1. Introduction
The large-scale commercialization of lithium-ion batteries has enabled a great number of applications ranging from consumer electronic devices to electric vehicles and energy storage systems. However, the safety and reliability of lithium-ion batteries have been a concern, due to the numerous incidents of fires, explosions, and the rapid capacity fade [
1,
2,
3,
4]. Testing is generally required to help qualify a battery in terms of safety and reliability in its targeted application.
Safety testing can be conducted by following standards from organizations, such as the United Nations (UN), Underwriters Laboratories (UL), and International Electrotechnical Commission (IEC), which require that lithium-ion batteries be subjected to various mechanical, electrical, and thermal conditions. However, reliability testing, which is the focus of this paper, has for the most part been developed by battery manufacturers and device companies themselves without a widely recognized guidance document. For reliability testing of lithium-ion batteries, the capacity retention capability is usually examined intermediately by cycling or storing batteries for a certain number of cycles or amount of time. Degradation occurring during cycling and storage is called “cycle aging” and “calendar aging”, respectively. However, lifetime of lithium-ion batteries comprised of cycle and calendar aging can be fairly long. For example, cells in a LiFePO
4-based battery pack retired from an electric vehicle still possess an average capacity of 83% and a standard deviation of 16% of the nominal capacity, which was used in a southern city of China for more than three years with the mileage of 32,500 km [
5]. The reliability testing of lithium-ion batteries under normal conditions is thus considerably time-consuming.
To shorten testing time, accelerated testing is performed by increasing the loading levels on the products [
6] in excess of normal conditions. There must be a method to extrapolate the data to predict reliability over the intended usage and storage conditions [
7], requiring a model to be fitted to the accelerated testing data.
Loading conditions (e.g., stress factors) that contribute to the calendar aging of lithium-ion batteries include ambient temperature and state of charge (SOC), whereas ambient temperature, SOC operation range, and charge/discharge current (C-rate) contribute to the cycle aging process [
8,
9]. The accelerated life test plan should consider some or all these stress factors.
Accelerated temperature testing has been extensively used owing to its simplicity of implementation and significant effect on degradation. The assumption is that elevated temperature can accelerate the failure mechanisms of lithium-ion batteries. For instance, Ecker et al. [
10,
11] stored lithium-ion batteries at 25–65 °C, and Bloom et al. [
12] cycled lithium-ion batteries at 40–70 °C. However, the failure mechanisms that were accelerated by temperature were not discussed by these papers. Lithium-ion battery degradation is mainly caused by solid electrolyte interface (SEI) layer growth, lithium plating, and particle cracks in the electrodes [
13]. Waldmann et al. [
14] evaluated the effect of different temperatures on the electrode polarizations and found that low temperature (
T < 25 °C) facilitates lithium plating, whereas SEI layer growth is accelerated at high temperature (
T > 25 °C) The result suggested that the failure mechanisms changed at different temperature ranges. Designing an appropriate accelerated test plan thus requires comprehensive understanding of failure mechanisms at different stress levels.
The Arrhenius model has been used numerously to simulate the effect of temperature on degradation and predict the reliability of lithium-ion batteries. Ecker et al. [
10,
11] applied this model to predict the calendar life of lithium-ion batteries at various temperatures, regardless that the Arrhenius model did not fit well to all experimental data. Wang et al. [
15] employed the Arrhenius model in the cycle aging modeling of lithium-ion batteries, and Fares et al. [
16,
17,
18,
19] assumed that the effect of temperature on calendar degradation of lithium-ion batteries followed this model. NASA’s Aerospace Flight Battery Program [
20] proposed the standard approach for lithium-ion batteries where they established the correlation between the capacity fade and cycles by conducting tests at various temperatures and analyzing the data to get the Arrhenius coefficient. Zhou et al. [
21] and Li et al. [
22] expressed the resistance growth and capacity fade for lithium-ion batteries as a product of cycles and degradation rates expressed by the Arrhenius model, then implemented battery-oriented optimization control during its lifetime.
All the studies described above assume that the Arrhenius model works for the temperature-dependent degradation behavior of lithium-ion batteries without rigorous verification. However, a battery is a complex nonlinear system with far more than one chemical reaction taking place. Qin and Bernstein [
23] proved that the coefficients in this model for a certain chemical reaction can change with temperature. Xu et al. [
24] pointed out that while the Arrhenius model indicates that the degradation rate increases with temperature, it does not hold true for low temperature in a lithium-ion battery case study. The derived activation energy in this model is shown to change with temperature [
14].
To further simplify modeling of the temperature effect, a rule of thumb commonly used by some researchers [
10] and companies [
25] is that the aging rate doubles for every 10 °C that a battery is operated above the rated temperature. This rule of thumb is then used to calculate the acceleration factor (AF), which is defined as the ratio between the times necessary to obtain a stated proportion of failures for two different sets of stress conditions involving the same failure modes and/or mechanisms. However, this rough approximation can result in wildly inaccurate estimation of battery lifetime, thus misleading battery manufacturers and device companies.
Comprehensively planning the accelerated testing and correctly modeling the aging effect of stress factors is essential to the accurate lifetime prediction of batteries. This paper presents issues encountered when conducting accelerated temperature testing of batteries using the Arrhenius model and the decade rule. Two case studies with actual experimental results demonstrate the problems with the current temperature testing and modeling methods. Case study 1 illustrates how a company conducted accelerated temperature testing and applied the Arrhenius model to storage life prediction of primary zinc-based batteries. In case study 2, testing data of lithium-ion batteries are used to demonstrate the impropriety of these approaches. Proper approaches for reliability testing and modeling are then provided.
The remaining sections of this paper are as follows.
Section 2 introduces the Arrhenius model and the
Q10 factor as well as its characteristics.
Section 3 presents the two case studies, discusses the issues from the case studies and proposes recommendations.
Section 4 concludes the main findings of this paper.
2. The Arrhenius Model and Q10 Factor
The Arrhenius model was developed as a phenomenological equation to model the temperature dependence of certain chemical reactions [
26], as in Equation (1).
where
K is the rate constant,
A is the frequency factor,
Ea is the activation energy representing the energy barrier for the chemical reaction,
R can be the universal gas constant or Boltzmann’s constant, and
T is the absolute temperature (in kelvin). This equation has been extended to model temperature-induced processes and degradation rates of everything from materials to electronic, chemical, and electrochemical systems [
27,
28,
29,
30].
The Arrhenius model can be plotted on a logarithmic scale of the rate coefficient versus the reciprocal temperature, resulting in a linear equation.
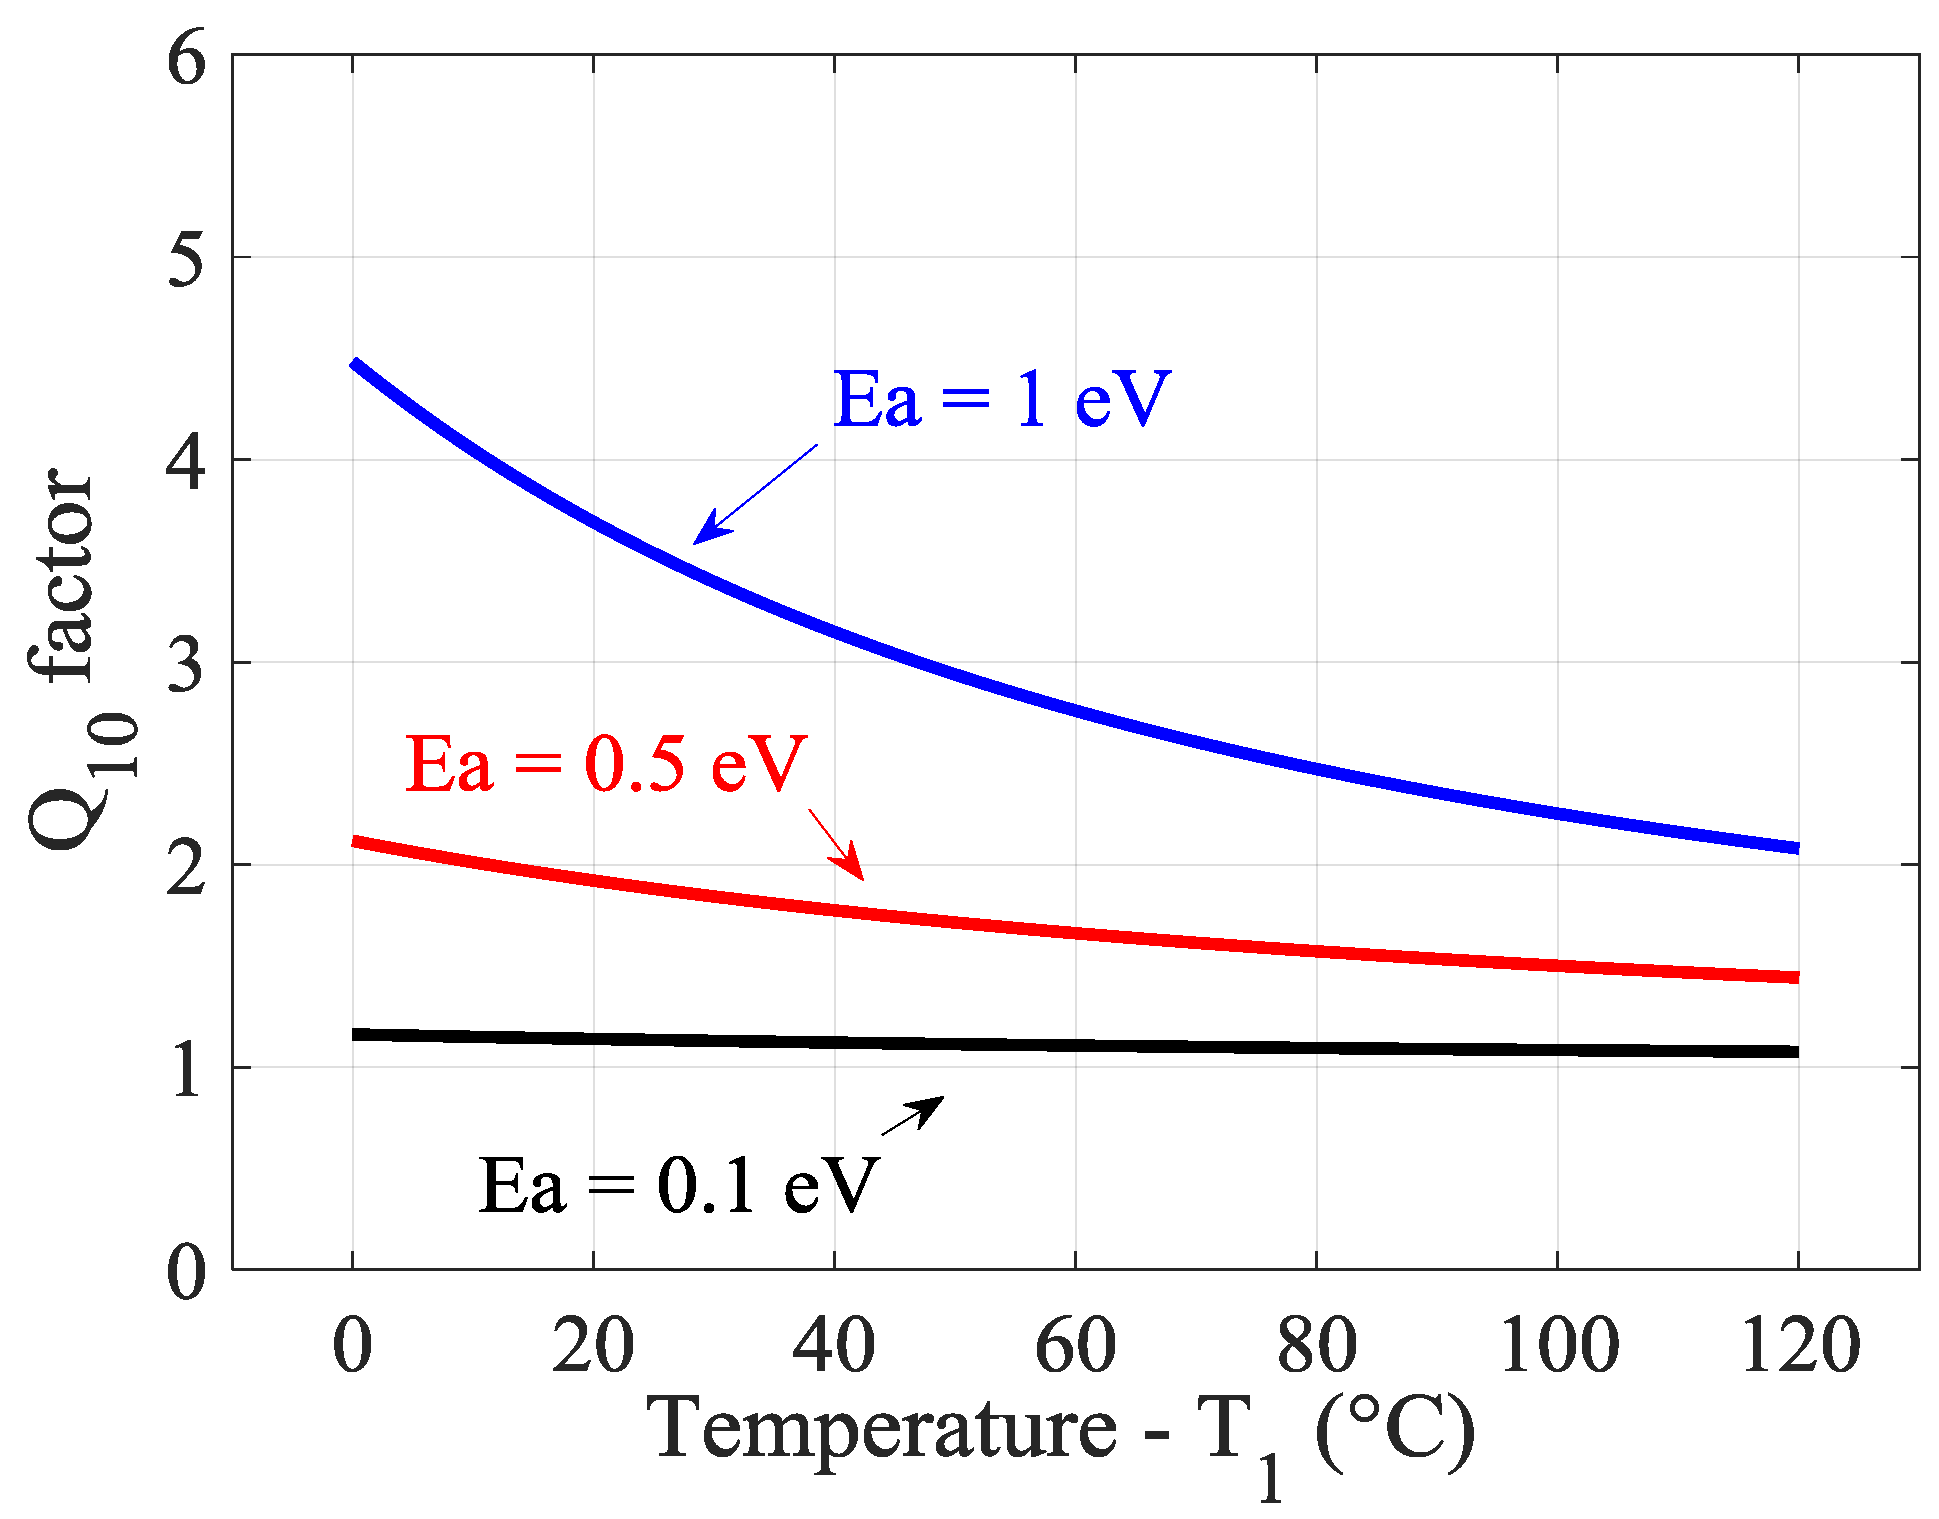
The decade rule is an off-shoot of the Arrhenius equation in which a
Q10 factor is defined as the change in the reaction rate with a 10 °C change in the temperature. Thus, a
Q10 value of 2.0 implies a two-fold increase in the reaction rate with a 10 °C increase in temperature. The
Q10 factor can be calculated as
where
k2 is the reaction rate at
T1 + 10 °C and
k1 is the reaction rate at
T1.
When the
Q10 factor is plotted with temperature at different activation energies in
Figure 1, it can be observed that it is not a constant and it only doubles at one temperature-activation energy value; it in fact decreases with temperature and increases as a function of activation energy. This is important to know because numerous technical articles report that there is a doubling of degradation rate with a 10 °C increase [
25,
31,
32], or try to determine the
Q10 factor [
10]. No more will be said about this decade rule, since it is simply rarely correct from the perspective of mathematics.
3. Case Studies
To show how the use of the Arrhenius model is incorrect for reliability prediction of batteries, two case studies on accelerated temperature testing, and modeling the effect of temperature are presented. Case study 1 shows a typical instance of inappropriate testing and modeling by many companies, who tested the primary batteries and extracted the Arrhenius model parameters to calculate the AF. Case study 2 presents the cycling data of an accelerated life testing of lithium-ion batteries and demonstrates the issues with using the Arrhenius model.
3.1. Case Study 1
In portable electronic devices that drain relatively low power and energy, primary battery is the first option in consideration of cost and safety. A device company, as one of our clients, has extensively used a type of primary button-shaped battery in their product. The cathode, anode and electrolyte are manganese dioxide (MnO2) mixed with graphite, zinc (Zn), and Potassium hydroxide (KOH), respectively. The nominal capacity and minimum open-circuit voltage are 150 mAh and 1.5 V, respectively.
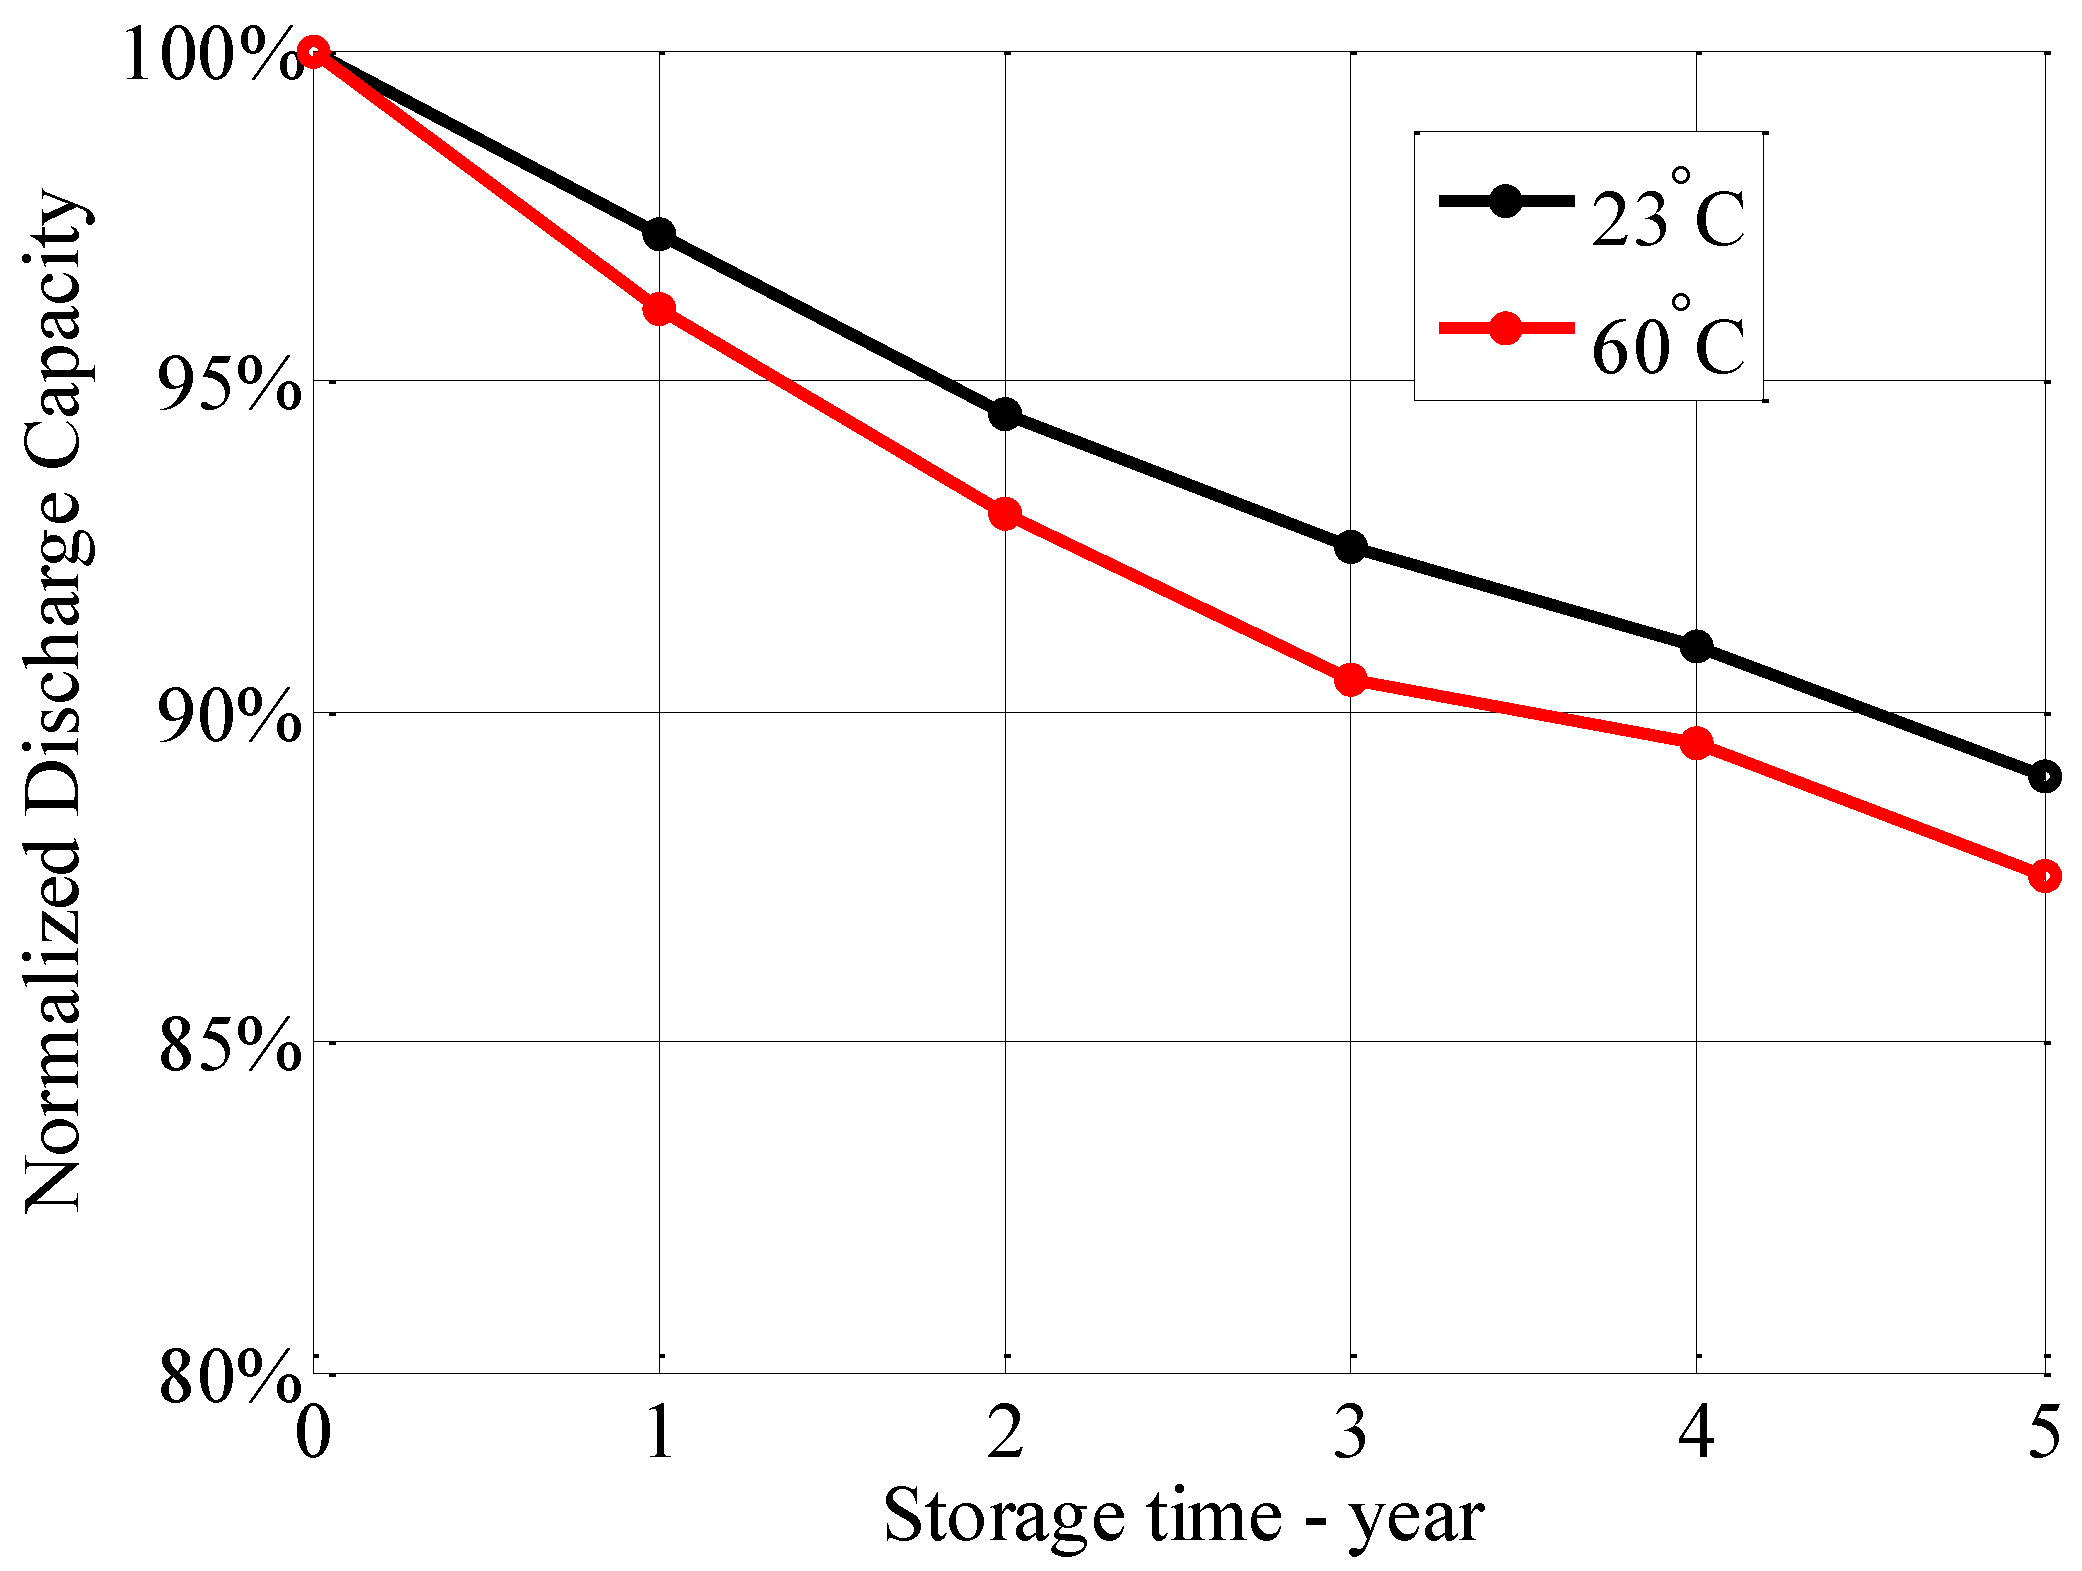
For this type of battery, the company wants to determine its storage life at normal temperatures. Several these batteries were stored at 23 °C and 60 °C, respectively. In the testing process, a certain proportion of batteries tested at 23 °C were taken out and discharged using a standard profile after every 365 days, whereas the same proportion of batteries tested at 60 °C were discharged using the same profile after every 20 days.
The testing data is plotted in
Figure 2, where every 20 days’ storage time on the degradation curve at 60 °C is drawn as 1 year. The normalized discharge capacity (NDC) is calculated based on the specified nominal capacity. It is observed that at both temperatures, the slopes of discharge capacity curves are becoming less negative over time, suggesting a decreasing instantaneous degradation rate.
This company then conducted data analysis using the Arrhenius model. The samples stored at 60 °C for 40 days showed 7% capacity loss, whereas the samples stored at 23 °C for 730 days showed 6% capacity loss. The degradation rates at 23 °C and 60 °C were then calculated, respectively, assuming a linear capacity decrease over time as in Equations (4)–(6). Accordingly, the AF of 21.3, and activation energy of 0.703 eV can be derived.
This modeling process is found to be incorrect. Only the capacity losses after the first 2 years’ storage at 23 °C and 40 days’ storage at 60 °C were picked, respectively, to calculate the degradation rates, then extrapolated the activation energy. The remaining data is not used in this case, and similar ways of validating the Arrhenius model and extracting the model parameters are seen in [
33]. However, when the capacity losses at 23 °C from the 3rd year to the 5th year, and 60 °C from the 60th day to the 100th day are chosen for calculation, the AF and activation energy are changed to 15.6 and 0.632 eV, respectively. Therefore, the activation energy can change over storage time. If the reliability testing is carried out at other temperatures, it is expected that the activation energy may differ from the previous calculated value.
3.2. Case Study 2
In this case, study, pouch-shaped lithium-ion batteries are selected to verify if the Arrhenius model applies. The major composition of cathode, anode and electrolyte are LiCoO2, graphite, and LiPF6-salt mixed with the organic solvent, respectively. The nominal capacity and operation voltage range are 3.36 Ah and 3.0–4.4 V, respectively.
The accelerated temperature testing is being conducted on pouch-shaped lithium-ion batteries at four different temperatures, 10 °C, 25 °C, 45 °C and 60 °C, with eight samples at each condition. The discharge C-rate and charge cut-off current are fixed at 1C and C/5, respectively. After every 50 cycles, the samples are charged and discharged using a standard profile for discharge capacity characterization.
Figure 3 shows the discharge capacity loss at different temperatures.
At 10 °C, 25 °C, and 45 °C, the slopes of the discharge capacity loss curves steadily decrease over cycles at first, then maintain at a relatively constant level. At 60 °C, the discharge capacity loss curve in the first 250 cycles shows a similar trend to that at 10 °C, 25 °C, and 45 °C. However, the capacity loss at 60 °C after the 250th cycle increases drastically, forming an inflection point on the curve. This phenomenon suggests that the dominant failure mechanisms have possibly changed after the 250th cycle. It is also found that the eight samples cycled at 60 °C present large variations after the 250th cycle, although with similar degradation trends. Different transition times of the failure mechanisms in these samples may account for this variation.
In most of the literatures where the Arrhenius model is incorporated in the cycle aging degradation model as an AF, the capacity loss is often expressed as in Equations (7) and (8) [
12,
14,
15,
34]. To determine whether an Arrhenius model works in this case, the relationship between capacity loss at different cycle numbers and temperature will be investigated. For Arrhenius behavior as expressed by Equation (2), the logarithm of
K is supposed to follow a linear relationship with 1/
T, that is, the logarithm of
Qloss of different temperatures at the same cycle number changes linearly with 1/
T.
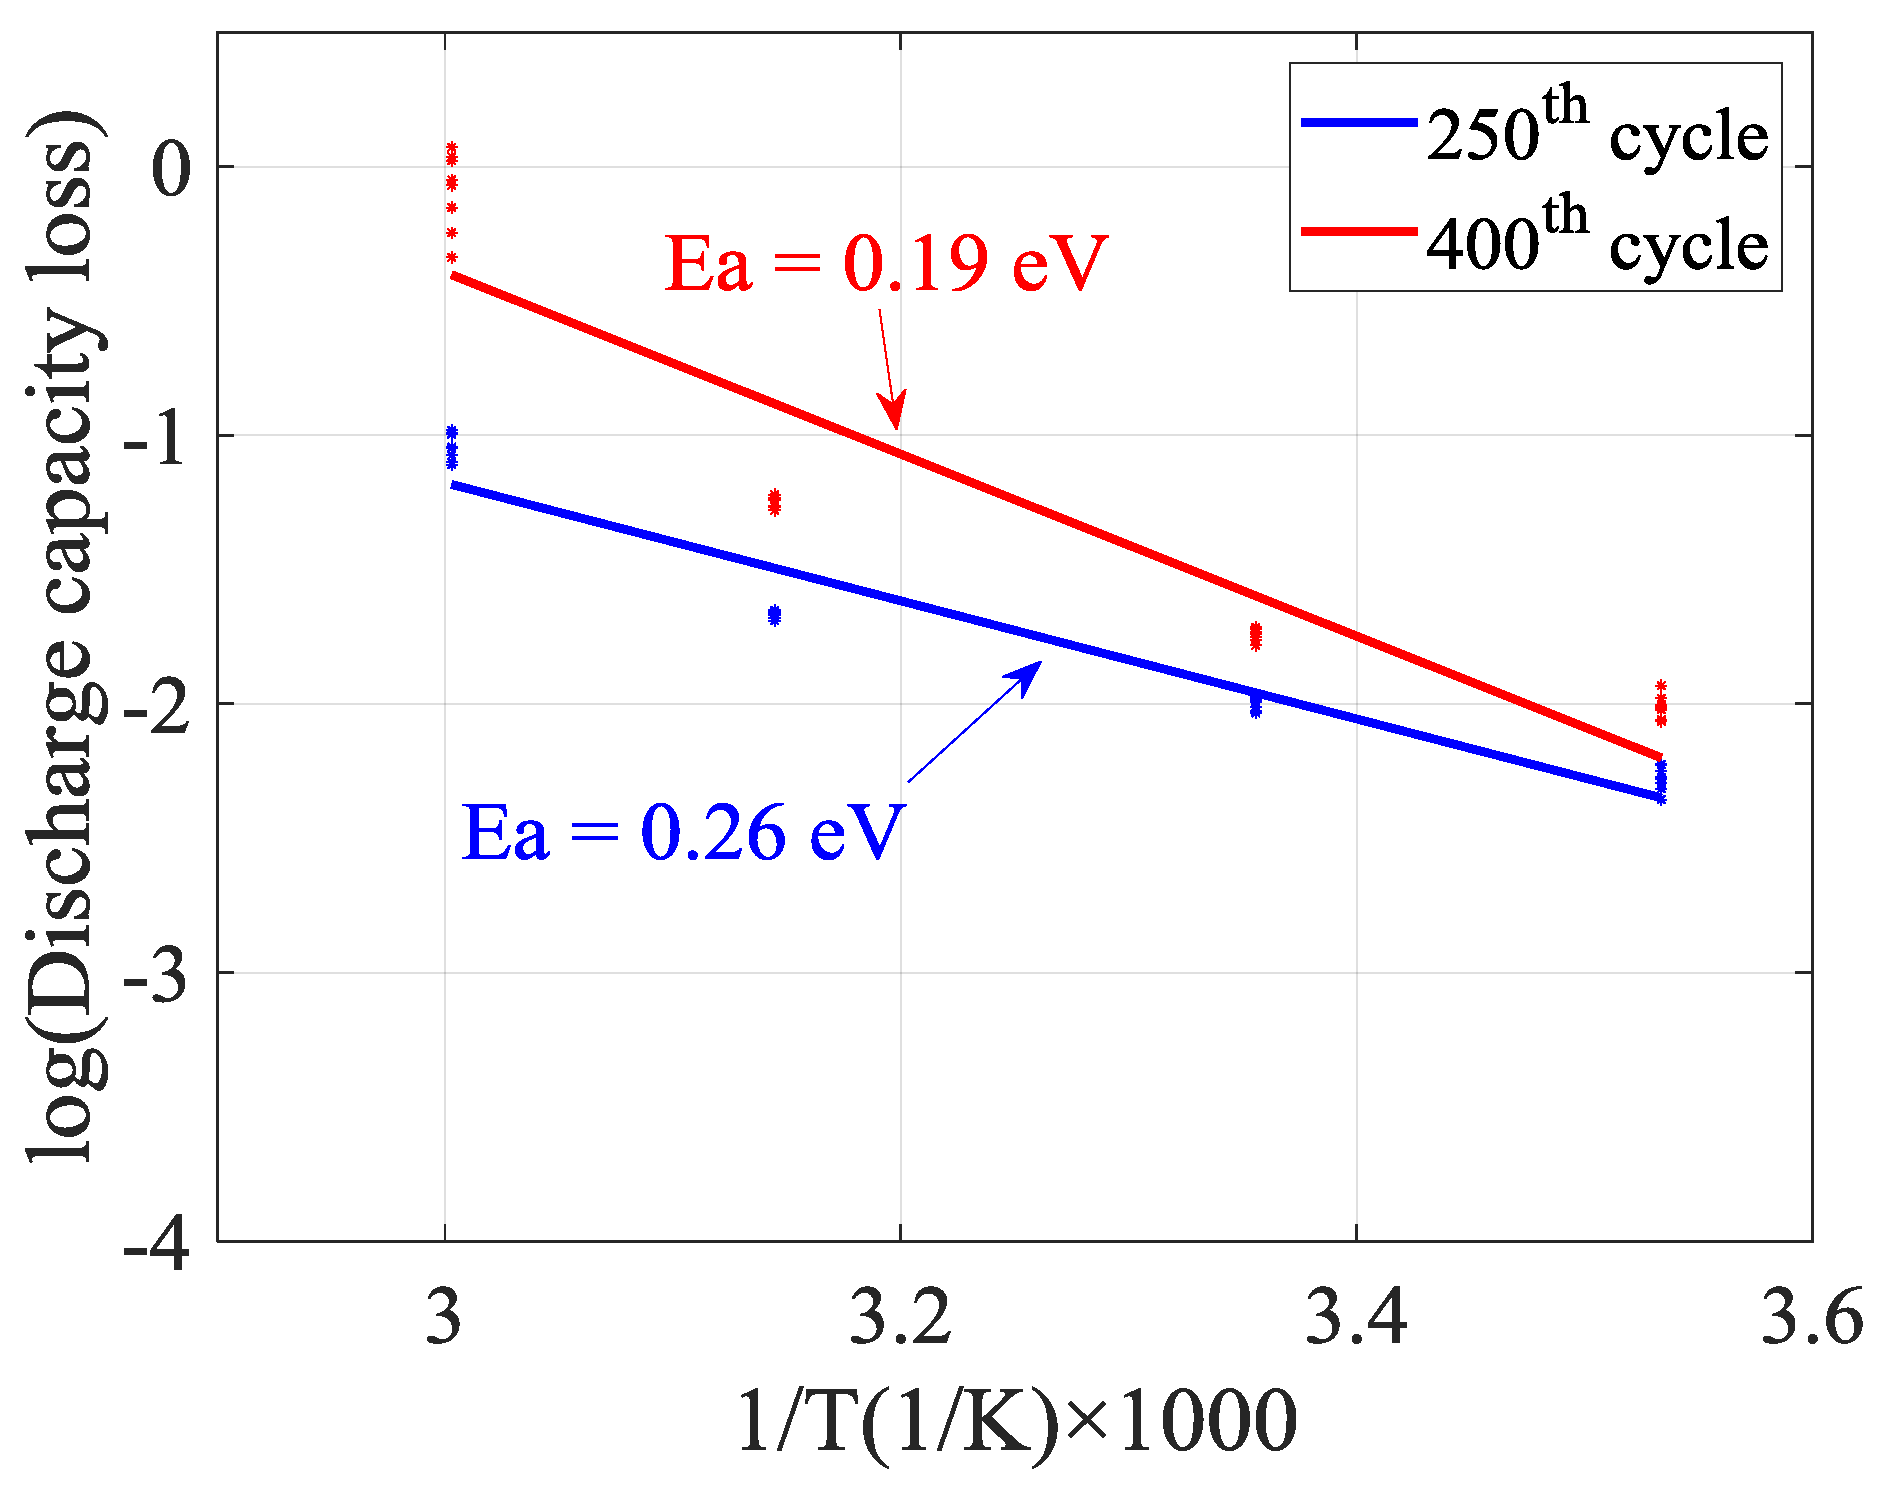
The logarithm of
Qloss of each sample is then plotted versus the reciprocal of temperature (1/
T × 1000) in kelvin as in
Figure 4. At both the 250th and 400th cycle, the average log(
Qloss) of eight samples does not show a linear relationship with the reciprocal of kelvin temperature, illustrating that the Arrhenius model does not fit over the entire practical operation range of the battery.
Even if an Arrhenius model is forced to fit all the data with the R-squared of 0.9512 and 0.8945, respectively, as some research groups did [
10,
15,
20], the derived activation energy can change with the cycle number. The analysis above shows that the Arrhenius relationship is not universal to model the effect of temperature on lithium-ion batteries’ degradation rates, since the coefficients are no longer fixed when the capacity loss at different times is selected.
3.3. Discussion
The limitations of the accelerated temperature testing, inaccuracy of the Arrhenius model and falseness of the decade rule have been shown in this work. These issues will be further discussed and summarized in this section. Following the discussion, the proper methods in terms of accelerated testing and modeling are provided.
The data in case study 2 suggest that the failure mechanisms can vary with the temperature range. For lithium-ion batteries, SEI layer growth and lithium plating are dominant at completely different temperature ranges as mentioned in
Section 1. Not all failure mechanisms can be accelerated by temperature. Thus, in the accelerated temperature testing plan, the dominant failure mechanisms associated with the designed stress levels should be thoroughly understood.
To keep the failure mechanisms unchanged, the amount of acceleration obtained through temperature elevation is often limited. For example, the organic electrolyte of lithium-ion batteries is not thermally stable at over 60 °C, the testing temperature of such batteries is thereby usually limited to 60 °C.
The Arrhenius relationship was originally developed as an empirical model to evaluate the temperature dependence of certain chemical reactions. In the degradation of batteries, there are some major chemical reactions and hundreds of side-reactions taking place at the same time, leading to competing degradation processes at one temperature. Also, multiple dominant degradation processes associated with different activation energies can occur at different temperatures. It is thus not reasonable that people try to determine one activation energy for the various degradation processes in the battery. There does not have to be an activation energy for every degradation mechanism.
To determine if the Arrhenius model works, multiple testing temperatures (≥3) are suggested to conduct the analysis. Case study 1 presumed the effectiveness of this model with only two testing temperatures. However, the degradation characteristics of temperature dependence should be assumed to follow this relationship only when the activation energy keeps constant over cycles/time and a linear relationship is observed between the logarithm of K in Equation (2) and the reciprocal of kelvin temperature. In addition, the applicability is considered valid only within the testing temperature range.
In addition, the Eyring model has a more generalized form with hyperparameters in terms of the temperature effect and provides a way to incorporate more stress factors. The Arrhenius model can be regarded as one typical Eyring model form, thus it can be expanded to consider the dependence of the aging with other stress factors than temperature and their interactions, as evidenced by Kreczanik et al. [
35]. A verification process is still required to use the Eyring model.
3.4. Recommended Approach for Reliability Testing and Modeling
The analysis above shows that comprehensive understanding of failure mechanisms is essential to develop an efficient accelerated life testing plan and an accurate model. Thus, failure modes, mechanisms, and effects analysis (FMMEA) should be conducted first based on the literature, experience, and battery applications. FMMEA is “a systematic methodology to identify potential failure mechanisms and models for all potential failure modes, and to prioritize failure mechanisms” [
36].
Second, a preliminary testing plan involving all possible stress factors should be established. The testing data can help determine the boundaries of major stress factors, that is, within these boundaries, failure mechanisms are consistent with those occurring under normal usage conditions. The major stress factors can be identified by ranking corresponding failure mechanisms. One ranking method is to compare the overall risk prioritization number (RPN) of each failure mechanism, which is a product of likelihood of occurrence, severity of occurrence, and ease of detection [
37].
Third, a design of experiment (DOE) should be prepared and conducted to investigate the effects of each stress factor as well as their interactions. Quantitative analysis of the DOE data then leads to an accelerated degradation model.
A final accelerated testing plan with reduced size can be built to quickly predict the reliability of batteries based on the developed model. This produces a great savings of time for the device company to examine every batch of product dispatched from battery manufacturers.
In the final testing plan, the overall testing time is a key factor for determining stress levels of different stress factors. Taking the accelerated cycle life testing of lithium-ion batteries as an example, major stress factors involve ambient temperature, SOC operation range and charge/discharge C-rate as mentioned in
Section 1. On one hand, some stress factors may be able to accelerate the degradation with respect to cycles without influencing the testing time of each cycle, such as the ambient temperature in case study 2. The charge C-rate and discharge C-rate can shorten the testing time of each cycle, regardless of whether they present significant effects on battery degradation with cycles or not. These are favorable stress factors to be incorporated in the final testing plan, and C-rate will be set as the highest possible level if it shows no effect. On the other hand, increasing the stress levels of SOC operation range may accelerate battery degradation with cycles; however, the testing time of each cycle will be prolonged. Thus, the testing process may not be accelerated at all by elevating the stress levels of such factors.
In the modeling process, the actual relationship between degradation and stress factors should be determined based on the testing data. There is no need to assume any empirical model, e.g., the Arrhenius model for temperature dependence, and applying any empirical model requires strict verification.
4. Conclusions and Recommendations
Accelerated temperature testing of batteries is often conducted to predict battery performance and product lifetime in the targeted operating temperature conditions, in a timely and cost-effective manner. However, there are significant problems when battery manufacturers and device companies use the Arrhenius model and the decade rule to design the test plan and make predictions.
First, not all failure and performance degradation mechanisms in a battery can be accelerated by increasing the temperature. For example, failure mechanisms at cold temperatures such as lithium dendrite growth of lithium-ion batteries are not accelerated or even precipitated by increasing the temperature. In this way, only decreasing temperature below a certain level can accelerate lithium dendrite growth. Therefore, the temperature range within which a failure mechanism dominates and the manner at which temperature affects the failure mechanisms should be clarified first.
Second, there is a limit to the amount of acceleration one can gain by increasing temperature without causing unique failure mechanisms that do not occur in normal operation. In other words, the testing temperature of batteries should generally not change the failure mechanisms that one has developed a model for.
Third, the Arrhenius model is often not accurate for modeling the effect of temperature. For example, as shown in case study 2, the logarithm of capacity loss and reciprocal of temperature is not linear. The activation energy in this model is also shown to change over cycles. However, these counter examples do not suggest that the Arrhenius model can never model the effect of temperature on battery degradation, but rather underscore the importance of verification.
Fourth, the commonly accepted 10 °C decade rule states that the useful life doubles for every 10 °C decrease of temperature, or that the aging rate doubles for every 10 °C increase. This represents a gross over-simplification of the Arrhenius model for thermally activated processes and is thus inaccurate. Even for processes that are accurately described using the Arrhenius model, it has been shown that this rule only holds true at one combination of temperature and activation energy. This decade rule thus should not be used to obtain an AF or estimation of life, since it does not correctly represent the variation of rate with temperature.
A proper approach for reliability prediction of batteries requires designing appropriate testing plans and correctly modeling the effect of stress factors. The testing plan should be based on the desired failure mechanisms to be accelerated. In the modeling process, the actual relationship between degradation and stress factors should be determined based on the testing data. It is best not to assume an empirical model and the valid working range of the model needs to be specified.


