Featured Application
The proposed theory can guide the design of combination methods, and the proposed TLF method can fuse multiple similarity indices in link prediction.
Abstract
The theoretical limit of link prediction is a fundamental problem in this field. Taking the network structure as object to research this problem is the mainstream method. This paper proposes a new viewpoint that link prediction methods can be divided into single or combination methods, based on the way they derive the similarity matrix, and investigates whether there a theoretical limit exists for combination methods. We propose and prove necessary and sufficient conditions for the combination method to reach the theoretical limit. The limit theorem reveals the essence of combination method that is to estimate probability density functions of existing links and nonexistent links. Based on limit theorem, a new combination method, theoretical limit fusion (TLF) method, is proposed. Simulations and experiments on real networks demonstrated that TLF method can achieve higher prediction accuracy.
1. Introduction
Limit theory is a basic theoretical issue and has attracted wide interest across many fields. On the 100th anniversary of its foundation, Science raised 125 unresolved scientific questions, and many of these issues related to limit theory []. Link prediction predicts missing links in current networks and new or dissolution links in future networks []. With continuous improvement of link prediction methods and, the theoretical limit of link prediction has attracted considerable research interest [].
Considering structure or attribute features, link prediction methods based on classification have been proposed by computer science community [,]. Subsequently, more insightful methods of network structure, such as similarity based methods [], have become a focus, these methods pay more attention to the physical meaning. At the same time, similarity index fusion methods are springing up [,]. Recent years, with the development of deep learning, some deep features extraction methods have been proposed [,], the fusion of structure and attribute information has been attached importance again [,,,]. These methods have strong consistency. We divide link prediction method into single and combination methods, based on whether they use multidimension information, and whether they define the relation of multidimension information directly. For example, single methods, such as RA index [], which defines the relation of common neighbors and degree of nodes directly; and classification based methods, index fusion methods, fusion of structure and attribute information methods belong to link prediction combination methods.
Most combination methods perform better than single methods that will be fused, and are robust to many network types. However, what is the reason for this improved accuracy and robustness, and is there a theoretical limit for combination methods? This paper proposes the mathematic description of combination methods, and obtains the necessary and sufficient conditions for theoretical limit. The limit theorem also has important practical application value. It reveals the ultimate goal of combination methods that is to estimate probability density functions of existing links and nonexistent links. Thus, an appropriate form of the transformation function could be selected from the complete set. Based on the limit theorem, a new combination method, theoretical limit fusion (TLF) method, is proposed. We use the Parzen kernel method [] of destiny estimation in the TLF method. Simulations and empirical studies have shown that TLF method can achieve higher prediction accuracy.
Section 2 introduces a mathematical description for the theoretical limit of combination methods and evaluation metrics for link prediction. Section 3 proposes and proves necessary and sufficient conditions for the theoretical limit of combination methods. Section 4 proposes a fusion link prediction method based on limit theorem (TLF method). Section 5 provides simulation examples for limit theorem and proposed TLF method with other combination methods, and gives comparison experiments in real networks. Section 6 and Section 7 discuss some results and conclude the paper.
2. Problem Description and Evaluation Metrics
2.1. Problem Description
Given a network at time t, where is the set of nodes and is the set of links. The observed links, E, are randomly divided into training, , and probe, , sets, where and . Link prediction aims to predict missing links at current network or new links for a future time []. Link prediction combination methods fuse several similarity indices and obtain a synthetic index and can be described in mathematic as follows. Let be the scores of existing links as given by n structural similarity indices, and follow probability density function (pdf) . Let be the scores of nonexistent links as n structural similarity indices, and follow . We need to find the transformation function, , and obtain the synthetic score, , that maximizes evaluation metrics. Figure 1 is the diagram of combination methods.
Figure 1.
Combination methods.
2.2. Evaluation Metrics
Let the synthetic score follow pdf , and follow . X and Y are independent. We have the following metrics.
2.2.1. Area under the Receiver Operation Characteristics Curve (AUC)
A receiver operating characteristics (ROC) curve is a two-dimensional depiction of classifier performance []. In the field of link prediction, the ROC curve abscissa represents the probability of nonexistent links i.e., the false positive rate (FPR), when the link prediction score is greater than some threshold, , and . The ordinate represents the probability of missing links, i.e., the true positive rate (TPR), when score >, and , TPR is equivalent to Recall. According to [], AUC can be derived as
where
In the real network, original data is randomly divided into training set and the probe set. Equation (1) means that for n independent comparisons, if there are n′ comparisons where the missing link returns a higher score and n″ comparisons where the missing and nonexistent links return the same score, we can obtain the algorithm expression of AUC:
2.2.2. Precision
Precision can be defined as the ratio of correct to (correct and error) prediction proportions when score >, i.e.,
In the real network, if the top L links are predicted ones, with m links being right (i.e., there are m links in EP), then
Owing to the imbalance of positive and negative samples, link prediction usually uses AUC metric. In application, high Precision means target links are accurate, and these links can be used directly. AUC and Precision are two important metrics in link prediction, we will study the theoretical limit using the two metrics.
3. Theoretical Limit Theorem
Theorem 1.
Let and be random vectors following the joint distributions and , respectively, where . (m represents the measure of a set.) Then the following conditions are equivalent.
- (a)
- A monotonically increasing function exists, such that , a.e. .
- (b)
- Transformation function produces maximum AUC. If we add a condition in Theorem that prior probability of existing and nonexistent links be and , respectively. Then the following conditions are equivalent to (a) and (b):
- (c)
- for any , there exists the corresponding threshold for transformation , and satisfies , such that transformation function produces maximum Precision.
Proof.
:
From the equivalent definition, AUC maximum is the maximum area under the ROC curve. For any FPR, if the TPRs corresponding to the ROC curve reach maximum, then the AUC reaches the maximum, i.e.,
where is a set , and .
We use Lagrange’s undetermined multipliers to solve this problem. For any specified FPR (denoted as FPR0), the TPR corresponding to the ROC curve reaches maximum is equivalent as reaches maximum,
Function will be maximized if we choose set such that the integrand is positive, i.e., if
then . Which means, no matter what is , if we select the set of which makes the integrand always be positive, the function will reach maximum; if the set contains that makes the integrand be negative, function will decrease. Let and , and the set, , equals to , which satisfies (8), i.e.,
Thus, for any FPR, the TPR corresponding to the ROC curve reaches the maximum, so the AUC reaches the maximum when X and Y are transformed by .
Let be a monotonically increasing function; and be the inverse function of . If , then and have the same monotonicity, and both are increasing functions. Thus, . The pdf of is , and the pdf of is . Thus,
We have proved .
: If , where is increasing function, there exists such that transforming from can also produce maximum AUC, and then the corresponding ROC curves are the same. Otherwise, if ROC curves are different, except the same part, for any FPR, there is at least a ROC curve which doesn’t reach maximum TPR, and contradict with maximum AUC. Since and the ROC curve is the same for any point on the two ROC curves, thus,
- For any , and any , there exist , such that for a.e. ;
- For any , if and , then .
Let , then a set of exist with nonzero measure, such that , i.e., . Let . If , satisfies function relation , but is not increasing, then for any , condition (ii) does not hold. If , and are not functionally related, then neither condition (i) or (ii) hold. Thus is established.
: Let be the slope of the secant for any point on the ROC curve to the origin, then . For any , that produces maximum Precision is equivalent that k reaches maximum. And equivalent that for any , , is maximum. Since this condition is established for any , then it is equivalent that for any , the corresponding TPR reaches maximum, and equivalent to produces maximum AUC. ☐
Note 1: the condition is for exclusion that when , (C is a constant), transformation function can be defined randomly on set . For example, let us construct the pdf of some random vector as
. Let the transformation function be
then no matter how is defined, only when can the produce the maximum AUC of . In particular, if , regardless of how is defined, AUC = 0.5. Thus, maximum AUC = 0.5.
Note 2: The arbitrariness of the ratio must be emphasized in condition (c). If we omitted “any ”, then (b) (c) can be established but (c) (b) cannot. The meaning of in application is a ratio of the whole data, for any , a ratio corresponds a threshold .
Theorem shows that no matter which evaluation criteria choose, transformation functions that provide maximum link prediction accuracy constitute a function cluster, , , where is a monotonically increasing function. Therefore, the accuracy of the combination method must be greater than or equal to the accuracy of each single dimension.
4. A Fusion Link Prediction Method Based on Limit Theorem
4.1. The Algorithm
The limit theorem of combination method shows that when selecting transformation function as or its monotone increasing transformation, the AUC and Precision of synthetic score reaches the maximum. In the real network, because and are unknown, the pdfs need to be estimated from multidimensional data. Let the estimated pdfs be and . On the basis of limit theorem, we define the transformation function as the ratio of estimated pdfs, i.e.,
then we obtained the synthetic score, , and used for link prediction. This method is called theoretical limit fusion (TLF) method.
Before evaluating and , the input link prediction scores need to be normalized,
represents the k-th similarity score for node pair . N is the dimension of adjacent matrix, and d is the number of similarity indices.
The limit theorem of combination method transformed the link prediction indices fusion problem into the estimation of pdfs. Statistical methods for estimating density functions can be applied to this problem, directly. The Parzen kernel method [] of destiny estimation is used in this paper. The multivariate kernel density estimate defined as:
where h is the window width, is the sample size, and is a multivariate kernel defined for d-dimensional , such that
A form of the pdf estimate commonly used is Gauss kernel,
In summary, the steps of TLF are listed as Table 1.
Table 1.
The steps of theoretical limit fusion (TLF) method.
4.2. Complexity Analysis
For a given undirected, unweighted graph G(V, E), let be the number of nodes and let be the number of edges, and let be the sample size. During the estimation of pdfs in (16), the entire samples are scanned once. A scan of samples requires time and it is less than . This is the step of model training or pdf estimation. Among all combination methods, there is an inevitable time complexity, that is to obtain the similarity matrix or final link prediction scores according to Equation (14). This step requires time . So, the TLF method will take time more than . The main space needs to storage estimator and adjacent matrix or final similarity matrix. The spatial complexity is .
5. Simulation and Experiment
We programmed the algorithm using Matlab (MathWorks, Beijing, China, 2014), and runs on a single machine equipped with RedHat 6.4. The host memory is 16 GB, with 3.4 GHz CPU, and the Matlab version is R2014b. In simulations from Section 5.1, 4-dimisional pdfs are supported to verify limit theorem and the effectiveness of TLF method. We also test the resulting method in real networks. We use TLF method to fuse 4 local similarity indices, CN [], AA [], RA and PA [,]. These indices are 4 simple indices with low computation complexity about , where <k> represents the average degree of nodes in a network. CN index only considers common neighbors of node pairs; PA index only considers the degree of two nodes; AA and RA consider both common neighbors and degree of nodes with different weights. And compare the method with fusion methods such as naïve Bayes and logistic regression and other global indices with computation complexity more than .
5.1. Simulation Examples
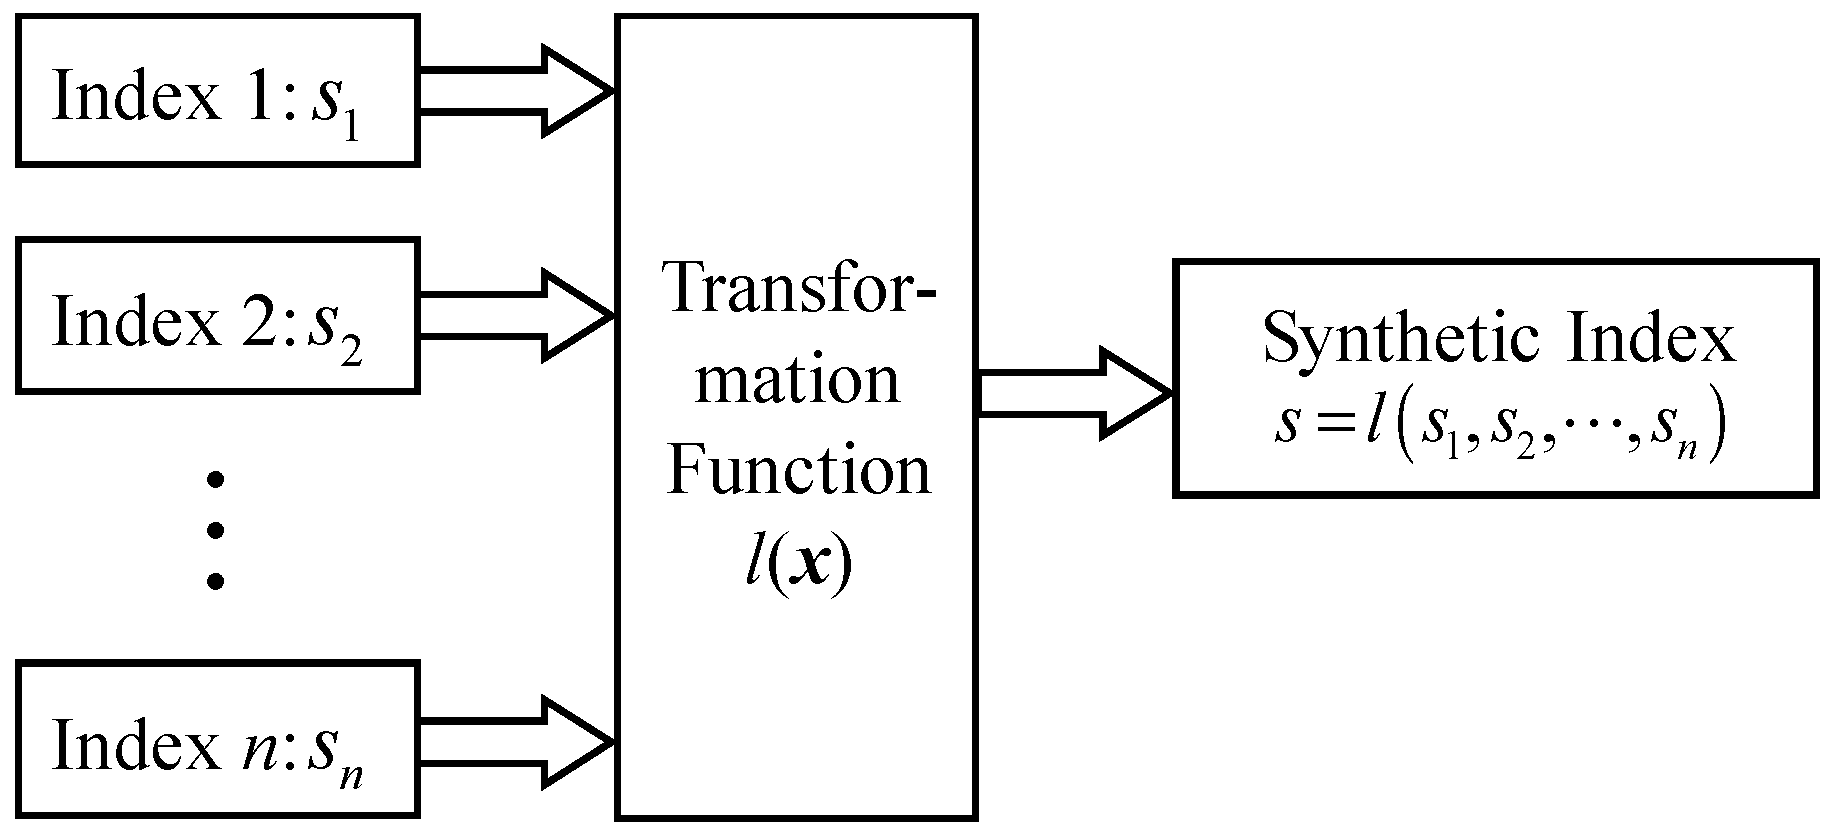
Four types of structural similarity indices were simulated to evaluate node pairs with and without links. The pdfs of the structural similarity indices are also provided. We construct 3 groups of known distributions for the similarity indices pdfs. One thousand samples extracted from 10,000 existing links and 100,000 samples of nonexistent links were generated following the appropriate pdfs. The 1000 samples serve as probe set; the 100,000 samples with 1000 probe links serve as unknown links for training; and the remaining 9000 samples serve as train set of existing links. Each sample had 4 dimensions to simulate 4 similarity scores. We first compute AUC and Precision for each dimension, then use proposed TLF method to obtain the synthetic score and calculate the AUC and Precision, compared with other combination methods such as Naïve Bayes and logistic regression. Finally, we calculate AUC and Precision using the theoretical limit theorem and compare with the above methods.
Let random vectors and be the scores of existing and nonexistent links, which follow and pdfs, respectively.
Let are 4-dimensional normal distributions,
where , and .
The parameter sets for the 2 groups of simulation examples are as follows.
Group 1: , and ;
Group 2: and .
In each group, , , , , , , , , , and .
The window width h of TLF method in the group 1 and 2 is h = 0.1.
Group 3: Let
and
We ignore the constant that makes the integral of equal to 1. The simulation results of group 3 are shown as Table 2.
Table 2.
Simulation results of group 1 and group 2. The bold figure indicates the best accuracy in each dimension and combination method.
The window width h of TLF method in the group 3 is h = 0.1.
The simulation results in Table 2 and Table 3 show us that we can calculate the theoretical limit of combination method based on Theorem 1, and the limit AUC and Precision are highest among all listed methods, though we cannot list all possible conditions. Results also show that TLF method can fuse the information effectively, and obtain the optimum accuracy. We also verify that the transformation of monotonically increasing function does not change the theoretical limit. Theorem 1 provides a platform that can compare each combination method by constructing some distributions, and direct an effect combination method TLF.
Table 3.
Simulation results of group 3. The bold figure indicates the best accuracy in each dimension and combination method.
5.2. Experiments in Real Networks
The significance of simulation is that the theoretical limit can be derived by theoretical calculation or numerical calculation, and all combination methods can be used to compare with it, finding shortcomings and gaps to design a more rational method. However, the simulation data is different from real network data. We use TLF method to fuse several similarity indices and test in real networks. The basic similarity indices we use are Common Neighbor index (CN) [], Adamic-Adar index (AA) [], Resource Allocation index (RA) and Preferential Attachment index (PA) [,]. These indices are local indices. Several global indices such as Katz index [], Average Commute Time index (ACT) and Cosine Similarity Time index (Cos+) are served as comparisons [,]. The definitions of the above indices and their meanings are listed as Table 4.
Table 4.
Definitions and descriptions of similarity indices.
We use TLF method to fuse 4 local similarity indices, and compare with fusion method such as naïve Bayes and logistic regression and other global indices. Our experiments are performed on 11 different real networks. (1) Food Web Everglades Web (FWEW) []; (2) Food Web Florida Bay(FWFB) []; (3) Protein-protein Interactions Cell (PPI Cell) []; (4) CKM-3 []; (5) Netscience (NS) []; (6) Yeast []; (7) Political Blogosphere(PB) []; (8) Email []; (9) CA-GrQc(CG) []; (10) Com-dblp(CD) []; (11) Email Enron (EE) [,]. The basic topological features of 11 real networks are listed in Table 5. Each original data is randomly divided into training set of 90% links, and the probe set of 10% links.
Table 5.
Basic topological features of 6 example networks. |V| and |E| are the total numbers of nodes and links, respectively. <k> represents the average degree of nodes in a network. C and r are the clustering coefficient and assortative coefficient respectively. H is the degree heterogeneity, defined as .
Table 6 and Table 7 show the comparisons between TLF method and other combination methods or global indices using AUC and Precision metrics. Each result is the average of 10 realizations. When calculating the Precision metric in Equation (5), we take L = 100 in datasets 1 to 8, and take L = 1000 in datasets 9 to 11. In the large networks, TLF method needs to sample to save the computing sources, and in datasets 10 to 11, the under-sampling rate is set as 1000.
Table 6.
Comparisons of the AUC value between TLF and other combination methods or global indices. In each network, the selected window width h is along with the AUC value. The bold figure indicates the best AUC.
Table 7.
Comparisons of the Precision value between TLF and other combination methods or global indices. In each network, the corresponding window width h is the same as Table 6. The bold figure indicates the best Precision.
The results show us that TLF method performs better than other fusion methods such as naïve Bayes and logistic regression, no matter what evaluation metric use. Almost all combination methods are better than 4 basic indices. From the limit theorem, combination methods are dependent with each dimension. The promotion of fusion index is restrict to each similarity index. Experiment results also exposed this problem: if the single similarity indices perform not well, the fusion index cannot significantly improve the accuracy. For example, in the CKM-3 network, though we use TLF method to fuse 4 basic similarity indices can improve the AUC obviously, it cannot be better than Katz index (0.928).
6. Discussion
Many combination methods try to find the nonlinear relation of every dimensions, and want to obtain a more reasonable fusion function to promote the prediction accuracy. For example, link prediction method based on the choquet fuzzy integral [] uses fuzzy measures to measure the importance of each similarity index in the fusion process and the interaction between them. Logistic regression based index adopts logistic function to learn the relation of multiple structural features and obtain an adaptive link prediction method []. In fact, according to the limit theorem, the nonlinear relation is the ratio of two joint probability destiny functions or its monotone increasing transformation. The best fusion function is a measurement of difference between existing and nonexistent links, and it reflects the relativity of existing and nonexistent links. The essence of combination methods is trying to approximate the pdfs from many aspects. Limit theorem provides a unified interpretation for all combination methods. On the basis of theoretical limit theorem, the proposed TLF method evaluates two pdfs directly, and it has a better fusion effect from results of simulation and experiment in real network.
7. Conclusions
This paper proposes mathematic description of link prediction combination methods and derives the limit theorem. Before the mathematic description we proposed, many combination methods have been put forward and widely used. However, all these methods are groping respectively without unified explanation. Limit theorem solved this problem and provided a guidance for link prediction method design. The TLF method based on limit theorem can achieve higher prediction accuracy.
Acknowledgments
We acknowledge professor Guo’en Hu for inspirations. This work was partially supported by the Foundation for Innovative Research Groups of the National Natural Science Foundation of China (No. 61521003), and National Natural Science Foundation of China (No. 61601513).
Author Contributions
Yiteng Wu and Hongtao Yu proposed mathematical description of combination method; Yiteng Wu proposed and proved the theoretical limit theorem; Yiteng Wu and Ruiyang Huang designed the experiments and analyzed the results. Yingle Li and Senjie Lin wrote part of code.
Conflicts of Interest
The authors declare no conflict of interest. The founding sponsors had no role in the design of the study; in the collection, analyses, or interpretation of data; in the writing of the manuscript, and in the decision to publish the results.
References
- Seife, C. What are the limits of conventional computing. Science 2005, 309, 96. [Google Scholar] [CrossRef] [PubMed]
- Wang, P.; Xu, B.; Wu, Y.; Zhou, X. Link prediction in social networks: The state-of-the-art. Sci. China Inf. Sci. 2015, 58, 1–38. [Google Scholar] [CrossRef]
- Lü, L.; Pan, L.; Zhou, T.; Zhang, Y.-C.; Stanley, H.E. Toward link predictability of complex networks. Proc. Natl. Acad. Sci. 2015, 112, 2325–2330. [Google Scholar] [CrossRef] [PubMed]
- Lü, L.; Zhou, T. Link prediction in complex networks: A survey. Phys. A Stat. Mech. Appl. 2011, 390, 1150–1170. [Google Scholar] [CrossRef]
- Wohlfarth, T.; Ichise, R. Semantic and Event-Based Approach for Link Prediction. In Proceedings of the Practical Aspects of Knowledge Management (PAKM 2008), Yokohama, Japan, 22–23 November 2008. [Google Scholar] [CrossRef]
- Chiancone, A.; Franzoni, V.; Li, Y.; Markov, K.; Milani, A. Leveraging Zero Tail in Neighbourhood for Link Prediction. In Proceedings of the 2015 IEEE/WIC/ACM International Conference on Web Intelligence and Intelligent Agent Technology (WI-IAT), Singapore, 6–9 December 2015; pp. 135–139. [Google Scholar] [CrossRef]
- Yu, H.T.; Wang, S.H.; Ma, Q. Link prediction algorithm based on the Choquet fuzzy integral. Intell. Data Anal. 2016, 20, 809–824. [Google Scholar] [CrossRef]
- He, Y.-l.; Liu, J.N.K.; Hu, Y.-X.; Wang, X.-Z. OWA operator based link prediction ensemble for social network. Expert Syst. Appl. 2015, 42, 21–50. [Google Scholar] [CrossRef]
- Liao, L.; He, X.; Zhang, H.; Chua, T.-S. Attributed Social Network Embedding. Trans. Knowl. Data Eng. 2017. Available online: http://www.comp.nus.edu.sg/~xiangnan/papers/attributed-social-network-embedding.pdf (accessed on 5 September 2017).
- Grover, A.; Leskovec, J. node2vec: Scalable Feature Learning for Networks. In Proceedings of the 22nd ACM SIGKDD International Conference on Knowledge Discovery and Data Mining, San Francisco, CA, USA, 13–17 August 2016. [Google Scholar]
- Wang, Z.; Chen, C.; Li, W. Predictive Network Representation Learning for Link Prdiction. In Proceedings of the 40th International ACM SIGIR Conference on Research and Development in Information Retrieval, Shinjuku, Tokyo, Japan, 7–11 August 2017; pp. 969–972. [Google Scholar]
- Chuan, P.M.; Son, L.H.; Ali, M.; Khang, T.D.; Huong, L.T.; Dey, N. Link prediction in co-authorship networks based on hybrid content similarity metric. Appl. Intell. 2017. [Google Scholar] [CrossRef]
- Franzoni, V.; Chiancone, A.; Milani, A. A Multistrain Bacterial Diffusion Model for Link Prediction. Int. J. Pattern Recognit. Artif. Intell. 2017, 31, 1759024. [Google Scholar] [CrossRef]
- Liu, B.; Sun, C.; Liu, M.; Wang, X.; Liu, F. Deep Belief Network-Based Approaches for Link Prediction in Signed Social Networks. Entropy 2015, 17, 2140–2169. [Google Scholar] [CrossRef]
- Ou, Q.; Jin, Y.D.; Zhou, T.; Wang, B.H.; Yin, B.Q. Power-law strength-degree correlation from resource-allocation dynamics on weighted networks. Phys. Rev. E Stat. Nonlinear Soft Matter Phys. 2007, 75, 021102. [Google Scholar] [CrossRef] [PubMed]
- Parzen, E. On estimation of a probability density function and mode. Ann. Math. Stat. 1962, 33, 1065–1076. [Google Scholar] [CrossRef]
- Fawcett, T. An introduction to ROC analysis. Pattern Recognit. Lett. 2006, 27, 861–874. [Google Scholar] [CrossRef]
- Hanley, J.A.; McNeil, B.J. The meaning and use of the area under a receiver operating characteristic (ROC) curve. Radiology 1982, 143, 29–36. [Google Scholar] [CrossRef] [PubMed]
- Lorrain, F.; White, H.C. Structural equivalence of individuals in social networks. Soc. Netw. 1977, 1, 67–98. [Google Scholar] [CrossRef]
- Adamic, L.A.; Adar, E. Friends and neighbors on the web. Soc. Netw. 2003, 25, 211–230. [Google Scholar] [CrossRef]
- Zhou, T.; Lü, L.; Zhang, Y.C. Predicting missing links via local information. Eur. Phys. J. B-Condens. Matter Complex Syst. 2009, 71, 623–630. [Google Scholar] [CrossRef]
- Barabasi, A.L.; Albert, R. Emergence of scaling in random networks. Science 1999, 286, 509–512. [Google Scholar] [CrossRef] [PubMed]
- Coleman, J.; Katz, E.; Menzel, H. The Diffusion of an Innovation among Physicians. Sociometry 1957, 20, 253–270. [Google Scholar] [CrossRef]
- Klein, D.J.; Randić, M. Resistance distance. J. Math. Chem. 1993, 12, 81–95. [Google Scholar] [CrossRef]
- Fouss, F.; Pirotte, A.; Renders, J.-M.; Saerens, M. Random-Walk Computation of Similarities between Nodes of a Graph with Application to Collaborative Recommendation. IEEE Trans. Knowl. Data Eng. 2007, 19, 355–369. [Google Scholar] [CrossRef]
- Ulanowicz, R.E.; DeAngelis, D.L.; Egnotovich, M.S. Network Analysis of Trophic Dynamics in South Florida Ecosystems, FY 99: The Graminoid Ecosystem. 2000. Available online: https://www.researchgate.net/publication/237005295_Network_Analysis_of_Trophic_Dynamics_in_South_Florida_Ecosystems_FY_99_The_Graminoid_Ecosystem (accessed on 13 June 2016).
- Ulanowicz, R.E.; Bondavalli, C.; Egnotovich, M.S. Network Analysis of Trophic Dynamics in South Florida Ecosystem, FY 97: The Florida Bay Ecosystem; Technical Report; CBL: Chattanooga, TN, USA, 1998; pp. 98–123. [Google Scholar]
- Kolaczyk, E.D. Statistical Analysis of Network Data: Methods and Models; Springer: New York, NY, USA, 2009. [Google Scholar] [CrossRef]
- Coleman, J.; Katz, E.; Menzel, H. The Diffusion of an Innovation among Physicians 1. Soc. Netw. 1977, 20, 107–124. [Google Scholar] [CrossRef]
- Newman, M.E.J. Finding community structure in networks using the eigenvectors of matrices. Phys. Rev. E Stat. Nonlinear Soft Matter Phys. 2006, 74 (Pt 2), 036104. [Google Scholar] [CrossRef] [PubMed]
- Von Mering, C.; Krause, R.; Snel, B.; Cornell, M.; Oliver, S.G.; Fields, S.; Bork, P. Comparative assessment of large-scale data sets of protein protein interactions. Nature 2002, 417, 399–403. [Google Scholar] [CrossRef] [PubMed]
- Adamic, L.A.; Glance, N. The political blogosphere and the 2004 U.S. election: Divided they blog. In Proceedings of the 3rd International Workshop on Link Discovery, Chicago, IL, USA, 21–25 August 2005; ACM: New York, NY, USA, 2005; pp. 36–43. [Google Scholar] [CrossRef]
- Michalski, R.; Palus, S.; Kazienko, P. Matching Organizational Structure and Social Network Extracted from Email Communication. In Business Information Systems; Springer: Berlin, Germany, 2011; pp. 197–206. [Google Scholar]
- Leskovec, J.; Kleinberg, J.; Faloutsos, C. Graph Evolution: Densification and Shrinking Diameters. ACM Trans. Knowl. Discov. Data ACM TKDD 2007, 1. [Google Scholar] [CrossRef]
- Yang, J.; Leskovec, J. Defining and Evaluating Network Communities based on Ground-truth. In Proceedings of the 12th International Conference on Data Mining (ICDM), Brussels, Belgium, 10–13 December 2012. [Google Scholar] [CrossRef]
- Leskovec, J.; Lang, K.J.; Dasgupta, A.; Mahoney, M.W. Community Structure in Large Networks: Natural Cluster Sizes and the Absence of Large Well-Defined Clusters. Internet Math. 2009, 6, 29–123. [Google Scholar] [CrossRef]
- Klimmt, B.; Yang, Y. Introducing the Enron corpus. In Proceedings of the CEAS Conference 2004, Mountain View, CA, USA, 30–31 July 2004. [Google Scholar]
- Ma, C.; Bao, Z.K.; Zhang, H.F. Improving link prediction in complex networks by adaptively exploiting multiple structural features of networks. Phys. Lett. A 2017, 381, 3369–3376. [Google Scholar] [CrossRef]
© 2017 by the authors. Licensee MDPI, Basel, Switzerland. This article is an open access article distributed under the terms and conditions of the Creative Commons Attribution (CC BY) license (http://creativecommons.org/licenses/by/4.0/).