Article

Application of Fiber Bragg Grating Sensing Technology for Bolt Force Status Monitoring in Roadways

Key Laboratory of Deep Coal Resource Mining, Ministry of Education of China, School of Mines, China University of Mining and Technology, Xuzhou 221116, China
*
Author to whom correspondence should be addressed.
Appl. Sci. 2018, 8(1), 107; https://doi.org/10.3390/app8010107
Submission received: 21 December 2017 / Revised: 8 January 2018 / Accepted: 11 January 2018 / Published: 12 January 2018
(This article belongs to the Special Issue Fiber Bragg Gratings: Fundamentals, Materials and Applications)

Abstract

:
Bolts support have become a major active support method in coal mine roadways to control roadway roof failure and improve surrounding rock structure stability. The traditional bolt force status monitoring (BFSM) method has poor anti-interference performance, is easily affected by harsh downhole environments, and cannot support remote real-time monitoring. This paper presents a fiber Bragg grating (FBG) bolt force sensor that monitors the force of roadway bolts. This sensor uses a cantilever and a diaphragm as elastic elements and two FBGs bonded on the top and bottom surfaces of the cantilever as sensing elements. The experimental results indicate that the measuring sensitivity is improved by using the center wavelength difference between the two FBGs. The sensitivity is 38.79 pm/kN within the range from 0 to 150 kN, and the correlation coefficient reaches 99.98%. The engineering applications show that the FBG sensing technology can automatically acquire, and monitoring results are of great significance in roadway anchorage engineering safety and bolt support quality evaluation. Furthermore, such a sensor is also widely used in quasi-distributed measurement and long-term online monitoring of bolt force status in such fields as geotechnical engineering, tunnel engineering, and slope engineering.

1. Introduction

In recent years, with the improvement of production capacity and the depletion of shallow coal resources, underground coal mining has been extending to deeper and deeper levels, facing high in situ stress conditions [1]. High in situ stresses can cause roof subsidence and floor heaving in coal mine roadways, thus increasing the difficulty and costs of roadway support and seriously affecting mine production and the miners’ safety [2]. Bolt support is characterized by efficient reinforcement and easy construction and has become the main active support method in coal mine roadways to control roadway roof failure and improve surrounding rock structure stability. Therefore, it is very important to perform real-time online monitoring of the force status of bolts in coal mine roadways to ensure long-term safety and stability of roadway surrounding rock structure and personnel safety. However, the concealment and force status complexity of bolt anchorage systems in surrounding rocks make it more difficult to measure mechanical status in the bolt support process. The current method that uses mechanical or electronic sensors of bolt force status monitoring (BFSM) has poor anti-interference performance, is easily affected by harsh downhole environments, and cannot implement distributed measurement and remote transmission, failing to meet the requirements for long-term real-time monitoring of anchoring quality and force status of bolts in roadways [3].
The fiber Bragg grating (FBG) sensing technology as a new measuring technology has become one of the most promising optical fiber passive device applications [4]. The FBG as a sensing element and transmission medium can be used to measure physical quantities such as temperature, pressure, displacement, flow rate, and acceleration [5]. It has the following unparalleled advantages over the traditional sensing method: intrinsic safety, corrosion resistance, immunity to electromagnetic interference, high reliability, high sensitivity, good stability, strong multiplexing ability, and easy implementation of quasi-distributed long-term online measurement [6]. It is being widely applied in a growing number of sensing application fields, including geotechnical engineering [7,8,9], structural engineering [10,11,12,13], civil engineering [14,15], and tunnel construction engineering [16,17]. The FBG has all-optical characteristic during transmission and signal detection, so it is very suitable for operating in coal mine environments. Chai et al. [18] used the simulation experiment with analogous material for mining and studied the application of fiber optical sensors for monitoring rock failure. Wang et al. [19] presented FBG sensors for online monitoring of stress variation and detection of the micro-seismic signal in coal mines. Zhang et al. [20] concluded that optical fiber sensing technology is an effective method for strata strain monitoring in similarity model test of coal mining. Zhao et al. [21] designed an overall temperature measurement system based on optical fiber online monitoring mechanism and carried out field tests in a coal mine goaf area. The FBG has drawn an increasing amount of attention in the coal mine safety monitoring field.
Nevertheless, there are few studies on the applications of FBG sensors for BFSM in coal mine roadways. This paper reports the design of an FBG bolt force sensor using a cantilever and a circular diaphragm as elastic elements. Two FBGs of the sensor as sensing elements are arranged on the top and bottom surfaces of the cantilever, respectively, and the center wavelength difference between the two FBGs is utilized as a measuring signal, thus improving measuring precision. This sensor has a sensitivity of 38.79 pm/kN and a linear fitting coefficient of 99.98% in the measuring range. It provides the functions of real-time online monitoring and on-site reading, and it was applied in coal mine roadways to monitor bolt force status. The monitoring results are of great significance in the parameter design of bolt support in roadways and in anchoring engineering safety. Furthermore, such a sensor is also widely used in quasi-distributed measurement and long-term online monitoring of bolt force in such fields as geotechnical engineering, tunnel engineering, and slope engineering.

2. Structure and Principle of FBG Bolt Force Sensor

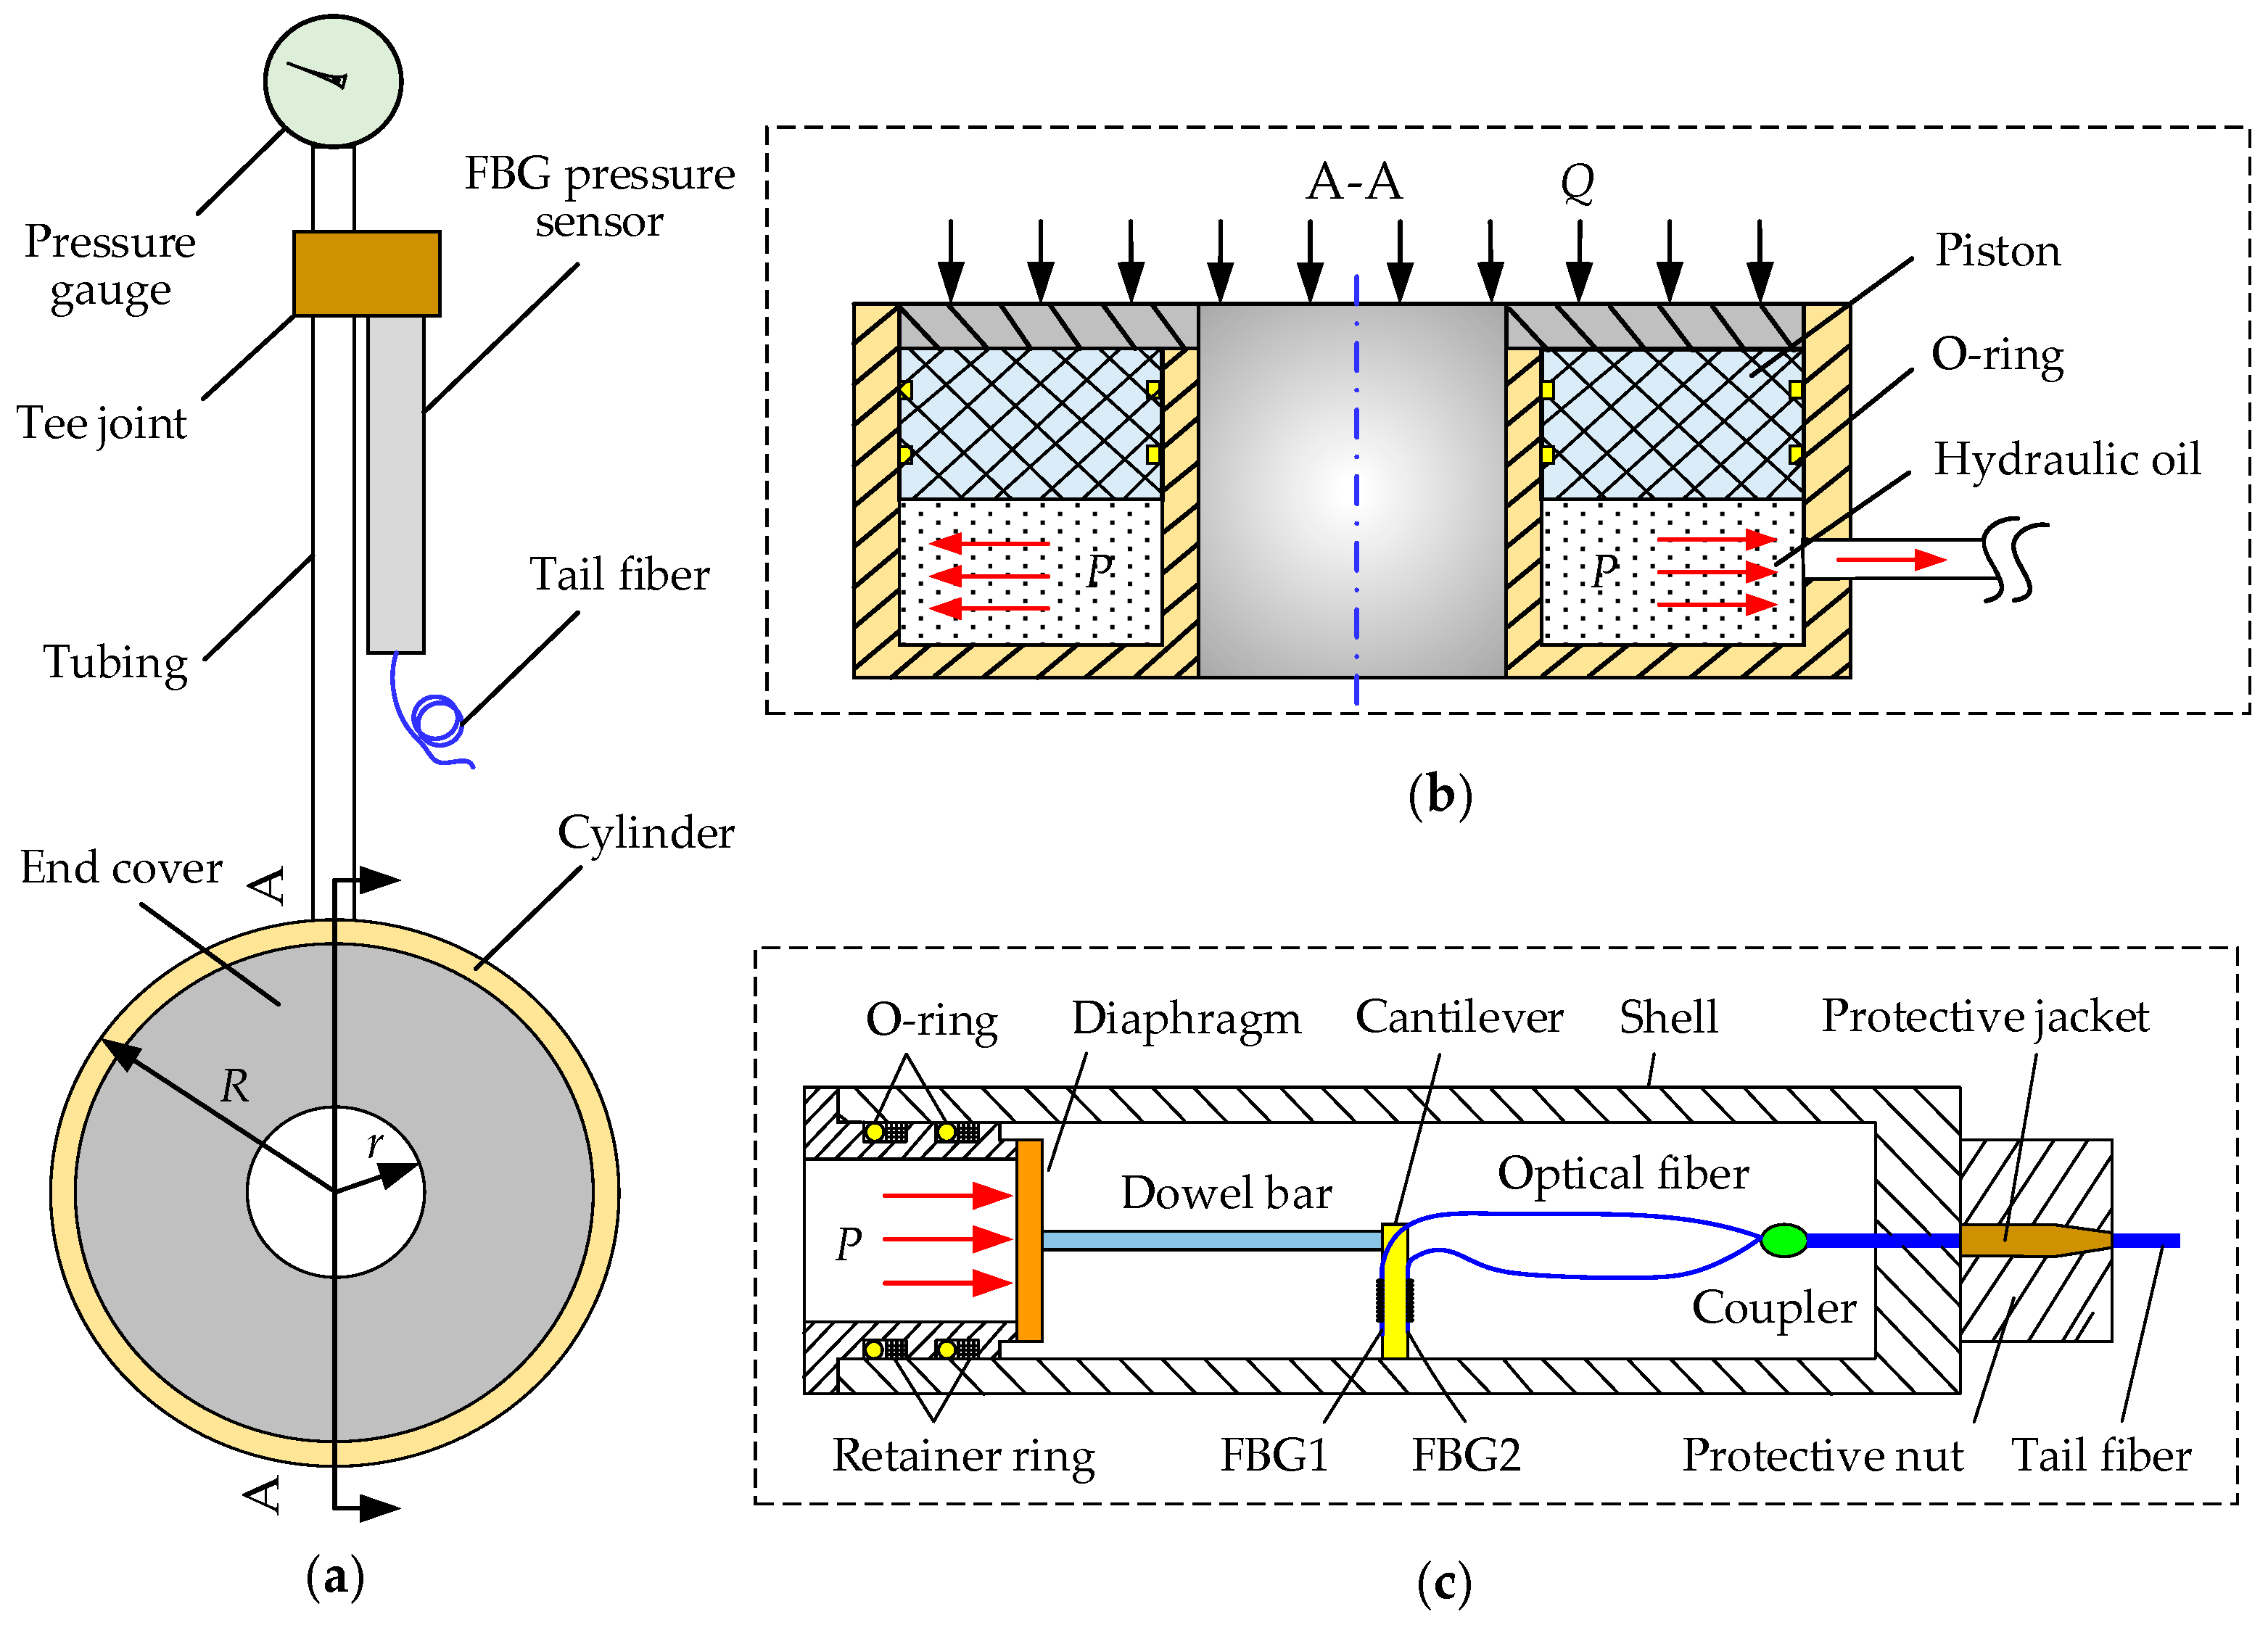
2.1. Structural Design

The FBG bolt force sensor mainly consists of a cylinder, tubing, a pressure gauge, and an FBG pressure sensor. The cylinder is connected to the pressure gauge and the FBG pressure sensor through the tubing and tee joint, respectively. This sensor provides the function of real-time online monitoring and on-site reading, as shown in Figure 1a.
(1) There is hydraulic oil in the cylinder that is sealed with an O-ring, a piston, and an end cover, as shown in Figure 1b. Hydraulic oil as a sensor force transfer medium is a path for transferring an external force to the sensor. Its role is to transfer an external load to the FBG pressure sensor and a measured value is indicated on the pressure gauge in real time.
(2) The FBG pressure sensor as a core component of the sensor mainly includes a planar diaphragm, a cantilever, a dowel bar, a shell, and two FBGs, as shown in Figure 1c. The diaphragm as a dynamometric elastic element is a force component of the sensor. The two FBGs as sensing elements of the sensor are bonded in symmetric positions on the top and bottom surfaces of the cantilever and are led out from one end of the sensor after being connected to the coupler through an optical fiber.

2.2. Measuring Principle

The FBG is an optical fiber device whose grating is directly written by ultraviolet light into a single mode fiber so that the refractive index is axially changed along the optical fiber. When light transmitted along the fiber core scatters on each FBG, if the Bragg condition is satisfied, a reflection peak is formed in the reverse direction. The wavelength corresponding to the apex of this reflection peak is the reflection center wavelength.
The basic sensing principle of the FBG is to convert a change in external physical quantities to its center wavelength shift by utilizing the sensitivity of its own grating period and effective refractive index to external physical quantities and then detect the change in the FBG reflected center wavelength to achieve measurement of external parameters. The effect of the strain and temperature changes on the wavelength shift can be expressed as [22,23]
Δ λ B λ B = ( 1 P e ) ε + ( α + ζ ) Δ T
where λB is the initial center wavelength; ε is the strain change; ΔT is the temperature change; Pe is the effective elasto-optical coefficient; α is the thermal expansion coefficient; ζ is the thermo-optical coefficient of the optical fiber. According to Equation (1), the effect of temperature on wavelength shift shall be eliminated to obtain a separate strain change.
When the bolt force Q is applied to the sensor cylinder and causes the piston to move and compress hydraulic oil in the cylinder to generate a uniform oil pressure P. The expression is as follows:
Q = P π ( R 2 r 2 )
where R is the outer radius of the cylinder, and r is the inner radius of the cylinder.
Oil pressure is transferred to the pressure gauge and the FBG pressure sensor through the tubing and the tee joint. When a uniform pressure is applied to the planar circular diaphragm in the sensor, a concentrated force is generated on the equi-intensity cantilever through the dowel bar, as shown in Figure 1c. The center deflection of the diaphragm under the uniform pressure and cantilever reactive force F is as follows [24,25]:
y = y ( P ) y ( F )
y ( P ) = 3 ( 1 μ 2 ) P R 0 4 16 E 1 t 3 ( R 0 4 r 0 4 + 4 R 0 2 r 0 2 ln ( r 0 R 0 ) )
y ( F ) = 3 ( 1 μ 2 ) F R 0 2 4 π E 1 t 3 ( 1 ( r 0 R 0 ) 2 1 ( r 0 R 0 ) 2 + 4 ln 2 ( r 0 R 0 ) 1 ( r 0 R 0 ) 2 )
where E1 is the Young’s modulus of the diaphragm; μ is Poisson’s ratio; r0 is the dowel bar radium; R0 and t are the radius and thickness of the diaphragm, respectively.
The deflection generated at the center of the diaphragm is the same as that of the cantilever under the concentrated force F according to the deformation compatibility principle and is determined by [26,27]
y = 6 F l 3 E 2 b h 3
where E2 is the Young’s modulus of the cantilever; b is the width of the free end of the cantilever; l and h are the length and thickness of the cantilever, respectively.
The relation between the deflection and strain of the cantilever is as follows [28]:
y = l 2 h ε .
Combining Equations (2)–(7), the strain can be obtained as follows:
ε = 3 ( 1 μ 2 ) R 0 4 16 E 1 t 3 ( R 0 4 r 0 4 + 4 R 0 2 r 0 2 ln ( r 0 R 0 ) ) π ( R 2 r 2 ) [ l 2 h + ( 1 μ 2 ) E 2 b R 0 2 h 2 8 π E 1 l t 3 ( 1 ( r 0 R 0 ) 2 1 ( r 0 R 0 ) 2 + 4 ln 2 ( r 0 R 0 ) 1 ( r 0 R 0 ) 2 ) ] Q .
When a deflection is generated on the cantilever, the strains of the FBGs bonded on its top and bottom surfaces are equal in size and opposite in direction (ε1 = −ε2 = ε). In addition, the two FBGs operate in the same temperature environment (ΔT1 = ΔT2 = ΔT). The center wavelength changes of FBG1 and FBG2 are expressed as follows:
Δ λ FBG 1 λ FBG 1 = ( 1 P e ) ε + ( α + ζ ) Δ T
Δ λ FBG 2 λ FBG 2 = ( 1 P e ) ε + ( α + ζ ) Δ T .
The initial center wavelengths of the two FBGs are λFBG1 = 1530.859 nm and λFBG2 = 1537.568 nm, respectively. The initial center wavelengths are much larger than the wavelength changes caused by strain or temperature (at 1550 nm, the strain and thermal sensitive coefficients are 1.21 pm/με and 10.3 pm/°C), so the equivalent wavelength λFBG (taken as the smaller one out of λFBG1 and λFBG2) can be used to replace two initial center wavelengths [29]. By subtracting Equation (10) from Equation (9), the difference between the wavelength changes of the two FBGs is obtained as follows:
Δ λ FBG 1 Δ λ FBG 2 = 2 λ FBG ( 1 P e ) ε .
According to Equation (8) and Equation (11), the relation between the two wavelength changes difference and the bolt force can be obtained as follows:
Δ λ FBG 1 Δ λ FBG 2 = k Q
k = 3 ( 1 P e ) ( 1 μ 2 ) λ FBG R 0 4 8 E 1 t 3 ( R 0 4 r 0 4 + 4 R 0 2 r 0 2 ln ( r 0 R 0 ) ) π ( R 2 r 2 ) [ l 2 h + ( 1 μ 2 ) E 2 b R 0 2 h 2 8 π E 1 l t 3 ( 1 ( r 0 R 0 ) 2 1 ( r 0 R 0 ) 2 + 4 ln 2 ( r 0 R 0 ) 1 ( r 0 R 0 ) 2 ) ]
where k is the sensor force sensitivity.
The theoretical sensitivity k of the sensor is calculated to be a constant of 39.46 pm/kN according to the structural material parameters of the FBG bolt force sensor (Table 1). The modal analysis results of the diaphragm obtained using the ABAQUS finite element analysis software show that the diaphragm has a first-order intrinsic frequency of 3416.0 Hz, and the amplitude is the largest at the center of the diaphragm and decreases gradually from the center to the edge. Therefore, the designed sensor can perform dynamic high-frequency pressure measurement. Moreover, Equation (12) shows that the difference between two wavelength shifts is linear to the force. Compared with a single FBG wavelength shift as a sensing signal, this enhances the measuring sensitivity and effectively avoids the effect of temperature on measuring results due to irrelevance to any temperature change.

3. Sensor Performance Experiment

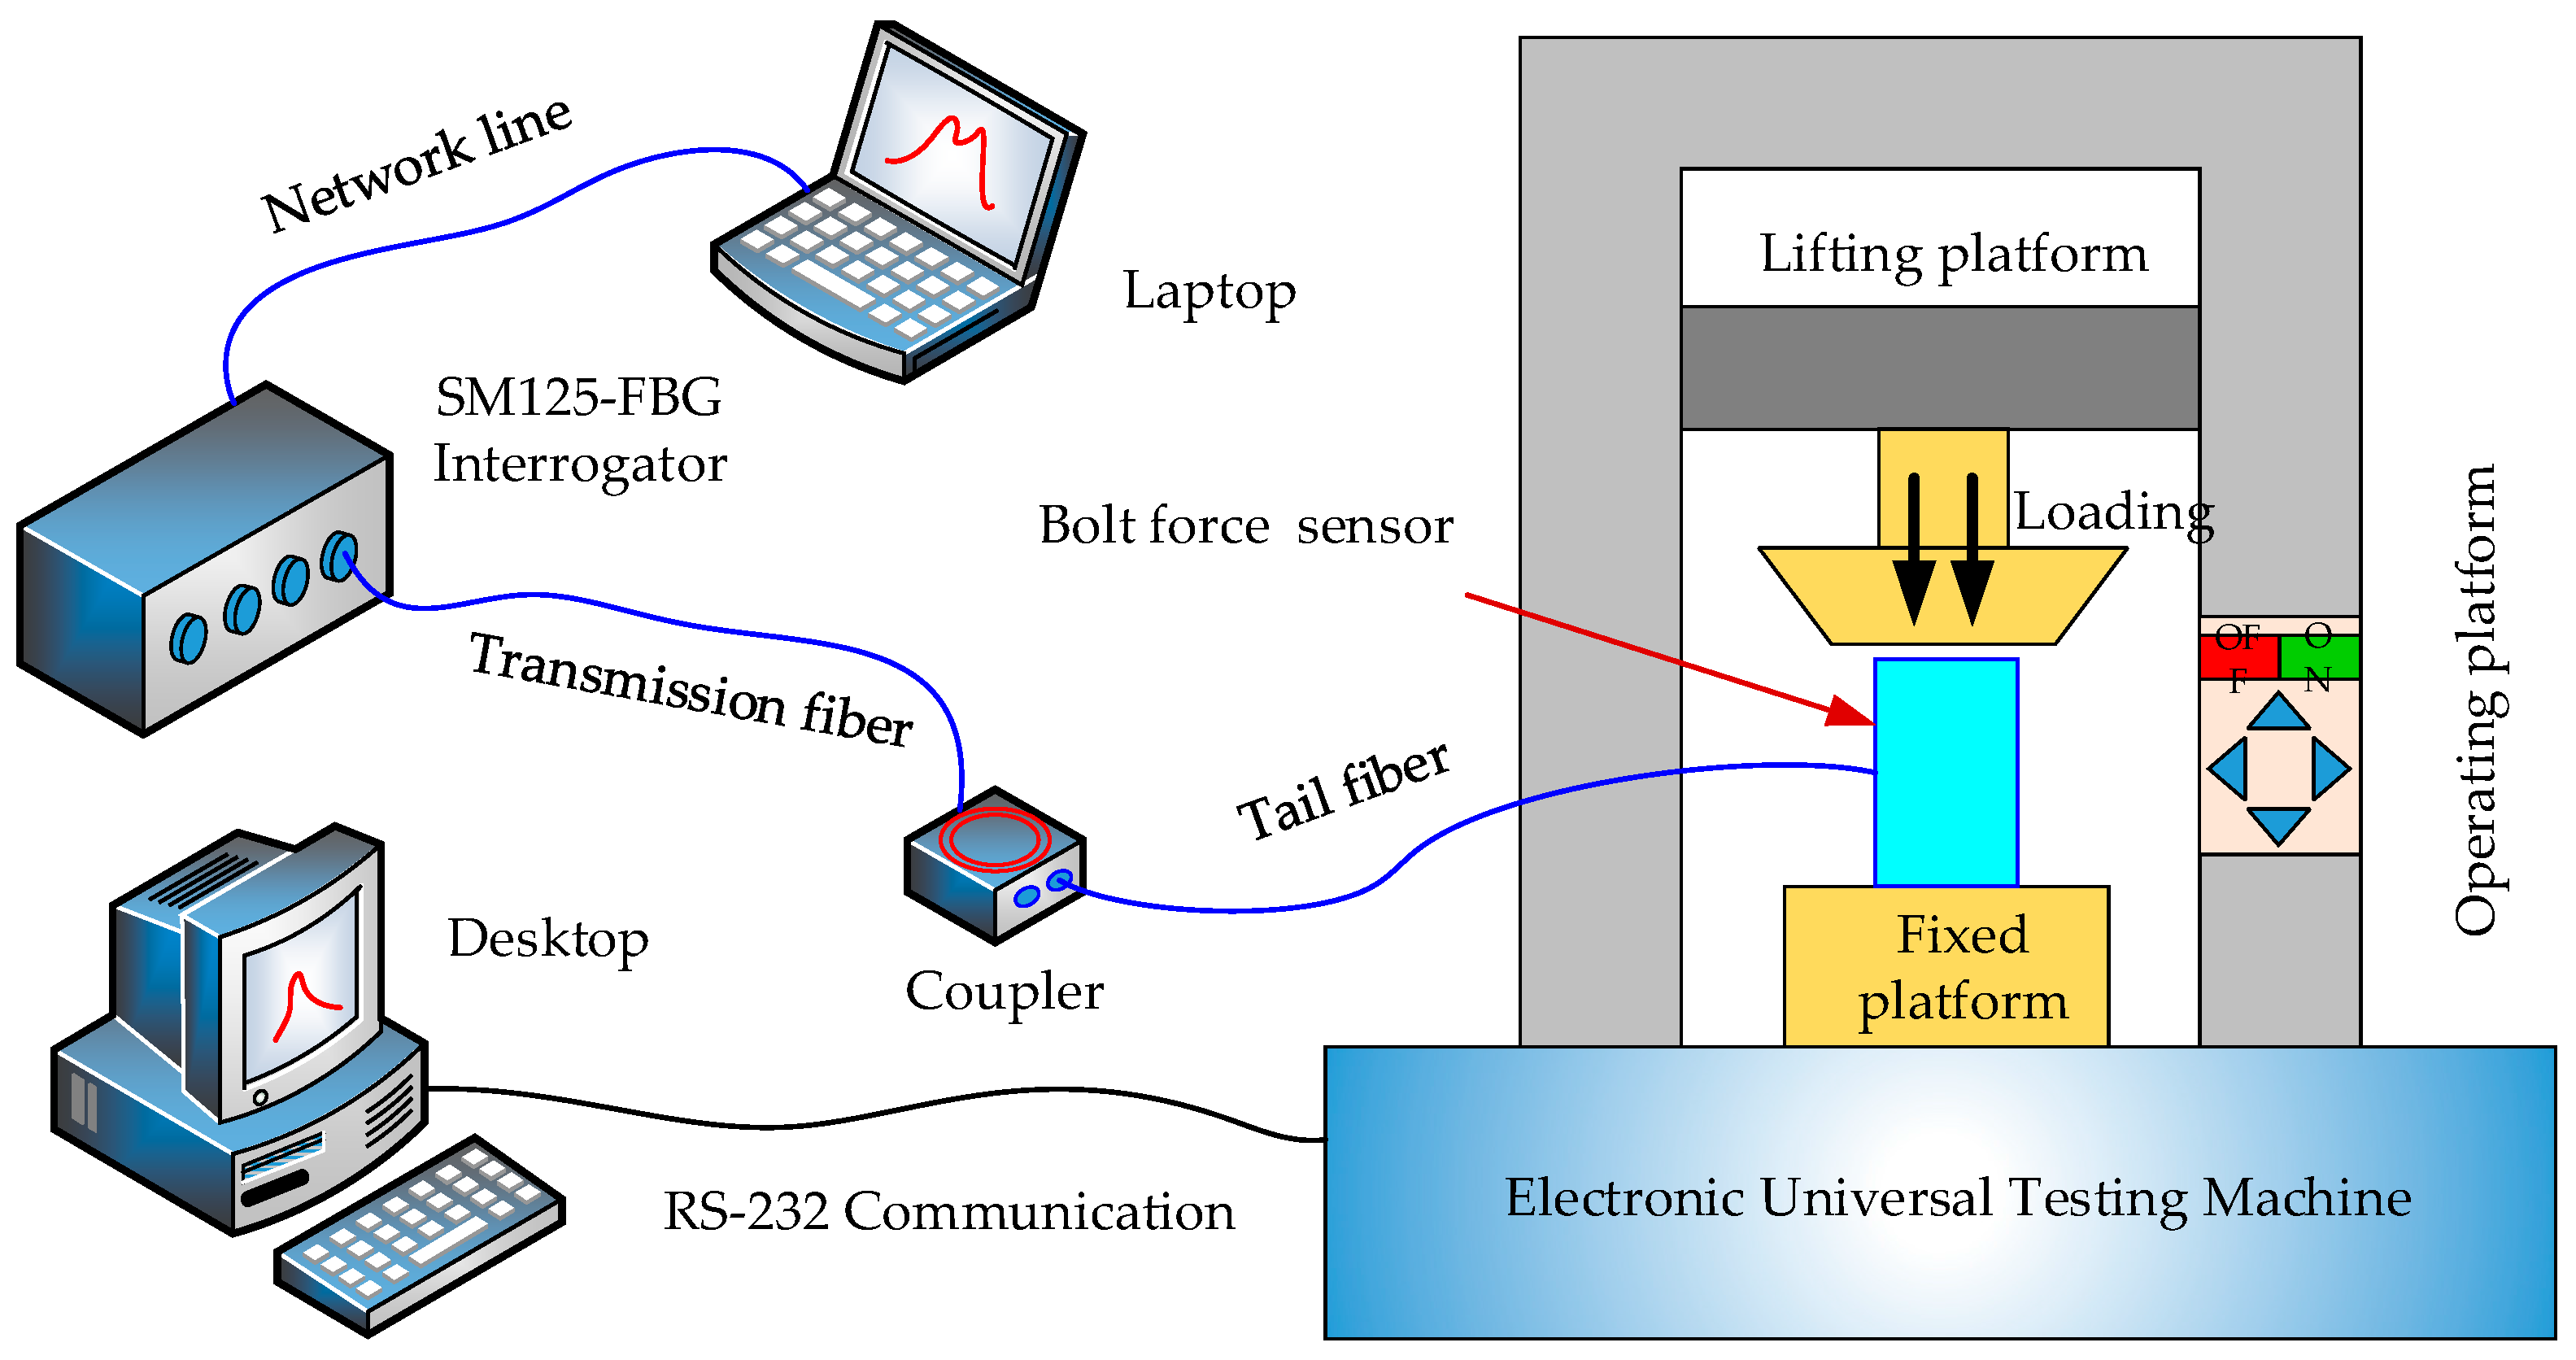
3.1. Experimental Devices and Process

To understand the relation between the external load applied to the sensor and the grating wavelength change, the sensor performance test system is shown in Figure 2. The FBGs of the FBG bolt force sensor in the experiment were made of ordinary single mode fiber using the ultraviolet light side writing technology. The connector was a universal optical fiber FC/APC jumper connector. The FBG center wavelength was measured using an SM125 FBG interrogator produced by Micron Optics, Inc., Atlanta, GA, USA, with an operating wavelength range of 1510~1590 nm, a wavelength resolution of 1 pm, a measuring precision of 1 pm, and a scanning frequency of 1 Hz. The test loading device was a C64.106 universal testing machine from MTS Systems Corporation, Eden Prairie, MN, USA, with a load range of 1000 kN and a stroke of 250 mm. The sensor was controlled in the range of 0~150 kN using the universal testing machine in the experimental process, and 15 kN was loaded each time. Loading was repeated three times in the room temperature environment in the experiment.

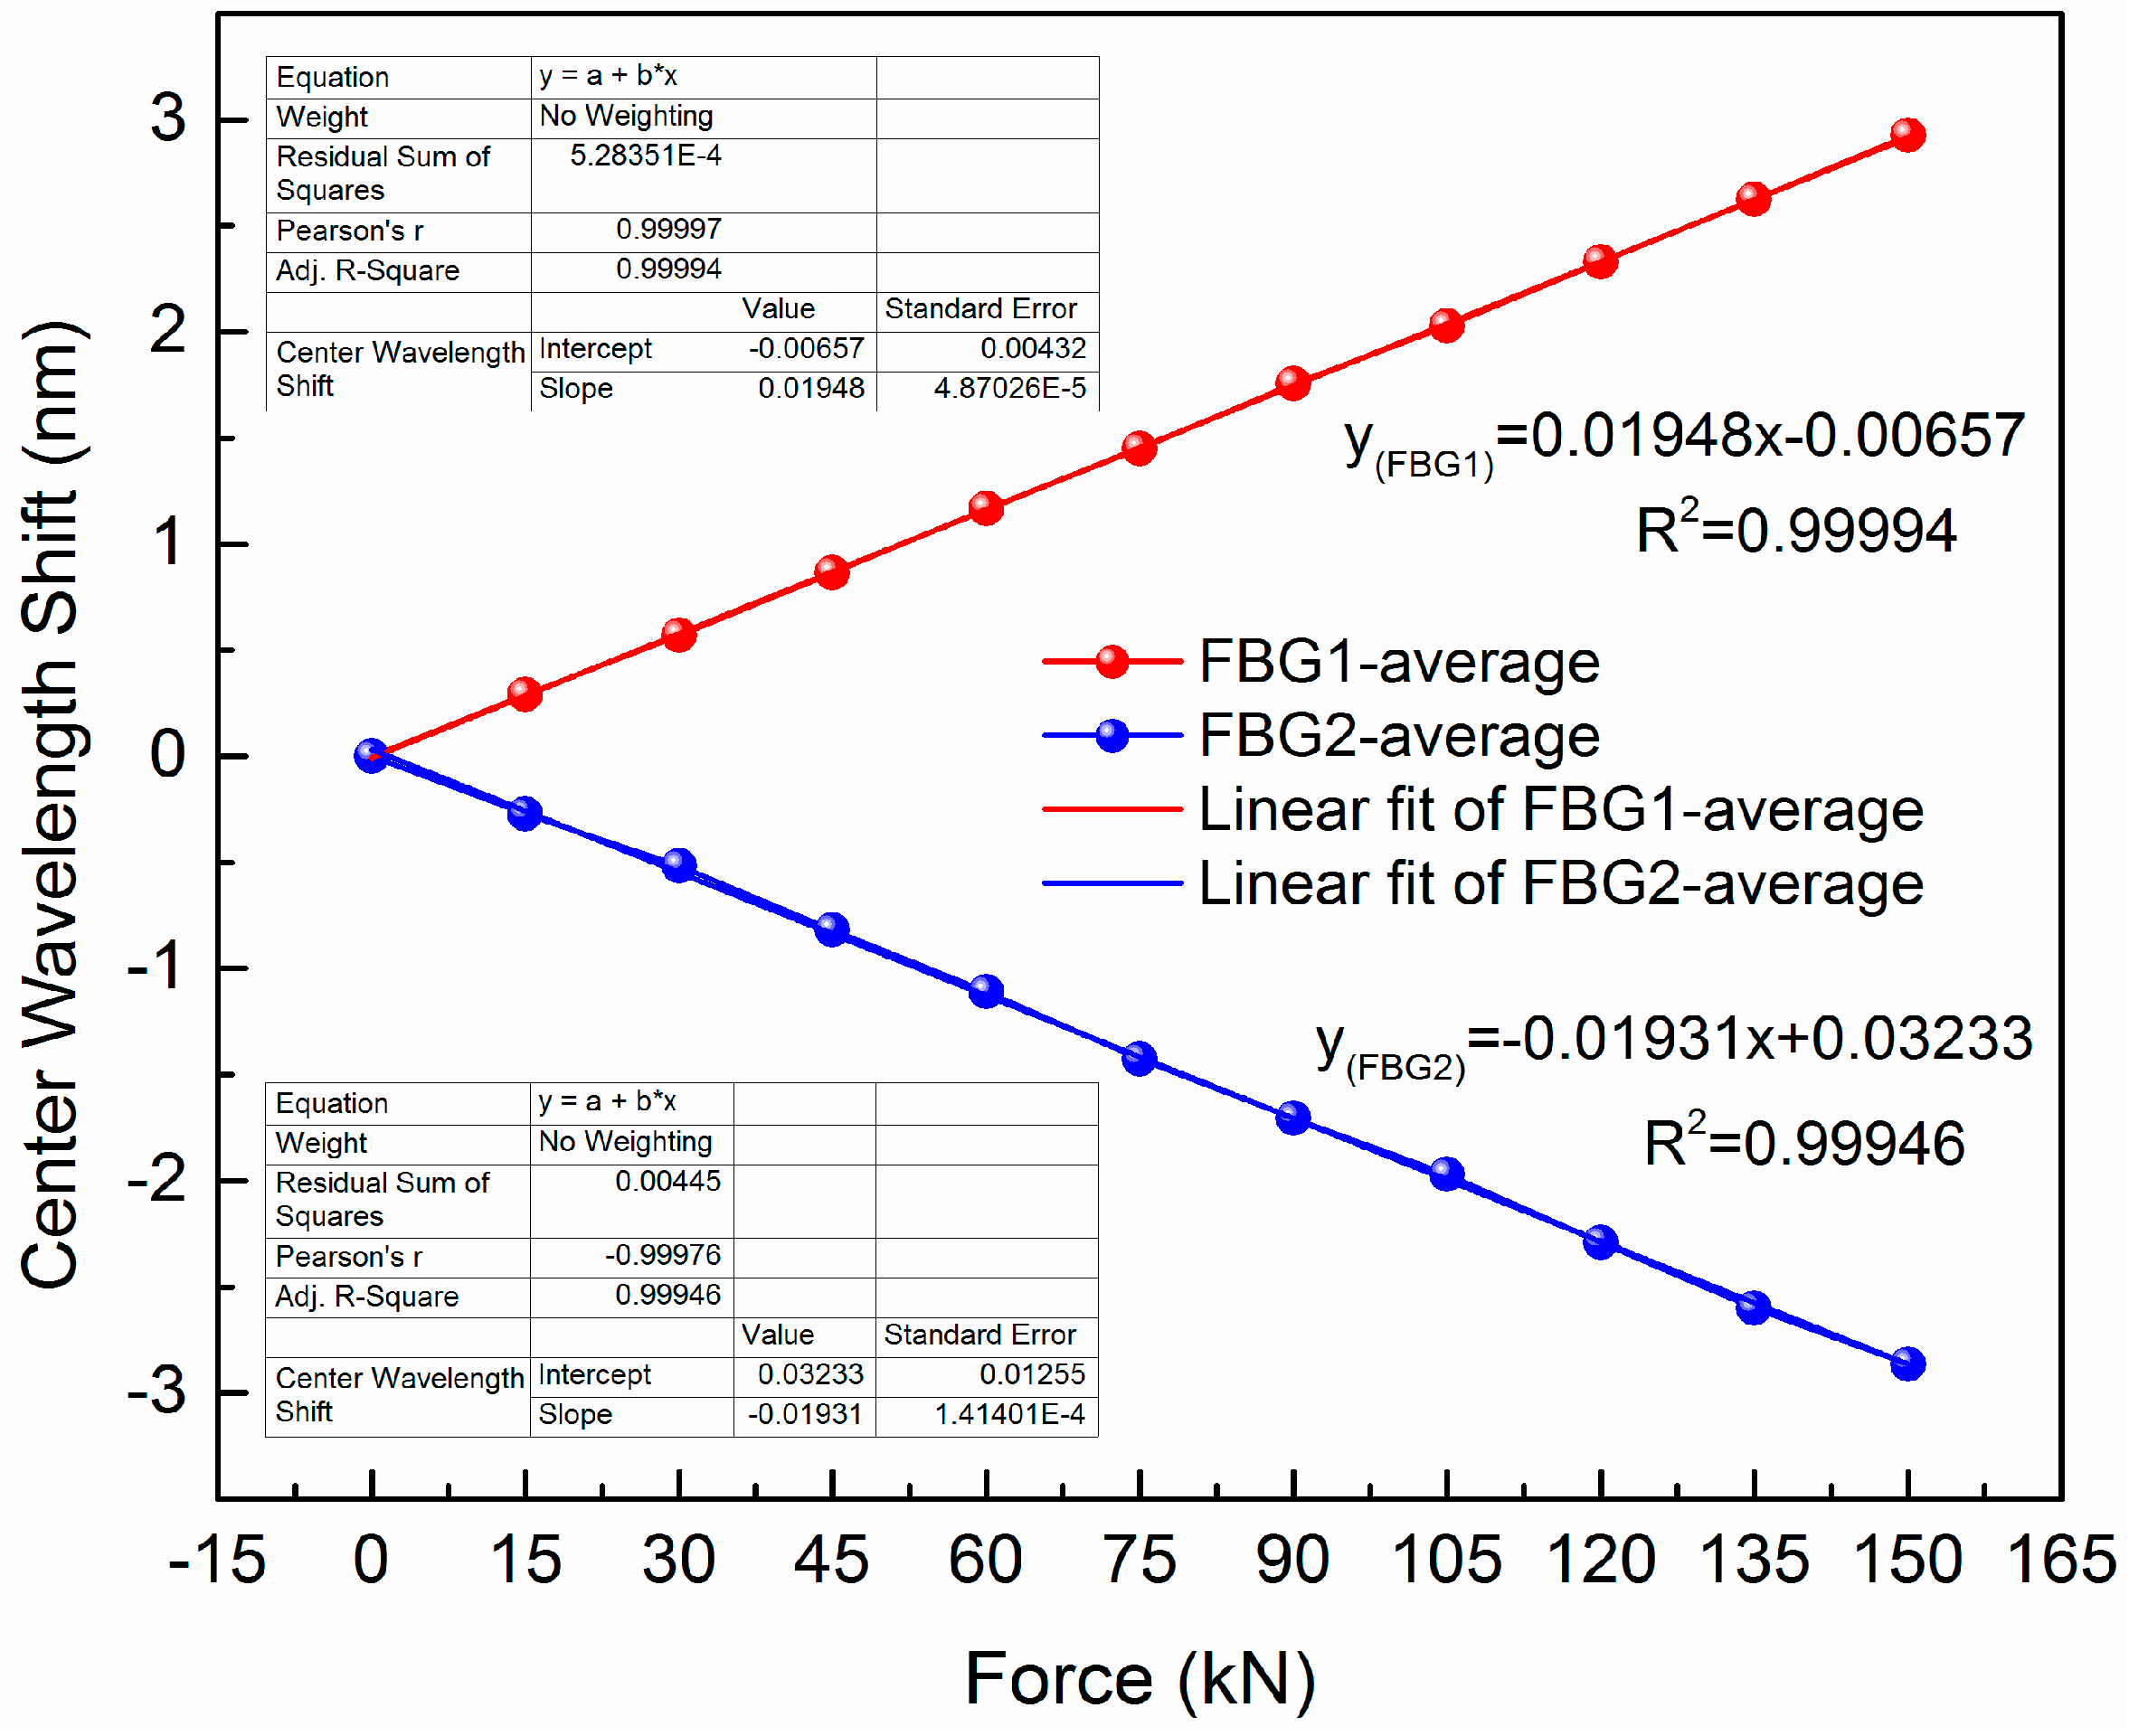
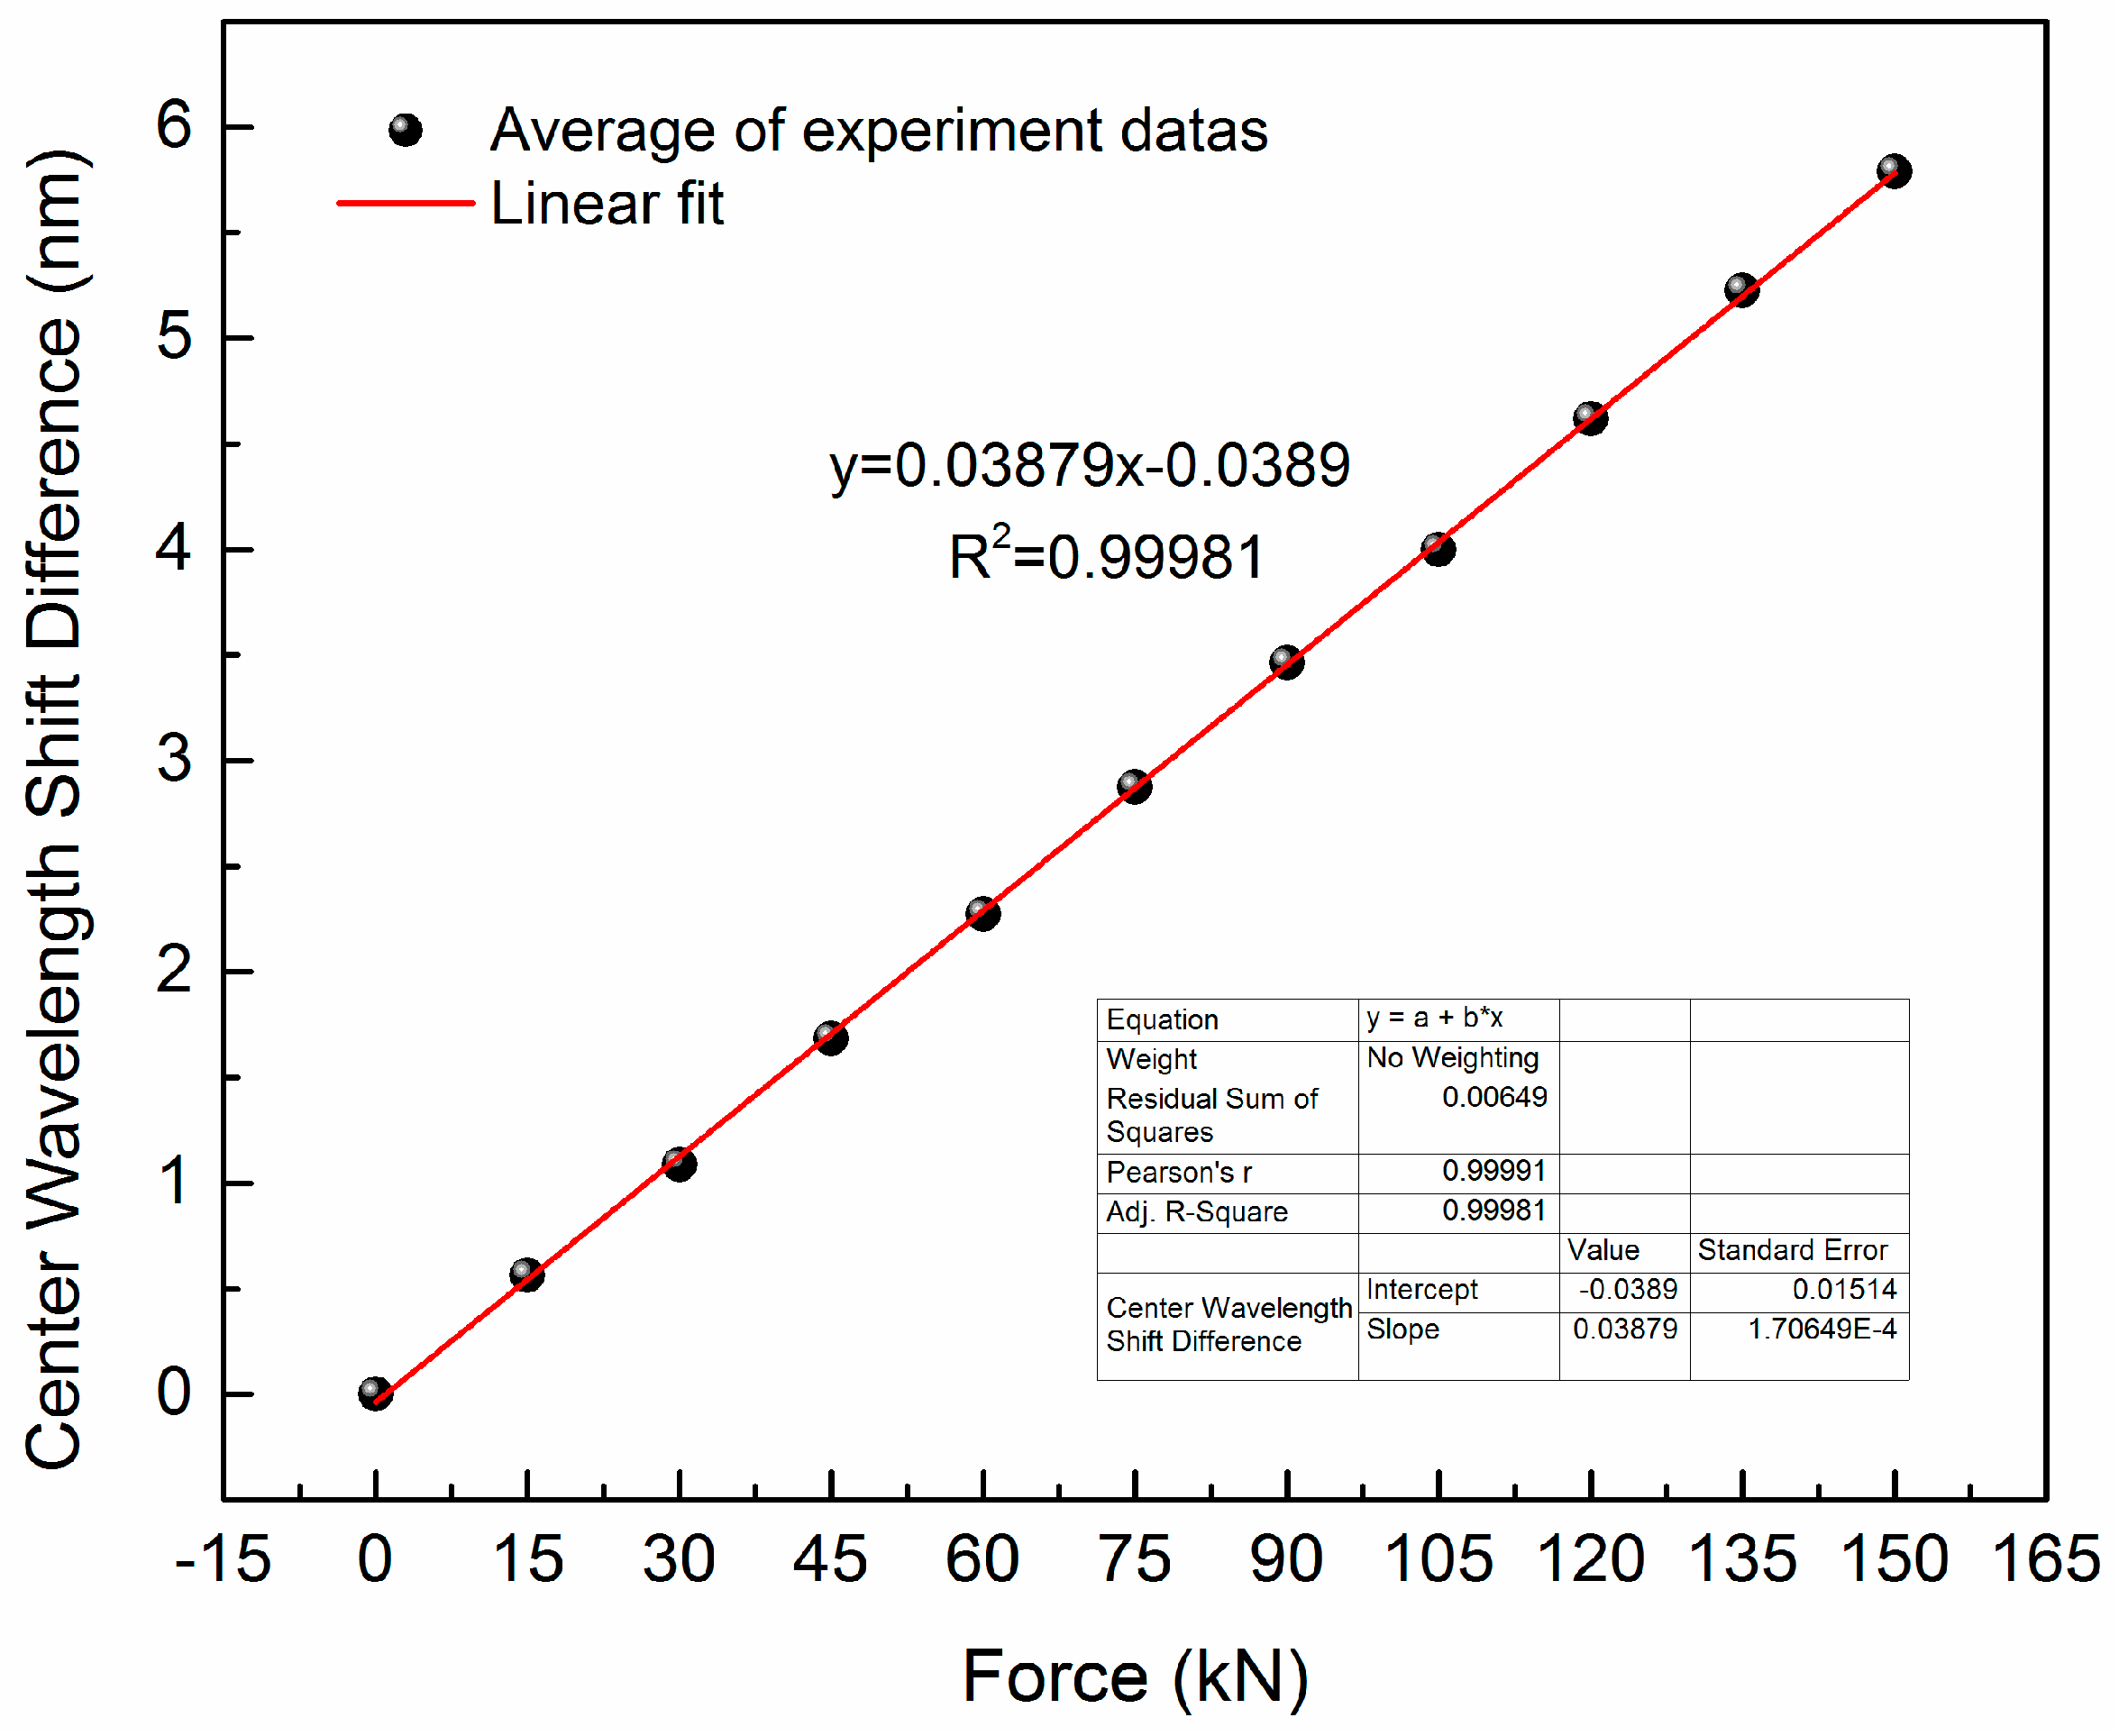
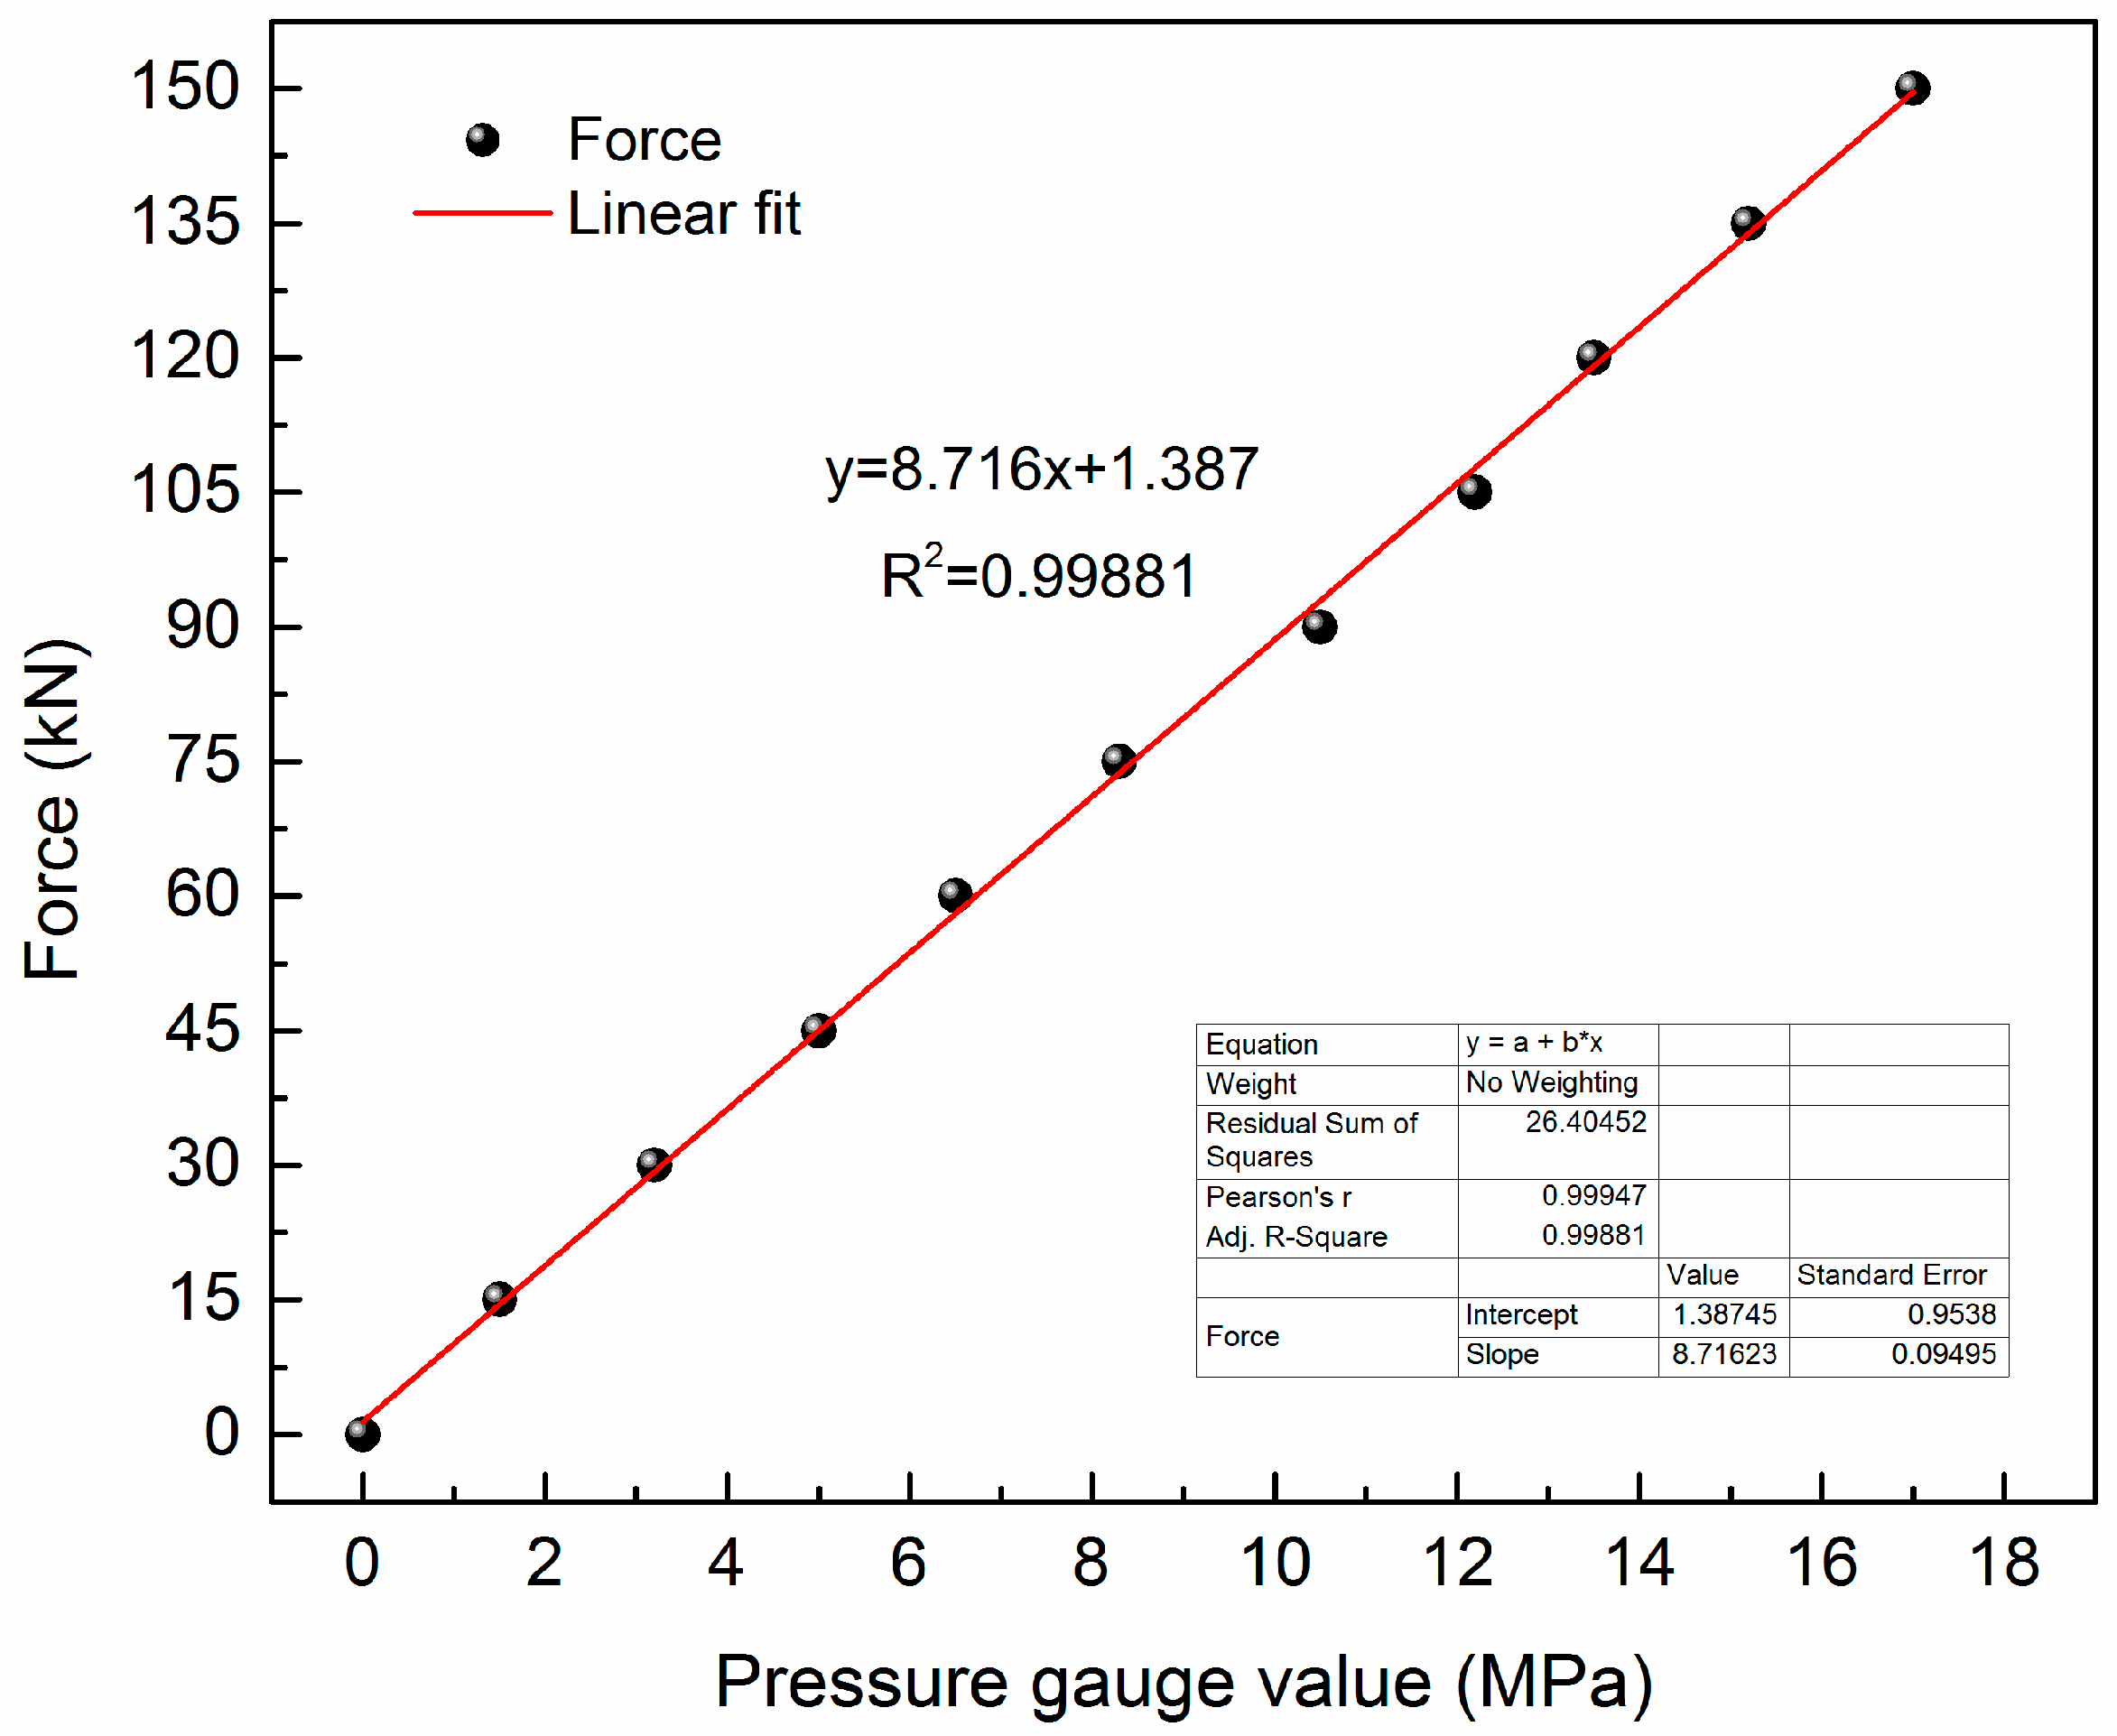
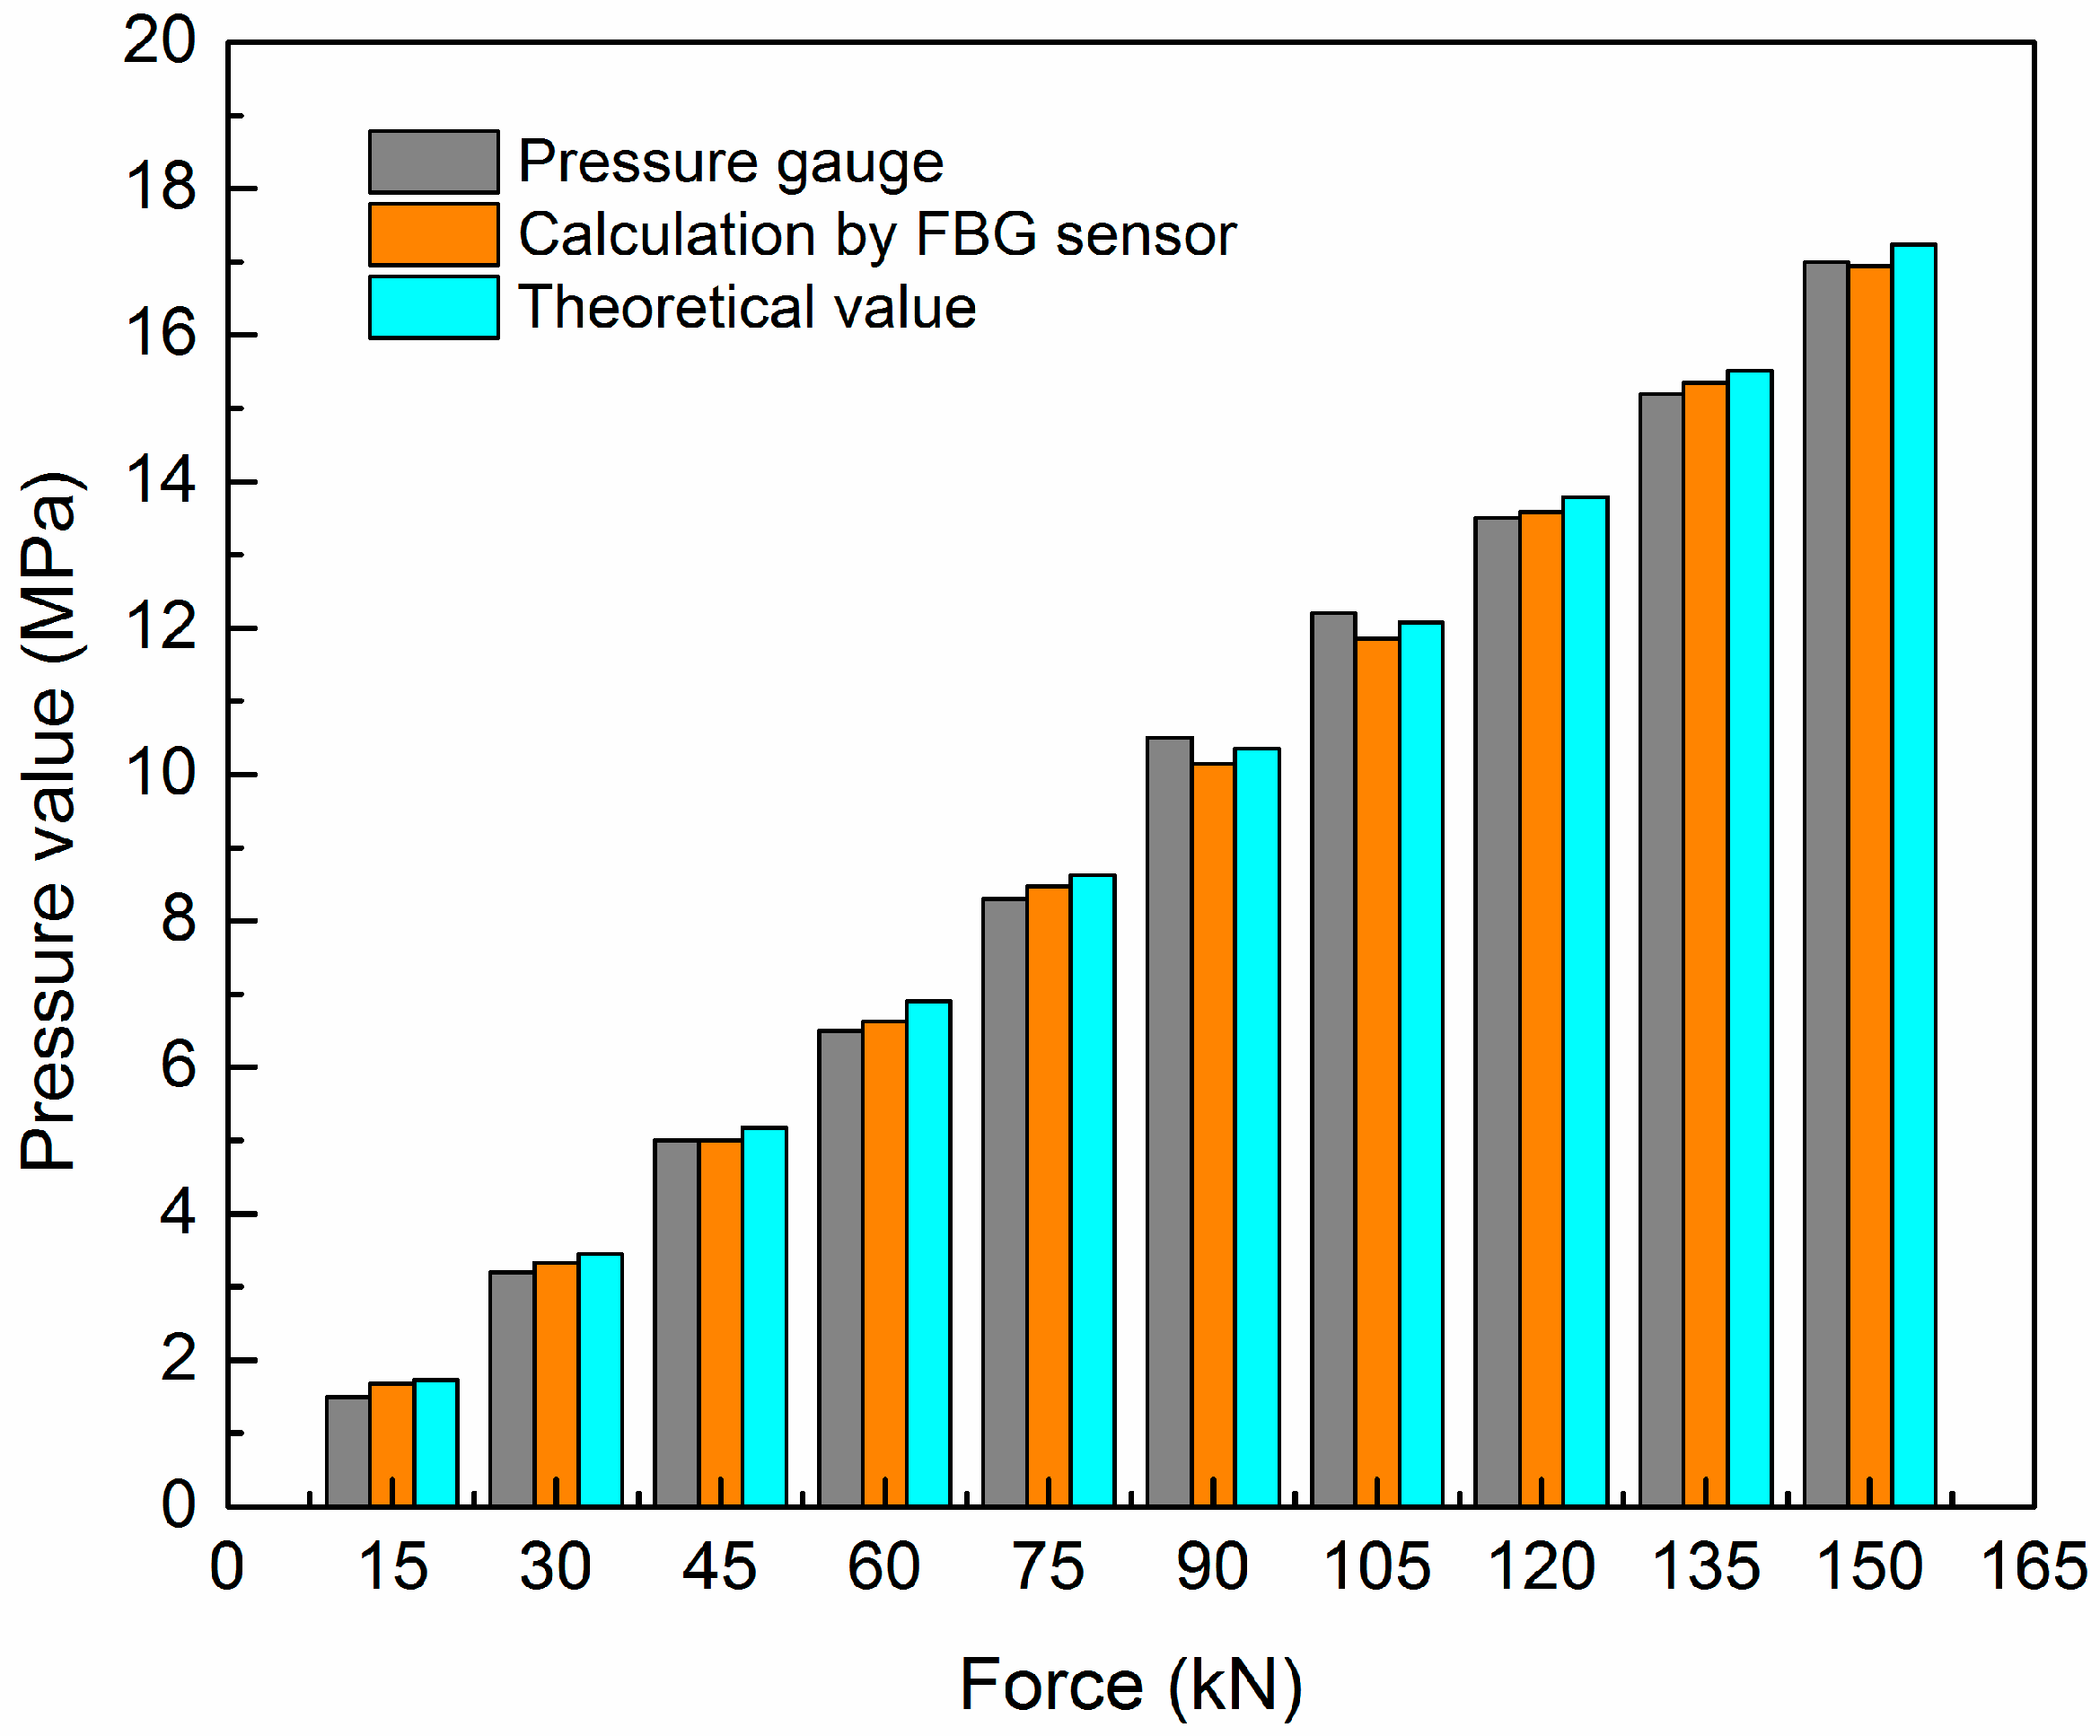
3.2. Analysis of Experimental Results

Figure 3 shows the relation between the center wavelength changes and force variation for the two FBGs. The wavelengths of FBG1 present a red shift, which verifies that FBG1 is stretched and senses the positive strain. The wavelength of FBG2 show a blue shift, indicating that FBG2 is compressed and senses the negative strain. Both variation patterns are linear, and the linear fitting sensitivity is 19.48 pm/kN and −19.31 pm/kN, respectively.
Figure 4 shows the average of wavelength shift differences between the two FBGs versus force. The fitting results are also given and the force sensitivity of the sensor is 38.79 pm/kN; in other words, 38.79 pm is approximately equivalent to 32.06 με of optical fiber Bragg grating (the strain sensitive coefficient of FBG is 1.21 pm/με), and the linear correlation coefficient is 0.9998. The measuring sensitivity is apparently improved, compared with the wavelength change of a single FBG as a measuring signal. The measured force sensitivity is basically consistent with the theoretically calculated value, and its influential factors are mainly the measurement process error and strain transfer efficiency.
Figure 5 shows the curve of the pressure gauge value versus the applied force. It can be seen that the applied force is linear to the pressure gauge value. The sensitivity of the force and pressure gauge value conversion is 8.72 kN/MPa, and the correlation coefficient is 0.9988. Figure 6 shows the test comparison between the pressure gauge and the FBG sensor under different forces. It can be seen that the results of the pressure gauge value and the FBG sensor’s calculated and theoretical values slightly differ from each other, and the largest difference values are 0.397 MPa and 0.3 MPa, respectively. Compared with the theoretical values, the pressure gauge values show a fluctuation in the measured data due to artificial reading error. The largest measured value of the FBG sensor is 16.94 MPa and is slightly smaller than the theoretical value of 17.24 MPa due to strain transfer and test errors. Therefore, the theory and experiment show that the designed FBG bolt force sensor can meet the measuring requirements, and this sensor can be used for the online monitoring and direct on-site reading of the force status of bolts in coal mine roadways.

4. Application of FBG Sensors for Bolts Force Monitoring in Coal Mine Roadway

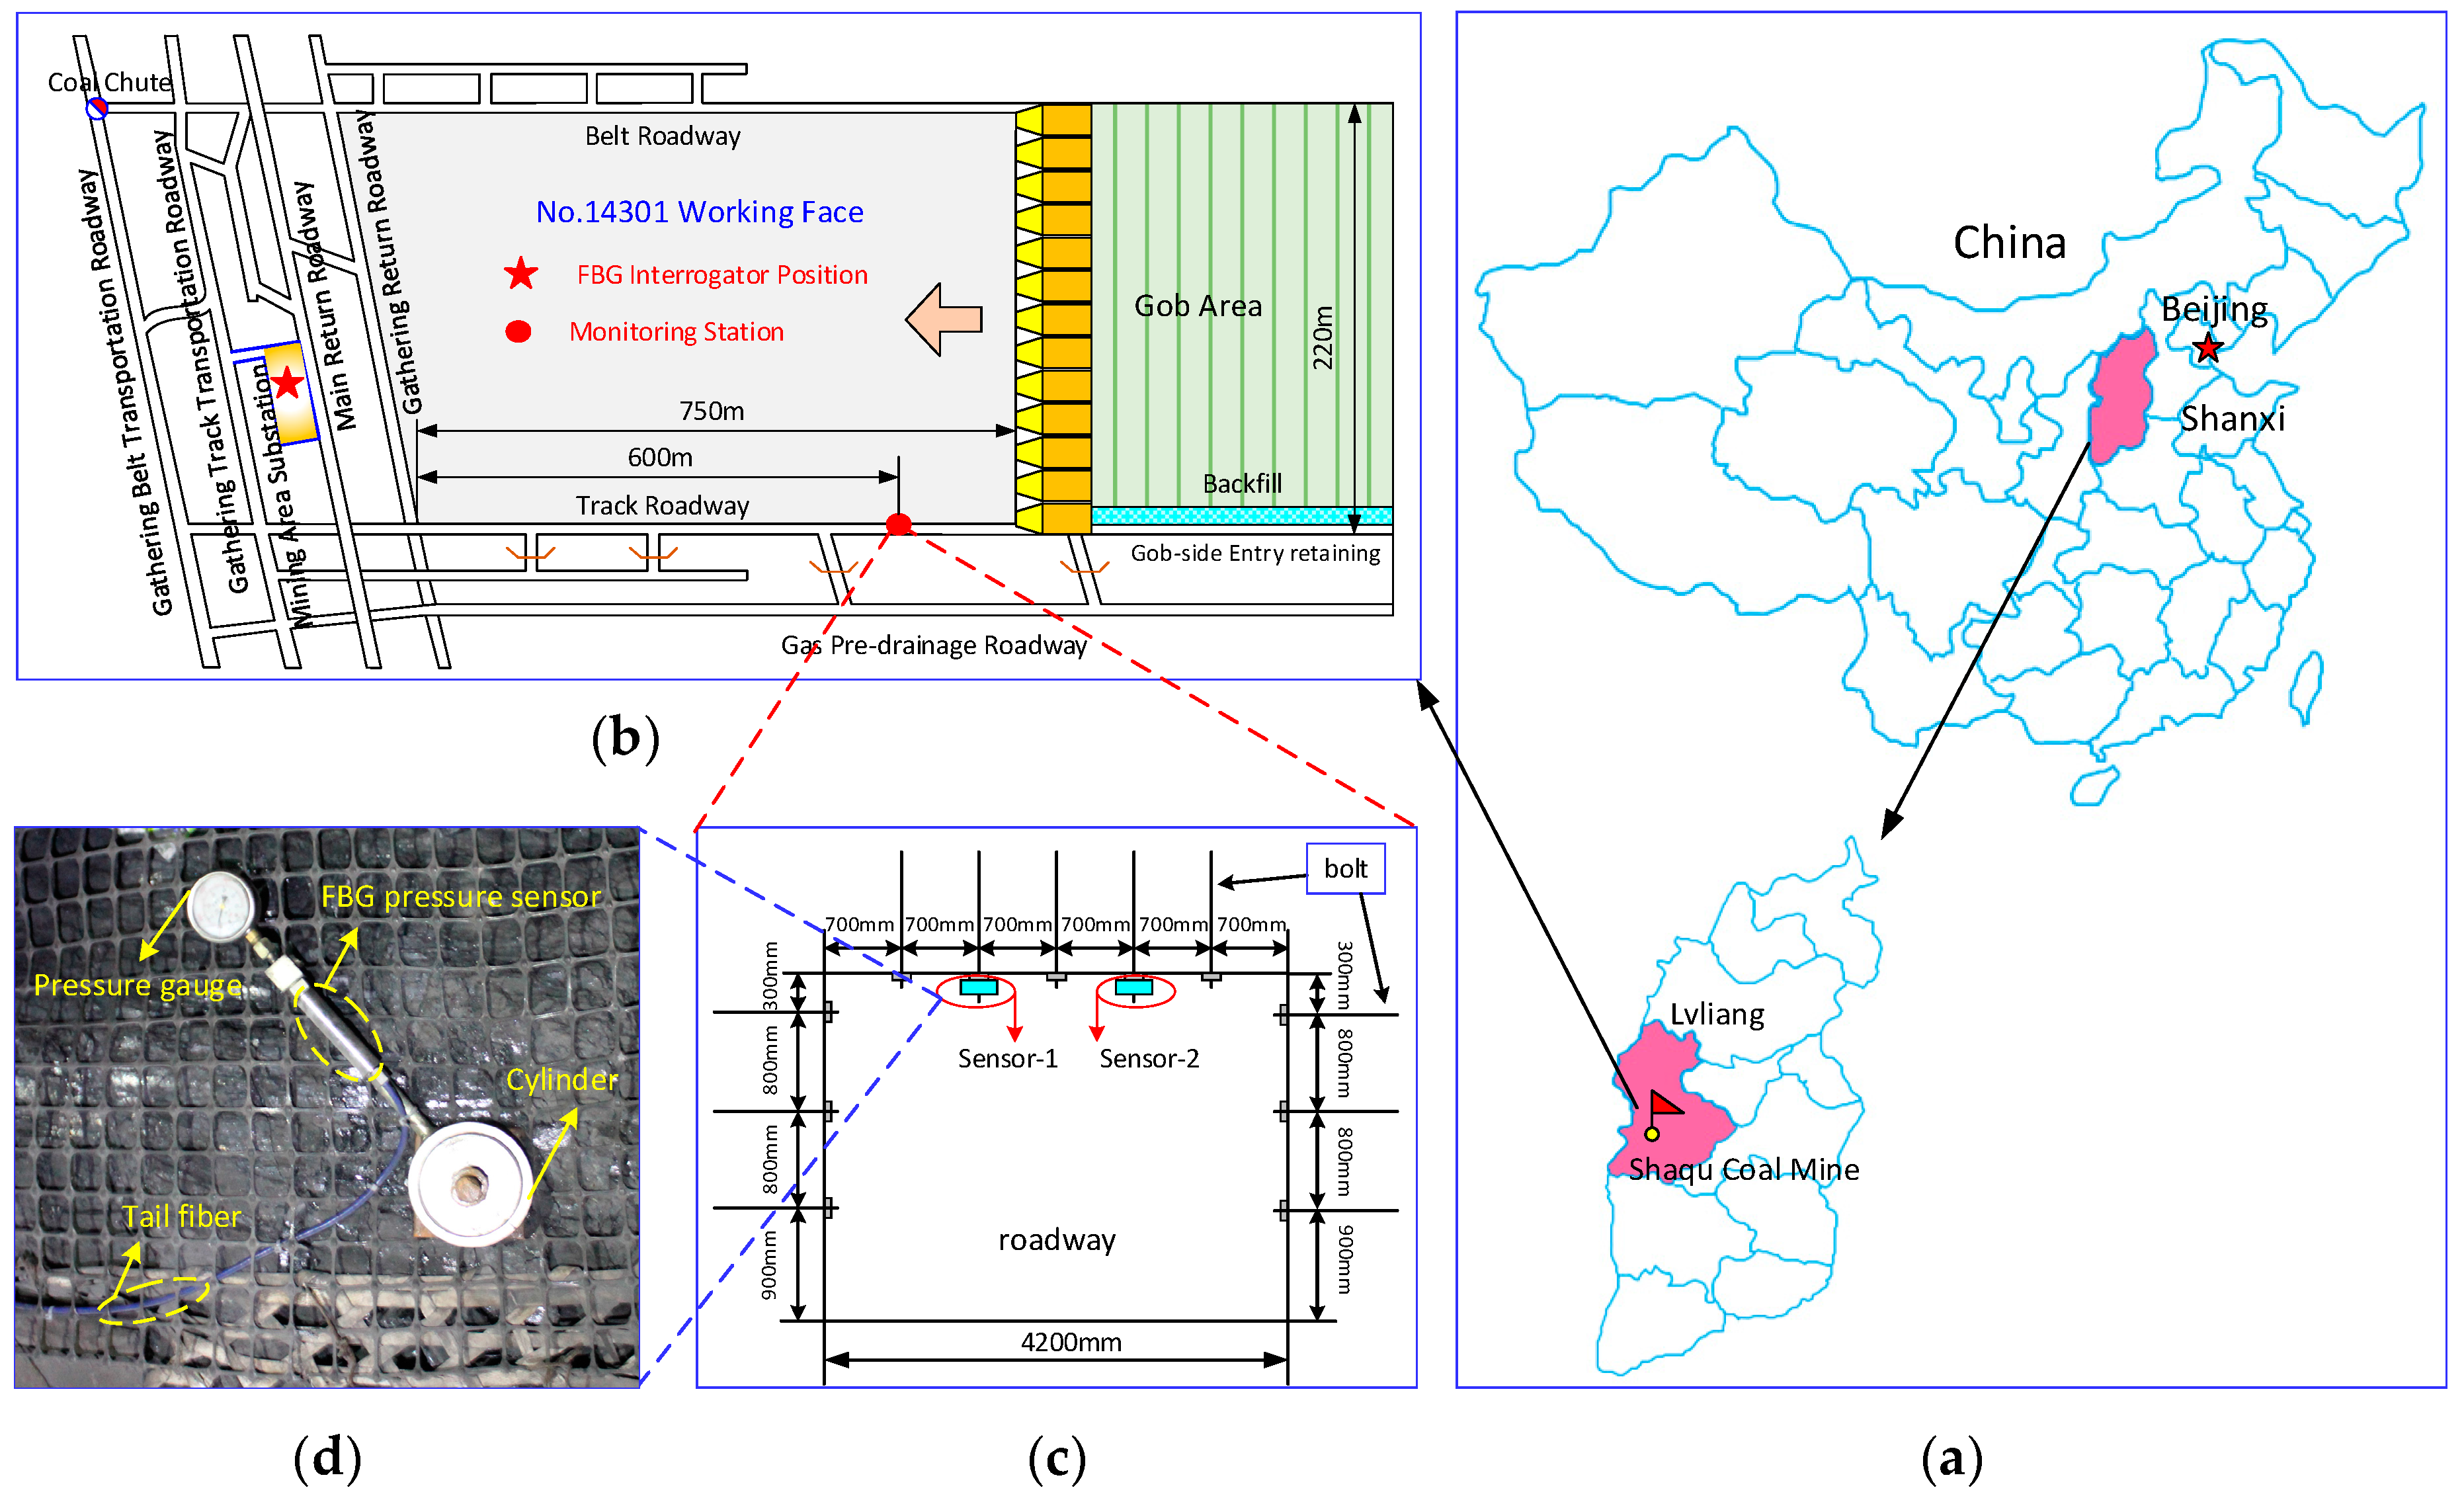
4.1. Engineering Overview and Monitoring Scheme

The engineering application place is the No. 14301 longwall working face of the Shaqu coal mine, Lvliang City, Shanxi Province, China, as shown in Figure 7a. This working face has an average inclination of 4°, a burial depth of 400 m, a vertical stress of about 10 MPa, a minable length of 1145 m, and a width of 220 m. It is identified as a highly gassy mine by the Chongqing Branch of the China Coal Research Institute, with a gas content of 81.84 m3/t.
When the monitoring system was installed, the working face had been mined to 750 m from the roadway adit. A monitoring observation station was arranged 150 m in front of the working face. An FBG interrogator and an upper computer were provided in the anti-explosion cabinet, which was placed in the substation in the mining area. The plan view of the No. 14301 working face and the layout of the observation station are shown in Figure 7b. The bolt force status test place was the track roadway of the No. 14301 working face. The roadway had a rectangular section with a width of 4.2 m and a height of 2.8 m. Two FBG bolt force sensors (Sensor-1 and Sensor-2) were installed on the roadway roof, 1.4 m from both sides of the roadway. The roadway section support and sensor installation positions are shown in Figure 7c. A picture of the installation of the FBG bolt force sensor in the roadway is shown in Figure 7d.

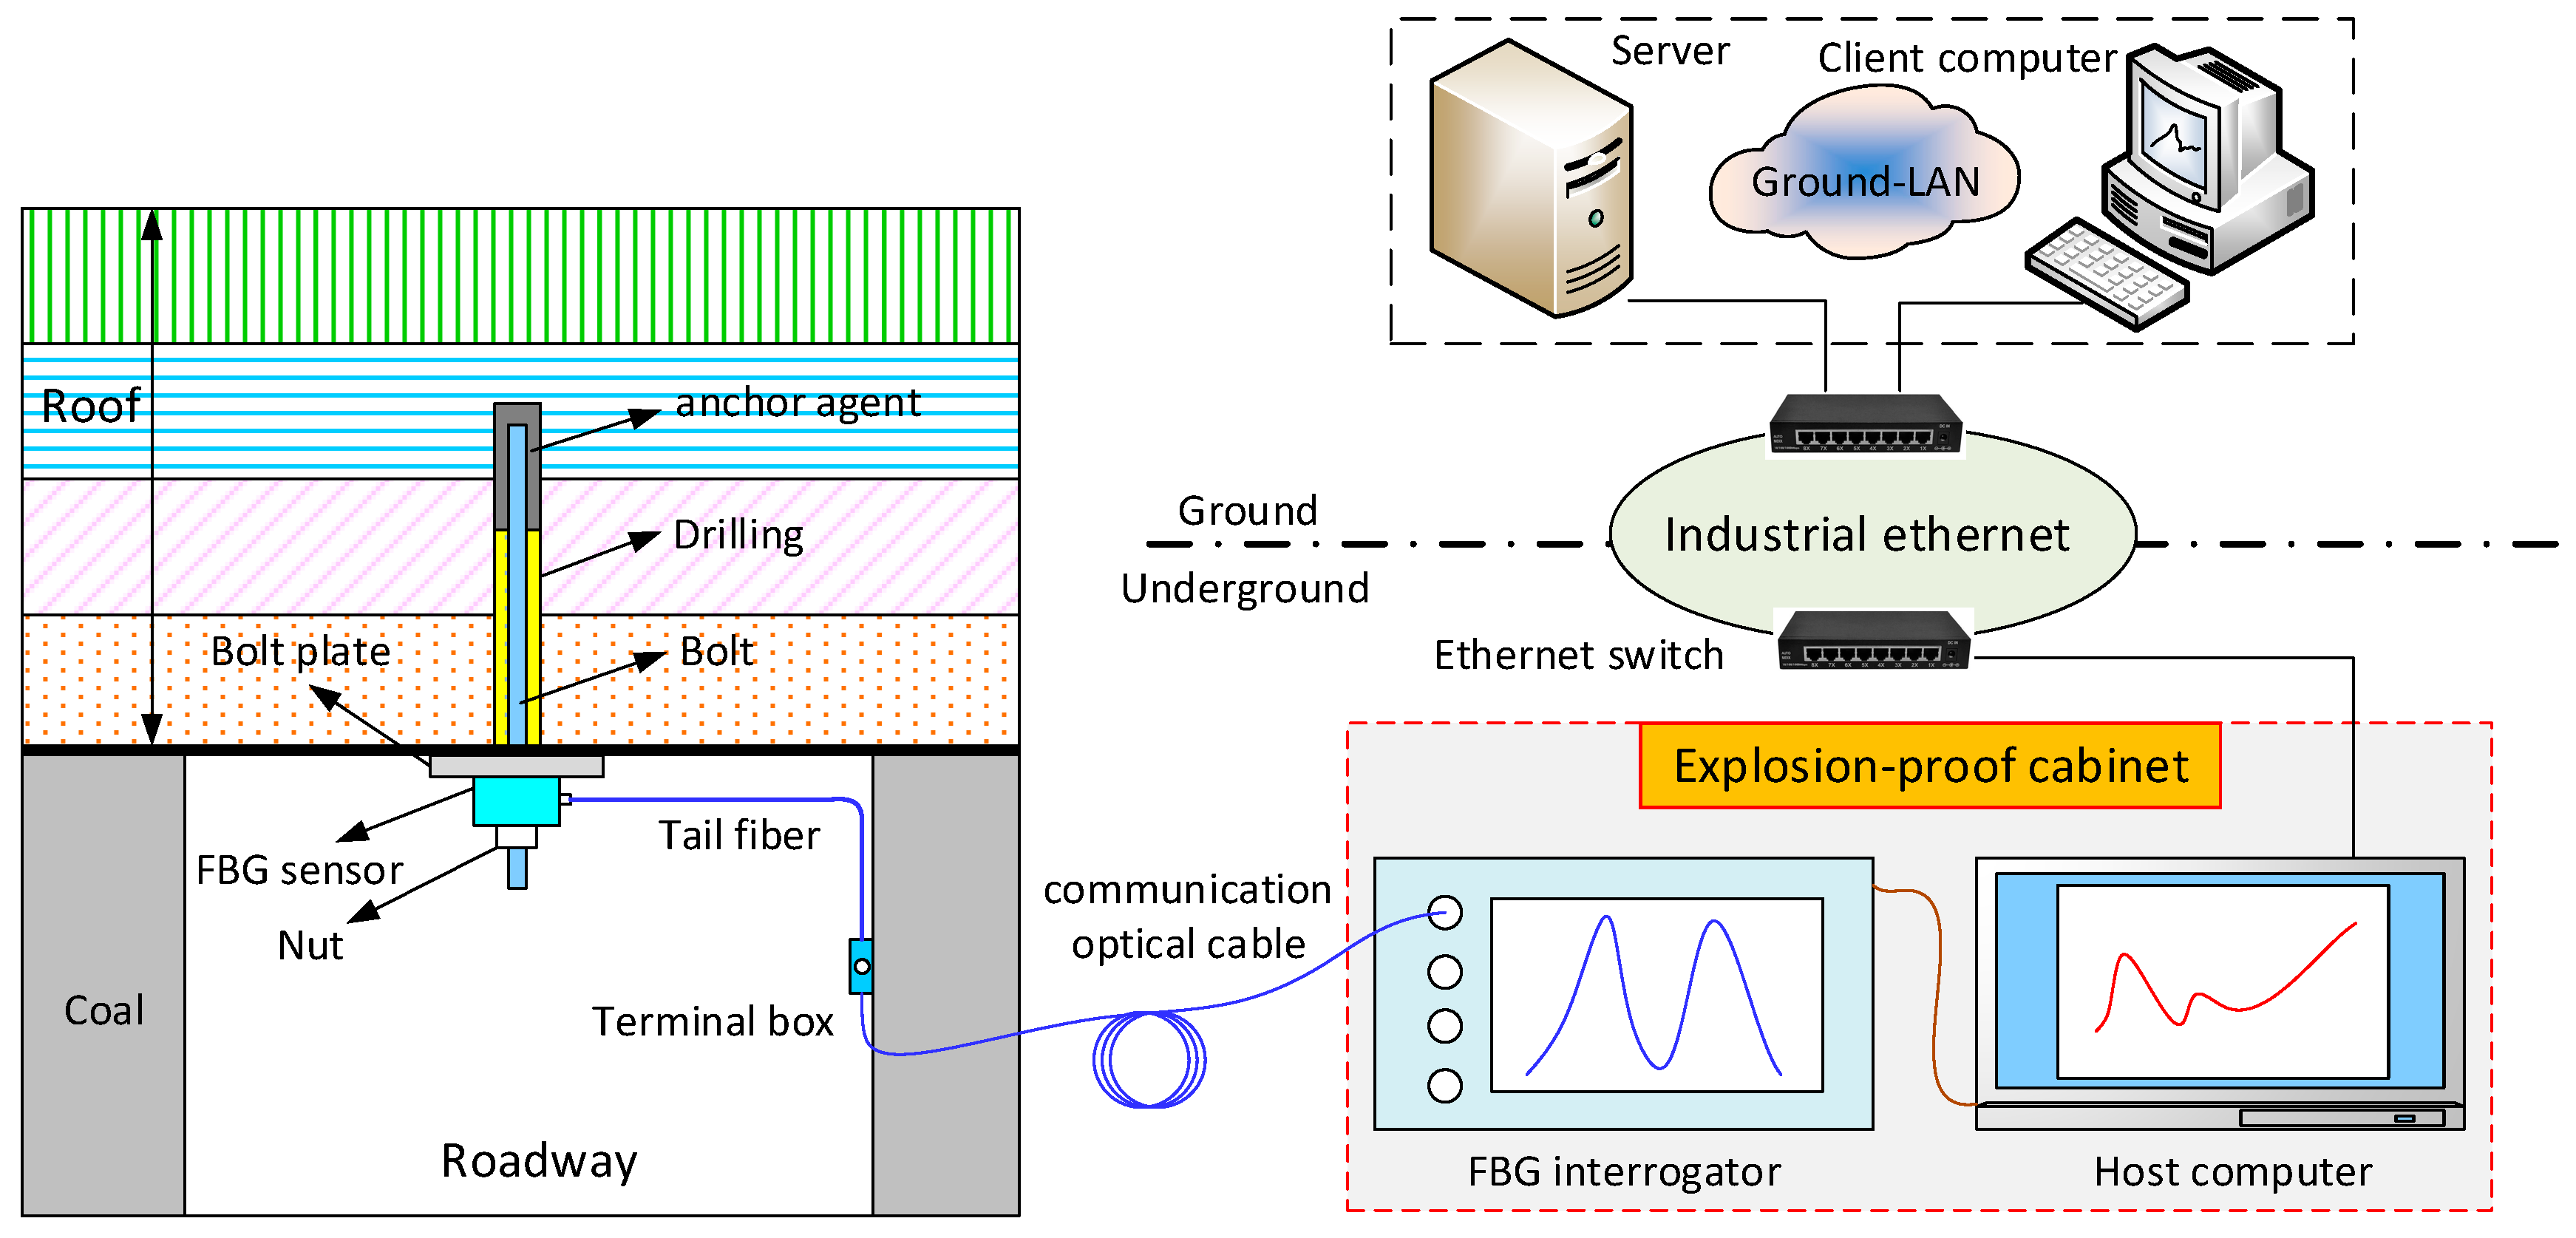
4.2. Arrangement of Roadway Bolt Support and Monitoring System

The roadway bolt support and monitoring system in the coal mine is shown in Figure 8. A Φ32 mm hole was drilled in the roadway surrounding rock during the bolt support. The anchor agent and the bolt were successively placed in the hole. The tail end of the bolt was bonded to the surrounding rock with the anchor agent. A bolt plate, a sensor, and a nut were successively installed at the outer end of the bolt. A torque force was applied to the nut so that the bolt generated a pretightening force to form active support effect on the surrounding rock. When the surrounding rock was deformed, the action force between the bolt plate and the surrounding rock and the force status of the bolt were changed accordingly. The force value of the bolt could be monitored online in real time and measured on site with the FBG bolt force sensor.
The tail fiber of the sensor was flanged to the communication optical cable in the junction box. The other end of the communication optical cable was connected to the channel port of the FBG interrogator. The FBG interrogator was connected to the upper computer using an RJ45 network interface to monitor and display the sensor reflected center wavelength. The acquired data was stored into the server database via Ethernet. A client PC implemented remote visual display and real-time monitoring of bolts force status in roadway by accessing the server.

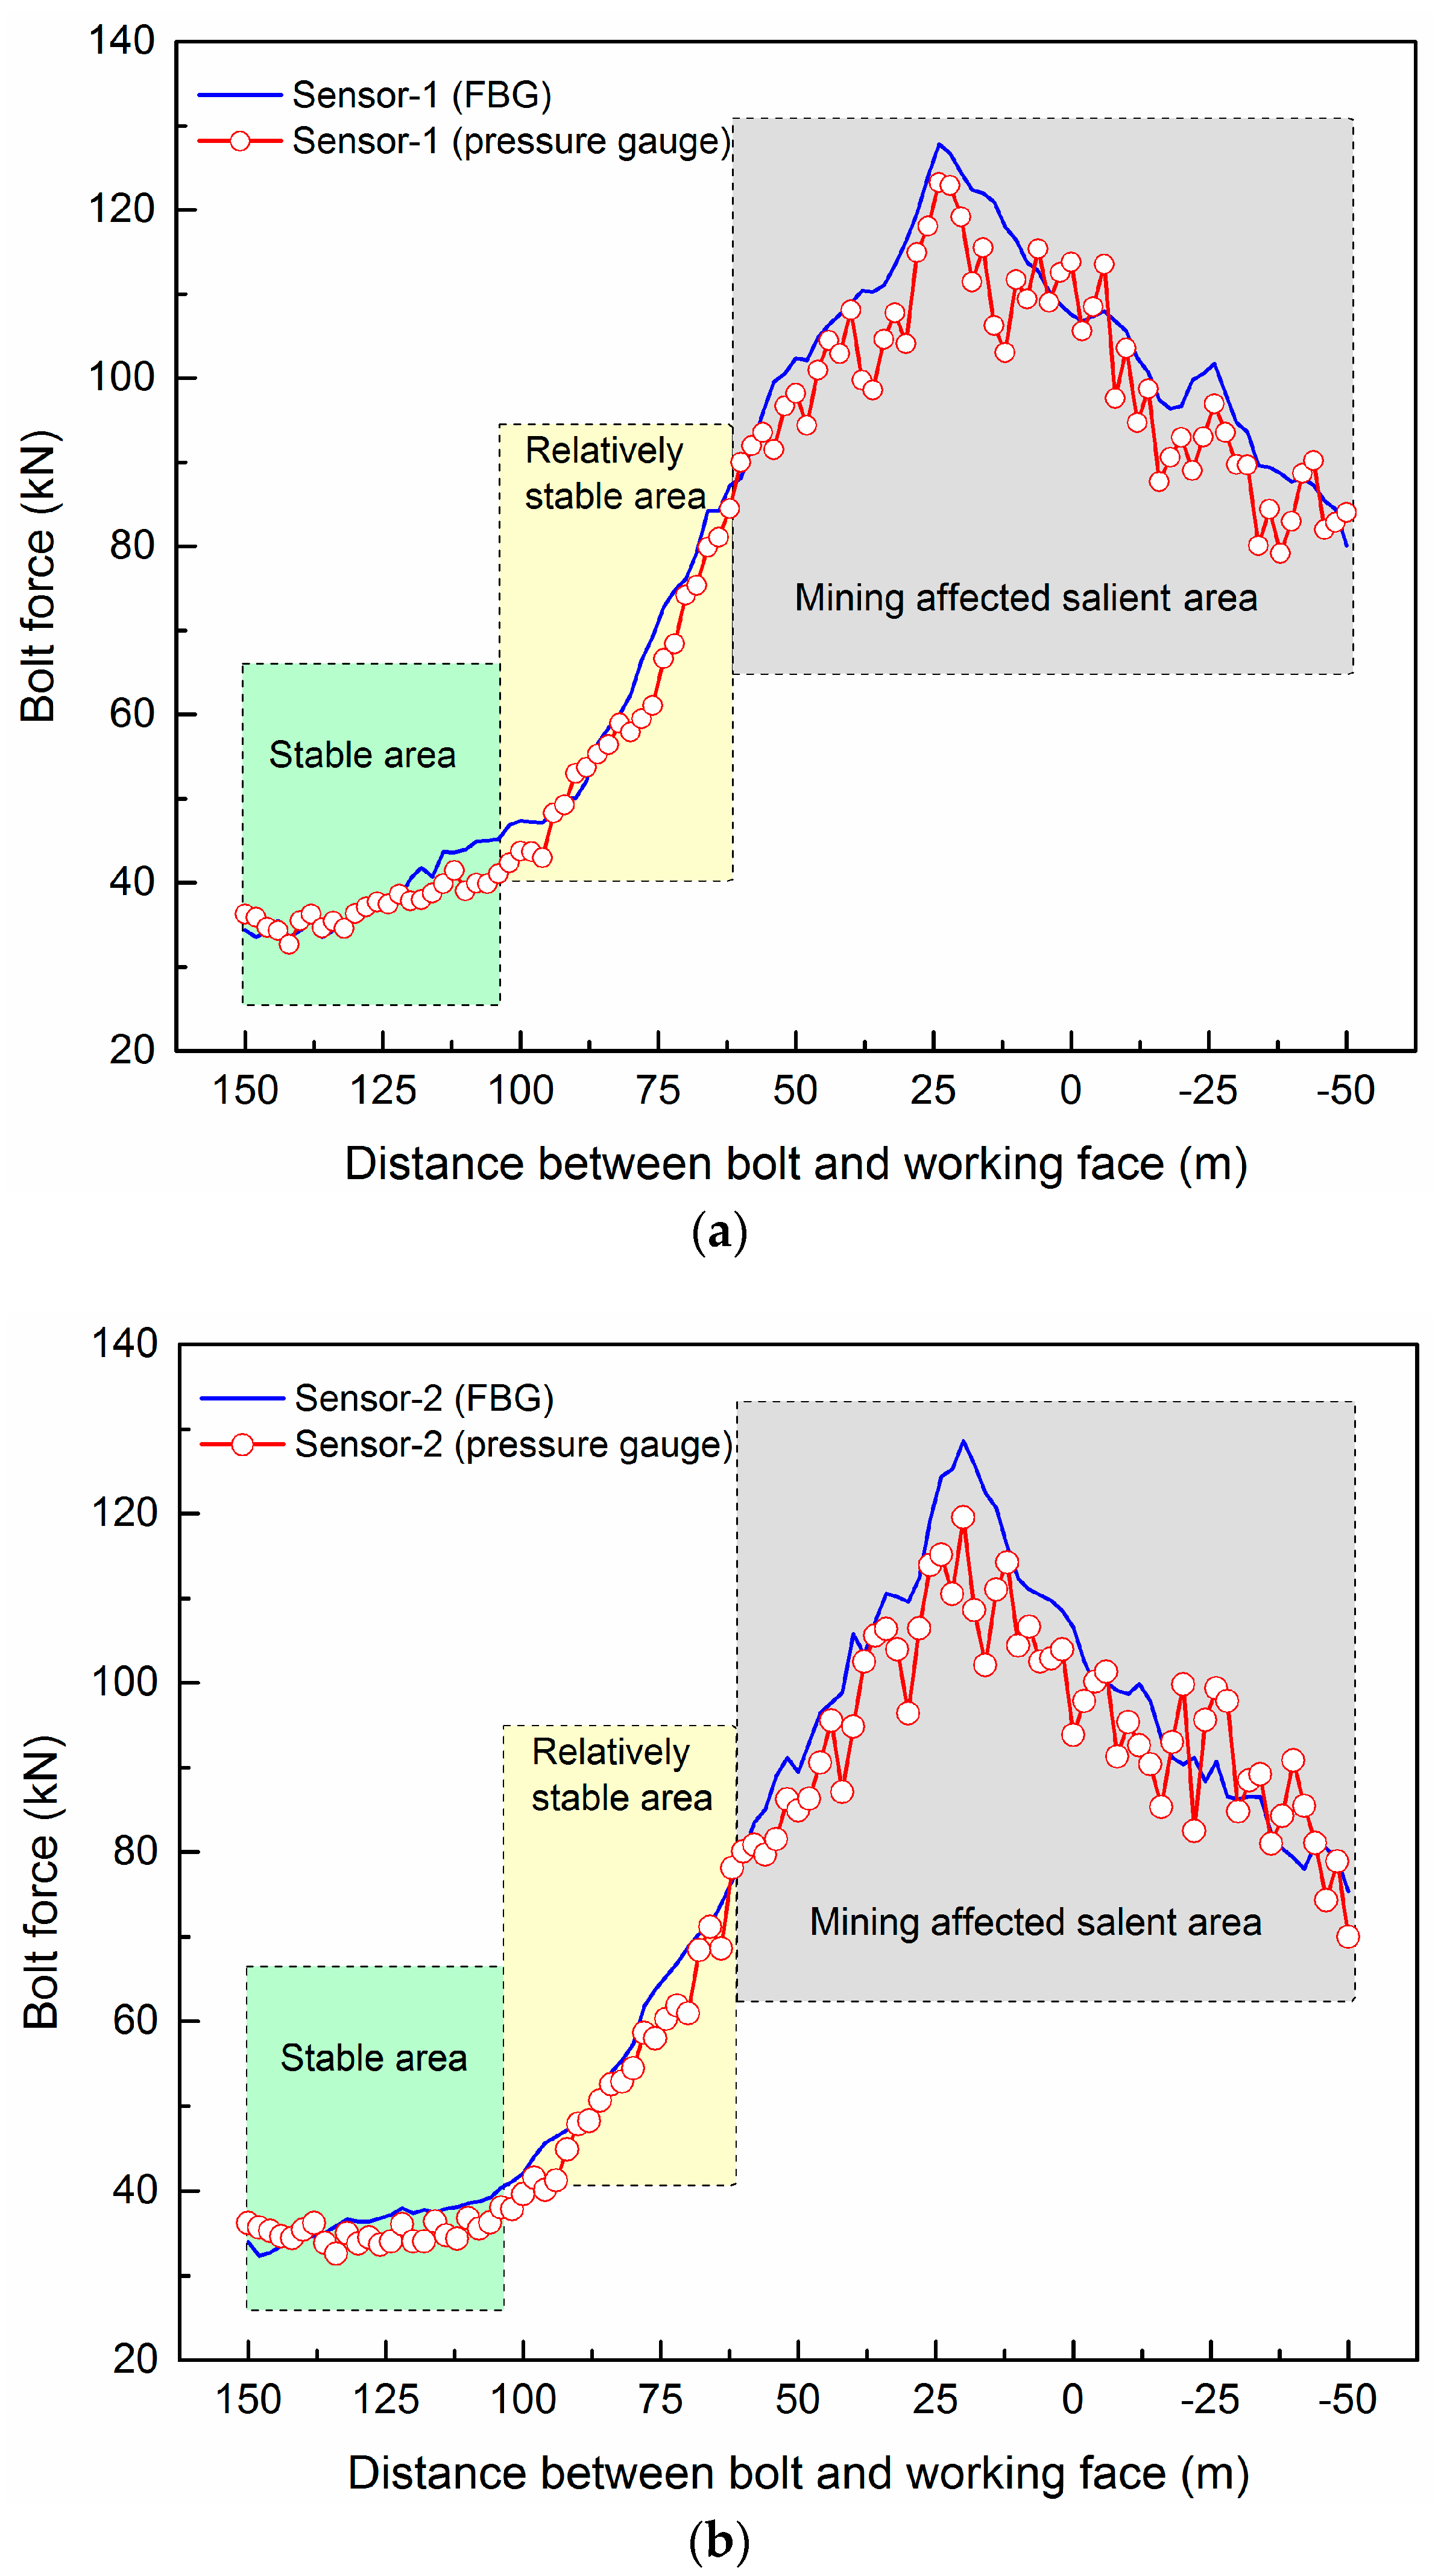
4.3. Analysis of Monitoring Results

One hundred days of continuous monitoring was conducted at the selected observation station. The working face advanced 200 m during this period, i.e., an average of about 2 m a day. The temperature in the installation place of the sensor was basically constant, so the effect of temperature on the sensor could be omitted and it was approximately supposed that the FBG wavelength shift was caused by only the force change of the bolt. Figure 9 shows the curve of the BFSM results versus the working face distance (first advance is positive and lagging advance is negative). The FBG bolt force sensor can clearly monitor the dynamic force status of the bolt in the roadway. The feasibility of FBG monitoring can be verified by the observation data on the pressure gauge.
It can be seen from the monitoring results of Figure 9 that the bolt force at the monitoring observation station shows a change rule of being stable first, gradually increasing to a peak, and then decreasing. The monitoring results obtained by two methods, namely, the FBG sensor method and the pressure gauge method, are very different but have the same change trend. In the range of 105~150 m from the front of the working face, the bolt force is basically stable, the monitoring value is the initial pretightening force of the bolt of about 37 kN, and the FBG sensor is much more sensitive than the pressure gauge. With the advancement of the working face, the change curve between the bolt force and the relative working face distance is more obvious. The bolt force is gradually increased in the range of 60~105 m from the working face. The bolt force is changed greatly in the range of −50~60 m from the working face, because the roadway in this area is drastically affected by mining in the working face and the roof pressure is changed abruptly. The axial force of the bolt reaches its maximum of 128 kN at the point about 25 m from the front of the working face. Therefore, reinforcing measures shall be taken in the range of 60 m in front of the working face to reduce the roadway roof subsidence and prevent roof accidents.
The reasons for the difference in monitoring results obtained by the FBG sensor and the pressure gauge are mainly as follows: The FBG sensor has a stronger immunity to interference, while the pressure gauge is more easily affected by the downhole humidity, temperature, and electromagnetism. The measuring results of the pressure gauge are very volatile, while the FBG sensor are more smooth and reliable. Therefore, monitoring by the FBG sensor has the advantages of continuity, and the measuring results can be used to accurately evaluate roadway roof stability and reduce the risk of roof accidents. In addition, the FBG sensing technology can provide automatic data collection and efficient transmission, effectively avoiding arduous and frequent downhole manual observation and improving the timeliness of monitoring results and the miners′ safety. To sum up, monitoring any force change of bolts in roadways by the FBG technology can reflect the affected mining range and provide a reference basis for determining the working face forepoling range, evaluating the real-time support quality of bolts and taking stability measures.

5. Conclusions

An FBG bolt force sensor was designed, and its measuring principle and structure are introduced here. This sensor provides the online monitoring and direct reading functions. It uses a cantilever and a circular diaphragm as elastic elements—two FBGs as sensing elements. The center wavelength difference between the two FBGs is utilized as a measuring signal, thus improving measuring precision. The experimental results show that this sensor has good linearity with a sensitivity of 38.79 pm/kN and a correlation coefficient of 99.98% in the measuring range.
The presented FBG bolt force sensor has been utilized to monitor roadway bolt force in the Shaqu coal mine in Shanxi, China. The engineering applications indicate that the change law of the bolt force and the affected mining range monitored by the FBG sensor provides continuity and timeliness, and the monitoring results are of great significance in the parameter design of bolt support in roadways. Above all, such a sensor is also widely used in quasi-distributed measurement and the long-term online monitoring of bolt force in such fields as geotechnical engineering, tunnel engineering, and slope engineering.

Acknowledgments

This study was financially supported by the Fundamental Research Funds for the Central Universities (No. 2014ZDPY22).

Author Contributions

Minfu Liang and Xinqiu Fang conceived and designed the experiments; Minfu Liang performed the experiments and analyzed the data; Minfu Liang and Xinqiu Fang wrote the paper.

Conflicts of Interest

The authors declare no conflict of interest.

References

  1. Zhao, Y.; Zhang, N.; Si, G. A fiber Bragg grating-based monitoring system for roof safety control in underground coal mining. Sensors 2016, 16, 1759. [Google Scholar] [CrossRef] [PubMed]
  2. Zhao, Y.; Li, Z.Q.; Dong, Y. Design and experiments on a wide range fiber Bragg grating sensor for health monitoring of coal mines. Optik 2014, 125, 6287–6290. [Google Scholar] [CrossRef]
  3. Kang, H.P.; Wang, J.H.; Lin, J. Case studies of rock bolting in coal mine roadways. Chin. J. Rock Mech. Eng. 2010, 29, 649–664. [Google Scholar]
  4. Lee, B. Review of the present status of optical fiber sensors. Opt. Fiber Technol. 2003, 9, 57–59. [Google Scholar] [CrossRef]
  5. Kersey, A.D.; Davis, M.A.; Patrick, H.J.; Leblanc, M.; Koo, K.P. Fiber grating sensors. J. Lightwave Technol. 1997, 15, 1442–1463. [Google Scholar] [CrossRef]
  6. Allwood, G.; Wild, G.; Lubansky, A.; Hinckley, S. A highly sensitive fiber Bragg grating diaphragm pressure transducer. Opt. Fiber Technol. 2015, 25, 25–32. [Google Scholar] [CrossRef]
  7. Pei, H.F.; Teng, J.; Yin, J.H.; Chen, R. A review of previous studies on the application of optical fiber sensor in geotechnical health monitoring. Measurement 2014, 58, 207–214. [Google Scholar] [CrossRef]
  8. Ho, Y.T.; Huang, A.B.; Lee, J.T. Development of a fibre Bragg grating sensored ground movement monitoring system. Meas. Sci. Technol. 2006, 17, 1733–1740. [Google Scholar] [CrossRef]
  9. Zhang, Q.; Wang, Y.; Sun, Y.; Gao, L.; Zhang, Z.; Zhang, W.; Zhao, P.; Yue, Y. Using custom fiber Bragg grating-based sensors to monitor artificial landslides. Sensors 2016, 16, 1417. [Google Scholar] [CrossRef] [PubMed]
  10. Torres, B.; Payá-Zaforteza, I.; Calderón, P.A.; Adam, J.M. Analysis of the strain transfer in a new FBG sensor for structural health monitoring. Eng. Struct. 2011, 33, 539–548. [Google Scholar] [CrossRef]
  11. Huang, M.; Zhou, Z.; Huang, Y.; Ou, J. A distributed self-sensing FRP anchor rod with built-in optical fiber sensor. Measurement 2013, 46, 1363–1370. [Google Scholar] [CrossRef]
  12. Wang, C.; Cheng, L. Use of fiber Bragg grating sensors for monitoring concrete structures with prestressed near-surface mounted carbon fiber-reinforced polymer strips. J. Intell. Mater. Syst. Struct. 2014, 25, 164–173. [Google Scholar] [CrossRef]
  13. Hu, D.; Guo, Y.; Chen, X.; Zhang, C. Cable force health monitoring of Tongwamen bridge based on fiber Bragg grating. Appl. Sci. 2017, 7, 384. [Google Scholar] [CrossRef]
  14. Waele, W.D.; Moerman, W.; Taerwe, L.; Degrieck, J.; Himpe, J. Measuring ground anchor forces of a quay wall with Bragg sensors. J. Struct. Eng. 2005, 131, 322–328. [Google Scholar]
  15. Huang, J.; Zhou, Z.; Zhang, D.; Tao, J.; Li, L.; Deng, X. Design and application of a fiber Bragg grating tension sensor for anchor rope. Adv. Mech. Eng. 2013, 995–1001. [Google Scholar] [CrossRef]
  16. Ye, X.W.; Ni, Y.Q.; Yin, J.H. Safety monitoring of railway tunnel construction using FBG sensing technology. Adv. Struct. Eng. 2013, 16, 1401–1409. [Google Scholar] [CrossRef]
  17. Lin, C.; Liu, Q.; Gao, W.; Xiao, C.X. Application of fiber optical sensing technology to monitoring axial forces of anchor bolts. Rock Soil Mech. 2008, 29, 3161–3164. [Google Scholar]
  18. Chai, J.; Wei, S.M.; Chang, X.T.; Liu, J.X. Monitoring deformation and damage on rock structures with distributed fiber optical sensing. Int. J. Rock Mech. Min. Sci. 2004, 41, 298–303. [Google Scholar] [CrossRef]
  19. Wang, J.; Liu, T.; Song, G.; Xie, H.; Li, L.; Deng, X.; Gong, Z. Fiber Bragg grating (FBG) sensors used in coal mines. Photonic Sens. 2014, 4, 120–124. [Google Scholar] [CrossRef]
  20. Zhang, D.; Wang, J.C.; Zhang, P.S.; Shi, B. Internal strain monitoring for coal mining similarity model based on distributed fiber optical sensing. Measurement 2016, 97, 234–241. [Google Scholar] [CrossRef]
  21. Zhao, Q.; Zhang, Y.H.; Gao, Y.K.; Ji, Y.C.; Huang, Z.A. Mechanism research and application on distributed optical fibre temperature measurement in coalmine goaf area based on the sensor network. Int. J. Sens. Netw. 2016, 20, 104–110. [Google Scholar] [CrossRef]
  22. Tao, S.; Dong, X.; Lai, B. Temperature-insensitive fiber Bragg grating displacement sensor based on a thin-wall ring. Opt. Commun. 2016, 372, 44–48. [Google Scholar] [CrossRef]
  23. He, J.; Zhou, Z.; Ou, J. Simultaneous measurement of strain and temperature using a hybrid local and distributed optical fiber sensing system. Measurement 2014, 47, 698–706. [Google Scholar] [CrossRef]
  24. Zhang, W.; Li, F.; Liu, Y. FBG pressure sensor based on the double shell cylinder with temperature compensation. Measurement 2009, 42, 408–411. [Google Scholar] [CrossRef]
  25. Feng, Z.; Wang, Q.; Shida, K. Design and implementation of a self-validating pressure sensor. IEEE Sens. J. 2009, 9, 207–218. [Google Scholar] [CrossRef]
  26. Rodriguez-Cobo, L.; Cobo, A.; Lopez-Higuera, J.M. Embedded compaction pressure sensor based on fiber Bragg gratings. Measurement 2015, 68, 257–261. [Google Scholar] [CrossRef]
  27. Zhao, Y.; Liao, Y.; Lai, S. Simulaneous measurement of down-hole high pressure and temperature with a bulk-modulus and FBG sensor. IEEE Photonic Technol. Lett. 2002, 14, 1584–1586. [Google Scholar] [CrossRef]
  28. Liang, M.F.; Fang, X.Q.; Wu, G.; Xue, G.Z.; Li, H.W. A fiber Bragg grating pressure sensor with temperature compensation based on diaphragm-cantilever structure. Optik 2017, 145, 503–512. [Google Scholar] [CrossRef]
  29. Huang, J.; Zhou, Z.; Zhang, D.; Wei, Q. A fiber Bragg grating pressure sensor and its application to pipeline leakage detection. Adv. Mech. Eng. 2013, 2013, 1310–1313. [Google Scholar] [CrossRef]
Figure 1. Schematic diagram of an FBG bolt force sensor; (a) the overall structure of sensor; (b) a schematic diagram of the cylinder; (c) a schematic diagram of the FBG pressure sensor.
Applsci 08 00107 g001
Figure 2. Sensor performance test system.
Applsci 08 00107 g002
Figure 3. Wavelength changes of the two FBGs under different forces.
Applsci 08 00107 g003
Figure 4. The average of wavelength shift differences between the two FBGs versus force.
Applsci 08 00107 g004
Figure 5. Change in sensor pressure gauge values under different forces.
Applsci 08 00107 g005
Figure 6. Pressure values of the pressure gauge and the FBG sensor under different forces.
Applsci 08 00107 g006
Figure 7. Location of the No. 14301 working face of the Shaqu coal mine and the layout of the bolt force status monitoring (BFSM): (a) location of the Shaqu coal mine; (b) plan view of the No. 14301 working face; (c) arrangement locations of two sensors; (d) picture of sensor installation in the roadway.
Applsci 08 00107 g007
Figure 8. Arrangement of roadway bolt support and monitoring system in the coal mine.
Applsci 08 00107 g008
Figure 9. Monitoring results of roof bolt force in the No. 14301 track roadway: (a) monitoring results of Sensor-1; (b) monitoring results of Sensor-2.
Applsci 08 00107 g009
Table 1. The structural material parameters of the fiber Bragg grating (FBG) bolt force sensor.
SymbolQuantityValue
Router radius of cylinder54 mm
rinner radius of cylinder12 mm
R0radius of diaphragm6 mm
r0radius of dowel bar1 mm
tthickness of diaphragm0.5 mm
hthickness of cantilever beam1.2 mm
bfree end width of the cantilever beam2 mm
llength of cantilever beam7.5 mm
E1Young’s modulus of diaphragm1.93 × 105 MPa
E2Young’s modulus of cantilever beam1.91 × 105 MPa
μPoisson’s ratio of diaphragm0.31
ρdensity of diaphragm7.93 g/cm3
Peeffective photoelastic coefficient of the optical fiber0.22
λFBG1initial wavelength of FBG11530.859 nm
λFBG2initial wavelength of FBG21537.568 nm
λFBGequivalent wavelength of FBGs1530.859 nm

