Article

An Investigation of Oxide Coating Synthesized on an Aluminum Alloy by Plasma Electrolytic Oxidation in Molten Salt

by
Alexander Sobolev
,
Alexey Kossenko
,
Michael Zinigrad
and
Konstantin Borodianskiy
*
Zimin Advanced Materials Laboratory, Department of Chemical Engineering, Biotechnology and Materials, Ariel University, Ariel 40700, Israel
*
Author to whom correspondence should be addressed.
Appl. Sci. 2017, 7(9), 889; https://doi.org/10.3390/app7090889
Submission received: 9 August 2017 / Revised: 22 August 2017 / Accepted: 28 August 2017 / Published: 30 August 2017
(This article belongs to the Section Materials Science and Engineering)

Abstract

:
Plasma electrolytic oxidation (PEO) is a surface treatment process for obtaining oxide coatings with a high performance on valve metals. PEO is mostly performed in an aqueous solution electrolyte that limits the size of treated parts due to the fact that the system is heated. Therefore, the coating of large surfaces cannot be synthesized in an aqueous electrolyte. In the current work, an alternative approach of PEO treatment, whereby an aluminum 1050 alloy in nitrate molten salt at a temperature of 280 °C is applied, was investigated. The microstructure, phase and chemical compositions, and micro-hardness were examined using X-ray diffraction (XRD), scanning electron microscopy (SEM), energy-dispersive X-ray spectroscopy (EDS), and micro-hardness tests. The obtained results show that formed coating contains from two sub-layers: one is the outer sub-layer of the α-Al2O3 phase and the second is its inner sub-layer. It was found that the formed coating was free of any contaminants originating from the electrolyte and had no cracks or pores, which are usually present in coatings formed by PEO treatment in an aqueous solution electrolyte.

Graphical Abstract

1. Introduction

In the last two decades, plasma electrolytic oxidation (PEO) became one of the most attractive surface treatment methods of advanced ceramic coating formation on metallic compounds [1,2,3,4,5]. This technological approach is usually applied in so-called valve metals as aluminum, magnesium, or titanium to obtain surface advanced properties such as high electrical insulation, corrosion and wear resistance, and excellent performance [6,7,8]. The combination of the obtained properties leads to their wide applications in medical, oil and gas, automotive, and aerospace industries.
The basic principle of the PEO technology is a high-voltage application between the specimen subjected to the treatment and the electrode, while the micro-arc discharge migration points appear on the its surface. These discharge points provide an additional impact to the thermal and plasmo-chemical effect, which causes the ceramic coating formation with a high adhesion to the metallic base [9,10,11].
The majority of research works describe the PEO process at frequencies of 50 Hz in different aqueous solutions [12]. Some of them show the process of in situ doping such as cerium or phosphate [13], tungsten [14], or even nanoplatelets [15]. Other works describe nanoformation on the coating surface, which affects its final properties [16,17]. The main disadvantages of the PEO treatment in aqueous solutions are a relatively low coating rate, a formation of a thick high porosity layer, a necessity of electrolyte cooling, and the presence of some undesirable compounds in the coating originating from the solution [18]. These issues can be solved by performing PEO treatment in an alternative electrolyte, such as molten salt.
In the current work, a ceramic coating formation achieved by PEO treatment in nitrate molten salt of the eutectic composition was investigated. The obtained morphology, chemical and phase composition, and performance are herein discussed. Moreover, different stages of the treatment and their comparison to the process in aqueous solution are also discussed.

2. Materials and Methods

Aluminum wrought alloy 1050 specimens (chemical composition shown in Table 1) with a surface area of 0.16–0.17 dm2 were ground using abrasive papers grits #280, #400, #600, #1000, #2400, and #4000 and then subjected to ultrasonic cleaning in acetone. The surface roughness after polishing was Ra 3.
PEO treatment was performed at 280 °C in the electrolyte with a eutectic composition of NaNO3—KNO3 (Sigma-Aldrich, St. Louis, MO, USA) with the mass % of 45.7:54.3 respectively. The electrolyte was held in a nickel crucible (99.95% Ni), which served as a counter electrode. The surface ratio of anode-to-cathode was 1:30, the anodic current density was 70 mA/cm2, and the voltage was limited by the galvanostatic mode. The applied power supply has the following parameters: Imax = 5 A, Umax = 900 V, current and voltage were pulsed with a square-wave sweep at a frequency of 50 Hz (ta = tk = 0.01 s) by a pulse generator Digit-EL PG-872 (Minsk, Belarus). The duration of the PEO treatment was 10 min, with a coating rate of 1 µm/min. Finally, the obtained specimens were rinsed with water and dried.
The current and the voltage wave profiles and trend plots, as well as the power consumed during the process, were measured using Fluke Scope Meter 199C (Eindhoven, The Netherlands) (200 MHz, 2.5 GS s−1), which was located into the electrical circuit between the power supply and the working container.
Photo images of the PEO treatment progress were made by the high-speed digital camera Nikon 1j5 (Tokyo, Japan) with a 1 Nikkor VR 10-110 lens (Tokyo, Japan) and a macro extension tube with a frame rate of 120 fps.
Cross sections were prepared by a standard method of metallography. Surface and cross-section morphologies of the obtained PEO coatings were examined by TESCAN MAIA3 scanning electron microscopy (SEM) (Brno, Czech Republic) equipped with an energy dispersive X-ray spectroscopy (EDS) system by Oxford instruments (Abingdon, UK) with an X-MaxN detector. The phase composition of the coatings were determined by a PANalytical Empyrean diffractometer (Almelo, The Netherlands) with Cu Kα radiation in grazing incidence mode using a scan with a grazing angle of 3°, with a step size of 0.03°, and at a 2Θ range from 10° to 90°.
A BuehlerMicromet 2100 (Lake Bluff, IL, USA) micro-hardness tester was used to evaluate micro-hardness on a cross section of the obtained oxide layer. The micro-hardness was determined according to ASTM E384, C1327, and B578 that’s standard names as the mean of eight measurements for each sublayer under a load of 10 g.

3. Results

Figure 1 shows the voltage and the current behavior as a function of treatment time.
Figure 2 illustrates different stages of oxide layer formation that corresponds to different stages on the voltage–time plot presented in Figure 1a. Figure 2a corresponds to Region 1; no discharges were revealed. Figure 2b corresponds to Region 2; microarc discharges start to appear. Figure 2c corresponds to Regions 3–4; the number of microarc discharges increases. Pits visible on the image are an accumulation of small bubbles that appear on the surface during PEO treatment. Black squares in the center of the specimens are the camera focusing locations, e.g., target.
Surface morphology of the sample subjected to PEO was investigated as well and the obtained images by SEM are presented in Figure 3.
It is evident from the presented micrographs that the surface morphology of the treated alloy contains round-shaped pores with a diameter in the range of 0.5–2.5 µm. This is well correlated with treatment obtained in aqueous solution and later compared in discussions of the current work.
The coating morphology of the PEO-treated specimen was investigated by SEM, and its elemental analysis, performed by EDS, is presented in Figure 4.
EDS was performed for qualitative analysis; however, quantification was performed as well and consequently followed by XRD investigation to evaluate coating phase composition. According to EDS investigations, the atomic composition of aluminum and oxygen are 36.7% and 63.3%, respectively. EDS results also indicate that no additional compounds were incorporated into the coating, as it confirmed is usually present after treatment in aqueous solutions originating from the electrolyte.
The obtained semi-quantitative calculations by XRD show phase composition distribution of the coating. Results in Figure 5 indicate the presence of 55% of α-Al2O3 and 45% of γ-Al2O3.
Micro-hardness measurements were performed on the oxide coating, and the obtained results are illustrated in Table 2. Different values of the micro-hardness obtained due to the different layers’ compositions depend on the depth.
Figure 6 demonstrates a cross-section micrograph of the obtained coating after PEO treatment and its EDS line scan elemental analysis.
It is evident from the micrograph that the thickness of the porous outer layer is about 4 µm and the thickness of the inner dense layer is about 3.5 µm. According to the linear dependence of the oxygen (O) and aluminum (Al) scans, the oxide layer of the Al2O3 composition is indicated as previously confirmed by XRD analysis.

4. Discussion

When a positive voltage is applied to a sample immersed in the electrolyte, redistribution of the charge begins. Negatively charged ions of electrolyte migrate to the metal′s surface by the influence of the external electric field, resulting in the formation of the adsorbed ions on the surface of the anode and leading to the distribution of the voltage drop across the electrolytic cell. As shown in Figure 2a,b, a typical anodizing process proceeds up to 30 V and causes the formation of a thin oxide layer that prevents further chemical reaction. At the same time, the negatively charged ions accumulate on the anode surface, forming a so-called quasi-cathode [19,20]. These ions simultaneously redistribute the voltage between electrodes in the electrolytic bath, leading to an increase in the electric field intensity between the anode and local quasi-cathode until a sufficient value for the ion diffusion process is reached through the barrier layer. This oxide layer affects the current magnitude, which decreases due to the added resistance of the formed layer.
While the coating thickness increases, the electrical resistance grows alongside the current reduction simultaneously, leading to the redistribution of potential between the electrodes. The increase in the voltage between the anode and quasi-cathode provides further appearance of the electrochemical process leads to the anodic growth of porous oxide layer by the mean of microarc discharge channels [21] as shown in Figure 2b,c. Finally, a high voltage leads to the heating and electrical breakdown of the barrier layer, resulting in a microarc discharge.
Evaluation of morphological changes showed that formed alloy subjected to PEO treatment has a round-shaped porosity with a diameter in the range of 0.5–2.5 µm. The morphology and the size distribution of pores are well correlated with the work by Butyagin et al. in aqueous solution electrolyte [22]. Micrographs shown in Figure 6 illustrate the porous structure of the outer layer, while the inner layer has no porosity at all. SEM images in Figure 4 and Figure 6 show the morphology of the obtained coating and are well correlated with the morphology usually obtained in the PEO process performed in aqueous solution electrolyte [23].
No cracks were found in the formed coating. We suggest that the low cooling rate is responsible for this. However, the coating produced in aqueous solution is usually formed from the oxide layer with cracks, which is attributed to the high cooling rate of the coating formation [24]. In addition, Hussein et al. described a temperature profile of the process in their work and found that the plasma temperature in discharges is around 10.000 K [25].
EDS analysis, line scan, and XRD investigations indicated that the coating is free of any contamination, which is, in contrast to the coating obtained in aqueous solution, where contamination originates from the electrolyte [26]. Typically, electrolytes for aluminum alloys in PEO treatment are made of alkali metal hydroxides and sodium silicate. Therefore, a formed crystalline aluminum oxide coating usually contains impurities of silicon in a form of oxide.
XRD results demonstrate the presence of α-Al2O3 and γ-Al2O3 phases in the obtained coating. The micro-hardness values of α-Al2O3 are higher than those of the γ-Al2O3 [27], so it is obvious that the outer layer consists of α-Al2O3, while the inner layer consists of γ-Al2O3. No other phases were detected, which provides further support for the above statement. These results are well correlated with the micro-hardness values given in Table 2 and in the presented images obtained by electron microscopy.

5. Conclusions

In the current work, a new approach to ceramic coating formation in PEO treatment in nitrate molten salt of the eutectic composition was investigated. Results and conclusions can be summarized as follows:
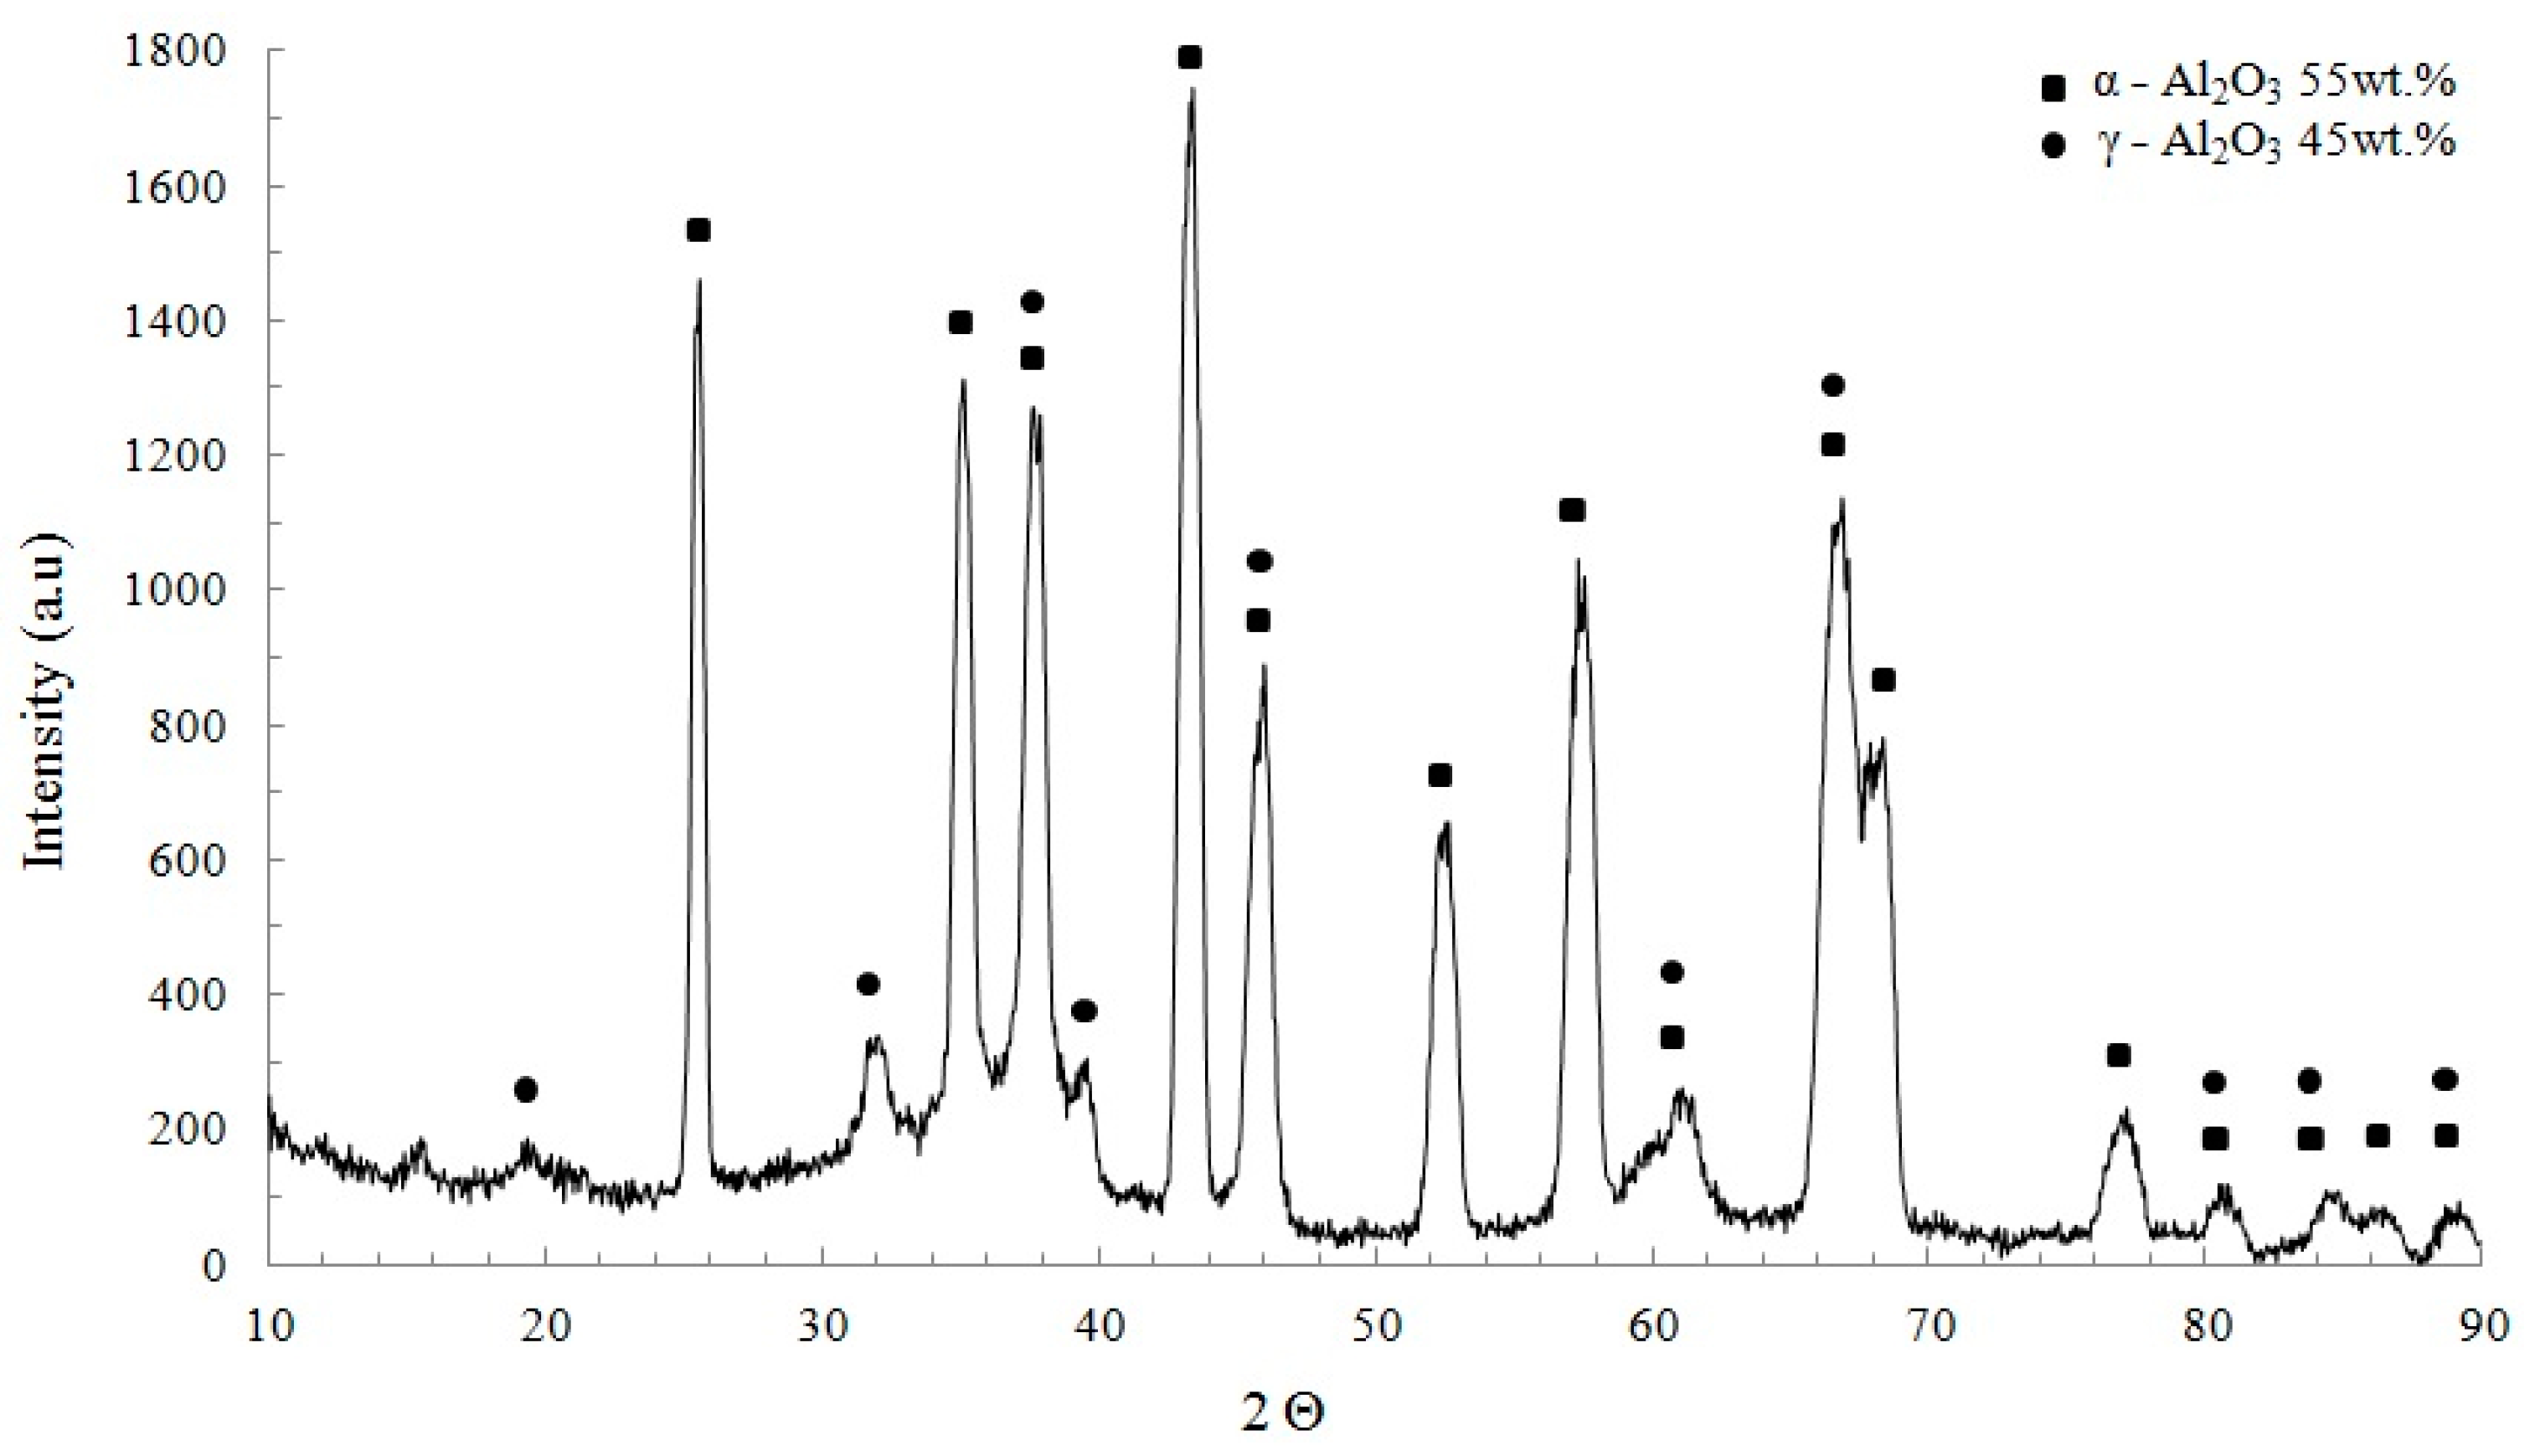
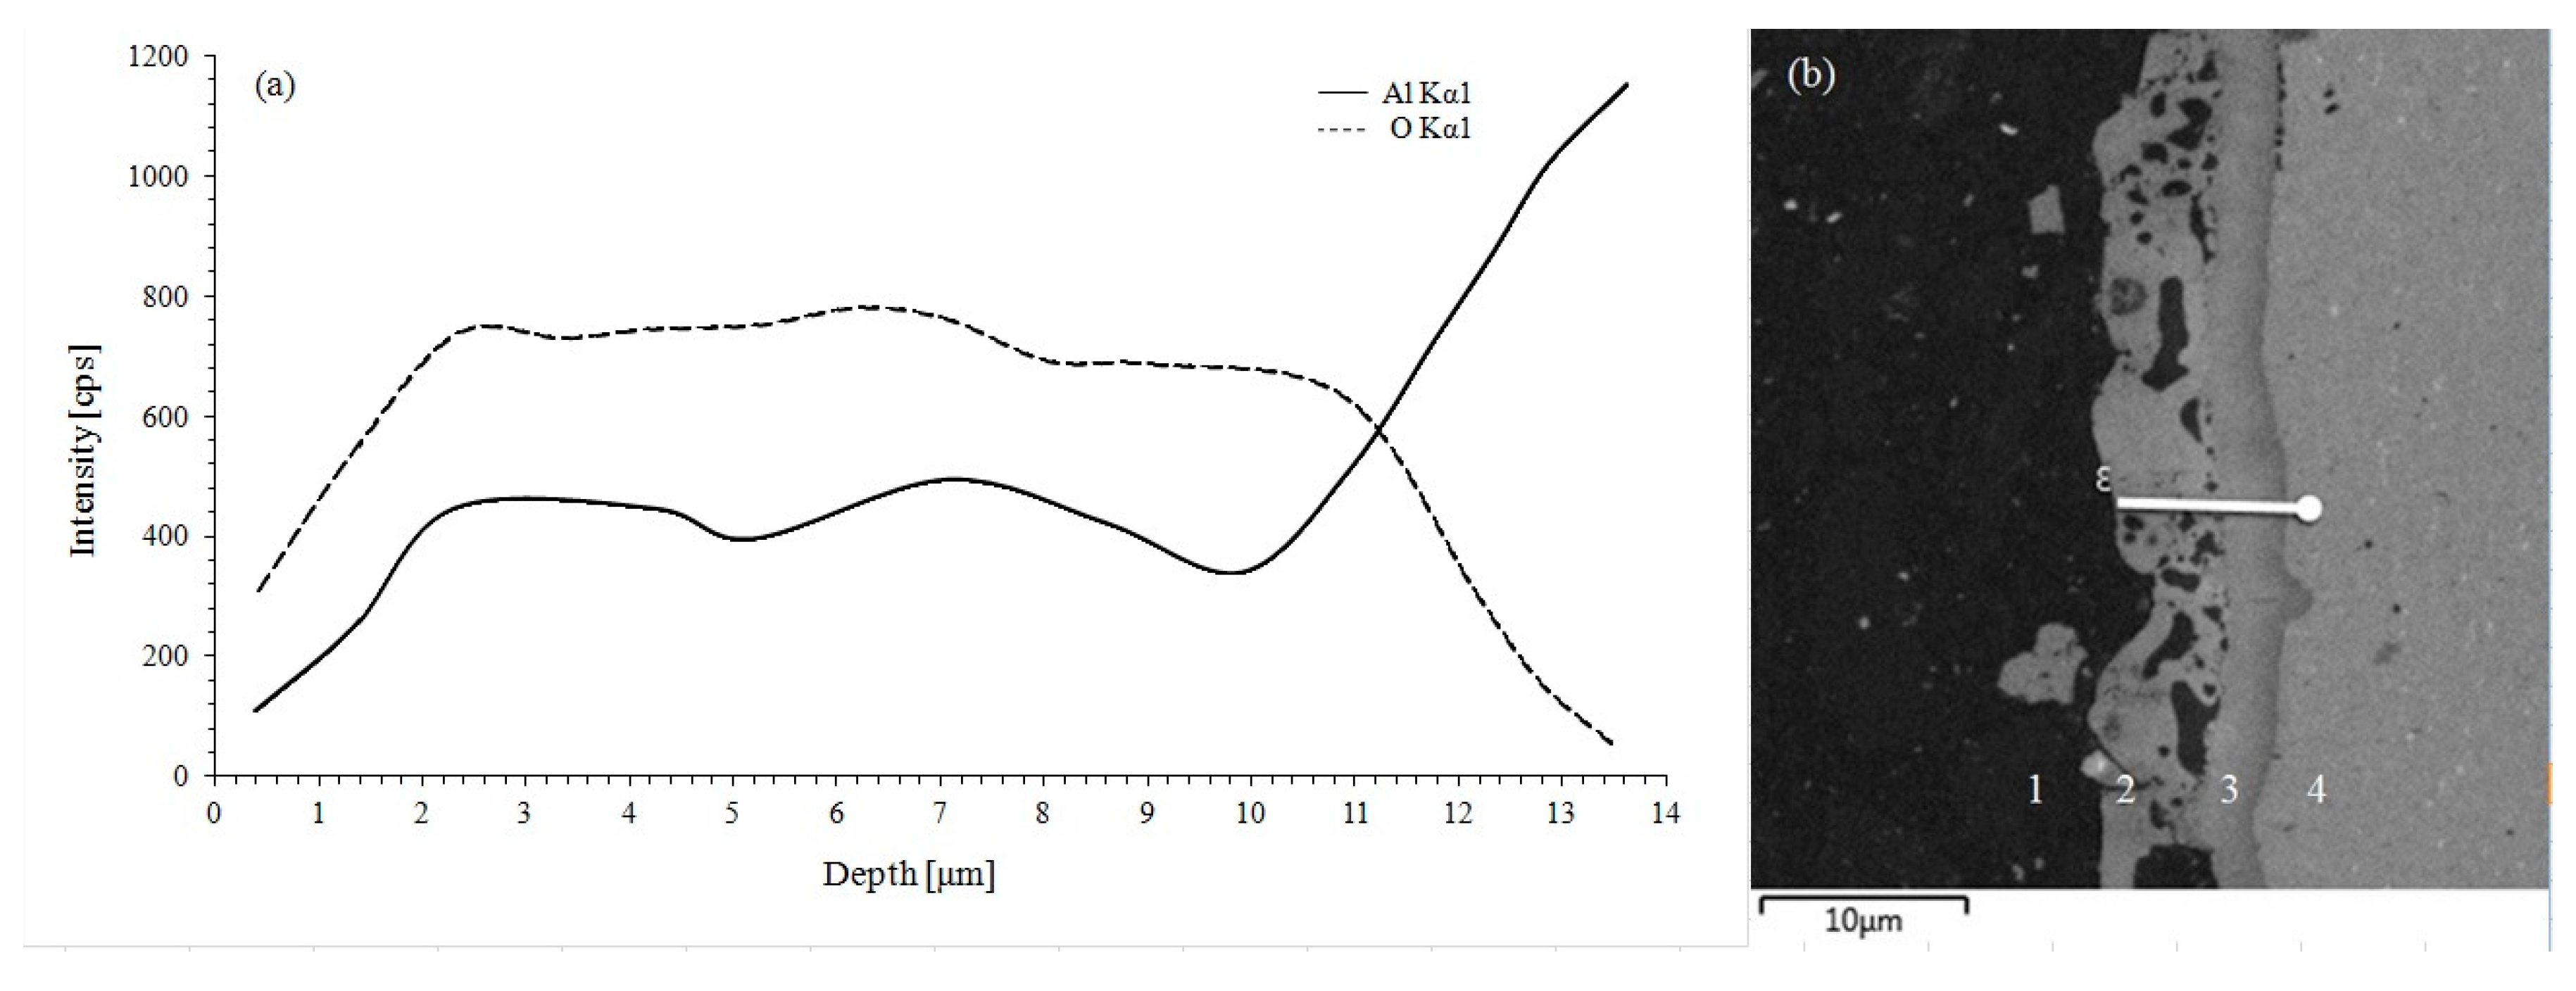
  • An aluminum 1050 alloy subjected to PEO treatment has an oxide coating contained from two sub-layers: one is the outer layer composed of α-Al2O3 and second is the inner layer composed of γ-Al2O3.
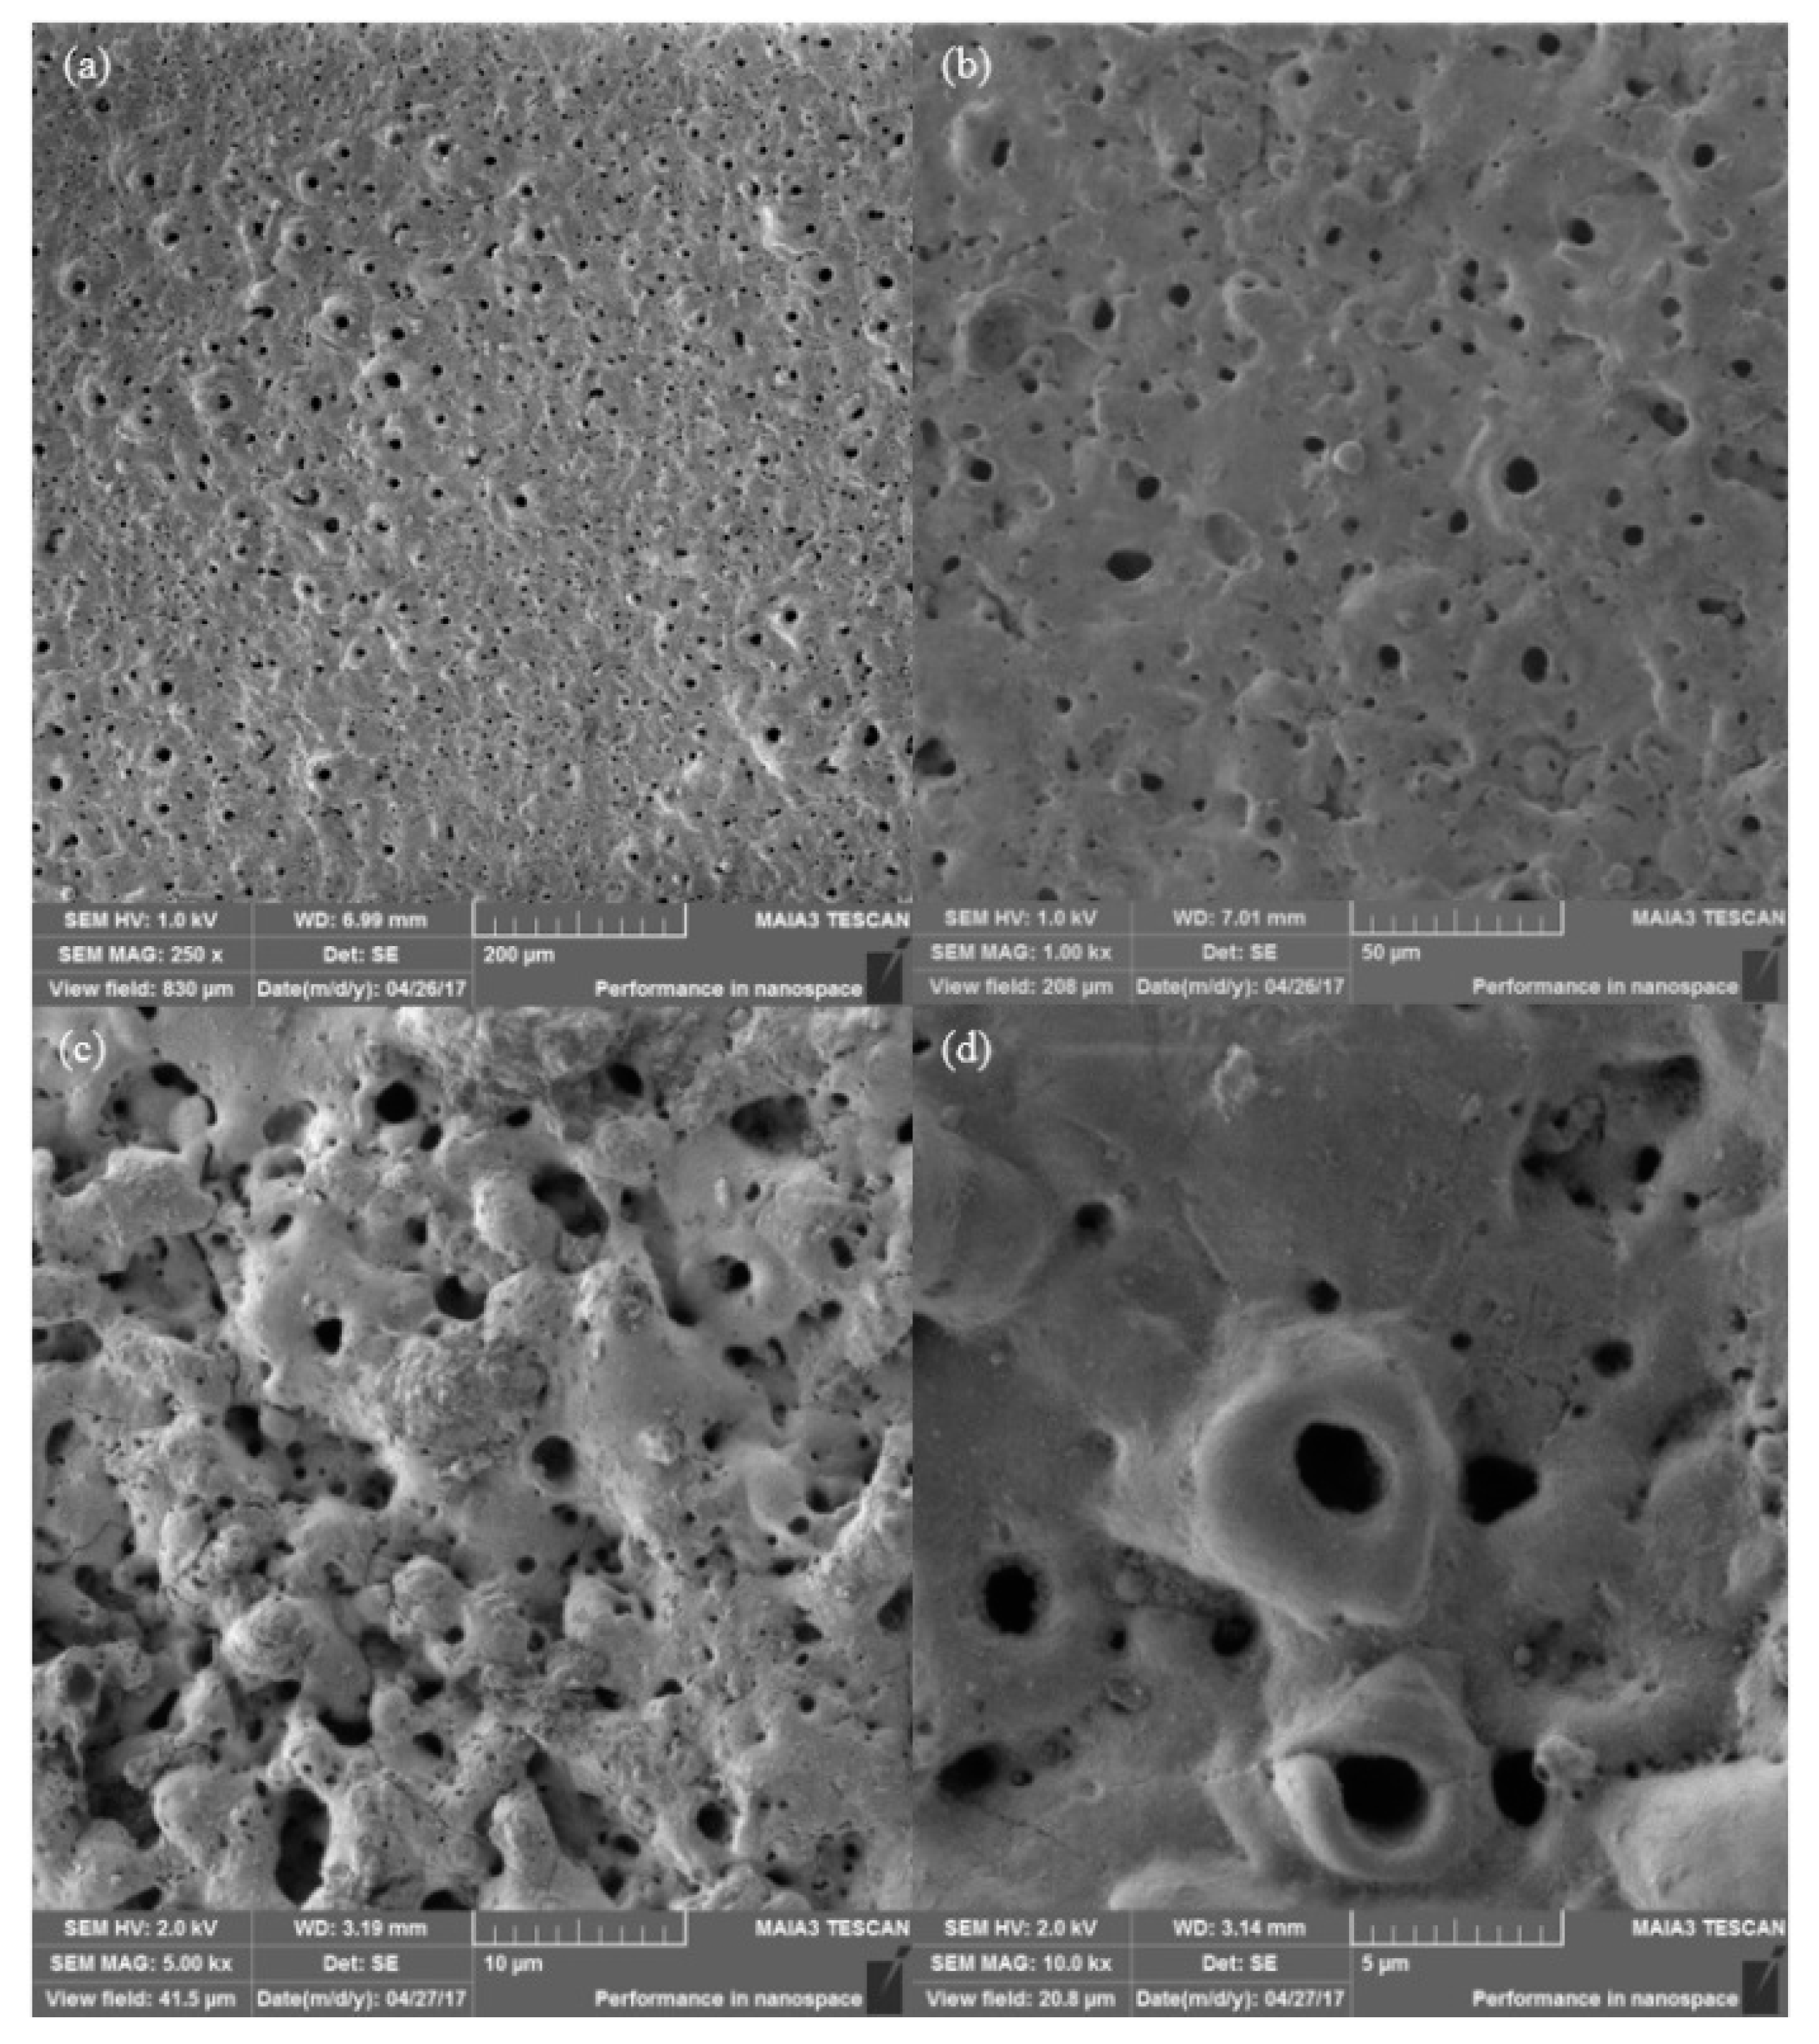
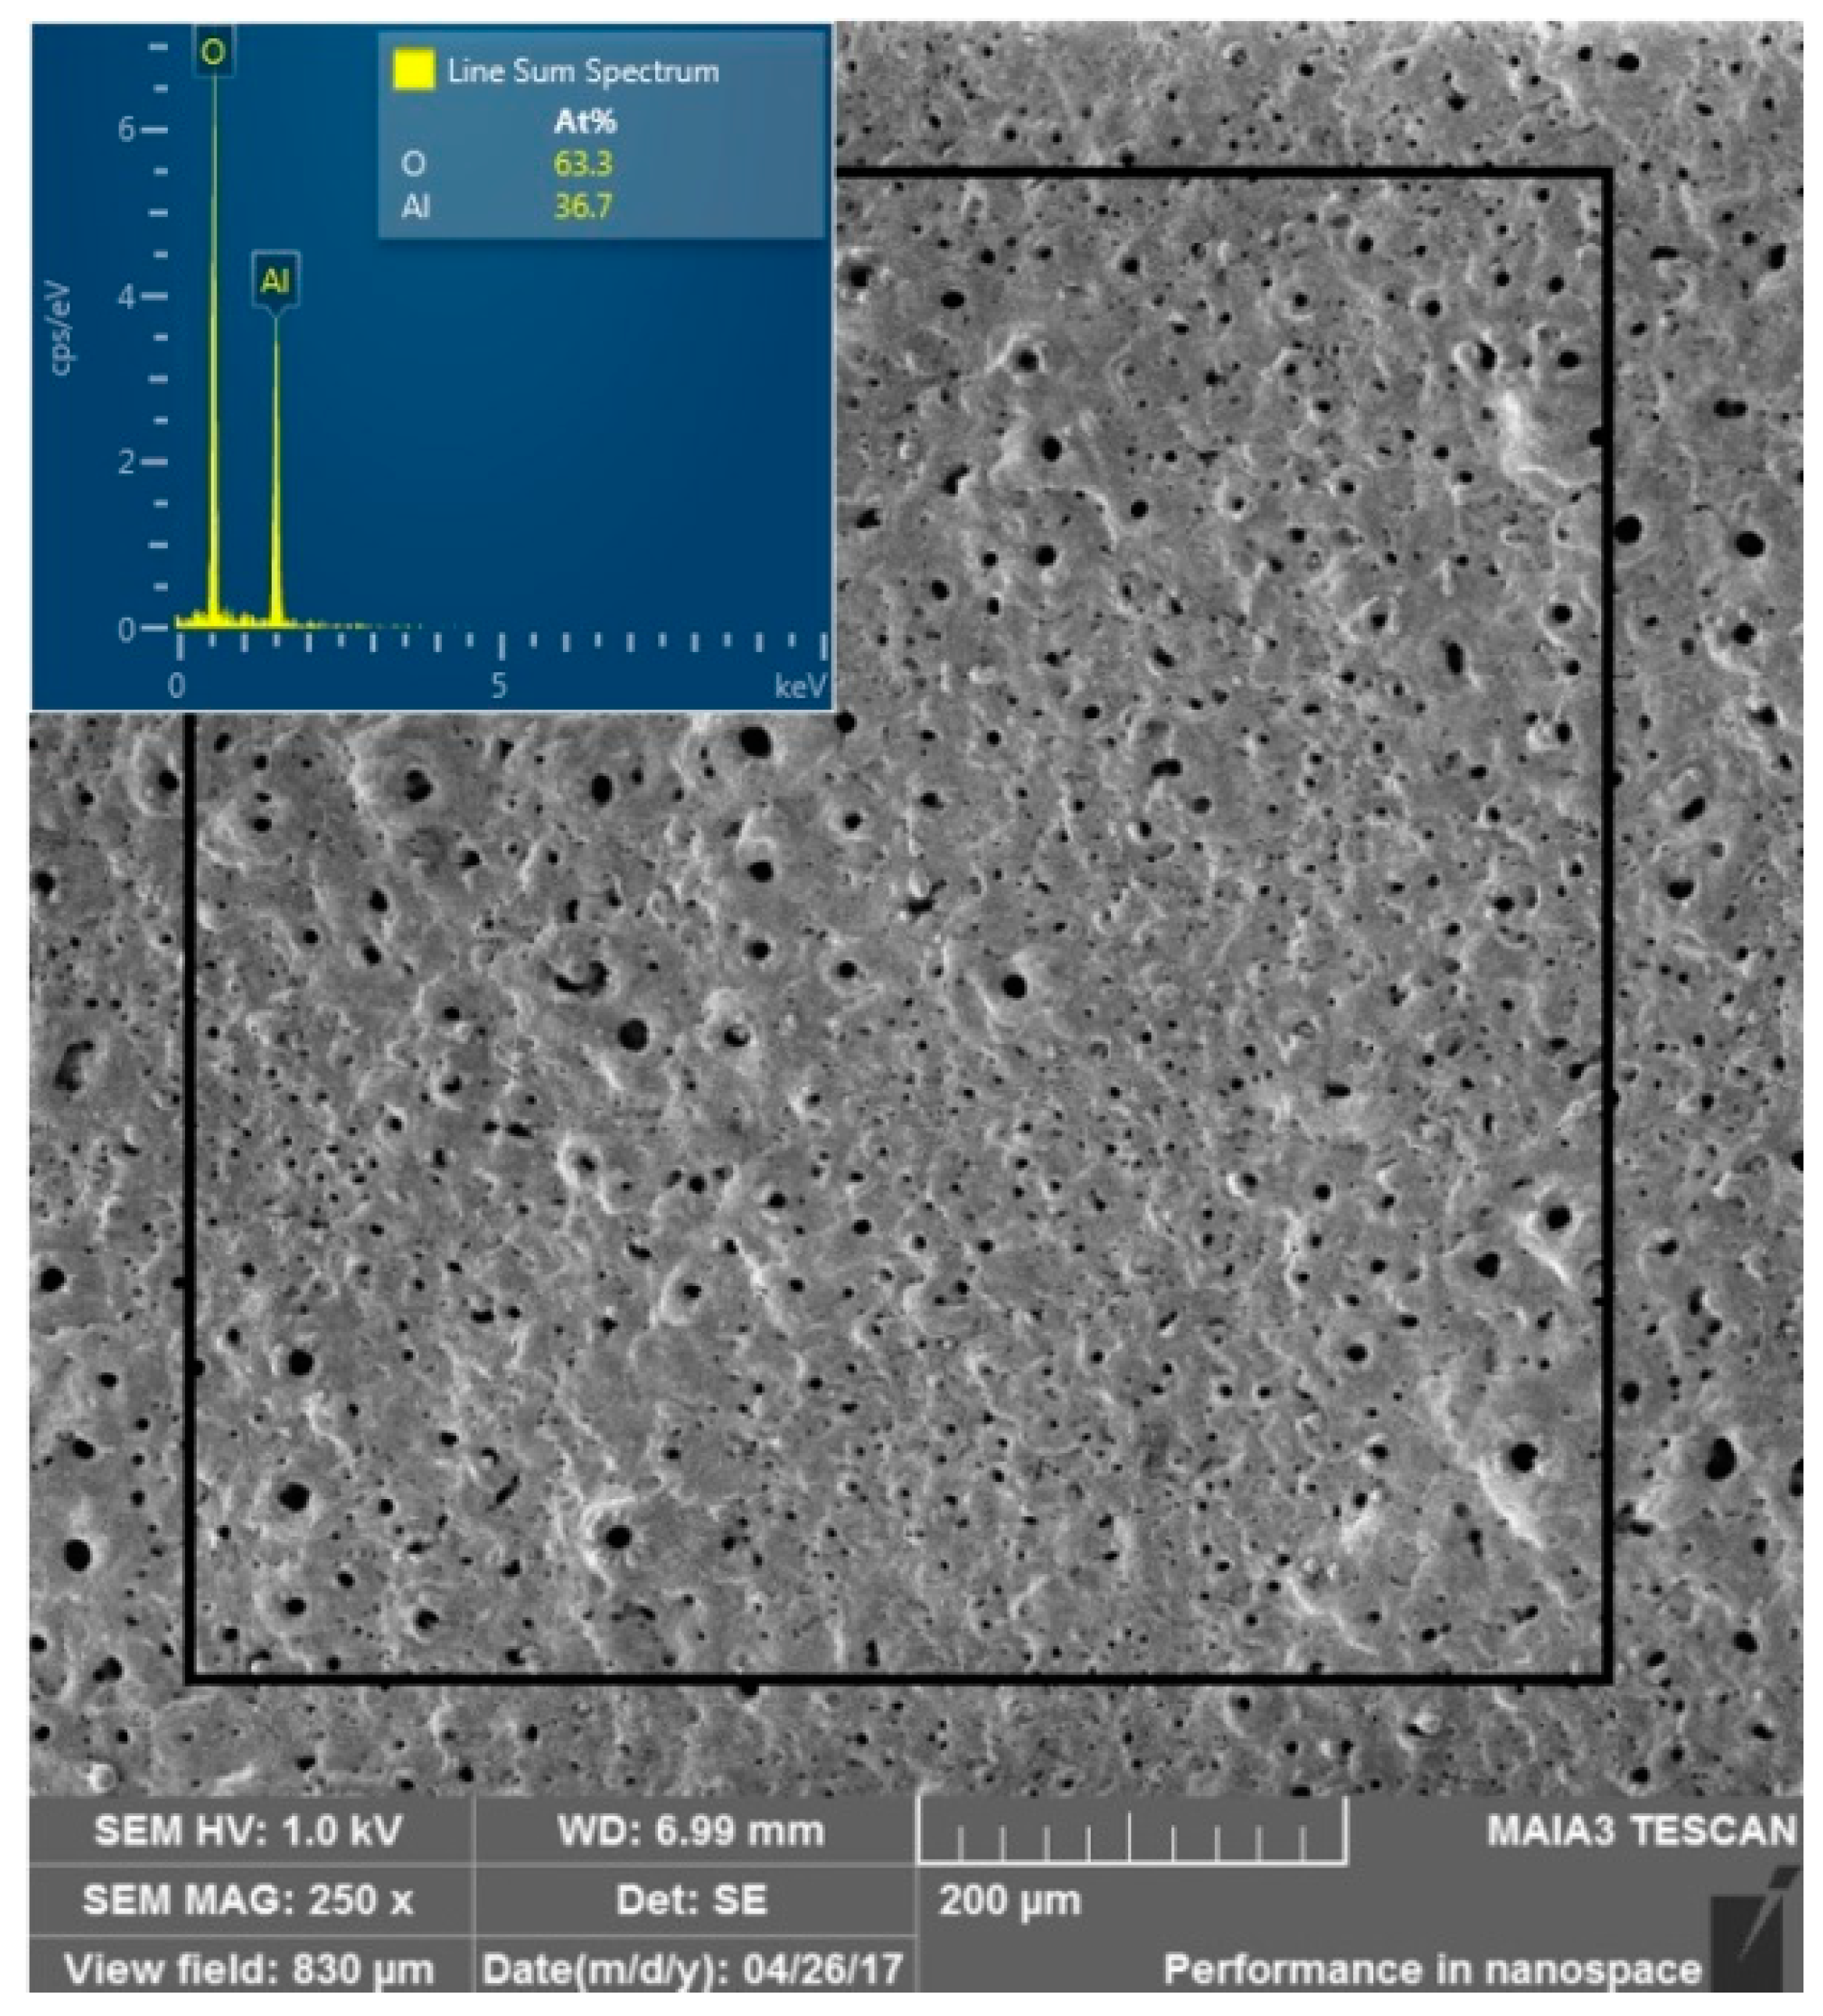
  • The formed coating has an oxide composition and is free of any contaminants originating from the electrolyte. Additionally, no porosity or cracks were found.
  • The approach described herein can be applied to the treatment of high surface area specimens in contrast to treatment in aqueous solutions where the electrolyte is significantly heated.

Acknowledgments

The authors would like to thank Ms. Natalia Litvak from Ariel University Electron Microscopy Unit, for her help with electron microscopy.

Author Contributions

Alexander Sobolev, Alexey Kossenko, Michael Zinigrad, and Konstantin Borodianskiy designed the experimental work. Alexander Sobolev and Alexey Kossenko performed PEO experiments. SEM, EDS, and micro-hardness investigations were performed by Alexander Sobolev. XRD investigations were performed by Alexey Kossenko. Alexander Sobolev, Michael Zinigrad, and Konstantin Borodianskiy analyzed the data. Alexander Sobolev and Konstantin Borodianskiy wrote the paper.

Conflicts of Interest

The authors declare no conflict of interest.

References

  1. Stojadinović, S.; Vasilić, R.; Petković, M.; Kasalica, B.; Belča, I.; Zekić, A.; Zeković, L. Characterization of the plasma electrolytic oxidation of titanium in sodium metasilicate. Appl. Surf. Sci. 2013, 265, 226–233. [Google Scholar] [CrossRef]
  2. Lu, X.; Blawert, C.; Kainer, K.U.; Zheludkevich, M.L. Investigation of the formation mechanisms of plasma electrolytic oxidation coatings on Mg alloy AM50 using particles. Electri. Acta 2016, 196, 680–691. [Google Scholar] [CrossRef]
  3. Dehnavi, V.; Liu, X.Y.; Luan, B.L.; Shoesmith, D.W.; Rohani, S. Phase transformation in plasma electrolytic oxidation coatings on 6061 aluminum alloy. Surf. Coat. Technol. 2014, 251, 106–114. [Google Scholar] [CrossRef]
  4. Rokosz, K.; Hryniewicz, T.; Matýsek, D.; Raaen, S.; Valíček, J.; Dudek, L.; Harničárová, M. SEM, EDS and XPS analysis of the coatings obtained on titanium after Plasma Electrolytic Oxidation in electrolytes containing copper nitrate. Materials 2016, 9, 318. [Google Scholar] [CrossRef] [PubMed]
  5. Yerokhin, A.L.; Nie, X.; Leyland, A.; Matthews, A. Characterization of oxide films produced by plasma electrolytic oxidation of a Ti–6Al–4V alloy. Surf. Coat. Technol. 2000, 130, 195–206. [Google Scholar] [CrossRef]
  6. Rama Krishna, L.; Sudha Purnima, A.; Sundararajan, G. A comparative study of tribological behavior of microarc oxidation and hard-anodized coatings. Wear 2006, 261, 1095–1101. [Google Scholar] [CrossRef]
  7. Yerokhin, A.L.; Leyland, A.; Matthews, A. Kinetic aspects of aluminium titanate layer formation on titanium alloys by plasma electrolytic oxidation. Appl. Surf. Sci. 2002, 200, 172–184. [Google Scholar] [CrossRef]
  8. Gnedenkov, S.V.; Khrisanfova, O.A.; Zavidnaya, A.G.; Sinebrukhov, S.L.; Gordienko, P.S.; Iwatsubo, S.; Matsui, A. Composition and adhesion of protective coatings on aluminum. Surf. Coat. Technol. 2001, 145, 146–151. [Google Scholar] [CrossRef]
  9. Chen, W.; Wang, Z.; Sun, L.; Lu, S. Research of growth mechanism of ceramic coatings fabricated by micro-arc oxidation on magnesium alloys at high current mode. J. Mag. Alloys 2015, 3, 253–257. [Google Scholar] [CrossRef]
  10. Mi, T.; Jiang, B.; Liu, Z.; Fan, L. Plasma formation mechanism of microarc oxidation. Electrochim. Acta 2014, 123, 369–377. [Google Scholar] [CrossRef]
  11. Yerokhin, A.L.; Nie, X.; Leyland, A.; Matthews, A.; Dowey, S.J. Plasma electrolysis for surface engineering. Surf. Coat. Technol. 1999, 122, 73–93. [Google Scholar] [CrossRef]
  12. Kossenko, A.; Zinigrad, M. A universal electrolyte for the plasma electrolytic oxidation of aluminum and magnesium alloys. Mater. Des. 2015, 88, 302–309. [Google Scholar] [CrossRef]
  13. Phuong, N.V.; Fazal, B.R.; Moon, S. Cerium- and phosphate-based sealing treatments of PEO coated AZ31 Mg alloy. Surf. Coat. Technol. 2017, 309, 86–95. [Google Scholar] [CrossRef]
  14. Rudnev, V.S.; Lukiyanchuk, I.V.; Vasilyeva, M.S.; Morozova, V.P.; Zelikman, V.M.; Tarkhanova, I.G. W-containing oxide layers obtained on aluminum and titanium by PEO as catalysts in thiophene oxidation. Appl. Surf. Sci. 2017, 422, 1007–1014. [Google Scholar] [CrossRef]
  15. Chen, F.; Yu, P.; Zhang, Y. Healing effects of LDHs nanoplatelets on MAO ceramic layer of aluminum alloy. J. Alloys Compd. 2017, 711, 342–348. [Google Scholar] [CrossRef]
  16. Rudnev, V.S. Micro- and nano-formations on the surface of plasma electrolytic oxide coatings on aluminum and titanium. Surf. Coat. Technol. 2013, 235, 134–143. [Google Scholar] [CrossRef]
  17. Gnedenkov, S.V.; Sinebryukhov, S.L.; Egorkin, V.S.; Vyaliy, I.E. Wettability and electrochemical properties of the highly hydrophobic coatings on PEO-pretreated aluminum alloy. Surf. Coat. Technol. 2016, 307, 1241–1248. [Google Scholar] [CrossRef]
  18. Al Bosta, M.M.S.; Ma, K.J. Suggested mechanism for the MAO ceramic coating on aluminium substrates using bipolar current mode in the alkaline silicate electrolytes. Appl. Surf. Sci. 2014, 308, 121–138. [Google Scholar] [CrossRef]
  19. Krysmann, W.; Kurze, P.; Dittrich, K.H.; Schneider, H.G. Process Characteristics and Parametrs of Anodic Oxidation by Spark Discharge (ANOF). Cryst. Res. Technol. 1984, 19, 973–979. [Google Scholar] [CrossRef]
  20. Blawert, C.; Dietzel, W.; Ghali, E.; Song, G. Anodizing Treatments for magnesium alloys and their effect on corrosion resistance in various environments. Adv. Eng. Mater. 2006, 8, 511–533. [Google Scholar] [CrossRef]
  21. Han, Y.; Hong, S.H.; Xu, K. Synthesis of nanocrystalline titania films by micro-arc oxidation. Mater. Lett. 2002, 56, 744–747. [Google Scholar] [CrossRef]
  22. Butyagin, P.I.; Khokhryakov, Y.V.; Mamaev, A.I. Microplasma systems for creating coatings on aluminium alloys. Mater. Lett. 2003, 57, 1748–1751. [Google Scholar] [CrossRef]
  23. Lugovskoy, A.; Zinigrad, M.; Kossenko, A.; Kazanski, B. Production of ceramic layers on aluminum alloys by plasma electrolytic oxidation in alkaline silicate electrolytes. Appl. Surf. Sci. 2013, 264, 743–747. [Google Scholar] [CrossRef]
  24. Mohannad, M.S.; Bostaa, A.; Ma, K.J.; Chien, H.H. The effect of MAO processing time on surface properties and low temperature infrared emissivity of ceramic coating on aluminium 6061 alloy. Infrared Phys. Technol. 2013, 60, 323–334. [Google Scholar] [CrossRef]
  25. Hussein, R.O.; Nie, X.; Northwood, D.O.; Yerokhin, A.; Matthews, A. Spectroscopic study of electrolytic plasma and discharging behaviour during the plasma electrolytic oxidation (PEO) process. J. Phys. D Appl. Phys. 2010, 43, 105203. [Google Scholar] [CrossRef]
  26. Wang, K.; Koo, B.H.; Lee, C.G.; Kim, Y.J.; Lee, S.H.; Byon, E. Effects of electrolytes variation on formation of oxide layers of 6061 Al alloys by plasma electrolytic oxidation. Trans. Nonferr. Met. Soc. China 2009, 19, 866–870. [Google Scholar] [CrossRef]
  27. Auerkari, P. Mechanical and Physical Properties of Engineering Alumina Ceramics; Technical Research Centre of Finland: Espoo, Finland, 1996; ISBN 951-38-4987-2. [Google Scholar]
Figure 1. Electric parameters behavior plots (a) voltage as a function of treatment time; (b) current as a function of treatment time.
Applsci 07 00889 g001
Figure 2. Different stages of the oxide layer formation: (a) anodizing process; (b) microarc appearance (presented in a white frame); (c) plasma electrolytic oxidation (PEO) treatment and increasing of microarc number discharges (presented in a white frame).
Applsci 07 00889 g002
Figure 3. Surface morphology of the Al 1050 alloy after PEO treatment, magnifications: (a) 250×; (b) 1000×; (c) 5000×; (d) 10,000×.
Applsci 07 00889 g003
Figure 4. Surface area morphology investigated by SEM and elemental composition investigated by energy dispersive X-ray spectroscopy (EDS) after PEO treatment.
Applsci 07 00889 g004
Figure 5. X-ray diffraction pattern of aluminum 1050 alloy surface after PEO treatment.
Applsci 07 00889 g005
Figure 6. EDS line scan of the aluminum 1050 alloy cross section after PEO treatment and its microphotograph: 1: resin; 2: outer layer; 3: inner layer; 4: aluminum base.
Applsci 07 00889 g006
Table 1. Chemical composition of the Al alloy 1050.
Chemical Element (mass %)
SiMgFeCuMnZnTiAl
0.250.050.440.050.050.070.05Base
Table 2. Micro-hardness test results of different alloy coating depth related to Figure 6: Base metal: point 4; inner layer: point 3; outer layer: point 2.
Base Aluminum [HV10]Inner Layer [HV10]Outer Layer [HV10]
42 ± 2.2756 ± 3.11051 ± 2.8

