Article

FE Model and Operational Modal Analysis of Lower Limbs

1
Mines de St-Étienne, 158 cours Fauriel, 42023 Saint-Étienne CEDEX 2, France
2
GRESPI, Groupe de Recherche En Science Pour l’Ingenieur, Université de Reims Champagne-Ardenne, 51687 Reims CEDEX 2, France
3
Escuela Colombiana de Ingeniería Julio Garavito, Bogotá D.C. 111166, Colombia
4
Aix Marseille Univ, CNRS, ISM, 13284 Marseille, France
*
Author to whom correspondence should be addressed.
Appl. Sci. 2017, 7(8), 853; https://doi.org/10.3390/app7080853
Submission received: 26 May 2017 / Revised: 30 June 2017 / Accepted: 8 August 2017 / Published: 18 August 2017
(This article belongs to the Section Mechanical Engineering)

Abstract

:

Featured Application

In the field of public transport and sports, the development of specific materials able to absorb the modal frequencies identified in this paper will help decrease the amount of vibrations received by the human lower limbs. For example, shoes made of this material in running activities could prevent, or at least significantly decrease, injuries such as tibial stress syndrome. Moreover, the proposed model could be used to simulate dynamic solicitations stemming from different foot-strike patterns during running activities and, thus, to decrease stresses in the lower limb.

Abstract

Human lower limbs are exposed to vibrations on a daily basis, during work, transport or sports. However, most of the FE (Finite Elements) and OMA (Operational Modal Analysis) studies focus either on the whole body or on the hand-arm system. The study presented herein aims at identifying the modal parameters of the lower limbs using a 2D FE model updated using OMA. A numerical model is proposed, and a modal analysis has been performed on 11 subjects. Two repeatable modal frequencies were extracted: 52 . 54 ± 2 . 05 Hz and 118 . 94 ± 2 . 70 Hz , which were used to update the mechanical properties of the numerical model. The knowledge of these modal characteristics makes it possible to design new equipment that would absorb these specific vibrations and possibly reduce the risk of related diseases in the field of sports and transport.

1. Introduction

Every day, the human body is exposed to vibrations, whether during work, transport or sports. Two modes of exposition can be distinguished: whole body vibration and local vibration. Whole body vibrations may have some beneficial effects including ossification [1,2] and treatment of child muscular disabilities [3]. However, their negative effects have also been proven. Vibration could lead to an accelerated degeneration of joints [4] and vascular diseases [5]. Likewise, local vibrations produce beneficial effects, in sports training for example [6], as well as significant drawbacks, especially in the hand-arm system. Related symptoms can be split into four groups: vascular effects, muscular effects, skeletal effects and joints effects [7], including Raynaud’s disease [8]. All of them are generally referred to as Hand Arm Vibration Syndrome (HAVS) [9].
Investigating the effects of vibrations leads us to consider the human body as an extremely complex system, if only because of its responses to vibrations. It is a non-uniform, nonlinear and anisotropic structure. Nevertheless, simplified numerical models, like Finite Elements (FE) models, have been used to study the human body on various aspects: evaluate the injury risk of the lumbar vertebra of a seated human body submitted to vibrations [10] or predict the strains and strength of human femora [11]. A recent study featuring a two-dimensional FE model of the human hand-arm system was also used to estimate significant modal frequencies [12]. These frequencies were then compared to experimental results in order to update the mechanical properties of the model. The study concluded that FE models could be used to obtain reliable resonance frequencies of the human hand-arm system.
In order to update and validate numerical models, it is necessary to carry out experimental measurements. In this study, Operational Modal Analysis (OMA) is used. The OMA represents the set of modal identification methods based on the sole measurement of the system’s response. It has been successfully used in various studies on the human body, mostly for whole body vibrations. Indeed, one of the main fields of interest of modal analysis in this scope is related to transport, including the effects of cabin vibrations [13] or the resonance behavior of the seated human body [14]. OMA and finite elements have already been used jointly to determine modal frequencies, damping and mode shapes, but only on a given part of the human body, e.g., the tibia [15]. Moreover, most of the studies about vibrations and the human body only focus on the hand-arm system: the upper limbs are indeed frequently exposed, for example during biking [16]. However, lower limbs should be given proper attention, as well, since many everyday activities expose legs to vibrations. Solicitations could be similar to white noise in public transport [17] or similar to shock in walking and running activities [18,19]. Therefore, we have chosen to focus our study on the lower limbs, combining OMA and finite elements on a different scale, i.e., the half-body.
The aim of this study is to identify the experimental modal parameters of the human lower limbs and to propose an updated two-dimensional finite element model. Experimental modal parameters were extracted by operational modal analysis using poly-reference implementation of a Least Squares Complex Frequency domain (p-LSCF) method.

2. Method

2.1. Measurement

Eleven voluntary and healthy subjects were recruited for this study. Their anthropometric parameters are summarized in Table 1: age, height, weight, Body Mass Index (BMI) and characteristic lengths. Height was measured with a stadiometer and weight with an electronic load cell scale, and BMI was calculated as the weight divided by the square of the height. All characteristic lengths were measured with a thin flexible metal tape measure. The study was approved by the local university ethics review board and in agreement with the Declaration of Helsinki. The participants were aware of the purpose of the study, and they all provided written informed consent. The exclusion criteria included a history of back pain, acute inflammation in the pelvis and/or lower extremities, acute thrombosis, recent fractures, recent implants, gallstones, kidney or bladder stones, any spine disease, peripheral vascular disease and severe delayed onset of muscle soreness in leg muscles.
The study was divided into two protocols. The first protocol (Protocol 1) was dedicated to the repeatability of the OMA results. It consisted of 10 repeated measures on the same subject (healthy man, age 20, 78 k g , 180 c m ). The second protocol (Protocol 2) identified the modal characteristics (modal frequencies, damping and mode shapes) of the lower limbs of all subjects. Ten measurements were performed on each one of them. During the protocol, the subject had to be barefoot to create a single impact, making it possible to compute all of the resonant frequencies. To create the impact, each subject had to hold a rod and drop it from a height of 5 c m . Subjects were asked to keep their legs straight, to not damp the shock by bending their ankles or knees and to hit the ground using their heels. Subjects were finally instructed to limit muscle contraction. For the first protocol, the subject performed ten drops, and each of the measurements was independently analyzed for repeatability purposes. For the second protocol, eleven subjects performed ten drops each. These ten drops were considered as a unique set of data and analyzed accordingly.
Both protocols relied on the same experimental device, which was based on two synced Oros OR 35 multi-channel analyzers (Oros, Grenoble, France). The recording lasted one second, with a sampling rate of 2560 Hz . The impact response of the lower limbs was measured using four tri-axial accelerometers (Bruel and Kjaer, Nærum, Denmark) (Deltatron 4524 B; frequency range: 0.25–3000 Hz ; sensitivity: 10 m V / g). Those were tightly fastened close to the joints in the lateral side of the right limb to minimize the contributions of skin artifacts, at repeatable anatomic locations: at the top point of the iliac crest, at the center of rotation of the knee placed in the middle of the lateral condyle, at the middle of the ankle external malleolus and at the center of mass of the tibia, aligned with the other two accelerometers on the segment. The accelerometers’ axes were properly oriented in the same direction (Figure 1). Accelerations along the x, y and z axis were recorded at all locations. The distance between the accelerometers was measured in order to rebuild a geometry using Oros Modal Analysis software (Version 5, OROS, Grenoble, France). The distances between the hip and knee accelerometers, between the knee and tibia sensors and between the tibia and ankle sensors are summarized in Table 1.

2.2. Modal Parameters

Modal identification was performed using OROS Modal software (Version 5, OROS, Grenoble, France). We chose the Least Squares Complex Frequency domain (p-LSCF) method [20] owing to its capability of separating strongly-coupled modes and avoiding the decomposition of model-related residues into singular values. Singular Value Decomposition (SVD) drastically decreases the quality of the regression [21]. The method is based on the analysis of the outputs, described in Equation (1):
S o u t p u t s ( ω ) = H ( ω ) · S i n p u t s · H ( ω ) H ,
ω being the frequencies, H ( ω ) the matrix composed of the frequency response function, exponent H the complex conjugate transpose of a matrix (Hermitian) and S i n p u t s and S o u t p u t s the inputs’ and outputs’ spectral matrix. The outputs’ estimation S ¯ o u t p u t s + ( ω ) is obtained by integrating two residual terms to approximate the effects outside the selected range [22], using Equation (2):
S ¯ o u t p u t s + ( ω ) = i = 1 n r Φ i g i T j ω λ i + Φ i * g i H j ω λ i * + LR j ω + j ω UR ,
where T is the transpose of a matrix, * is the complex conjugate of a matrix, Φ k is a column vector containing mode shape k, g k T is a line vector with the modal participation factor of mode k and λ k are the structure poles. LR and UR stand for the lower and upper residues, which illustrate the influence of modes outside the frequency range.
For both protocols, the range of interest was 0–200 Hz . Preliminary measurements showed that for frequencies over 200 Hz , the spectral signal was similar to noise. Moreover Standard ISO 2631-1 [23] provides a guideline for measurement and assessment in the case of exposure to whole body vibration, and defines a frequency weighting filter. More precisely, frequencies above 200 Hz are significantly filtered.
Identification of the modal parameters, and particularly mode shapes, requires a simplified model. Thus, a model of a segmented straight line was made from four nodes with three degrees of freedom (DOFs), positioned in a way similar to the measurement points in OROS Modal software (see Figure 1). For Protocol 1, the modal characteristics of the leg were calculated: modal frequencies, damping and shapes. The results of frequencies and damping are presented as the mean and standard deviation (coefficient of variation). The coefficient of variation was calculated as the ratio between the standard deviation and the mean. The repeatability of the shapes was visually estimated. For Protocol 2, the modal characteristics of the lower limb were determined for all of the subjects: modal frequencies, damping and shapes, as indicated above. The modal frequencies were then used to validate and update the mechanical properties (Young’s moduli and mass densities) used in the numerical model.

2.3. FE Model

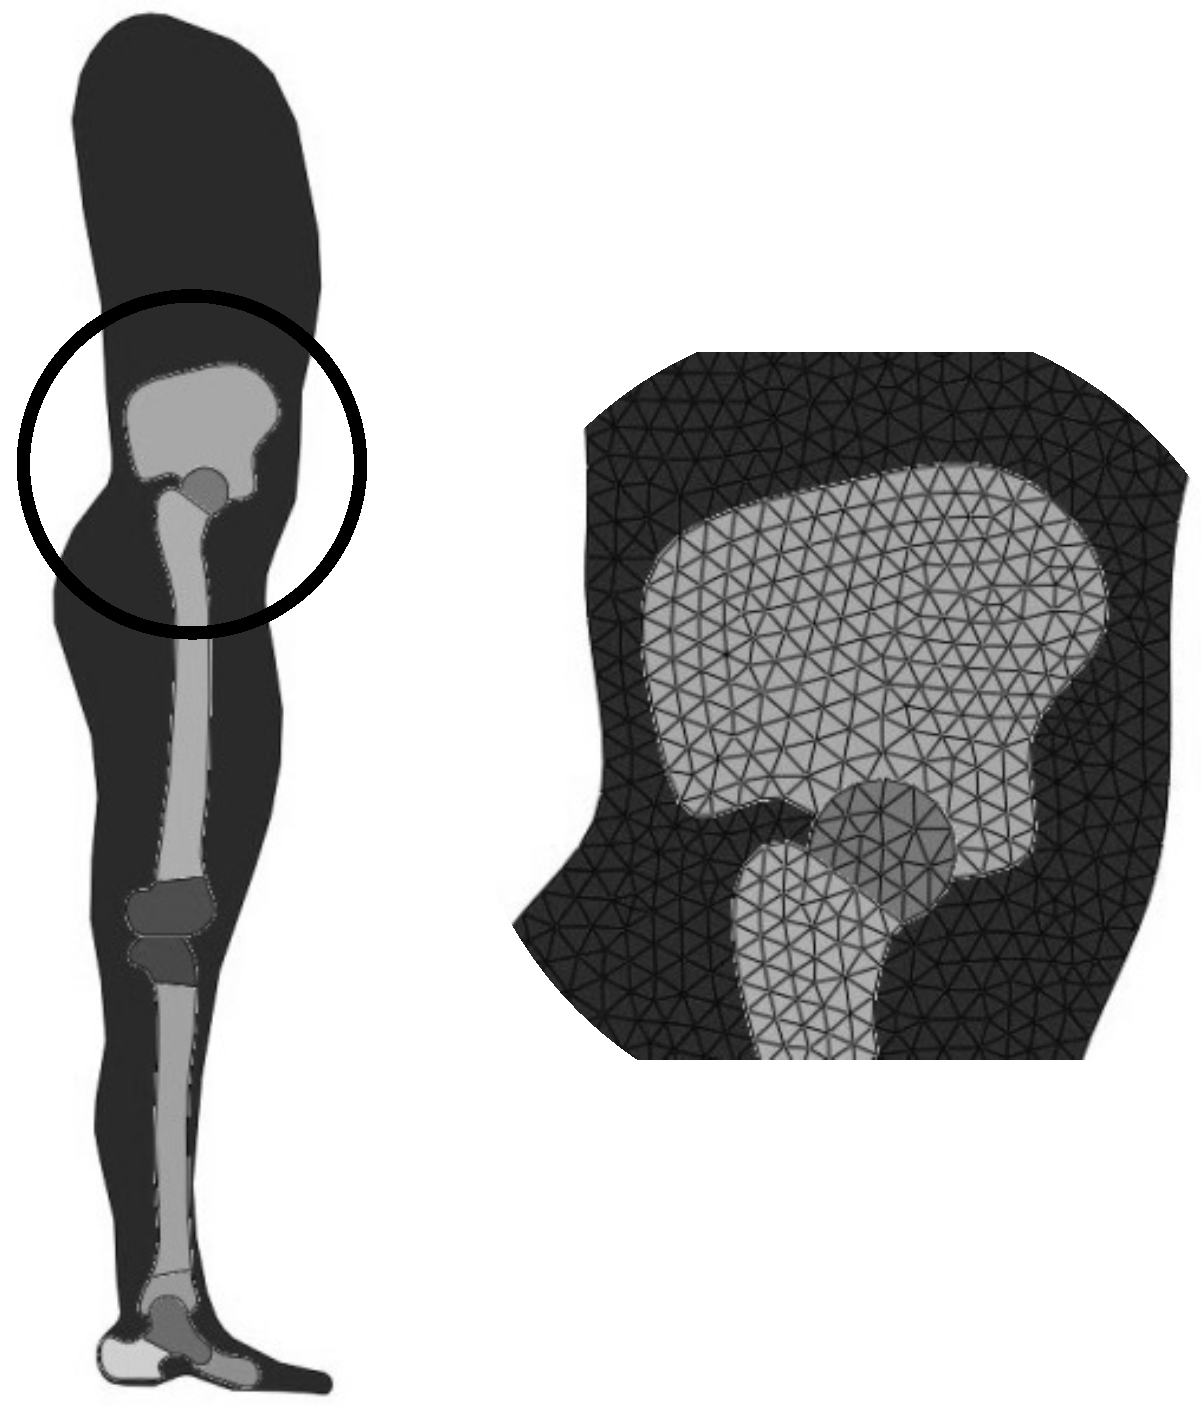
The 2D FE model of the human lower limb was created using Abaqus® software (Version 6.12, Dassault Systèmes, Vélizy-Villacoublay, France) and features the foot (calcaneus, talus, metatarsus lumped together, tarsus lumped together), leg (tibia bone), thigh (femur bone), soft tissues, ankle, knee, hip joints and trunk (Figure 2). The femur and tibia bones were made of a central part of cortical bone and trabecular bones at the ends. The bones were held together by soft tissues, which represent muscles, skin, tendons and adipose tissue. Bones are in contact at joints; however, joint cartilage has not been modeled. The anthropometric dimensions used to create the model have been retrieved from several references (Table 2) and calculated for a virtual subject 175 c m tall. Obviously, the natural modes and frequencies are strongly dependent on these anthropometric dimensions, yet focusing on a single virtual subject showed promising results and allowed us to validate the methodology.
The model was developed for a standing posture without knee flexion. Humans are indeed exposed to vibrations and impacts while extending legs. In industry, workers are liable to stand on platforms, which are sources of vibrations, and it is common to remain standing in public transport.
Four materials were used: trabecular and cortical bones and soft tissues for the trunk. All of the components of the trunk (spine, scapular, abdomen, etc.) were lumped together (see Figure 2) to simplify the model, as defined by Adewusi [12]. Mechanical properties of the bones [24], soft tissues and trunk [12] are summarized in Table 3. The downside regarding the use of a linear elastic constitutive law for soft tissues is discussed in Section 4. Fixed boundary conditions were applied at the shoulder to allow motion of the trunk and hence the pelvis. The mesh is created using default CPS33-node linear plane stress triangle elements, for a total of 1167 nodes and 1742 elements. Modal analyses of the model were then performed using Abaqus® on a standard workstation. Modal frequencies’ sensitivity to the mesh density was investigated.

3. Results

3.1. Modal Identification

The repeatability results are listed in Table 4. Eight modes have been identified in the selected frequency range. The score stands for the number of appearances of the mode compared to the total number of measures. Modes 1, 3, 4, 6, 7 and 8 have been identified in more than 80% of the tests. Mode 2 was identified in 60% of the tests and Mode 5 in 30%.
The mode frequencies exhibit a coefficient of variation below 5%. Frequencies 1, 3, 4, 6, 7 and 8 have been identified in at least 80% of the tests, and their coefficients of variation lie below 5%. Their identification is therefore considered repeatable. Dampings for Modes 2, 3, 4, 6 and 7 have similar values, around 7.57%. Damping of Mode 1 is 40% higher, while that of Mode 5 is about 50% lower and that of Mode 8 only 30%. The variation coefficients range from 16.2% for Mode 6 to 49.9% for Mode 5. The modal dampings are consequently considered not repeatable, contrary to the frequencies. The parameters considered by the protocol could not provide accurate measurement of damping. Therefore, damping will be discarded in the forthcoming exploitation of the results.
The results of the modal identification for the 11 subjects are listed in Table 5.
Eight modes have been identified among all of the subjects. The modal frequencies were estimated as identical for the eight identified modes with a coefficient of variation below 5%. However, modal damping had a high coefficient of variation (above 30.1%). This confirmed the previous results of the repeatability protocol.

3.2. FE Model Results

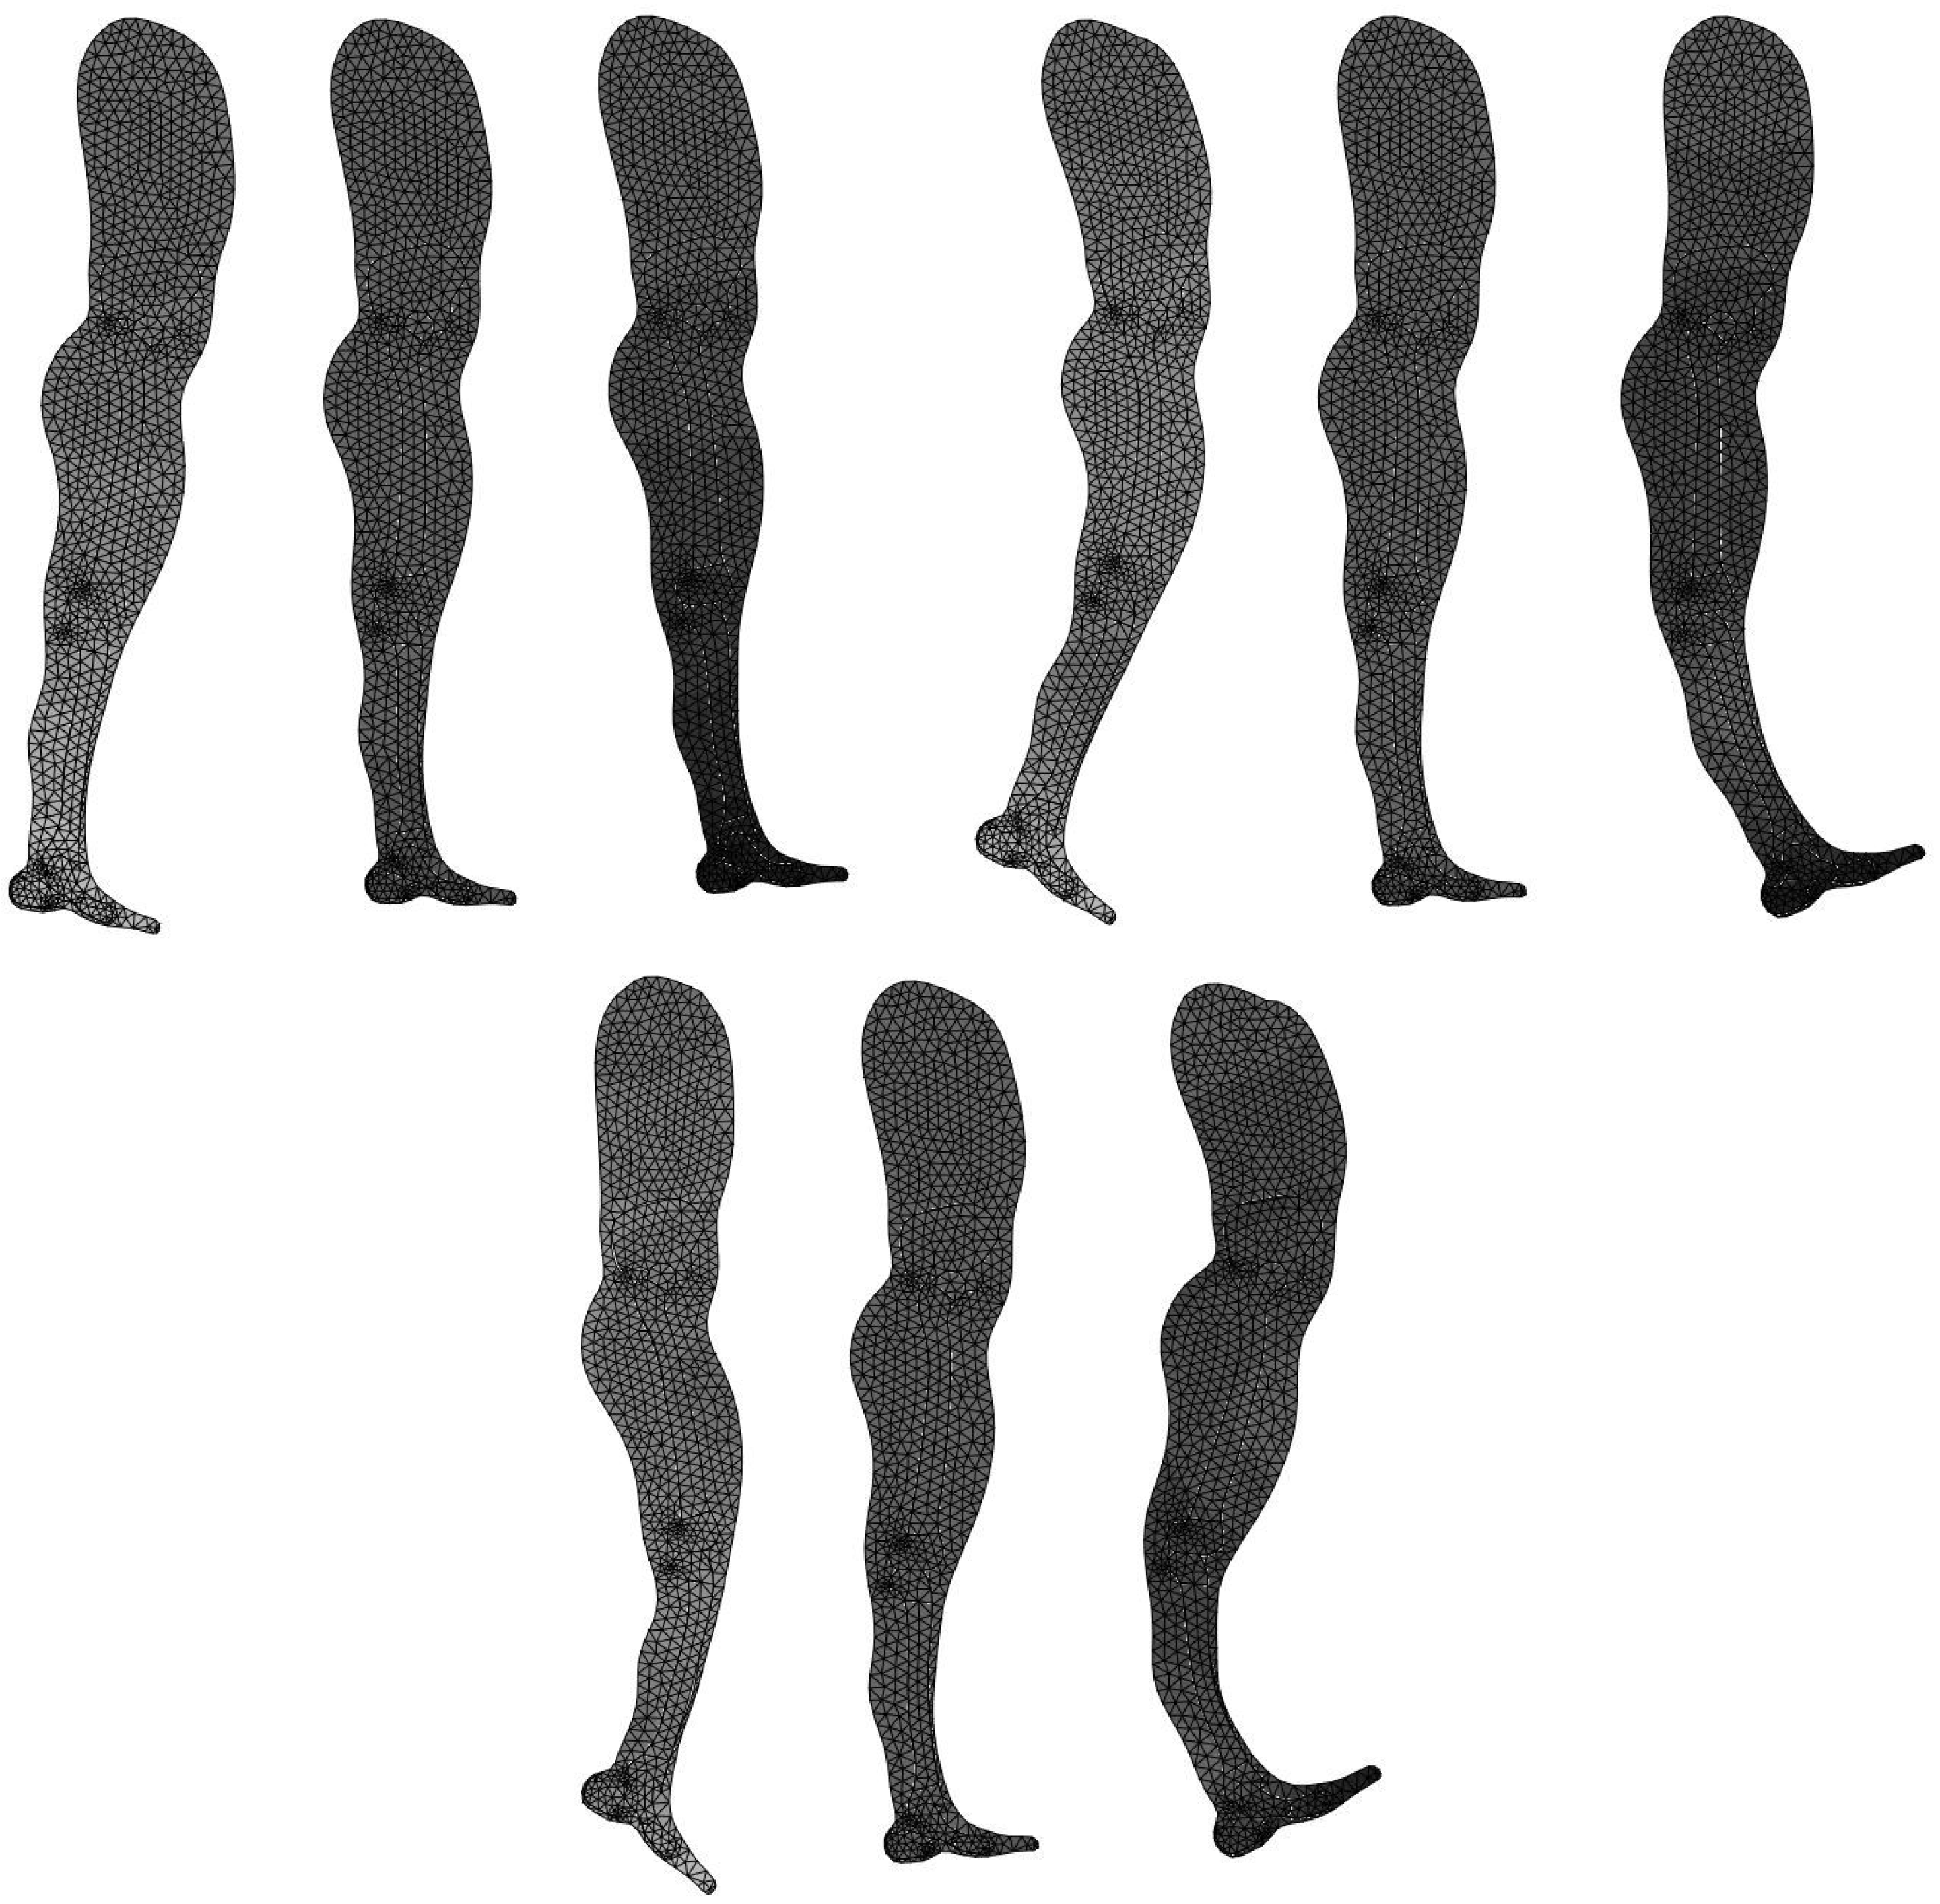
The results of the initial numerical model highlight three modes: 12 . 8 Hz , 54 . 5 Hz and 126 . 9 Hz , depicted in Figure 3. The deformations of the first mode are located at the top of the trunk and the foot. Experimental mode shapes have been visually compared to the numerical ones: the modes corresponding to the numerical modes were Numbers 3 and 8. Mode 3 matched numerical Mode 2; Mode 8 matched numerical Mode 3. The frequency of Mode 3 is 52 . 54 Hz and that of Mode 8 is 118 . 94 Hz . Given that our study was based on a two-dimensional model, the other modes could not be obtained by the numerical model. The corresponding experimental mode shapes showed however that deformation is mostly oriented out-of-plane, suggesting that the numerical model accurately describes the in-plane dynamic behavior.

3.3. Model Update

The mechanical properties used during the modal analysis are summarized in Table 3. A sensitivity analysis was performed in order to investigate the effect of changes in the mechanical properties on the resonant frequencies [34]. It was observed that the mechanical properties of the soft tissues were the most influential on the resonant frequencies of the FE models (a variation of 50% of the parameters of soft tissues, including the trunk and hard tissues, leads to a variation of about 10% in the frequencies for soft tissues and 1% for hard tissues). Then, the mechanical properties of the bones were retained while those of the soft tissues and the trunk were updated. Actually, the properties of the trunk were not known, and those of soft tissues depended on the subject stature and muscular force. The aim was to update the mechanical properties of the model until its resonant frequencies were close to the OMA results. The different frequencies obtained from the numerical model and with the OMA were associated through visual comparison of the mode shapes.
A Shapiro–Wilk test showed that the values of experimental frequencies for Modes 3 and 8 were normally distributed. A Student test has been used to calculate a confidence interval for each frequency, as shown in Equation (3):
f ¯ i exp t α · s i n f i f ¯ i exp + t α · s i n ,
where t α was set up for a risk probability α of 5%, n was the number of subjects and f ¯ i exp and s i were the mean and standard deviation of the experimental frequencies found for each mode i as shown in Table 5. This confidence interval has been calculated in order to compare experimental and numerical results. The purpose of updating the mechanical properties of the numerical model was to ensure that all mode frequencies were included in the confidence interval. Thus, the updated numerical model was significantly similar to experimental results. The experimental frequencies, confidence intervals, initial and updated model frequencies for Modes 3 and 8 are displayed in Table 6. The new mechanical properties are summarized in Table 3.

4. Discussions

The present study identified eight modes in the range of 0–150 Hz . Six modes are identified in 80% of the tests. The fifth mode seems difficult to exploit given its low repeatability in the identification. This mode is most certainly due to a measurement artifact. Two of these eight modes ( 54 . 55 Hz and 126 . 86 Hz ) are in agreement with the numerical modes, and the identification is supported by an analysis of modal deformations. The parameters used in the updated model clearly match both physical and anatomical realities. This proves that an FE model, once updated, is a possible approach to simulate the mechanical behavior of human lower limbs. It should be noted that these two modes are differentiated by the sensor located in the middle of the tibia. The tibia actually contains a vibration node for solicitations around 118 Hz . On the other hand, the thigh does not have a vibration node in the frequency range of interest.
In order to validate the numerical model, this study proposes a methodology that allows describing the modal behavior of the leg with no direct measures. This methodology can come in addition to those used in the literature that focus on modal parameters of a particular bone. One can distinguish two main in vivo methods that are compared in the work of Cornelissen in the late 1980s [35]. The Impulse Response (IFR) method involves generating impact with a shock hammer where the leg is relaxed and left hanging. The Bone Resonance Frequency (BRA) method consists of generating a sinusoidal signal over a frequency range with a vibrating shaker. These methods involve the measurement of the forces and their responses on the bone: it is therefore impossible to carry out measurements under real conditions. An OMA offers an interesting alternative, being an application in real conditions where the input forces are not known. Recent developments in OMA make it possible to identify the modal parameters, with possible applications in various sports with stationary impacts or noise. In terms of instrumentation, the proposed setup (featuring four sensors) extracts two modes in the 0–150- Hz range. The sensor in the middle of the tibia is essential to differentiate modes. It might be wise to deploy a fifth sensor in the middle of the thigh to observe a possible modal deformation displaying a vibration node on the femur. However, properly attaching the sensor would be difficult in view of the presence of the rectus femoris. Experimental studies propose a mathematical modeling of the phenomenon and could be integrated directly into the FE model [36].
Concerning the identified frequencies, the frequency of 52 . 54 Hz is very similar to that found in previous studies [37,38]. Both resonance frequencies were determined by using a vibratory excitation at different frequencies between 10 and 90 Hz . The resonance frequency of the ankle was found to lie in the 40–50- Hz range. The modal deformation of the second mode at 126 . 9 Hz matches the modal deformations of the tibia, which is identified experimentally in the work of Van der Perre [39] and numerically in that of Taylor [40]. The latter highlights the torsional modes obtained for higher values ( 521 Hz ). The protocol of the present study unfortunately prevents the measurement of this deformation.
Considering results in a qualitative way, the frequency values lie in wide ranges. The tibia study shows that the bending resonance frequencies are of the order of magnitude 270 Hz and 340 Hz [39]. The modal frequencies for the femur are quite controversial. In free-free boundary conditions, Kumar [41] identified modal frequencies at 449, 524 and 1109 Hz , while Gupta [42] determined frequencies of 722 Hz for bending mode and 1582 Hz for double bending. In fixed-fixed conditions, the extracted frequencies are 1211, 1269 and 2818 Hz [41]. These studies identified modes on a particular bone with boundary conditions that are completely different from those depicted in the present paper. Our methodology is dependent on the mass of the subject and the whole anatomical environment, which accounts for the lower values and corroborates previous studies on the influence of anatomical parts. Tsuchikane [43] shows from cadaverous specimens that the resonance frequencies are uninfluenced by the skin, increased with the dissection of the muscles and foot and decreased with the dissection of the femur and the fibula. This is confirmed by the work of Cornelissen [35], who adds that the joint has no influence on the modal frequencies of the tibia, but alters modal damping by 10–16%. These results are in agreement with the present work, where the values of frequencies are much lower than the values determined in vitro. In addition, the results of the sensitivity of the parameters show that a variation of 50% in the parameters of soft tissues, including the trunk and hard tissues, leads to a variation of about 10% in the frequencies.
The proposed FE model is a preliminary model that requires many developments, but the values identified experimentally are very similar to the numerical ones, even without updates. Several perspectives are possible. The model does not integrate the fibula, which may actually be necessary: the works of Cornelissen and Tsuchikane show that the fibula makes the lower limb more rigid. Moreover, the work of Tseng [44] proves that the fibula has modal properties close to those of the tibia ( 173 . 5, 249 . 3 and 516 . 2 Hz ): there is no denying that it has a given influence on the dynamic behavior of the limb. Joint cartilage has also not been modeled: its influence, especially on damping, may be investigated in future works. A possible source of error is also the choice of a linear elastic constitutive law for soft tissues. Switching to hybrid models featuring Ogden-type hyperelasticity and exponential anisotropic behaviors [45] may improve the model. Then, it would be interesting to calculate the resonance modes at different knee angles. The work of Munera [8] shows that the resonance frequencies are a function of the knee angle during a squat. The identified frequencies could be located in the excited frequency range 6–8 or 9–20 Hz , matching that of running activities [46]. Finally, upgrading to a 3D model would most certainly provide a greater number of modes in the range 0–150 Hz , two-dimensional modeling only allowing extraction of the modes in the mid-lateral plane.
Reading the standards on human exposure to vibrations, the frequency of 52 . 54 Hz seemed to be the most harmful frequency for lower limbs. Indeed standard ISO 2631-1 [23] defines a frequency weighting filter: the gain at 52 Hz is 0.87, but drops below 0.10 beyond 150 Hz . In the field of public transport and sports, the development of specific materials able to absorb these specific frequencies will decrease the amount of vibrations received by the human lower limbs. For example, a ground made of this material in public transport or in industries could prevent or at least significantly decrease diseases such as arthritis among workers. It could also drastically reduce the tiredness of lower limbs for passengers and make travel far more comfortable. We can note that Taiar [47] determined the vibration responses of anti-fatigue mats to reduce the pain associated with vibratory exposure by considering these standards and defined the optimal geometry and design for risk prevention.

Author Contributions

Aymeric Pionteck conceived of and performed the experiments and analyzed the data. Xavier Chiementin, Sébastien Mürer wrote the paper and interpreted the data with the first author. Xavier Chiementin and Marcela Munera planned and supervised the research work and outlined the paper. Delphine Chadefaux and Guillaume Rao provided suggestions on the numerical model and revised the entire manuscript.

Conflicts of Interest

The authors declare no conflict of interest.

References

  1. Gómez-Cabello, A.; González-Agüero, A.; Morales, S.; Ara, I.; Casajús, J.A.; Vicente-Rodríguez, G. Effects of a short-term whole body vibration intervention on bone mass and structure in elderly people. J. Sci. Med. Sport 2014, 17, 160–164. [Google Scholar] [CrossRef] [PubMed]
  2. Madou, K.H.; Cronin, J.B. The Effects of Whole Body Vibration on Physical and Physiological Capability in Special Populations. Hong Kong Physiother. J. 2008, 26, 24–38. [Google Scholar] [CrossRef]
  3. Matute-Llorente, Á.; González-Agüero, A.; Gómez-Cabello, A.; Vicente-Rodríguez, G.; Casajús Mallén, J.A. Effect of Whole-Body Vibration Therapy on Health-Related Physical Fitness in Children and Adolescents With Disabilities: A Systematic Review. J. Adolesc. Health 2014, 54, 385–396. [Google Scholar] [CrossRef] [PubMed]
  4. Carlsöö, S. The effect of vibration on the skeleton, joints and muscles. A review of the literature. Appl. Ergon. 1982, 13, 251–258. [Google Scholar] [CrossRef]
  5. Wang, Y.J.; Huang, X.L.; Yan, J.W.; Wan, Y.N.; Wang, B.X.; Tao, J.H.; Chen, B.; Li, B.Z.; Yang, G.J.; Wang, J. The association between vibration and vascular injury in rheumatic diseases: A review of the literature. Autoimmunity 2015, 48, 61–68. [Google Scholar] [CrossRef] [PubMed]
  6. Jordan, M.J.; Norris, S.R.; Smith, D.J.; Herzog, W. Vibration Training: An Overview of the Area, Training Consequences, and Future Considerations. J. Strength Cond. Res. 2005, 19, 459. [Google Scholar] [CrossRef] [PubMed]
  7. Gurram, R. A Study of Vibration Response Characteristics of the Human Hand-Arm System. Ph.D. Thesis, Concordia University, Montreal, QC, Canada, 1993. [Google Scholar]
  8. Munera, M.; Chiementin, X.; Crequy, S.; Bertucci, W. Physical risk associated with vibration at cycling. Mech. Ind. 2014, 15, 535–540. [Google Scholar] [CrossRef]
  9. Fridén, J. Vibration damage to the hand: Clinical presentation, prognosis and length and severity of vibration required. J. Hand Surg. 2001, 26, 471–474. [Google Scholar] [CrossRef] [PubMed]
  10. Ayari, H.; Thomas, M.; Doré, S.; Serrus, O. Evaluation of lumbar vertebra injury risk to the seated human body when exposed to vertical vibration. J. Sound Vib. 2009, 321, 454–470. [Google Scholar] [CrossRef]
  11. Grassi, L.; Väänänen, S.; Ristinmaa, M.; Jurvelin, J.S.; Isaksson, H. How accurately can subject-specific finite element models predict strains and strength of human femora? Investigation using full-field measurements. J. Biomech. 2016, 49, 802–806. [Google Scholar] [CrossRef] [PubMed]
  12. Adewusi, S.; Thomas, M.; Vu, V.; Li, W. Modal parameters of the human hand-arm using finite element and operational modal analysis. Mech. Ind. 2014, 15, 541–549. [Google Scholar] [CrossRef]
  13. Hostens, I.; Ramon, H. Descriptive analysis of combine cabin vibrations and their effect on the human body. J. Sound Vib. 2003, 266, 453–464. [Google Scholar] [CrossRef]
  14. Kitazaki, S.; Griffin, M.J. Resonance behaviour of the seated human body and effects of posture. J. Biomech. 1998, 31, 143–149. [Google Scholar] [CrossRef]
  15. Hobatho, M.C.; Darmana, R.; Pastor, P.; Barrau, J.J.; Laroze, S.; Morucci, J.P. Development of a three-dimensional finite element model of a human tibia using experimental modal analysis. J. Biomech. 1991, 24, 371–383. [Google Scholar] [CrossRef]
  16. Munera, M.; Chiementin, X.; Murer, S.; Bertucci, W. Model of the risk assessment of hand-arm system vibrations in cycling: Case of cobblestone road. Proc. Inst. Mech. Eng. Part P 2015, 229, 231–238. [Google Scholar] [CrossRef]
  17. Thuong, O.; Griffin, M.J. The vibration discomfort of standing persons: 0.5–16 Hz fore-and-aft, lateral, and vertical vibration. J. Sound Vib. 2011, 330, 816–826. [Google Scholar] [CrossRef]
  18. Wakeling, J.M.; Liphardt, A.M.; Nigg, B.M. Muscle activity reduces soft-tissue resonance at heel-strike during walking. J. Biomech. 2003, 36, 1761–1769. [Google Scholar] [CrossRef]
  19. Lafortune, M.A.; Lake, M.J.; Hennig, E.M. Differential shock transmission response of the human body to impact severity and lower limb posture. J. Biomech. 1996, 29, 1531–1537. [Google Scholar] [CrossRef]
  20. Peeters, B.; Van Der Auweraer, H. Polymax: A revolution in operational modal analysis. In Proceedings of the 1st International Operational Modal Analysis Conference, Copenhagen, Denmark, 26–27 April 2005. [Google Scholar]
  21. Van der Auweraer, H.; Guillaume, P.; Verboven, P.; Vanlanduit, S. Application of a Fast-Stabilizing Frequency Domain Parameter Estimation Method. J. Dyn. Syst. Meas. Control 2001, 123, 651. [Google Scholar] [CrossRef]
  22. Heylen, W.; Lammens, S.; Sas, P. Modal Analysis Theory and Testing; Katholieke Universiteit Leuven, Faculty of Engineering, Department of Mechanical Engineering, Division of Production Engineering, Machine Design and Automation: Leuven, Belgium, 1998. [Google Scholar]
  23. Afnor. ISO 2631-1:1997—Mechanical Vibration and Shock—Evaluation of Human Exposure to Whole-Body Vibration—Part 1: General Requirements; ISO: Geneva, Switzerland, 1997. [Google Scholar]
  24. Beillas, P.; Papaioannou, G.; Tashman, S.; Yang, K. A new method to investigate in vivo knee behavior using a finite element model of the lower limb. J. Biomech. 2004, 37, 1019–1030. [Google Scholar] [CrossRef] [PubMed]
  25. De Mendonça, M.C. Estimation of height from the length of long bones in a Portuguese adult population. Am. J. Phys. Anthropol. 2000, 112, 39–48. [Google Scholar] [CrossRef]
  26. Atilla, B.; Oznur, A.; Cağlar, O.; Tokgözoğlu, M.; Alpaslan, M. Osteometry of the femora in Turkish individuals: A morphometric study in 114 cadaveric femora as an anatomic basis of femoral component design. Acta Orthop. Traumatol. Turc. 2007, 41, 64–68. [Google Scholar] [PubMed]
  27. Beauthier, J.; Mangin, P.; Hédouin, V. Traité de Médecine Légale. De Boeck: Bruxelles, Belgique, 2011. [Google Scholar]
  28. Schmidt, W.; Reyes, M.; Fischer, F.; Geesink, R.; Nolte, L.; Racanelli, J.; Reimers, N. Quantifying human knee anthropometric differences between ethnic groups and gender using shape analysis techniques. In Proceedings of the Annual Meeting American Society of Biomechanics, State College, PA, USA, 26–29 August 2009. [Google Scholar]
  29. NASA. Volume I: Man-Systems Integration Standards (MSIS); Chapter Anthropometry and Biomechanics; NASA: Washington, DC, USA, 1995. [Google Scholar]
  30. Giladi, M.; Milgrom, C.; Simkin, A.; Stein, M.; Kashtan, H.; Margulies, J.; Rand, N.; Chisin, R.; Steinberg, R.; Aharonson, Z. Stress fractures and tibial bone width. A risk factor. J. Bone Jt. Surg. Br. Vol. 1987, 69, 326–329. [Google Scholar]
  31. Radzi, S.; Uesugi, M.; Baird, A.; Mishra, S.; Schuetz, M.; Schmutz, B. Assessing the bilateral geometrical differences of the tibia—Are they the same? Med. Eng. Phys. 2014, 36, 1618–1625. [Google Scholar] [CrossRef] [PubMed]
  32. Ozden, H.; Balci, Y.; Demirüstü, C.; Turgut, A.; Ertugrul, M. Stature and sex estimate using foot and shoe dimensions. Forensic Sci. Int. 2005, 147, 181–184. [Google Scholar] [CrossRef] [PubMed]
  33. Kanaani, J.; Mortazavi, S.B.; Khavanin, A.; Mirzai, R.; Rasulzadeh, Y.; Mansurizadeh, M. Foot Anthropometry of 18–25 Years Old Iranian Male Students. Asian J. Sci. Res. 2010, 3, 62–69. [Google Scholar] [CrossRef]
  34. Pionteck, A.; Munera, M.; Chiementin, X. Modélisation 2D des Membres Inférieurs et Comportement Modale Face aux Paramètres Biomécaniques; 22ème Congrès Français de Mécanique, Lyon, France (FR); AFM, Association Française de Mécanique: Courbevoie, France, 2015. [Google Scholar]
  35. Cornelissen, P.; Cornelissen, M.; Van der Perre, G.; Christensen, A.B.; Ammitzbøll, F.; Dyrbye, C. Assessment of tibial stiffness by vibration testing in situ–II. Influence of soft tissues, joints and fibula. J. Biomech. 1986, 19, 551–561. [Google Scholar] [CrossRef]
  36. Dumas, R.; Camomilla, V.; Bonci, T.; Cheze, L.; Cappozzo, A. Generalized mathematical representation of the soft tissue artefact. J. Biomech. 2014, 47, 476–481. [Google Scholar] [CrossRef] [PubMed]
  37. Munera, M.; Bertucci, W.; Duc, S.; Chiementin, X. Transmission of whole body vibration to the lower body in static and dynamic half-squat exercises. Sports Biomech. 2016, 15, 409–428. [Google Scholar] [CrossRef] [PubMed]
  38. Kiiski, J.; Heinonen, A.; Järvinen, T.L.; Kannus, P.; Sievänen, H. Transmission of Vertical Whole Body Vibration to the Human Body. J. Bone Miner. Res. 2008, 23, 1318–1325. [Google Scholar] [CrossRef] [PubMed]
  39. Van der Perre, G.; Cornelissen, P. On the mechanical resonances of a human tibia in vitro. J. Biomech. 1983, 16, 549–552. [Google Scholar] [CrossRef]
  40. Taylor, W.R.; Roland, E.; Ploeg, H.; Hertig, D.; Klabunde, R.; Warner, M.D.; Hobatho, M.C.; Rakotomanana, L.; Clift, S.E. Determination of orthotropic bone elastic constants using FEA and modal analysis. J. Biomech. 2002, 35, 767–773. [Google Scholar] [CrossRef]
  41. Kumar, A.; Jaiswal, H.; Garg, T.; Patil, P.P. Free Vibration Modes Analysis of Femur Bone Fracture Using Varying Boundary Conditions based on FEA. Procedia Mater. Sci. 2014, 6, 1593–1599. [Google Scholar] [CrossRef]
  42. Gupta, A.; Ming Tse, K. Finite Element Analysis on Vibration Modes of Femur Bone. In Proceedings of the International Conference on Advances in Mechanical Engineering, NCR-Delhi Region, India, December 2013. [Google Scholar]
  43. Tsuchikane, A.; Nakatsuchi, Y.; Nomura, A. The influence of joints and soft tissue on the natural frequency of the human tibia using the impulse response method. Proc. Inst. Mech. Eng. Part H 1995, 209, 149–155. [Google Scholar] [CrossRef] [PubMed]
  44. Tseng, J.G.; Huang, B.W.; Liang, S.H.; Yen, K.T.; Tsai, Y.C.; Tseng, J.G. Normal Mode Analysis of a Human Fibula. Life Sci. J. 2014, 11, 711–718. [Google Scholar]
  45. Kassab, G.; Sacks, M. Structure-Based Mechanics of Tissues and Organs; Springer: New York, NY, USA, 2016. [Google Scholar]
  46. Gruber, A.H.; Boyer, K.A.; Derrick, T.R.; Hamill, J. Impact shock frequency components and attenuation in rearfoot and forefoot running. J. Sport Health Sci. 2014, 3, 113–121. [Google Scholar] [CrossRef]
  47. Taiar, R.; Chiementin, X. Ergonomics and biomechanics on the impact of mats on decreasing whole body vibration. In Proceedings of the 8th International Conference on Applied Human Factors and Ergonomics, Los Angeles, CA, USA, 7–17 July 2017. [Google Scholar]
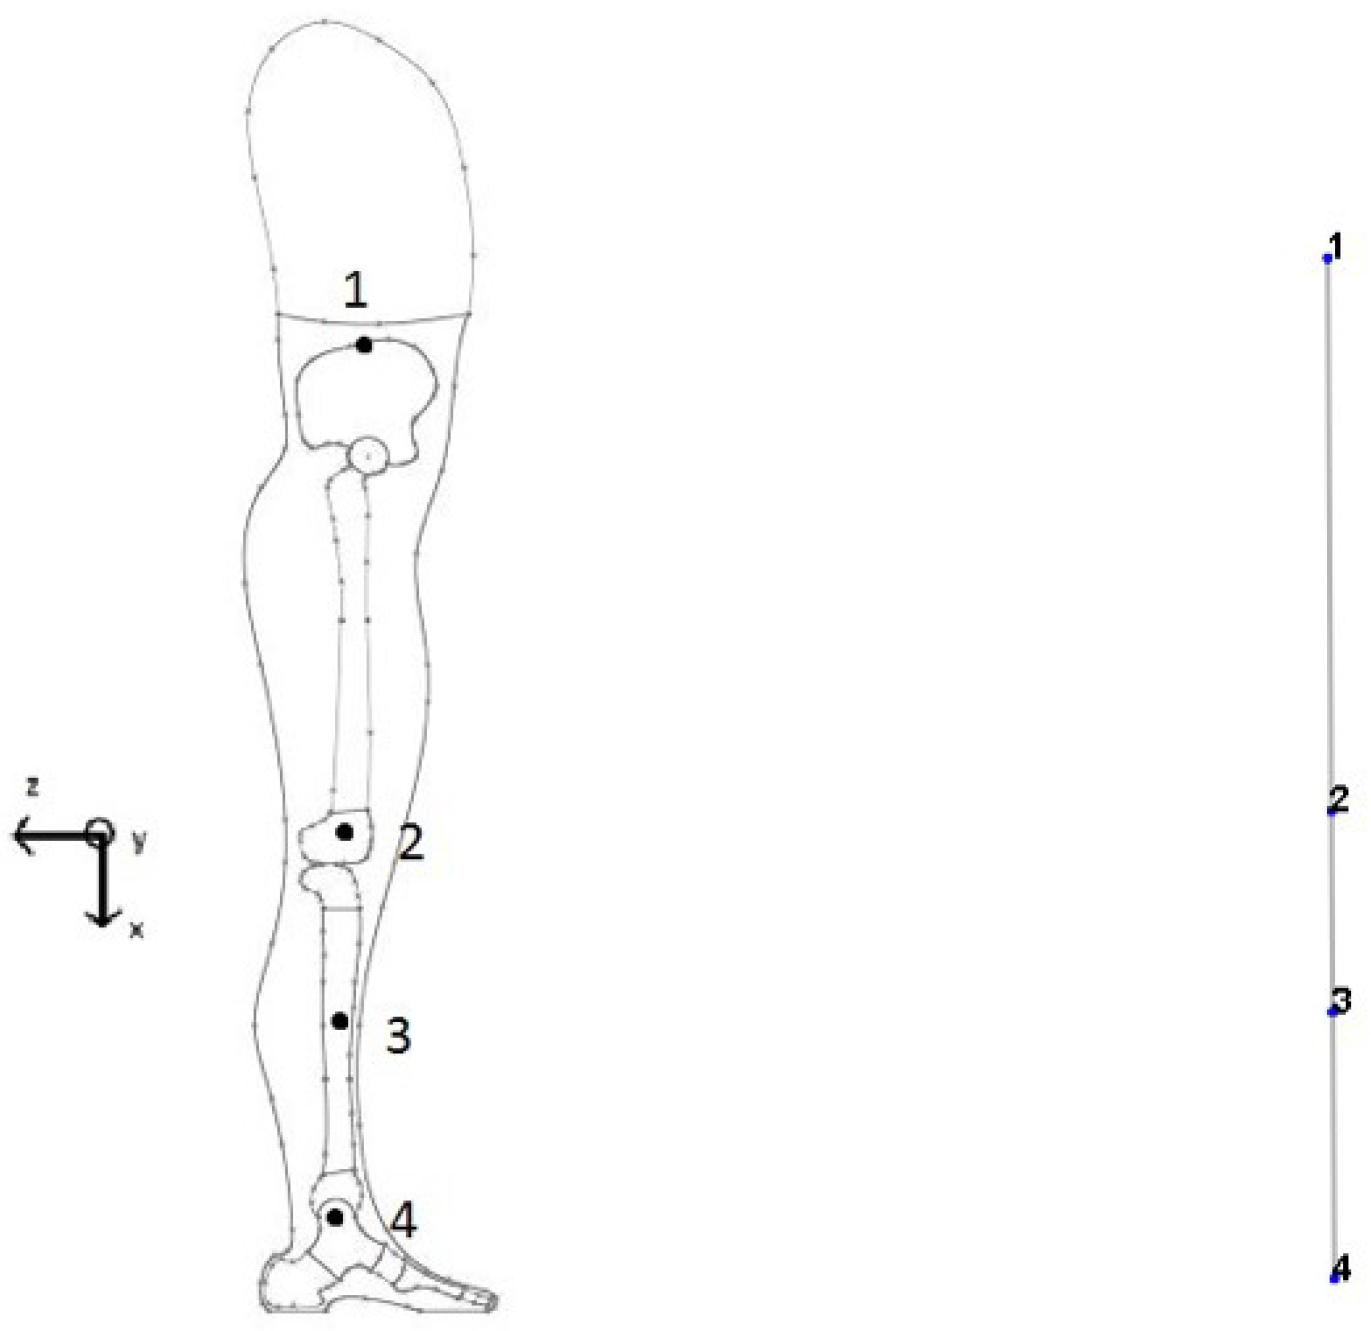
Figure 1. (Left) Accelerometers locations and orientations; (right) geometry of the lower limb model in the Modal Analysis software. Points 1, 2, 3, 4 are the location of the accelerometers and the number of node for the numerical model.
Applsci 07 00853 g001
Figure 2. Numerical model of lower limb (left); mesh detail of hip joint region (right).
Applsci 07 00853 g002
Figure 3. Mode shapes: (top) Frequency 1 ( 12 . 8 Hz ); (middle) Frequency 2 ( 54 . 5 Hz ); (bottom) Frequency 3 ( 126 . 9 Hz ).
Applsci 07 00853 g003
Table 1. Subjects’ anthropometric parameters.
ParametersRangesMeanSTD
Age (years)22–3425.902.81
Height ( m )1.68–1.841.780.04
Weight ( k g )65.30–84.7073.524.93
Body Mass Index (BMI)20.73–27.0423.342.09
Hip-knee ( c m )50.00–60.0053.733.88
Knee-tibia ( c m )15.00–21.0717.291.09
Tibia-ankle ( c m )20.00–27.9322.891.52
Total length ( c m )80.00–107.0093.915.72
Table 2. Anthropometric table for a virtual subject 175 c m tall.
SegmentParametersDimension ( m m )
ThighFemoral length [25]482.0
Femoral head diameter [26]46.1
Neck width of the femoral head [26]24.1
Femoral diaphysiswidth [27]30.0
Femoral condyles width [28]81.4
Thigh diameter [29]191.0
Knee radius [29]125.4
LegTibia length [28]383.4
Tibia width ( 13 . 7 c m above ankle) [30]28.2
Tibia proximal epiphysis width [31]60.1
Tibia distal epiphysis width [31]43.6
Calf radius [29]119.7
FootFoot length [32]260.0
Foot height [33]81.2
Ankle height [33]127.9
Table 3. Initial and updated mechanical properties. E: Young modulus, D: Density.
Body Zones InitialUpdated
E M Pa D 10 3 k g / m 3 E M Pa D 10 3 k g / m 3
Trunk6001.006001.30
Cortical17,5002.1017,5002.10
Trabecular4501.804501.80
Soft tissues3451.206151.11
Table 4. Identification results: repeatability (Protocol 1). m: mean, std: standart deviation, CV: coefficient of variation.
ModeScoreFrequency ( Hz ) m ± std (CV%)Damping % m ± std (CV%)
1100%36.82 ± 0.98 (2.7)10.03 ± 1.73 (17.2)
260%42.26 ± 2.02 (4.8)7.5 4± 3.29 (43.7)
3100%49.48 ± 1.23 (2.5)7.04 ± 1.74 (24.7)
490%62.51 ± 2.68 (4.3)7.78 ± 2.19 (28.2)
530%71.30 ± 1.26 (1.8)4.81 ± 2.40 (49.9)
680%82.14 ± 2.60 (3.2)7.82 ± 1.26 (16.2)
7100%98.26 ± 3.16 (3.2)7.53 ± 2.33 (31.0)
890%122.89 ± 1.07 (0.9)2.58 ± 0.76 (29.3)
Table 5. Results of the modal identification on eleven subjects (Protocol 2).
ModeFrequency ( Hz ) m ± std (CV%)Damping % m ± std (CV%)
135.66 ± 1.00 (2.8)1.39 ± 0.97 (69.8)
243.24 ± 2.09 (4.8)7.28 ± 2.36 (32.4)
352.54 ± 2.05 (3.9)6.41 ± 2.35 (36.8)
461.99 ± 1.67 (2.7)5.16 ± 2.28 (44.2)
570.40 ± 1.60 (2.3)4.73 ± 1.57 (33.1)
684.06 ± 3.71 (4.4)4.46 ± 1.34 (30.1)
7100.38 ± 3.71 (3.7)3.52 ± 2.12 (60.1)
8118.94 ± 2.70 (2.3)1.60 ± 0.76 (47.7)
Table 6. Comparison between the confidence interval and the frequencies calculated by the numerical model.
FrequenciesMode 3Mode 8
Mean experimental frequencies ( Hz )52.54118.94
Confidence interval ( Hz )51.17–53.91117.13–120.75
Initial model ( Hz )54.55126.85
Updated model ( Hz )51.17120.70