1. Introduction
In most urban areas, there is an on-going increase in the number of vehicles on the road. For road authorities, taking measures to improve traffic efficiency and the safety of its participants is essential. Amongst research in this field [
1,
2,
3], studies on traffic theories [
3], models [
4], and traffic modelling for one- and two-way roads and also roundabouts appear to be the most promising. Such analyses are significantly facilitated by computer simulations [
5], which help to visualise the object of the research.
A roundabout is an intersection where traffic moves in a circle around a central island. According to roundabout traffic rules, vehicles approaching a roundabout must give way to vehicles already moving in the roundabout. Roundabout intersections help to solve number of the problems encountered by the traditional intersection which involves a major and a minor road. Roundabouts reduce the number of vehicle-vehicle and vehicle-pedestrian collision points at an intersection, which in turns helps reduce the number of accidents. Research studies conducted in the US have shown a drop in the number of accidents (by 29%) and injured persons (by 81%) as a result of implementing roundabouts [
6]. An important aspect of roundabouts implementation is making drivers slow down when approaching a roundabout, which results from the need to give way to vehicles already moving around the roundabout, and from the appropriate structure of a roundabout. Leaf and Preusser [
7] found vehicle velocity has a tremendous effect on the scale of injuries sustained by a pedestrian hit by a vehicle: slowing down from 48 km/h to 32 km/h means the pedestrian’s chances of surviving increase ninefold. In a study in Sweden [
8], major factors of roundabout safety were specified: the number of lanes in a roundabout, island diameter, and also traffic speed and intensity. The authors of the study argued that single-lane roundabouts are the safest, whereas large-radius roundabouts result in a higher permissible speed, which is positively related to the number of accidents. At the same time, a radius of less than 10 m is also problematic as it usually encourages drivers to accommodate the bend, and consequently drive almost straight on without reducing a reduction in speed.
Computer simulations are applied in roundabout traffic modelling to visualise the effects of layout changes. Simulations by their nature obtain information on a given system during the design stage. Computer simulation can also apply hypothetical conditions to a given system. They can provide an examination of the system operation in conditions which occur rarely and conditions yet to eventuate, such as the simulation of the effect of new traffic regulations). Simulation programs are based on mathematical models (traffic flows, multi-agent models, neural networks and cellular automata), which map the process and enable specification of input parameters that affect the simulation effectiveness. For example, Sisiopiku and Heung-Un Oh have determined, by means of a simulation, that roundabouts are particularly recommended in places where the traffic is evenly spread among the feeder roads, and also in places where there is a substantial amount of left-turn traffic (in the case of right-hand traffic) [
9]. The pair [
10] established factors that affect the capacity of roundabouts, and found that a three-lane roundabout is not necessarily preferable to a two-lane roundabout.
The mentioned examples of studies show that the focus of the research to date has been to ascertain whether a roundabout is preferable to a conventional intersection, and how many lanes in a roundabout is best to ensure optimal traffic flow. The majority of cities face a problem of chronic jammed streets and roundabouts notwithstanding the studies and road traffic regulations established. There have been numerous examples of drivers who fail to obey rules and cause congestion. The human factor is a significant variable any simulation of traffic.
The purpose of the current article is to determinate, based on computer simulation, whether road traffic reorganisation has an effect on roundabout capacity. The authors have developed a multi-lane roundabout model with multi-lane entrance and exit roads. The novelty of the model is the application of varied traffic principles, which contribute to the analysis of driver behaviour. Comparison of the existing roundabout traffic rules with the proposals presented in the studies reveals that roundabout capacity could be increased by over 15%.
The current publication is organised as follows: the following chapter is a review of previous studies, then there is a short note on the theoretical basis, the research problem and the developed model. Following this, simulation scenarios and experimental studies are discussed, and the article is concludes with a summary.
2. Related Works
2.1. Selected Hardware and Software Solutions
Road traffic analysis and modelling is a challenging task due to the complexity of the situation and its stochastic nature. Attempting to avoid inconveniencing the connected driver with attempts to adjust a specific area (e.g., an intersection or a roundabout), road administrators and researchers resort to simulation to determine best road solutions. The literature describes mathematical models and also software solutions and hardware solutions, as well as solutions combining hardware and software. The most numerous are software solutions, for example: MATSim (Multi-Agent Transport Simulation) [
11], VISSIM (Verkehr In Städten-SIMulationsmodell) [
12], TRANSIMS (TRansportation ANalysis SIMulation System) [
13], MITSIM (Massachusetts Institute of Technology SIMulation) [
14], AIMSUN (Advanced Interactive Micro-scopic Simulator for Urban Networks) [
15,
16], SUMO (Simulation of Urban MObility) [
17,
18] or CORSIM (CORridor SIMulation) [
19,
20], extensions of existing solutions [
21,
22], and multi-agent simulations [
23] regarding pollution [
24,
25] or driver behaviour [
26]. Some authors also focus their attention on solutions close to real-time simulations [
27]. Hardware solutions are broad. They include numerous scale models of selected road junctions [
28,
29,
30], hardware-in-the loop solutions [
31,
32], solutions presenting a scale model of a real object [
33] or GPU(Graphics Processing Unit)-based solutions [
34].
2.2. Selected Studies and Models of Road Traffic
The car-following theory, “follow-the-leader”, was developed in the late 1950s [
35]. The theory won many supporters and was applied whole-heartedly [
36,
37], particularly in relation to road traffic simulation [
38,
39,
40,
41,
42,
43].
Some of the studies based on car-following theory concentrated on finding a gap in a flow of vehicles moving around a roundabout, which makes it possible for a waiting vehicle to enter the roundabout from a feeder road (the so-called gap-acceptance model) [
44,
45,
46,
47]. The main limitation of the gap-acceptance theory is an assumption that drivers behave in a predictable way, whereas in reality behaviours are slightly different, e.g., resulting from ignorance or intentional disobeying of the rules [
48]. The issue was also addressed by more contemporary researchers [
49,
50,
51]. Some more recent directions in research studies have been application of cellular automata in the modelling of unloading bays [
52] and exploitation of game theory in order to shorten the time autonomous vehicles wait to enter roundabouts [
53].
2.3. Selected Basic Traffic Models Based on Cellular Automata
Cellular automata are perfect for traffic flow modelling due to their stochastic nature. The Nagel–Schreckenberg (N–Sch) model is a simple model of cellular automata to simulate car traffic. It was developed in 1992 by Nagel and Schreckenberg [
4]. The model describes the single-lane car traffic and it is the basis for testing various traffic scenarios [
54]. Schreckenberg created a project to inform drivers from Cologne, Aachen and Bonn about traffic jams on the road. Development and utilization of the model enabled the prediction of traffic congestion and notification of the drivers. Another proven framework is the model developed by Biham [
55]. It is a simple cellular automaton model displaying the traffic in two intersecting directions. Each array cell can be occupied with a vehicle travelling in one of the two directions (north or east). The vehicle moves by one cell in the chosen direction, if that the adjacent cell is empty. Otherwise, the vehicle remains in place. The most important model showing traffic within the intersection is the model by Chowdhury and Schadschneider [
56]. The authors model the traffic in one-way single-lane roads. The development of the model to the version for two-lane and two-way roads is presented in another study by Małecki and Iwan [
21]. The new model expands the original idea of the intersections with the mechanism of induction loops activating traffic light to eliminate congestion, namely to keep smooth traffic flow at the intersection. Phenomena taking place in 4-way intersections were addressed in Ławniczak and Di Stefano [
57]. An interesting modification of the N–Sch model is presented by Hartman [
58], regarding urban traffic simulation.
Cellular automata are an effective tool for the analysis of actual behaviours [
59,
60]. Cellular automata have been applied to describe traffic jams [
61], queue lengths before intersections and roundabouts [
10,
62] and to compare the capacities of various road solutions [
63], as well as to study drivers’ behaviours and to provide references for traffic design and management at roundabouts [
64].
2.4. Roundabout Cellular Automaton (CA) Models
The rules of the traffic in a roundabout were dealt with in Belz et al. [
65]. The work involved developing a model of a cellular automaton for capture of priority-taking and priority-abstaining behaviours in roundabouts.
A number of publications have addressed single-lane roundabout modelling [
66,
67,
68]. The topics studied have included study road traffic dynamics in roundabouts [
69], and the study of probability of road accidents [
70,
71]. The current publication focuses on developing a model for multi-lane roundabouts. It adds to previous studies in the field [
40,
72,
73]. However, earlier studies failed to address the impact of traffic reorganization in the way the current article does. The authors of the earlier studies investigated the correlation between roundabout size and its capacity. The current paper is the first to examine the approach consisting in changing the traffic rules at roundabouts of a specified size, and its effect on the roundabout capacity. Roundabout traffic reorganisation is presented in the subsequent simulation scenarios described in the further parts of the article.
3. Proposed Approach
3.1. Theoretical Background
The generalised CA roundabout traffic model for a multi-lane roundabout with multi-lane feeder roads was developed based on the Nagel–Schreckenberg model [
4] and its modified version by Hartman [
58]. The original traffic model (N–Sch) was developed for the purposes of motorway traffic simulations. The length of the automaton single cell was assumed to correspond to 7.5 m of the road, which represents an average length of a car together with its surrounding space. The velocity unit in the N–Sch model corresponds to the actual speed of 27 km/h. In order to reflect actual urban traffic, using Hartman [
58], vehicles were classified according to their length and the number of cells taken up by them (
Table 1). The length of the automaton single cell corresponds to 2.5 m of the actual road. This translates into the velocities of moving vehicles (
Table 2).
3.2. Research Problem
Studies have been focused on determining the optimum number of lanes in a roundabout in order to greatest capacity. The authors of the current article approach the issue in a different way, by formulating the following thesis: traffic rule modification may lead to the increase of roundabout capacity without changing the roundabout structure. To prove the thesis, the author has analysed the roundabout traffic, developed a model and run experimental studies.
The roundabout traffic analysis was performed based on several month long observations of traffic at various roundabouts, including large and small, single-lane as well as 2- or 3-lane ones. The observations revealed that excessive congestion was found in the outer lane of a roundabout, while the occupancy of the inner lane (in the case of 2-lane roundabouts) or of the inner and middle lanes (in the case of 3-lane roundabouts) was moderate.
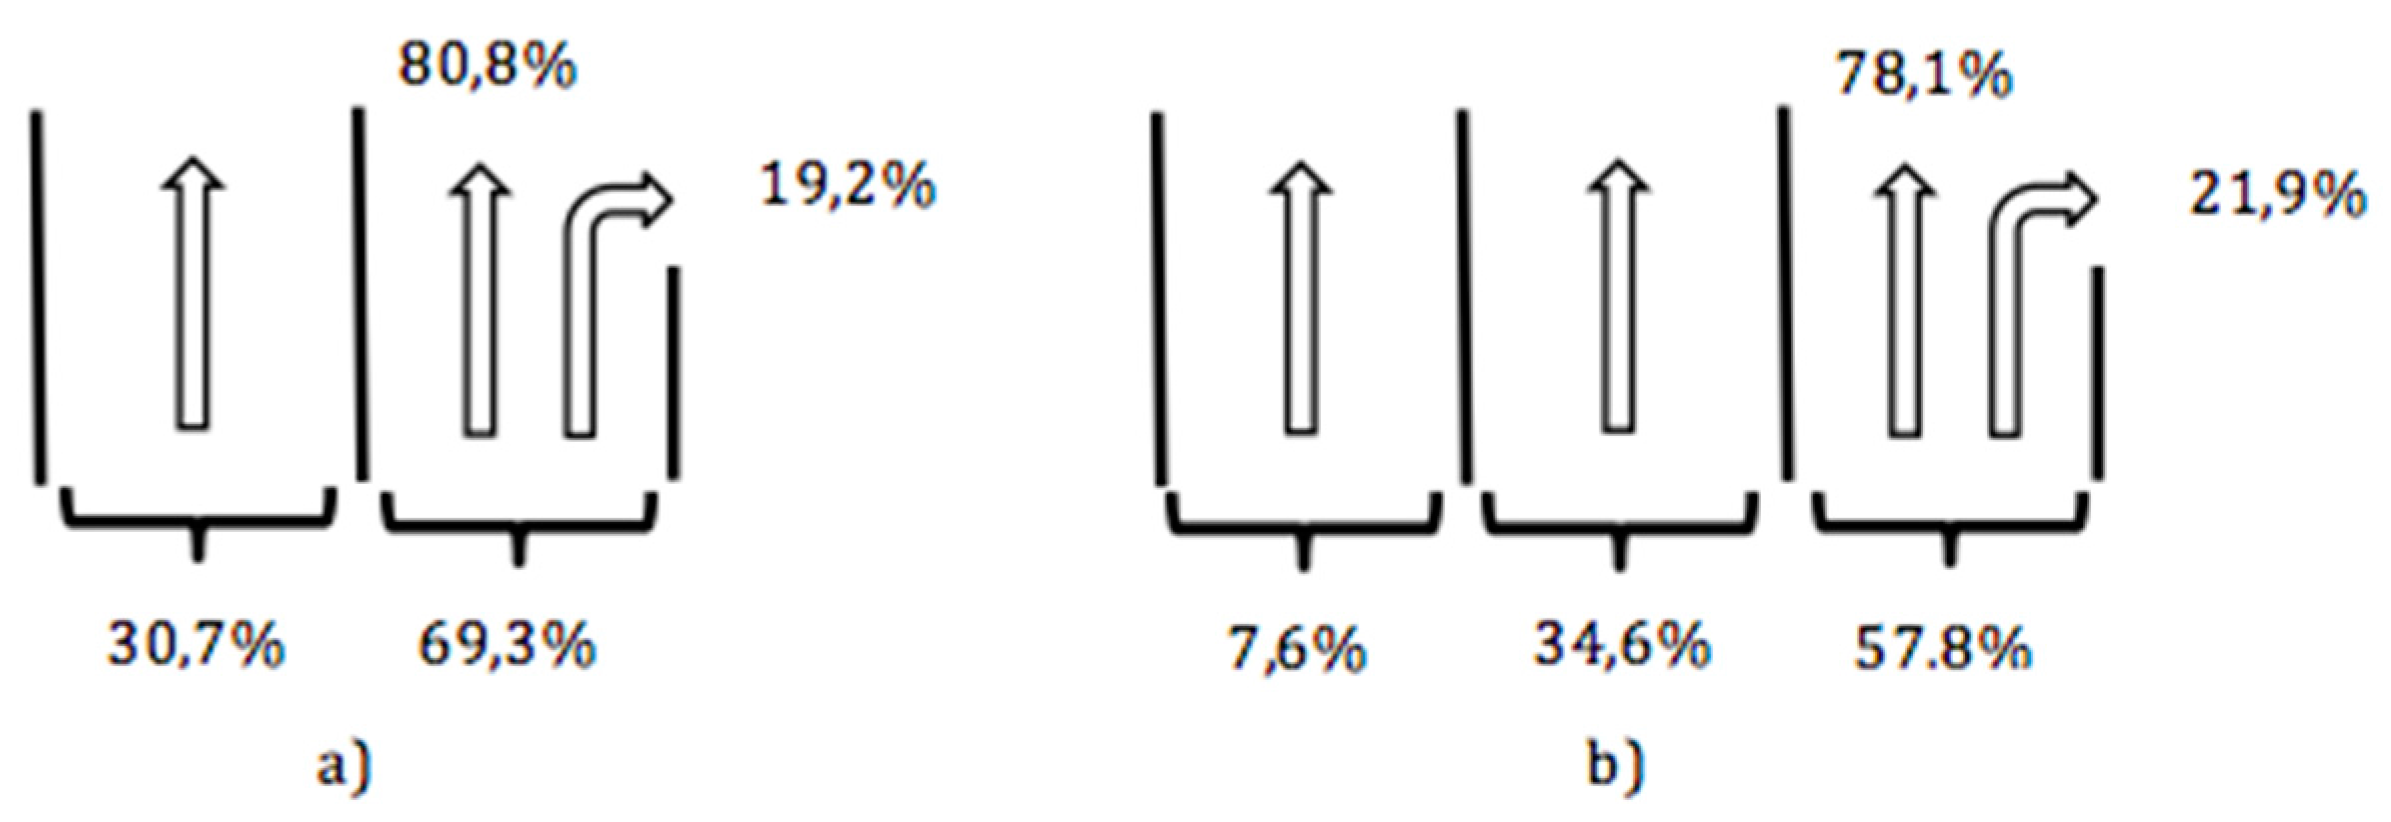
Figure 1 presents averaged results of the observations, providing numeric values regarding the mean quantity of vehicles that entered the roundabout directly into the outer lane and those which did not take the first possible exit even though they were moving along the outer lane. The analysis shows that in the case of 2-lane roundabouts as many as 69.3% of the drivers entering the roundabout get into the outer lane and then only 19.2% of them take the first possible exit. In the case of 3-lane roundabouts, the values were 57.8% and 21.9%, respectively. The other drivers (80.8% and 78.1%) continue driving in the outer lane up to the subsequent exit or further.
Pursuant to regulations, such behaviour is legal in most countries. However, the roundabout traffic observations have revealed that such behaviour causes an unnecessary restriction of vehicles queuing in feeder roads to enter the intersection (especially when the distance between the adjacent entrances is small). The above defined thesis may be further specified by stating that a reduction in the occupancy of the outer lane of a roundabout may increase the chances for the queuing vehicles to enter the roundabout, and increase its capacity. Shorter queues of waiting vehicles also provide the benefits of lower emissions and reduced local pollution.
3.3. The Data Set and the Simulation Setup
The data used for calibration and validations of the model were obtained during a comprehensive traffic study in Szczecin, Poland, during which the city area was divided into 255 communication areas. The boundaries of communication divisions were along major roads, rivers and other traffic barriers. Traffic surveys were conducted. Interviews were conducted with truck drivers and traffic volume and traffic pattern were measured. The following information was collected: the generic structure of vehicles (passenger cars, vans, minibuses, trucks without trailers, trucks with trailers and semi-trailers), and number of people in the vehicle. For external areas of the city, the country of origin of the vehicle, the source and destination of the journey, the frequency of the journey and the motives of the journey were also ascertained. The survey was conducted on weekdays from 6 a.m. to 10 p.m.
The field data provided information on the average number of vehicles passing through the roundabout (
Table 3).
Based on the data obtained, the number of vehicles in the model was set at 500 vehicles per hour (average value resulting from the table is 481.5).
3.4. Assumptions of the Roundabout Traffic Model
The model was prepared so as to enable traffic flow simulation on a multi-lane roundabout with multiple entrance and exit roads. The model describes right-hand traffic.
The lanes on the roundabout are numbered from 0 (inner lane) to
, where
corresponds to the total number of lanes on the roundabout. The feeder road consists of the entrance road and the exit road. The right-hand lane of the entrance road and the right-hand lane of the exit road are to first lanes to be numbered starting from zero. The right-hand lane is the lane on the right-hand side from the point of view of a driver travelling on the road in the given direction. Due to different lengths of the roundabout lanes, it is impossible to divide them into the same number of cells. Assuming that the cell length is constant and amounts to 2.5 m, the outer lanes will have more cells than the inner ones, reflecting the actual differences in the lanes lengths. The lane length, taking its inner (shorter) edge, may be determined using the formula:
where
is the lane length,
is the island radius,
is the subsequent lane number, starting from the inner lane numbered 0, and
is the single lane width.
The developed model posits that the width of each lane
is the same. By parameterising the model in relation to the actual size of the roundabout, the number of cells in each lane is determined in relation to its length:
The resulting value is rounded down, as the number of cells making up a lane must be an integral number. Assuming that the radius of a sample roundabout amounts to , and the lane width is , the number of cells on subsequent lanes will then be, respectively: and . The outer lane will be divided into 81 cells, and the inner lane into 70 cells.
Distance from the exit. If the cells in the roundabout lane are numbered with subsequent values from the range
, the distance to the nearest exit
may be computed using the formulas:
Distance from the entrance. As the cells in the entrance road are numbered with subsequent values from the range , the distance of the simulated vehicle from the entrance into the roundabout equals the difference between the cell connected with the roundabout and the cell currently containing the front of the vehicle .
Calculation of the cell value in the subsequent iteration for vehicles entering and exiting the roundabout is dependent on information on adjacent cells. Adjacent cells are those which link the feeder road with the roundabout internal road. Adjacency does not need to be of the first degree. For example, cells in the inner lane of the roundabout are not directly adjacent to any cell in the feeder road. However, there are cells located between the aforementioned cells which link the two lanes and enable movement of vehicles. When a vehicle exits the roundabout, an adjacent cell is the last one which the vehicle covers on its lane before moving into a cell located in the feeder road lane. Depending on the lane on which the vehicle is located and the lane onto which it is going to move, these will be different cells corresponding to the natural turns taken by vehicles. The values of CA cells from which vehicles may exit the roundabout are determined by the formula:
where
is the cell from which a vehicle may exit the roundabout,
is the quantity of cells in the roundabout lane in which the vehicle is travelling,
is the multiplier depending on the road, N(North)-1, E(East)-2, S(South)-3, W(West)-4,
is the the exit lane, symbol
denotes rounding to an integral number.
For the vehicles entering the intersection, an adjacent cell is the first one into which the vehicle moves upon entering the roundabout. The interdependence is shown by the formula:
where:
is the cell taken up by a vehicle upon entering the roundabout,
is the quantity of cells in the roundabout lane in which the vehicle is travelling,
is the multiplier depending on the road, N-1, E-2, S-3, W-4, and
is the entrance lane.
3.5. Simulation Scenarios
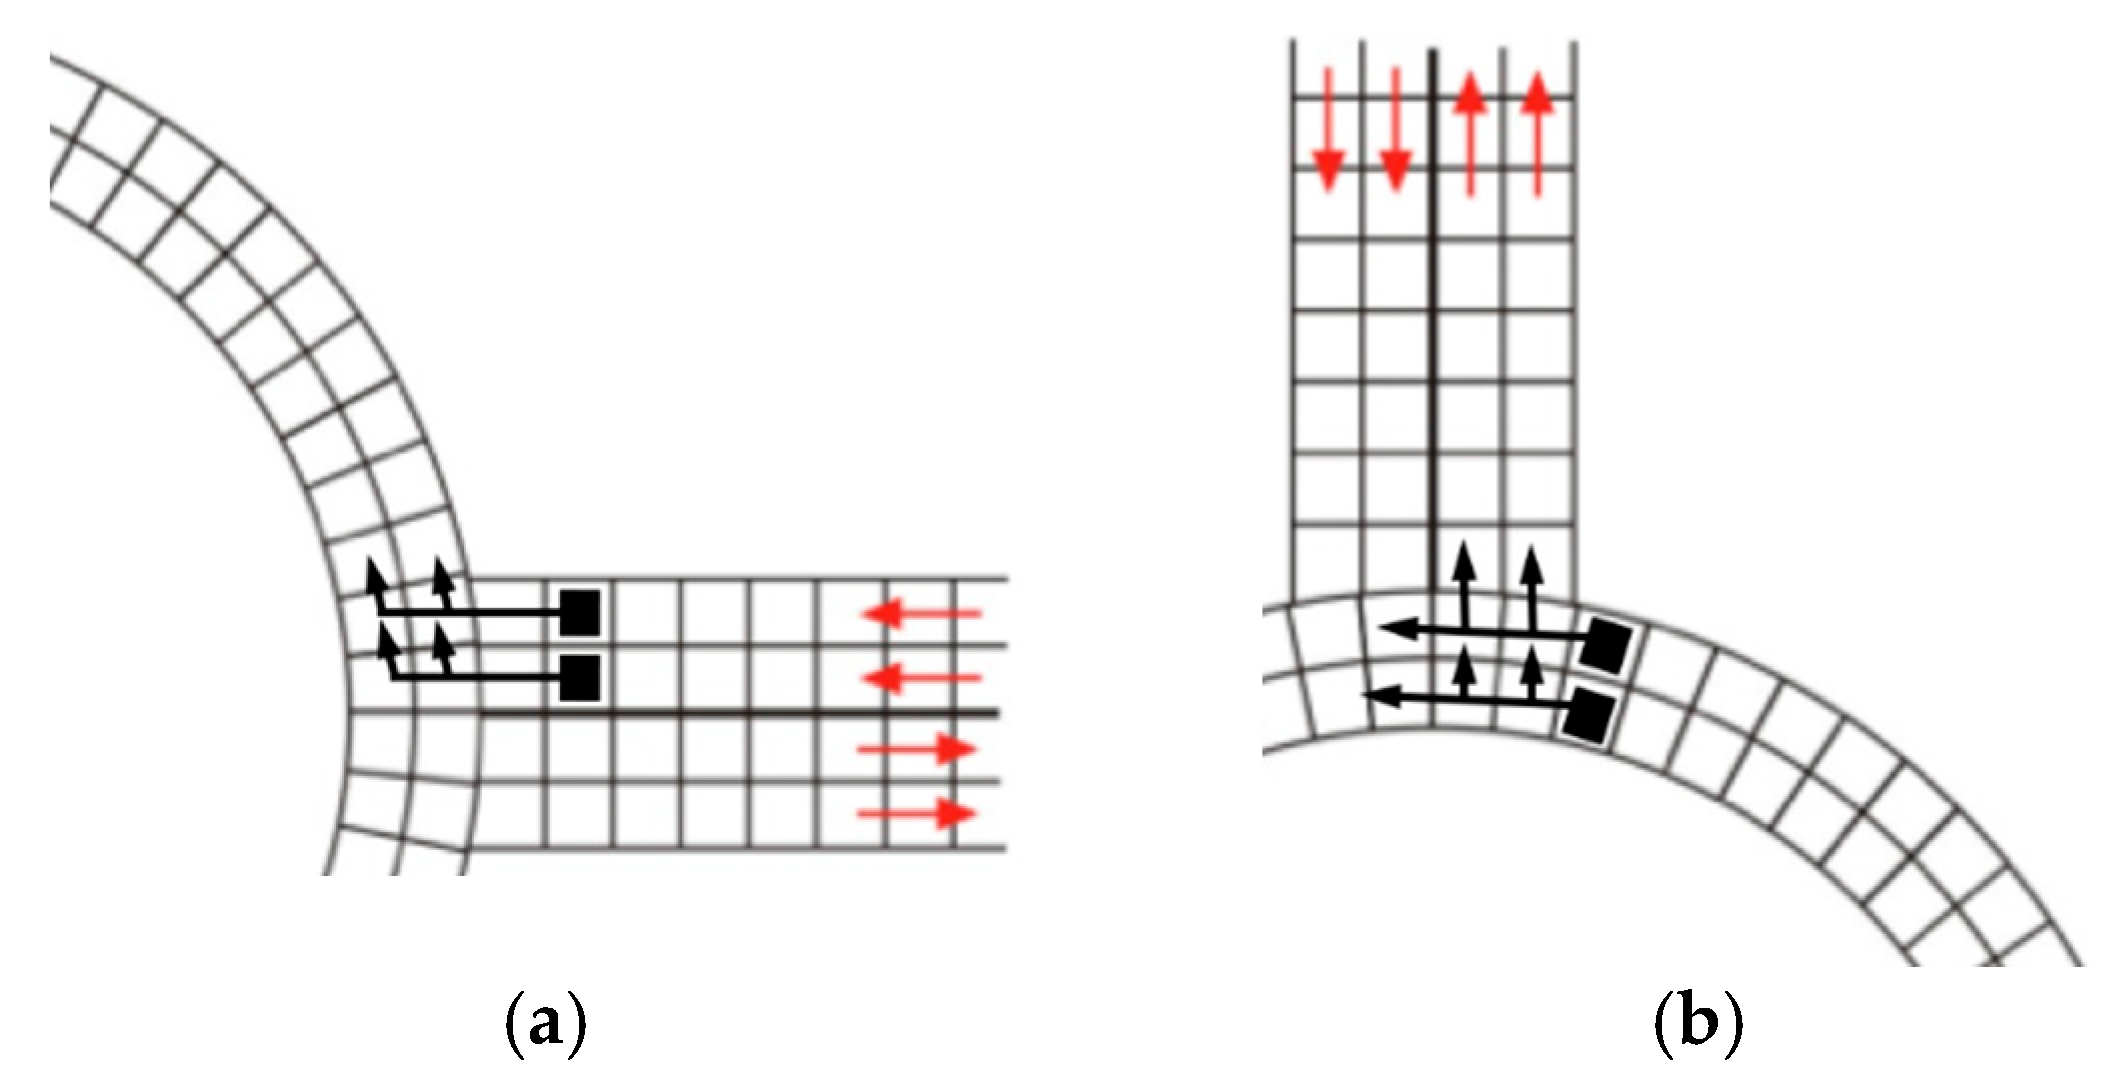
Figure 2 shows the possible trajectories of vehicles that enter and exit the roundabout. The observations of roundabouts have revealed that a possibility of taking up any lane in a roundabout causes a risk of collision. When a vehicle entering a roundabout from the right-hand lane of a feeder road takes up the inner lane of the roundabout, it prevents the vehicle on the left-hand side from entering the roundabout. The event leads to temporary blocking of the vehicles located in the left-hand lane. Additionally, when exiting the roundabout, the driver in the outer lane of the roundabout is more privileged. As a result, drivers tend to choose the right-hand lane as “safer”, i.e., the lane in which the driver always has right of way (
Figure 1), which consequently leads to excessive occupancy of the outer lane of a roundabout while the inner lanes are under occupied.
Scenario 1 (
Figure 2) shall be the reference scenario. The subsequent scenarios will refer to Scenario 1 in the comparative aspect.
The proposed traffic scenario (Scenario 2) is as follows: the vehicle in the right-hand lane of the feeder road should take up the outer or middle lane (in the case of 3-lane roundabouts), whereas the vehicle in the left-hand lane of the feeder road should go into the inner or middle lane, giving way to the vehicle on its right-hand side in cases where both of them are trying to get into the middle lane. The tested scenario results in a greater quantity of vehicles simultaneously entering the roundabout (
Figure 3).
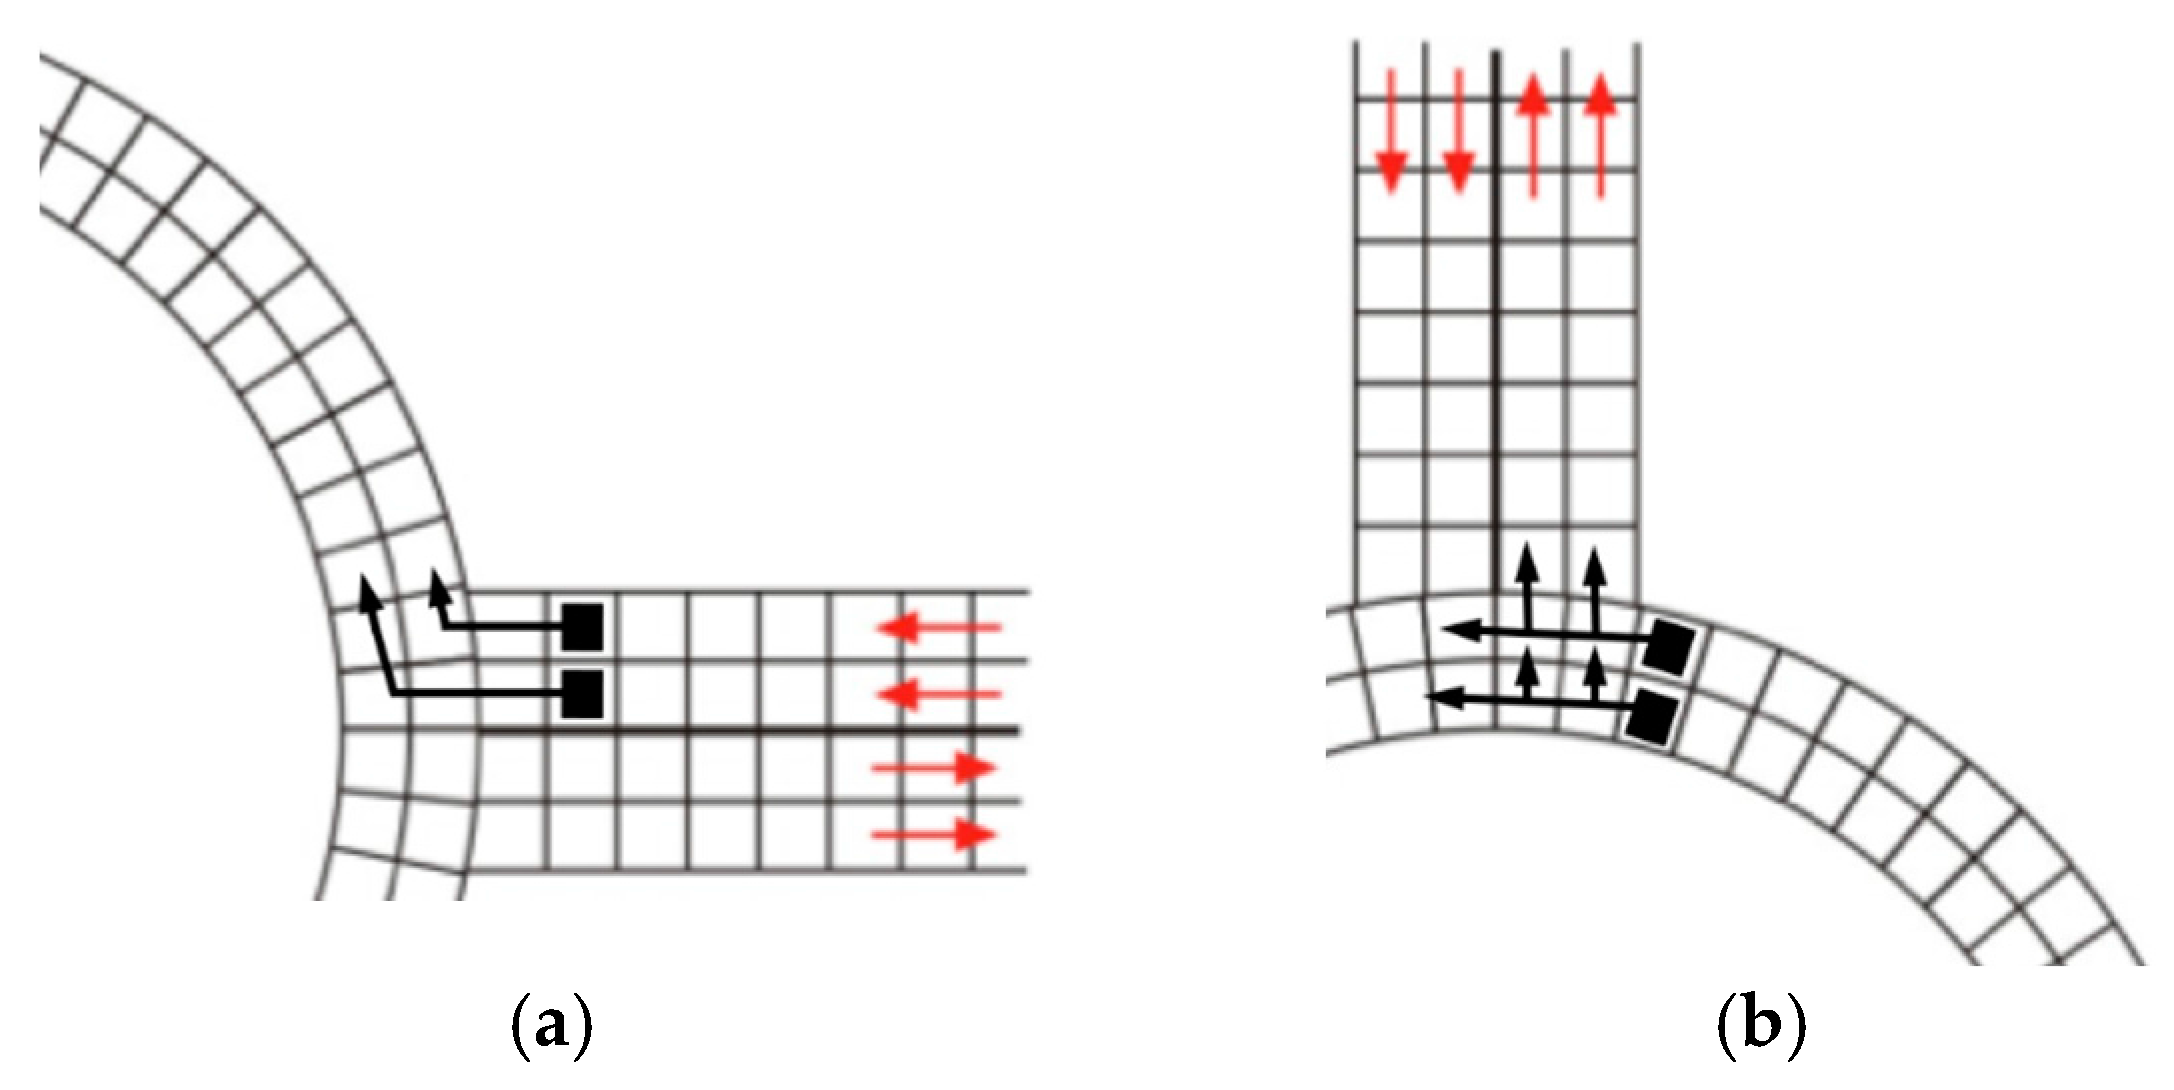
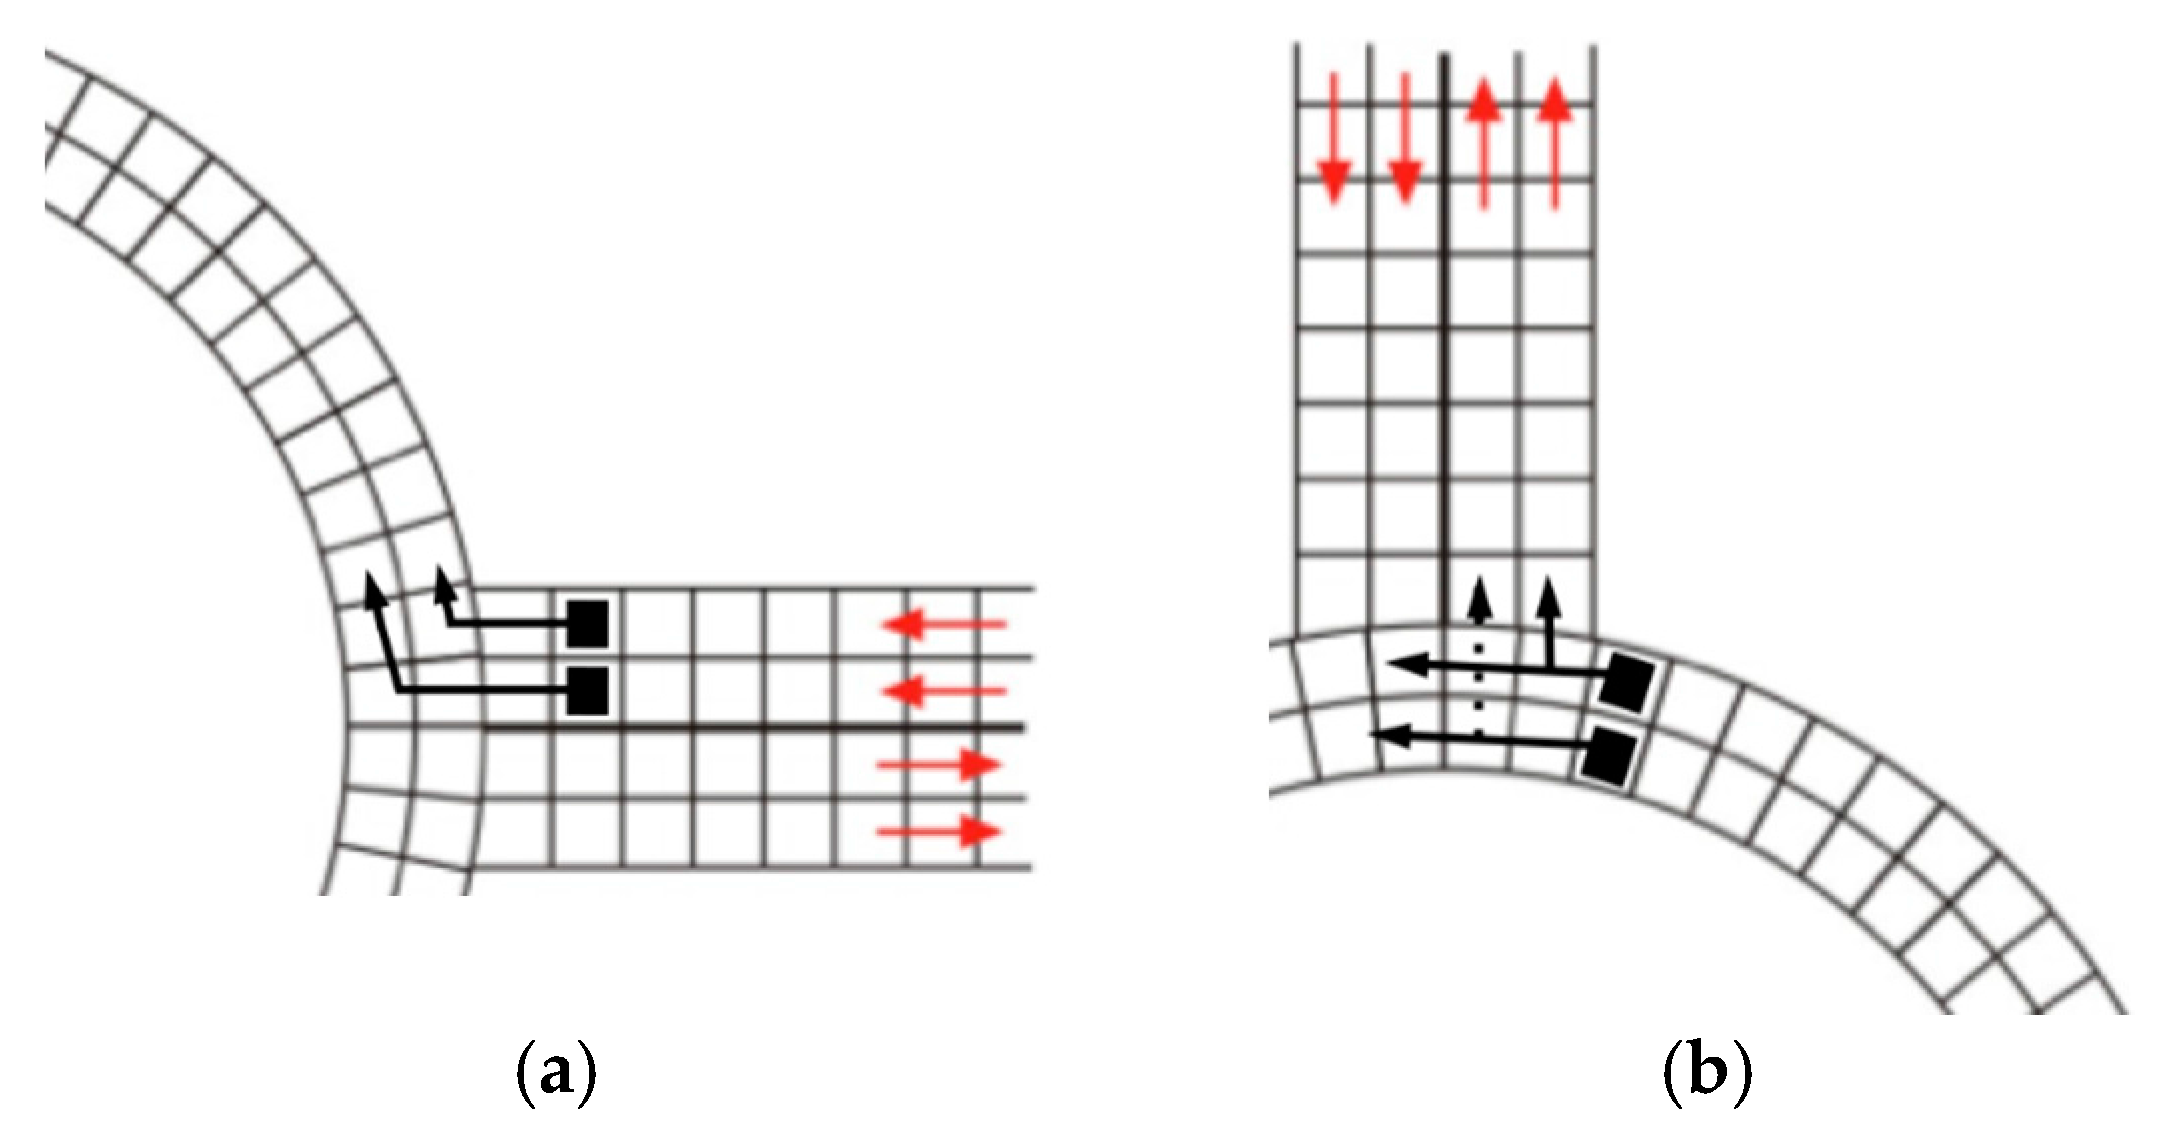
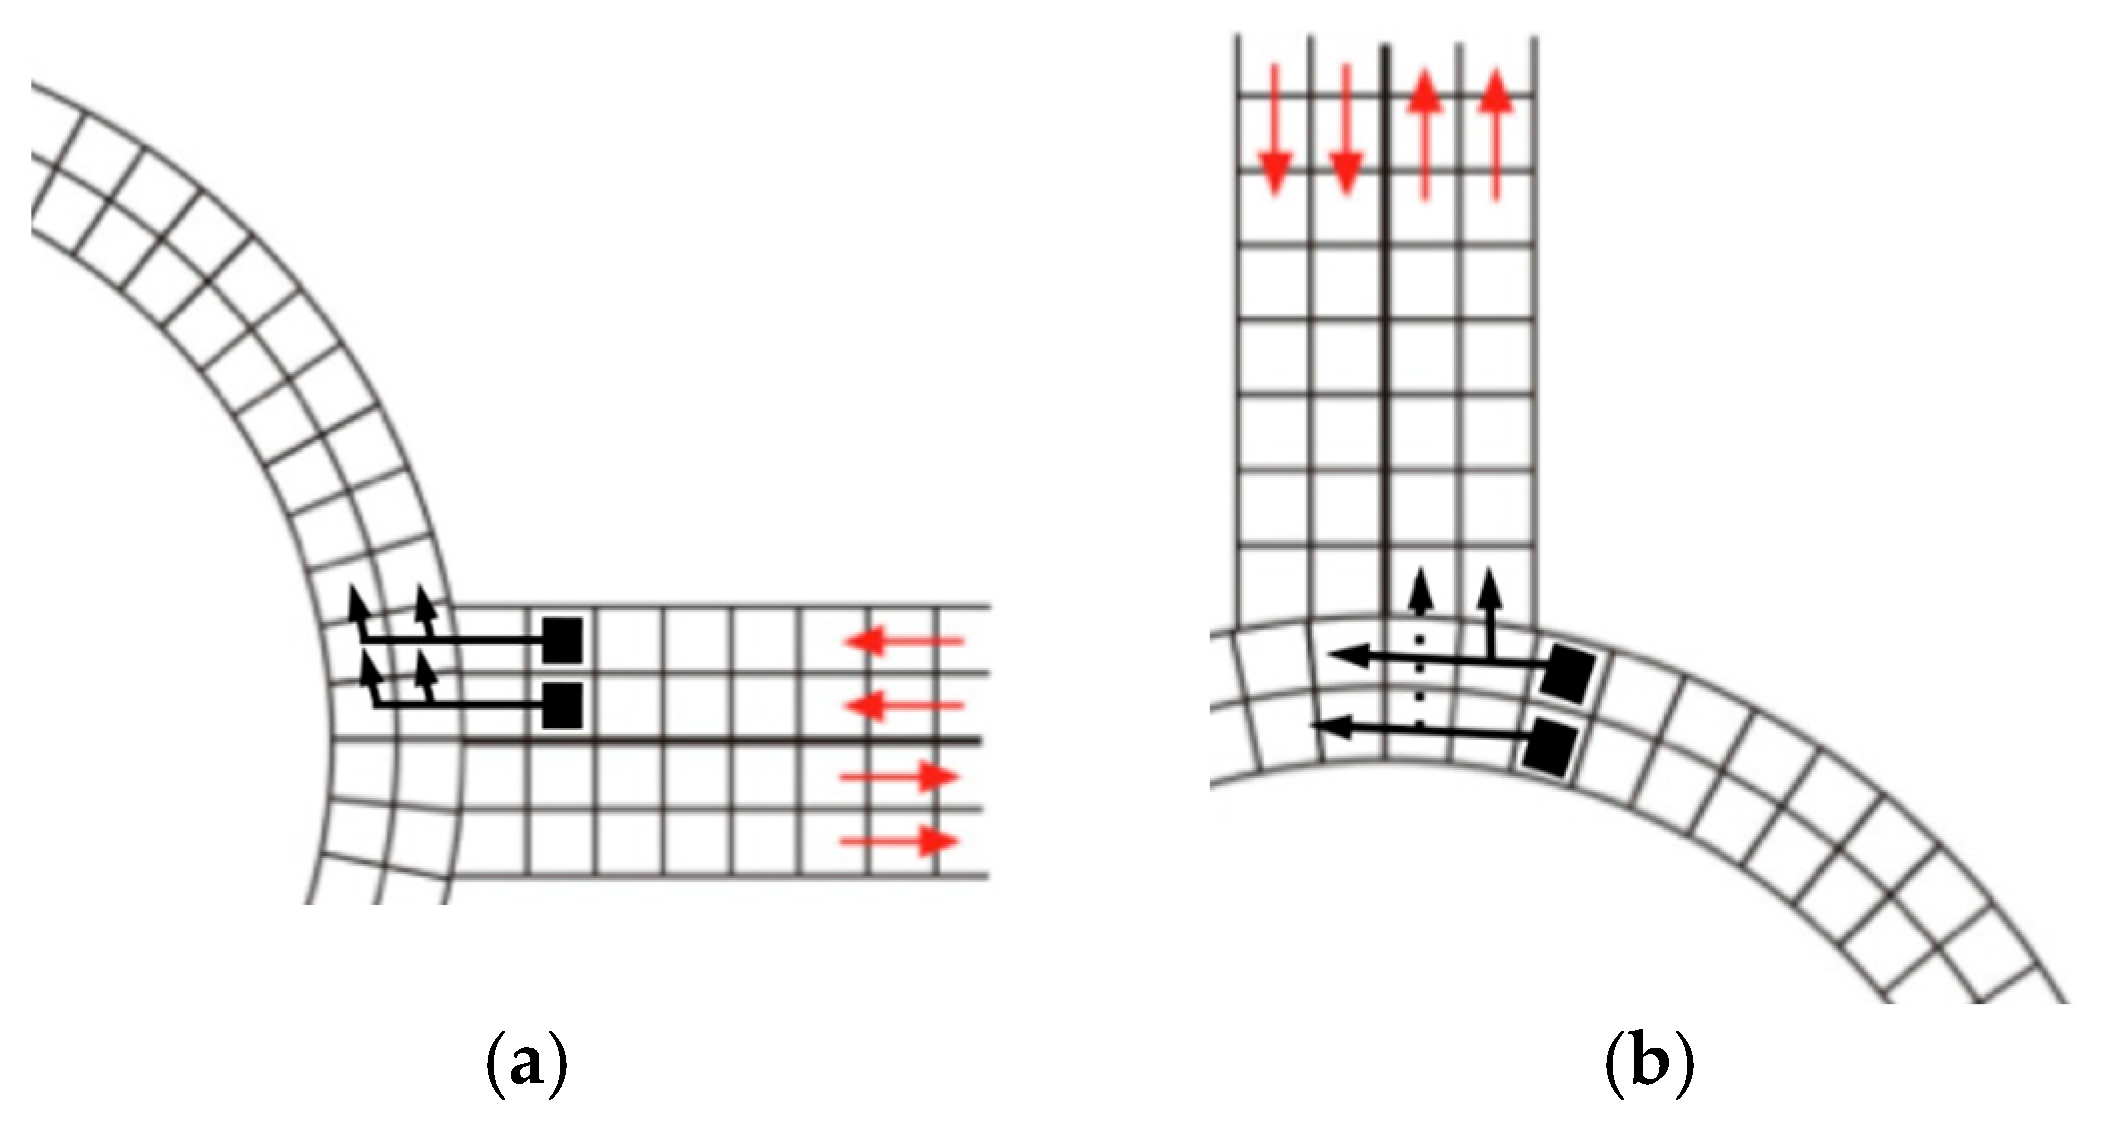
Pursuant to the current EU regulations, a vehicle exiting a roundabout from the outer lane may take up any lane of the exit road, whereas the vehicle moving along the inner lane has to yield to it (
Figure 4b: vehicle whose trajectory is marked with a dotted line). It may be hard for the driver moving along the inner lane to assess whether the driver on the right-hand side is driving straight on or moving into the outer lane. The proposed traffic scenario (Scenario 3) is as follows: the vehicle in the outer lane may take up the right-hand lane of the exit road, and the vehicle in the inner lane may take up the left-hand lane of the exit road, giving way to the vehicle on the right-hand side which is driving straight.
The tested scenario is for two cars exiting the roundabout simultaneously, if they are taking the same exit (
Figure 4b), provided that the entrance into the roundabout is compliant with Scenario 1.
The fourth analysed traffic scenario (Scenario 4) is a combination of Scenario 2 and Scenario 3. The tested scenario is of two vehicles entering the roundabout simultaneously and exiting the roundabout simultaneously in the same direction (
Figure 5).
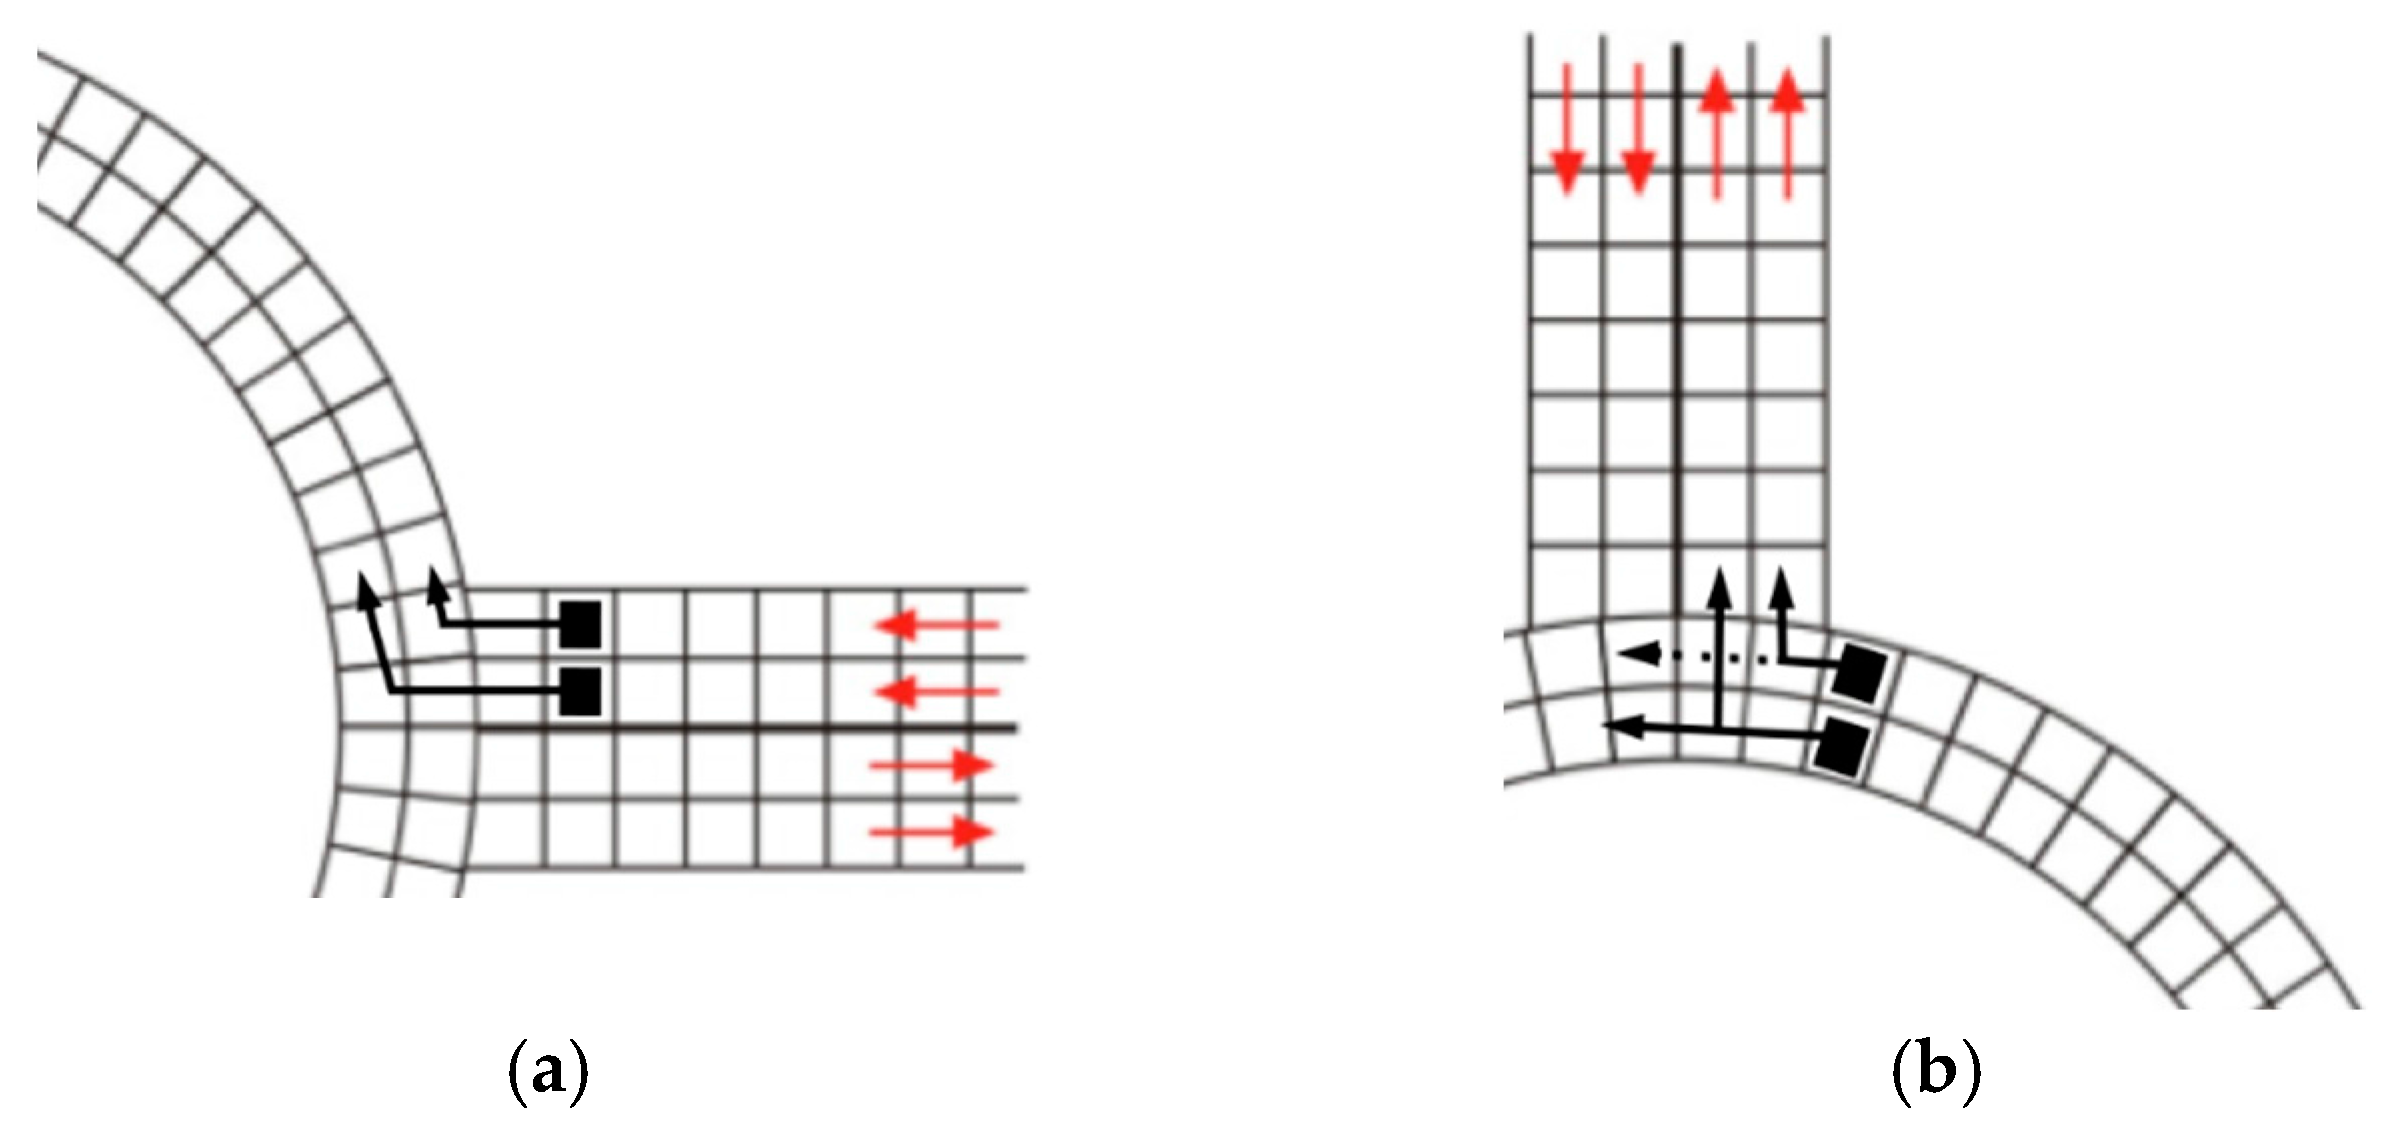
The last of the examined scenarios (Scenario 5) regards roundabout traffic reorganisation (
Figure 6). The vehicles travelling along the outer lane of the roundabout have to yield to the vehicles driving on the left-hand side, which are exiting the roundabout (
Figure 6b: vehicle whose trajectory is marked with a dotted line). The experiment is motivated by the fact that drivers of the vehicles on the right-hand side are better able to see the manoeuvres of the vehicles driving on the left-hand side (in the case of right-hand traffic). Additionally, the scenario also applies the previously proposed changes regarding entering and exiting a roundabout, considered in Scenario 4.
3.6. The System Developed for the Simulation
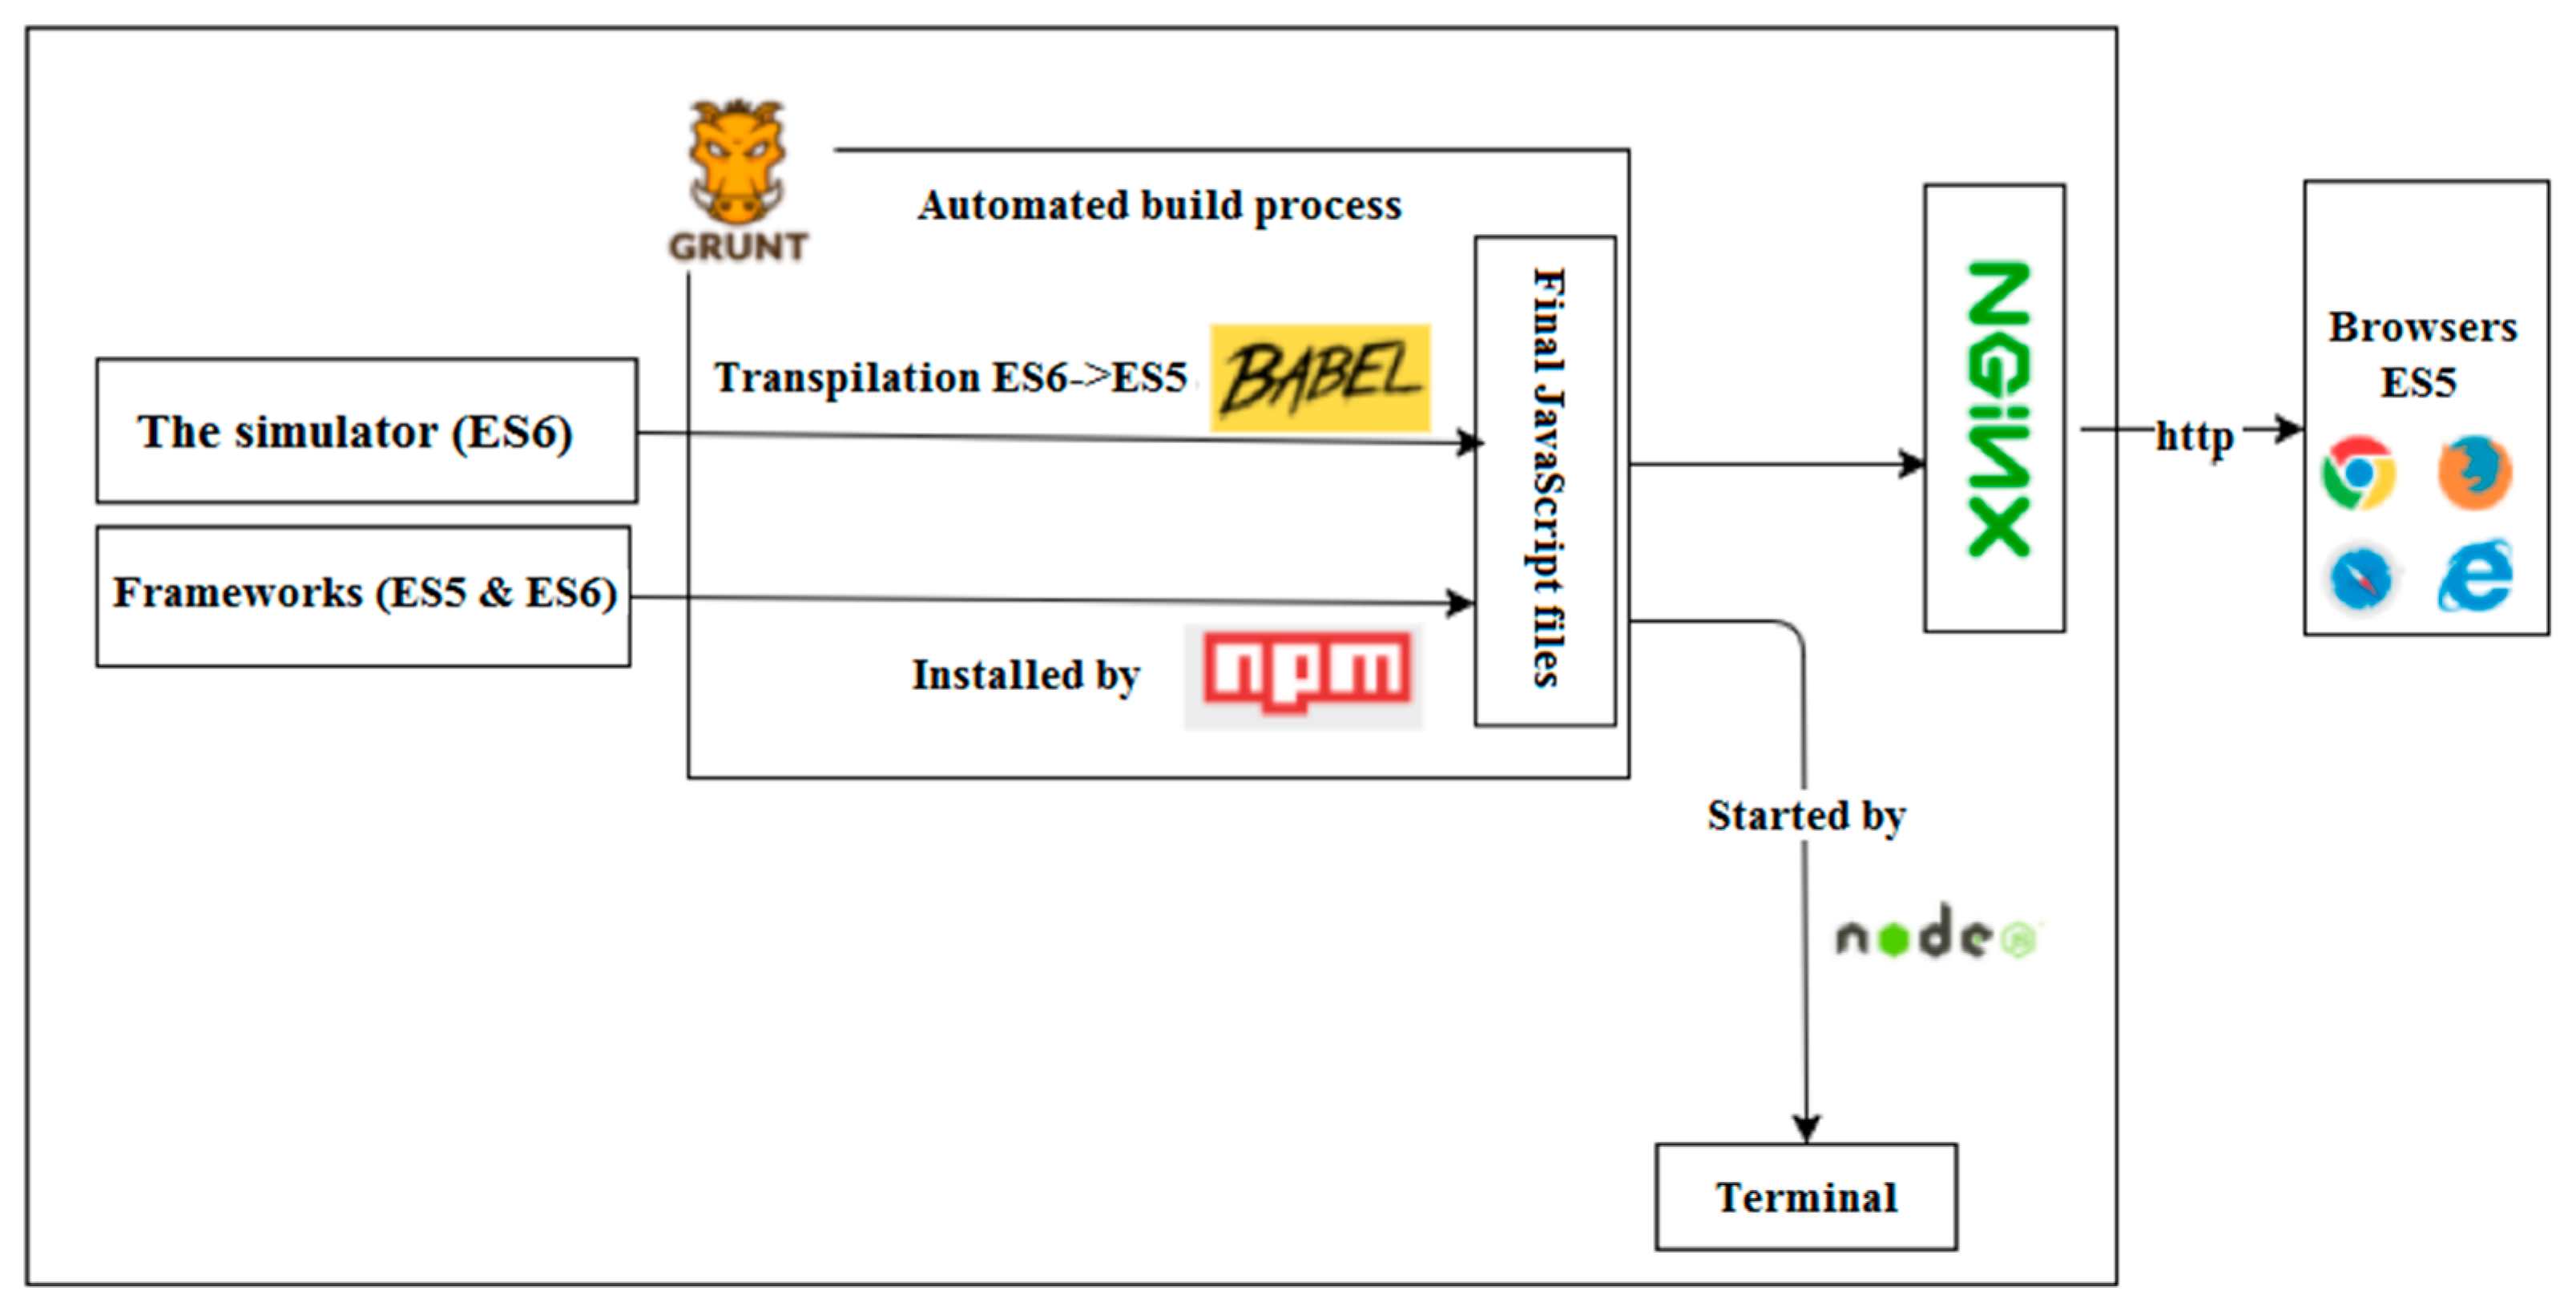
The application was developed in JavaScript and it can be operated in web browsers as well as by means of a console. Running the application by means of a console is possible via a Node.js runtime environment based on a V8 engine in the Chrome browser. Running the application in such a way is faster, as the program can operate without the graphics layer. The application makes use of many free tools enabling the programming works.
Figure 7 shows the structure of the application together with the tools applied.
Frequent problems with running the application are due to different runtime environments. The problems are solved by the combination of Vagrant and Ansible tools. Vagrant enables management of virtual machines, offering identical runtime conditions for applications. Ansible is used to ensure that the virtual machine is always equipped with any indispensable libraries. Upon starting, the program compares the current state of the machine with the expected one and carries out any necessary setups. Before that, it is necessary to prepare the configuration files that define the dependencies.
The application is written in accordance with the latest standards of ECMAScript 6. To enable correct operation of the application in web browsers, the Babel transpiler was used to change the code into the one compliant with ECMAScript 5. The process of transpilation and providing the application to the www server was automated by means of the Grunt program.
4. Results of the Experimental Studies
The object of the simulation experiment was to check whether roundabout traffic reorganisation has an effect on the roundabout capacity. A study was performed to find out the impact of an increasing number of trucks on roundabout traffic in order to make a reliable choice of the best configuration of regulations. The study accounted for the sizes of such vehicles and their limited technical and physical capabilities, such as e.g., slow acceleration, or low manoeuvring speed.
The experiments were conducted in a 2-lane roundabout with four feeder roads, for right-hand traffic. Each feeder road consists of the entrance road and the exit road, each with two lanes. The roundabout island diameter amounted to
. The roundabout capacity was examined on the sample of 500 vehicles, by measuring the number of iterations needed for moving all the vehicles through the roundabout, and using the formula:
where
is roundabout capacity,
is the number of vehicles that have driven across the roundabout (500), and
is the number of CA iterations.
The simulation was repeated 1000 times in order to obtain results that are not distorted by random events. The quantity of vehicles in the feeder roads was even. The entrance road for each vehicle was assigned at random with the same probability (25%). The exit road was assigned at random by the programme in the same manner. The entrance and exit roads had two lanes, so the individual lanes were assigned to the vehicles at random. The probability of assigning a given exit lane depended on the examined traffic rules and the roundabout lane on which the vehicle was travelling. In Scenario 1 the vehicle was able to take either of the two lanes in the exit road, if it was moving along the outer lane. In the case the probability of choosing either lane in the exit road was 0.5. If the vehicle was moving along the inner lane of the roundabout, it was able to take the left-hand lane only, and the probability of choosing the left-hand lane was 1. Selection of lanes in the roundabout was made on the same principles, if the principles made it possible to take any lane, the probability was , while for a 2-lane roundabout it was 0.5. In the case of random assigning of the entrance lane, the probability was always 0.5 in all the scenarios. The experiments were run assuming mixed traffic, with 90% of cars (including motorcycles), and 10% of trucks. An exception was the examination of the impact of the number of trucks on the roundabout capacity. Then the quantity of trucks varied.
4.1. Examining the Impact of the Proposed Changes on the Roundabout Capacity
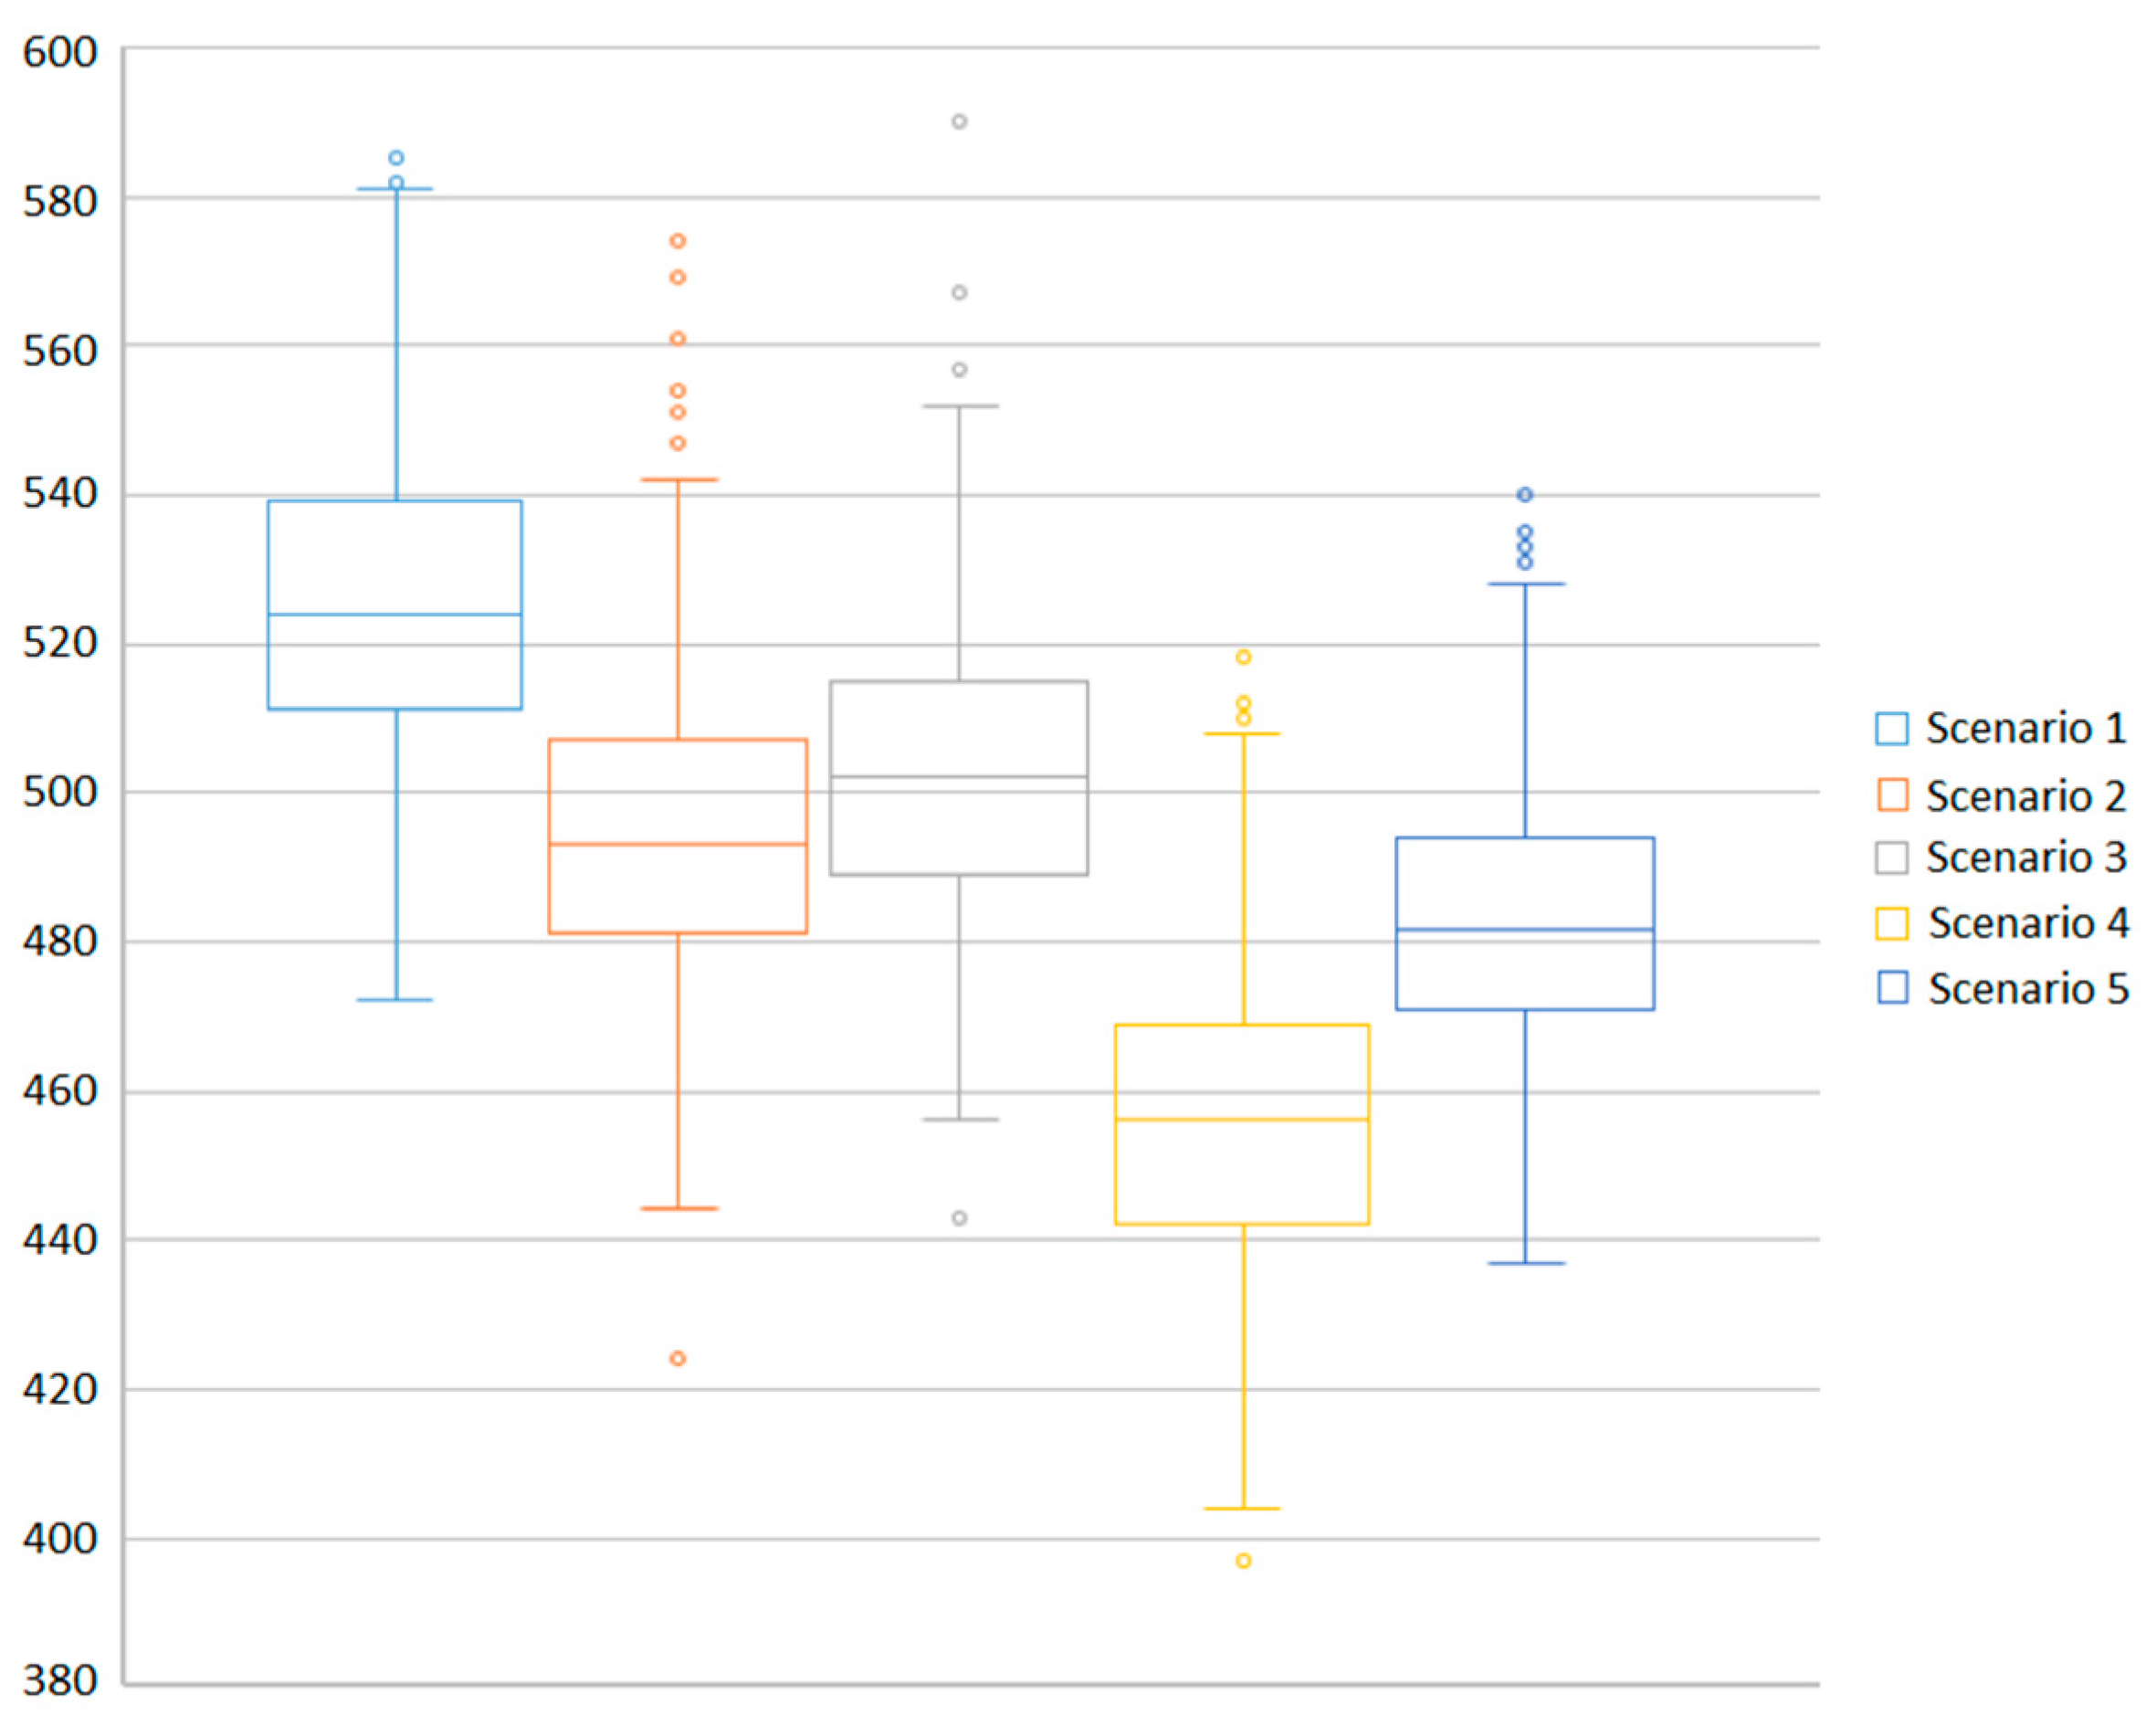
Table 4 presents the results of the experiment aimed at examining the impact of different forms of roundabout traffic reorganisation on the roundabout capacity. The mean and median values for the number of iterations have been rounded to integral numbers. The values are similar with each other, which meant that the results were absent outliers.
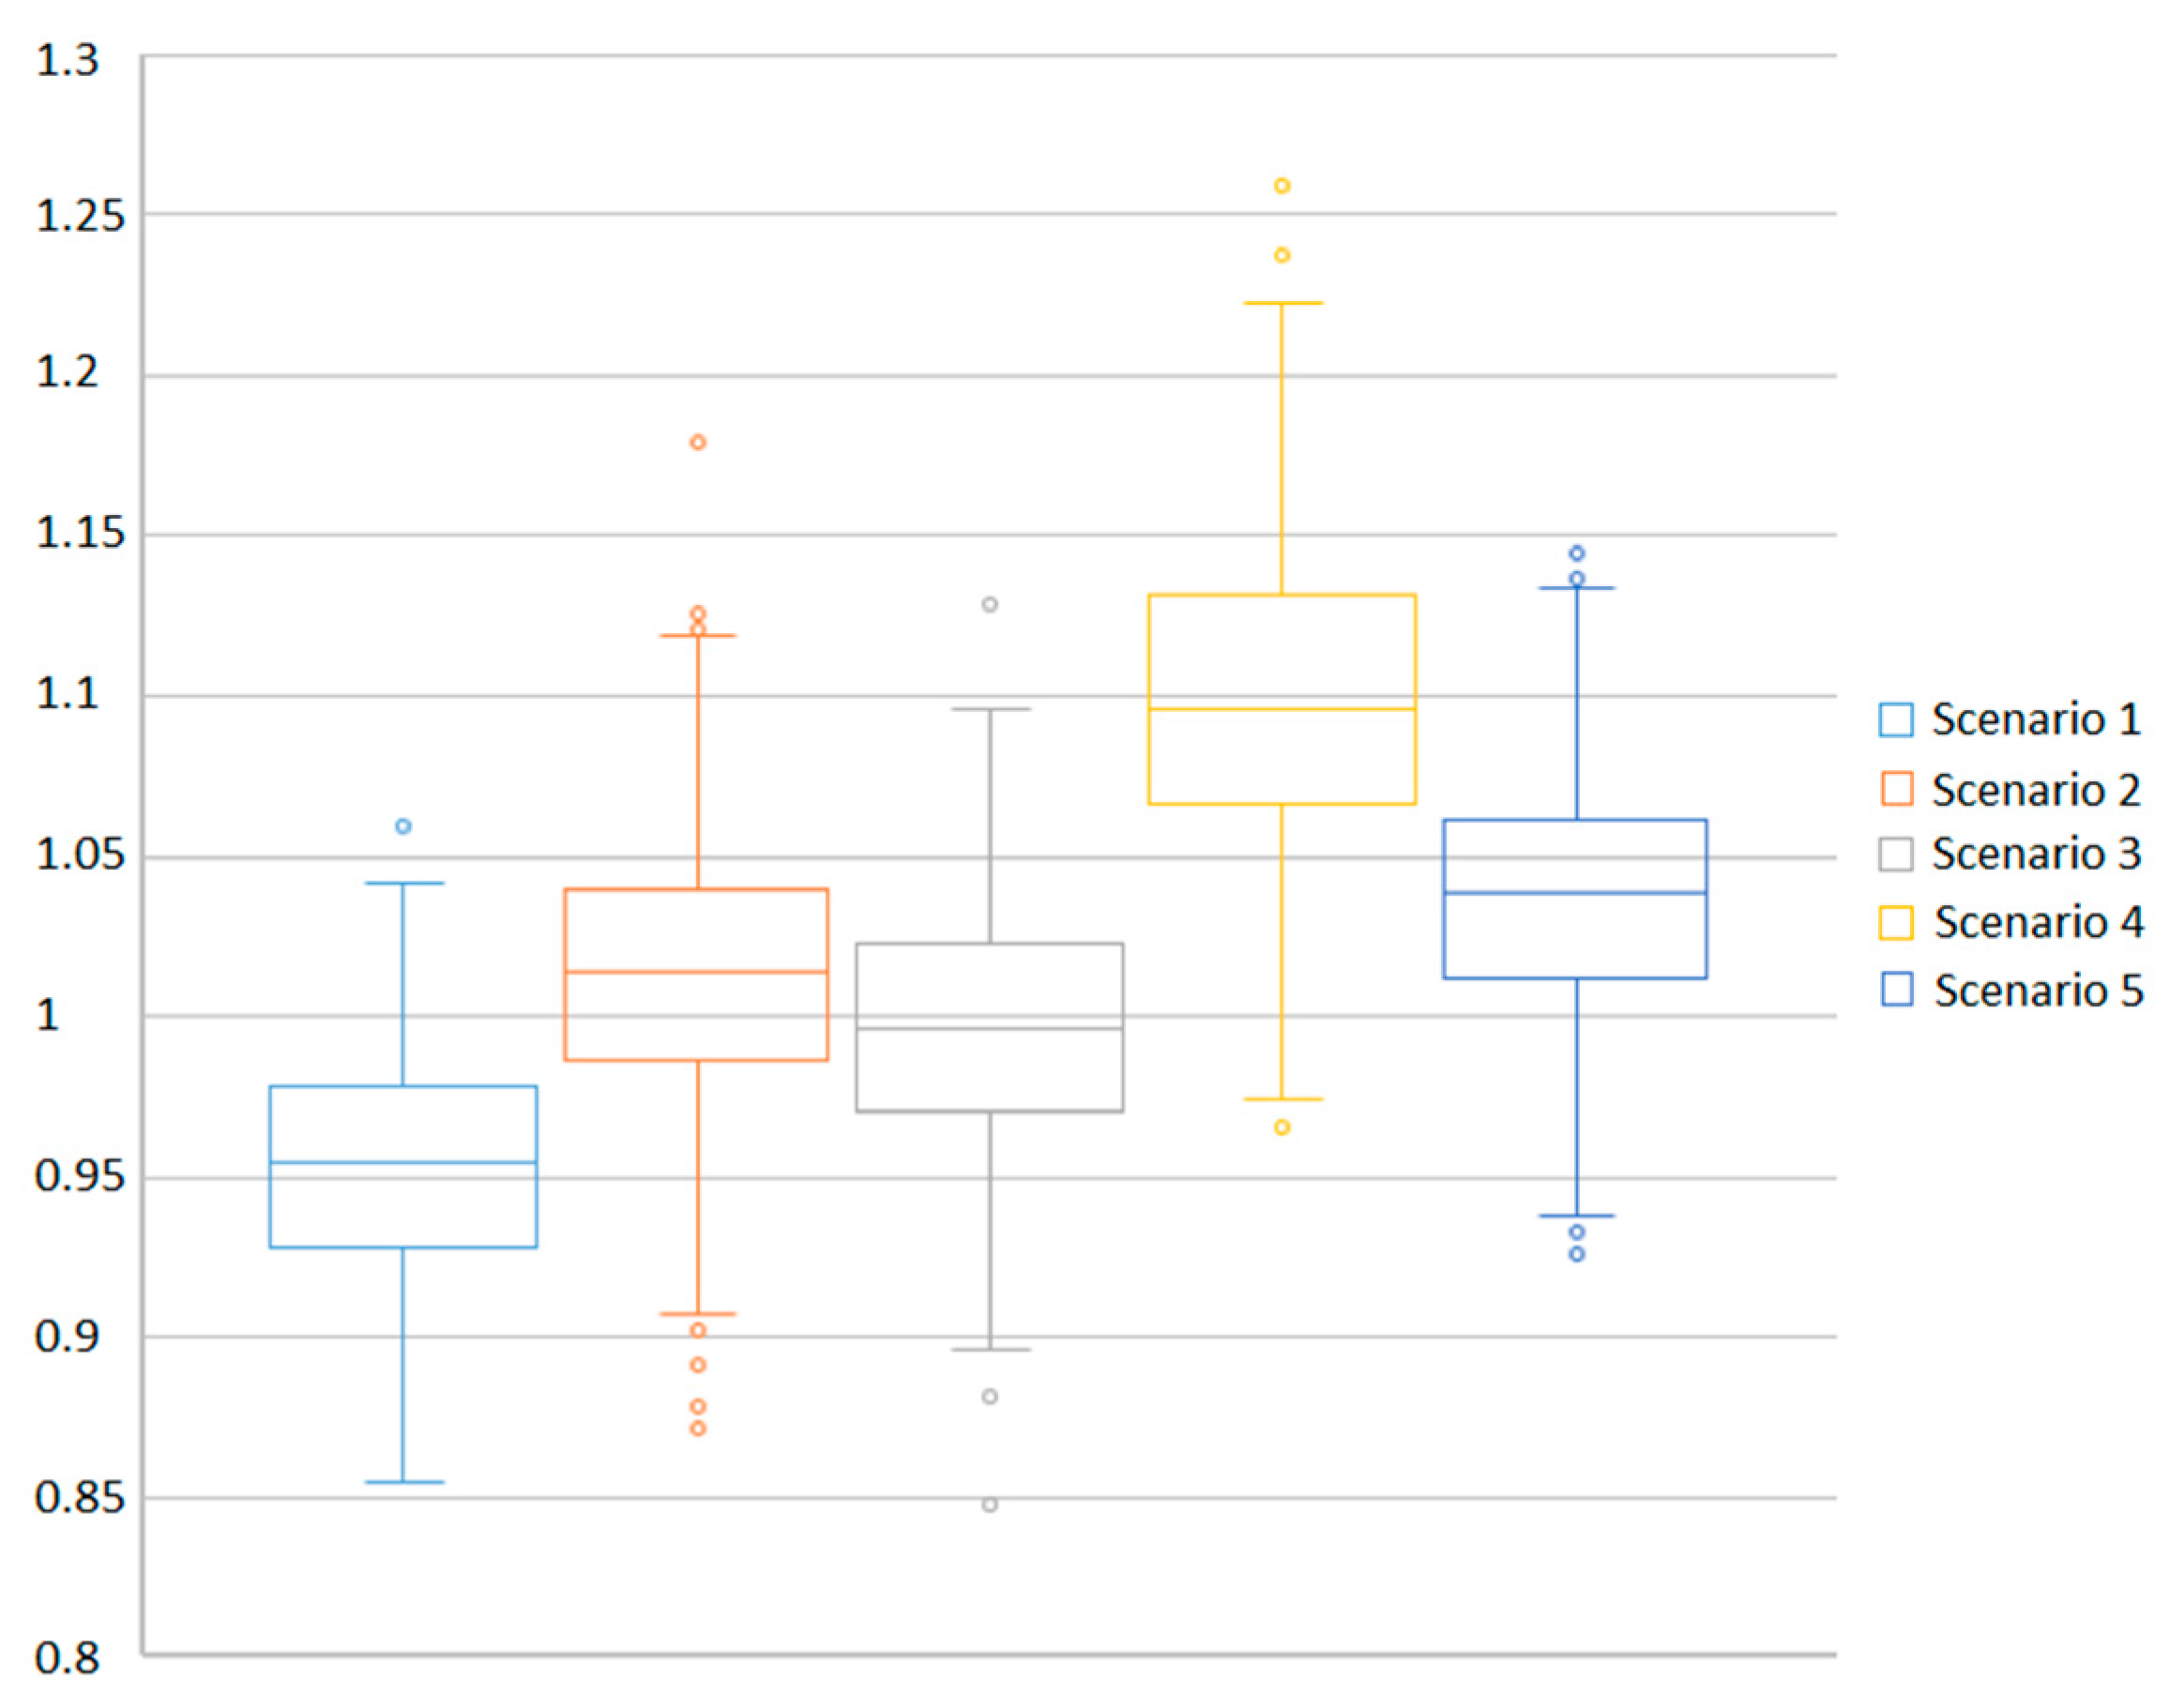
In order to make sure that the analysed results are not distorted, their distribution was visualised in the box plot presented in
Figure 8. It shows that the results are scattered in a similar manner, proven by the similar sizes of the boxes and their “whiskers”. The distribution of the variable is symmetric, as the horizontal line in the box representing the median is located more or less in the middle. During the testing of the individual scenarios there were some outliers that are marked with circles, however, their quantity compared to the number of cycles accounts for less than 1% of the obtained results. The chart shows that there is a correlation between the examined scenarios and the quantity of CA iterations. The traffic organisation described in Scenario 4 caused vehicles to cross the roundabout in the shortest time. The worst case of the traffic organisation is represented by the reference scenario, i.e., Scenario 1 (526 iterations on the average). That means an improvement of 15%.
The roundabout capacity was calculated (
Figure 9) based on each of the obtained results. The guiding principle was the higher the value of the capacity, the better the solution. The measure of roundabout capacity is the quantity of vehicles which exit the roundabout in a time unit which is one iteration of a cellular automaton. The best result was obtained in the case of Scenario 4. The second best result was the roundabout traffic organisation according to Scenario 5.
Table 5 shows the percentage differences in relation to Scenario 1. The traffic organisation described in Scenario 4 led to the greatest increase in the roundabout capacity in relation to the current traffic rules (Scenario 1). Scenario 4 is a combination of the rules specified in Scenarios 2 and 3. The changes introduced separately provide an increase of 6.4% and 4.5%, respectively, and cumulatively 10.9%. However, introducing them together increases the roundabout capacity by an extra 4.4%, thus achieving the best result of all the modifications, equalling 15.3%. Such traffic organisation tidies up the road traffic and can be achieved without substantial modifications of the traffic regulations (what it does require is provision of more accurate driver training and at the same time developing appropriate algorithms for autonomous vehicles). The second biggest increment in relation to the reference scenario is demonstrated by Scenario 5. It is an attempt to turn attention to the fact that the traffic regulations in force favour drivers moving along the outer lane of a roundabout. Such vehicles often block roundabouts, while the inner lanes are empty or almost empty. According to the simulations, introducing the changed right of way in roundabouts can cause a result of increase 8.9%, preferable to the status quo (Scenario 1), while at the same time being the second most efficient set of rules.
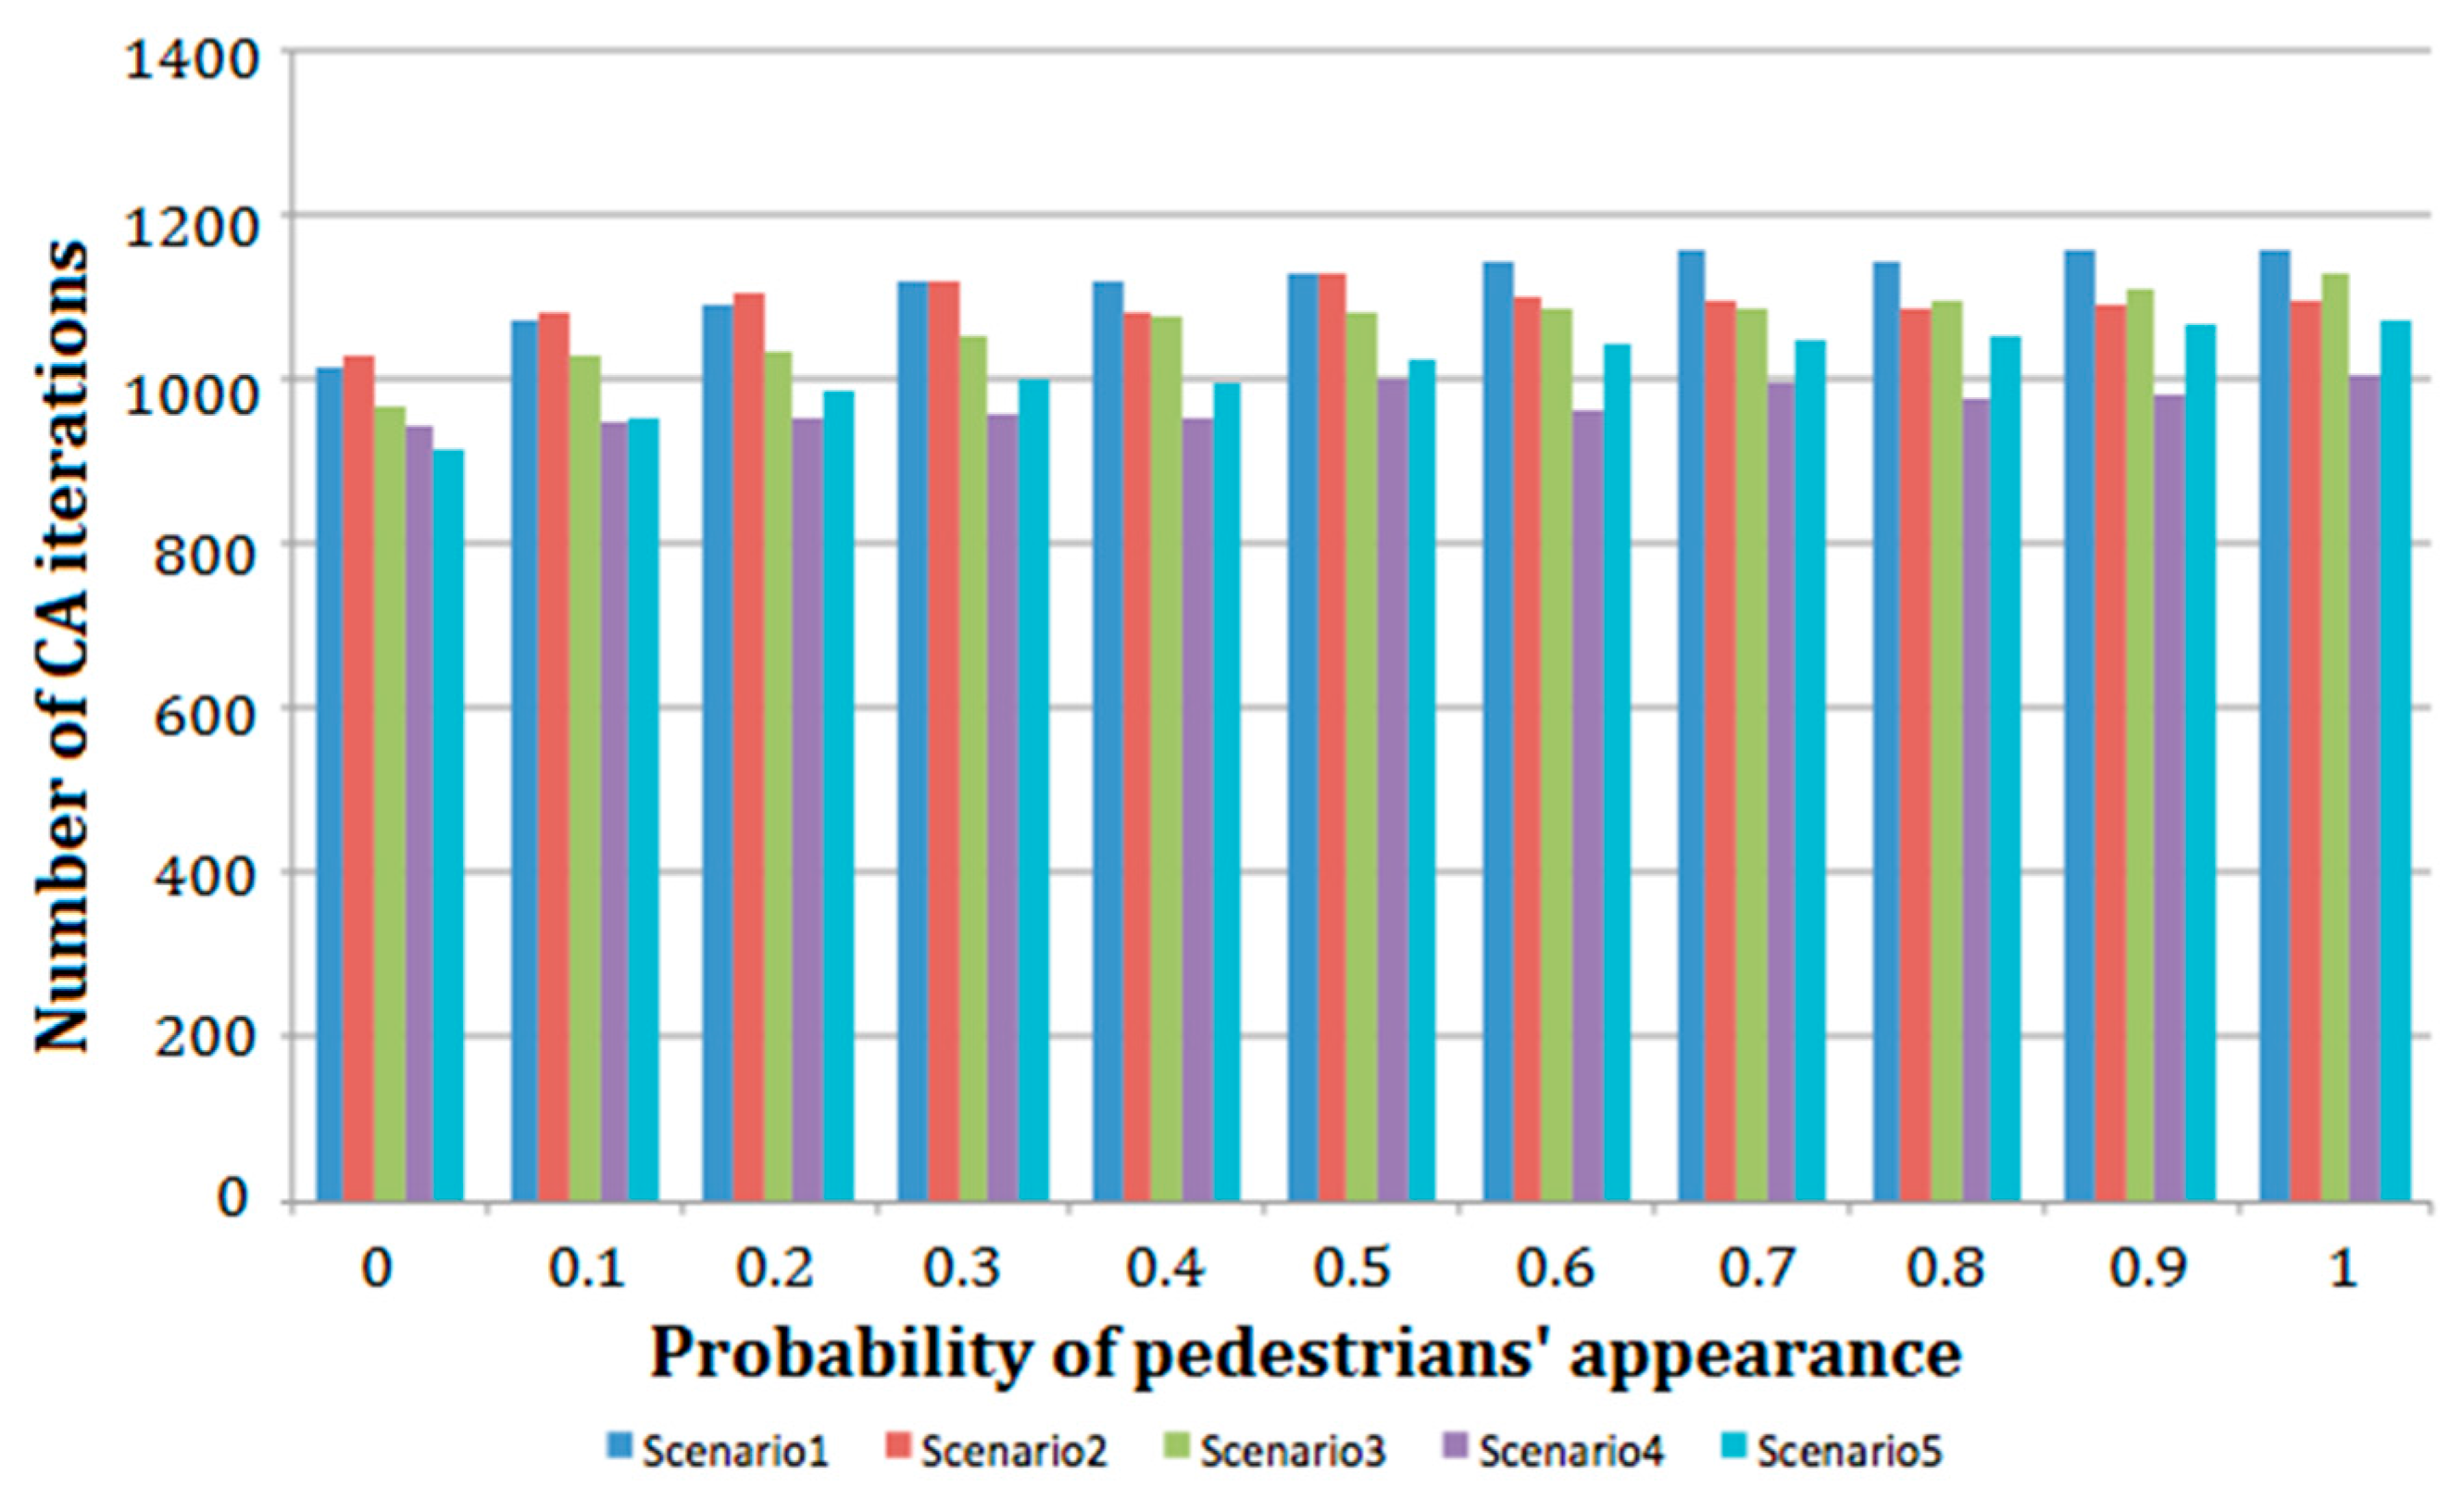
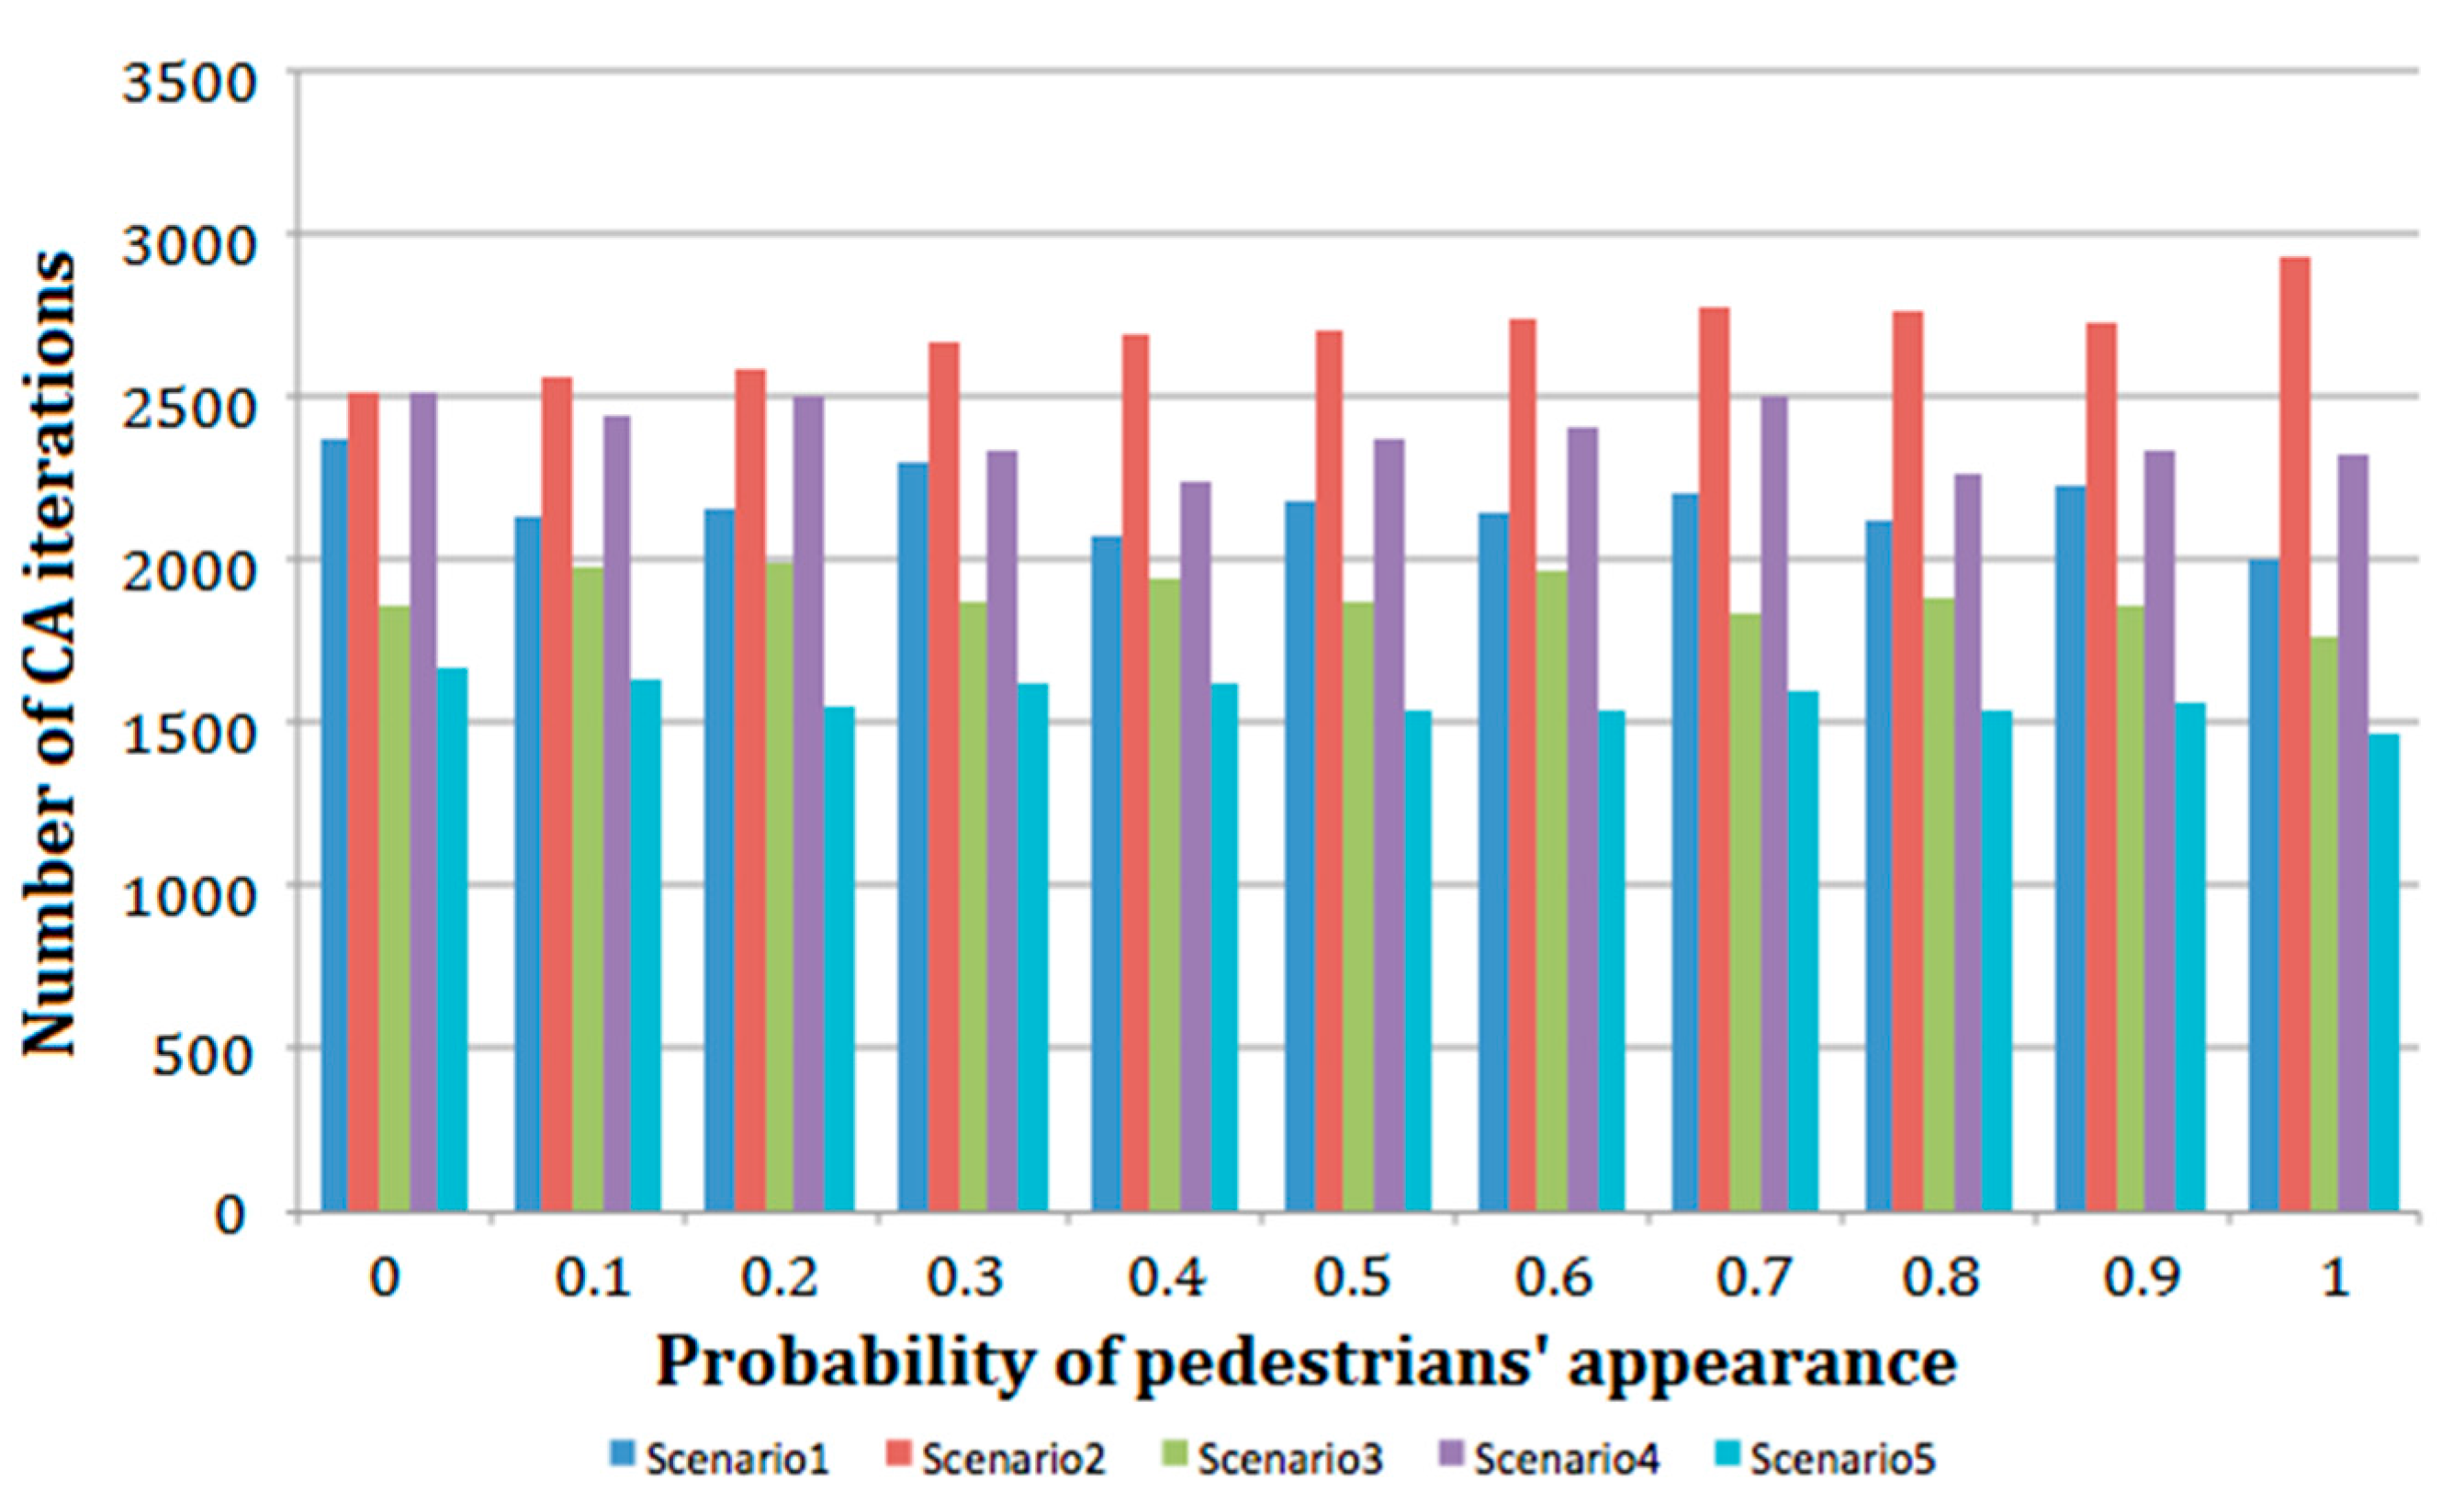
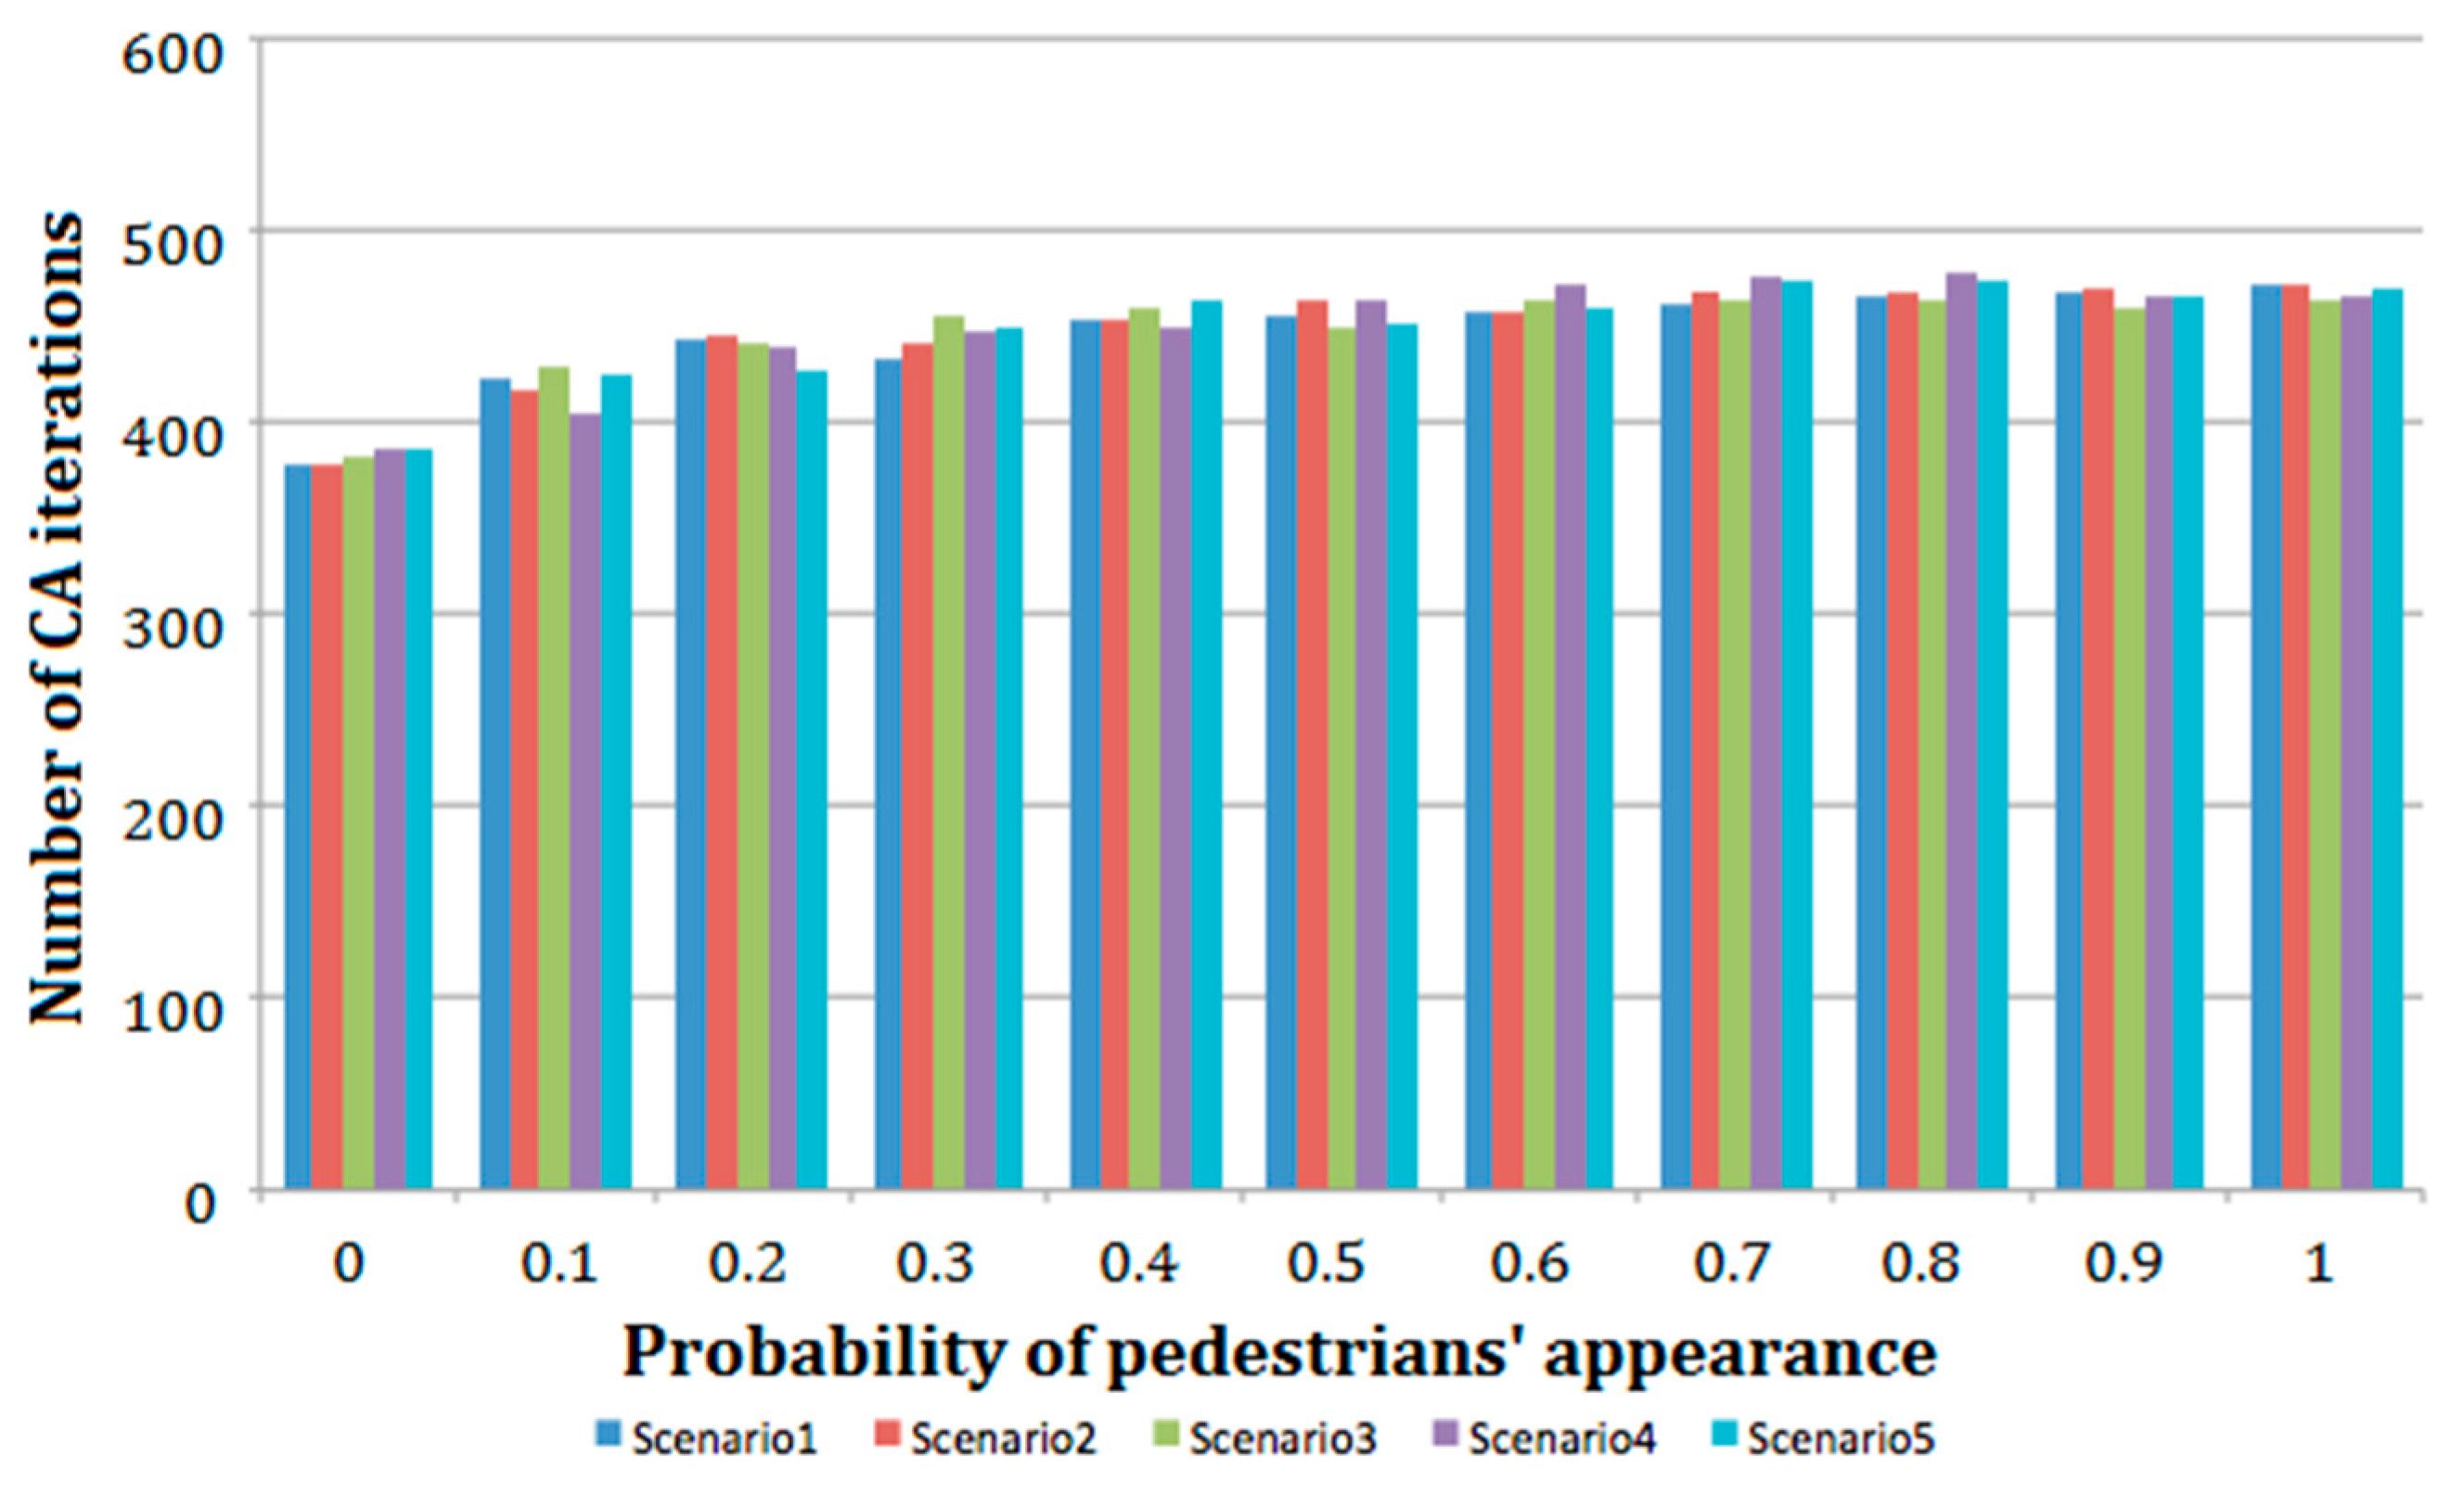
The subsequent studies pertained to the impact of the number of pedestrians at the roundabout on the roundabout capacity for the individual traffic scenarios.
Figure 10,
Figure 11,
Figure 12 and
Figure 13 demonstrate the research results for the specified distances between vehicles 1 and 4 and for the specified maximum velocities of cars and trucks. The traffic scenarios return values that are similar for the distance between vehicles equalling 1 (
Figure 10).
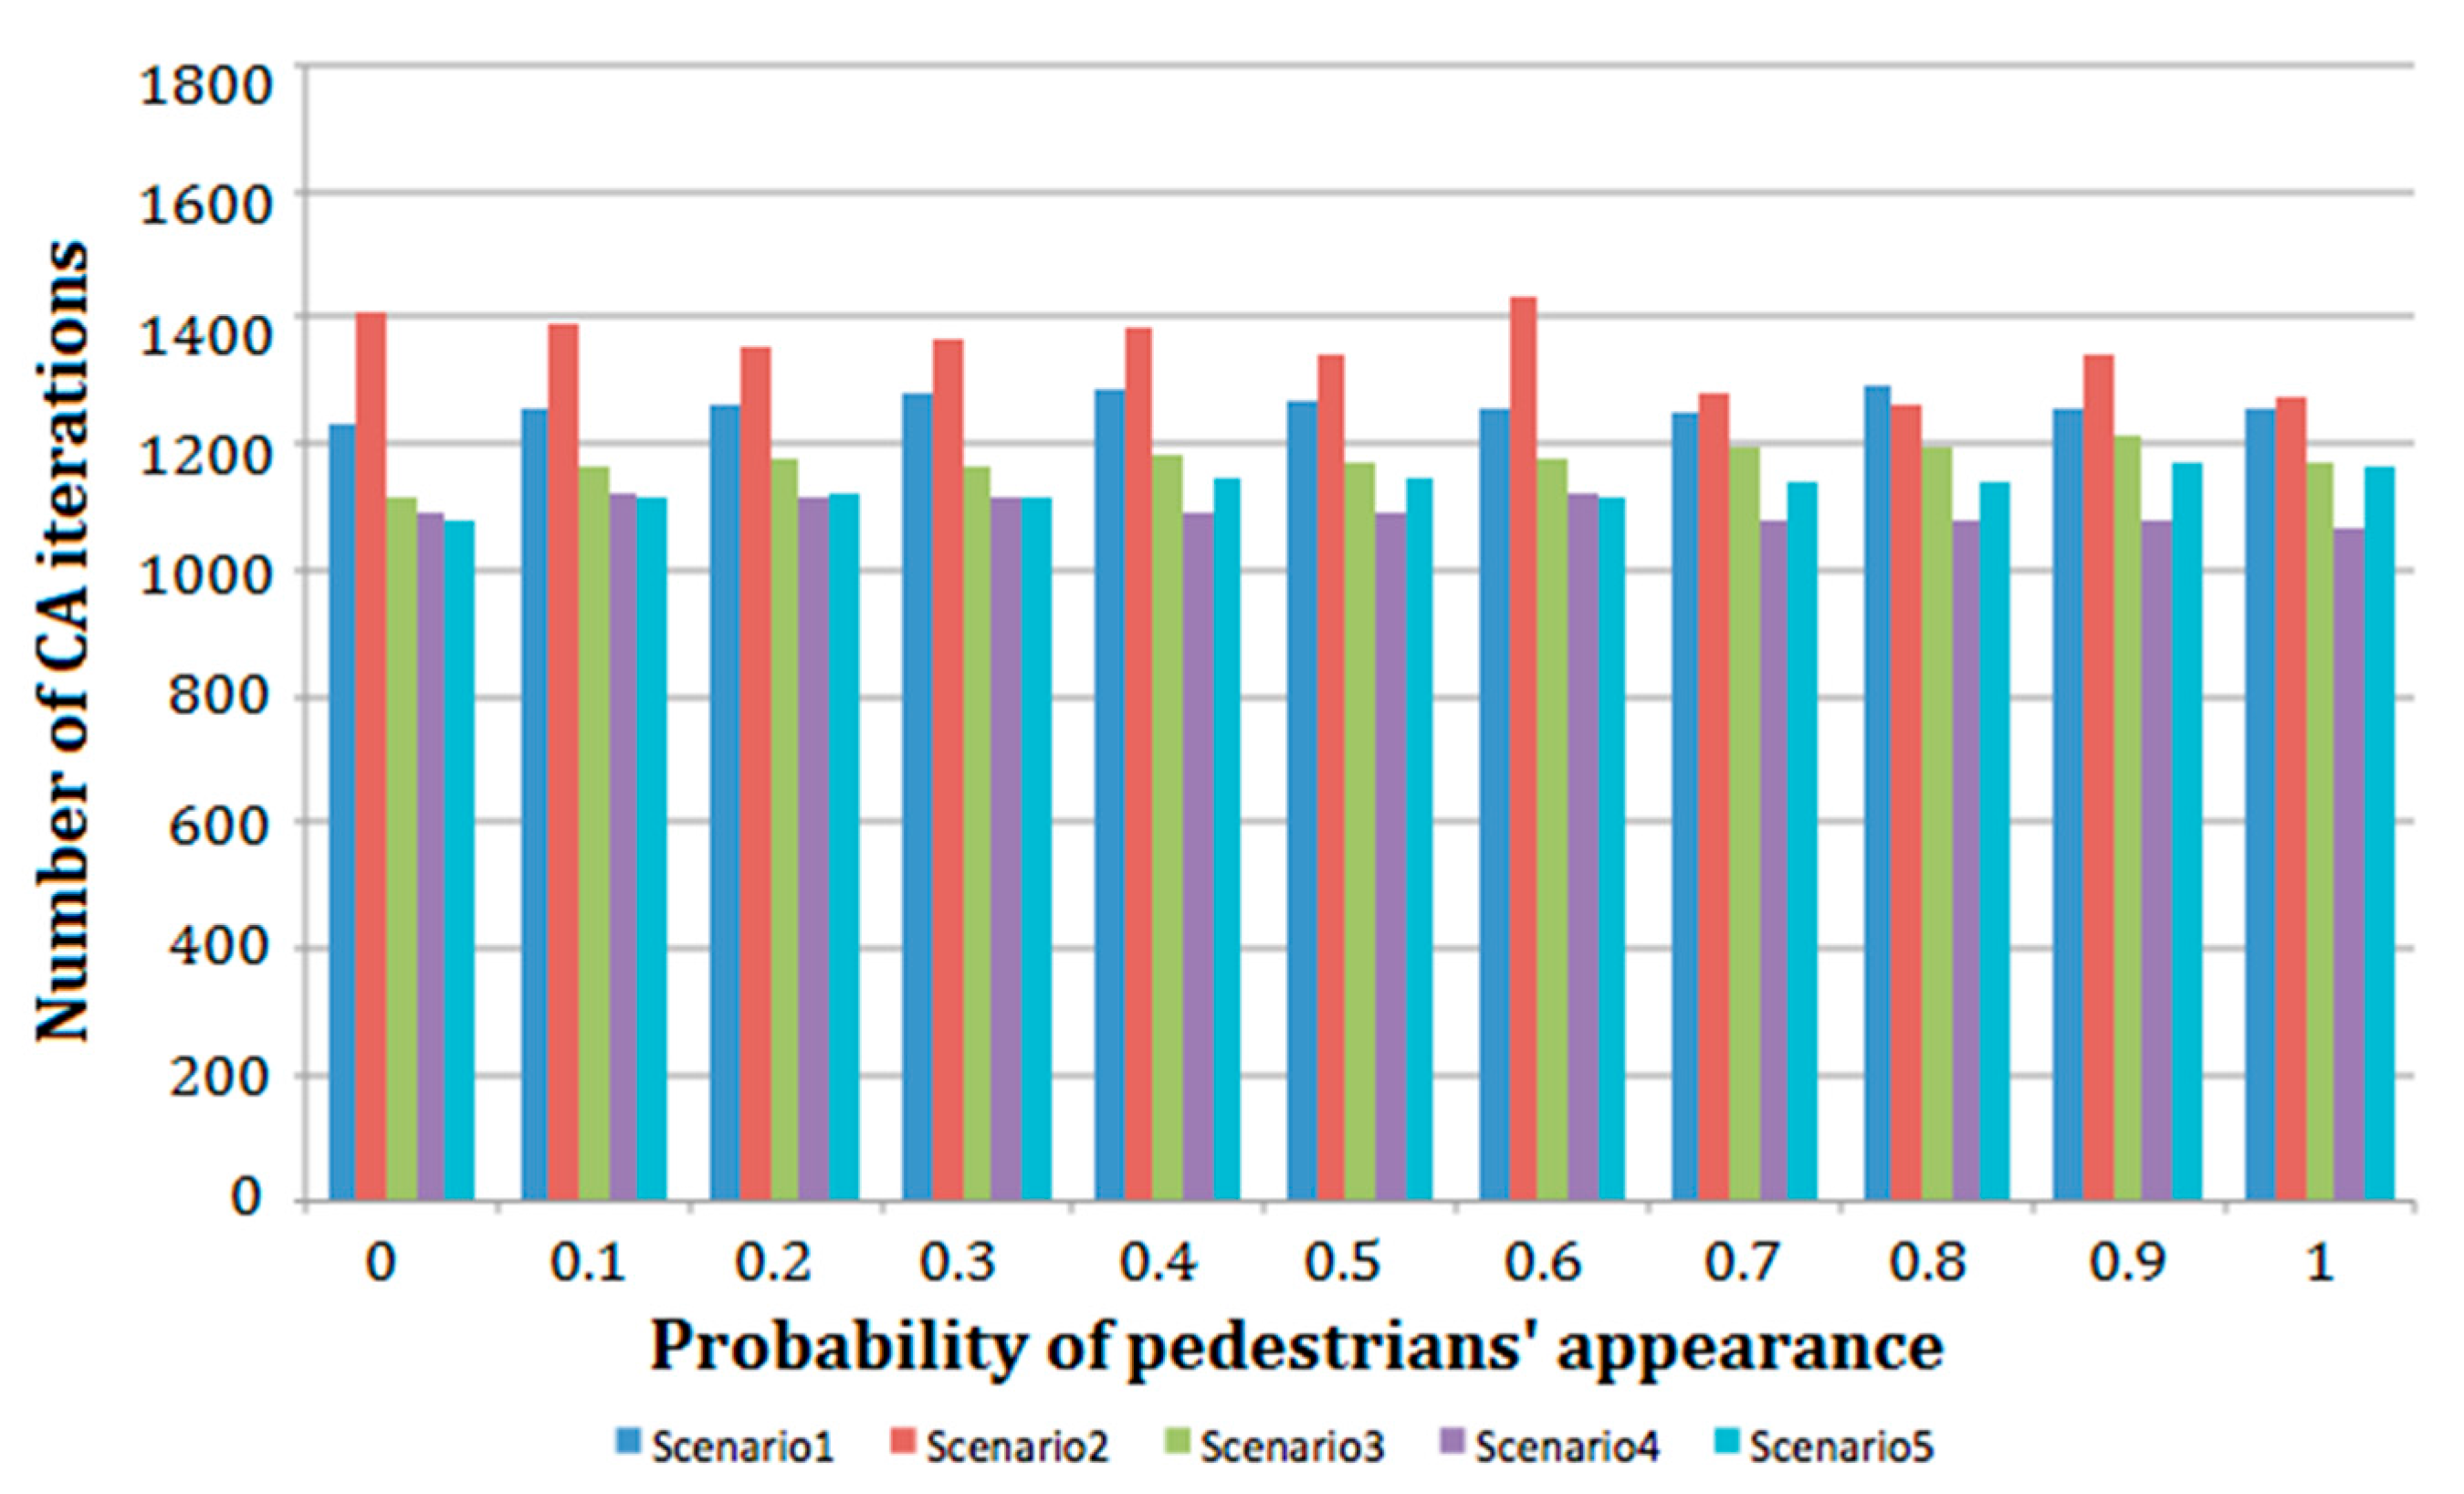
More significant differences are found in the cases shown in
Figure 11,
Figure 12 and
Figure 13. The figures reveal that road traffic organisation has a considerable impact on roundabout capacity. It was found that the larger the forced distance between vehicles, the smaller the roundabout capacity, due to the fact that vehicles queuing to enter the roundabout must wait longer. However, the distance between moving vehicles is insufficient for the waiting vehicles. In the case presented in
Figure 13, the most effective type of traffic organisation is that applied in Scenario 5. It is 20–30% more effective in relation to the reference scenario for various numbers of pedestrians participating in the traffic. For smaller distances between vehicles, the differences are much smaller, ca. 10%. The traffic organisation that proved to be the least susceptible to changing the distances between vehicles was the one applied in Scenario 2, and at the same time it was the least effective.
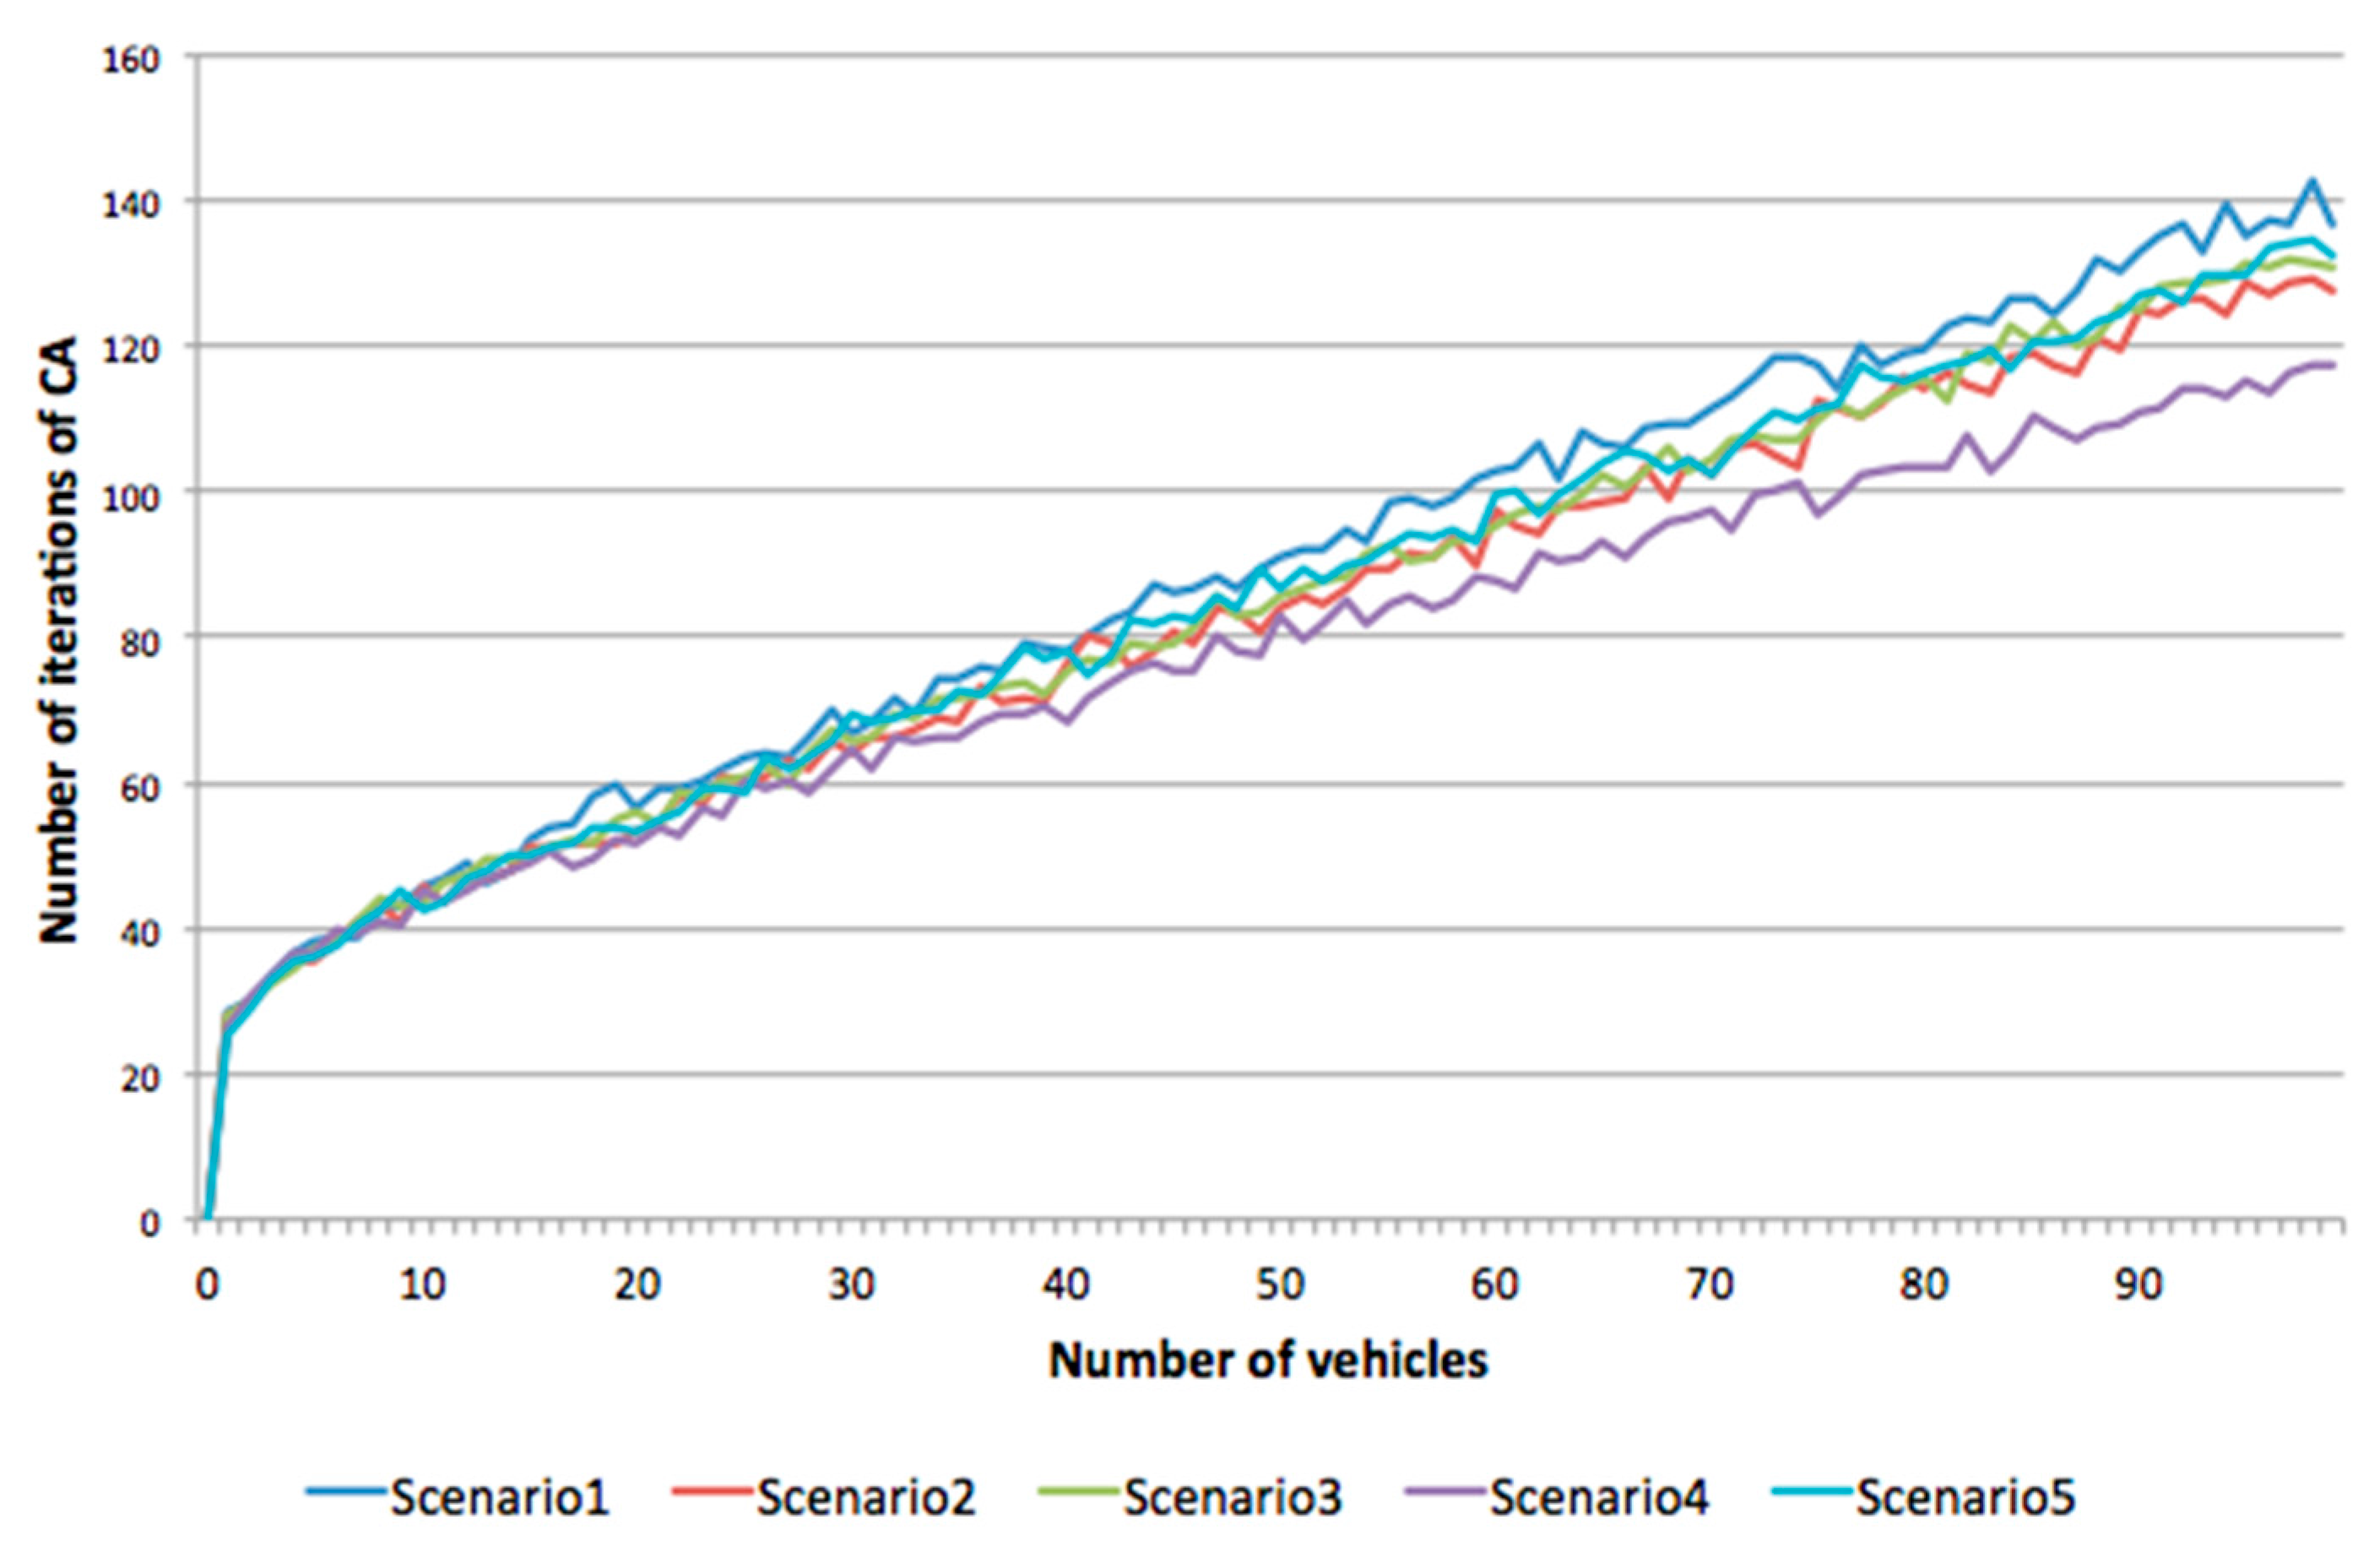
Figure 14 presents the aggregated results of the research study for the individual scenarios, specified speeds (1–4), probability of pedestrians’ appearance at the roundabout (0; 0.5; 1) and different maximum speeds. The observed value is the number of CA iterations.
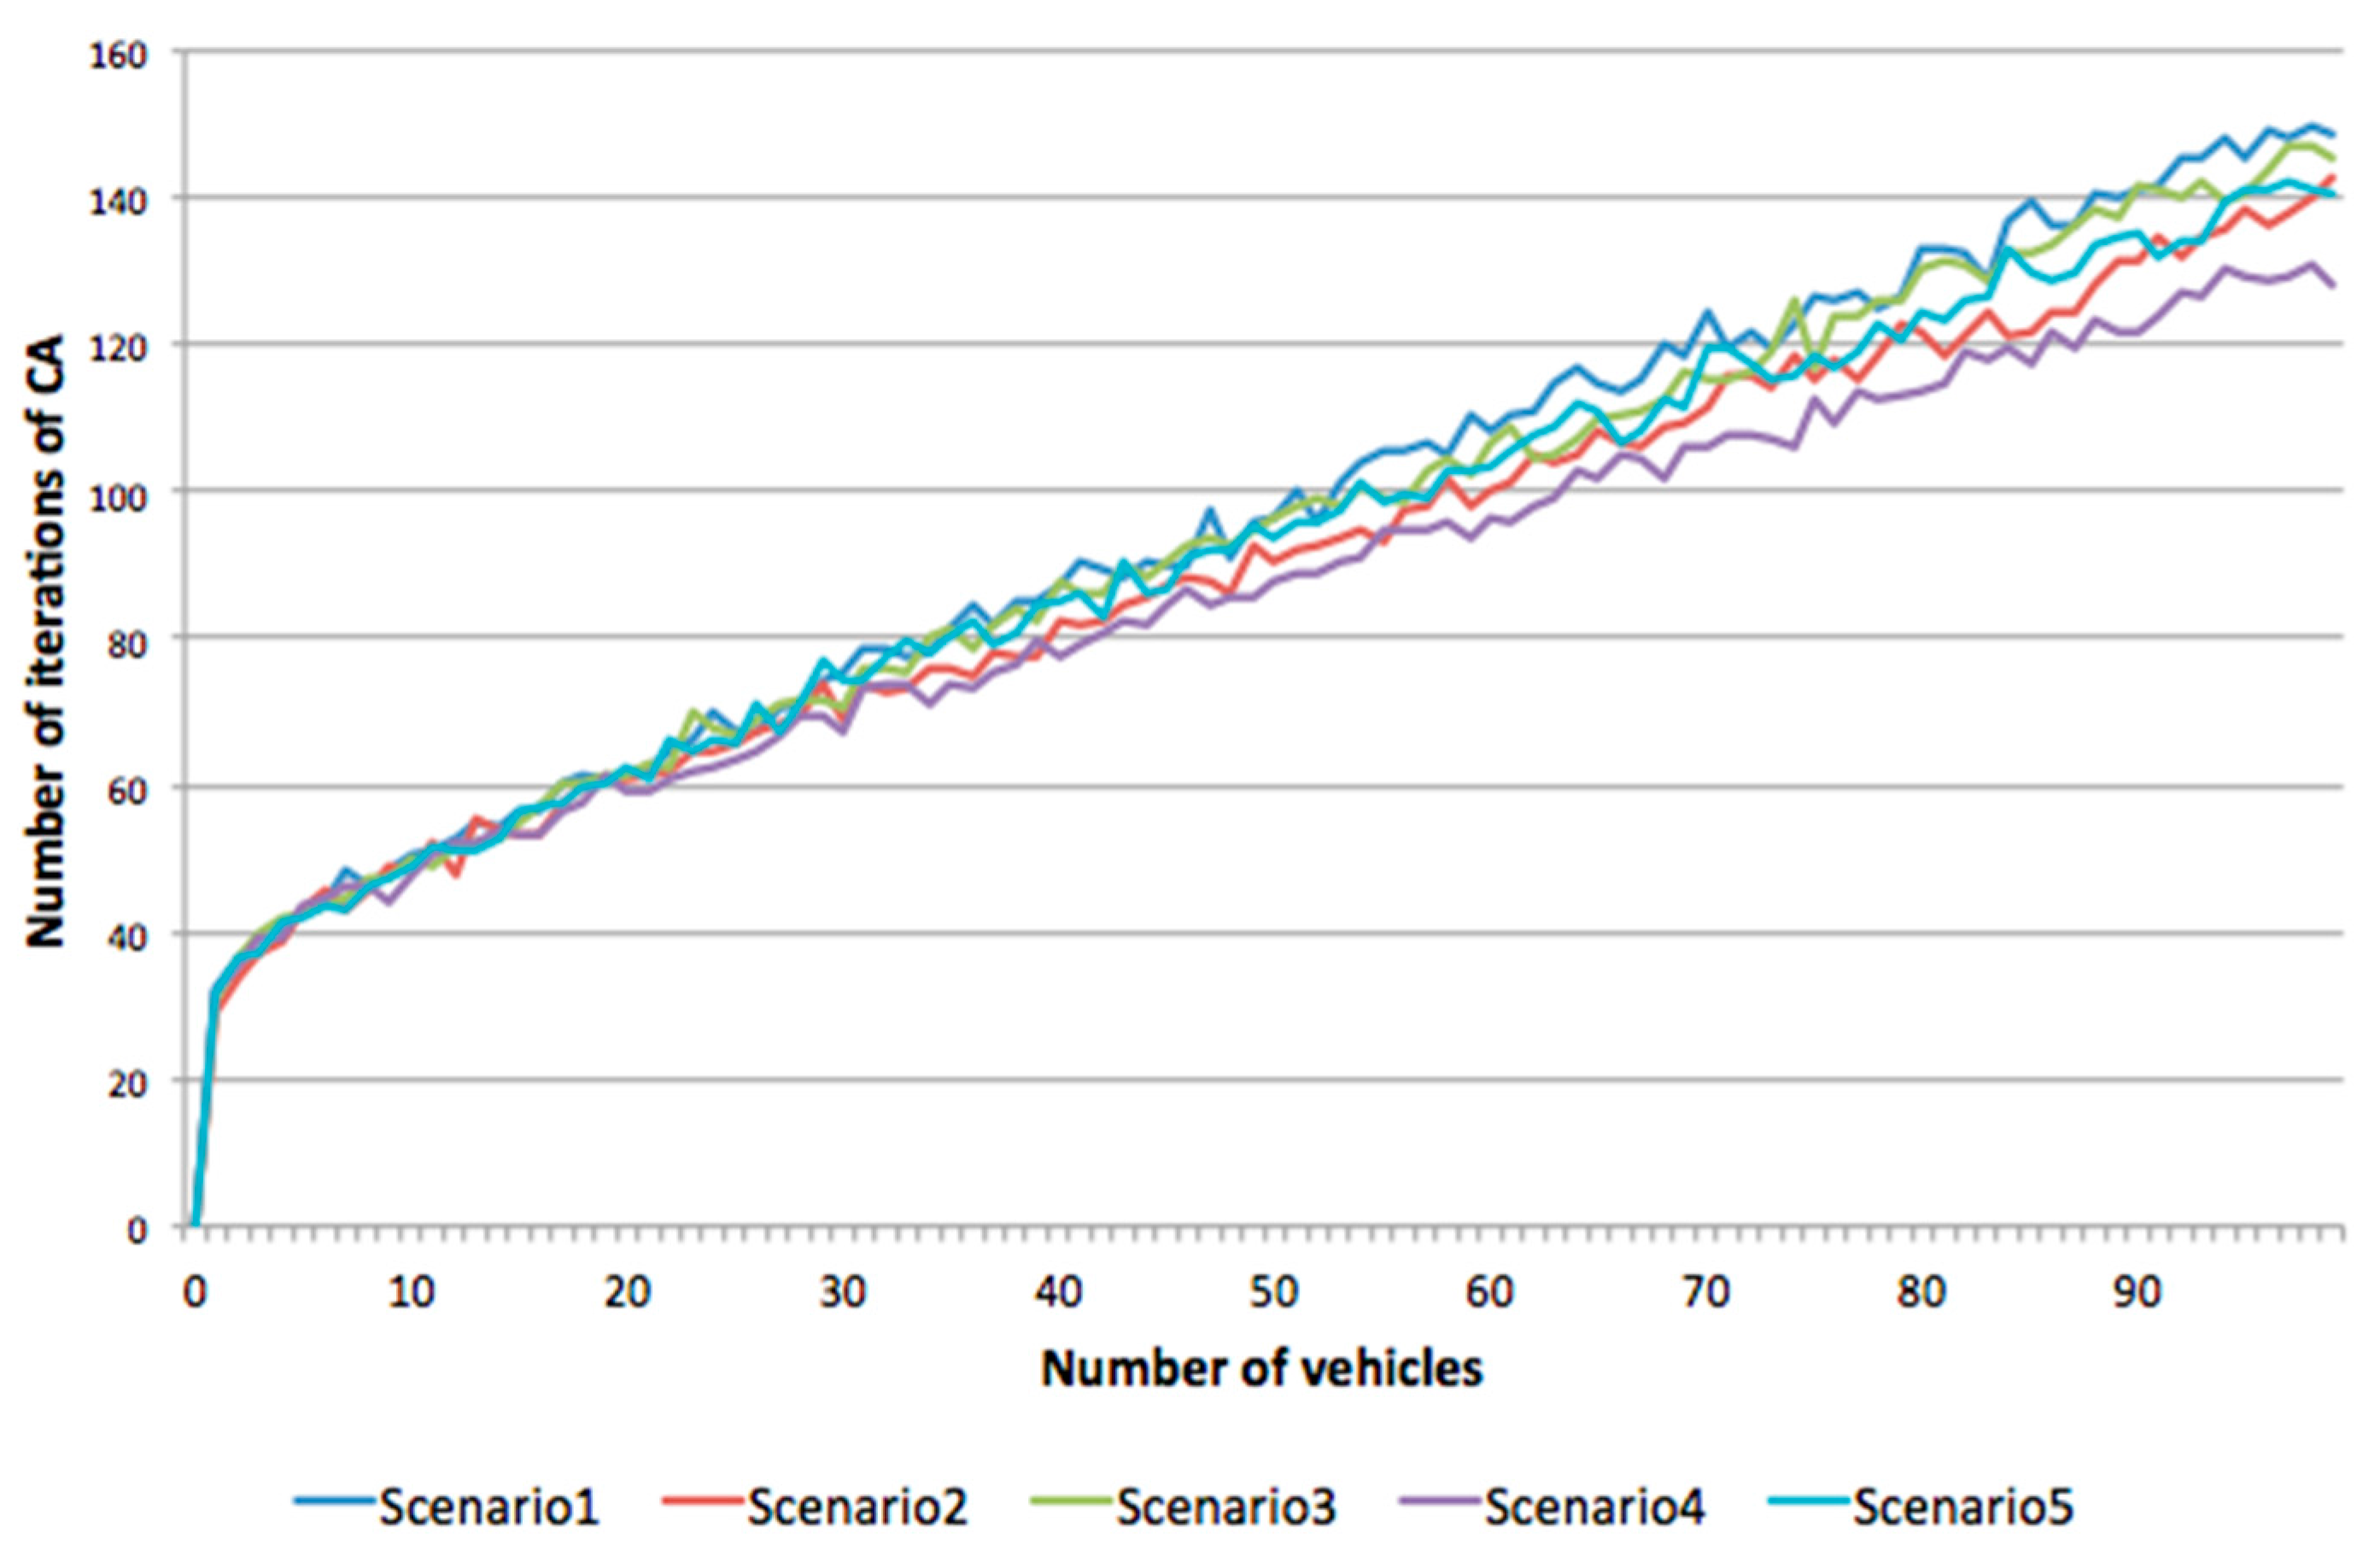
The subsequent study focused on finding out how roundabout capacity changes in different scenarios of traffic organisation (Scenarios 1–5) in the context of deteriorated adhesion. The developed model was prepared in such a way so that the braking process accounts for delay resulting from lack of tyre adhesion to various surfaces. The adhesion studies were performed for wet (
Figure 15) and for snowy (
Figure 16) surfaces. In this case, roundabout capacity was studied for 100 vehicles.
The analysis of the results has shown that again reference Scenario 1 proved to be the least effective form of traffic organisation at the roundabout. Scenarios 3–5 were more effective.
4.2. Examining the Impact of Freight Vehicles on Roundabout Capacity
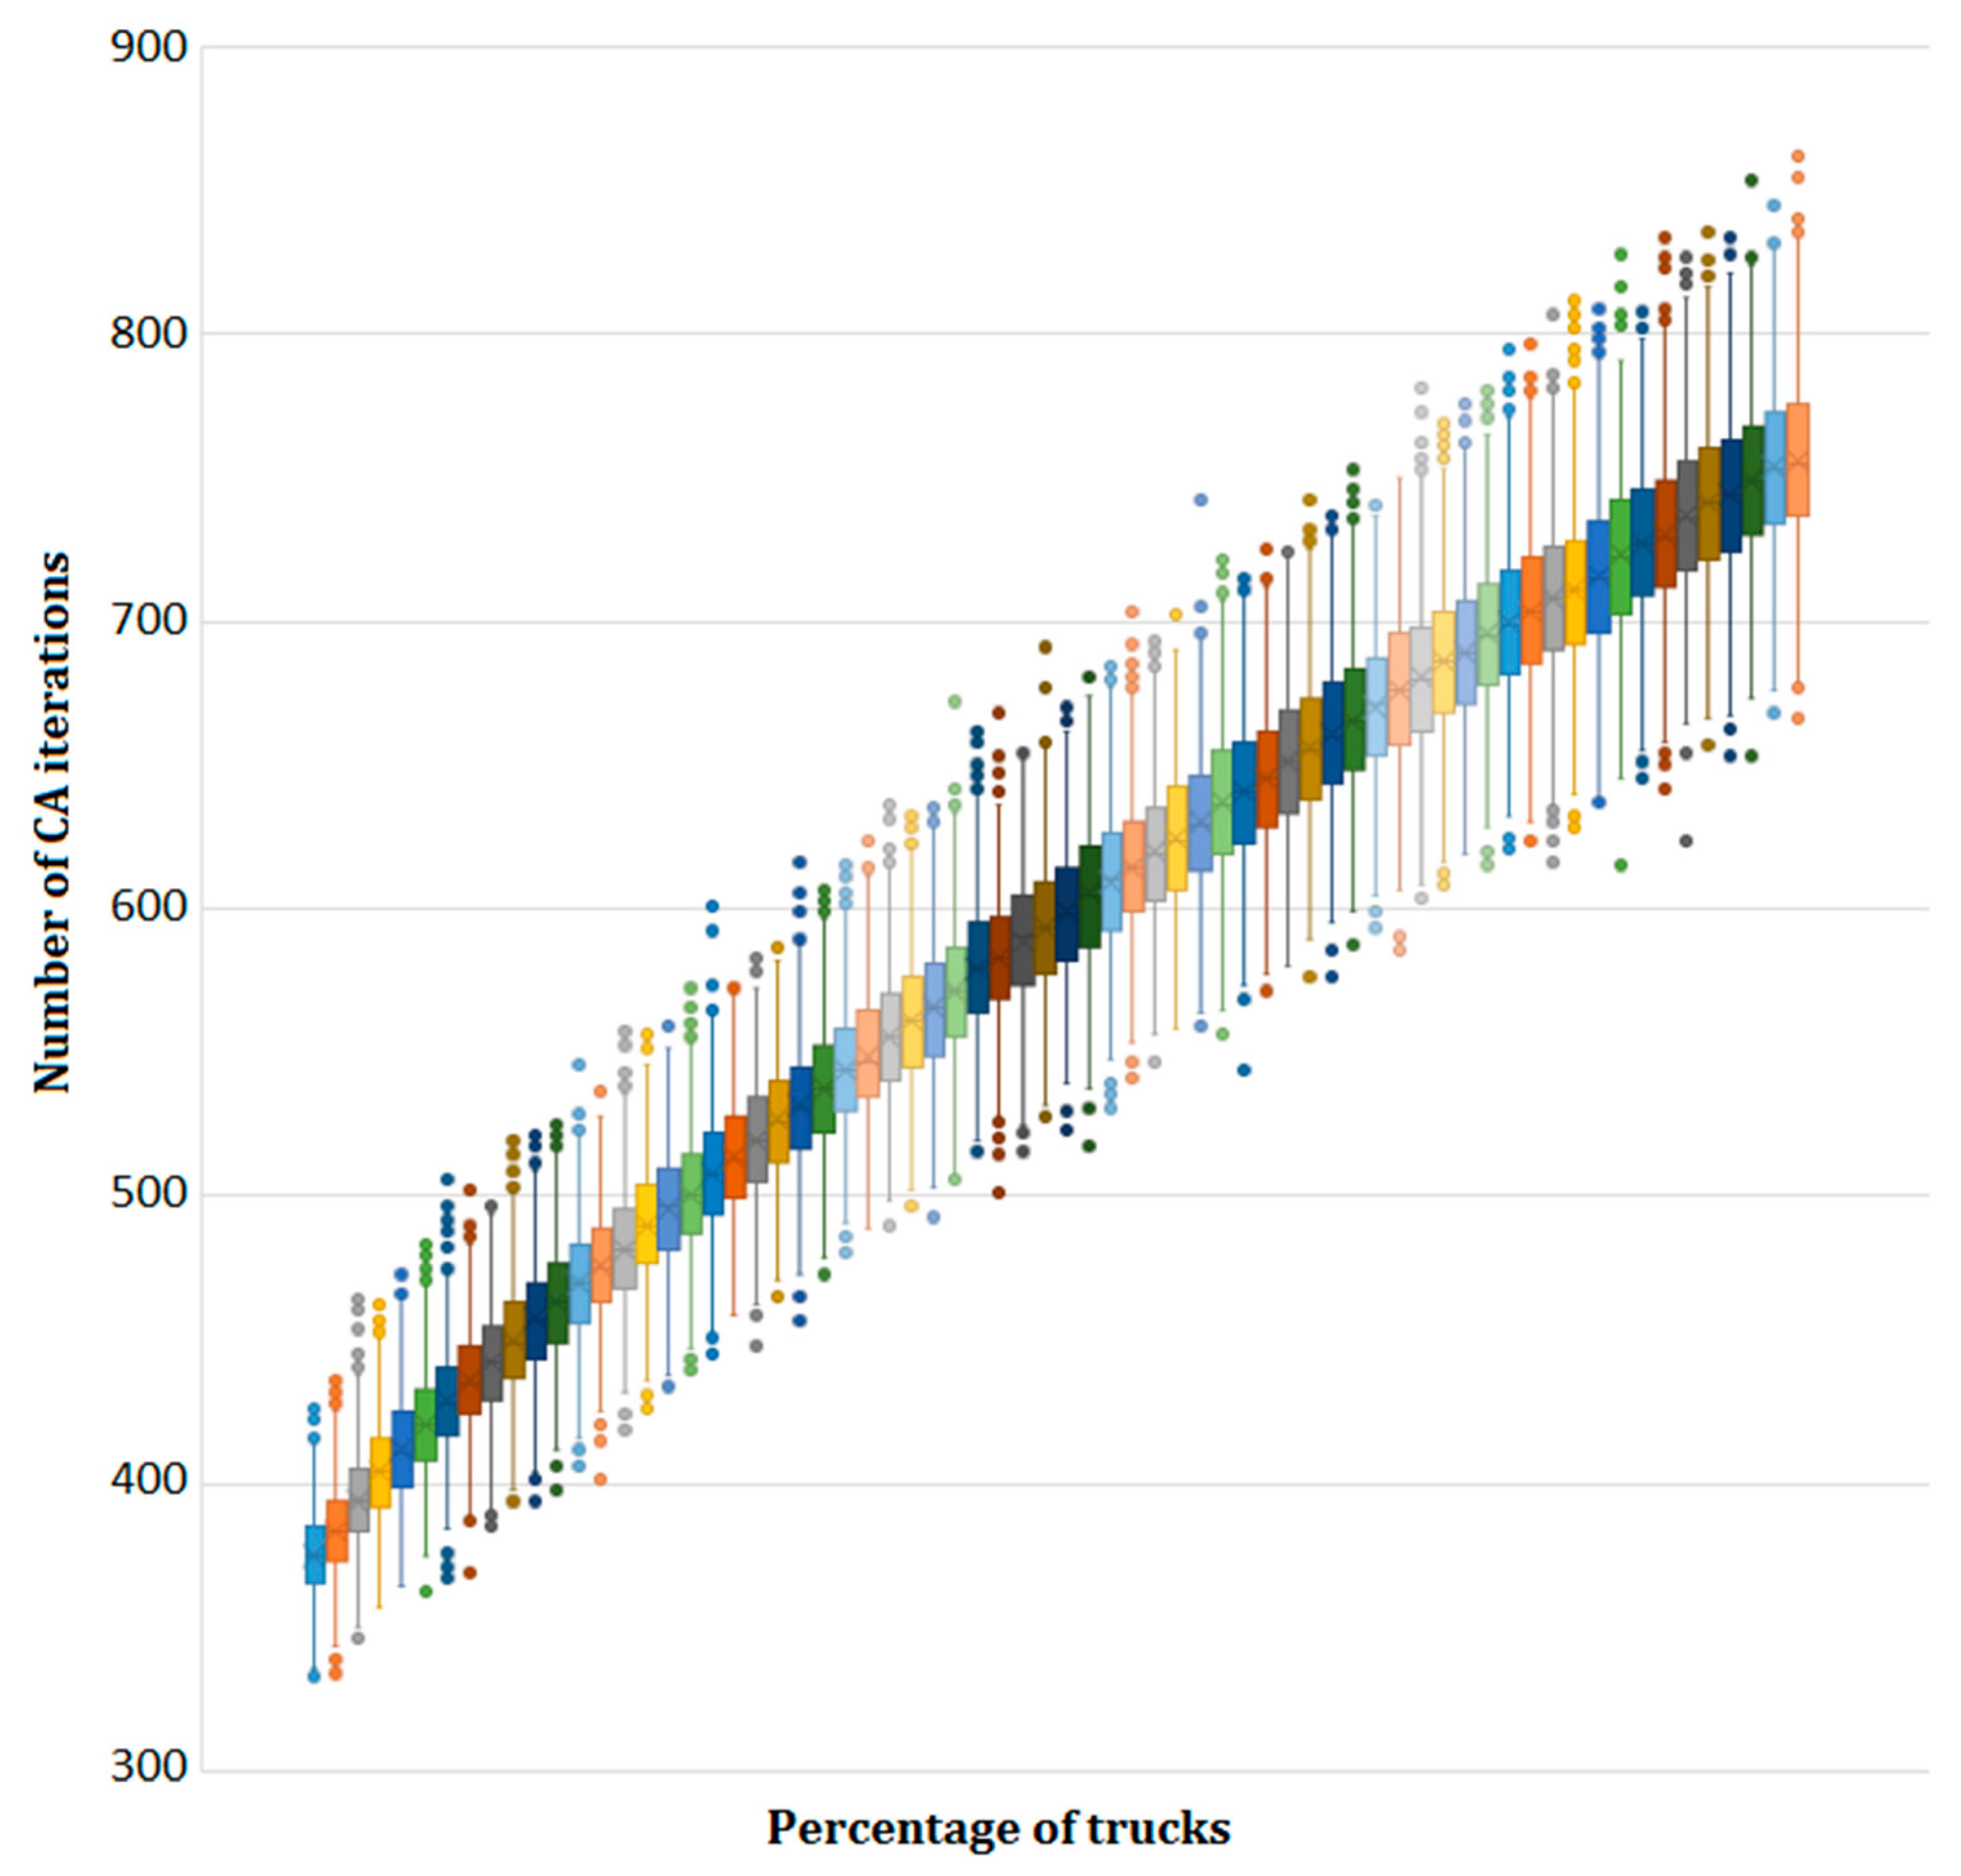
The aim of the study was to determine whether an increase in the number of trucks significantly affects roundabout capacity. The first stage of the study was examining the roundabout capacity without trucks. In total 500 cars crossed the roundabout on average in 375 iterations of the cellular automaton, applying the most effective traffic organisation—Scenario 4. In the subsequent tests, the percentage of trucks was increased by 1%, which resulted in an increase in the time needed for the constant number of vehicles to cross the roundabout. The distribution of the received results is presented in
Figure 17.
It is visible that the more trucks are involved, the longer the average duration of the experiment, which means that the roundabout capacity is getting smaller. A more accurate analysis has shown that the more trucks there are, the more unstable the traffic becomes. The differences between the maximum and minimum values start to increase.
5. Interpretation of the Results and Future Works
The above studies described have shown that it is possible to increase roundabout capacity by changing traffic regulations. Also, trucks have a significant impact on urban traffic fluidity: their growing share in the total number of vehicles (simulated in one of the experiments) led to a significant reduction of the roundabout capacity.
In order to maximise the number of vehicles crossing a roundabout, it should be possible for vehicles to enter and exit the roundabout simultaneously. The multi-lane area of a roundabout can be used most effectively, which results in capacity maximisation. This was demonstrated by Scenario 4. Such traffic organisation may be easily implemented, e.g., by appropriate marking of solid and broken lines within roundabouts. The analysis of urban traffic performed in Poland reveals that more appropriate marking may lead to increasing safety of road traffic participants. An additional criterion to improve traffic safety seems to be driver training. The observations of roundabout traffic have revealed numerous behaviours of drivers that generated unnecessary traffic collisions. Development of Scenario 5 was inspired by actual events observed at roundabouts. Many a time, the vehicles driving in the inner lane (in the case of 2-lane roundabouts) or in the middle lane (in the case of 3-lane roundabouts), when trying to exit the roundabout would cut in on the vehicles moving in the outer lane. It was observed that e.g., less experienced or elderly drivers tended to keep to the outer lane. The traffic organisation described in Scenario 5 could reduce such behaviours, which in turn might lead to increased traffic capacity in cities having a high number of roundabouts.
Another aspect, which should be noted in order to increase traffic capacity, is reduction of freight vehicles on roundabouts affected by heavy traffic. Of course it is impossible to totally eliminate freight traffic in cities. However, it is possible to limit the number of trucks in cities, e.g., by providing ring-roads. Also, a controversial idea seems to be a prohibition to drive trucks in peak hours. When the number of trucks is significant and there are limited other possibilities to increase the traffic capacity, this idea might be taken into account.
It should be emphasised that not each roundabout has the same shape or the number of entrances and exits. Moreover, a computer simulation takes into account merely a fragment of the reality. Nevertheless, the results of the study are promising and this issue deserves further attention. The model does not consider drivers’ behaviour, experience, fatigue nor ongoing concentration in navigating through roundabouts. The future plans for this task include an ongoing linkage between the model and metrics form the urban system, which will record quantitative data (although it would certainly be useful to develop a methodology for automatically retrieving qualitative data such as vehicle data). The model also does not specifically look at the specific characteristics of pedestrians walking by the roundabout, treating them only as a parameter that has some influence on the scenarios studied. However, incorporating pedestrians’ behaviour into the launched study may point to further important aspects. The developed model does not account for cyclists, either. The aforementioned facts show an area that could contribute to the subsequent studies in this respect. Other aspects that may be of some importance, but were not investigated, are the distances between the individual feeder roads. The developed model could also be extended to include the possibility of turbo roundabout simulations. It would require small modifications of the principles contained in Scenario 5. It also might provide an answer to the question whether in the case of a given roundabout it is better to apply the classical traffic organisation, or a directional traffic organisation.
It must be stressed that the model has been tested in a simulation environment, which can be perceived as an incomplete scientific pathway. Therefore, in the future, some works will be carried out towards validation of the model, using available measures and current real data.
6. Conclusions
The article focuses on the analysis of traffic efficiency at roundabout intersections. The current roundabout traffic rules were presented, and then other forms of roundabout traffic organisation were proposed by means of specifying various traffic scenarios. A generalised model was developed, which was based on cellular automata aimed at examining multi-lane roundabout capacity for different road traffic rules. The developed model was implemented in the form of a simulation system, which enabled numerous simulations. The obtained results proved that modification of the existing traffic regulations has an effect on increasing roundabout capacity. The greatest roundabout capacity is provided by the form of traffic organisation that makes vehicles enter and exit a roundabout in parallel. The implication is that several vehicles may easily enter and exit a roundabout at the same time. The results obtained were better by 15.3% (Scenario 4) and 8.9% (Scenario 5) compared to regulations in force (Scenario 1). Another important result of the study was determination that a reduction of freight traffic has a square function effect on roundabout capacity. It means even a small number of trucks within the total quantity of vehicles may significantly reduce roundabout capacity.
Studies such as the current one cannot possibly be performed in real conditions, mainly due to a possibility of collision, and difficulties in ensuring that all the traffic participants will understand the conditions of the experiment and will behave as prescribed. Computer simulations were applied to bridge this gap. A mathematical model and a simulation system were developed, and the obtained results were presented in the figures and tables. The simulation applied at the microscopic level made it possible to reproduce the phenomena of the real world, such as road traffic, and enabled answering of new questions regarding possible behaviours of drivers.
During the research some possible areas of improvement of the proposed approach have been identified. The most interesting ones seem to be the validation of the model and the inclusion of the human factors to reduce model simplification.
The aim of the study was to demonstrate that a modification of road traffic rules could lead to increasing roundabout capacity. The results described have shown that the aim of the study has been attained, and the results make it possible to take up further studies.


