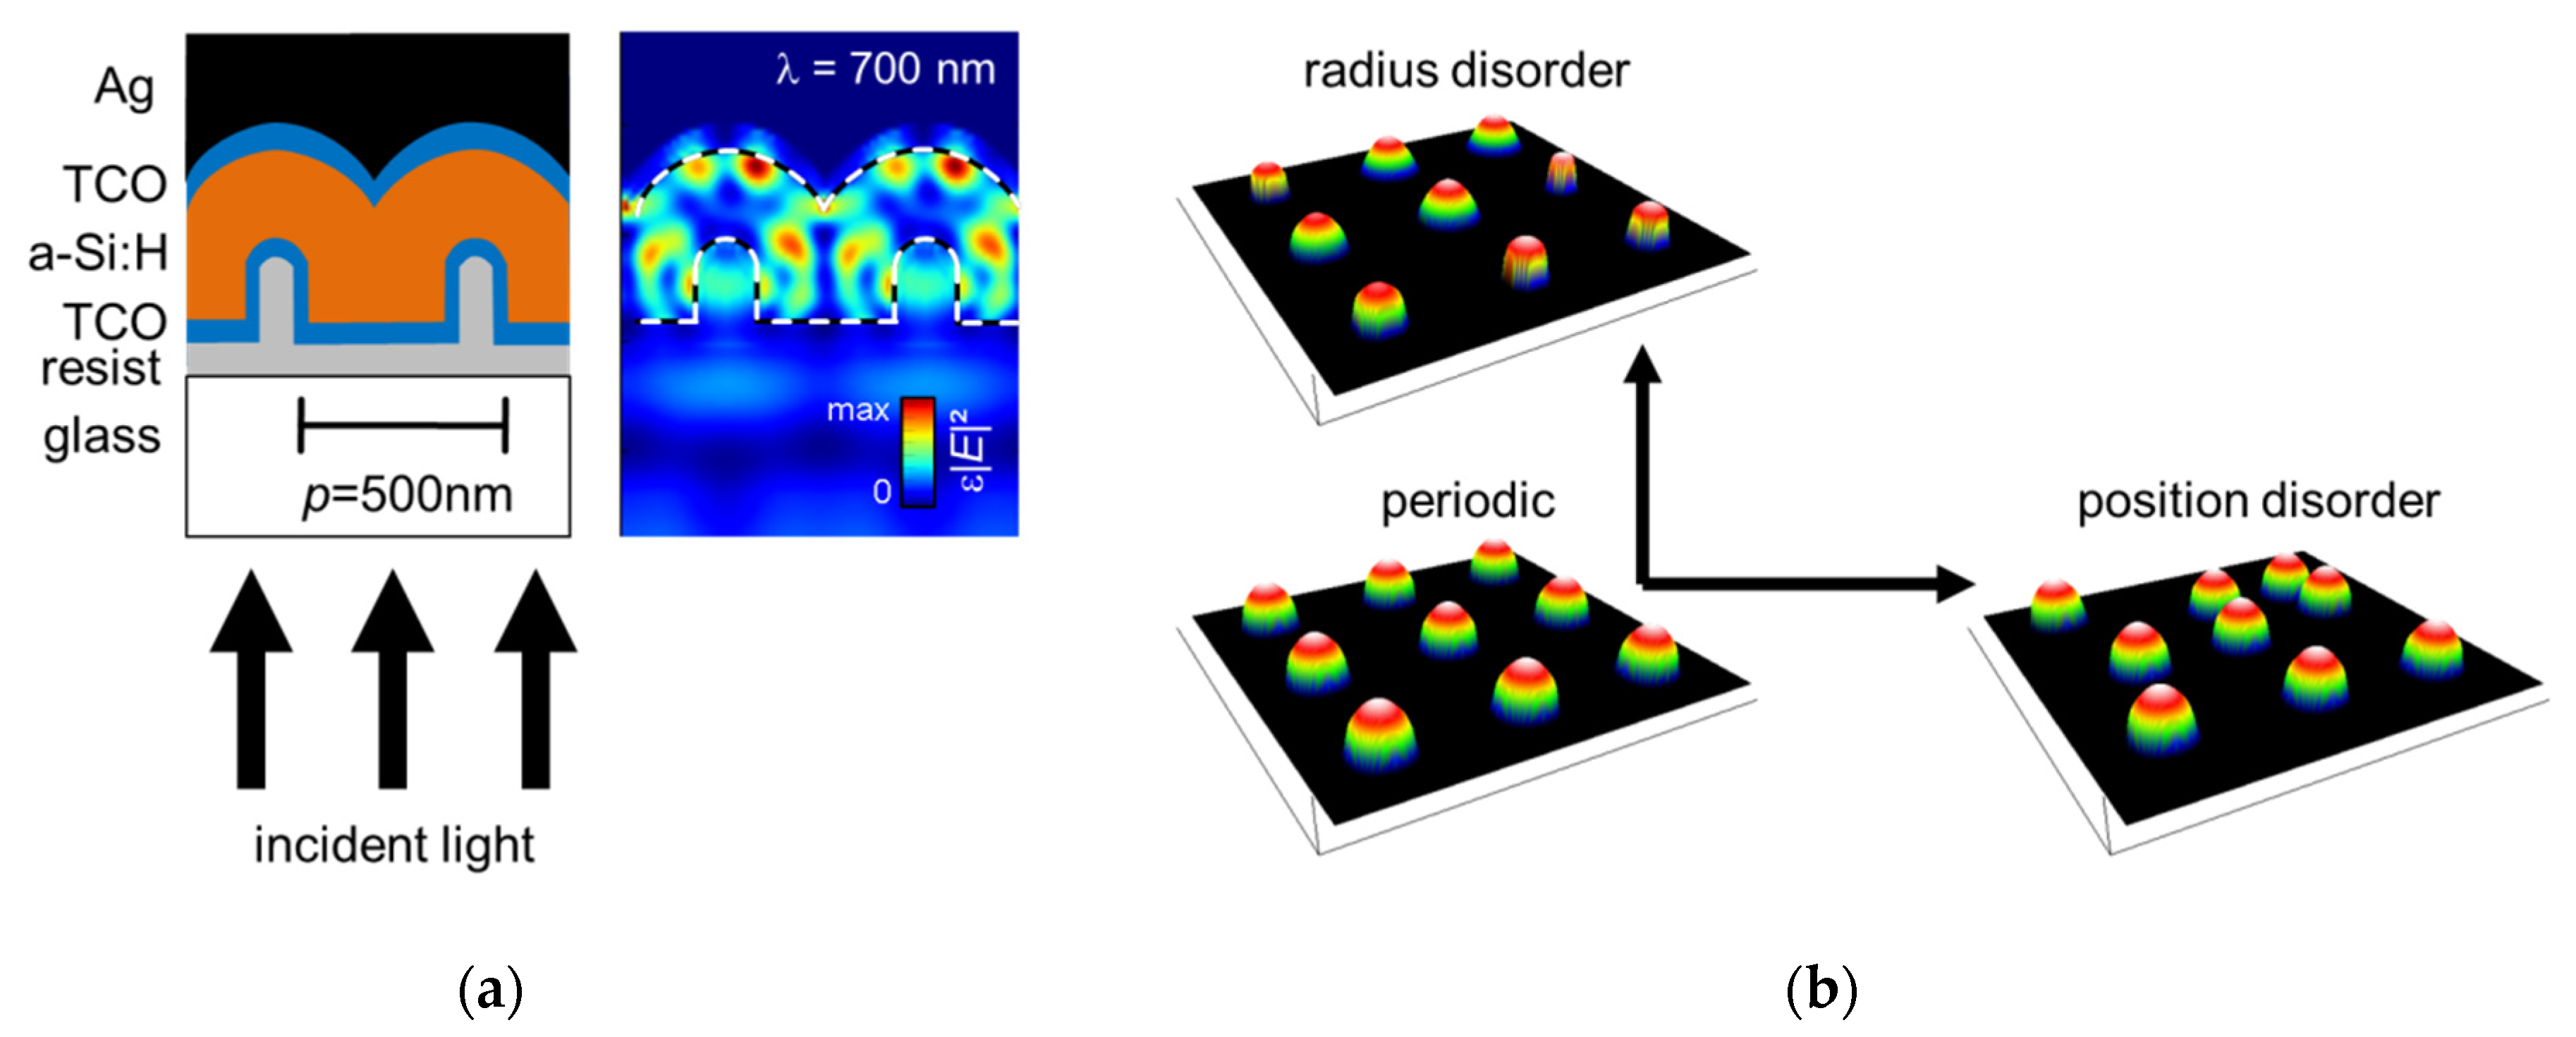
3.1. Spectral Broadening of Light Coupling to Waveguide Modes
Generally, the light coupling to waveguide modes in a photonic device with disordered gratings reveal a spectral broadening compared to the situation without disorder. This can be explained by (1) the broadening of the wave vector transfer and (2) the broadening of the waveguide modes. Both increase the total coupling of the incident light to waveguide modes. The former process leads to a certain range of wave vectors that is transferred to incident photons. Due to the dispersion relation of the waveguide mode, this range is translated to spectrally broader resonance energy. The latter process results in an internal optical damping of the waveguide mode, which is directly accompanied by broader resonance. This means that both possible processes lead to a broadening of the resonances in an optical experiment. Therefore, it is difficult to derive their contribution directly.
In the following sections, we demonstrate that the dominating process of spectral broadening of light coupling to waveguide modes depends on the way in which disorder is introduced to the nanophotonic grating structure. For this work, a texture analysis based on fast Fourier transformation (FFT) is applied as well as an analysis of the local absorber layer thickness variation. Finally, the impact of the disordered grating textures on the spectral response of the solar cells is investigated.
3.2 Texture Analysis
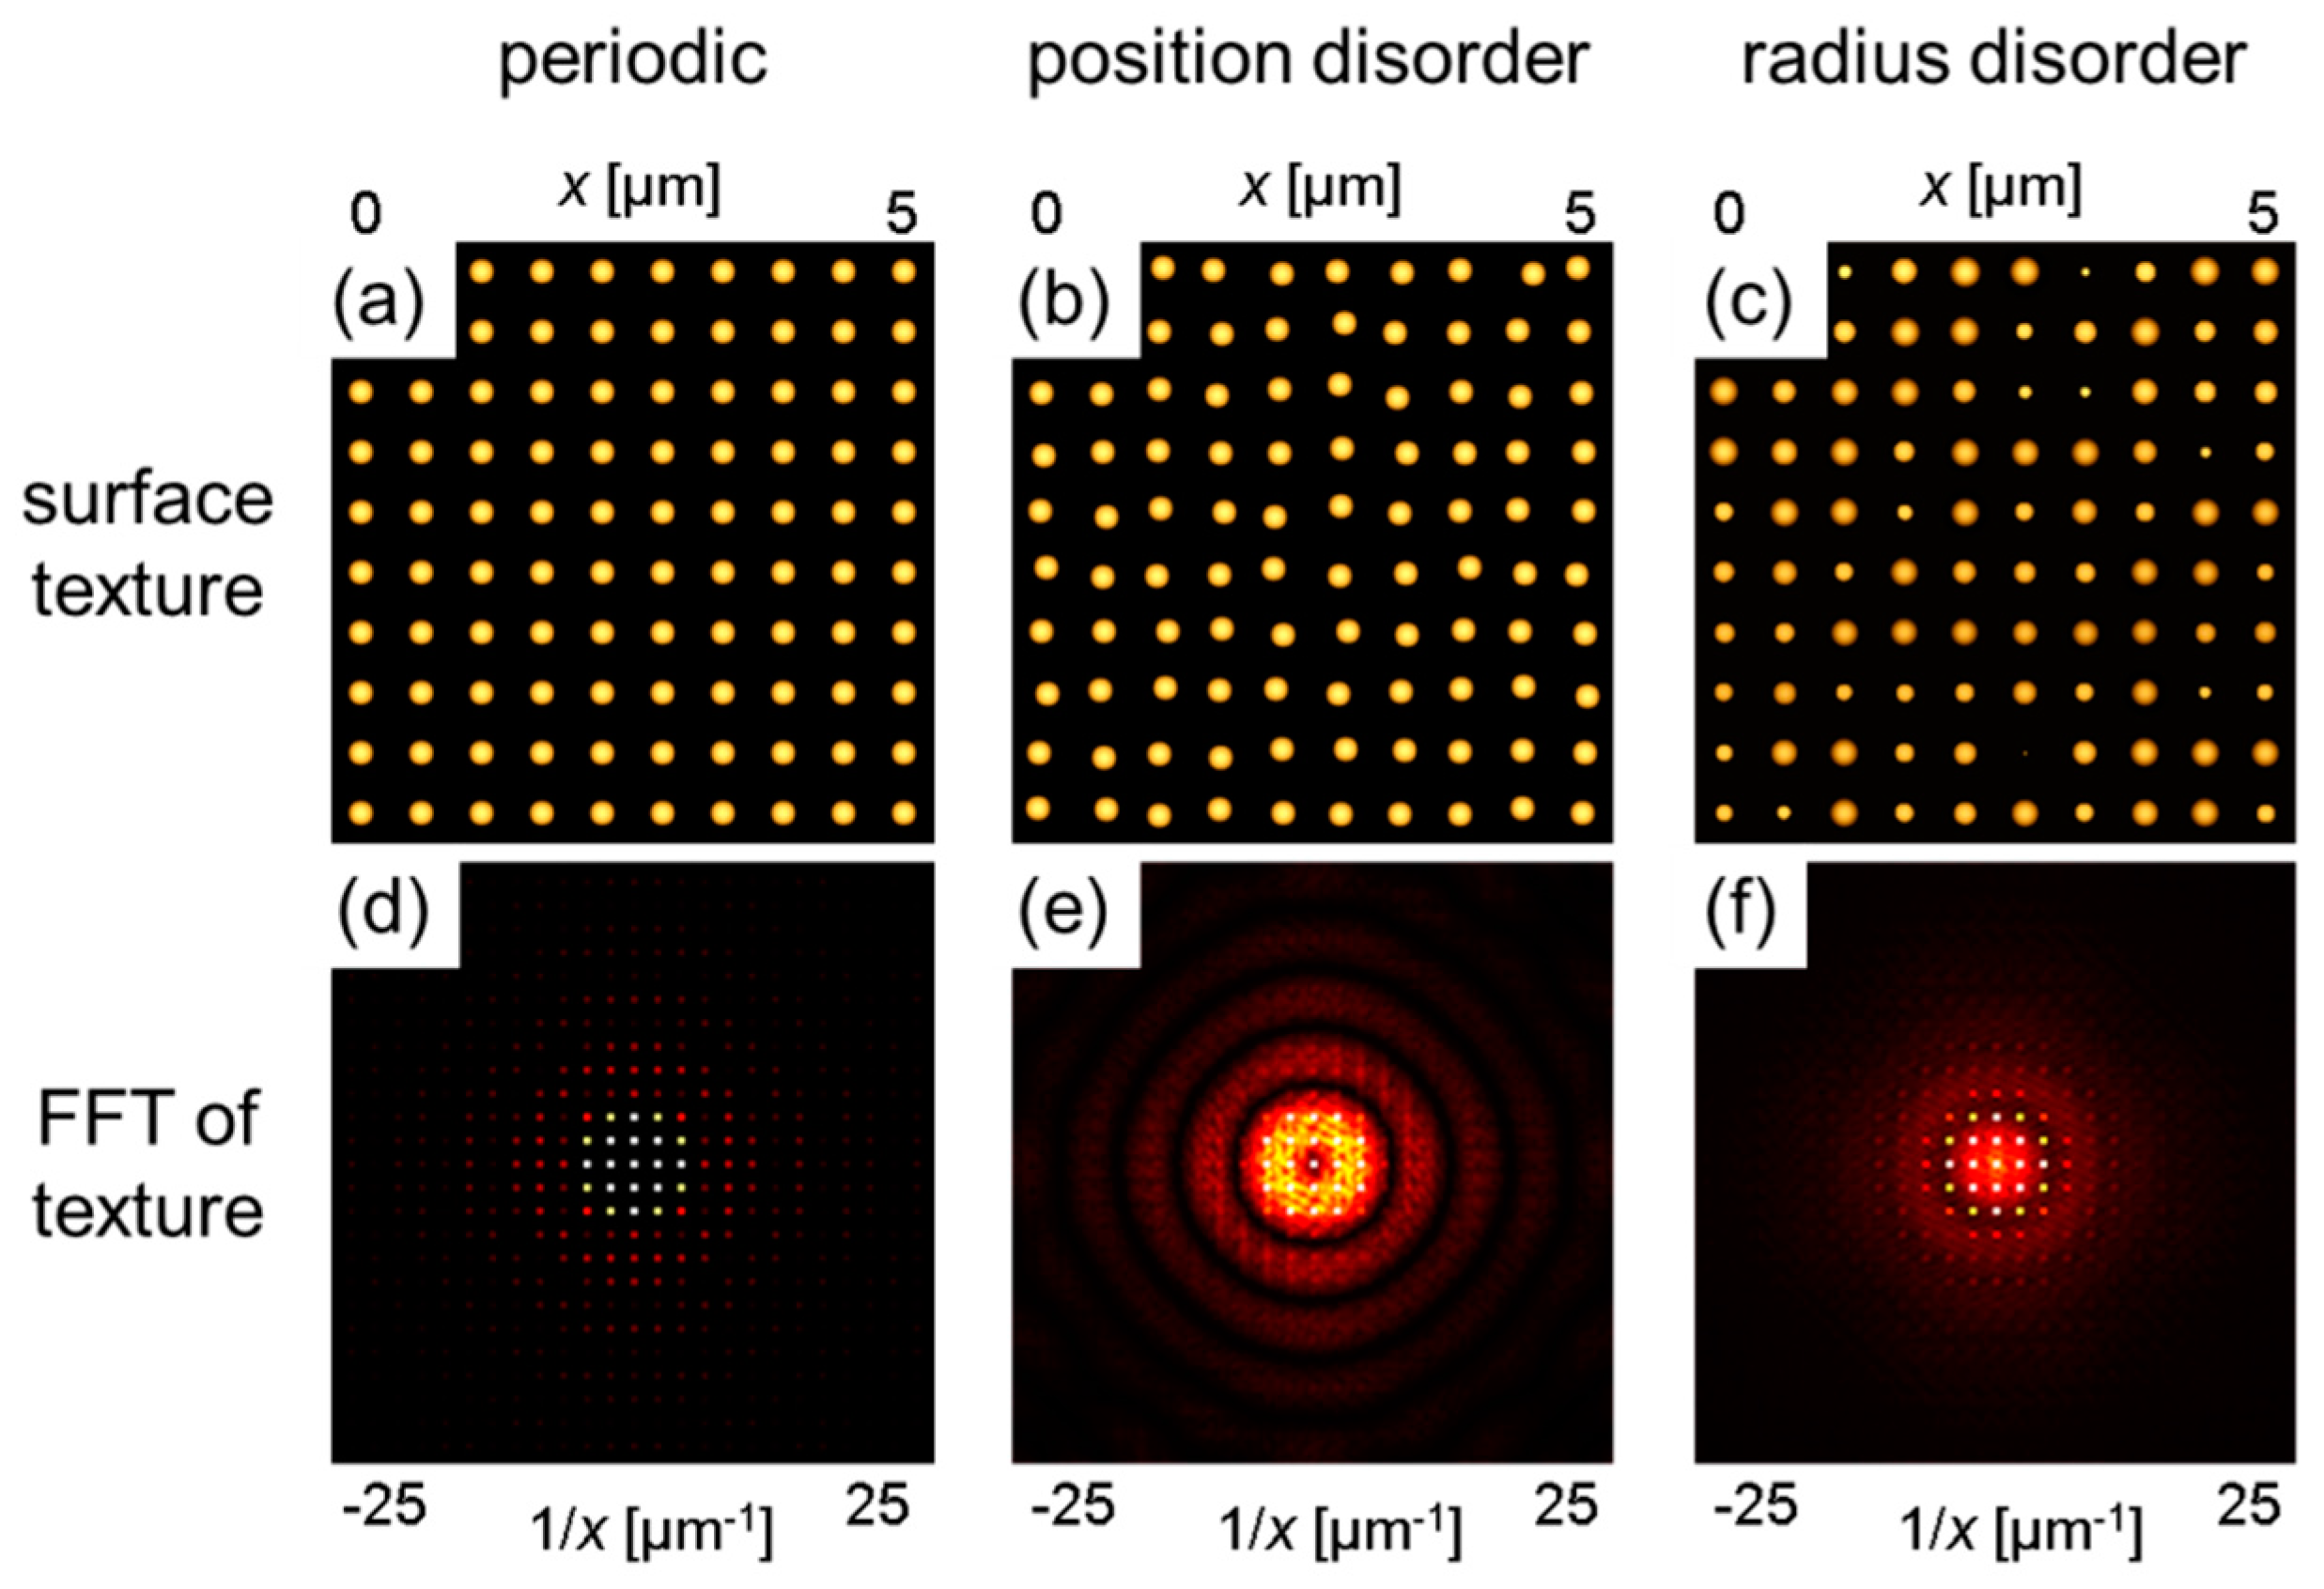
In order to prove a possible broadening of the transferred wave vector, we investigated the variety of applied disordered interface textures. A perfect periodic interface structure reveals a well-defined wave vector transfer by light diffraction into different orders. The transferred wave vector can be directly determined from the period of the grating. In the case of a disordered texture, it is necessary to apply a Fourier analysis to obtain the distribution of lateral feature sizes. Perfect periodic gratings show distinct peaks in the Fourier transform, whereas fully randomized textures result in a broad Fourier spectrum. In other words, any possible broadening of the transferred wave vector in a disordered grating texture is connected to a broader peak in the Fourier transform of the texture. Therefore, FFT is applied to our assumed disordered grating textures in order to evaluate the broadening of the transferred wave vector.
Figure 2 shows selected interface topographies and their corresponding FFT images for the case of the perfect periodic grating, the disordered texture assuming a position disorder with
= 22 nm, and the disordered texture with an introduced radius disorder of
= 32 nm. As expected, the FFT image of the perfect periodic grating structure only consists of distinct peaks at integer multiples of the reciprocal grating period. This reflects the well-defined wave vector transfer when a periodic texture is applied to a wave guiding slab. For both disordered textures, a diffusive signature is visible in the FFT images. For the structure with radius disorder (
Figure 2c), there is only a weak diffusive background visible in the FFT (
Figure 2f) where the peaks related to the diffraction orders are still dominating. In contrast, the diffusive part strongly dominates the FFT in the case of an applied position disorder (
Figure 2e). Note that the applied standard deviations cannot be directly compared as their boundaries are different. It is therefore concluded that position disorder influences the wave vector transfer much more strongly than radius disorder.
3.3. Local Layer Thickness
It is difficult to quantify the impact of the interface structure of a wave guiding slab on the spectral width of the light coupling to the resonance mode as, without any interface structure, this light coupling is not possible at all. The situation becomes much more complex when looking for the impact of disorder within a grating coupler on the spectral width of the waveguide mode. On the one hand, the waveguide mode is already influenced in the case of the ordered grating structure. On the other hand, the disorder in the grating structure already influences the wave vector that is transferred to incident photons in a way that the resonance mode spectrally broadens.
In the present study, the wave guiding slab is grown on top of a textured substrate, which means that the interfaces of the slab are corrugated. In particular, the growth of a-Si:H can be assumed to be isotropic, which leads to a modification of the backside texture as compared to the frontside texture [
12]. Due to this isotropic growth, the thickness of the wave guiding layer fluctuates along the surface texture when the thickness is defined along the intentional growth direction. Since its thickness is a main parameter to determine the resonance condition of a wave guiding slab, the disorder in the local layer thickness behavior can be used to investigate the impact of the disorder on the quality of the wave guiding properties.
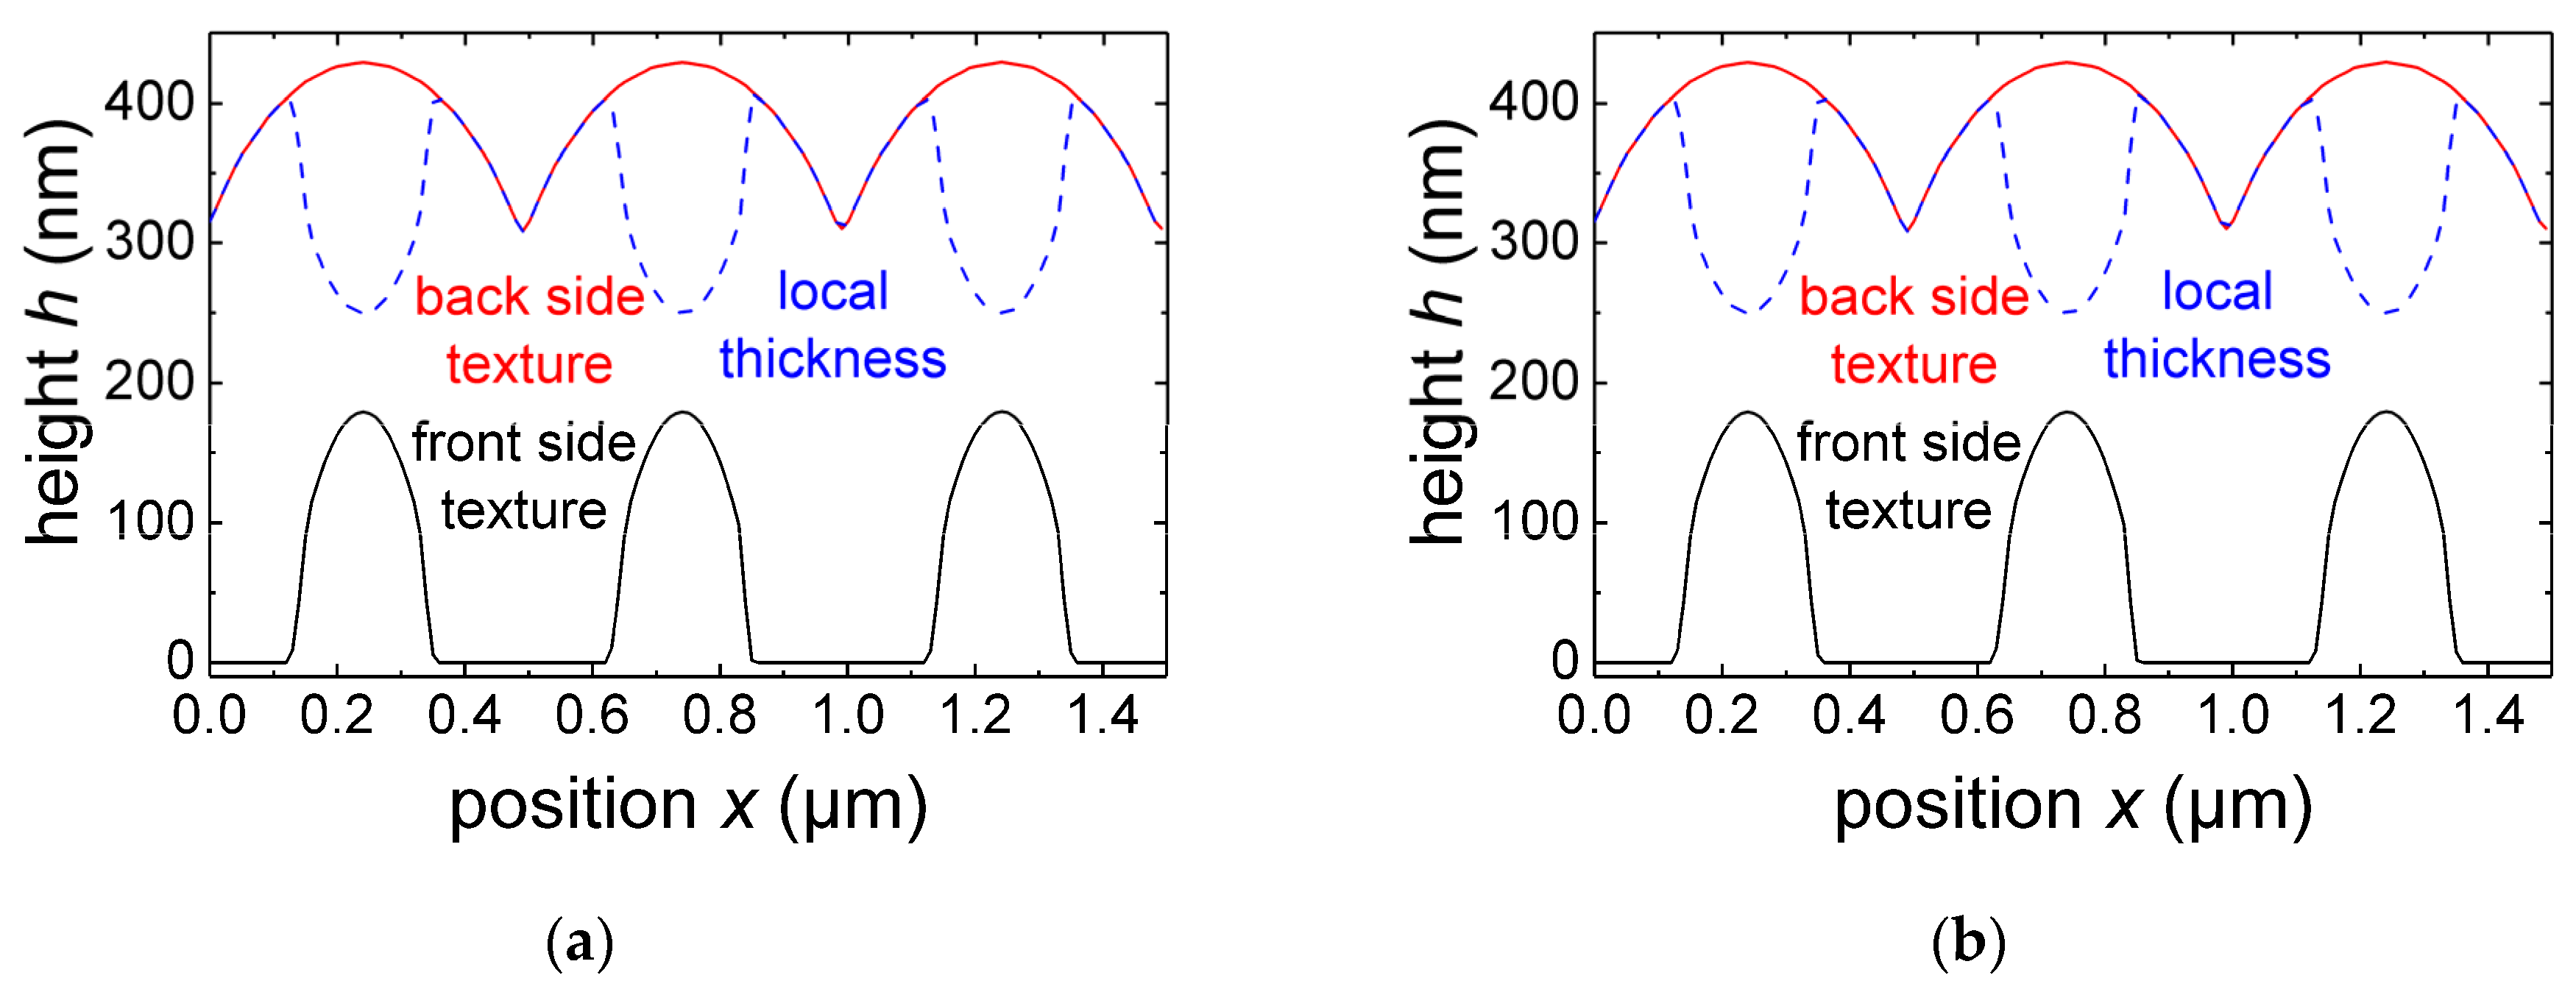
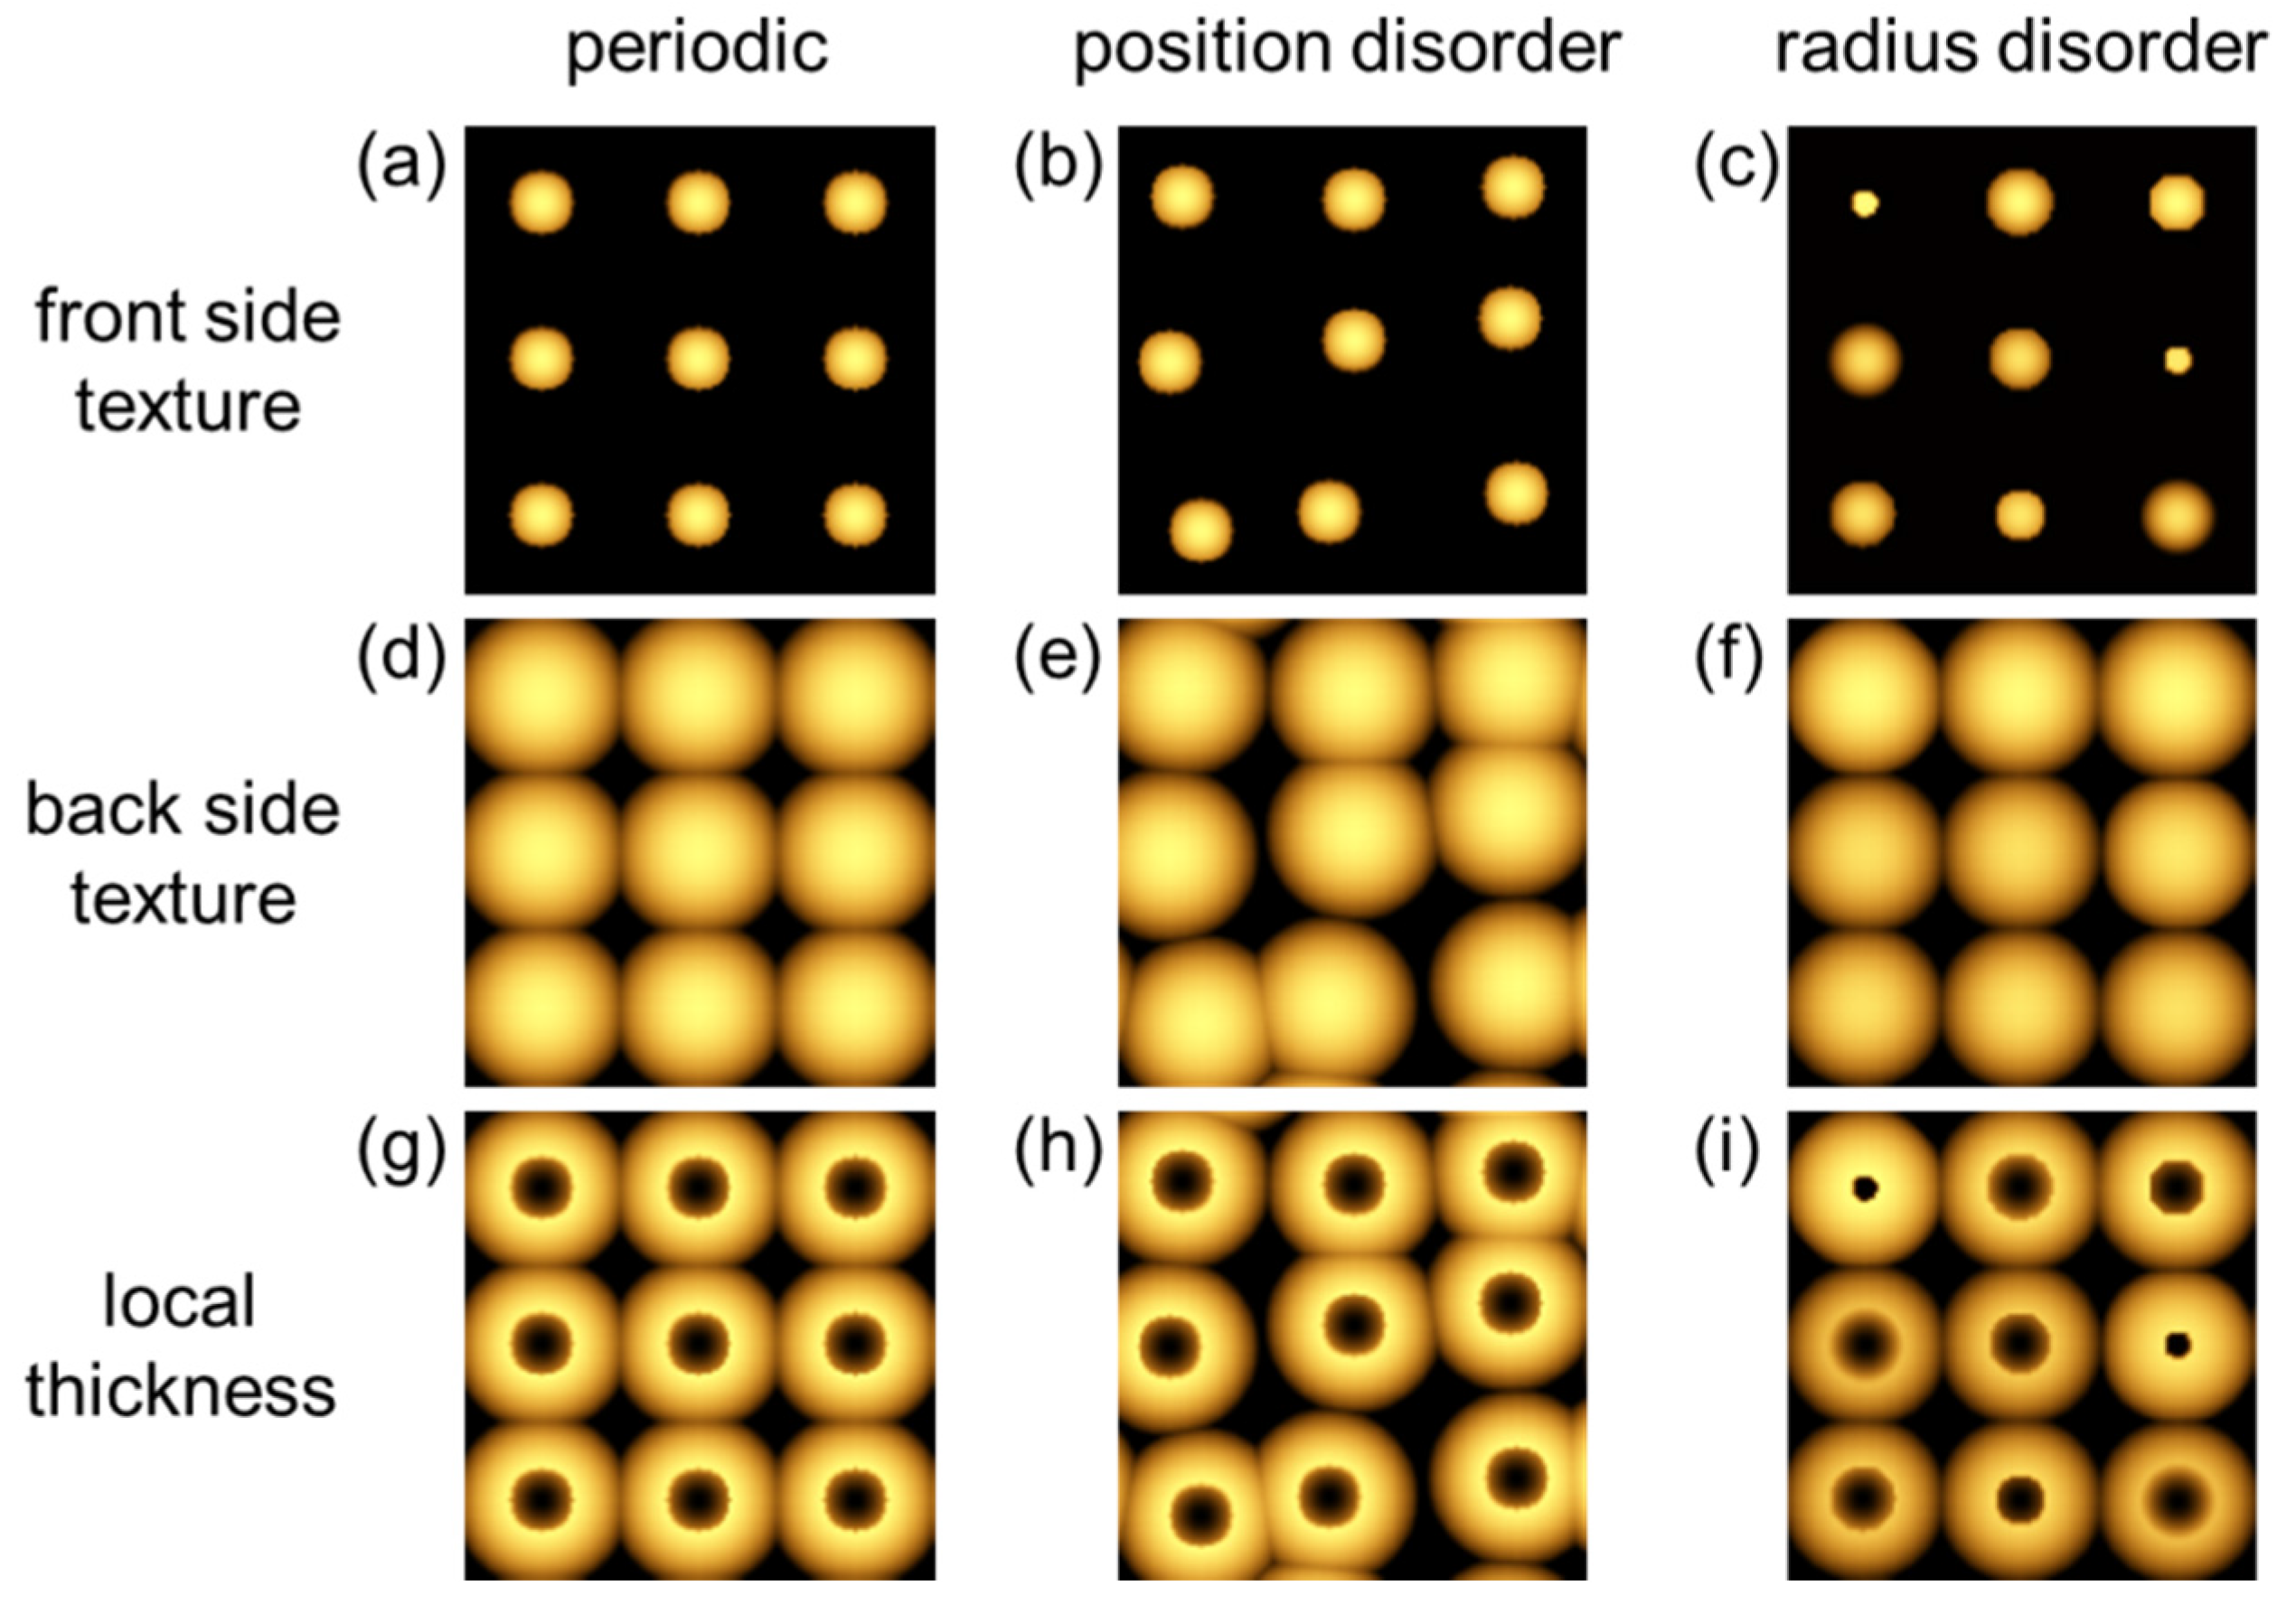
Figure 3 shows the height profiles for the frontside texture (black lines), the backside texture (red lines) and the corresponding local layer thickness (red dashed lines), which is defined by the difference between the height profile at the backside and at the frontside. The results for the perfect periodic case are shown in
Figure 3a, while those for a representation of a radius disorder introduced into the grating structure are shown in
Figure 3b. Although the frontside textures of both structures (periodic and with radius disorder) look quite different from each other, the corresponding backside textures appear to be very similar. Small differences can only be obtained by a close look. This is a result of the isotropic growth of a-Si:H. As a consequence, the local layer thicknesses show significant differences depending on the applied disorder.
In order to visualize this for the different investigated textures, top view images of the frontside texture, the backside texture, and the local layer thickness are illustrated in
Figure 4 for the perfect periodic case and the structures with position disorder and radius disorder. As expected, the frontside textures (
Figure 4a–c) reveal significant differences for the differently applied disorder. The backside textures (
Figure 4d–f)) are more or less equalized for the perfect periodic case and the texture with radius disorder. Significant differences were only found for the texture with position disorder. This is a result of the isotropic growth of a-Si:H on top of the structured interface. Due to this growth behavior, the radius of the half-conically shaped nanostructures increases with the layer thickness. As long as the layer thickness reaches or exceeds half the distance between the nanostructures, the resulting radius is defined by the layer thickness rather than the original radius.
This has a strong impact on the local layer thickness, as can be seen in
Figure 4g–i. Each unit cell shows a typical characteristic in the perfect periodic case, which is quite similar to the shape of the unit cells for the texture with position disorder applied to the grating. The waveguide resonance can be understood as laterally coupled optical resonators with each unit cell forming a resonator. When each resonator exhibits the same resonance energy, the lateral interconnection leads to an extended optical mode, the waveguide mode. In the case of the texture with radius disorder, the shape of the different resonators differs significantly from each other. Therefore, the formation of an extended optical mode is hindered. In other words, any guided mode is damped, which leads to a spectrally broader resonance.
From this part of the investigation, it is concluded that radius disorder has a much stronger influence on the spectral width of the waveguide mode than position disorder. It should be kept in mind that, in contrast, the position disorder has a stronger impact on the wave vector transfer than radius disorder. With these two ways of implementing disorder in a grating structure, the investigation of the impact of these two origins of broadening on the performance of a spectrally broad optoelectronic device such as a thin-film solar cell is now possible.
3.4. Impact of Disorder in Solar Cells
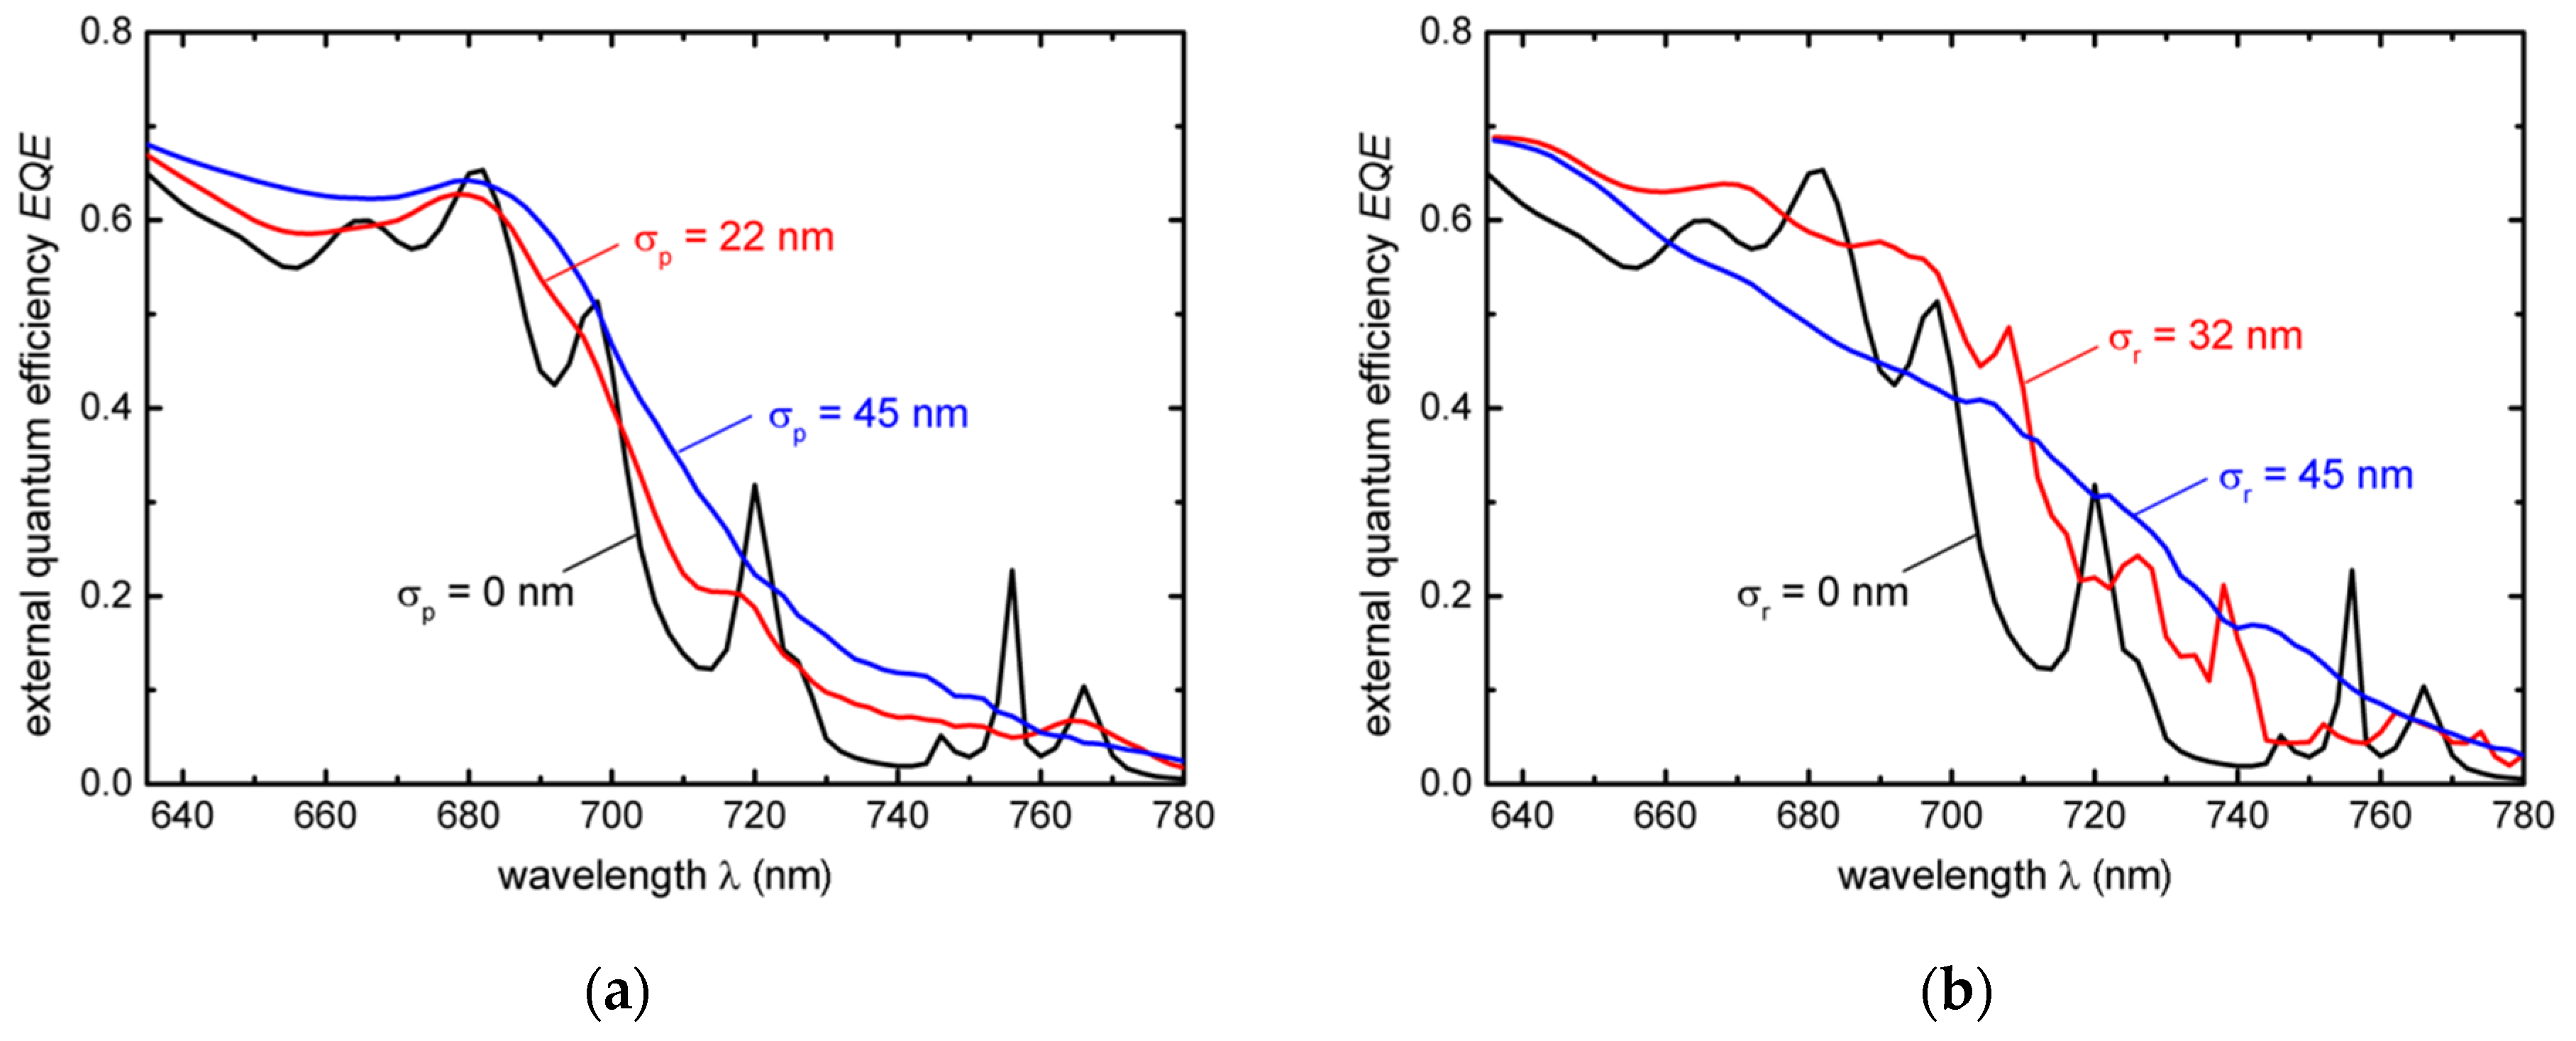
In order to evaluate the impact of the disordered grating textures on the broadband performance of the a-Si:H solar cell, we simulated the EQE in the spectral range from 635 nm to 780 nm with a spectral resolution of 2 nm. For shorter wavelengths, the absorption coefficient of a-Si:H is too high for the formation of waveguide modes; for longer wavelengths, the absorption coefficient is too low to contribute significantly to the photocurrent generation at the given cell thickness. The results are shown in
Figure 5.
Figure 5a,b illustrate the broadening of the spectral resonances in the EQE due to the position disorder and radius disorder, respectively. In both illustrations, the black line corresponds to the perfect periodic case, which is characterized by distinct maxima in the EQE which are related to the resonant light coupling of incident light to waveguide modes in the absorber layer of the solar cell. The EQEs for the implementation of a moderate disorder into the grating textures are shown as red lines. These curves still show some resonant behavior, but with strongly reduced peak heights which are spectrally much broader. The blue curves depict the situation for a high degree of disorder. Resonant behaviors are no longer visible and the shape of the curves is smooth.
Obviously both physical effects, the less well-defined wave vector transfer in the case of the position disorder as well as the less well-defined waveguide mode in the case of the radius disorder lead to the similar effect of a smearing out of the resonant behavior of light coupling of incident light to guided modes in the absorber layer of the solar cell. Nevertheless, the two ways of applying disorder into the grating textures show significant differences. In the case of the position disorder (
Figure 5a), the EQE is reduced at the spectral positions of the waveguide modes (e.g., at
~720 nm) but reveal an overall improved EQE off of these spectral resonance positions (e.g., at 700 nm
715 nm or 725 nm
750 nm). This already suggests an overall improvement of photocurrent generation due to the implementation of position disorder into the grating texture. In contrast, the EQE curves in the case of the grating textures with radius disorder show spectral regions where the EQE is improved, but also other regions with a reduced response (e.g., at 670 nm
690 nm). In order to quantify the impact of the different ways of disorder on the solar cell performance in the broad spectral range, the photocurrent is determined for each structure and the results are compared to each other.
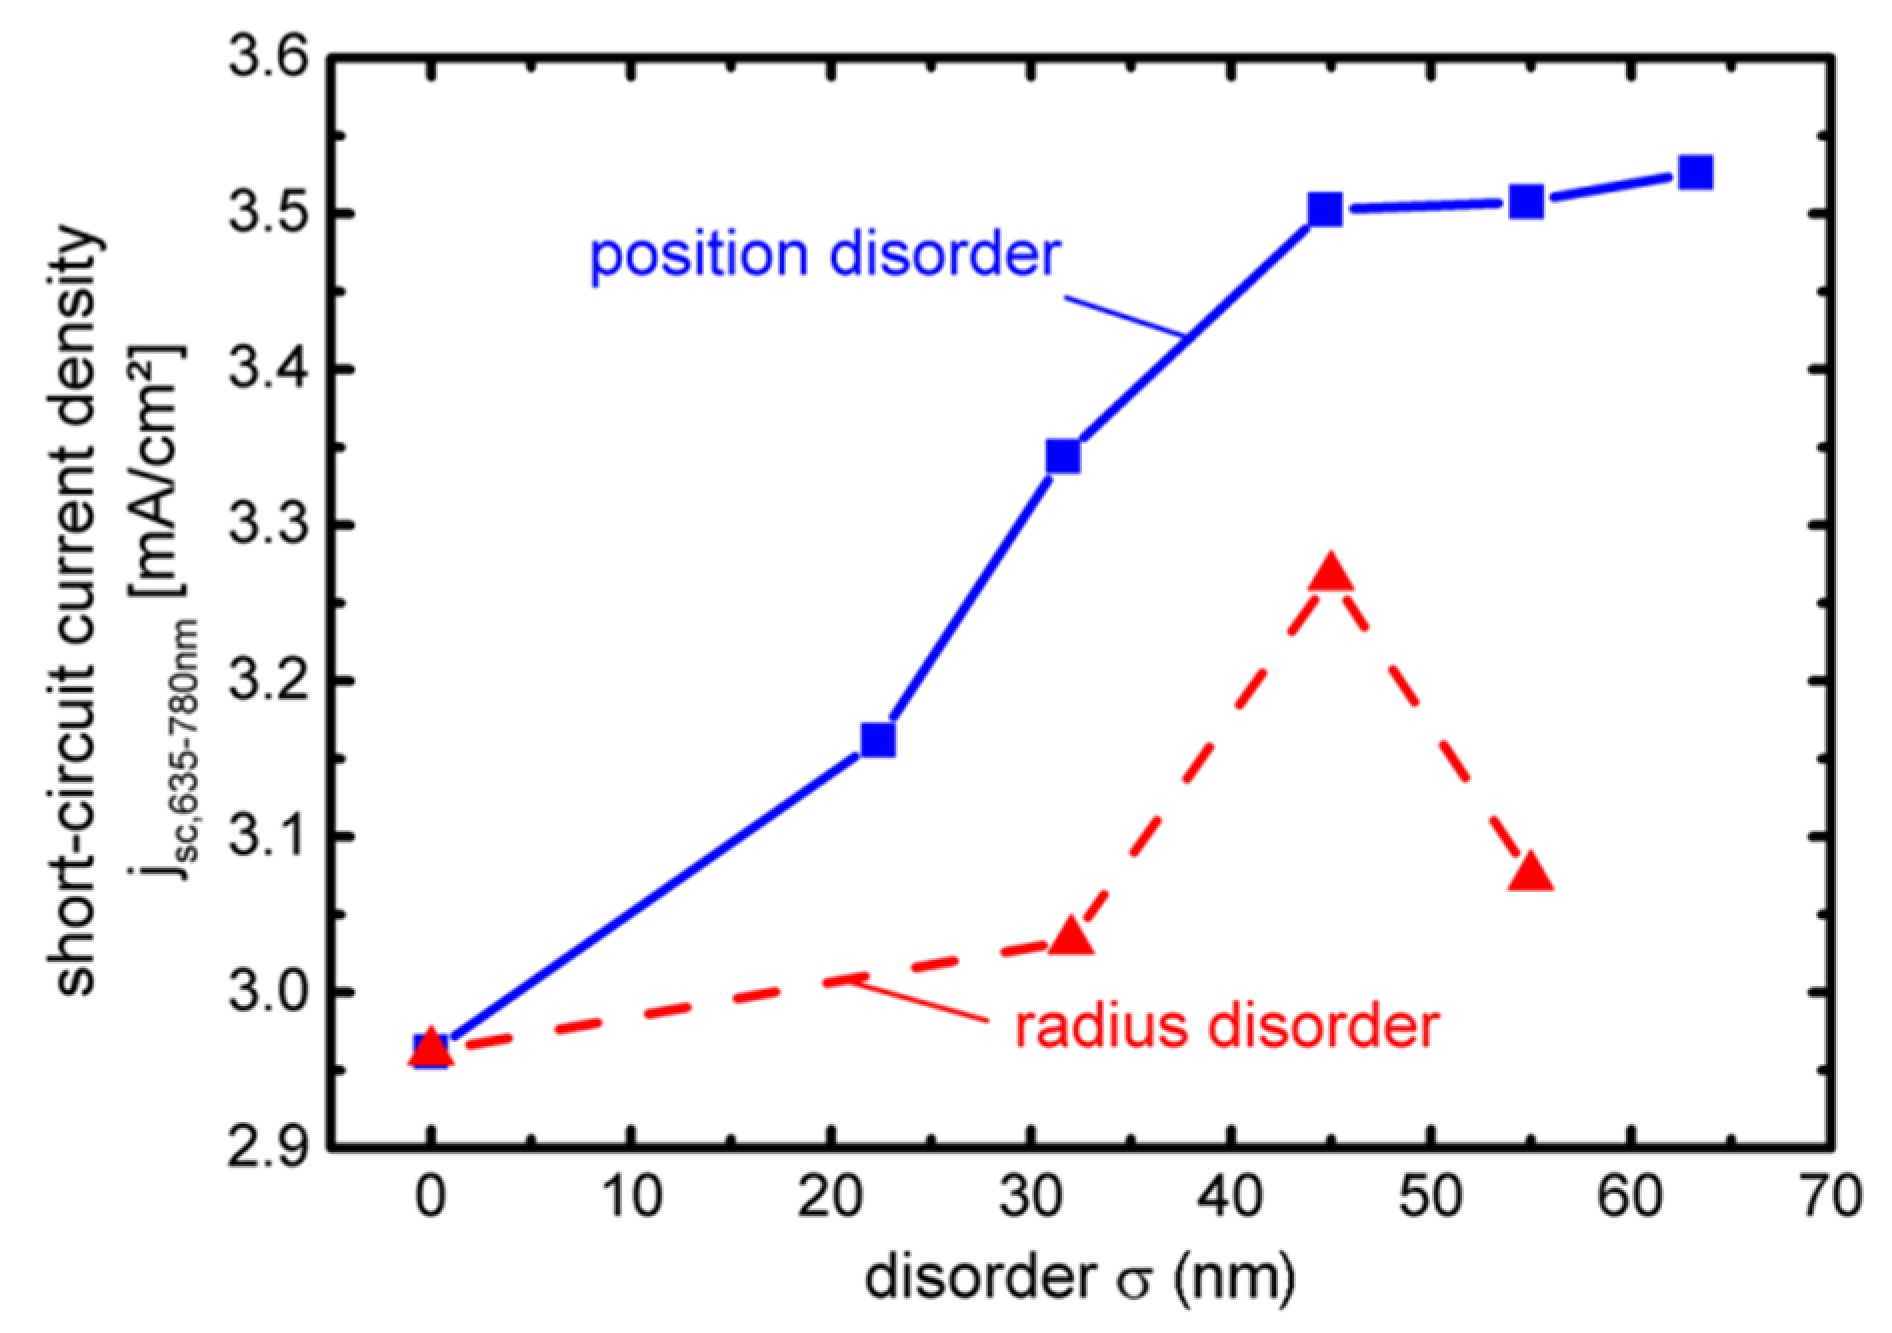
Therefore, the simulated EQE curves are weighted by the solar irradiance and spectrally integrated to obtain the short-circuit current density (J
SC) of the solar cells generated in the spectral region from 635 nm to 780 nm. The results are plotted in
Figure 6 as a function of the respective disorder parameter. We found that an increase of position disorder monotonically enhances the short-circuit current density (blue solid line). At larger disorder, J
SC of the solar cell saturates. The radius disorder (red dashed line) shows a different trend. For smaller disorder parameters up to 45 nm, the J
SC increases. Afterwards, the short-circuit current density decreases while still surpassing the level of the well-ordered periodic texture.
Both investigated ways of introducing disorder into the grating structure lead to an improvement of JSC of the solar cell as long as the strength of disorder is moderate. With a higher degree of disorder, the impact on the solar cell performance varies for the different ways of disorder. The JSC of the solar cells with position disorder in the grating texture saturates. In contrast, solar cells with a higher degree of radius disorder exhibit lower JSC than solar cells with a moderate degree of radius disorder. This different behavior is explained as follows.
In the case of the position disorder, the improvement of JSC is mainly explained by a diffuse wave vector transfer. This follows from the Fourier transforms of the topographies of the different disordered grating textures, which show the strongest diffuse part in the case of the position disorder.
The increase of JSC in the case of the radius disorder is mainly explained by a broadening of the waveguide mode. Here, the Fourier transforms of the textures show only a weak diffuse part. Furthermore, the local layer thickness varies strongly from unit cell to unit cell due to the isotropic growth of the a-Si:H layer. This leads to a broadening of the resonance condition of the waveguide mode. A further increase of the radius disorder results in a disturbance of the waveguide mode because the differences between the individual resonances of the unit cells become too large to form an extended optical mode in the layer. This explains the decrease of JSC for larger radius disorder.
The two presented ways of implementing disorder into a grating texture are merely two possible examples. Of course, there are many other possibilities to vary the shape of the particles or their spatial distribution. The investigated position and radius disorder represent two extreme cases where the two basic physical mechanisms are dominating, respectively. How other types of disorder impact the light coupling to waveguide modes and, thereby, solar cell efficiency is open to further research.


