3.1. Laminar Flow Model
According to Merkli and Thomann [
7], an oscillatory flow is considered laminar as long as the Reynolds number (based on the thickness of Stokes’ layer) is less than 400. This is defined as
, with
,
and
representing the axial velocity amplitude, viscosity and angular velocity, respectively. The values of the Stokes Reynolds number for all drive ratios investigated by Shi et al. [
16,
17] are shown in
Table 1. All of these are lower than the critical value suggested in [
7],
. Thus, at first, a laminar model was used to model the flow and heat transfer for the drive ratios (
;
is the mean pressure in the resonator) in
Table 1.
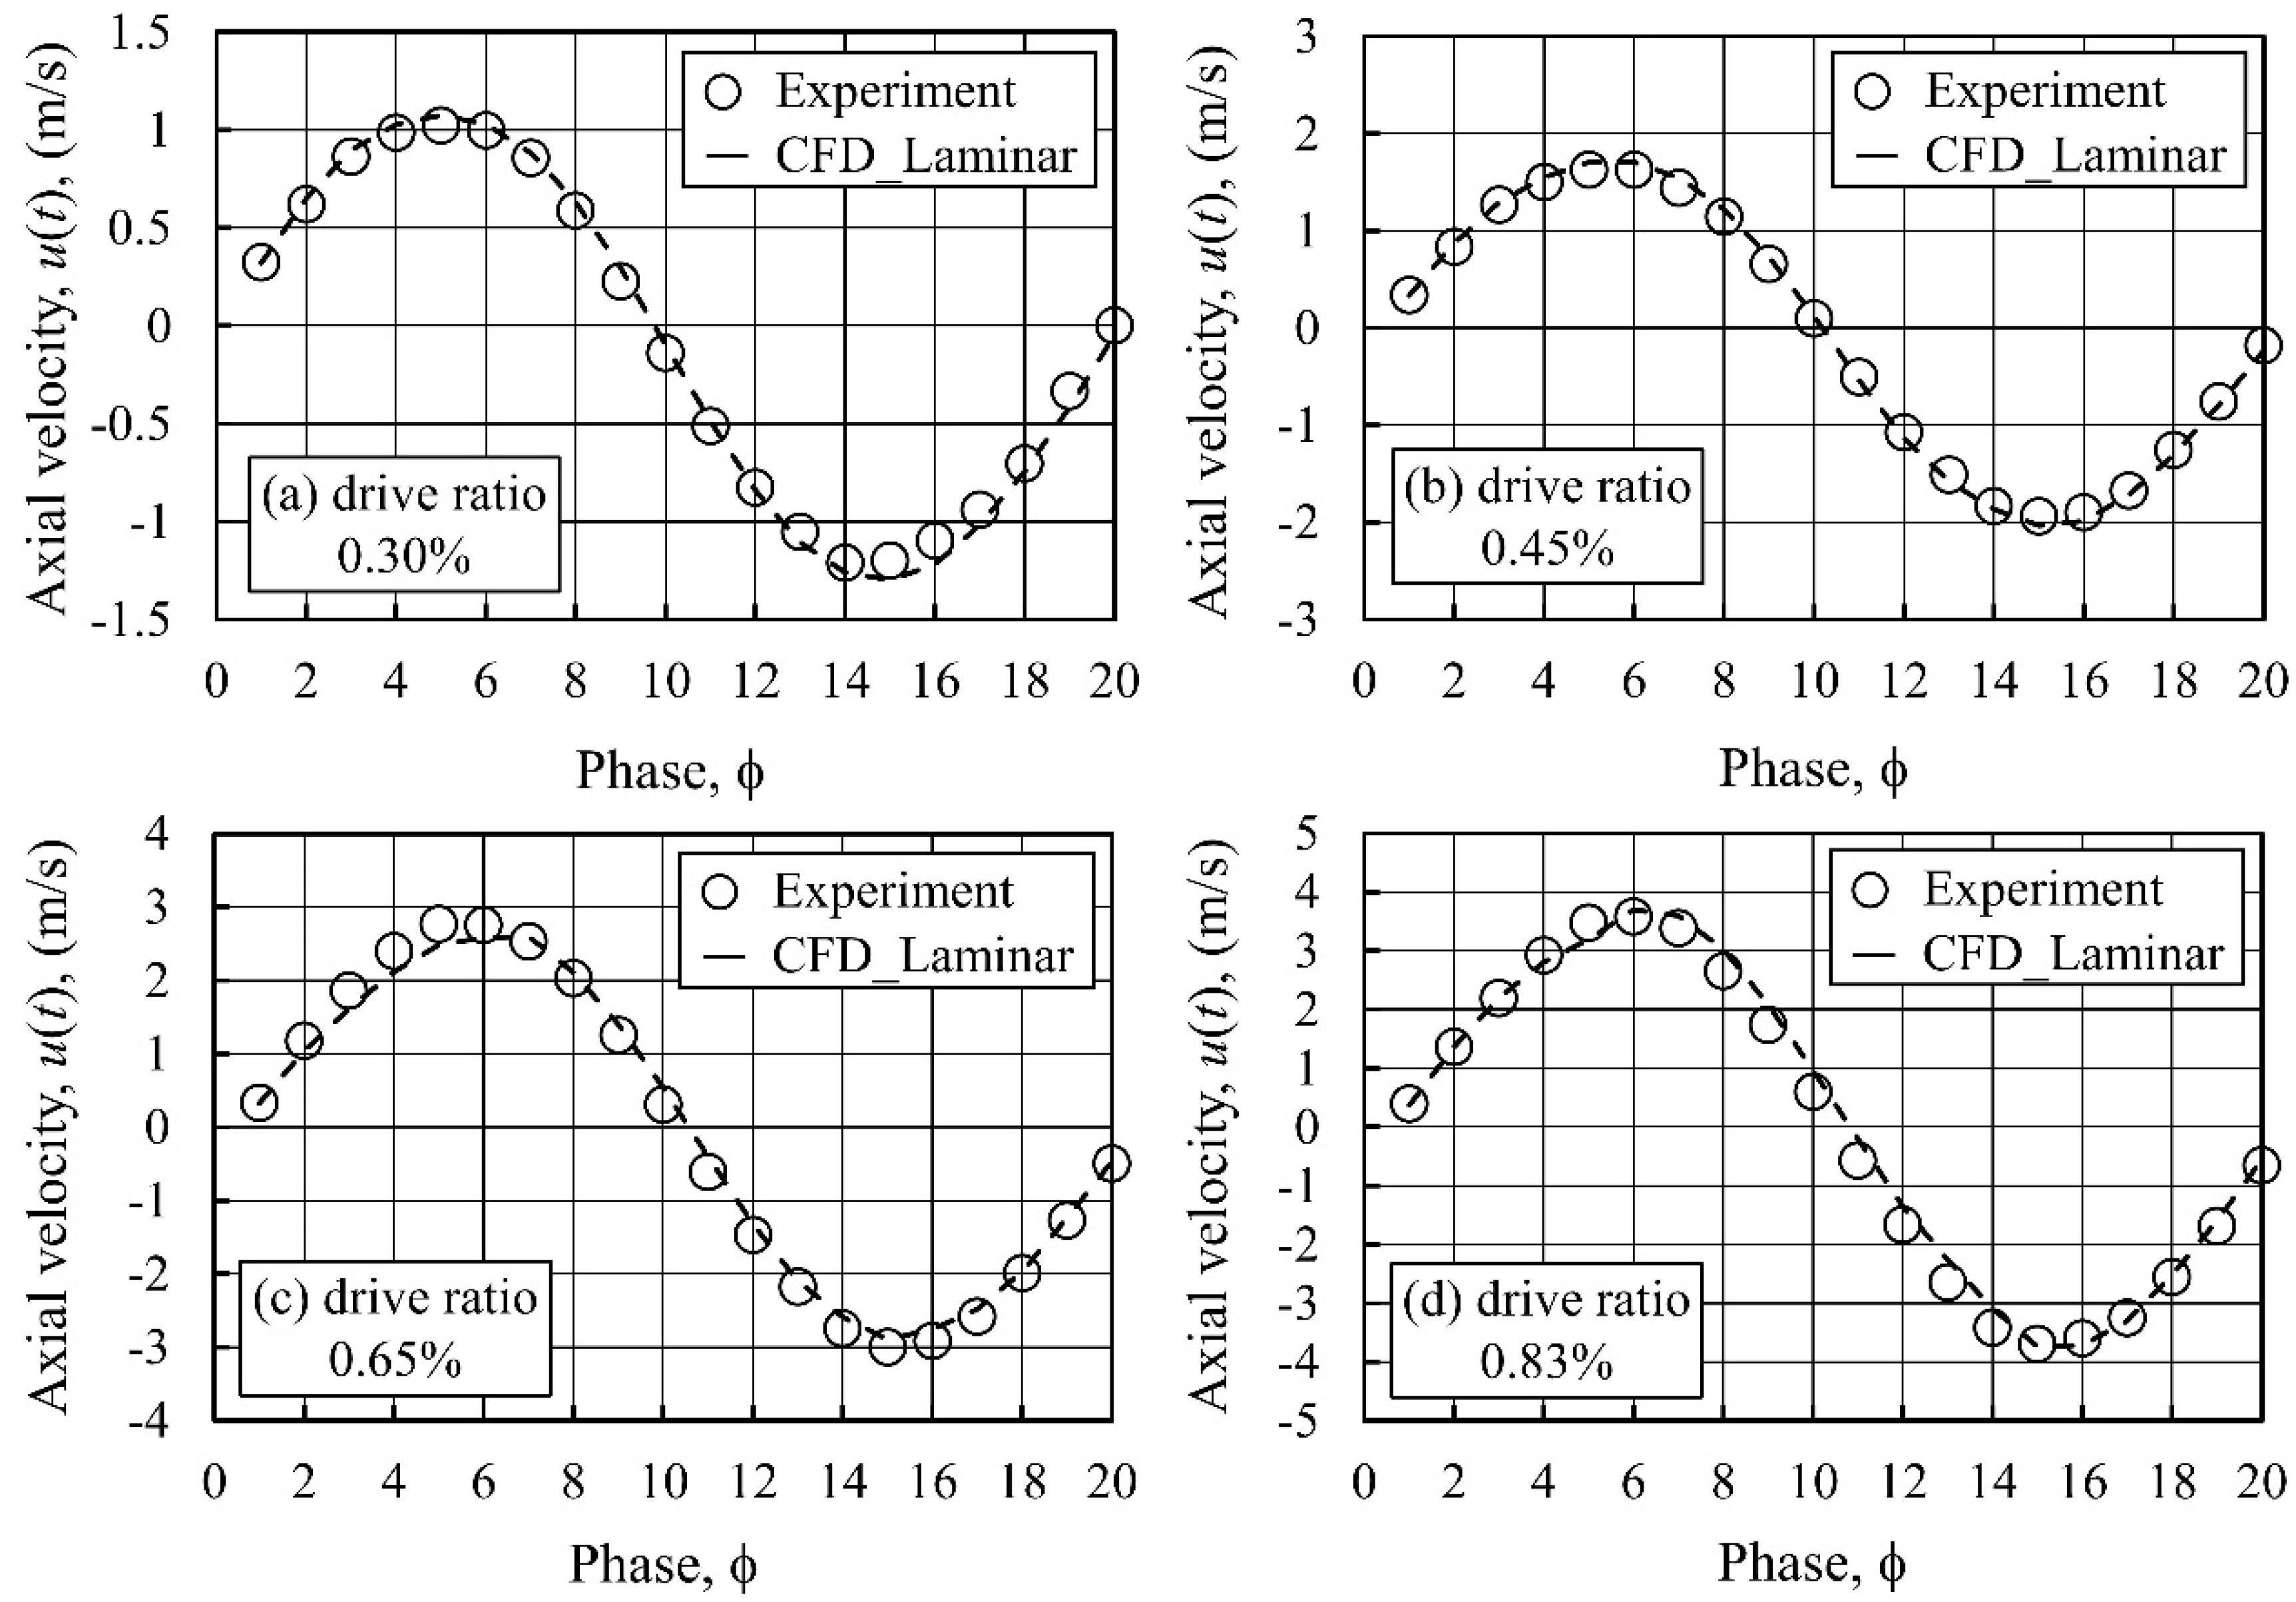
Figure 3 shows the variation over the cycle of the axial velocity at the channel centre, 10 mm from the joint between the HHX and CHX plates, inside the cold channel. Results from the laminar model, for the four drive ratios, are plotted against the experimental results. For all drive ratios, the numerical and experimental values of velocity agree reasonably well, but with slight discrepancies at some phases of a flow cycle. Maximum deviation between numerical and experimental values for drive ratios of 0.30%, 0.45%, 0.65% and 0.83% are 8%, 4.7%, 10.1% and 4.6%, respectively.
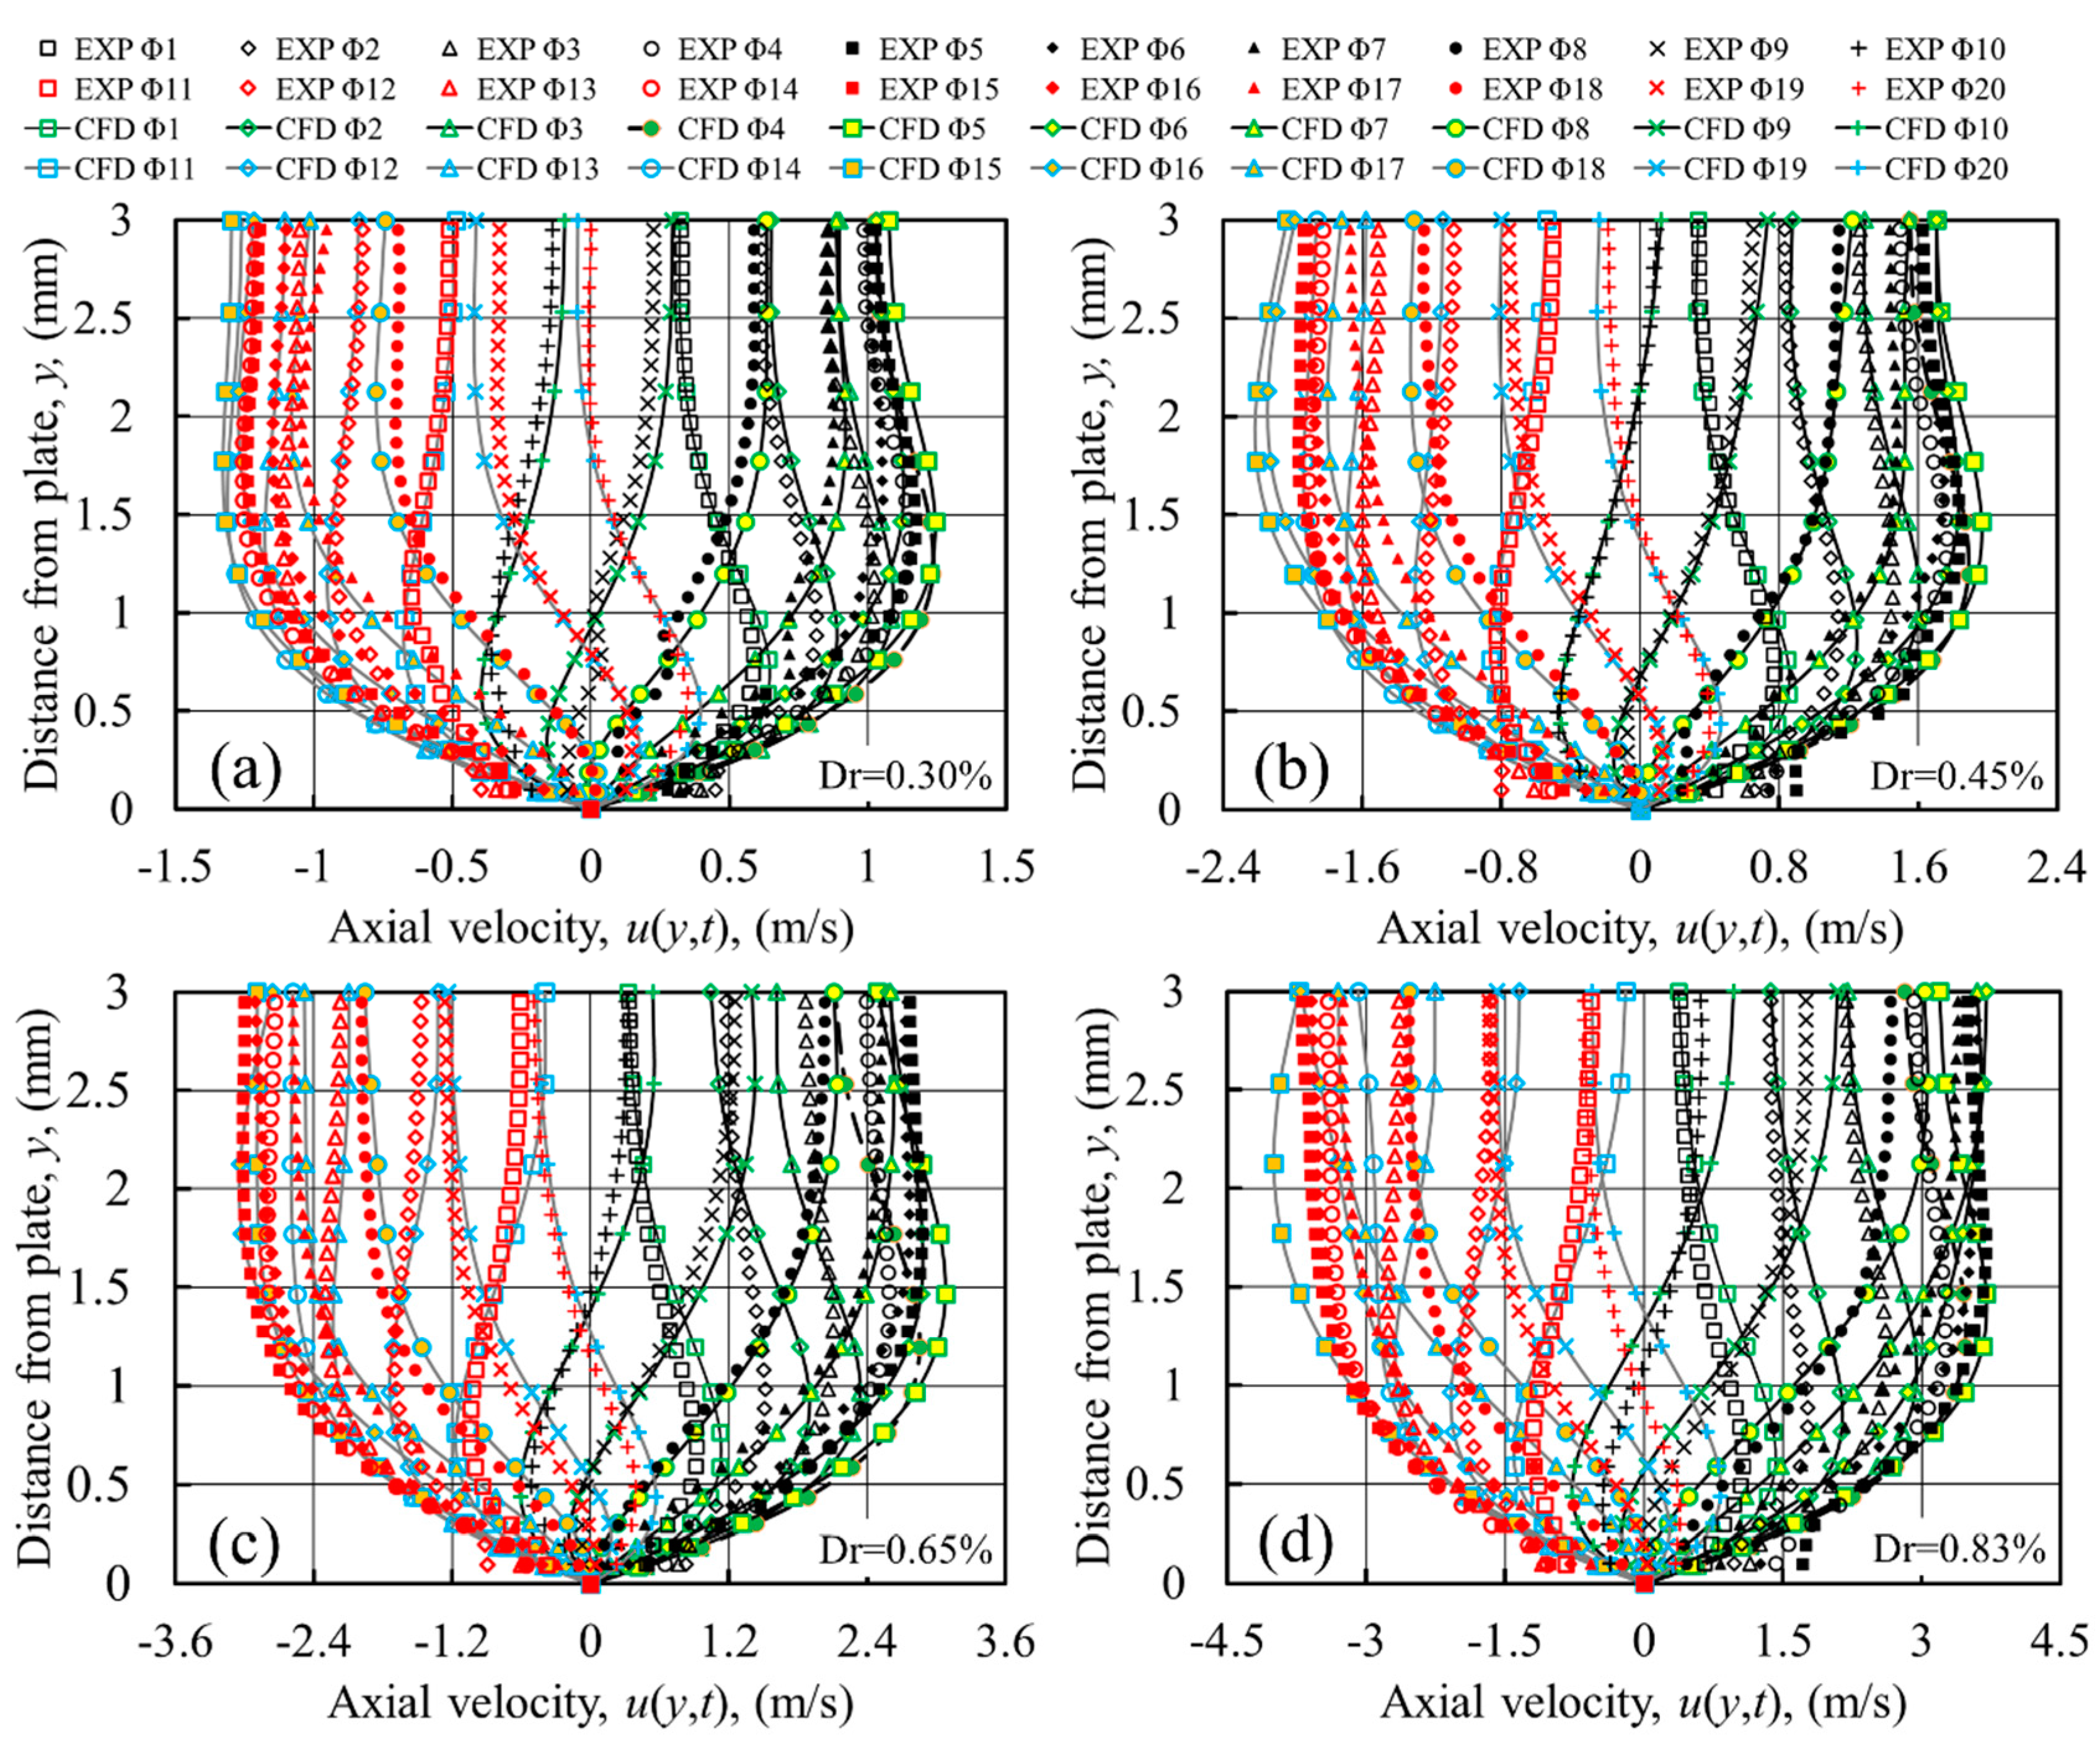
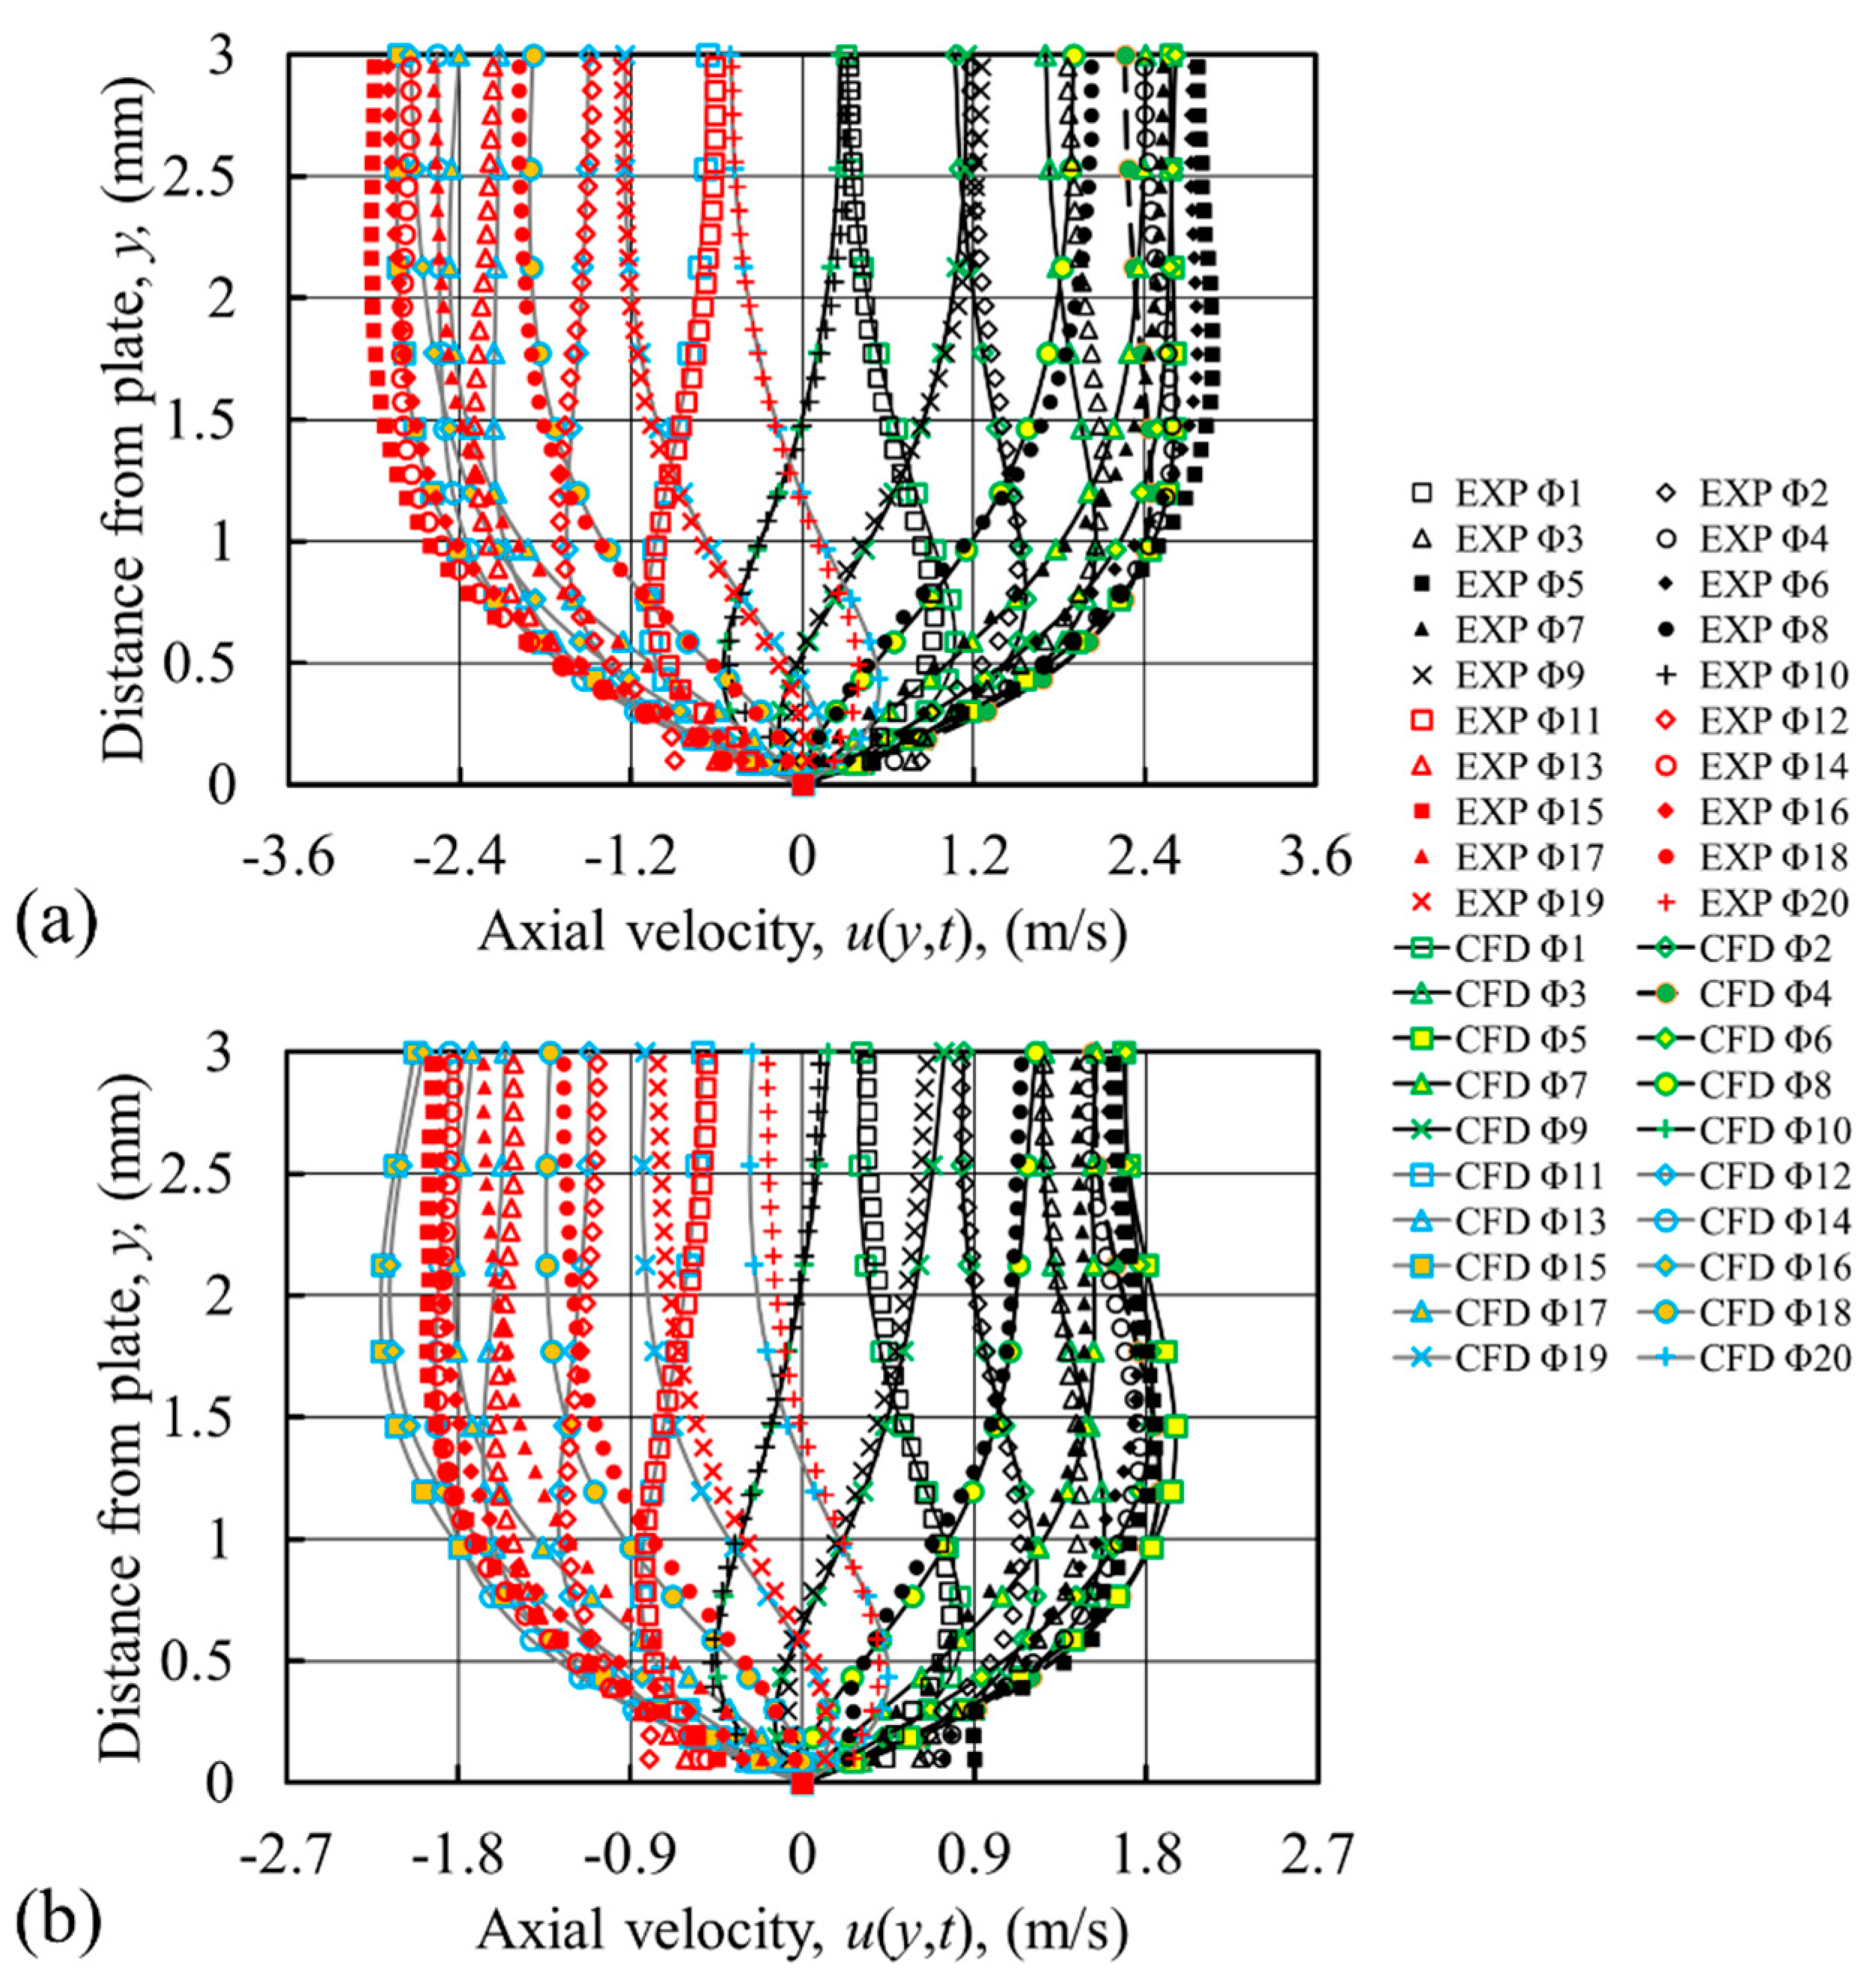
However, the centreline velocity alone is not sufficient to represent the flow, and therefore, the instantaneous velocity profiles across the channel need to be inspected. These are plotted in
Figure 4 for the same axial location, from the wall surface (
) to the middle of the channel (
), for all 20 phases of a flow cycle, separately for each drive ratio. Clearly, the already shown mismatch between the CFD and experimental magnitudes of axial velocity at
y = 3 mm can be seen also in
Figure 4, but more importantly, the whole profiles show substantial discrepancies at other locations, especially near the wall. The over-prediction of velocity profiles near the wall as calculated by the laminar model hints at the presence of turbulence [
25].
Furthermore, as the drive ratio increases, the discrepancies between velocity profiles from laminar CFD and experiments become larger, which indicates that the laminar model may not be sufficient to capture the flow behaviour. These discrepancies are also illustrated in
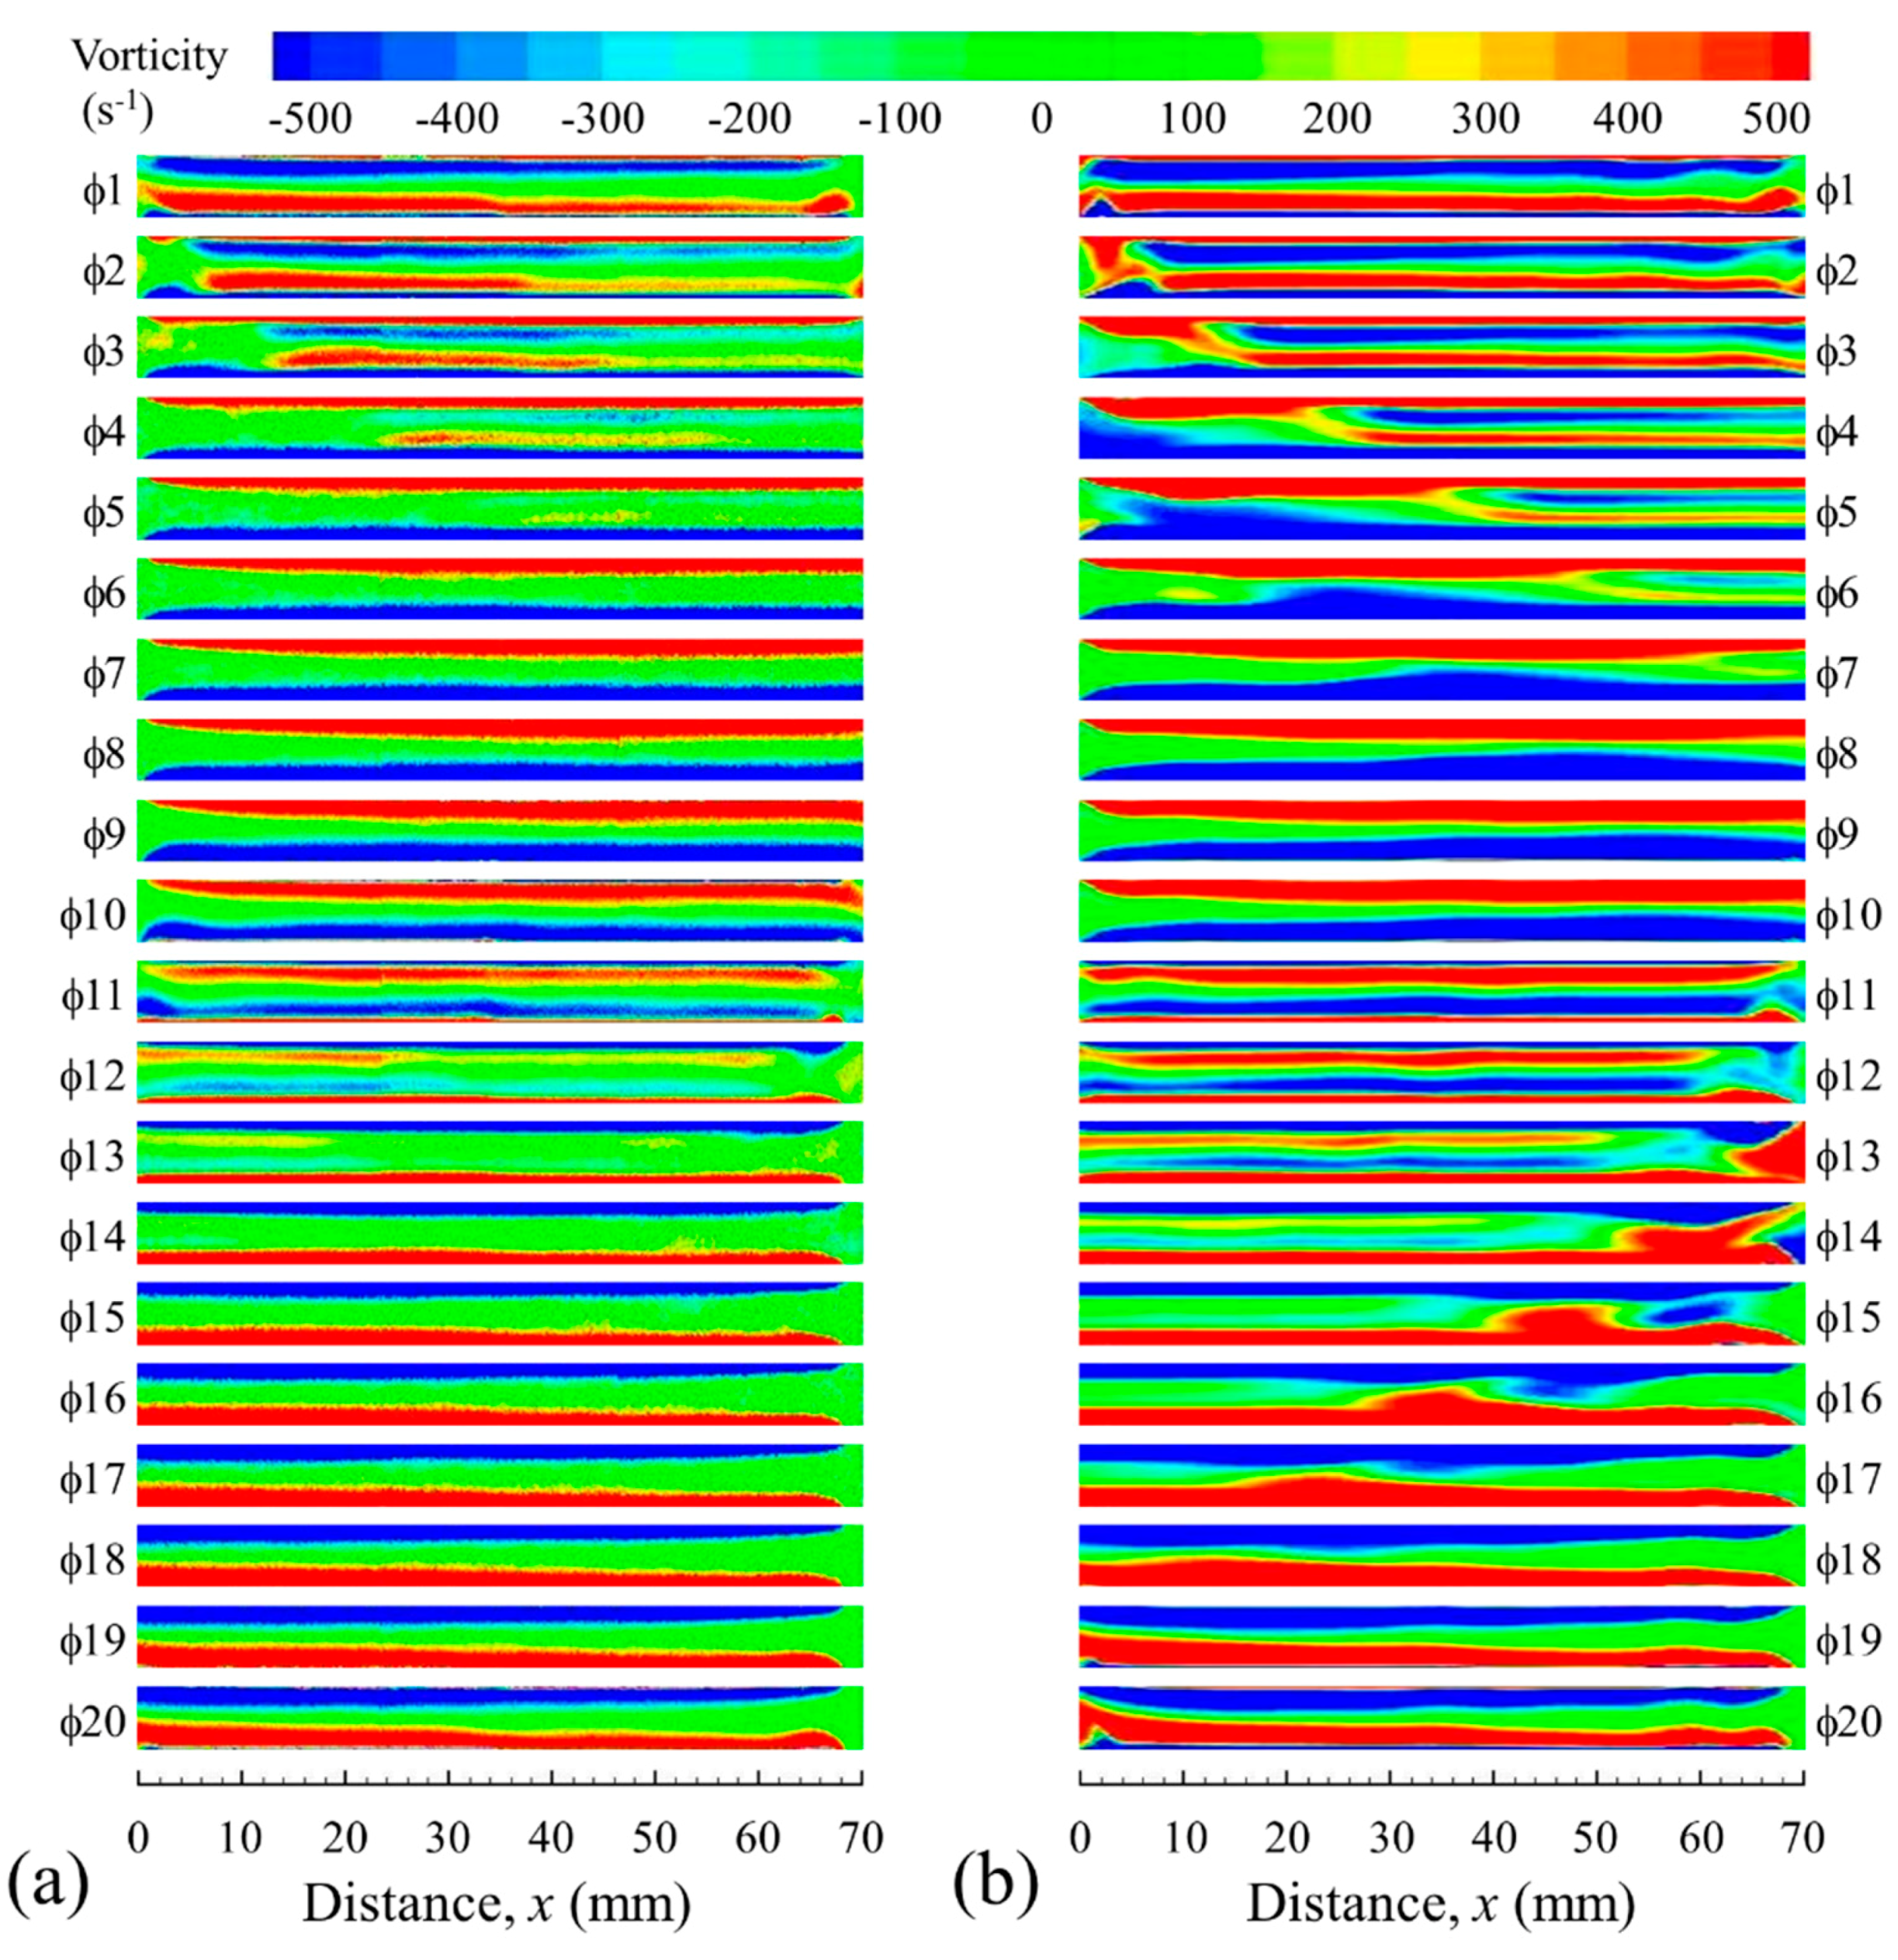
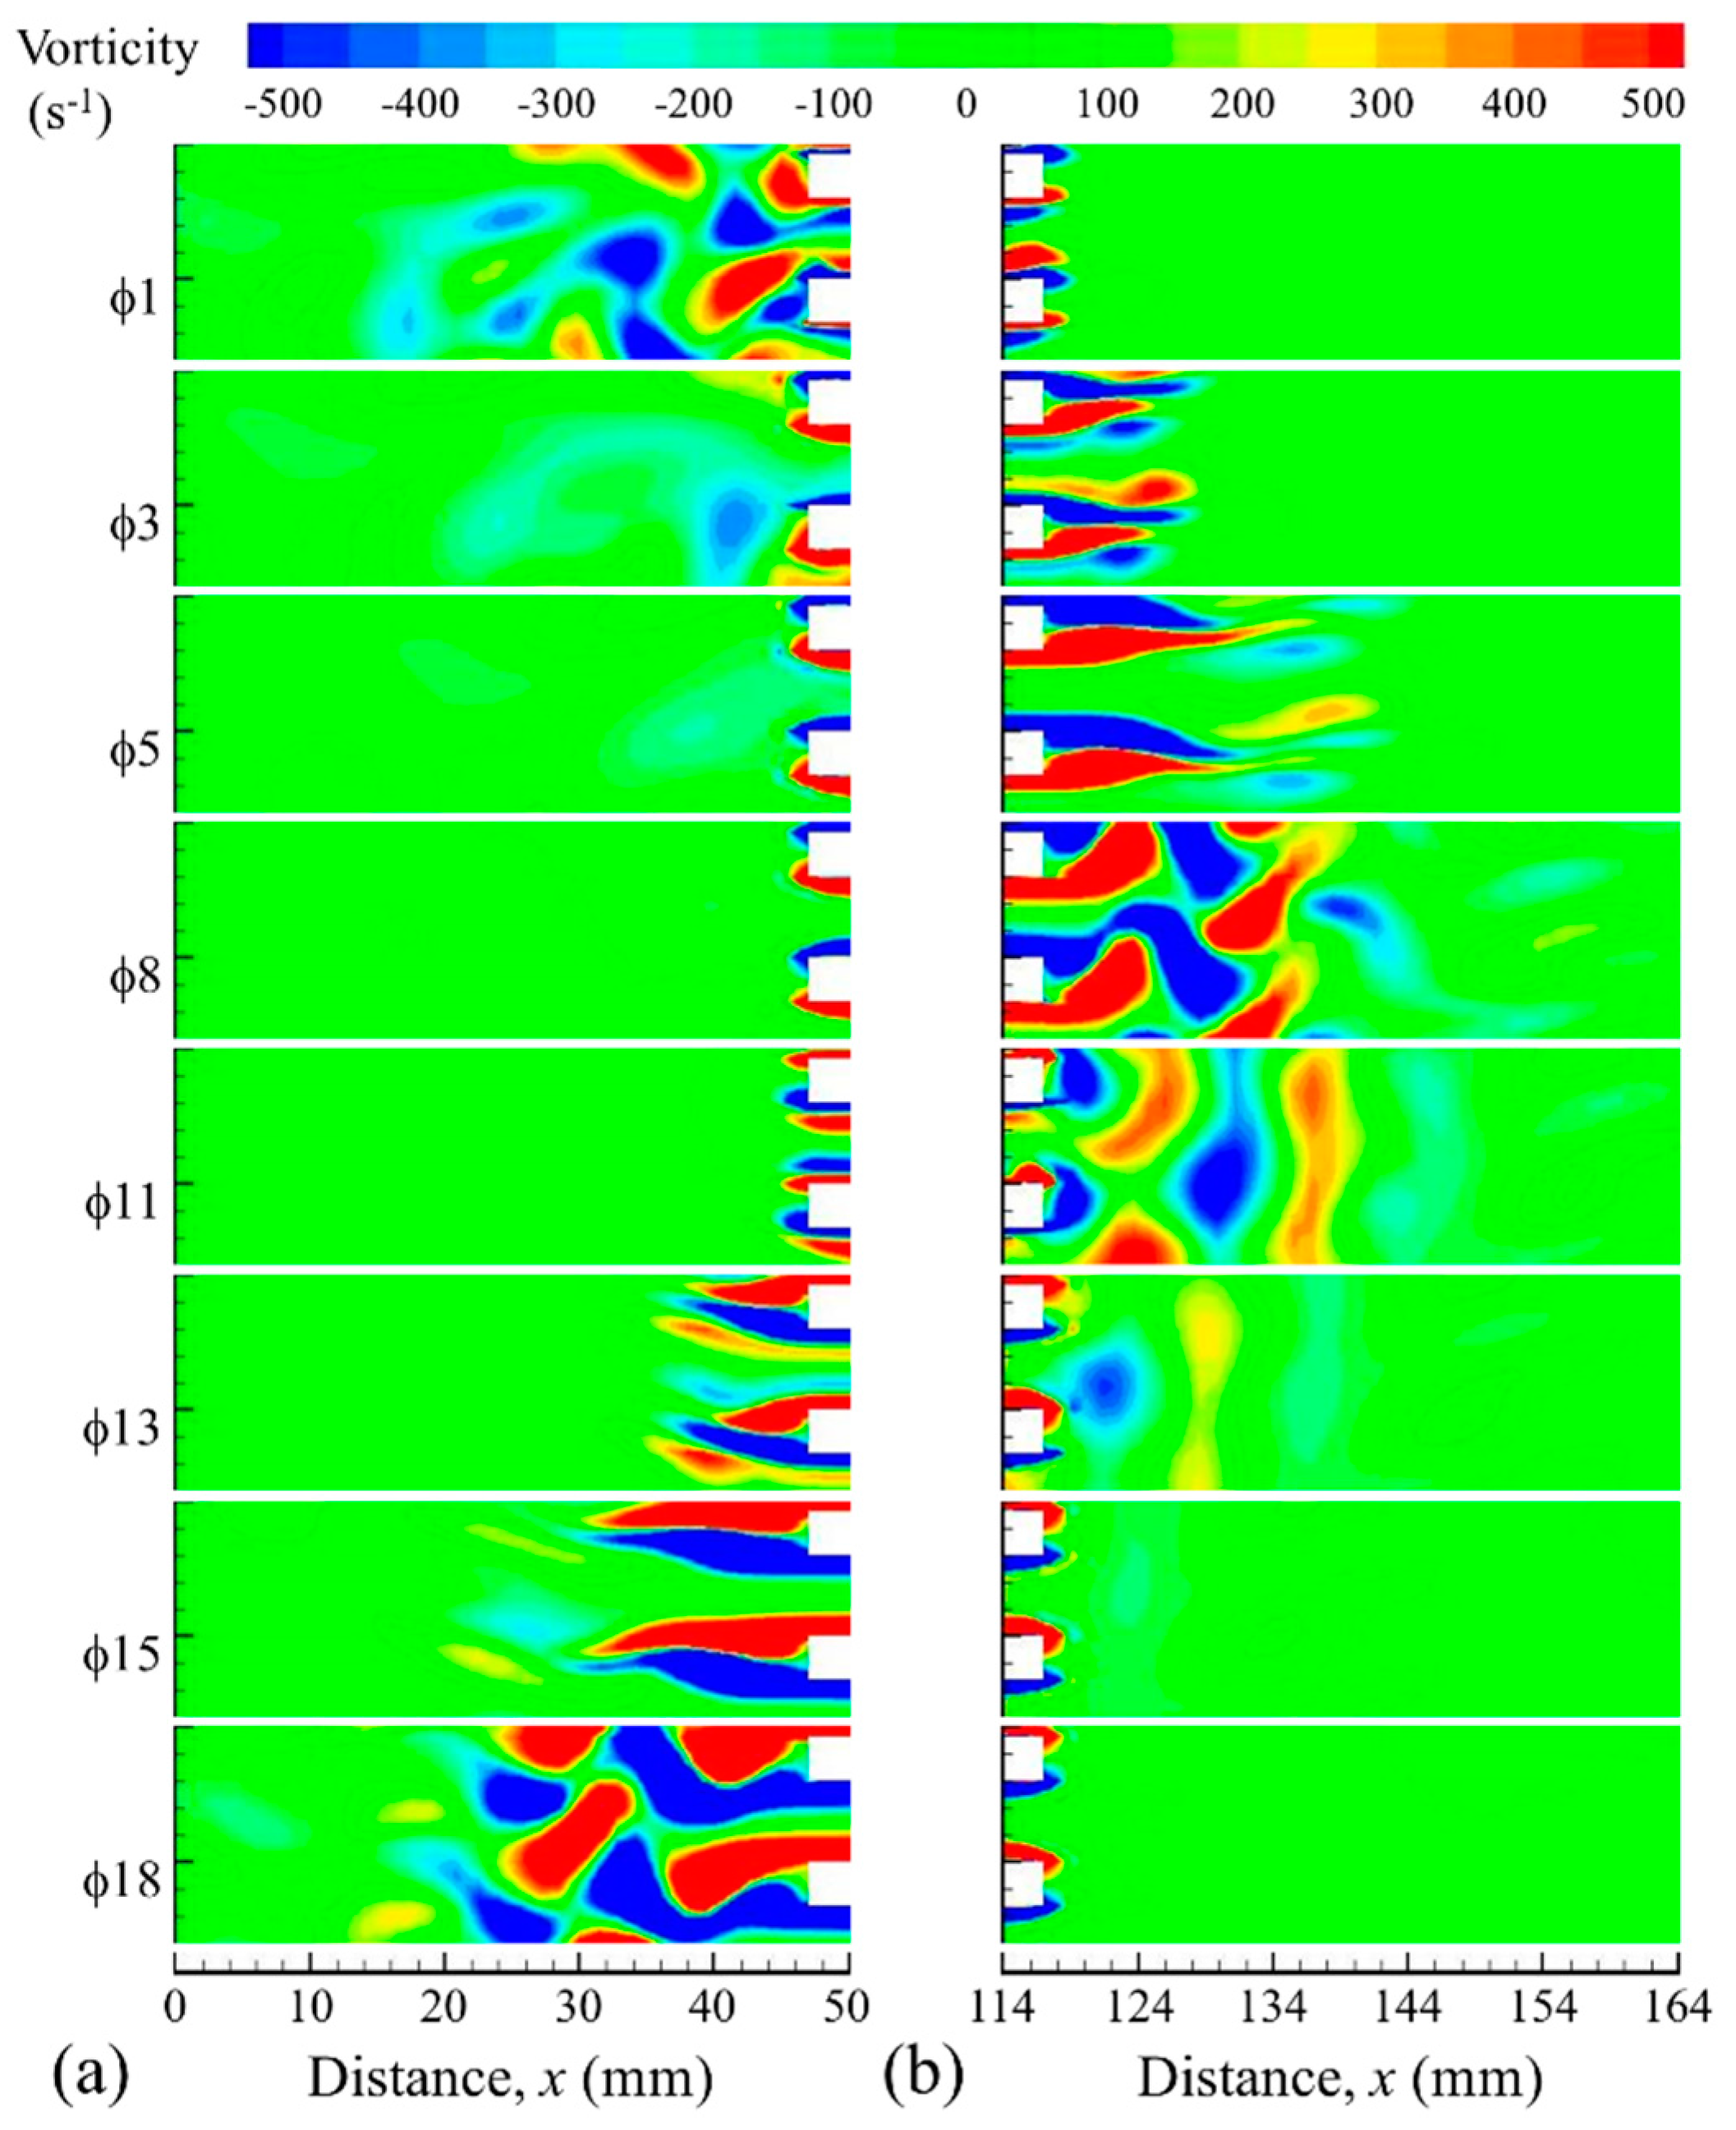
Figure 5 as a vorticity contour map (drive ratio 0.83% selected as an example), which covers the area of the hot and cold channel. The numerical solutions appear to indicate the presence of very strong elongated secondary vortices (also referred to as a secondary shear layer), which are much less intense in reality, the best examples of such discrepancies being shown for
3. Furthermore, the laminar model also produces “blobs” of vorticity that travel within the channel between phases
13 and
17, and this also has no match in the experimental results.
Many investigations (cf. [
4,
5]) have shown that oscillatory flow past parallel plate structures creates strong vortex structures at the end of plates. The remains of these structures tend to be re-entrained into the channel as the flow changes direction. This suggests that there may be sufficient instabilities present in the flow to trigger turbulent transition. Furthermore, the critical Reynolds number defined in [
7] was strictly for a flow within a long, ideally infinite, channel. Therefore, it is possible that transition may be triggered at much lower
for flows past short plates. This is why a range of turbulent models has been tested as presented in the next section.
3.2. Turbulent Flow Models
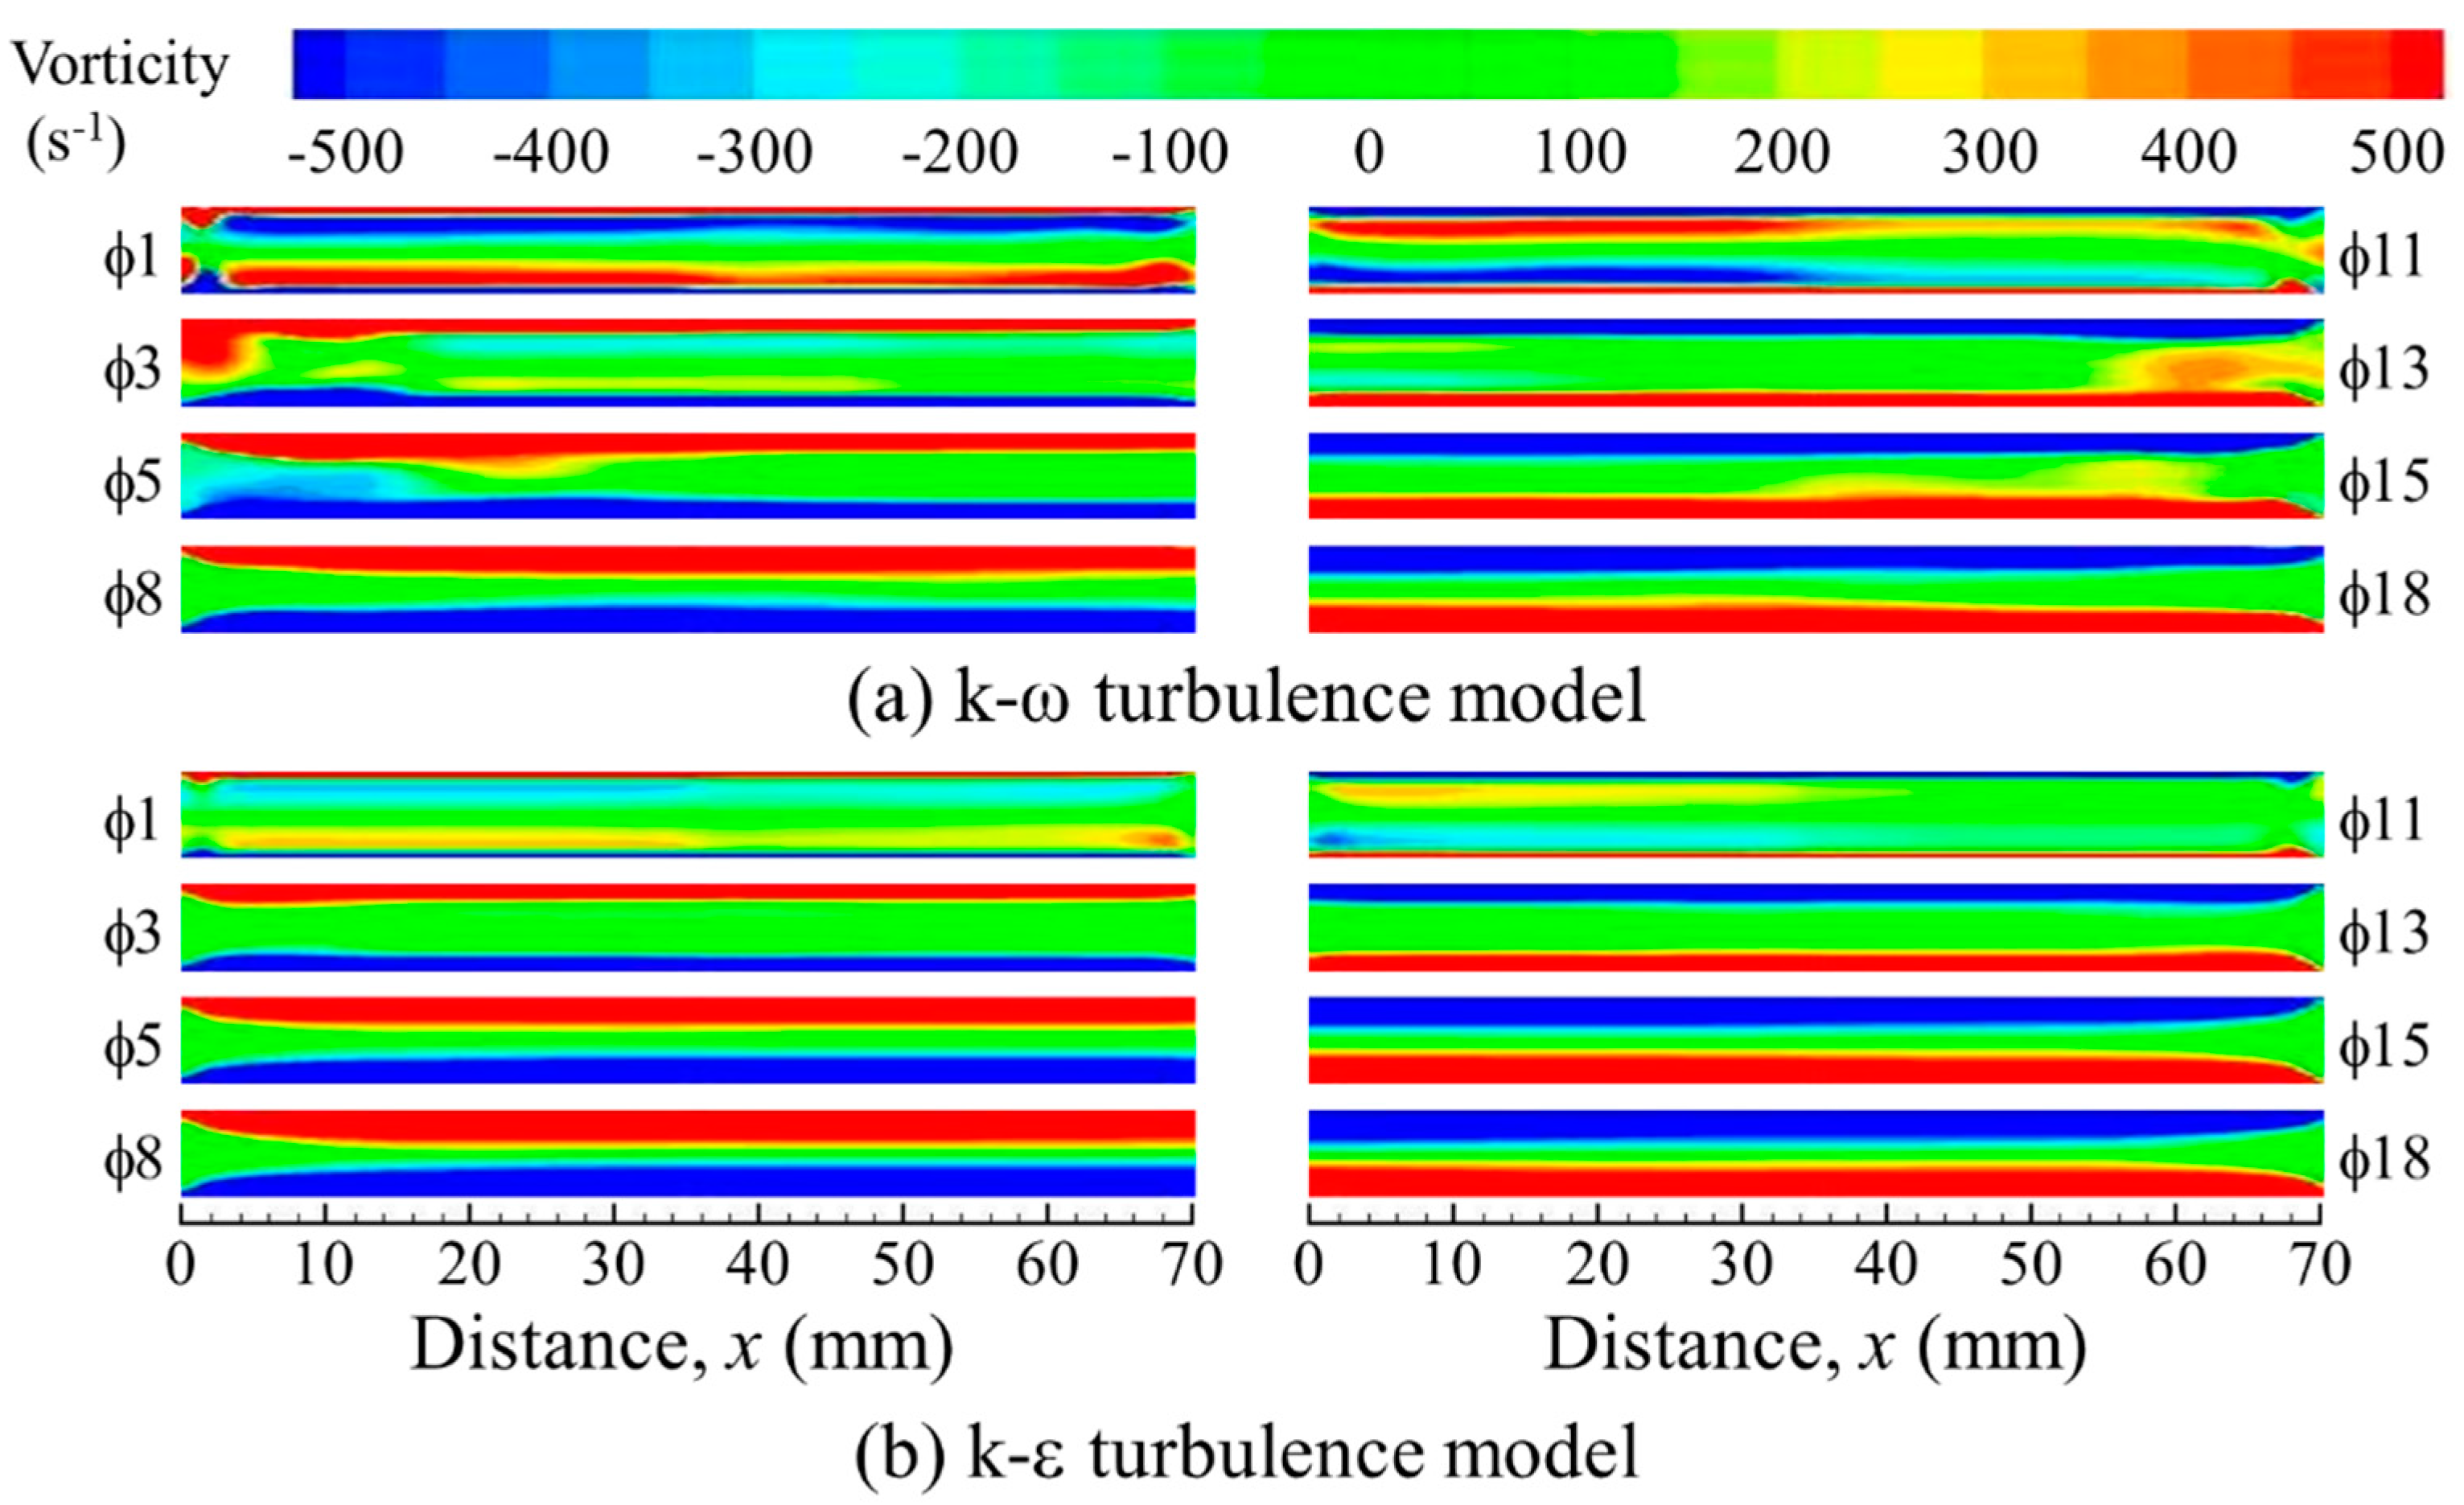
Figure 6 shows the vorticity contours for drive ratio of 0.83% obtained using two turbulence models: k-ω and k-ε. These are best discussed in comparison with
Figure 5. The vorticity between the plates predicted by the k-ω model exhibits weaker vortex structures compared to the results obtained from the laminar model. However, there is still a suspect “blob” of vorticity that travels within the channel that is not seen in the experiment. On the other hand, the k-ε model produces much more realistic vorticity contours. However, when comparing experimental and CFD results for phases
1,
3,
11 and
13 in
Figure 5a and
Figure 6b, it is clear that the secondary shear layer (closer to the centre of the channel) is rather under-predicted by the CFD model. The results in
Figure 5 and
Figure 6 suggest that the disturbances leading to the creation of the elongated vorticity regions referred to as secondary shear layers and the “blobs” of vorticity described above originate from the open area at the end of plates.
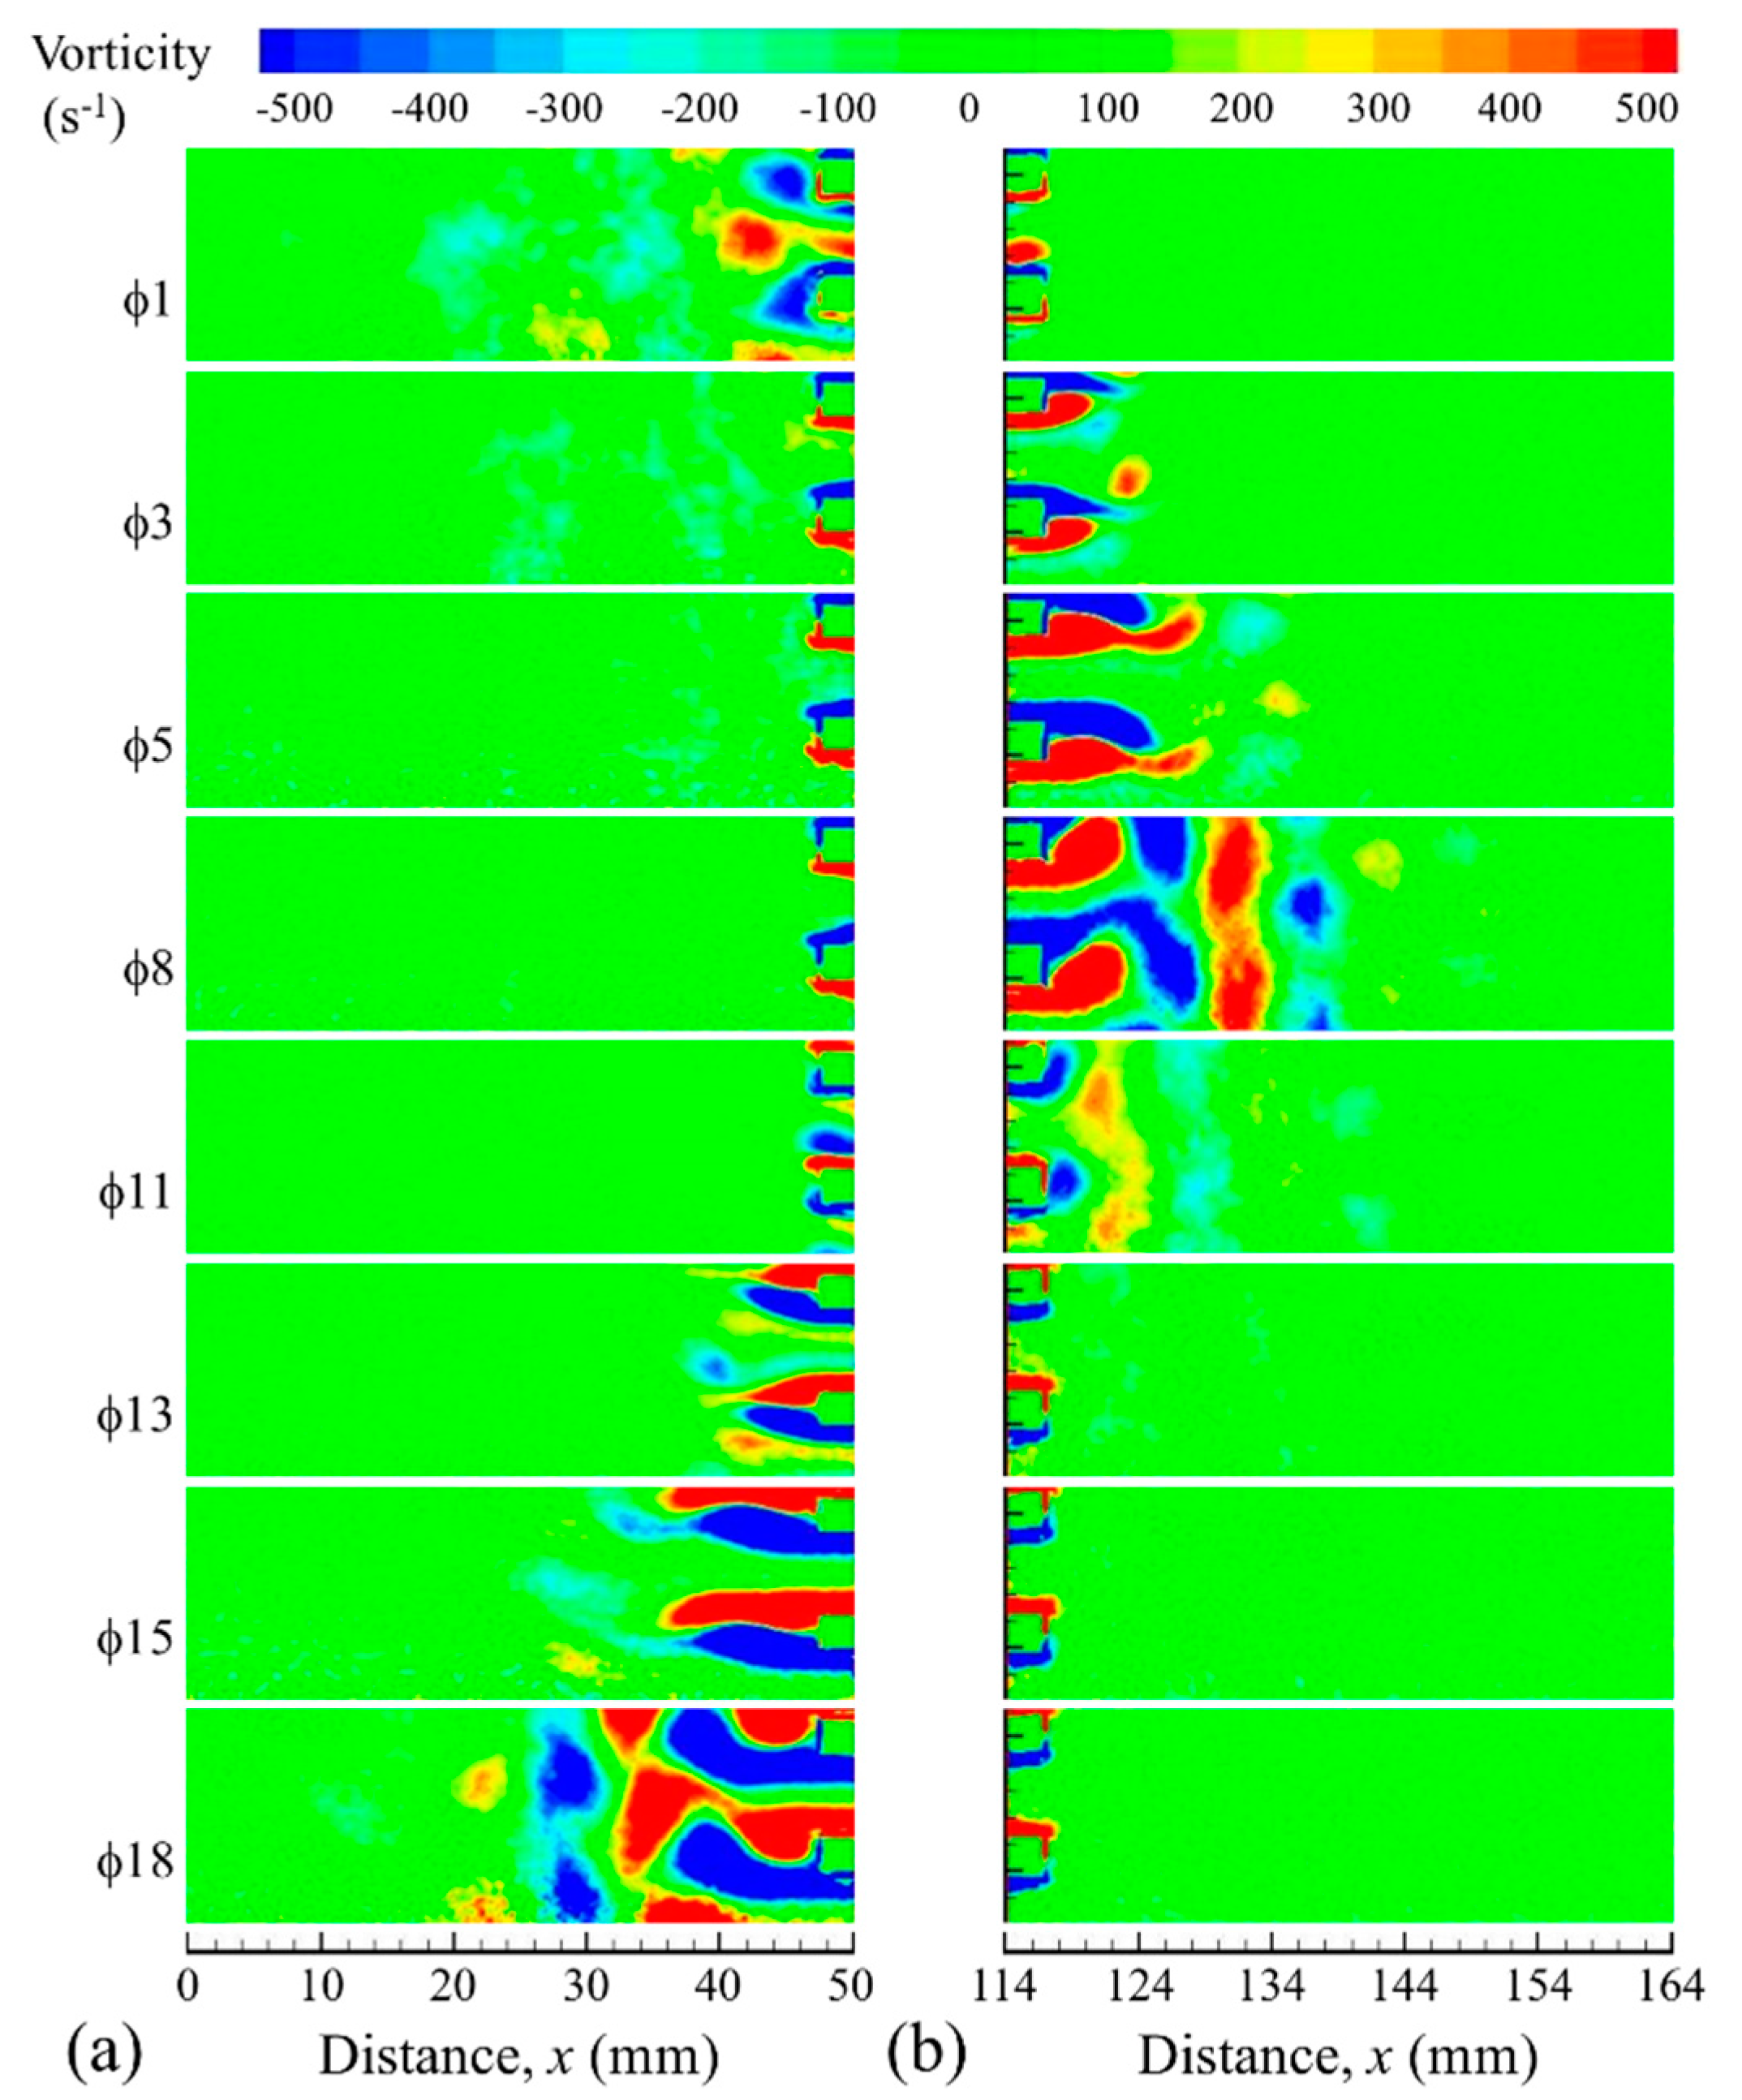
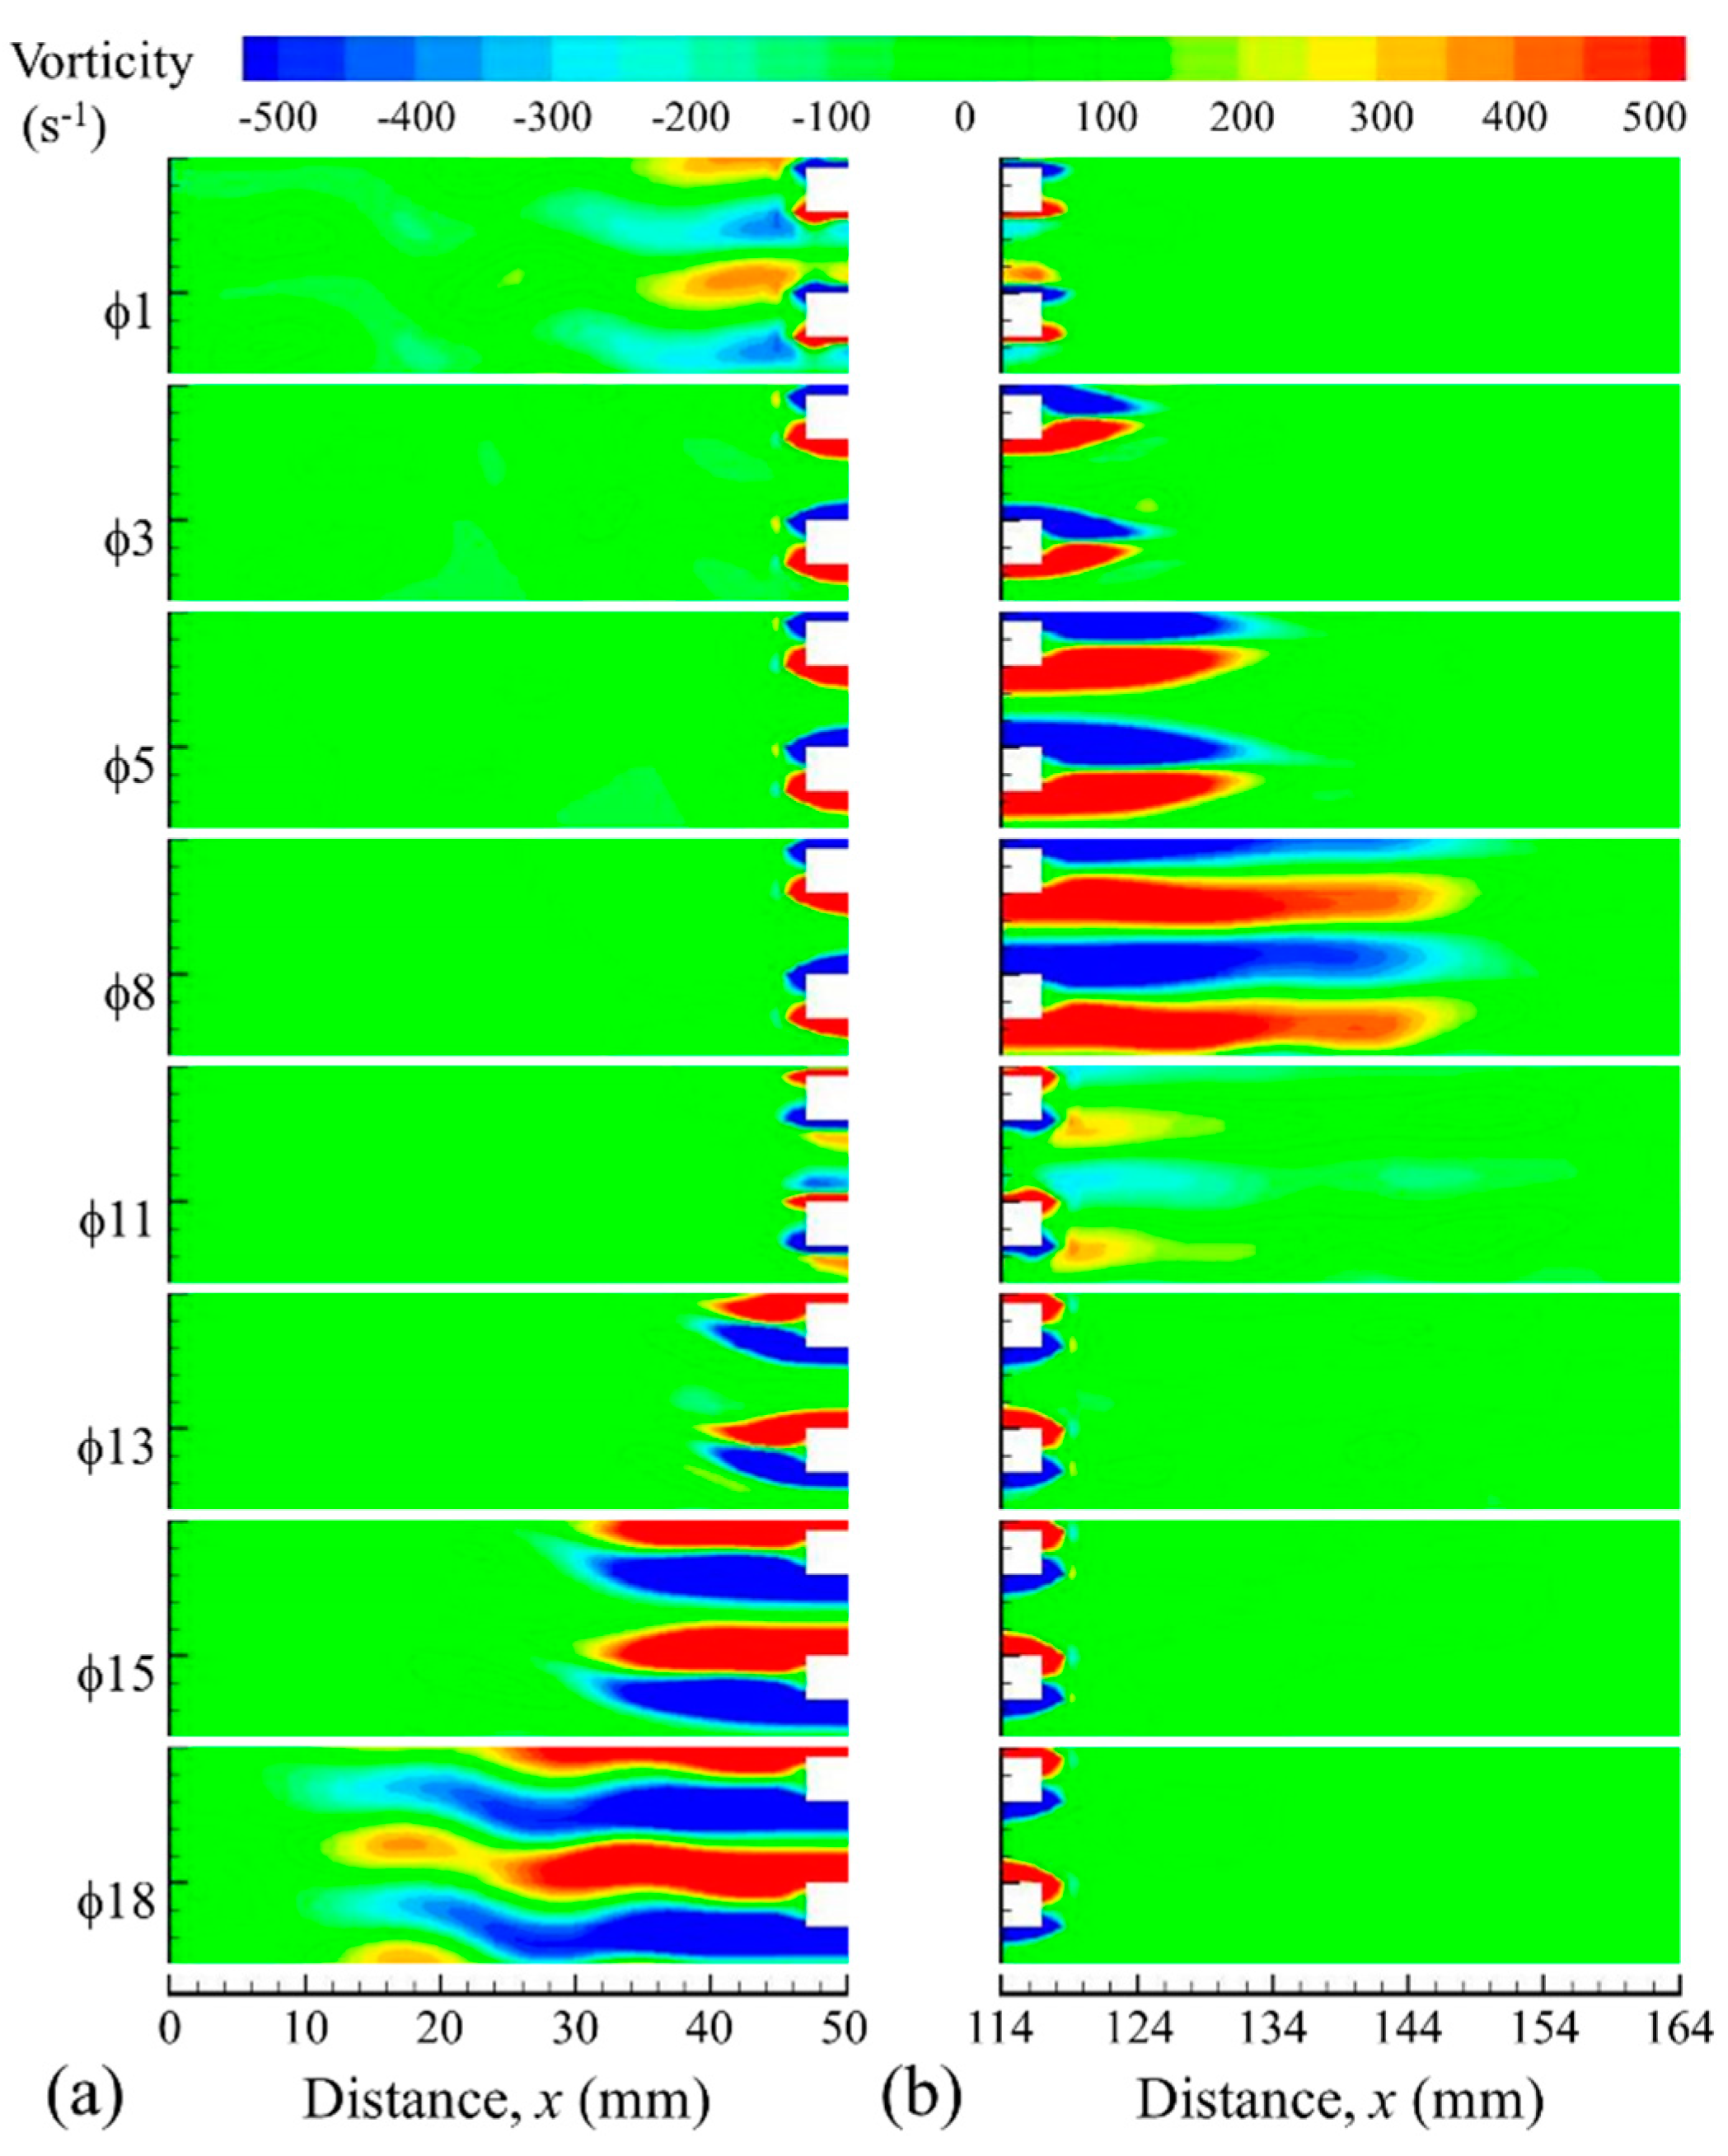
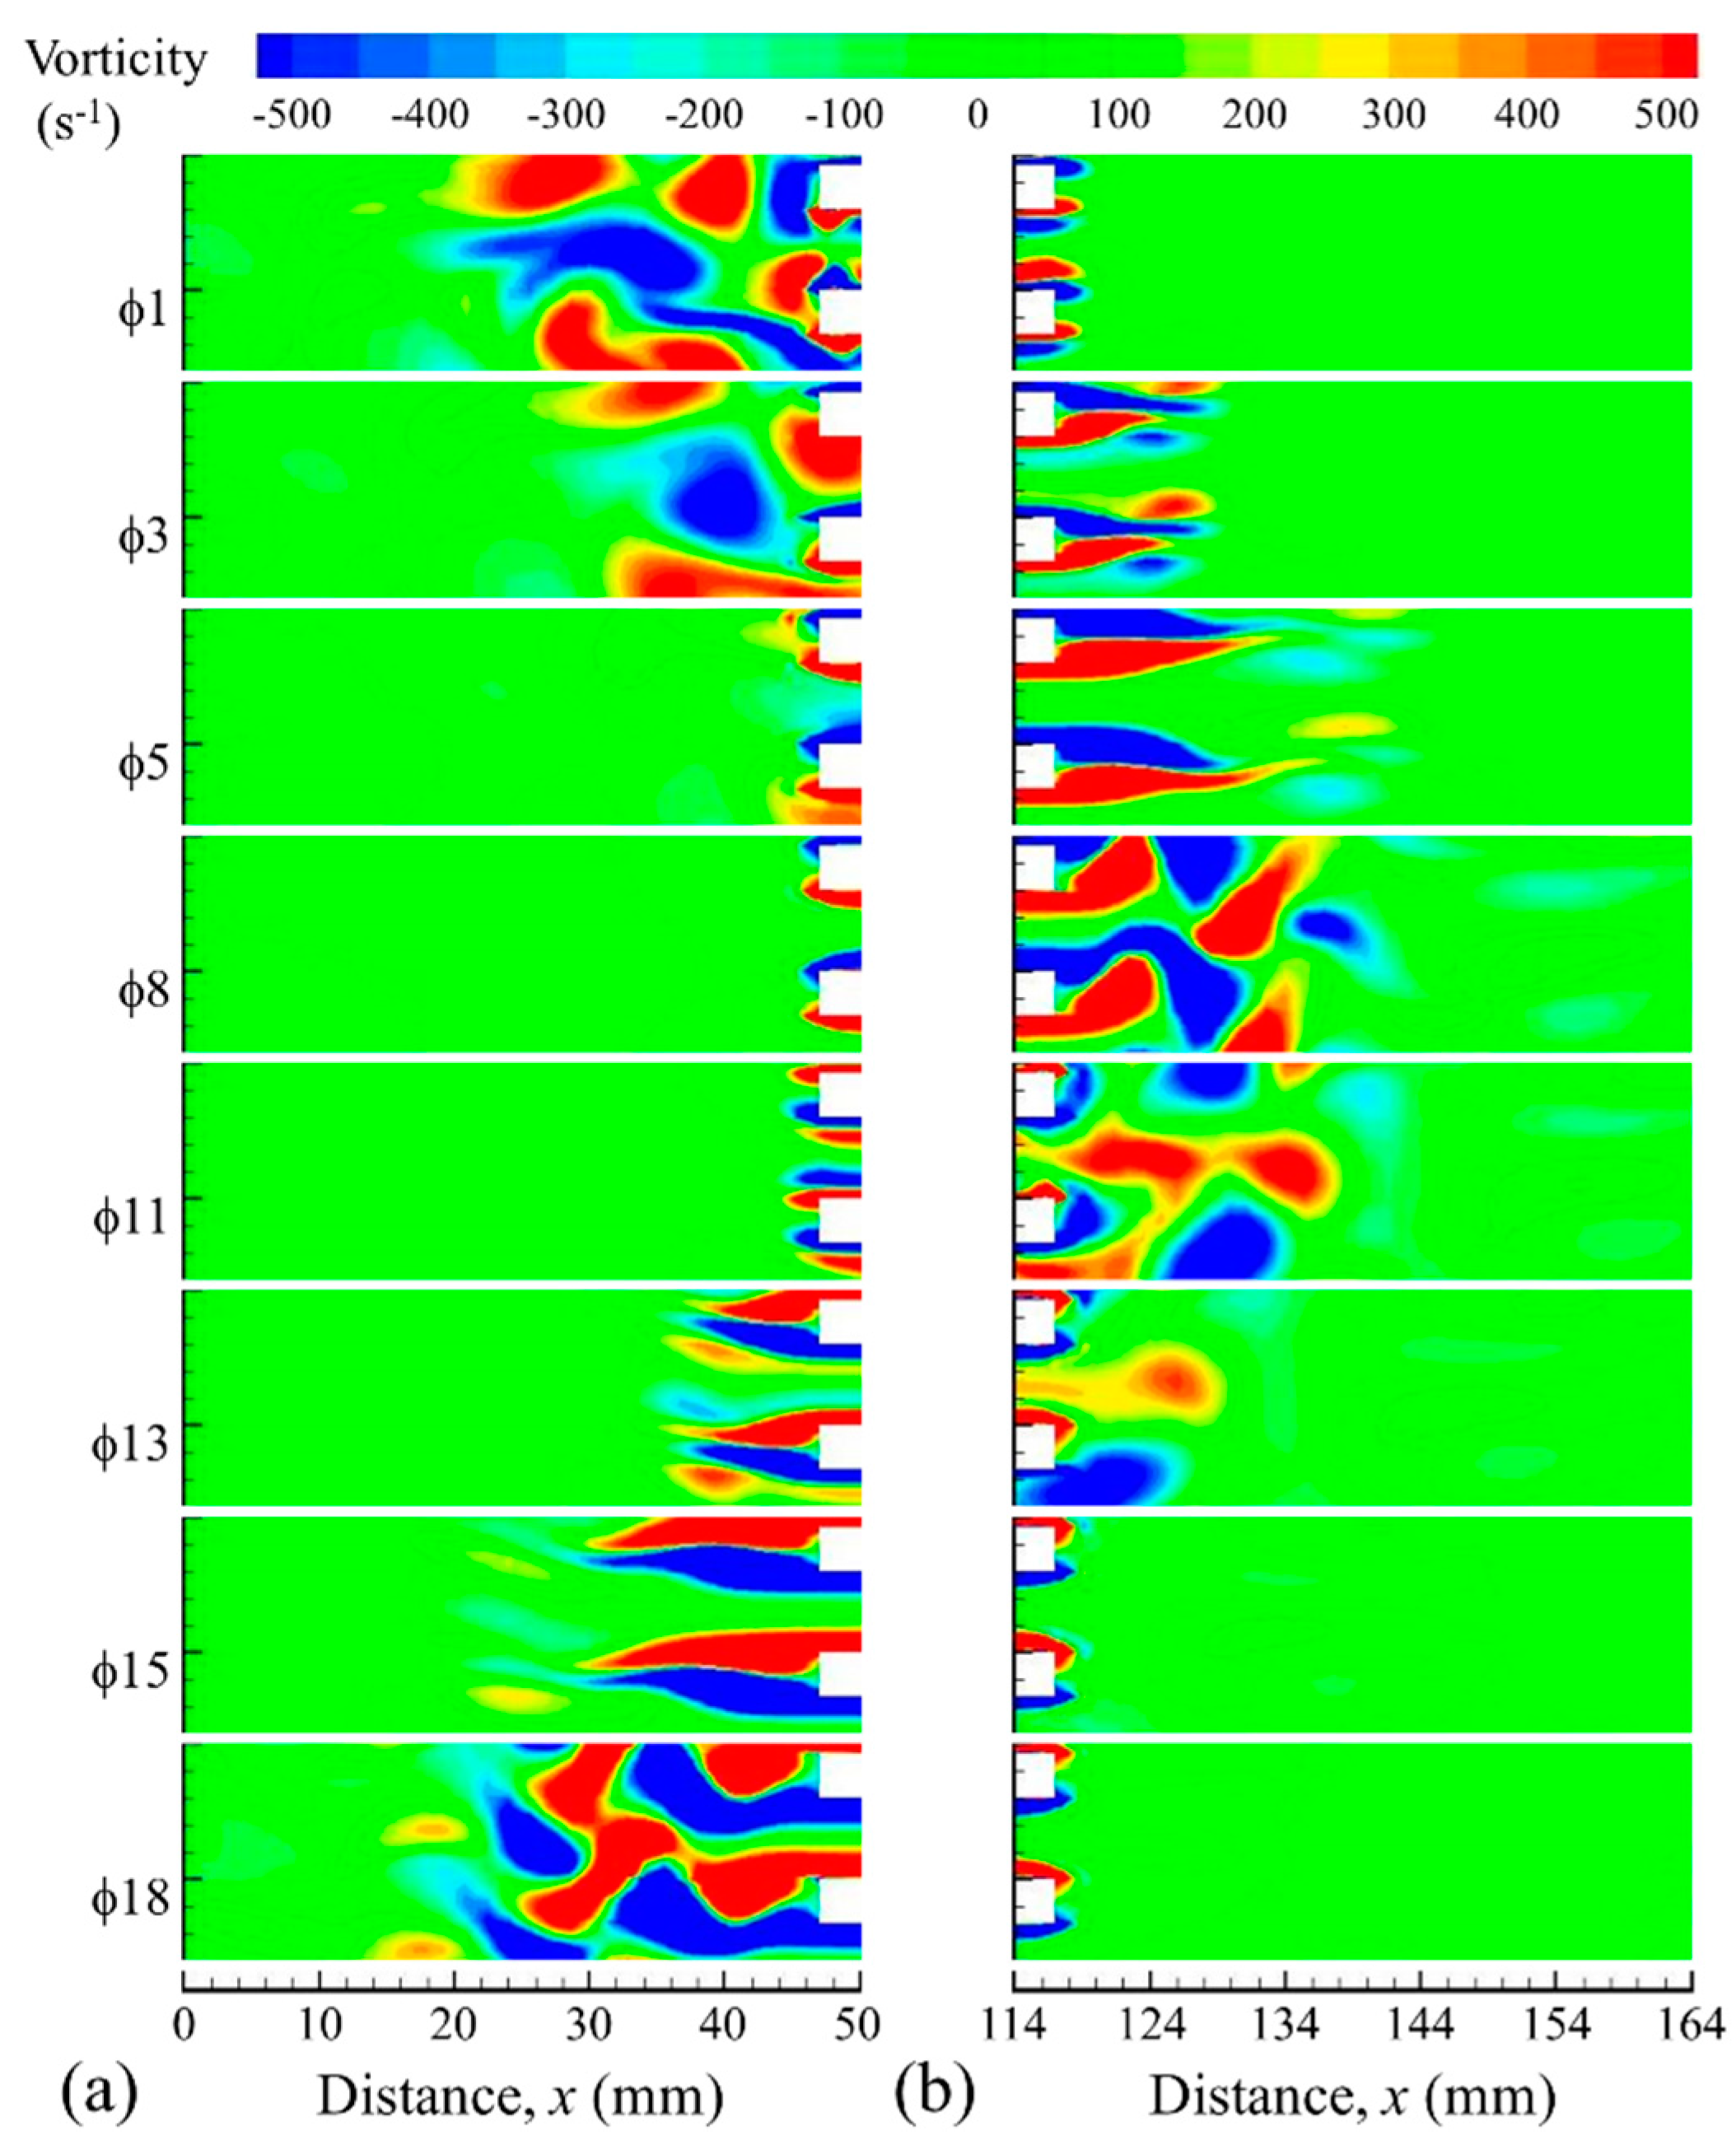
Therefore, a further investigation into the vortex structures at the end of the plates was conducted to help choose turbulence models that best describe the flow, as illustrated in
Figure 7,
Figure 8 and
Figure 9.
Figure 7, based on experimental results at drive ratio 0.83%, shows that the flow enters the left end of the heat exchanger assembly at phase
1 and reaches the maximum amplitude at
5. During these phases, a weak vortex structure from the open area next to the left end of the HHX moves into the channel. The vortex structure at the right end of the heat exchanger assembly elongates as the velocity increases, but stays attached to the plate ends until the maximum velocity is reached at
5. When the flow decelerates, the vortex structures at the right end of the plates start shedding, as seen at
8. Similar behaviour is observed for the second half of the cycle as the flow reverses (phases
11 to
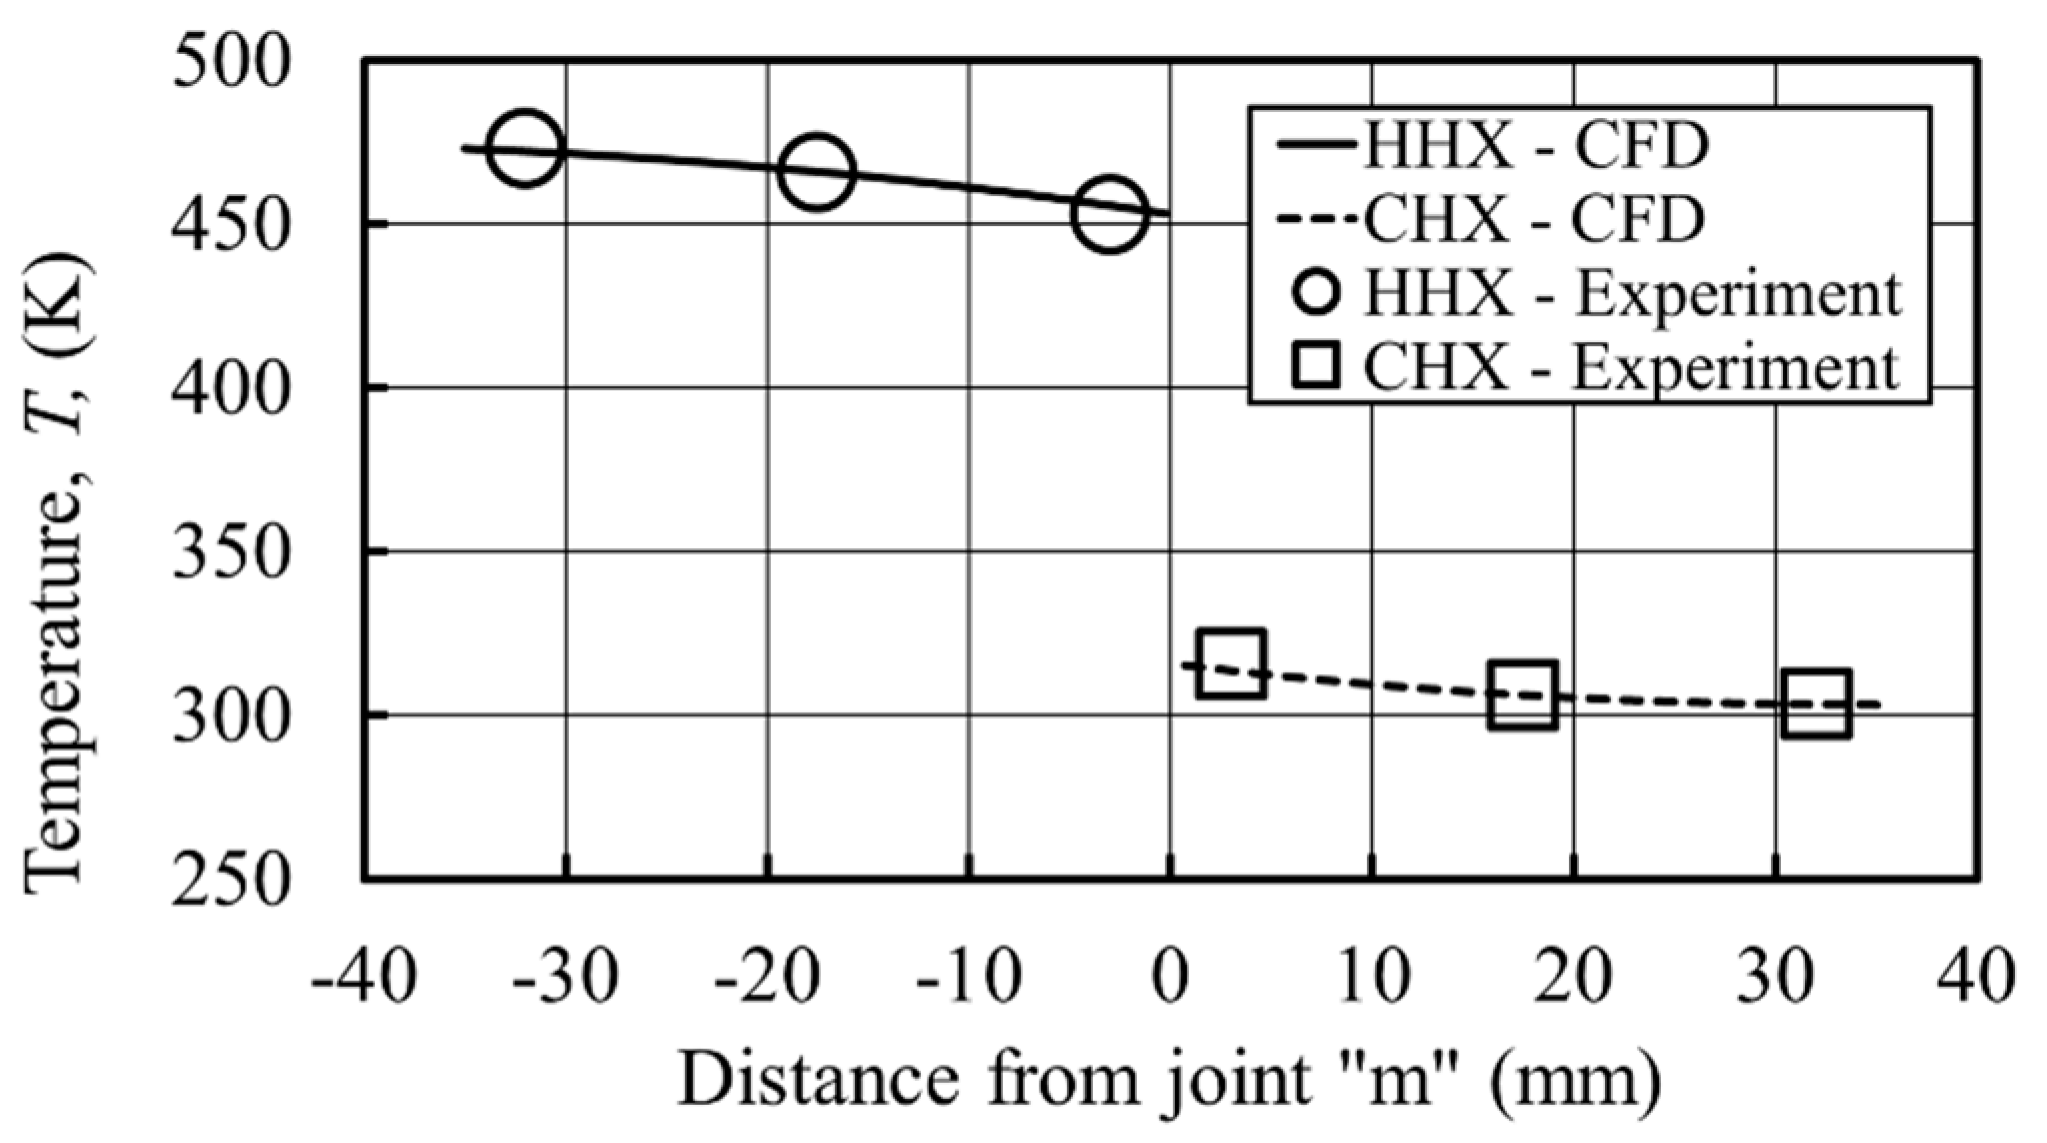
20), although differences in the flow patterns exist due to the asymmetry of the temperature profile (cf.
Figure 2).
Figure 8 shows vorticity contours at the ends of the heat exchanger assembly for drive ratio of 0.83% calculated using the k-ε model. The vortex pattern is very different form the experimental one: vortex structures at the right end of the plate for
3 appear more stable. The pair of vortex structures at the end of plates elongates until the flow reaches maximum velocity at
5. In the experiment, vortex structures start to “wiggle” in this phase, which the k-ε model does not seem to predict.
As the flow decelerates, the elongated structures predicted by the k-ε model retain their shapes, but start to lose their strength, which reduces considerably by the time the flow reverses at 11. The weak vortex structures are re-entrained by the channel flow to create the elongated secondary vortex structures (secondary shear layers). In the second half of the cycle, similar stable vortex structures are observed on the left end of the plates. Importantly, the discrete vortex shedding phenomena are not seen in the results obtained from the k-ε turbulence model.
Figure 9 shows vorticity contours at the left and right ends of the heat exchanger assembly calculated for the drive ratio of 0.83% using the k-ω model. The vortex structures have a closer resemblance to the experimental result than those from the k-ε model. The vortex shedding process starts at the right end at
1 and the left end at
11. The vortex strengths seem slightly over-predicted, compared to the corresponding structures that appear somewhat weaker in the experimental results. The differences may be related to the consequence of “stitching” and “averaging” of the experimental results as explained in the original papers by Shi et al. [
17] and Mao and Jaworski [
4]. It may also be the result of two-dimensional assumptions used in the current turbulence model. Nevertheless, the resemblance of the flow structures to the experimental ones is quite convincing.
The results show that the flow structures at the end of the plates are best predicted by the k-ω turbulence model. The slight disparity with experimental results observed for the vorticity plots within the area bounded by the plates of the heat exchangers may require a more refined investigation. Menter [
26] proposed a modified two-equation model called the shear-stress-transport (SST) k-ω model. It was proposed based on the observations of the performance of the conventional k-ε and k-ω models; the k-ε model is reported to perform best in the wake and free stream region while the k-ω model performs best for flows in bounded areas. Therefore, SST k-ω model uses both the k-ε and k-ω models appropriately, based on a control parameter that applies the correct model depending on the distance to the nearest wall. The model is suggested to cater for flows that involve both inviscid and viscous regions. It was used in this study to obtain better predictions and was first tested for the highest drive ratio of 0.83%.
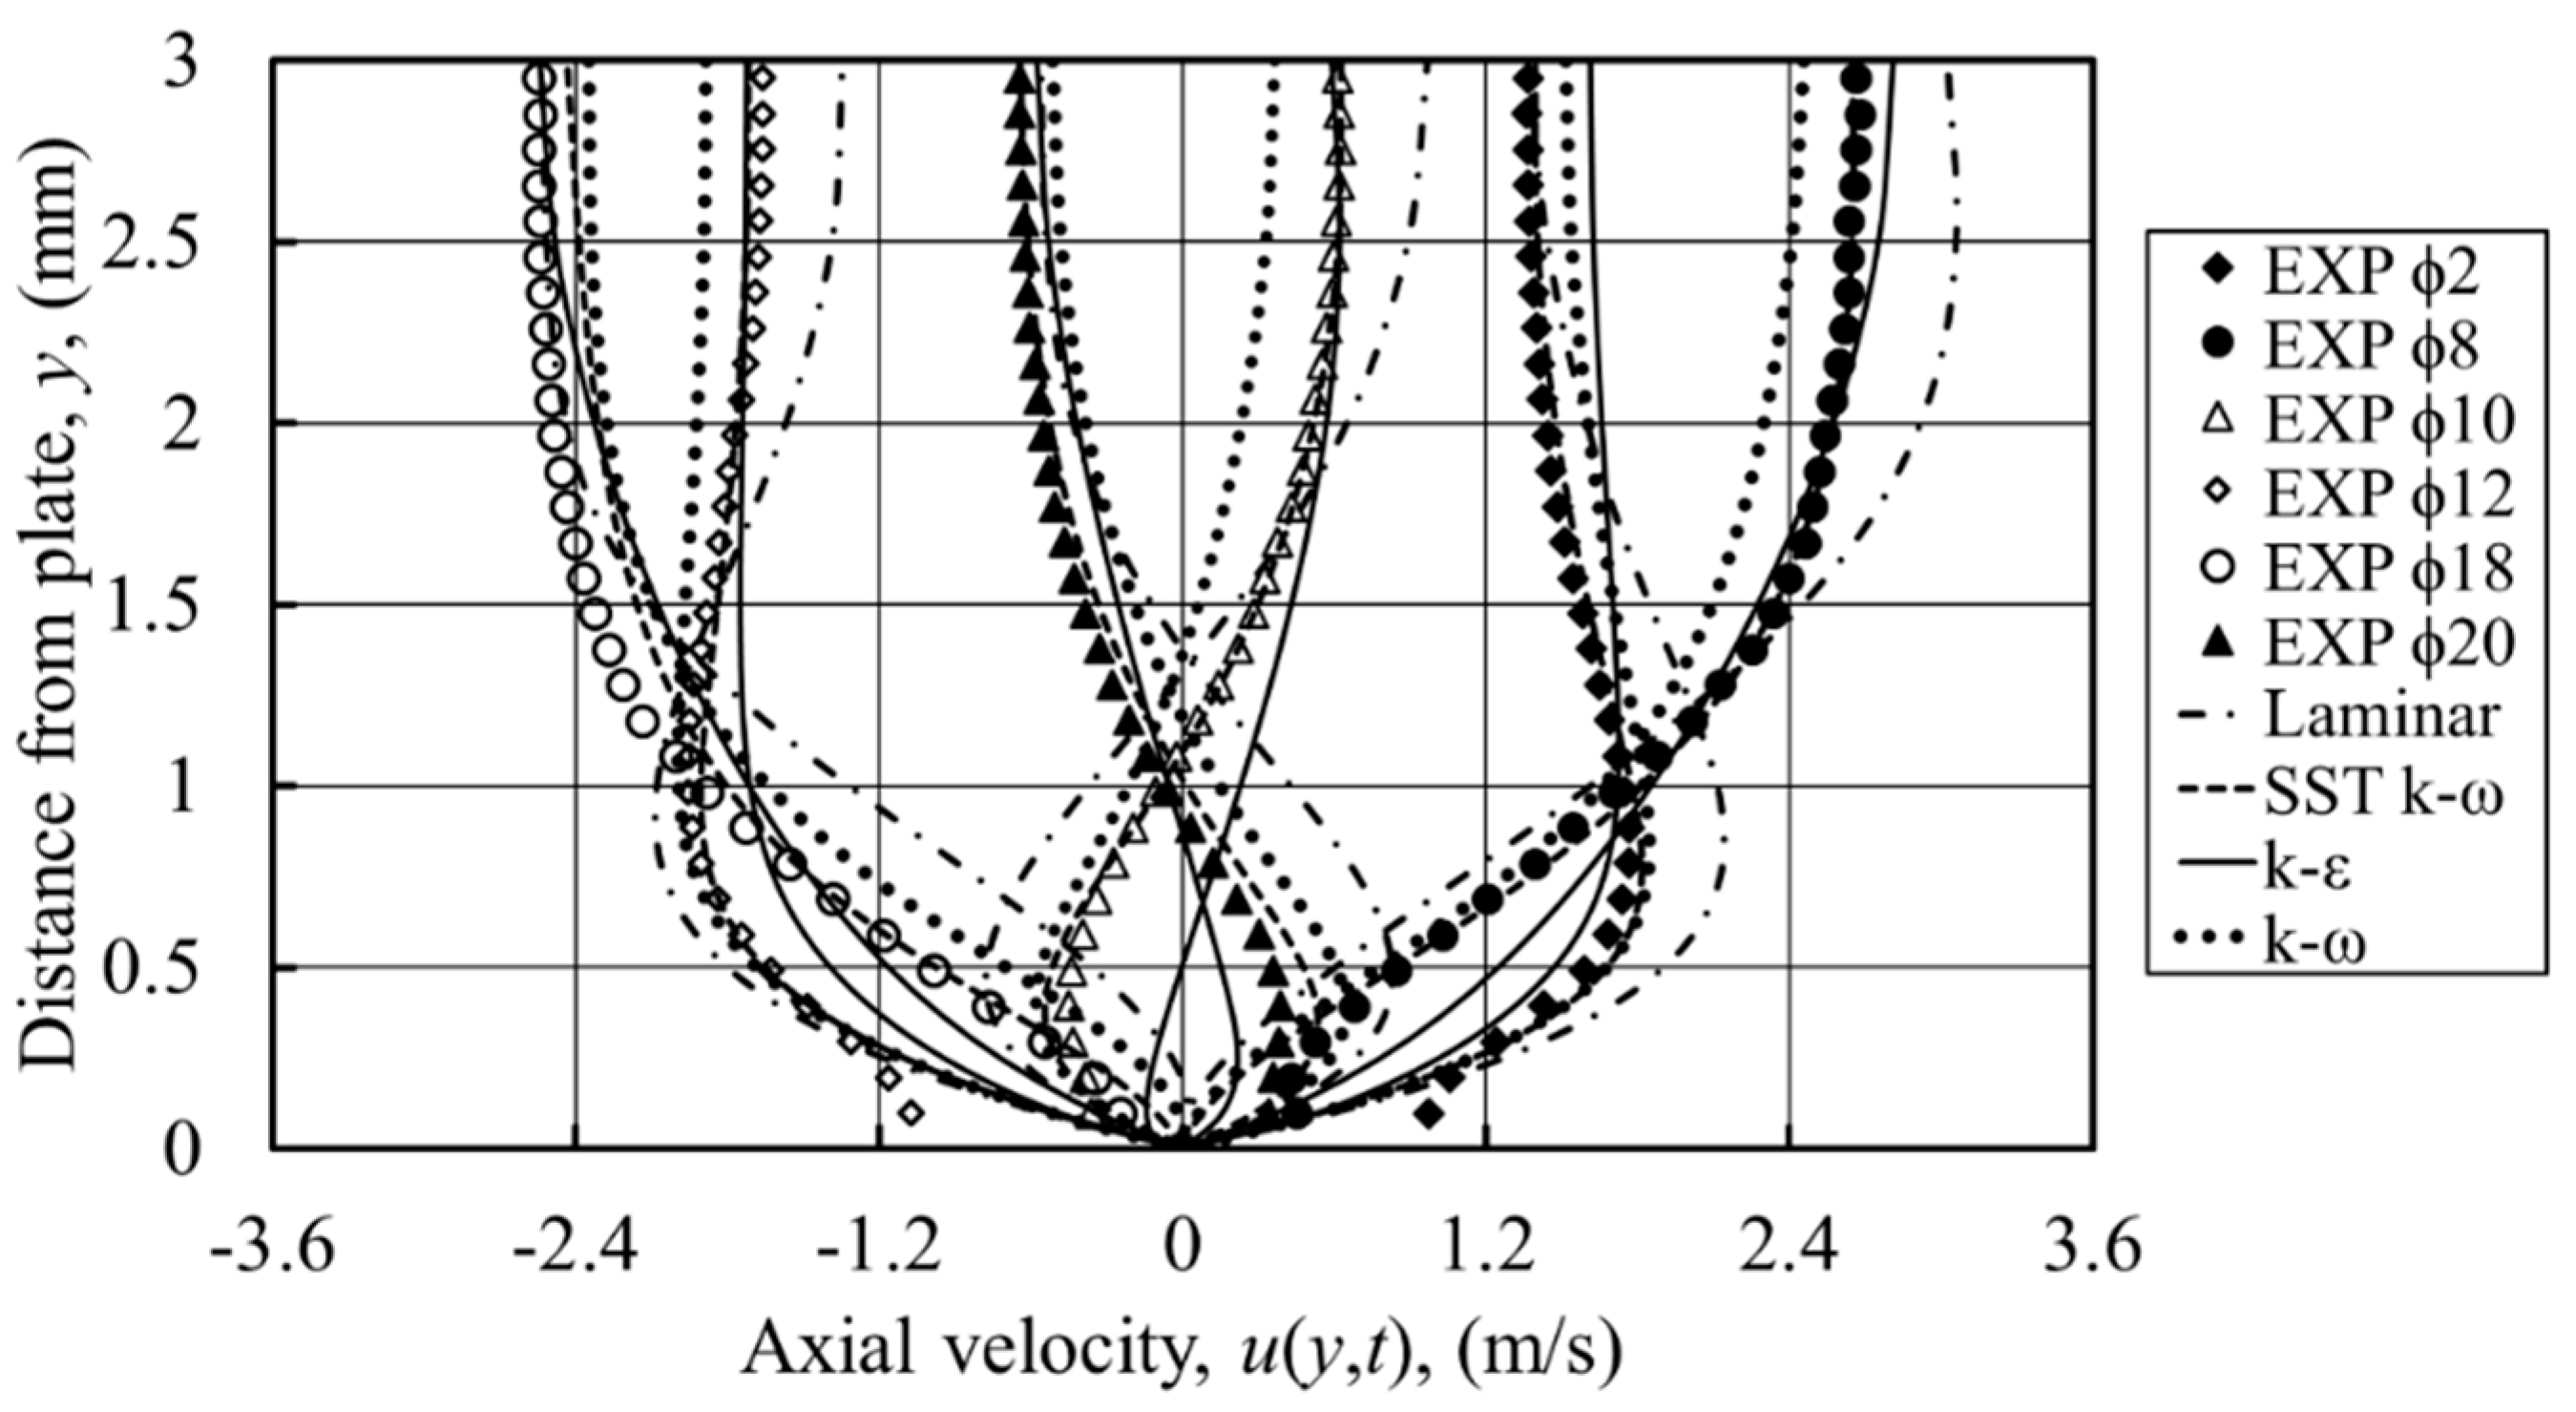
The comparison between velocity profiles from the experimental results and the numerical models tested is shown in
Figure 10 for selected phases of the flow cycle at the drive ratio of 0.83%. They are plotted at the location 10 mm away from the joint, above the cold plate. As mentioned earlier, the laminar model over-predicts the profiles especially at locations near the wall. The predictions from the k-ε and k-ω models miscalculate the magnitude of velocity both near the wall and within the flow “core” away from the wall. Taking
10 as an example, the k-ε model gives good predictions at the core, but under-predicts the velocity magnitude near the wall. On the other hand, the k-ω model gives a better prediction near the wall, but under-predicts the magnitude of the velocity at the core. The profiles are better predicted by the SST k-ω model.
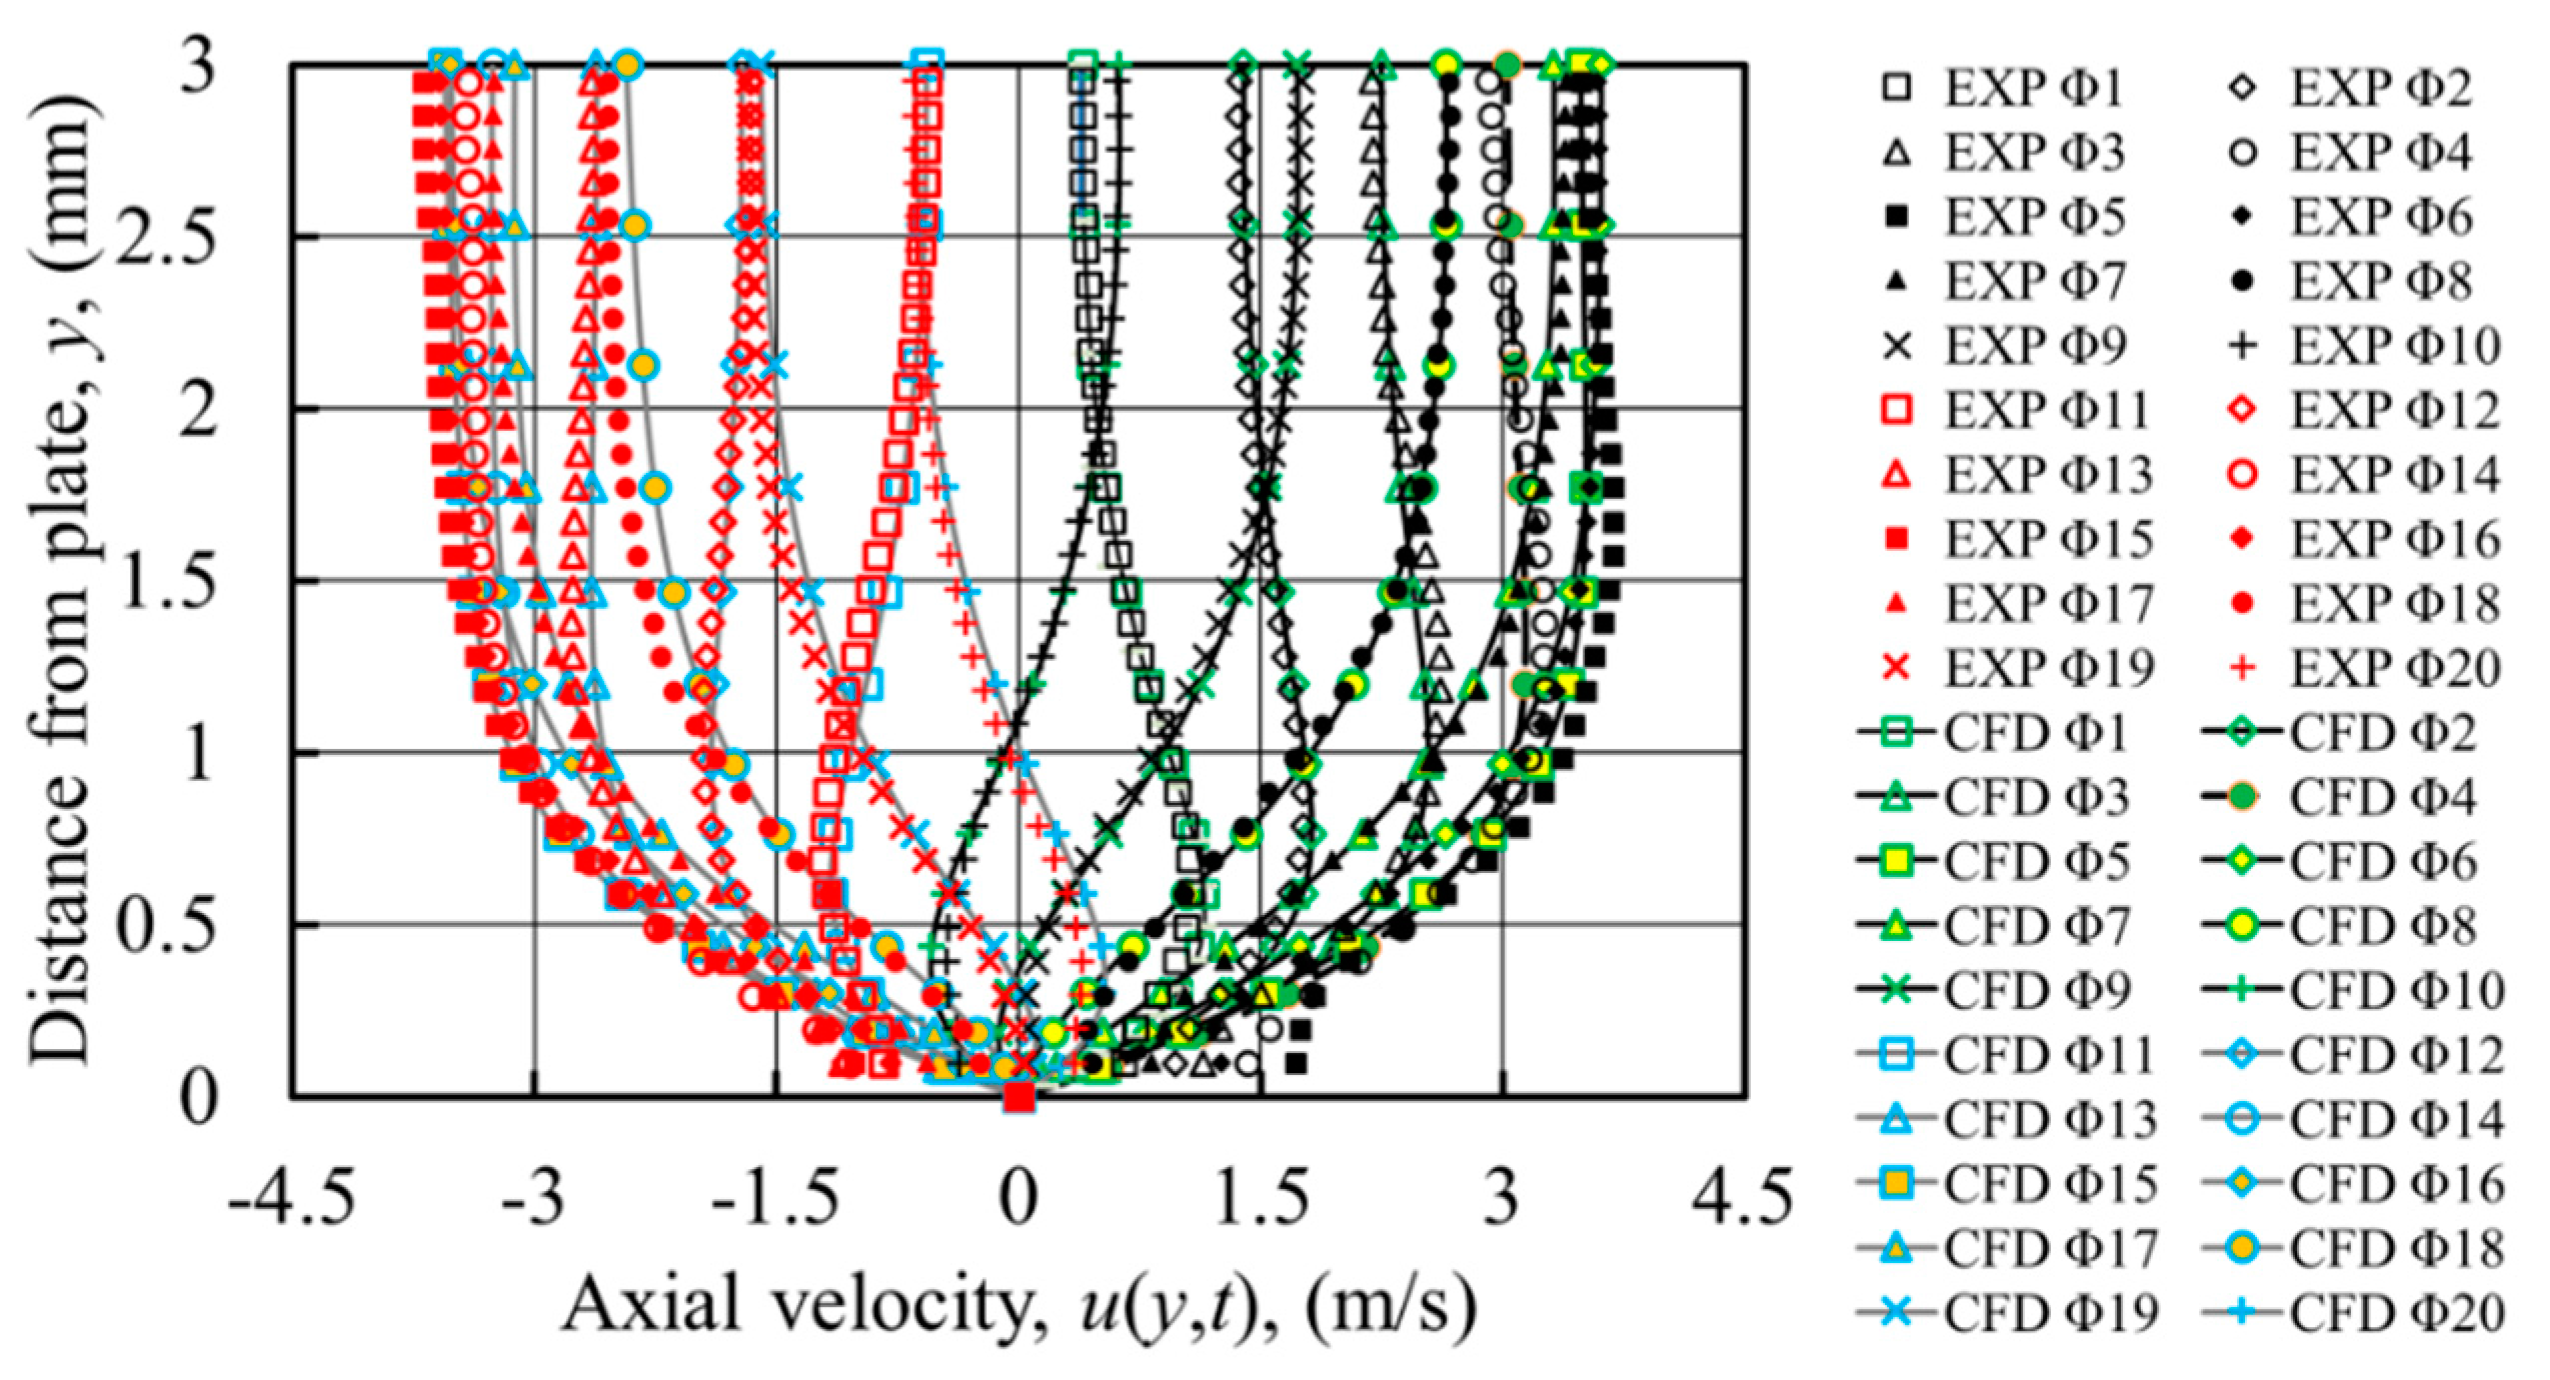
Figure 11 presents a comparison between experimental and numerical results from the SST k-ω model for all 20 phases. A good match, with a maximum error of 4.3%, is found for almost all phases in the flow cycle.
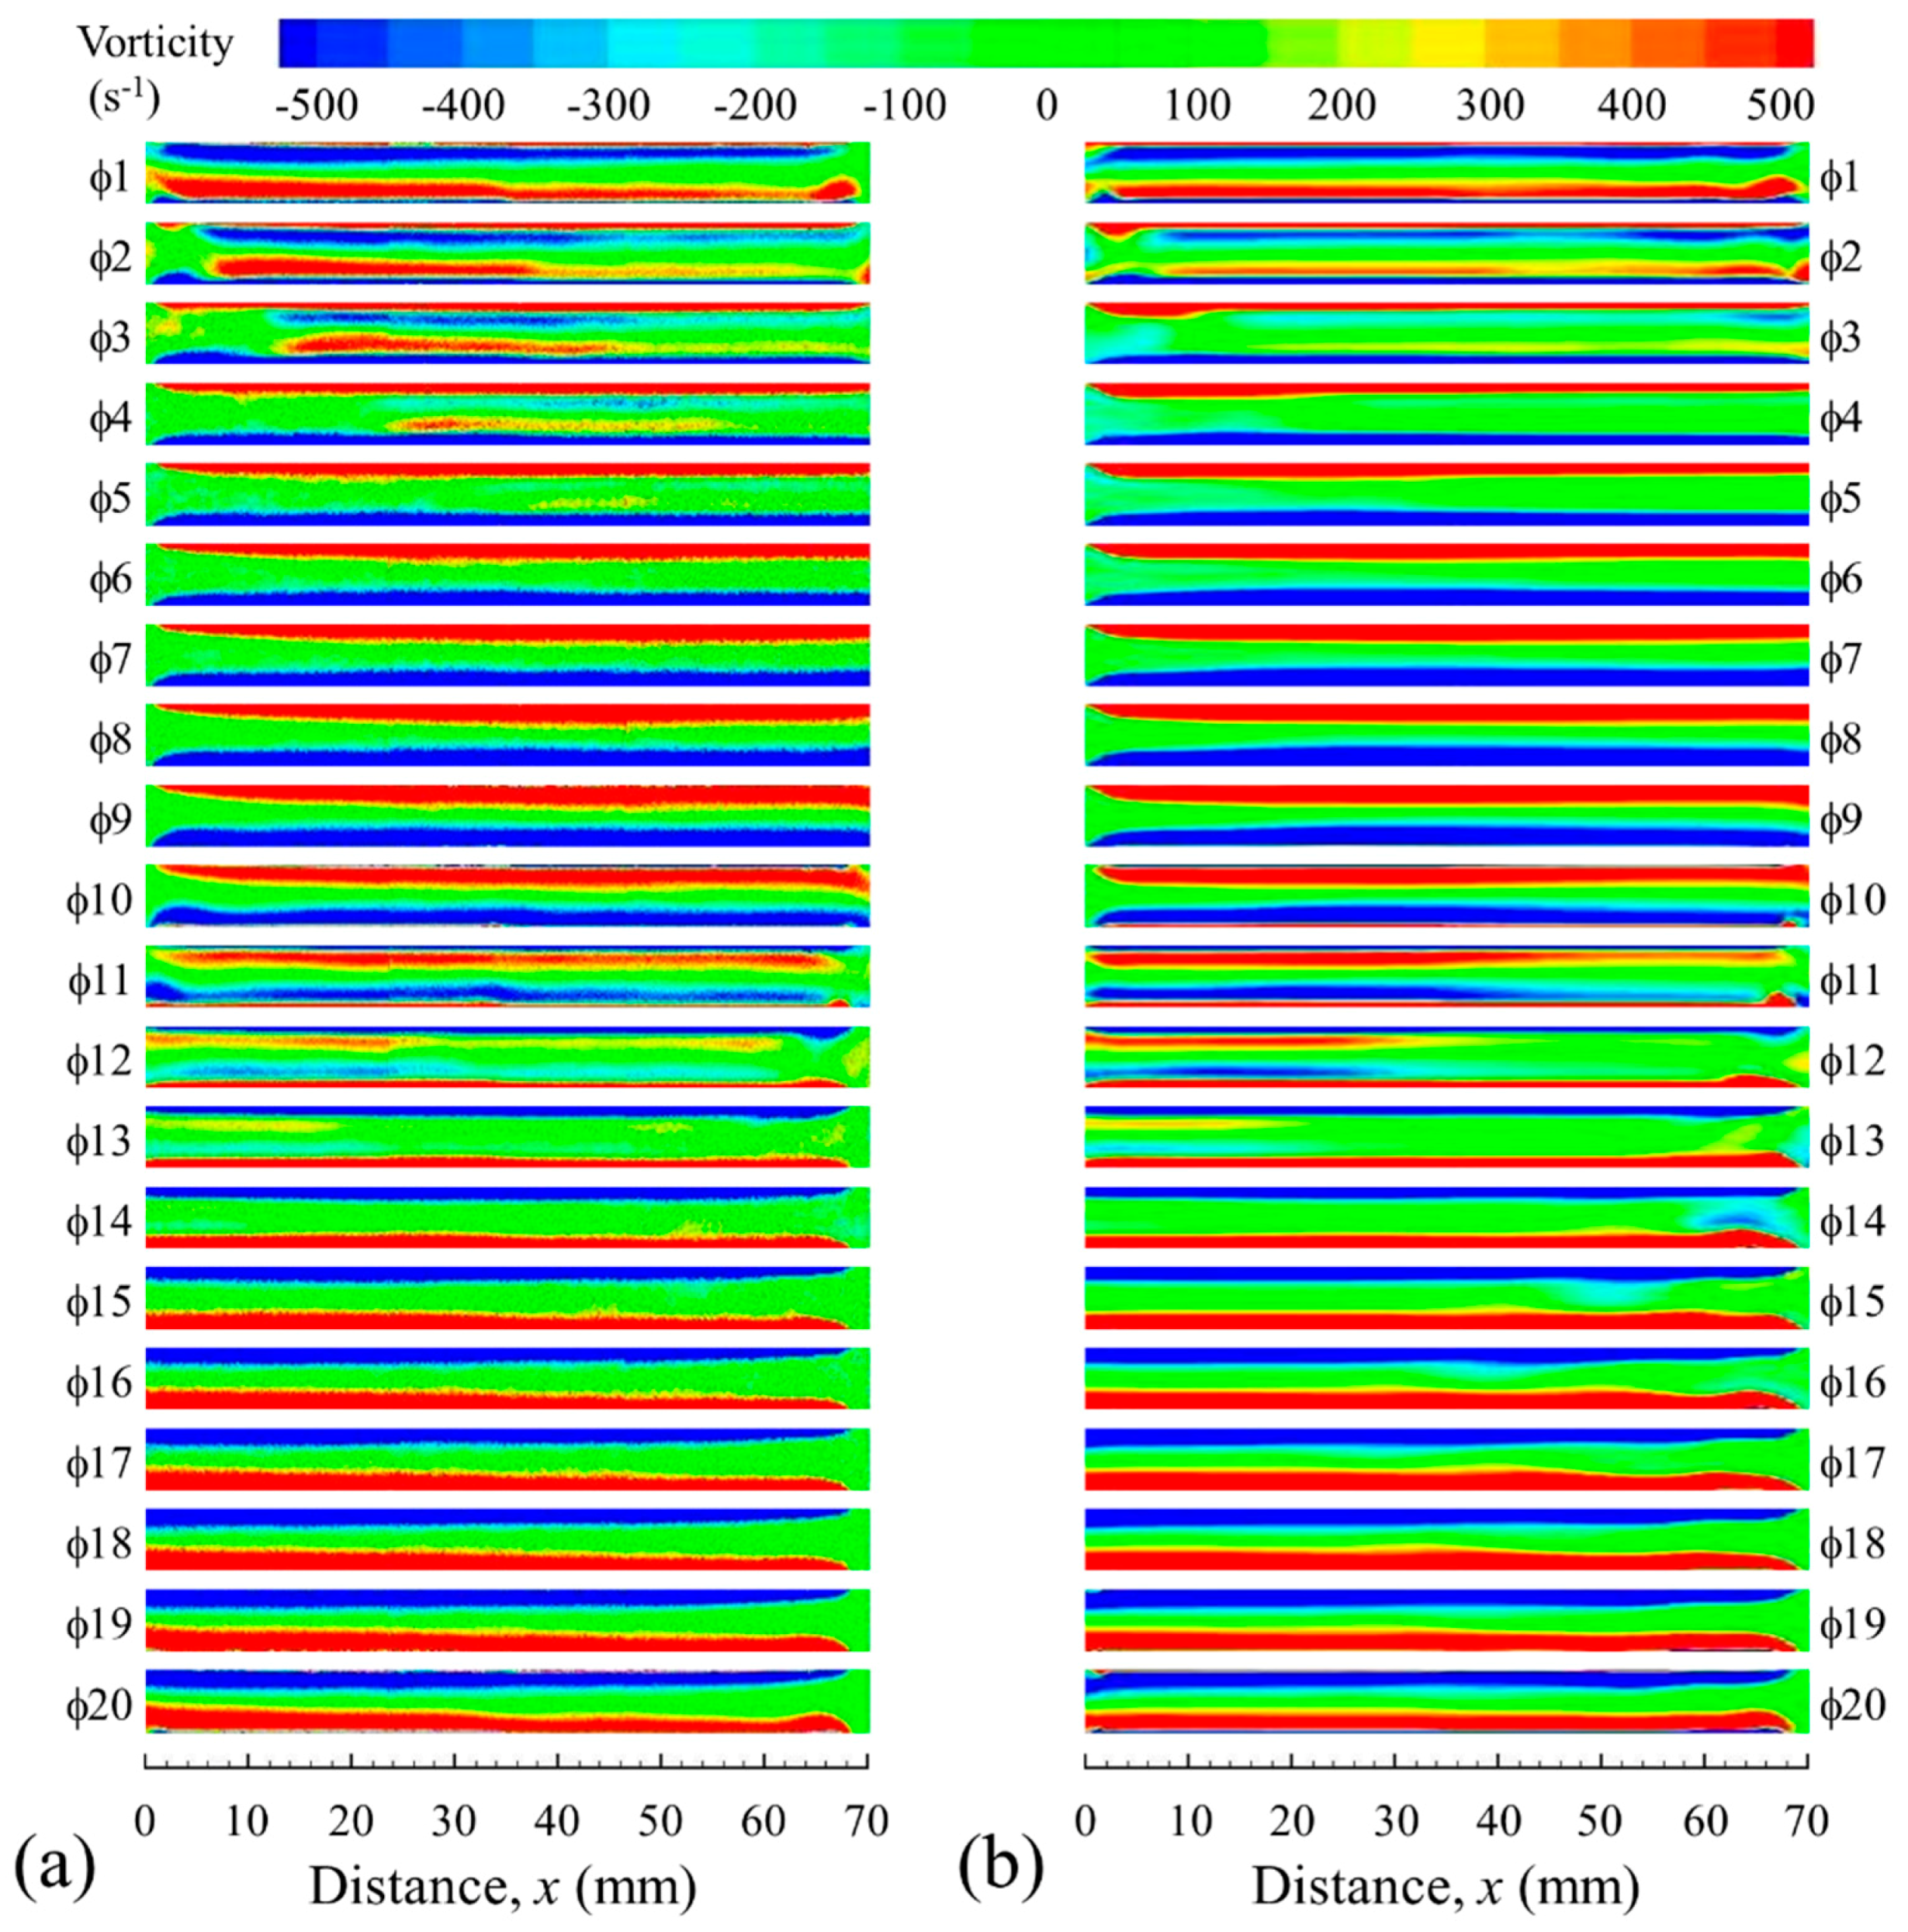
Figure 12 gives a similar comparison in terms of vorticity contours: a very good qualitative match is found. A slight disagreement on the strength of the secondary shear layer is still visible during the first few phases that represent the acceleration stages of a flow cycle (
2 to
4 and
to
). This may be related to the uncertainty of the measurement, as well as the two-dimensional assumptions of the numerical model used in a three-dimensional situation. Nevertheless, the SST k-ω model has provided the best solution for the drive ratio of 0.83% with the closest match to the experiment.
The vorticity contours at the ends of the heat exchanger assembly, calculated using the SST k-ω model, are shown in
Figure 13. They agree well with the experiment and are similar to the results from the k-ω model. This indicates that the vortex structures at the end of the plates are strongly influenced by the processes in the shear layer near the wall of the channel and that a correctly-defined flow condition within the channel leads to a better prediction of flow structures at the end of the plate. Clearly, the SST k-ω model with its excellent control parameter has given an improved prediction in both areas of the flow field.
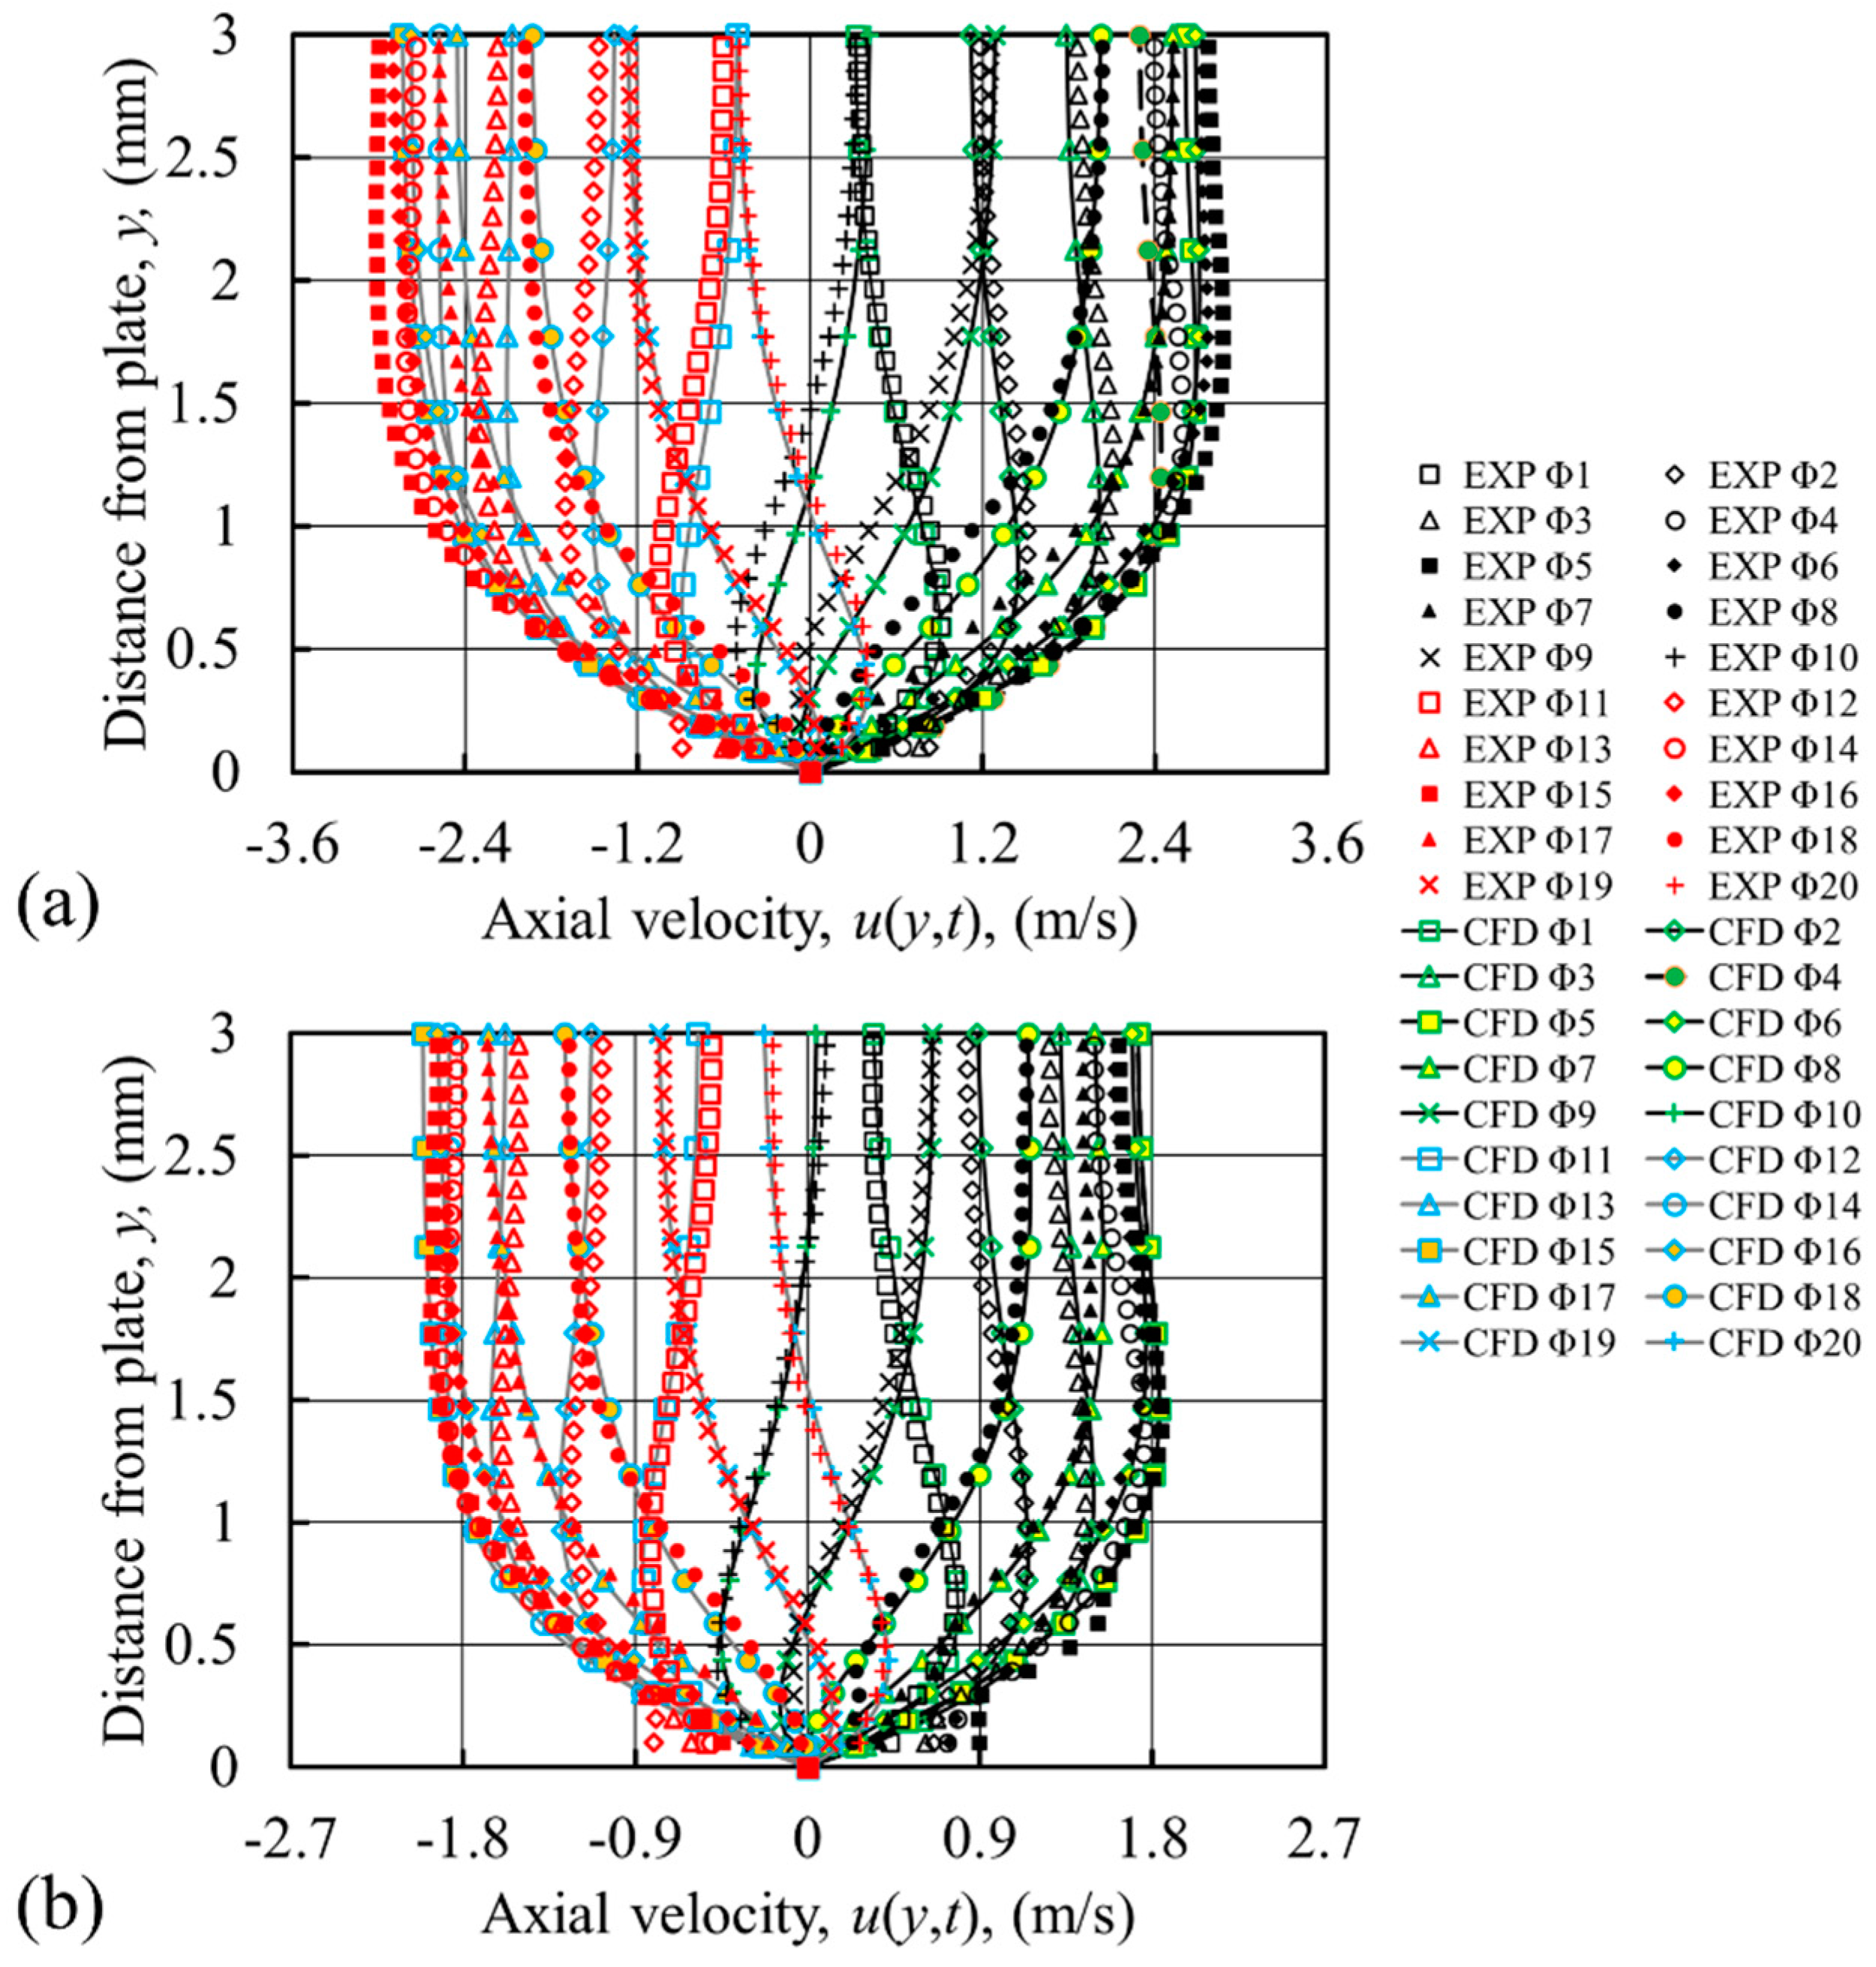
Following the successful application of the SST k-ω model at the drive ratio of 0.83%, it was subsequently applied to the other two drive ratios of 0.45% and 0.65%. The resulting velocity profiles for all 20 phases, together with experimental data, are shown in
Figure 14. For the drive ratio of 0.65%, a better match to the experiment is obtained, compared to laminar predictions shown earlier in
Figure 4c. The maximum deviation in
Figure 4c occurs at
5, where the velocity was numerically over-predicted by 8.9%. With the SST k-ω model, the maximum deviation is slightly reduced to 8.3%. The match is not as good as predicted for the drive ratio of 0.83%. For the drive ratio 0.45%, the SST k-ω model provides no improvement in the velocity profiles compared to the laminar model. This may indicate that the flow at the drive ratio of 0.45% has not yet reached a state suitable for the application of a turbulence model. However, the laminar model does not provide a satisfactory solution either.
Observations of the experimental and numerical results in two extreme conditions of drive ratios of 0.3% and 0.83% suggest the occurrence of transition within this range. Therefore, the four-equation transition model (transition-SST [
27]) is used.
Figure 15 shows the resulting velocity profiles for drive ratios of 0.45% and 0.65%. The velocity profiles for a drive ratio of 0.65% are slightly better predicted than the profile shown in
Figure 14a, with the maximum error of 5.3%. Hence, the transition model seems to be a better model for predicting the flow at this drive ratio. The difference in amplitude of velocity between experimental and numerical results at
5 and
15 may be due to the moderation constant [
21,
23,
26,
27] not being varied in this study.
For drive ratio of 0.45%, the transition-SST model provides velocity profiles that agree well with the experiment, with the maximum deviation of 5.2% (cf.
Figure 15b). This may indicate that the flow at this drive ratio is already transitional in its nature. Generally, in oscillatory flow, turbulent transition is a much more complex process than in uni-directional flow. Swift [
1] summarizes that the transitional region exists between the “weakly turbulent region” (flow with turbulent bursts at the centre of the pipe with the boundary layer remaining laminar) and the “conditionally turbulent region” (where the flow changes between “weakly turbulent” and “fully-turbulent” flow within a cycle). Furthermore, an oscillatory flow may also experience “relaminarization” where a “turbulent-like” flow is followed by a “laminar-like” flow in one cycle (cf. [
8,
9]).
As seen from
Table 1, the drive ratios investigated here correspond to Stokes’ layer-based Reynolds number,
, well below 400, which would be the critical Reynolds number for an infinite pipe [
7]. However, the heat exchanger assembly in the current study has a short length. The disturbances from the edge of plates and the vortices shed and subsequently re-entrained (cf.
Figure 13) may act as flow instabilities triggering turbulent transition. This may explain the need for the turbulence/transition model even though the Reynolds number is seemingly below the widely-accepted critical value.
As discussed above, with reference to
Figure 3, the velocity amplitude at location
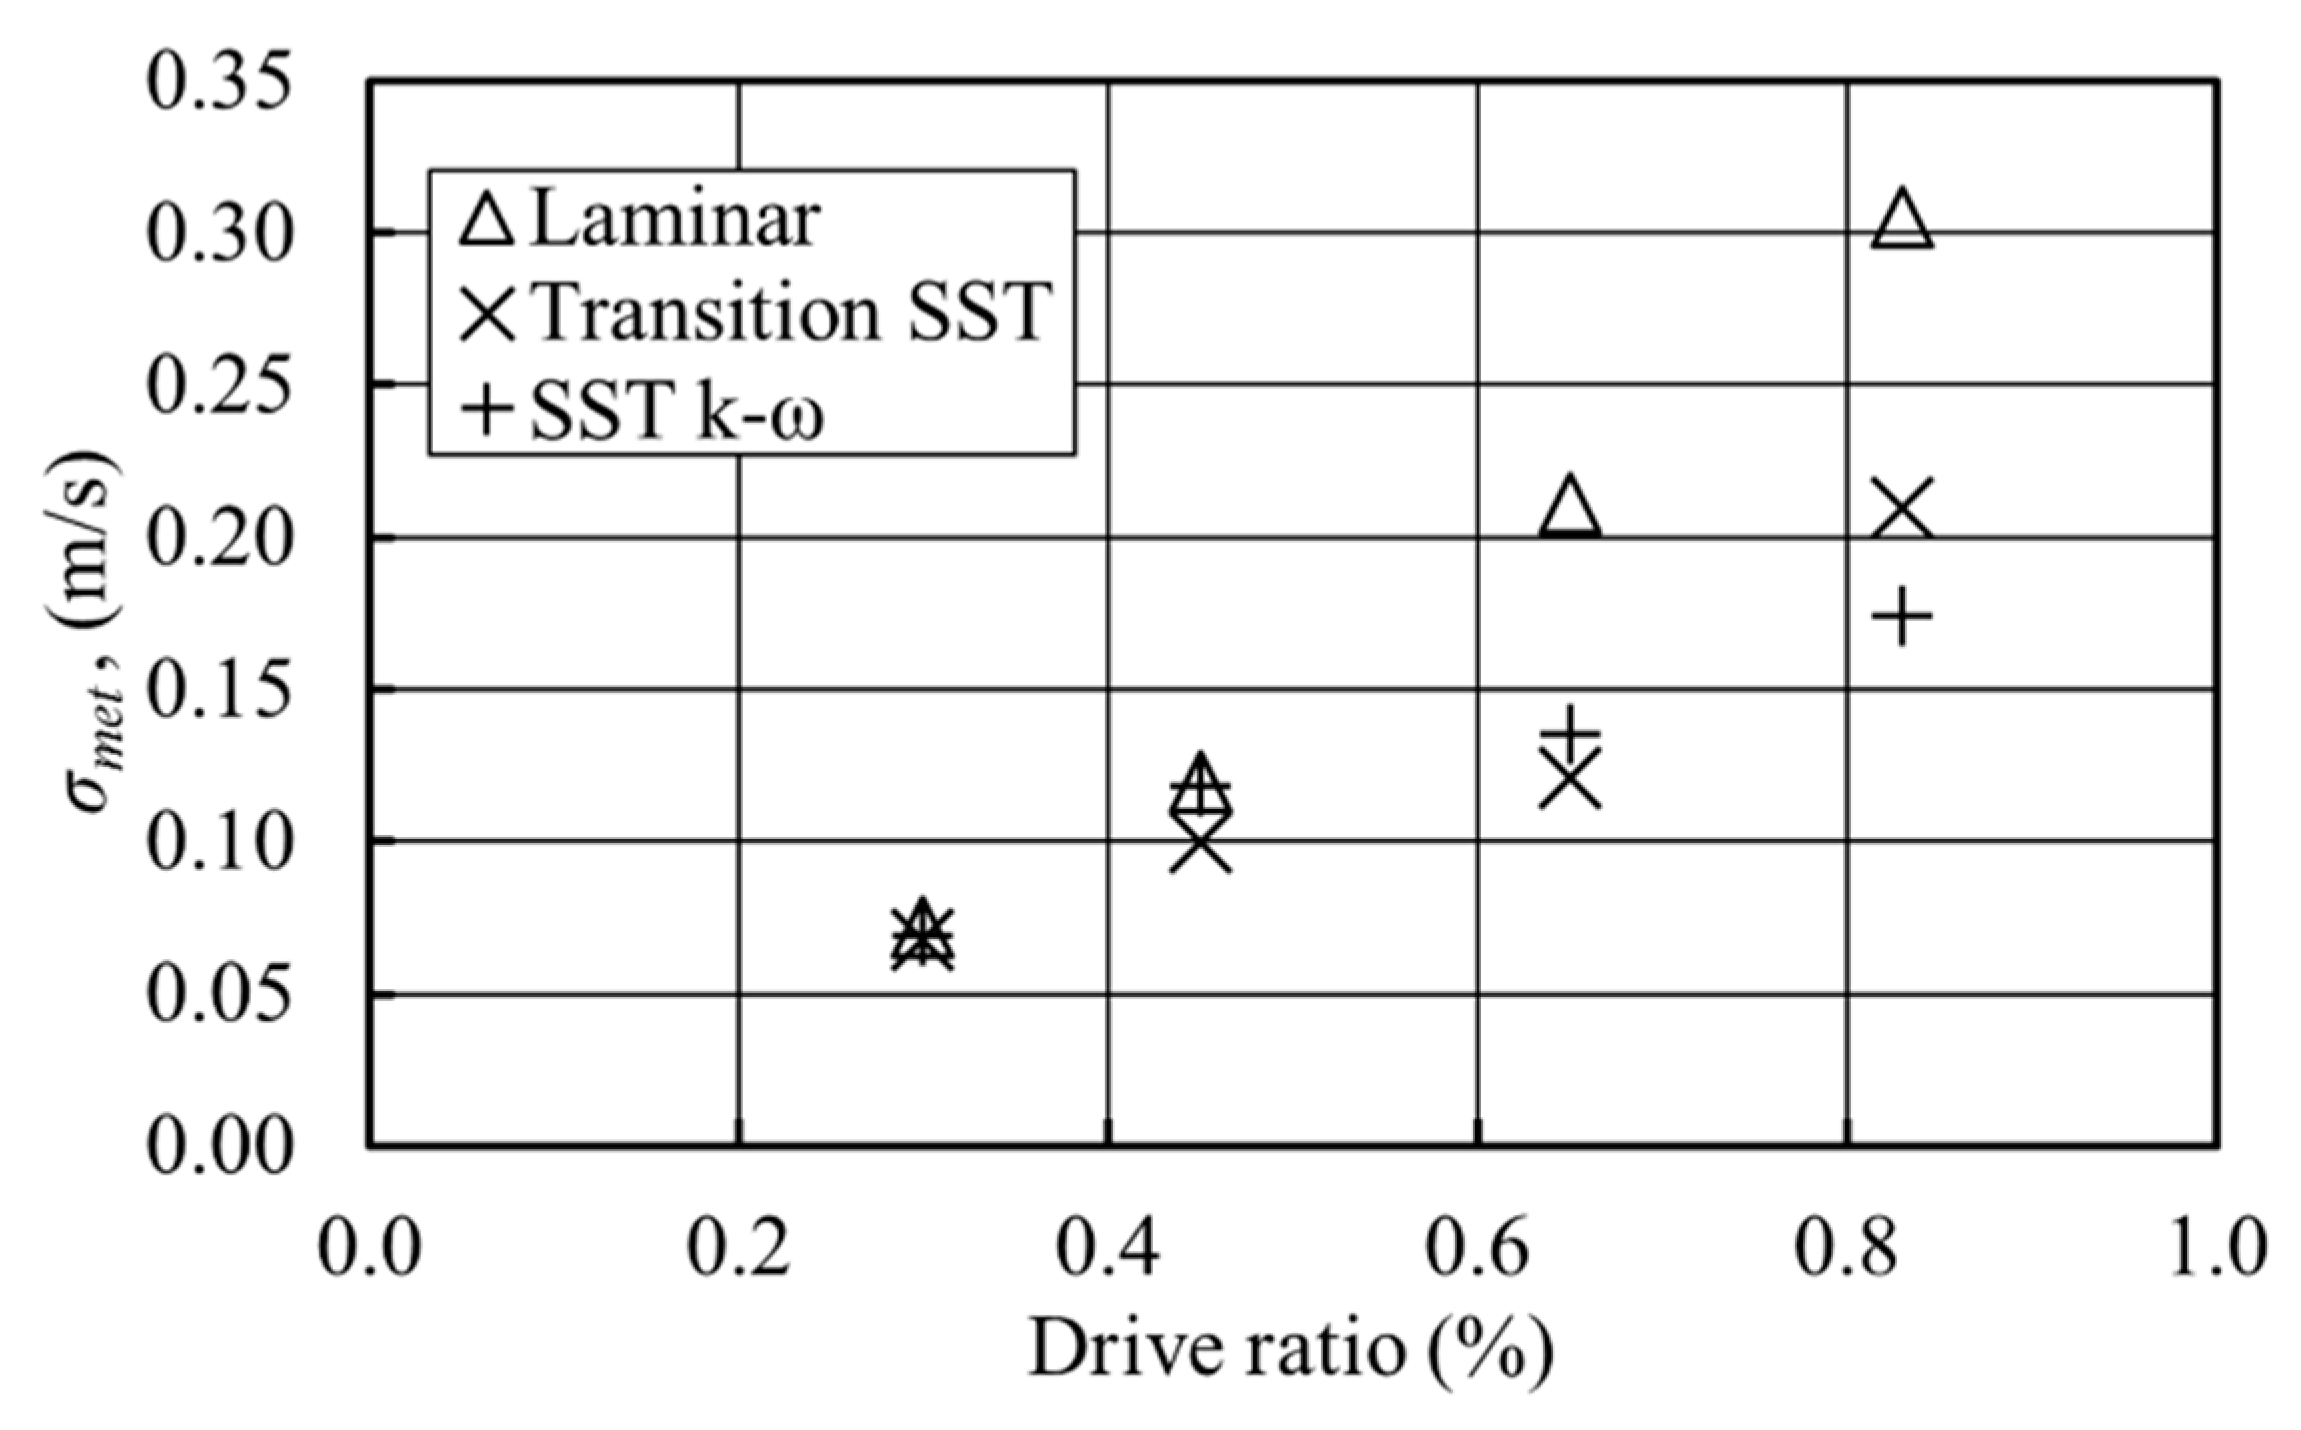
is not a suitable benchmark to judge the quality of CFD against experimental results. On the other hand, judging the appropriateness of the models from vorticity maps may not be entirely objective. It is possible to introduce various “metrics” to judge the quality of CFD solutions; one of the simplest resembles the concept of the standard deviation. When considering
-velocity profiles in the channel, at a selected axial location as an example, it can be defined as follows:
where
and
simply denote the discrete locations
between the wall and channel centreline (here, the maximum
is
) and the phase number in the cycle (here, the maximum
is
), respectively. It attempts to describe the deviation of the CFD-based profile from the experimental profile, or in other words, the “goodness” of predictions. The numerical values are appropriately interpolated so that
y-coordinates of CFD points match with the experimental ones. Of course, the smaller the metric
, the better the match.
Figure 16 shows the plot of metric
for the application of three models: laminar, transition-SST and SST k-ω at the drive ratios studied. It is clear that for the smallest drive ratio, all models give a very similar value of
. As the drive ratio increases, the laminar model gives the largest discrepancies (the metric
grows almost linearly). Meanwhile, the transition-SST model seems to give the best predictions for drive ratios of 0.45% and 0.65%, while SST k-ω gives the best prediction for the highest drive ratio of 0.83%. This is congruent with the previous discussions that identify the transition processes for drive ratios as low as 0.45%. Of course a caveat must be made that in this example, a selected profile of velocity at the location 10 mm away from the joint above the cold plate is considered.
The velocity magnitudes tabulated in
Table 1 can also be used to represent the gas displacement,
; hence, the drive ratios of 0.30%, 0.45%, 0.65% and 0.83% correspond to the gas displacements of 16, 23, 36 and 47 mm, respectively. Clearly, the gas parcel in the flow with a drive ratio higher than 0.65% moves by a distance longer than half of the total length of the heat exchanger channel (70 mm). The forward and backward movements of the gas parcel convey the energy of the vortex structures at the end of plates into the channel.
Vortex structures of the selected phase,
8, obtained from the numerical calculations for drive ratios of 0.3% and 0.83% are shown in
Figure 17. Evidently, the strong vortices appearing in the plate wake for the drive ratio of 0.83% can create strong flow disturbances when pushed back into the channel. This could be a possible explanation for the appearance of turbulence (and the need for transition/turbulence model) at this drive ratio as a means of dissipating the flow energy.
The growth of any flow disturbances that occur between the plates of the heat exchanger can also be complicated by the effects of the thermal expansion that causes the gas particles to move at a different displacement amplitude for the two halves of one cycle. The short length of the plates investigated in this study prohibits the flow of high drive ratios to reach a fully-developed state. Most heat exchangers are short, and a practical system works with a high drive ratio. This study suggests that turbulence is likely to occur within heat exchangers working in the oscillatory flow condition for Stokes Reynolds numbers well below the critical value of 400 given by Merkli and Thomann [
7].
3.3. Viscous Dissipation
In a viscous flow, the energy of the fluid motion (kinetic energy) is turned into internal energy of the fluid through the existence of viscous dissipation. A dimensionless approach, introduced by Worlikar [
11] and Mao [
28], has been used with appropriate consideration of the porosity of the area within the heat exchanger and the open areas next to both ends of the heat exchanger (0.65 and one, respectively) [
22]. The total dimensionless viscous dissipation is calculated as:
where:
The terms
,
and
in Equation (15) are the area, viscosity and phase of a flow cycle, respectively; the term in square brackets is the area-weighted-average value of dimensionless dissipation, which is also averaged over one flow cycle. The dimensionless dissipation in Equation (16) is related to the mean flow velocity. The results in
Figure 18 are shown as a product of porosity,
, Eckert number,
(where
,
and
are the reference values of velocity, specific heat and temperature, respectively) and the area-weighted-average value of dimensionless dissipation. The reference values are taken at the location 200 mm away from the end of CHX. More detailed explanations and dimensional analysis were already given by Mohd Saat and Jaworski [
21]. The Eckert number,
, expresses the relationship between the flow kinetic energy and enthalpy and is used to characterise dissipation.
The viscous dissipation presented by Equation (16) is also known as “direct dissipation”, not to be confused with turbulent dissipation [
25]. The velocity components
and
in Equation (16) are the mean velocity components of the flow. As with the laminar model, the direct dissipation represents the transfer of mechanical energy to internal energy through viscosity. The turbulent dissipation (which is the transfer of energy from the mean motion into the turbulence fluctuation and then into the internal energy) is indirectly affecting the mean flow when the turbulence model is used. The effect of turbulence on the internal energy of the flow is reflected in the final velocity of the mean flow used in Equations (1), (2) and (16). The laminar model was used for the drive ratio of 0.30%, the transition-SST model for drive ratios of 0.45% and 0.65%, while the SST k-ω model for the drive ratio of 0.83%.
Figure 18 shows that the viscous dissipation increases as the drive ratio increases. The increment occurs in areas both within the channel (
Figure 18a) and the area outside (
Figure 18b). Hot areas have a higher viscous dissipation compared to cold ones, due to the increase of viscosity with temperature. Furthermore, thermal expansion at the area bounded by the wall of the HHX and the buoyancy-driven flow as reported in [
16], particularly prominent at the hot end, may well be responsible for the higher viscous dissipation within these areas. As the drive ratio increases, the amplitude of flow increases, and the viscous dissipation becomes larger.
3.4. Heat Transfer Condition
Finally, the wall heat transfer calculated from the CFD models is compared to the experimental data. Heat flux,
, for all models is averaged over one cycle and the length of the heat exchanger,
, and calculated as:
Subscripts
and
refer to HHX and CHX, respectively. Here, the mean thermal conductivity,
, is used to calculate the heat flux obtained from laminar, transition-SST and SST k-ω models [
22].
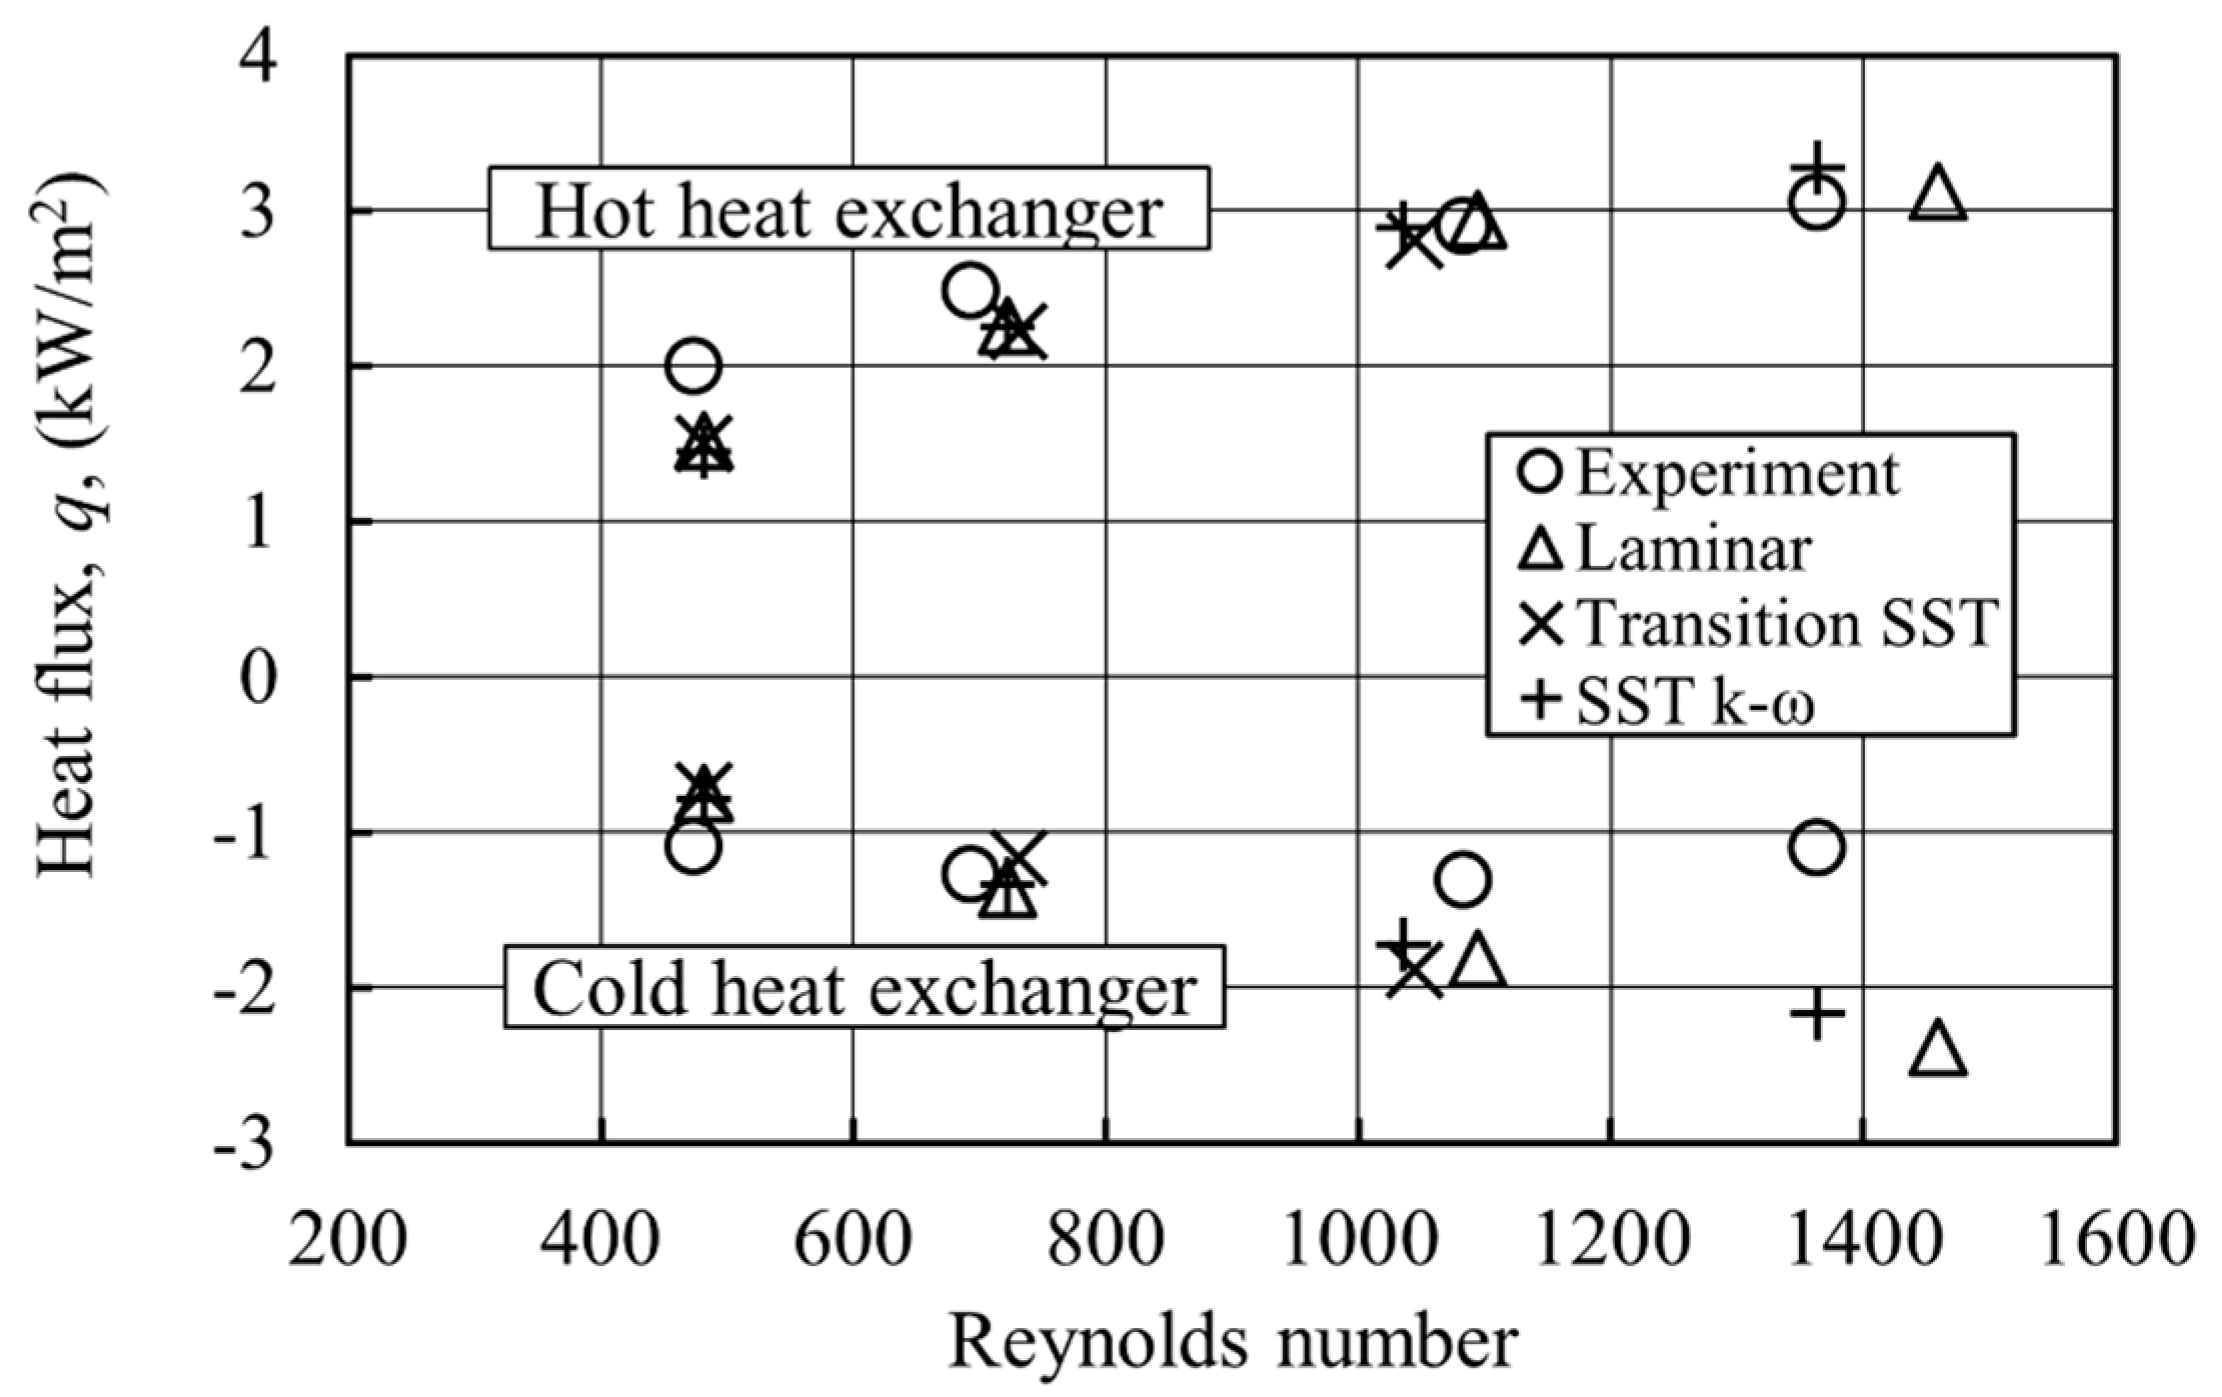
Figure 19 shows that the heat flux predicted from the numerical models and experiments increases with an increase of the drive ratio (indeed, for easier comparisons with the literature, the drive ratio is replaced by the Reynolds number, but it is still easy to identify the four drive ratios). The Reynolds number is calculated as
as already outlined in
Section 2. The flow behaviour for drive ratios investigated in this paper has been shown to be well predicted using the SST k-ω turbulence model and the transition-SST model. Therefore, the results shown in
Figure 19 are based on the laminar and these two turbulent models.
In general, judging from
Figure 19, the numerical predictions of heat transfer at the HHX are reasonably well aligned with the experimental values for all drive ratios. Here, the lowest discrepancy between numerical predictions and experiment is around 24% for the lowest drive ratio of 0.30%. As the drive ratio increases, the discrepancy drops to 7%. On the other hand, for the CHX, the agreement seems reasonable for the three lower drive ratios, 0.30%, 0.45% and 0.65%, where the lowest discrepancy is around 31%, 4% and 30%, respectively. The disagreement becomes substantially worse for the highest drive ratio of 0.83%, where the smallest discrepancy between CFD and the experiment is around 97%.
Of course, a judgement as to what constitutes reasonable agreement is somewhat arbitrary; however, the literature tends to agree that in complex flow cases like this, a discrepancy of around 30% is not unexpected. One also needs to remember that the experimental results were obtained from the acetone-based PLIF measurement technique with the stated temperature accuracy of ±16 K, where calibration for the low temperature end of the range is particularly challenging. This may well explain the discrepancies between CFD and experiment that tend to be within 30% in the majority of cases, but in particular, also the case of the highest drive ratio for the CHX, which seems to be an experimental “outlier”.
It is also worth comparing in detail the CFD results themselves. It is clear that the results obtained from the turbulent models are consistently closer to the experiment than from the laminar model (although this improvement is dwarfed by the overall large gap between all numerical results and the experiment). In particular, the transition-SST model gives better predictions of heat flux for drive ratios of 0.45% and 0.65% compared to predictions from the laminar model. For the highest drive ratio of 0.83%, the use of the SST k-ω, instead of the laminar, model brings the discrepancy of 117% down to 97%.
