
Levels of Organic Pollution Indicators in Groundwater at the Old Landfill and Waste Management Site


Abstract
:1. Introduction
2. Materials and Methods
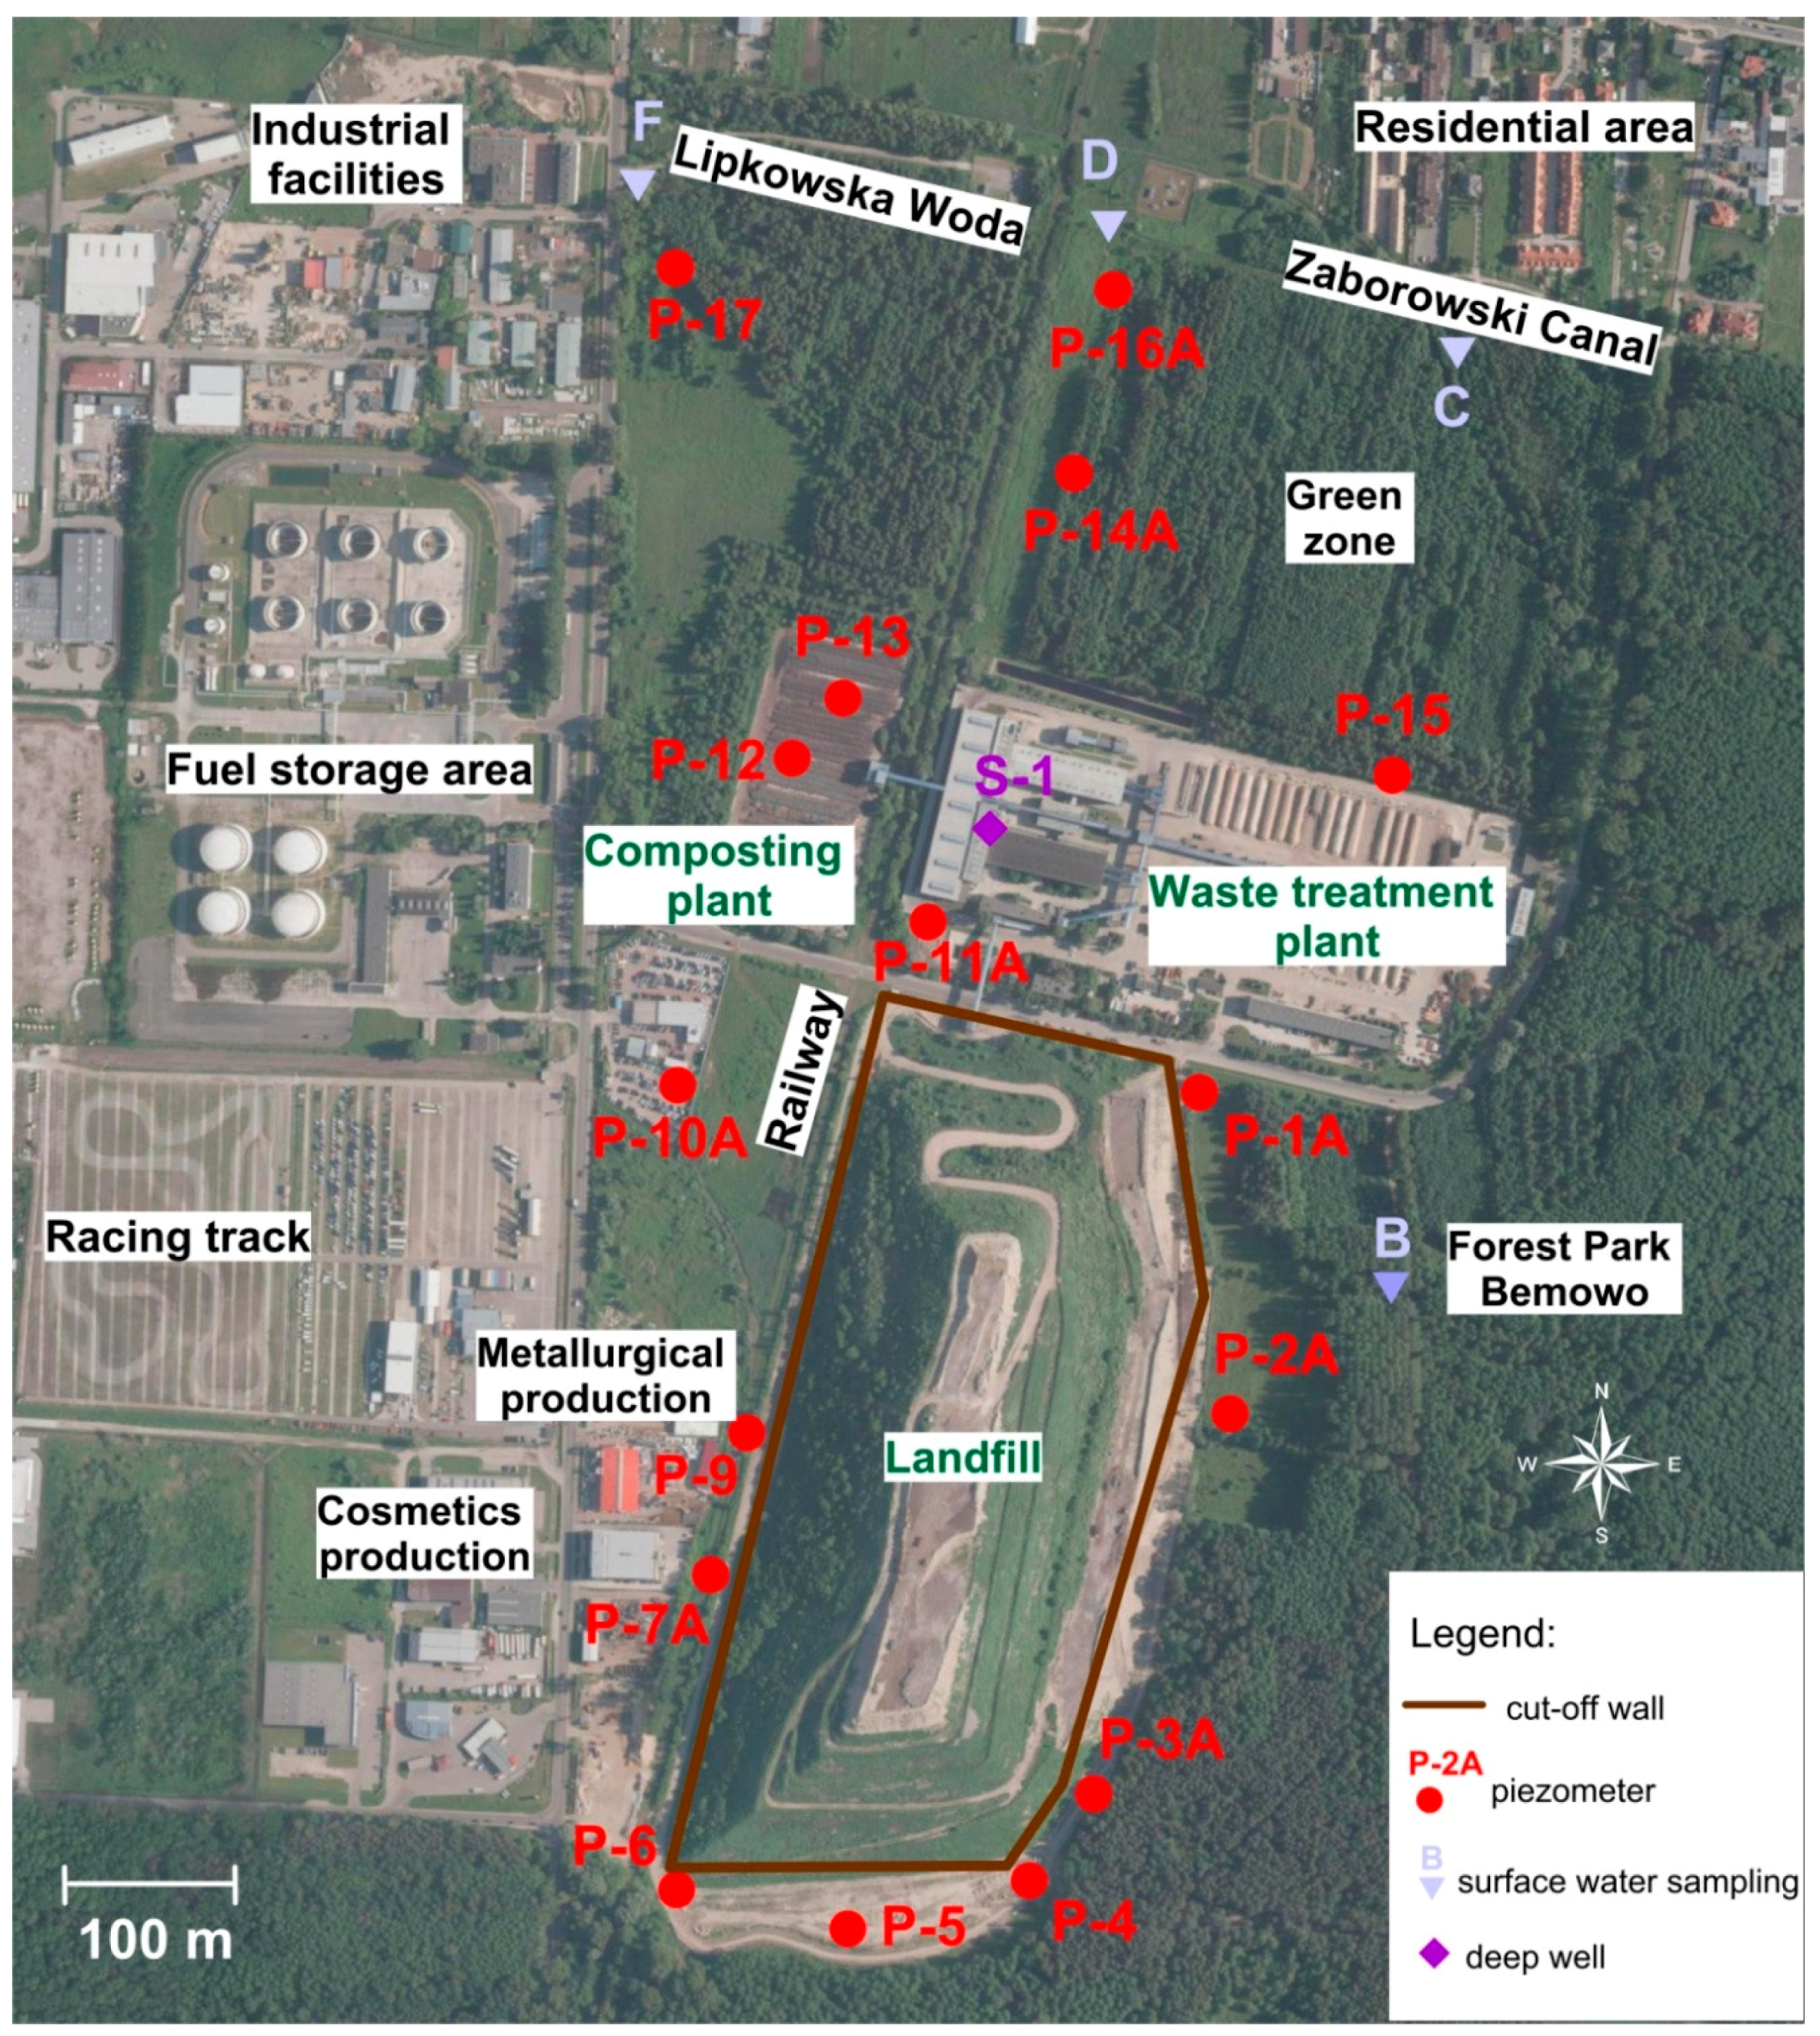
2.1. Site Characteristics
2.2. Geological and Hydrogeological Conditions
2.3. Technical Characteristics of the Vertical Barrier
2.4. Monitoring Network
2.5. Sampling and Experimental Analysis
2.6. Statistical Analysis
3. Results
3.1. Pollution Level in Groundwater Due to Localization of Piezometers
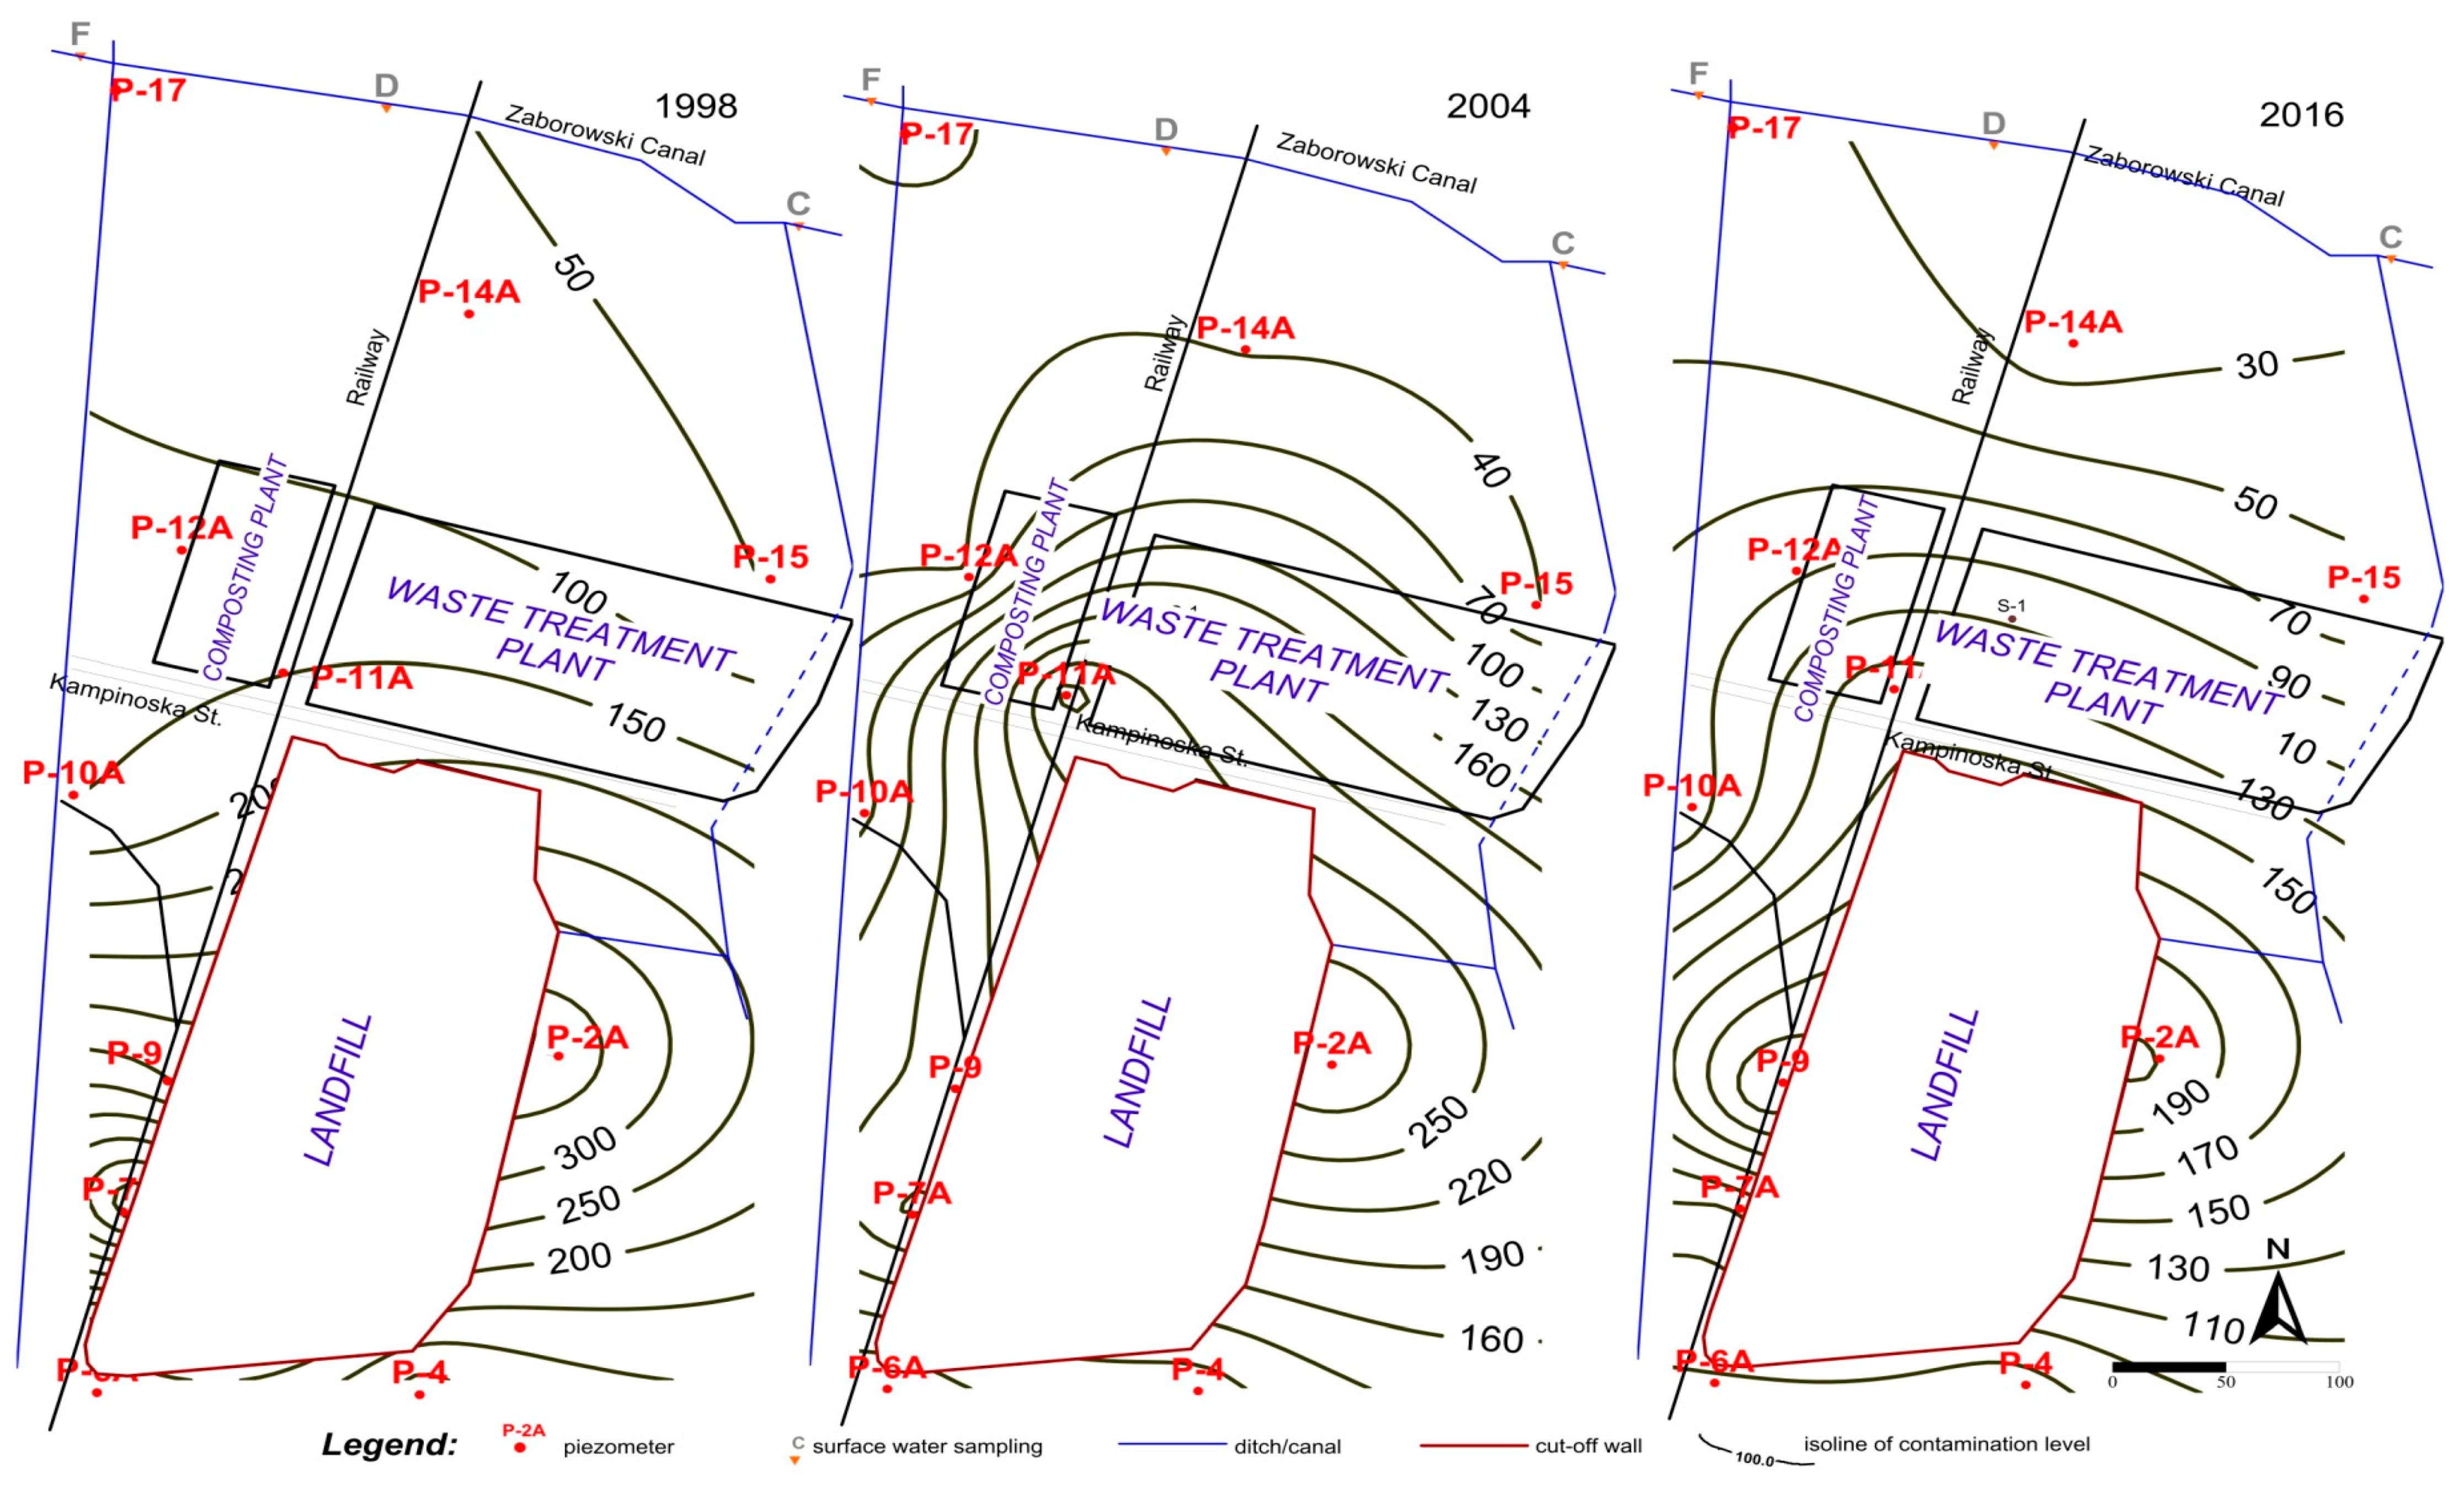
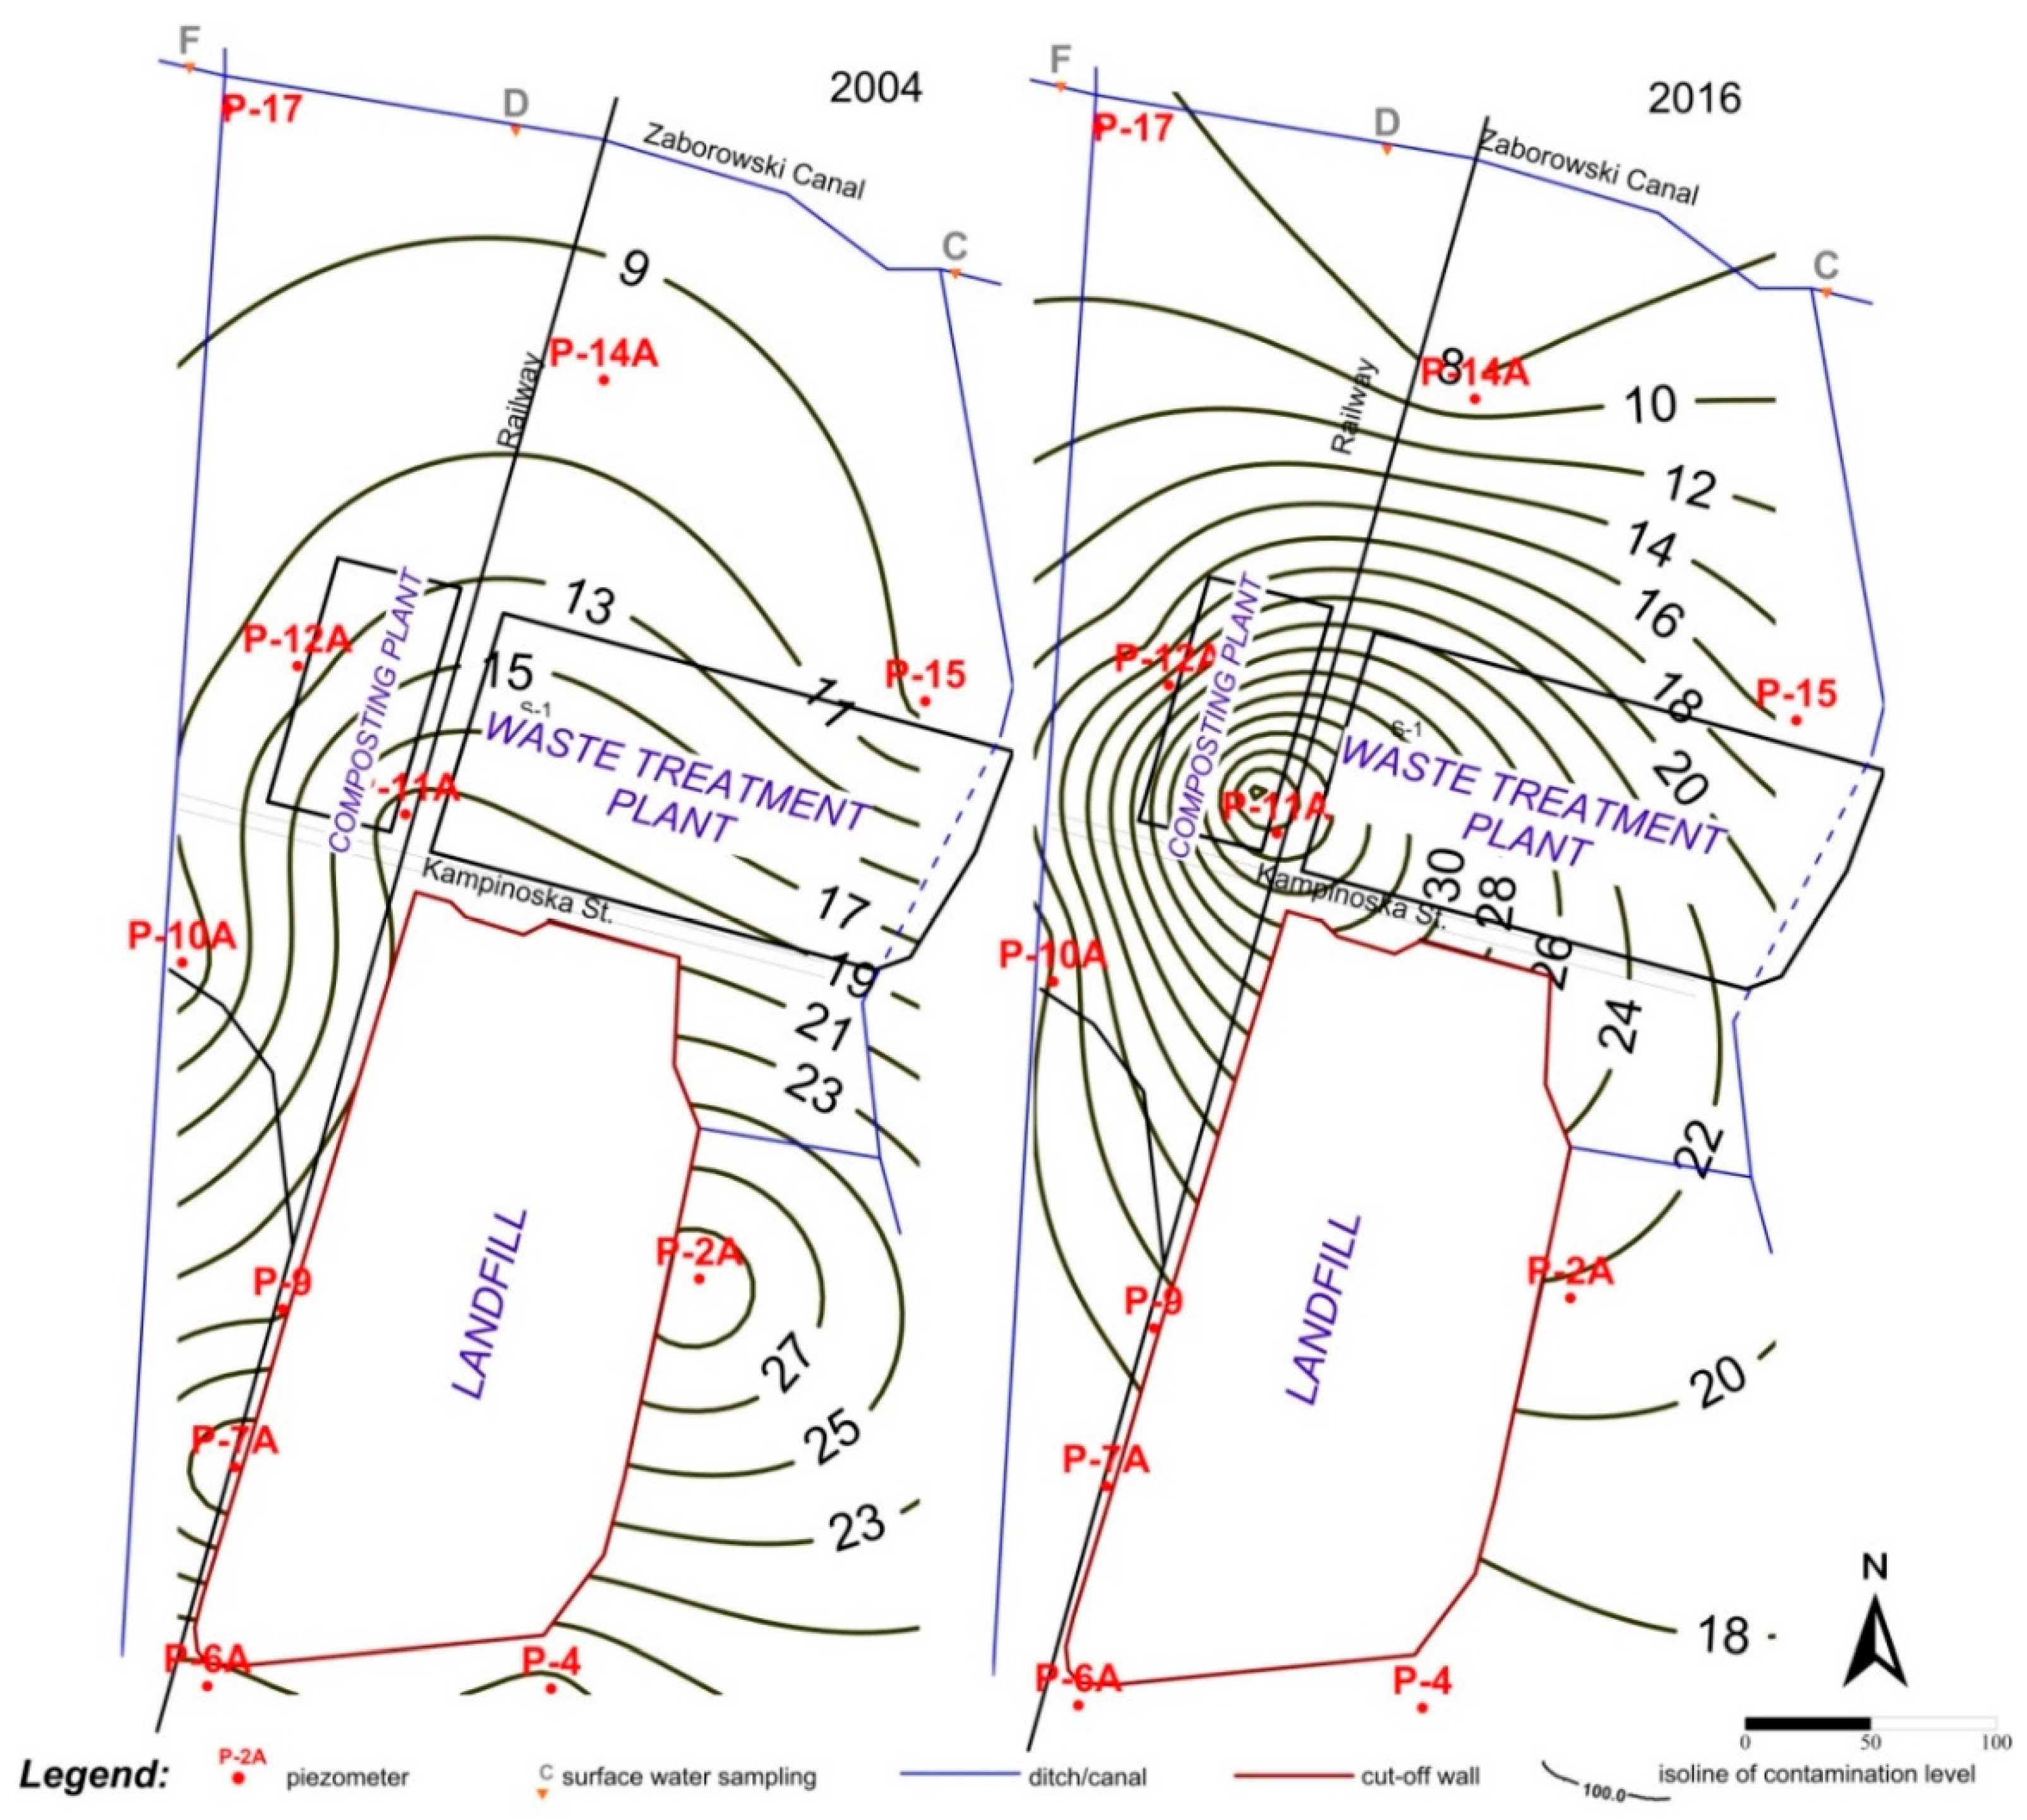
3.2. Areal Distribution and Temporal Changes of Organic Pollution Indicators (BOD, COD, TOC) in Groundwater
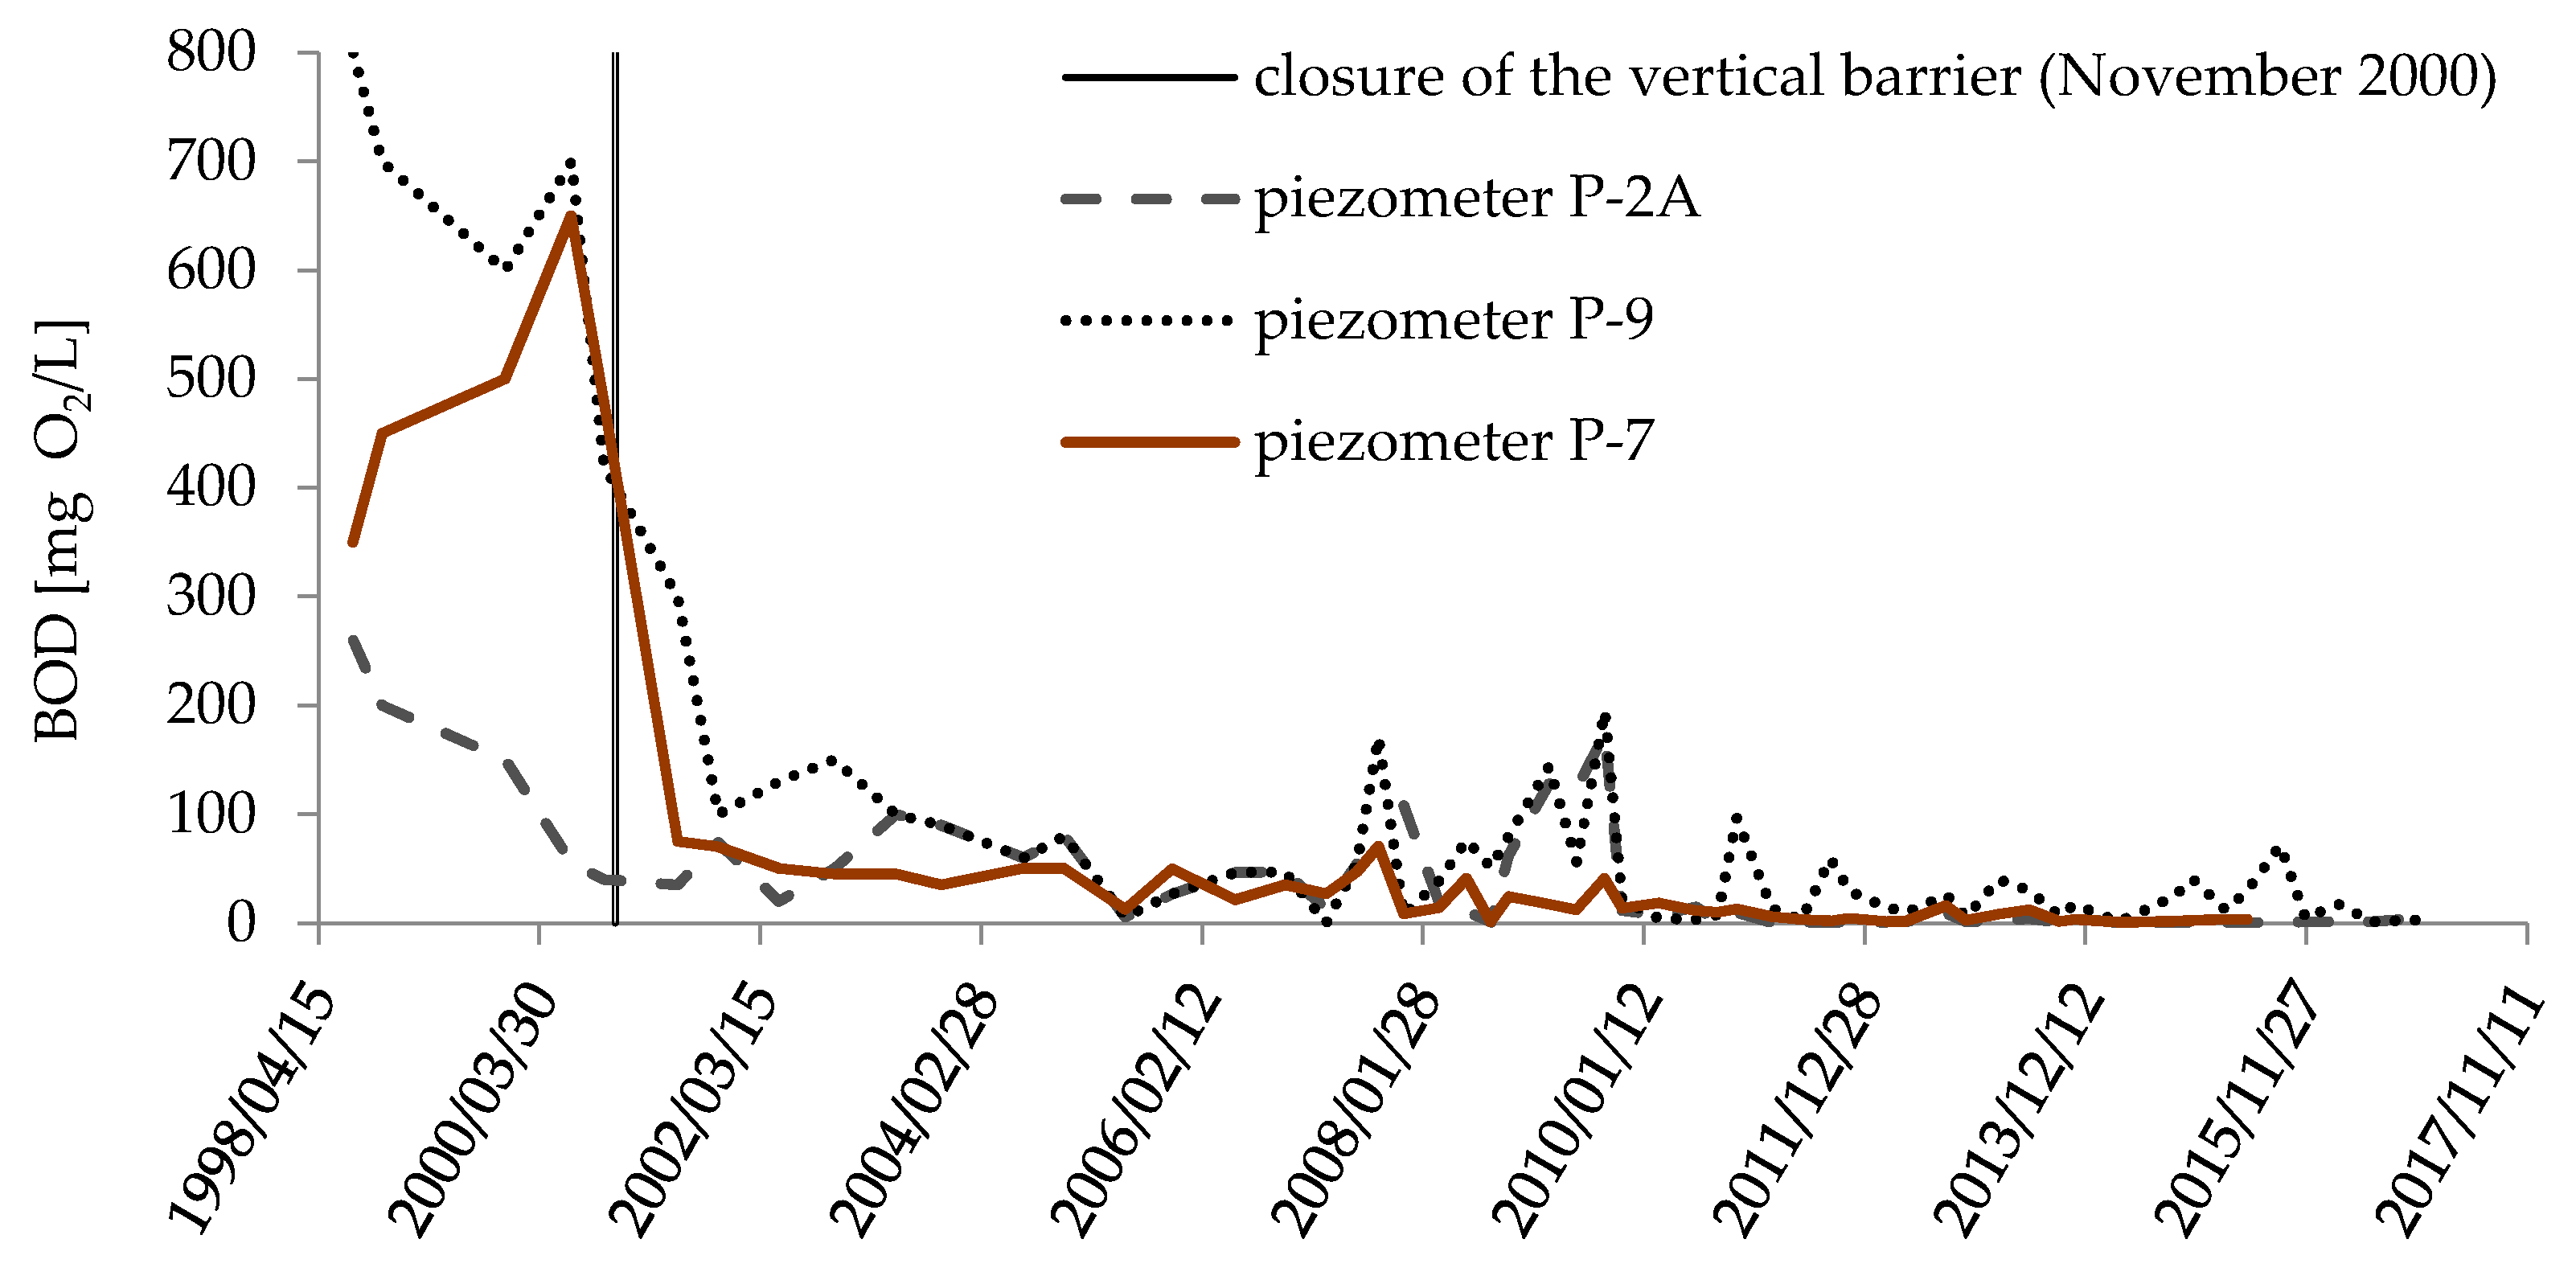
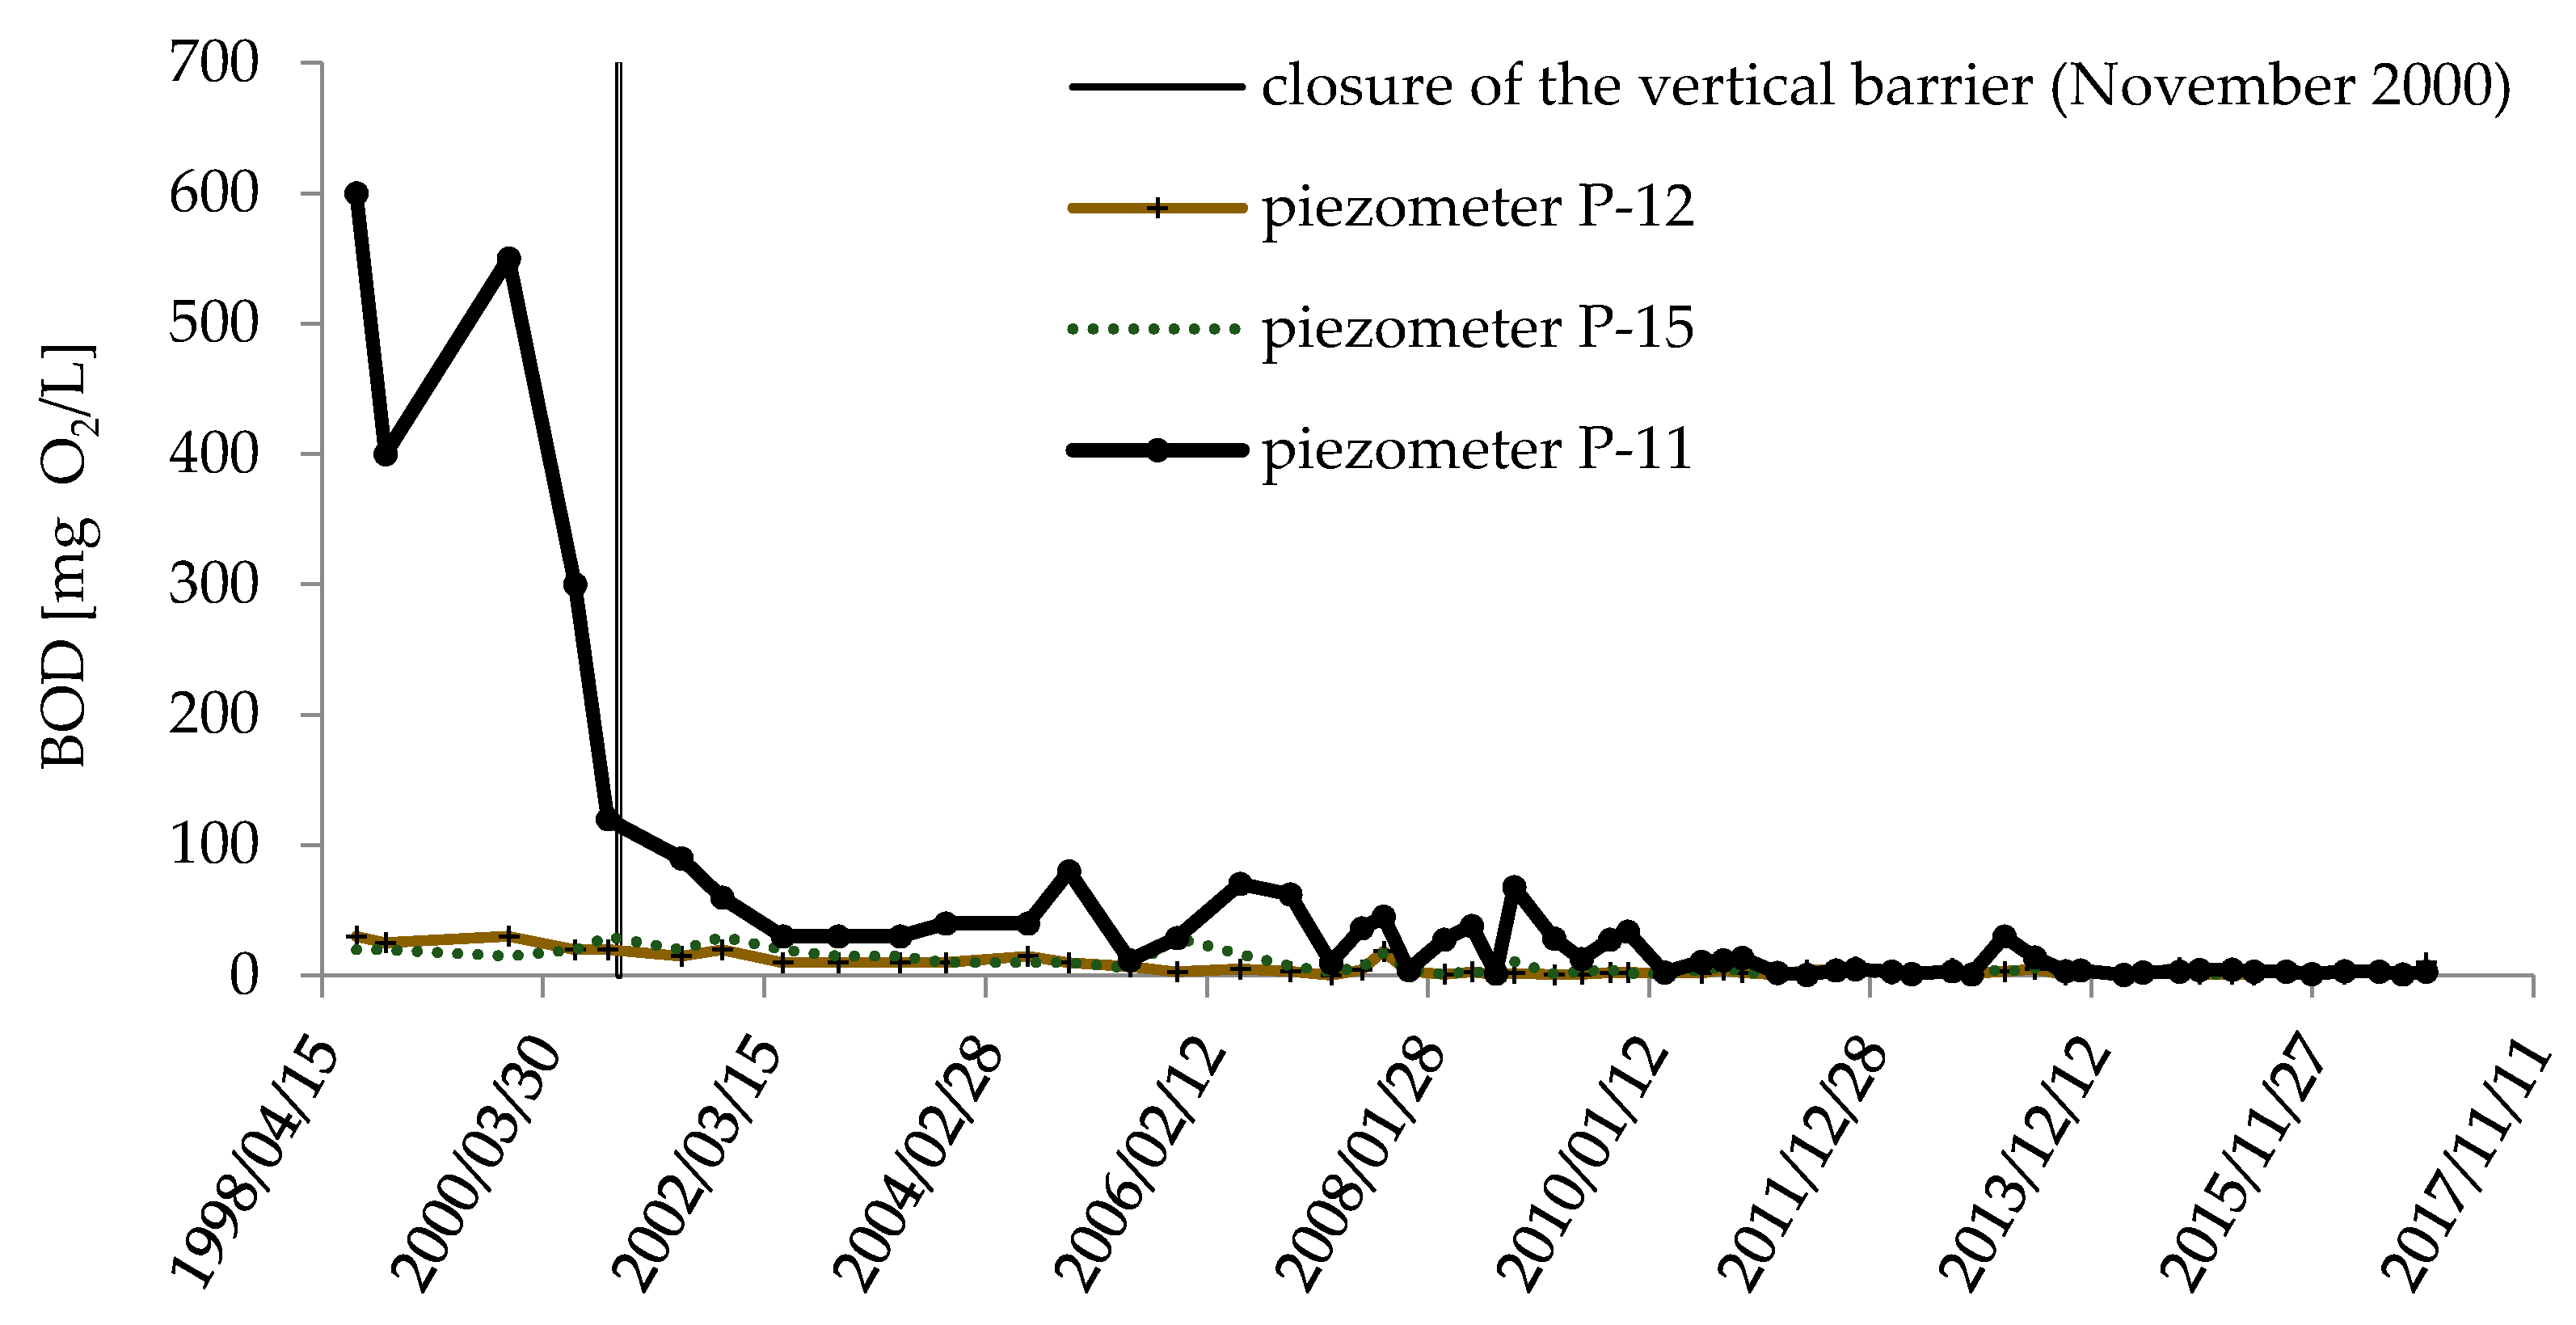
3.2.1. Biochemical Oxygen Demand (BOD) in Groundwater
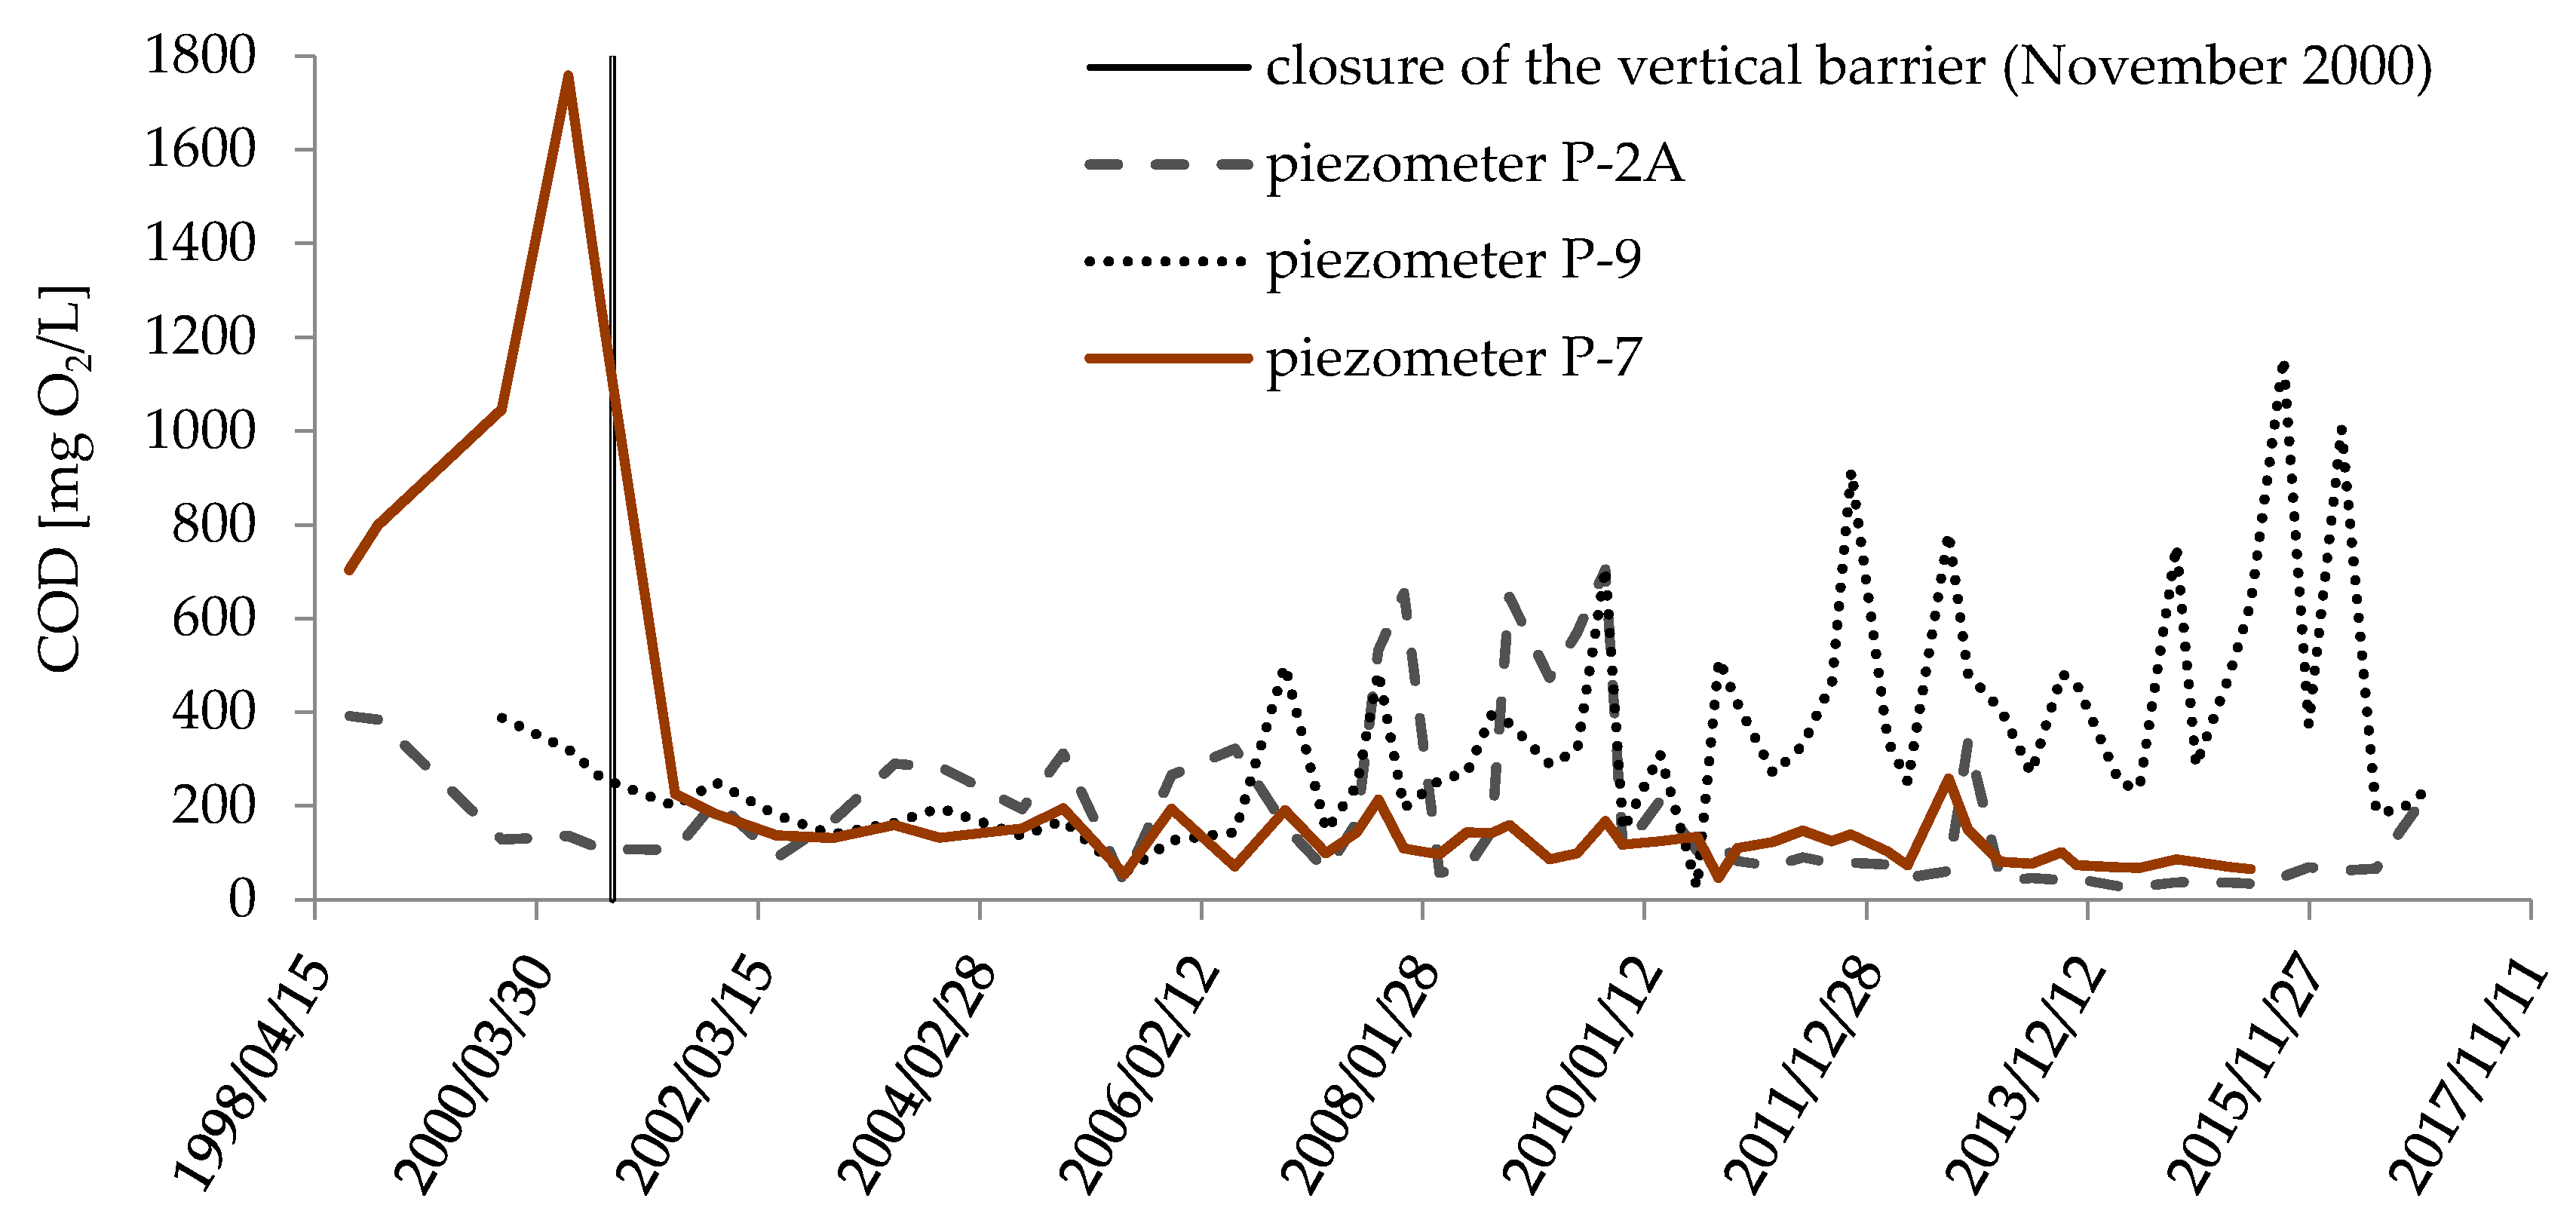
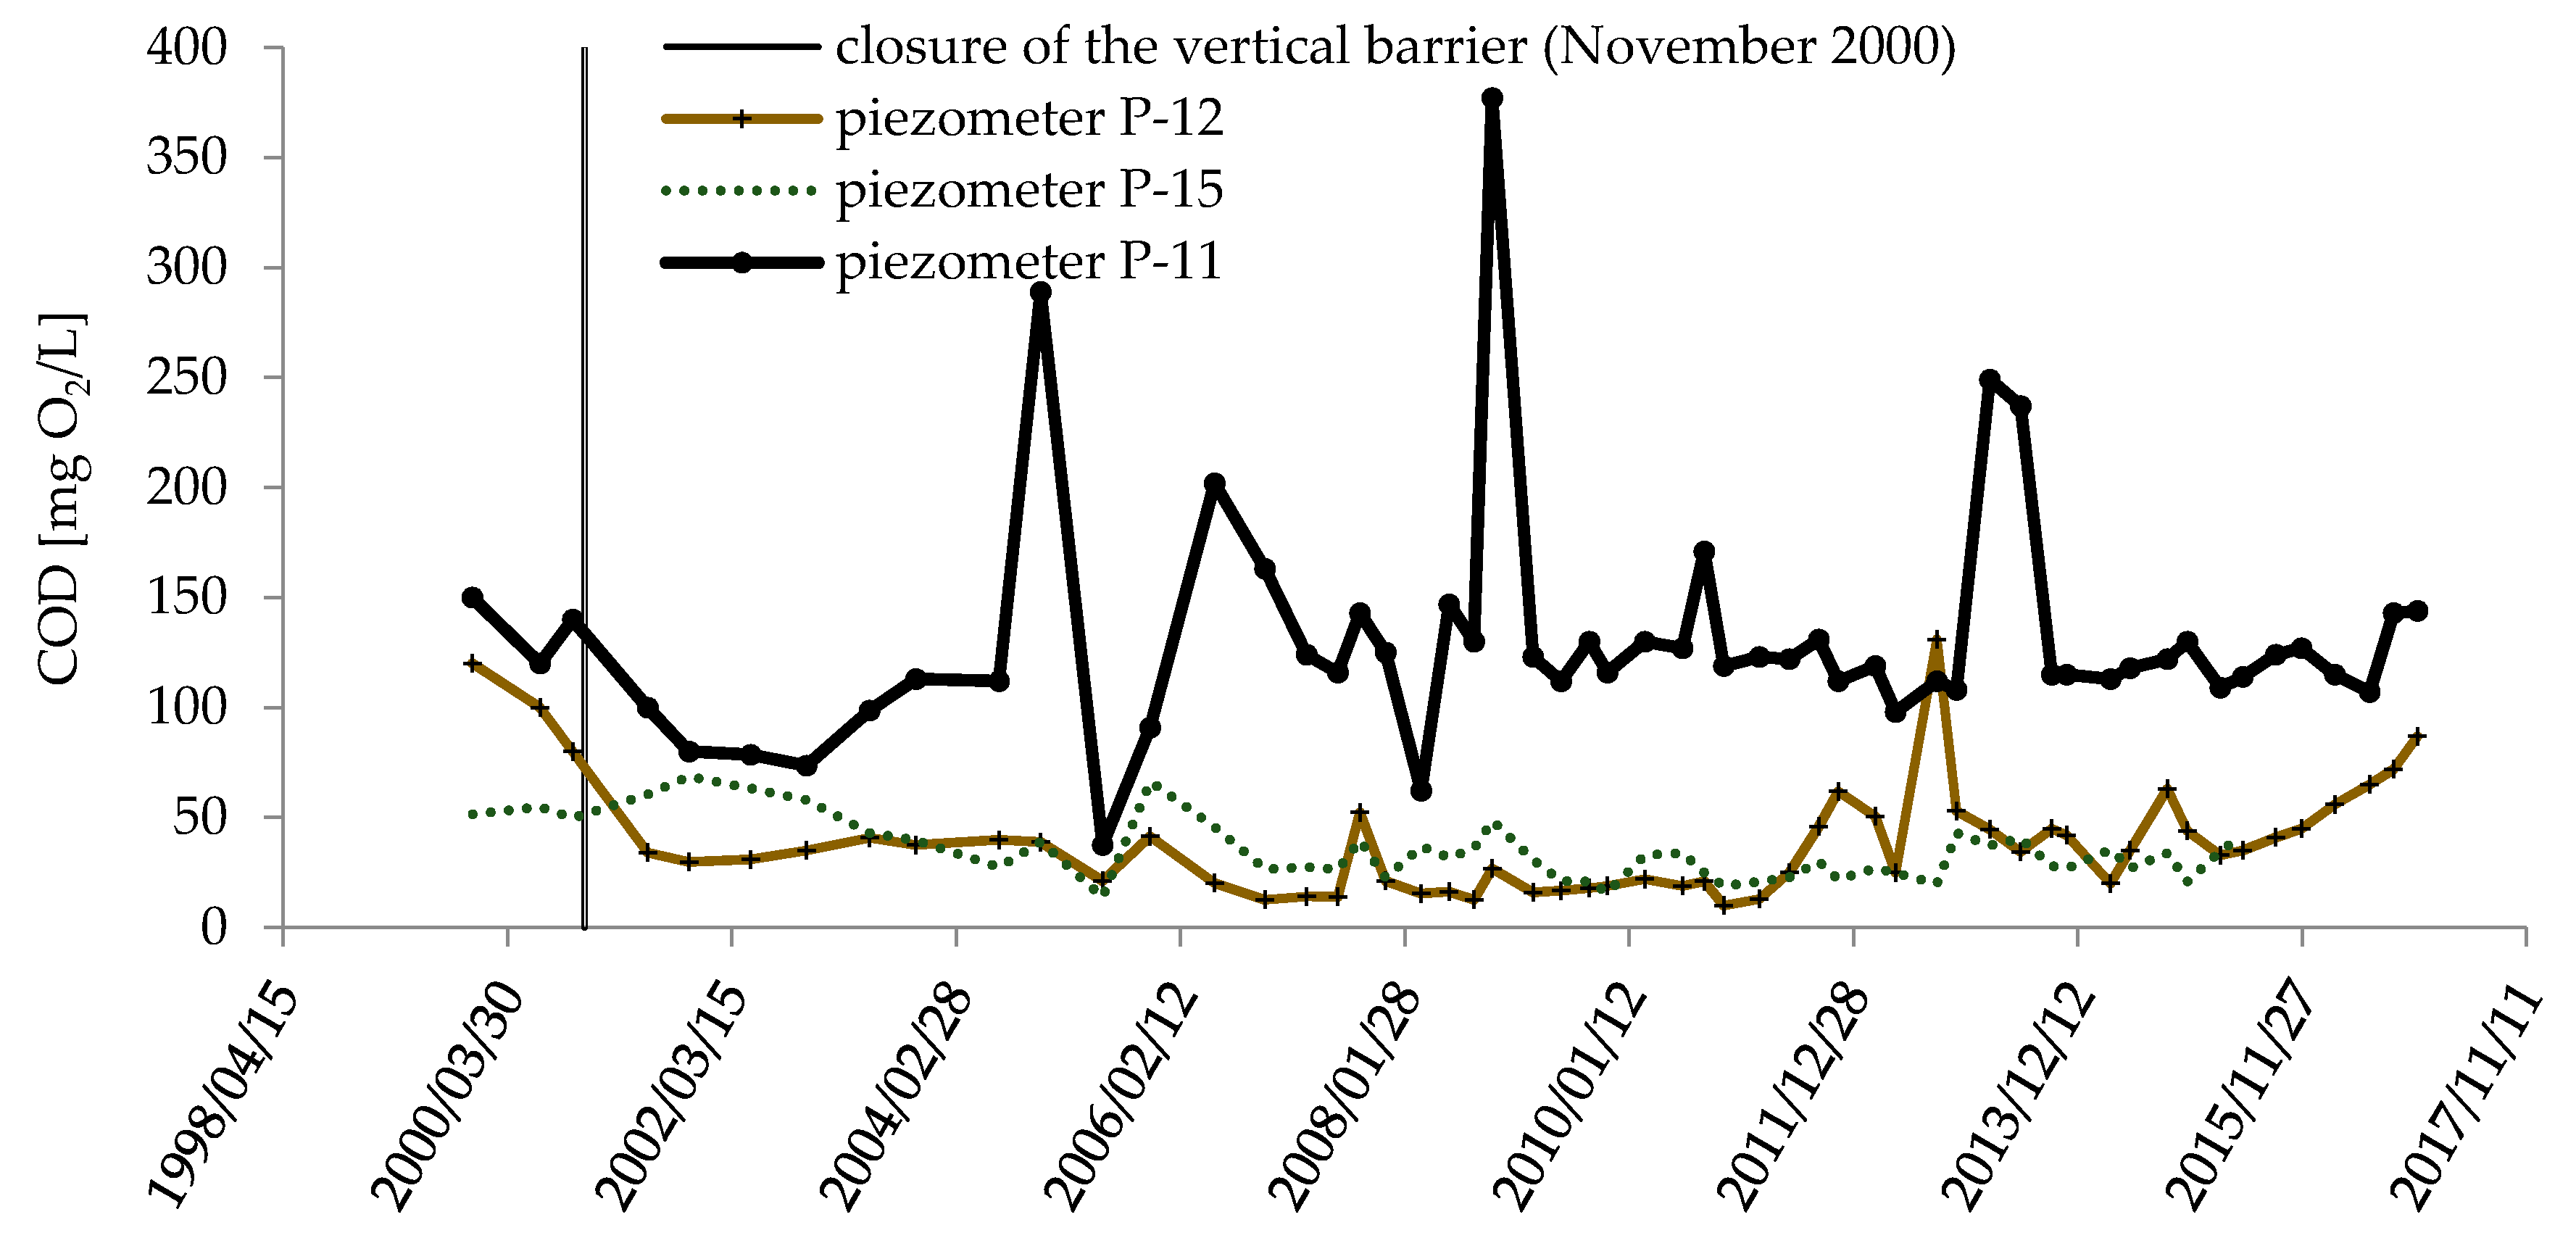
3.2.2. Chemical Oxygen Demand (COD) in Groundwater
3.2.3. BOD/COD Ratio
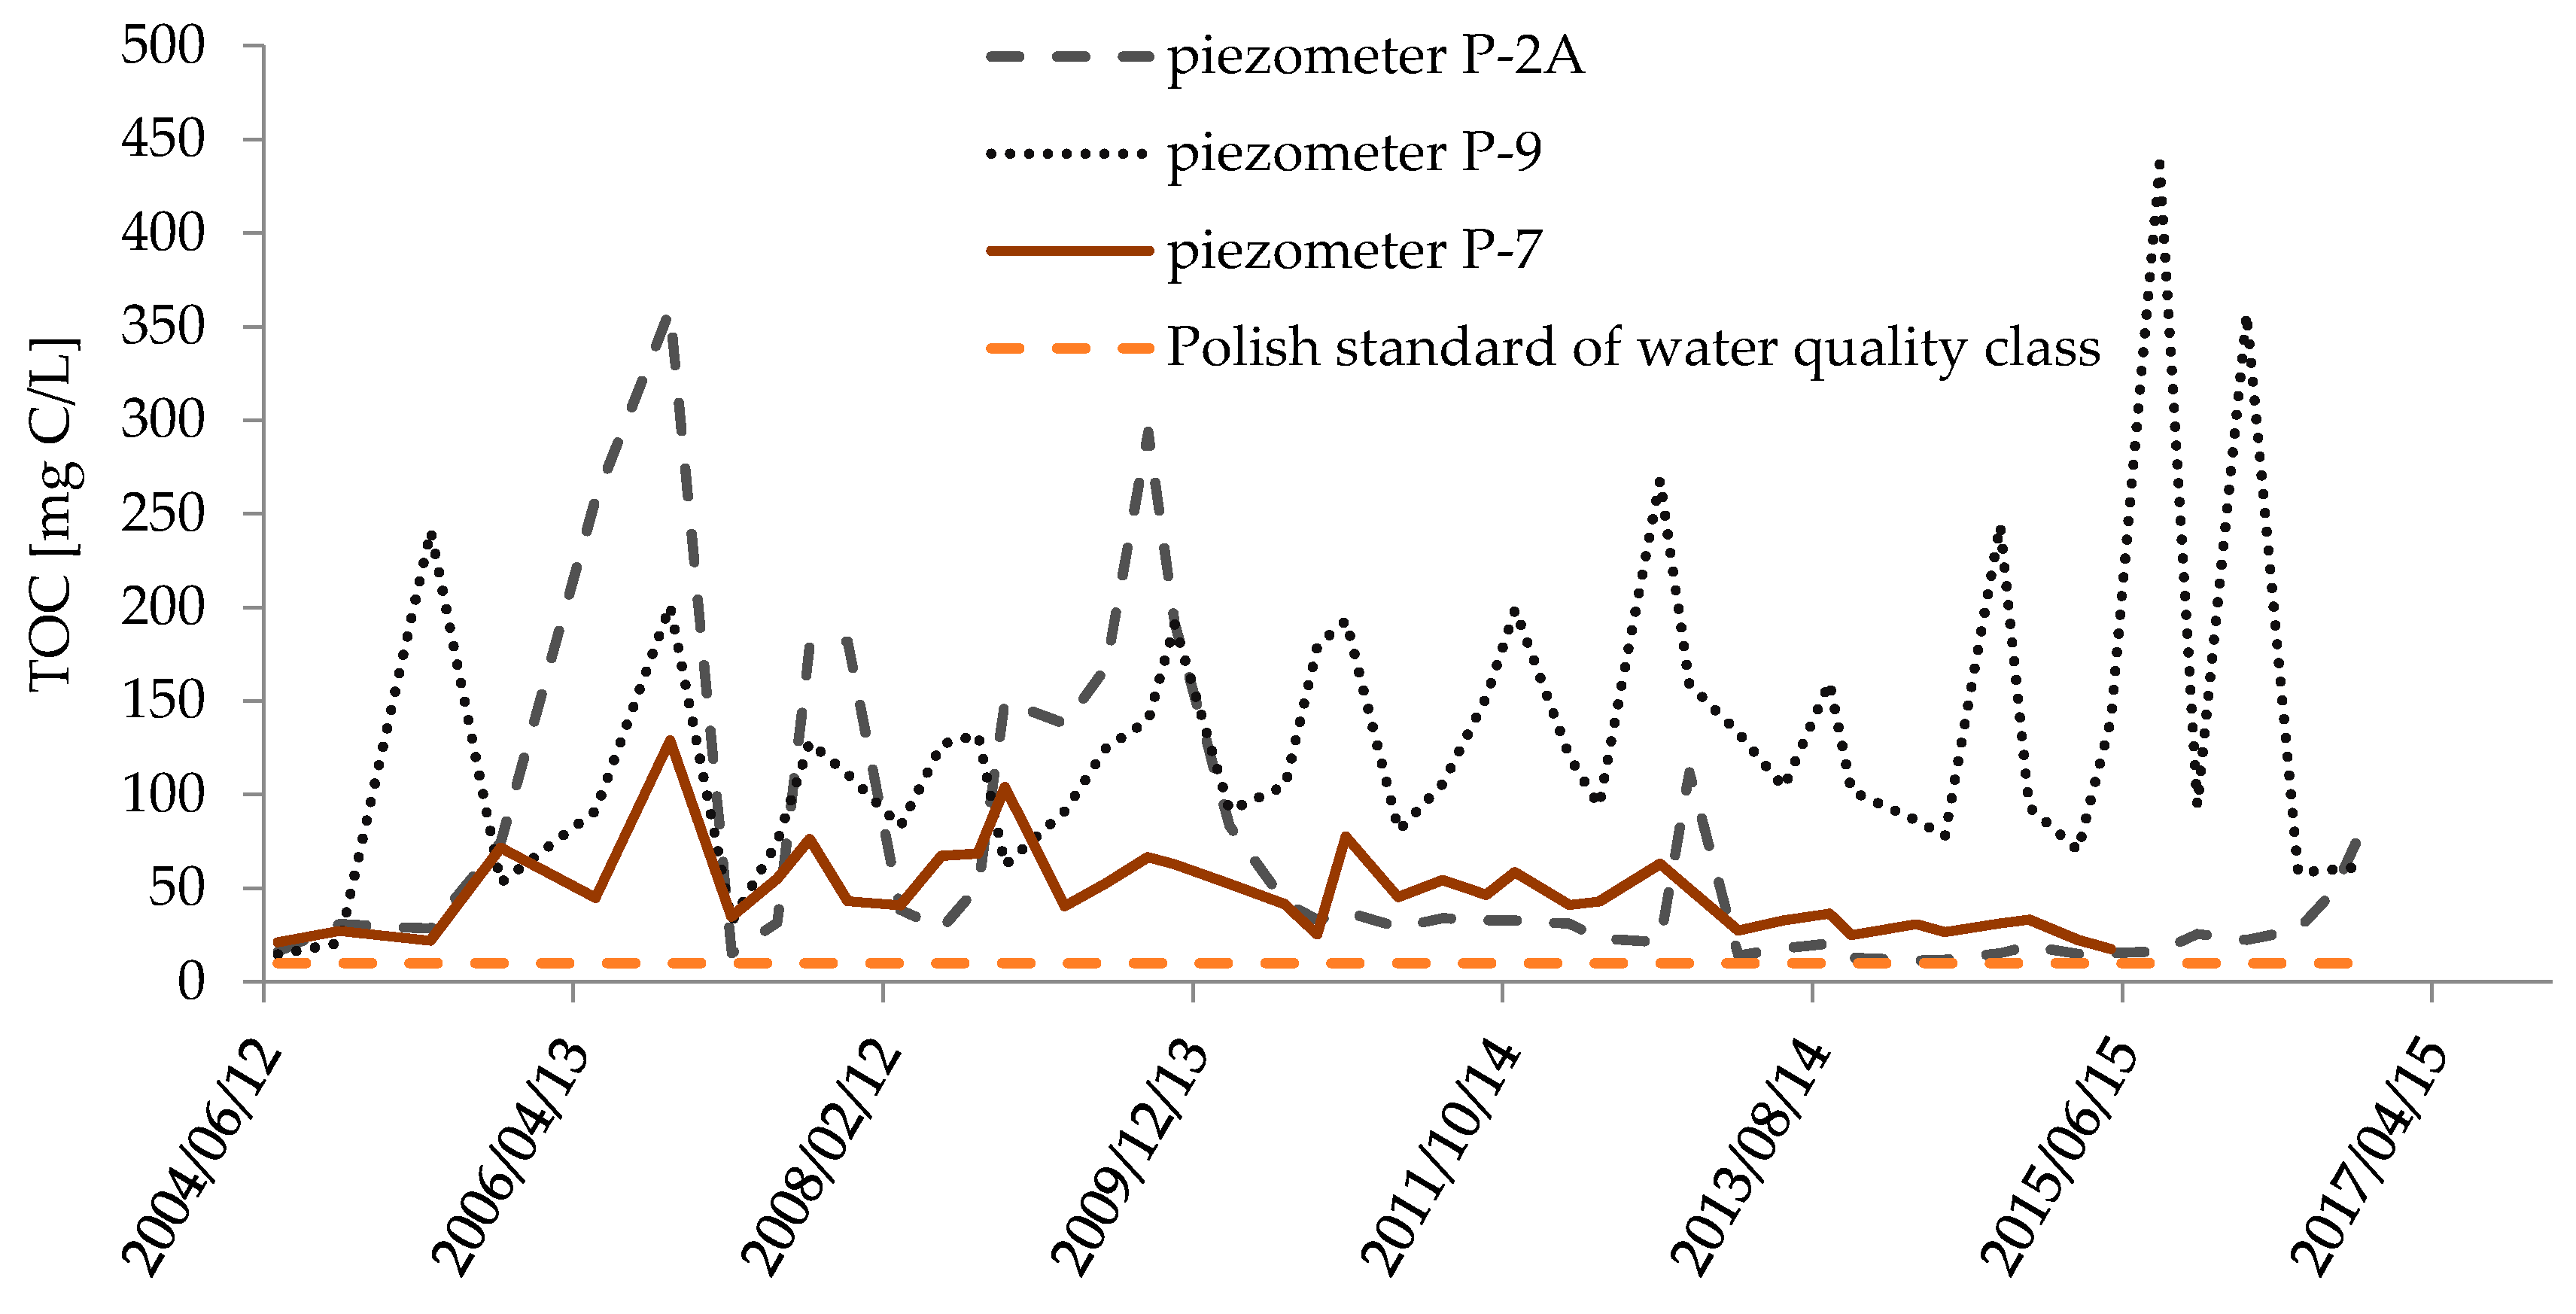
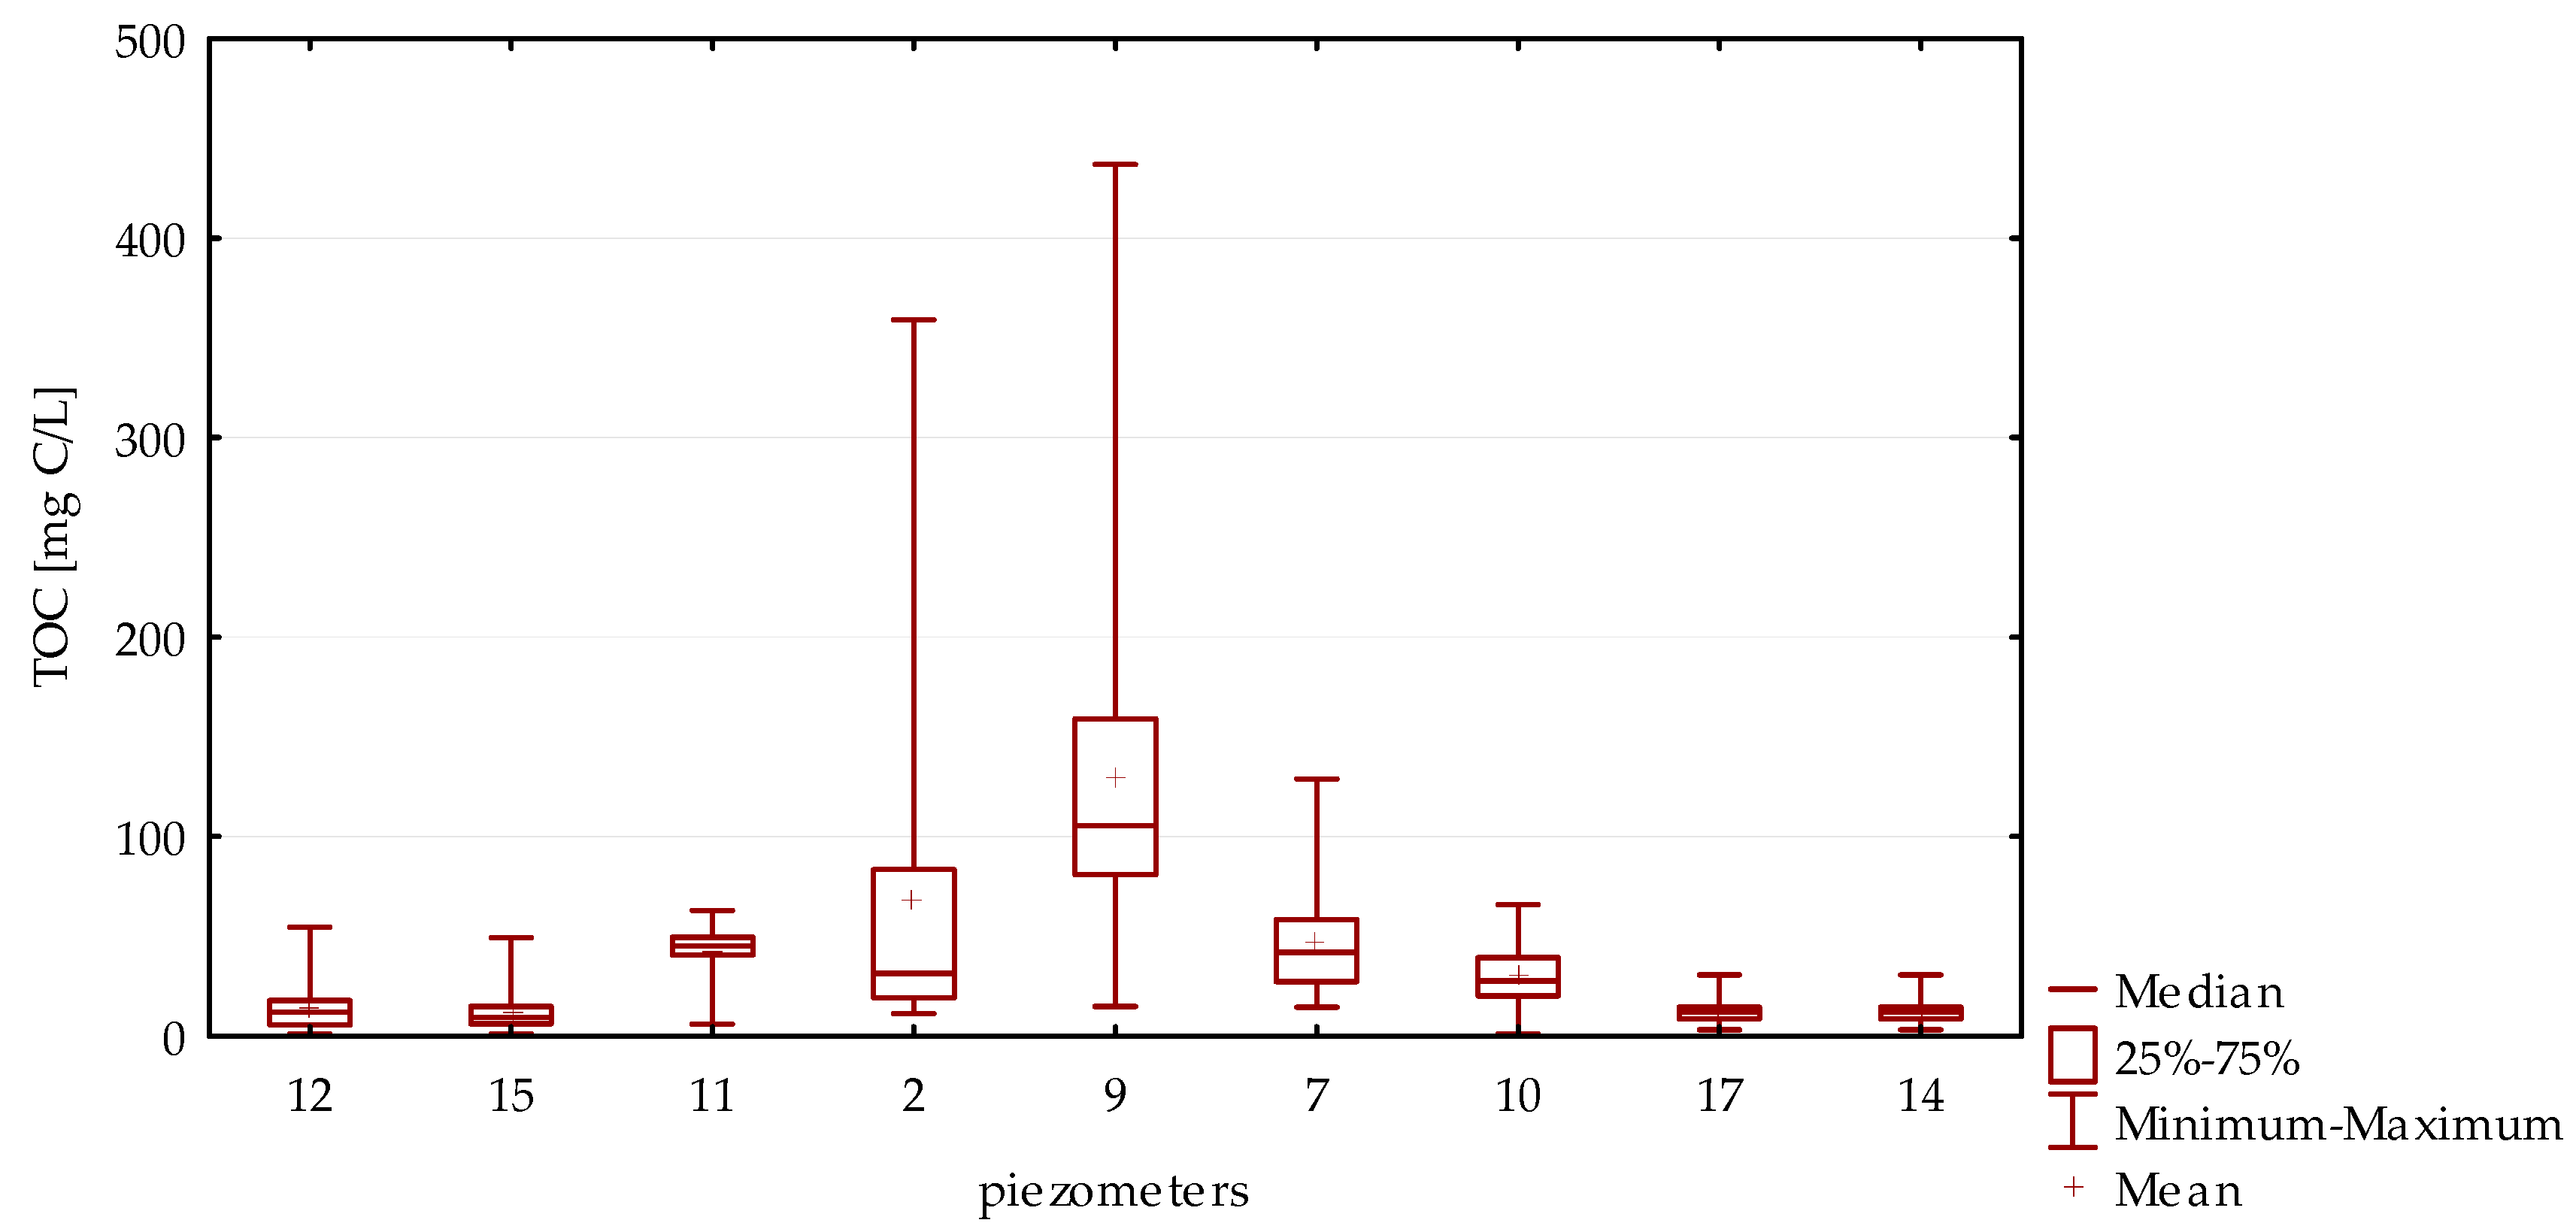
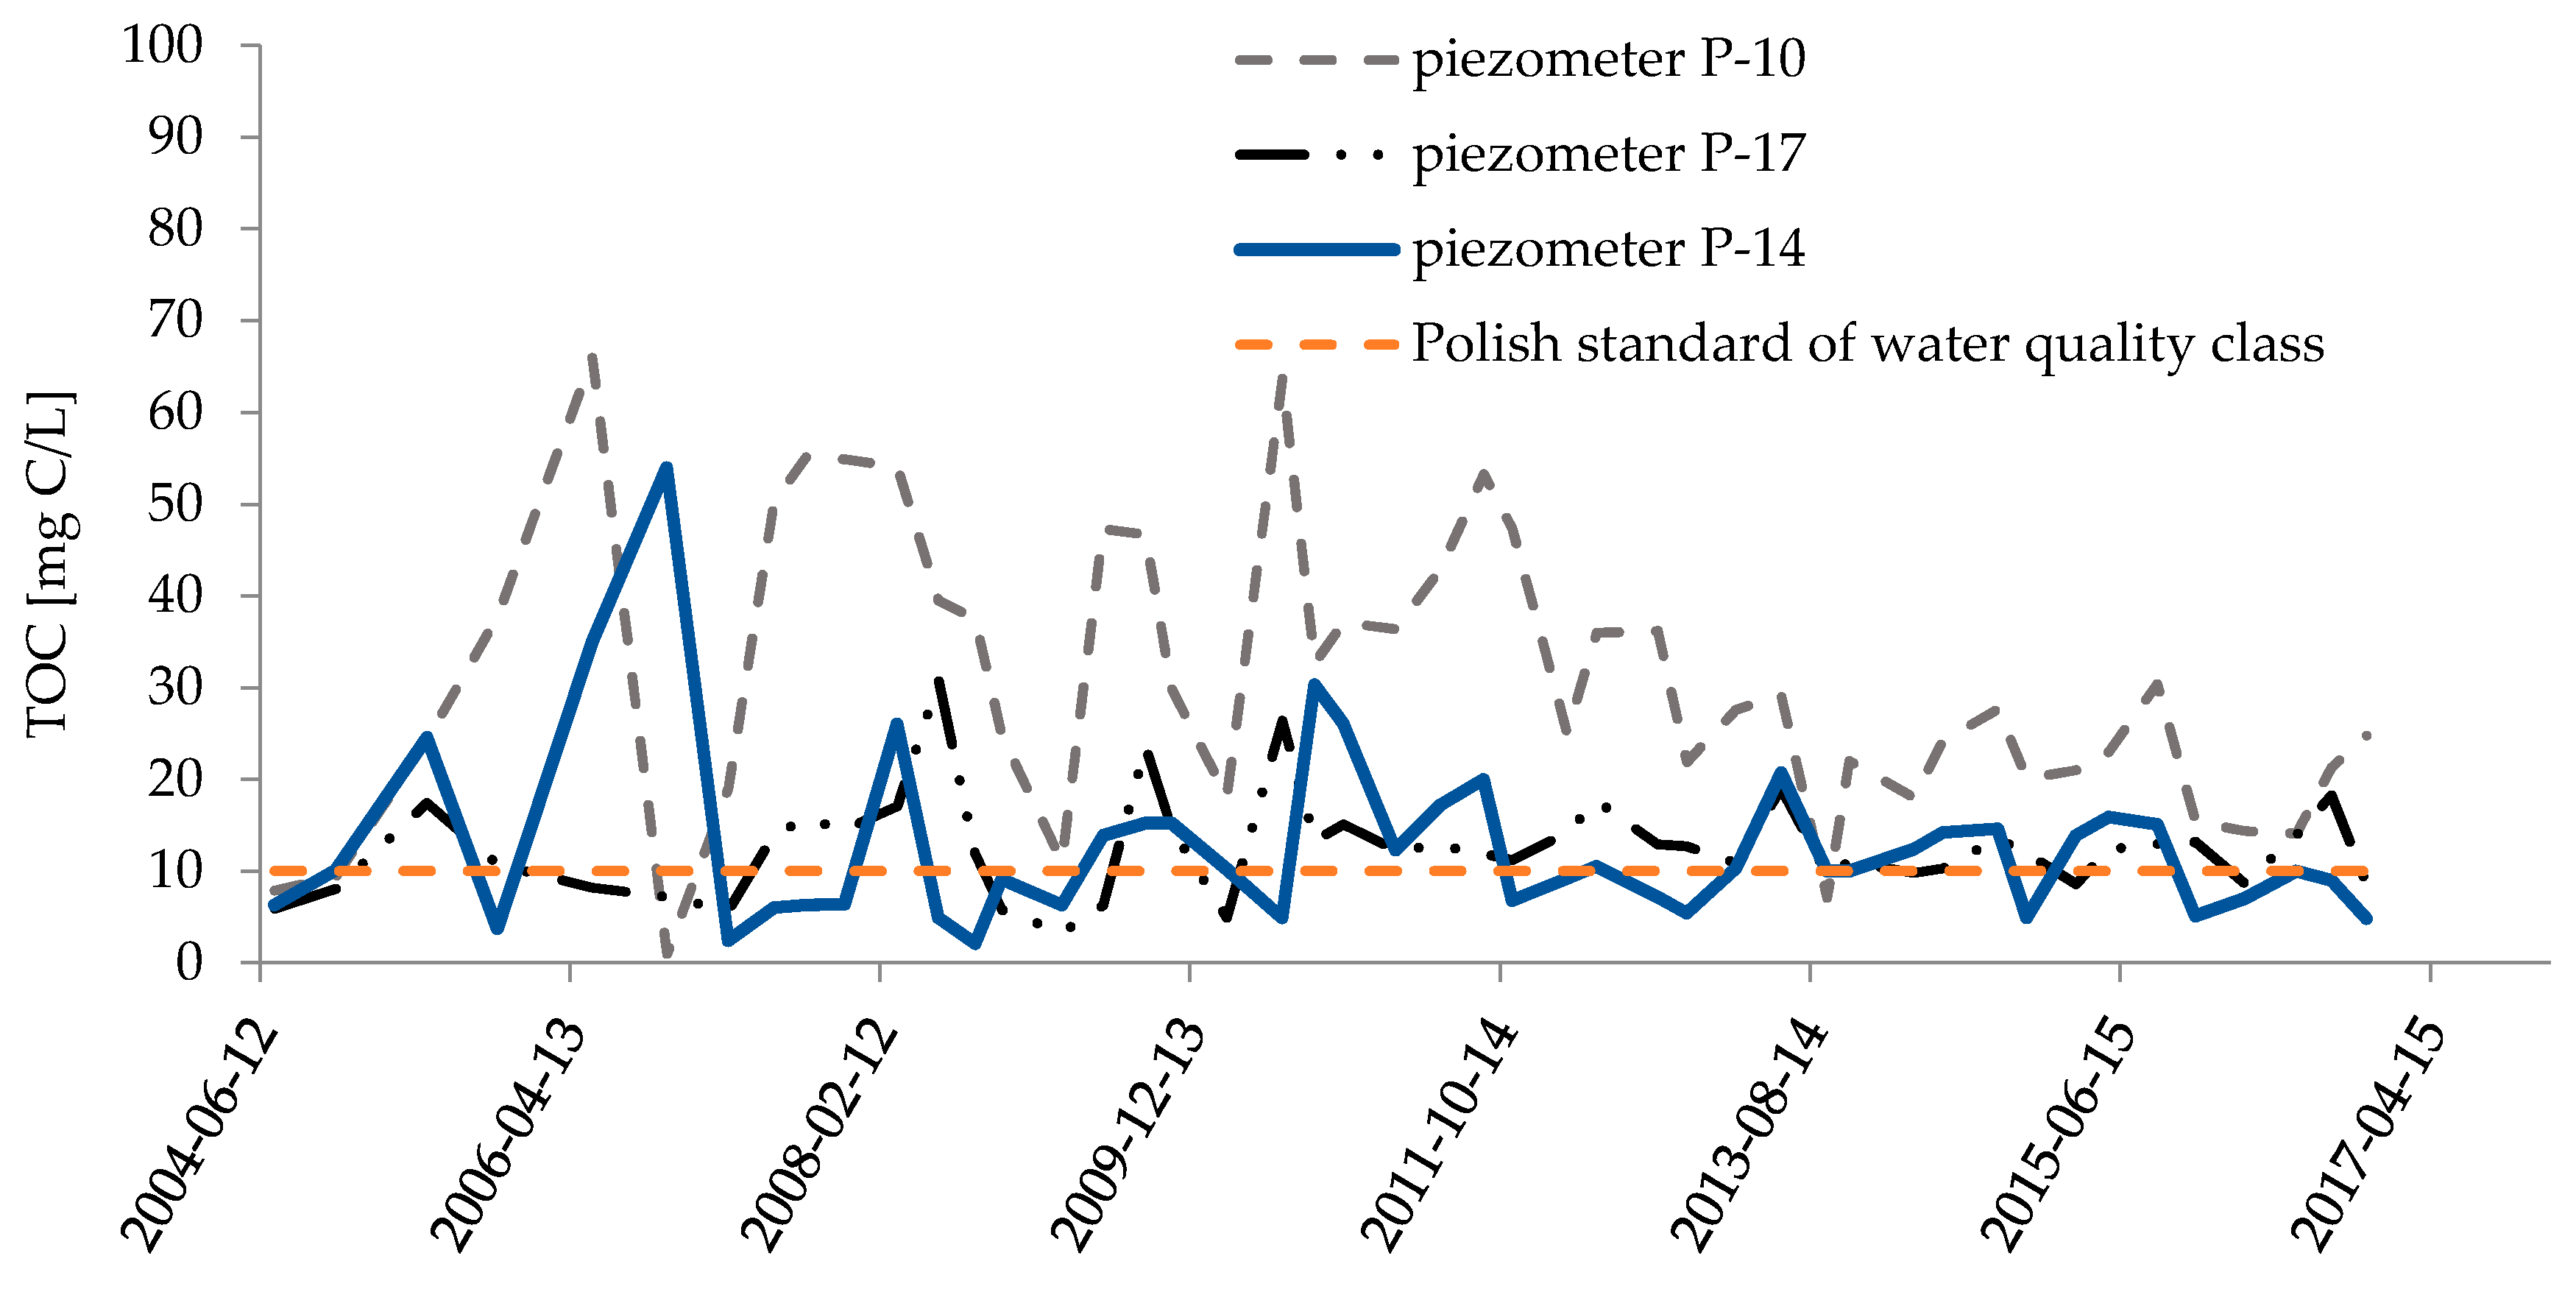
3.2.4. Total Organic Carbon (TOC) in Groundwater
3.3. Statistical Analysis of the Monitoring Data
3.3.1. Pearson’s Correlation Analysis
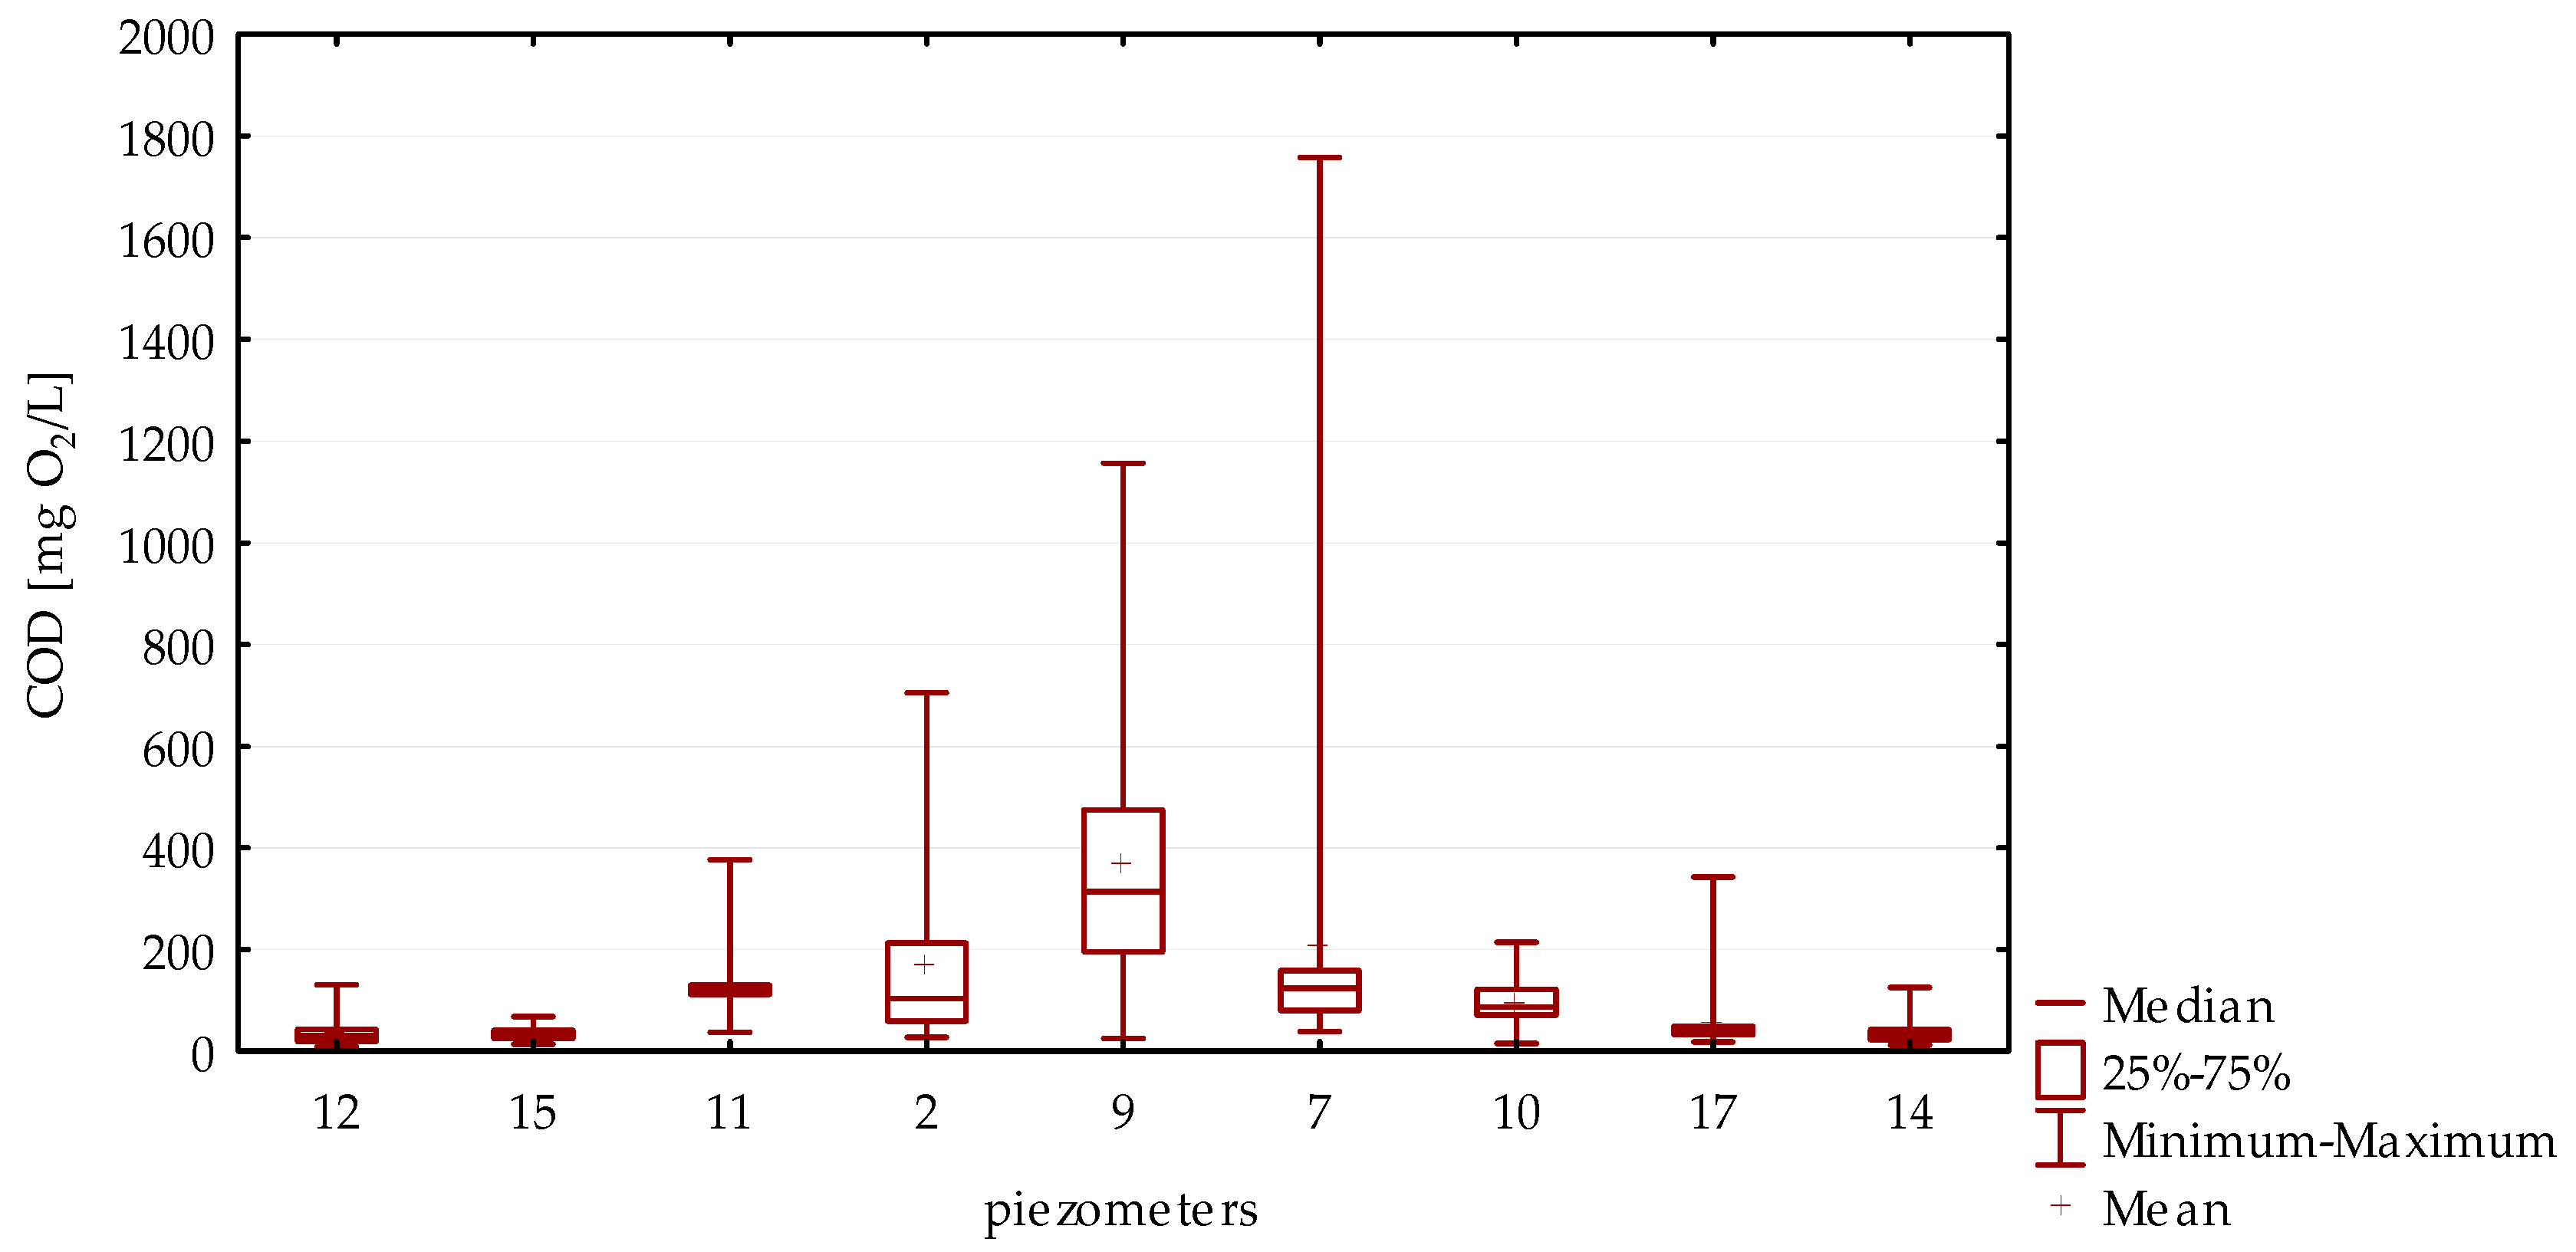
3.3.2. Box-and-Whisker Plots
4. Conclusions
Author Contributions
Conflicts of Interest
References
- Christensen, T.H.; Cossu, R.; Stegmann, R. Landfilling of Waste: Leachate; Taylor & Francis: Abingdon, UK, 1992. [Google Scholar]
- Central Statistical Office: Warsaw, Poland, 2016. Available online: http://stat.gov.pl/obszary-tematyczne/infrastruktura-komunalna-nieruchomosci/nieruchomosci-budynki-infrastruktura-komunalna/infrastruktura-komunalna-w-2015-r-,3,13.html (accessed on 19 June 2017).
- Slack, R.J.; Gronow, J.R.; Voulvoulis, N. Household hazardous waste in municipal landfills: Contaminants in leachate. Sci. Total Environ. 2005, 337, 119–137. [Google Scholar] [CrossRef] [PubMed]
- Akinbile, C.O. Environmental impact of landfill on groundwater quality and agricultural soils in Nigeria. Soil Water Res. 2012, 7, 18–26. [Google Scholar]
- Klinck, B.; Stuart, M. Human Health Risk in Relation to Landfill Leachate Quality; Technical Report WC/99/17; British Geological Survey: Nottingham, UK, 1999. [Google Scholar]
- Albaiges, J.; Casado, F.; Ventura, F. Organic indicators of groundwater pollution by a sanitary landfill. Water Res. 1986, 20, 1153–1159. [Google Scholar] [CrossRef]
- Dvronic, A.; Djogo, M.; Vojinovic–Miloradov, M.; Vujic, G. Biological and chemical oxygen demand as indicators of organic pollution of leachate and piezometric water from semi controlled, non-sanitary landfill in Novi Sad, Serbia. Ann. Fac. Eng. Hunedoara Int. J. Eng. 2011, 9, 79–82. [Google Scholar]
- Koś, K.; Zawisza, E. Landfill liners from dam reservoir sediments. Ann. Warsaw Univ. Life Sci. SGGW Land Reclam. 2016, 48, 41–52. [Google Scholar]
- Bjerg, P.L.; Albrechtsen, H.J.; Kjeldsen, P.; Christensen, T.H.; Cozzarelli, I. The groundwater geochemistry of waste disposal facilities. In Treatise on Geochemistry. Environmental Geochemistry; Holland, H.D., Turekian, K.K., Lollar, B.S., Eds.; Elsevier: Amsterdam, The Netherlands, 2004; Volume 9. [Google Scholar]
- Sarsby, R.W. Environmental Geotechnics; Thomas Telford: London, UK, 2013. [Google Scholar]
- Christensen, J.B.; Jensen, D.L.; Gron, C.; Filip, Z.; Christensen, T.H. Characterization of the dissolved organic carbon fraction in landfill leachate-pol luted groundwater. Water Res. 1998, 32, 125–135. [Google Scholar] [CrossRef]
- Anilkumar, A.; Sukumaran, D.; Vincent, S.G.T. Effect of Municipal Solid Waste Leachate on Ground Water Quality of Thiruvananthapuram District, Kerala, India. Appl. Ecol. Environ. Sci. 2015, 3, 151–157. [Google Scholar]
- Gettinby, J.H. The Composition of Landfill Leachate and Its Interaction with Compacted Clay Liners. Ph.D. Thesis, Manchester University (Bolton Institute), Manchester, UK, 1999. [Google Scholar]
- Kalenik, M. Sewage Treatment Efficacy of Sandy Soil Bed with Natural Clinoptilolite Assist Layer. Ochr. Środowiska 2014, 36, 43–48. [Google Scholar]
- Ngang, B.U.; Agbazue, V.E. Aseasonal Assessment of Groundwater Pollution due to Biochemical Oxygen Demand, Chemical Oxygen Demand and Elevated Temperatures in Enugu Northern Senatorial District, South East Nigeria. IOSR J. Appl. Chem. 2016, 9, 66–73. [Google Scholar]
- Adamcová, D.; Vaverková, M.D.; Barton, S.; Havlícek, Z.; Broušková, E. Soil contamination in landfills: A case study of a landfill in Czech Republic. Solid Earth 2016, 7, 239–247. [Google Scholar] [CrossRef]
- Calvo, F.; Moreno, B.; Zamorano, M.; Szanto, M. Environmental diagnosis methodology for municipal waste landfills. Waste Manag. 2005, 25, 768–779. [Google Scholar] [CrossRef] [PubMed]
- Gworek, B.; Dmuchowski, W.; Koda, E.; Marecka, M.; Baczewska, A.H.; Brągoszewska, P.; Sieczka, A.; Osiński, P. Impact of the Municipal Solid Waste Łubna Landfill on Environmental Pollution by Heavy Metals. Water 2016, 8, 470. [Google Scholar] [CrossRef]
- Koda, E. Influence of vertical barrier surrounding old sanitary landfill on eliminating transport of pollutants on the basis of numerical modelling and monitoring results. Pol. J. Environ. Stud. 2012, 21, 929–935. [Google Scholar]
- Koda, E.; Osiński, P.; Sieczka, A.; Wychowaniak, D. Areal Distribution of Ammonium Contamination of Soil-Water Environment in the Vicinity of Old Municipal Landfill Site with Vertical Barrier. Water 2015, 7, 2656–2672. [Google Scholar] [CrossRef]
- Koda, E.; Sieczka, A.; Osiński, P. Ammonium concentration and migration in groundwater in the vicinity of waste management site located in the neighborhood of protected areas of Warsaw, Poland. Sustainability 2016, 8, 1253. [Google Scholar] [CrossRef]
- Koda, E.; Tkaczyk, A.; Lech, M.; Osiński, P. Application of Electrical Resistivity Data Sets for the Evaluation of the Pollution Concentration Level within Landfill Subsoil. Appl. Sci. 2017, 7, 262. [Google Scholar] [CrossRef]
- Ling, C.; Zhang, Q. Evaluation of surface water and groundwater contamination in a MSW landfill area using hydrochemical analysis and electrical resistivity tomography: A case study in Sichuan province, Southwest China. Environ. Monit. Assess. 2017, 189, 1–18. [Google Scholar] [CrossRef] [PubMed]
- Pande, G.; Sinha, A.; Agarwal, S. Impacts of leachate percolation on ground water quality: A case study of Dhanbad City. Glob. Nest J. 2015, 17, 162–174. [Google Scholar]
- Koda, E. Local water quality monitoring on surroundings of the sanitary landfill. Ann. Warsaw Agric. Univ. SGGW AR Land Reclam. 2004, 35, 131–144. [Google Scholar]
- Koda, E.; Osinski, P.; Kolanka, T. Flow numerical modeling for efficiency assessment of vertical barriers in landfills. In Coupled Phenomena in Environmental Geotechnics: From Theoretical and Experimental Research to Practical Applications, Proceedings of International Symposium TC215 ISSMGE, Torino, Italy, 1–3 July 2013; Manassero, M., Dominijanni, A., Foti, S., Musso, G., Eds.; CRC Press: London, UK, 2013; pp. 693–698. [Google Scholar]
- Nielsen, D.M. Practical Handbook of Environmental Site Characterization and Ground-Water Monitoring, 2nd ed.; CRC Press: Boca Raton, FL, USA, 2005. [Google Scholar]
- Water Quality. Sampling. Part 3: Preservation and Handling of Water Samples; EN ISO 5667-3; International Organization for Standardization: Geneva, Switzerland, 2012.
- Water Quality. Sampling. Part 11: Guidance on Sampling of Groundwaters; ISO 5667-11; International Organization for Standardization: Geneva, Switzerland, 2009.
- Water Quality: Determination of the Chemical Oxygen Demand Index (ST-COD)–Small-Scale Sealed-Tube Method; PN-ISO 15705:2005P; International Organization for Standardization: Geneva, Switzerland, 2002.
- Water Quality; Determination of Biochemical Oxygen Demand after n Days (BODn)–Part 2: Method for Undiluted Samples (ISO 5815:1989, Modified); PN-EN 1899-2:2002P; Polish Committee for Standardization: Warsaw, Poland, 2002.
- Water Analysis: Guidelines for the Determination of Total Organic Carbon (TOC) and Dissolved Organic Carbon (DOC); PN-EN 1484:1999P; Polish Committee for Standardization: Warsaw, Poland, 1999.
- Water Quality: Determination of pH; PN-EN ISO 10523:2012; International Organization for Standardization: Geneva, Switzerland, 2012.
- Water Quality: Determination of Electrical Conductivity; PN-EN 27888:1999; Polish Committee for Standardization: Warsaw, Poland, 1999.
- Regulation of the Minister of Environment Dated 21 December 2015 on the Criteria and Method of Evaluating the Underground Water Condition (Journal of Laws 2016, Item 85). Available online: http://isap.sejm.gov.pl/DetailsServlet?id=WDU20160000085 (accessed on 19 June 2017).
- Aderemi, A.O.; Oriaku, A.V.; Adewumi, G.A.; Otitoloju, A.A. Assessment of groundwater contamination by leachate near a municipal solid waste landfill. Afr. J. Environ. Sci. Technol. 2010, 5, 933–940. [Google Scholar]
- Mor, S.; Ravindra, K.; Dahiya, R.P.; Chandra, A. Leachate characterization and assessment of ground-water pollution near municipal solid waste landfill site. Environ. Monit. Assess. 2006, 118, 435–456. [Google Scholar]
- Hazelton, P.; Murphy, B. Interpreting Soil Test Results: What Do All the Numbers Mean? CSIRO Publishing: Melbourne, Australia, 2007. [Google Scholar]
- Bandara, N.J.G.J.; Hettiaratchi, J.P.A. Environmental impacts with waste disposal practices in a suburban municipality in Sri Lanka. Int. J. Environ. Waste Manag. 2010, 6, 107–116. [Google Scholar] [CrossRef]
- Sugirtharan, M.; Rajendran, M. Ground water quality near municipal solid waste dumping site at Thirupperumthurai, Batticaloa. J. Agric. Sci. 2015, 10, 21–28. [Google Scholar] [CrossRef]
- Wijesekara, S.S.R.M.D.H.R.; Mayakaduwa, S.S.; Siriwardana, A.R.; de Silva, N.; Basnayake, B.F.A.; Kawamoto, K.; Vithanage, M. Fate and transport of pollutants through a municipal solid waste landfill leachate in Sri Lanka. Environ. Earth Sci. 2014, 72, 1707–1719. [Google Scholar] [CrossRef]
- National Agency for Food and Drug Administration and Control (NAFDAC). Guidelines for Registration and Production of Packaged Water in Nigeria; NAFDAC: Abuja, Nigeria, 1999.
- Lee, A.H.; Hamid, N. BOD/COD ratio as an indicator for pollutants leaching from landfill. J. Clean Energy Technol. 2014, 2, 263–266. [Google Scholar] [CrossRef]
- Nininen, M.; Kalliokoski, P.; Parjala, E. Effect of organic contaminants in landfill leachates on groundwater quality in Finland: Groundwater Quality Management. In Proceedings of the GQM 93 Conference, Tallinn, Estonia, 6–9 September 1993; pp. 64–71. [Google Scholar]
- Uz, G.; Turak, F.; Afşar, H. Research of BOD and COD values of wastewaters that contain organic materials. 4th Aegean Analytical Chemistry Days, Kusadasi, Turkey, 29 September–3 October 2004. [Google Scholar]
- Wang, M.; Liu, X.; Pan, B.; Zhang, S. Photodegradation of Acid Orange 7 in a UV/acetylacetone Process. Chemosphere 2013, 93, 2877–2882. [Google Scholar] [CrossRef] [PubMed]
- Evans, J.D. Straightforward Statistics for the Behavioral Sciences. Brooks/Cole Publishing: Pacific Grove, CA, USA, 1996. [Google Scholar]
- Maitera, O.N.; Ogugbuaja, V.O.; Barminas, J.T. An assessment of the organic pollution indicator levels of River Benue in Adamawa State, Nigeria. JECE 2010, 2, 110–116. [Google Scholar]


| Layer | Soil | IL or ID | Stratigraphy | ρ | k |
|---|---|---|---|---|---|
| I | clSa | 0.4 | Quaternary (Pleistocene) | 2.1 | 9.2 × 10⁻⁶ |
| II | Sa | 0.7 | Quaternary (Pleistocene) | 2.0 | 5 × 10⁻⁵ |
| III | saclSi/Cl | 0.2 | Quaternary (Pleistocene) | 2.1 | 1.2 × 10⁻⁷ |
| IV | saCl | 0.1 | Quaternary (Pleistocene) | 2.2 | 3 × 10⁻⁸ |
| V | Cl/saCl | <0.25 | Tertiary (Pliocene) | 2.1 | <10−9 |
| Parameter | Unit | Value |
|---|---|---|
| Geometric Parameters | ||
| Thickness | m | 0.6 |
| Length | m | 1687.2 |
| Minimum depth | m | 3.0 |
| Mean depth | m | 8.6 |
| Maximum depth | m | 22.0 |
| Lateral surface area | m2 | 14529.8 |
| Filtration Parameters | ||
| Permeability coefficient after 28 days | m/s | 2.5 × 10⁻⁸ |
| Permeability coefficient after 60 days | m/s | 1.0 × 10⁻⁹ |
| Strength Parameters | ||
| Compressive strength after 28 days | MPa | min. 0.53 |
| Compressive strength after 60 days | MPa | min. 0.91 |
| Piezometar | BOD/COD Ratio before the Closure of the Vertical Barrier | BOD/COD Ratio after the Closure of the Vertical Barrier | ||||||
|---|---|---|---|---|---|---|---|---|
| Min | Max | Mean | STD | Min | Max | Mean | STD | |
| P-2A | 0.370 | 0.663 | 0.490 | 0.132 | 0.003 | 0.352 | 0.119 | 0.119 |
| P-4 | 0.279 | 1.055 | 0.539 | 0.448 | 0.001 | 0.481 | 0.105 | 0.127 |
| P-6A | 0.260 | 0.673 | 0.493 | 0.206 | 0.011 | 0.469 | 0.118 | 0.123 |
| P-7A | 0.370 | 0.498 | 0.415 | 0.072 | 0.007 | 0.384 | 0.144 | 0.121 |
| P-9 | 0.560 | 2.062 | 1.561 | 0.708 | 0.005 | 0.610 | 0.140 | 0.155 |
| P-10A | 0.368 | 0.390 | 0.379 | 0.016 | 0.004 | 0.487 | 0.139 | 0.136 |
| P-11A | n.d. | n.d. | n.d. | n.d. | 0.004 | 0.445 | 0.133 | 0.139 |
| P-12 | n.d. | n.d. | n.d. | n.d. | 0.011 | 0.671 | 0.146 | 0.137 |
| P-14A | 0.270 | 0.560 | 0.454 | 0.150 | 0.016 | 0.543 | 0.155 | 0.119 |
| P-17 | n.d. | n.d. | n.d. | n.d. | 0.012 | 0.439 | 0.171 | 0.132 |
| Variable | BOD | COD | TOC | pH | EC |
|---|---|---|---|---|---|
| PIEZOMETER 2A | |||||
| BOD | 1 | 0.859 * | 0.601 * | −0.246 | 0.649 * |
| COD | 1 | 0.696 * | −0.154 | 0.813 * | |
| TOC | 1 | −0.338 ** | 0.645 * | ||
| pH | 1 | −0.214 | |||
| EC | 1 | ||||
| PIEZOMETER 7A | |||||
| BOD | 1 | 0.621 * | 0.378 ** | 0.052 | 0.576 * |
| COD | 1 | 0.652 * | 0.268 | 0.679 * | |
| TOC | 1 | 0.054 | 0.354 ** | ||
| pH | 1 | 0.246 | |||
| EC | 1 | ||||
| PIEZOMETER 9 | |||||
| BOD | 1 | 0.190 | 0.018 | −0.255 | 0.137 |
| COD | 1 | 0.772 * | −0.004 | 0.815 * | |
| TOC | 1 | 0.063 | 0.826 * | ||
| pH | 1 | −0.057 | |||
| EC | 1 | ||||
| Variable | BOD | COD | TOC | pH | EC |
|---|---|---|---|---|---|
| PIEZOMETER 11A | |||||
| BOD | 1 | 0.599 * | −0.517 * | 0.102 | −0.410 * |
| COD | 1 | −0.080 | 0.303 ** | −0.005 | |
| TOC | 1 | 0.022 | 0.424 * | ||
| pH | 1 | −0.201 | |||
| EC | 1 | ||||
| PIEZOMETER 12 | |||||
| BOD | 1 | 0.308 ** | −0.153 | 0.188 | −0.227 |
| COD | 1 | 0.717 * | −0.060 | 0.589 * | |
| TOC | 1 | −0.263 | 0.413 * | ||
| pH | 1 | −0.305 ** | |||
| EC | 1 | ||||
| PIEZOMETER 15 | |||||
| BOD | 1 | 0.666 * | 0.127 | 0.072 | −0.407 * |
| COD | 1 | 0.124 | 0.146 | 0.141 | |
| TOC | 1 | −0.168 | 0.282 | ||
| pH | 1 | 0.017 | |||
| EC | 1 | ||||
| Variable | BOD | COD | TOC | pH | EC |
|---|---|---|---|---|---|
| PIEZOMETER 10A | |||||
| BOD | 1 | 0.462 * | 0.311 ** | −0.089 | 0.517 * |
| COD | 1 | 0.468 * | 0.298 ** | 0.321 ** | |
| TOC | 1 | 0.140 | 0.369 ** | ||
| pH | 1 | −0.380 ** | |||
| EC | 1 | ||||
| PIEZOMETER 14A | |||||
| BOD | 1 | 0.878 * | 0.052 | −0.265 | −0.015 |
| COD | 1 | 0.211 | −0.237 | 0.147 | |
| TOC | 1 | −0.313 ** | 0.352 ** | ||
| pH | 1 | −0.133 | |||
| EC | 1 | ||||
| PIEZOMETER 17 | |||||
| BOD | 1 | 0.352 ** | 0.014 | 0.137 | 0.494 * |
| COD | 1 | 0.193 | 0.006 | 0.232 | |
| TOC | 1 | −0.078 | 0.004 | ||
| pH | 1 | −0.144 | |||
| EC | 1 | ||||
© 2017 by the authors. Licensee MDPI, Basel, Switzerland. This article is an open access article distributed under the terms and conditions of the Creative Commons Attribution (CC BY) license (http://creativecommons.org/licenses/by/4.0/).
Share and Cite
Koda, E.; Miszkowska, A.; Sieczka, A. Levels of Organic Pollution Indicators in Groundwater at the Old Landfill and Waste Management Site. Appl. Sci. 2017, 7, 638. https://doi.org/10.3390/app7060638
Koda E, Miszkowska A, Sieczka A. Levels of Organic Pollution Indicators in Groundwater at the Old Landfill and Waste Management Site. Applied Sciences. 2017; 7(6):638. https://doi.org/10.3390/app7060638
Chicago/Turabian StyleKoda, Eugeniusz, Anna Miszkowska, and Anna Sieczka. 2017. "Levels of Organic Pollution Indicators in Groundwater at the Old Landfill and Waste Management Site" Applied Sciences 7, no. 6: 638. https://doi.org/10.3390/app7060638
APA StyleKoda, E., Miszkowska, A., & Sieczka, A. (2017). Levels of Organic Pollution Indicators in Groundwater at the Old Landfill and Waste Management Site. Applied Sciences, 7(6), 638. https://doi.org/10.3390/app7060638