Article

Artwork Identification for 360-Degree Panoramic Images Using Polyhedron-Based Rectilinear Projection and Keypoint Shapes

1
Department of Copyright Protection, Sangmyung University, Seoul 03016, Korea
2
Department of Electronics Engineering, Sangmyung University, Seoul 03016, Korea
*
Author to whom correspondence should be addressed.
Appl. Sci. 2017, 7(5), 528; https://doi.org/10.3390/app7050528
Submission received: 24 February 2017 / Revised: 29 April 2017 / Accepted: 17 May 2017 / Published: 19 May 2017
(This article belongs to the Special Issue Holography and 3D Imaging: Tomorrows Ultimate Experience)

Abstract

:
With the increased development of 360-degree production technologies, artwork has recently been photographed without authorization. To prevent this infringement, we propose an artwork identification methodology for 360-degree images. We transform the 360-degree image into a three-dimensional sphere and wrap it with a polyhedron. On the sphere, several points are located on the polyhedron to determine the width, height, and direction of the rectilinear projection. The 360-degree image is divided and transformed into several rectilinear projected images to reduce the adverse effects from the distorted panoramic image. We also propose a method for improving the identification precision of artwork located at a highly distorted position using the difference of keypoint shapes. After applying the proposed methods, identification precision is increased by 45% for artwork that is displayed on a 79-inch monitor in a seriously distorted position with features that were generated by scale-invariant feature transformations.

1. Introduction

In recent years, the explosive development of 360-degree camera technology has led to rapid growth in 360-degree video, images, and multimedia viewing services, including social media and video-sharing websites such as Facebook and YouTube [1,2]. Users can easily take a 360-degree photo with a 360-degree camera and a smartphone. However, when a copyrighted artwork is either inadvertently or deliberately photographed without permission, copyright infringement occurs. Currently, manual inspections are performed of copyrighted contents in 360-degree multimedia. Thus, it is important to develop an automatic technology for identifying artwork for multimedia sharing systems before 360-degree multimedia are uploaded. To prevent unauthorized artwork from being illegally distributed by 360-degree multimedia viewing services, it is important to identify the artwork inside 360-degree images. Over the last decade, many computer vision algorithms have been proposed for extracting features, recognizing objects, and retrieving images [3,4,5,6,7,8,9,10,11,12,13,14,15,16,17,18,19,20,21,22,23,24,25,26,27,28,29,30,31,32,33,34,35,36,37,38,39,40,41,42,43,44,45,46,47,48,49,50,51,52,53,54,55,56,57,58,59,60,61,62,63,64,65]. Although many algorithms have been used to extract features and identify objects, no technology specifically identifies artwork inside the 360-degree image.
A 360-degree image is stored in an equirectangular projected format. The equirectangular projection maps the entire surface of a sphere onto a flat image [66,67,68,69,70]. The vertical axis is latitude and the horizontal axis is longitude. Because most locations in the equirectangular projected image are seriously distorted, the keypoints from the original artwork are either extremely difficult to match to those from the same artwork in the 360-degree image, or are matched to irrelevant objects. Therefore, we divide the 360-degree image into several portions and transform them into several rectilinear projected images. The rectilinear projection maps a portion of a sphere to a flat image. The feature extraction and matching procedures are performed based on the rectilinear projected images.
The proposed method transforms the equirectangular projected 360-degree image to a sphere that has a radius of 1 and generates a polyhedron to wrap the sphere with polygons. Next, it locates several points on the sphere that are closest to the vertices of the polyhedron. The Euclidean distances between the points are used to determine the widths, heights, and directions of the rectilinear projections. With these parameters, the equirectangular projected 360-degree image is transformed into several rectilinear projected images. Identification is implemented by matching the features extracted from the transformed images to those in the original artwork. We also propose a method for improving the identification precision of artwork that is located in a highly distorted position by matching the keypoint’s shapes. The shape of the keypoints is represented by the proportion of vector norms for the connected keypoints. By measuring the difference of the shapes of keypoints (DSK), we can identify false matches. Figure 1 provides a flowchart for the proposed method. In the experimental results section, we compare matching results before and after applying the proposed methods.

2. Research Background

A 360-degree image is achieved by stitching several individual images together based on the feature matching method [66,67]. The images are photographs taken from different angles. The first step is to extract the local features. One frequently used feature is the scale invariant feature transform (SIFT). To establish relationships between the individual images, the features are matched to each other. An estimation procedure, the random sample consensus (RANSAC) algorithm, is used to remove outliers and retain inliers that are compatible with a homography between the individual images. Next, a set of correct matches is selected by verifying the matches that were based on the inliers. A bundle adjustment procedure further refines the estimated distortion factors. To ensure smooth transitions between images, a blending procedure is applied to the overlapped images. Finally, the 360-degree image is produced by projecting the stitched image onto spherical formats for viewing. The most commonly used format is the equirectangular projection. Most of the regions in the equirectangular projected image are seriously distorted. The photograph of the artwork is affected by several image processing operations during the stitching and projection. Therefore, the keypoints from the original artwork either are extremely difficult to match to those from the same artwork in the 360-degree image, or are matched to irrelevant objects.
In the last decade, several robust algorithms have been proposed for extracting features from images in a variety of computer vision applications. One of the most famous of these algorithms is the SIFT, which detects interest points, specifically keypoints, and assigns orientation properties to each keypoint based on the direction of the local gradient. In the field of facial recognition, the SIFT can detect specific facial features and performs well [11,12,13,14,15]. In [14], the SIFT was used to extract 3D geometry information from 3D face shapes to recognize 3D facial expressions. The SIFT was also used to recognize specific objects, such as TV logos [16] and regular art pictures [17]. However, the art pictures recognized were merely ordinarily photographed pictures. Content-based image retrieval (CBIR) is an application that searches images that are similar to the query image in a database. Because of the SIFT’s rotation, scale and translation invariant properties, it demonstrated adequate retrieval performance in the CBIR evaluation [18,19]. However, because of the SIFT’s high computation complexity, researchers have proposed additional methods to increase its speed.
The speeded-up robust features (SURF) were partially inspired by the SIFT. The descriptor is composed of a histogram constructed from several gradient orientations that surround a keypoint. It is obtained based on integral images for convolutions and the strength of both a Hessian matrix- and a distribution-based descriptor. The length of the standard SIFT descriptor is 128, whereas that of the SURF descriptor is condensed to 64. In [21], the authors used SURF descriptors for image retrieval and classification. They extracted interest points from images in combination with the bag-of-words method to obtain adequate retrieval and classification results. In [22,23], the authors used SURF detectors and descriptors for facial recognition. The keypoints were extracted from facial images following image processing procedures, such as histogram equalization and normalization. The gradients for the neighborhoods of keypoints were used to describe person-specific features.
The features from an accelerated segment test (FAST) were proposed to reduce the computational complexity for real-time application. The FAST detector performs tests by examining a circle of 16 pixels to detect features. When three of the 16 pixels are greater or less than the intensity of the center pixel, a feature can be detected. A decision tree algorithm, specifically iterative dichotomiser3, selects the three pixels. Similar to other methods, the FAST was used for facial recognition, specifically in videos. In [56], the FAST was used to detect local features for omnidirectional vision. However, matching was only performed between the features of the panoramic images instead of matching the features of the original objects to those in the panoramic images. To identify the most important region in an image, the region of interest (ROI), [59] used the FAST to distinguish between important and unimportant content in the image. In [58], the FAST was also used to approximate ROI detection of fetal genital organs in B-mode ultrasound images. In [57], the FAST was used to extract keypoints of pine floorboard images to guide a wood patching robot.
The maximally stable extremal regions (MSER) detection algorithm detects the invariant stable extremal regions. The extremal region is closed under continuous and monotonic transformations of image coordinates and intensities. The MSER is defined as the property of the intensity function on the outer boundary. Local minima of the changing rate for the area function are the intensity levels that are the thresholds for producing MSER. This is represented by the position of the local intensity maximum or minimum and a threshold. Because of the MSER’s invariant and stable properties, it has been used in many applications, such as text and image segmentation [47,48,49,50], video fingerprinting [51], human tracking [52] and object recognition [53].
The histograms of oriented gradient (HOG) evaluate normalized local histograms of gradient orientations on a dense grid. It uses overlapping local contrast normalizations for improving performance. The HOG feature has significant effects for detecting humans and vehicles in conjunction with machine learning algorithms [41,42,43,44,45]. One interesting application used HOG features to detect landmines in ground-penetrating radar [40]. The HOG was also used for facial expression recognition [39] and other object recognition, such as plant leaves [37], handwritten digits [38], and off-line signatures [36].
The BRISK descriptor is generated from a configurable circular sampling pattern. It is obtained by computing brightness comparisons. To improve the accuracy of facial detection against pose variation, in [26], the feature descriptors of binary robust invariant scalable keypoints (BRISK) were used to register facial images, which are processed prior to facial recognition. The BRISK also has adequate performance for recognizing gender [31] and people [30] using facial and ocular images. In [29], the BRISK was used to recognize appearance-based places for collaborative robot localization.
Similar to the BRISK, the sampling pattern that is used for the fast retina keypoint (FREAK) is based on Gaussians and is derived from the retina in the human eye. Because its low computation cost is an advantage, the FREAK was used in multimedia for image and video classification [63,64]. In target-matching recognition for satellite images, the recognition had poor accuracy and robustness because of tis unfit feature detector and large amount of data. Accordingly, FREAK was used to improve target-matching recognition for satellite remote sensing images [65]. To prevent the distribution of pornography, the FREAK descriptor was used to detect pornographic images in conjunction with the bag-of-words model [61,62].
In [71], the authors explored the use of the query-by-picture technology for artwork recognition. The SURF and eigenpaintings are combined to recognize the artwork images on mobile phones. However, the approach required a preprocessing step to extract the foreground from the image. The artwork recognition was only performed on the foreground. The artwork segmentation relied on the fact that the artwork was presented on a uniform white background. However, the artworks in 360-degree images are surrounded by various objects. Therefore, the approach is inappropriate for identifying the artworks in 360-degree images.
A fully affine invariant image matching method called affine-SIFT (ASIFT) was proposed in [72]. The ASIFT extends the SIFT to a fully affine invariant device. It simulates scale, longitude and latitude angles of camera. It also normalizes translation and rotation. It transforms images by simulating all possible affine distortions caused by a change in the camera optical axis direction. These distortions depend on the longitude and latitude. The images undergo directional subsamplings. The tilts and rotations are performed for a small and finite number of longitude and latitude angles. The simulated images are then compared by the SIFT for final matching. However, there are a lot of false matched keypoints between original artwork images and 360-degree images using the ASIFT. In [73] authors investigated the possibility of synthesizing affine views of successive panoramas of street facades with affine point operators. Final keypoint matches were obtained by applying the ASIFT features. In [74], the authors evaluated some feature extraction methods to automatically extract the tie points for calibration and orientation procedures. The considered feature extraction methods are mainly the SIFT and its variants.
Several computer vision algorithms have been proposed to detect features and recognize objects for many applications. However, research has yet to develop a technology that specifically recognizes objects in 360-degree images.

3. Map Projection

This section provides an overview of equirectangular projection and rectilinear projection, which are the most commonly used map projections. A map projection transforms the locations on a sphere into areas on a plane [69,70]. However, several serious geometric distortions occur during the transformation process. The following sections discuss these limitations in detail.

3.1. Equirectangular Projection

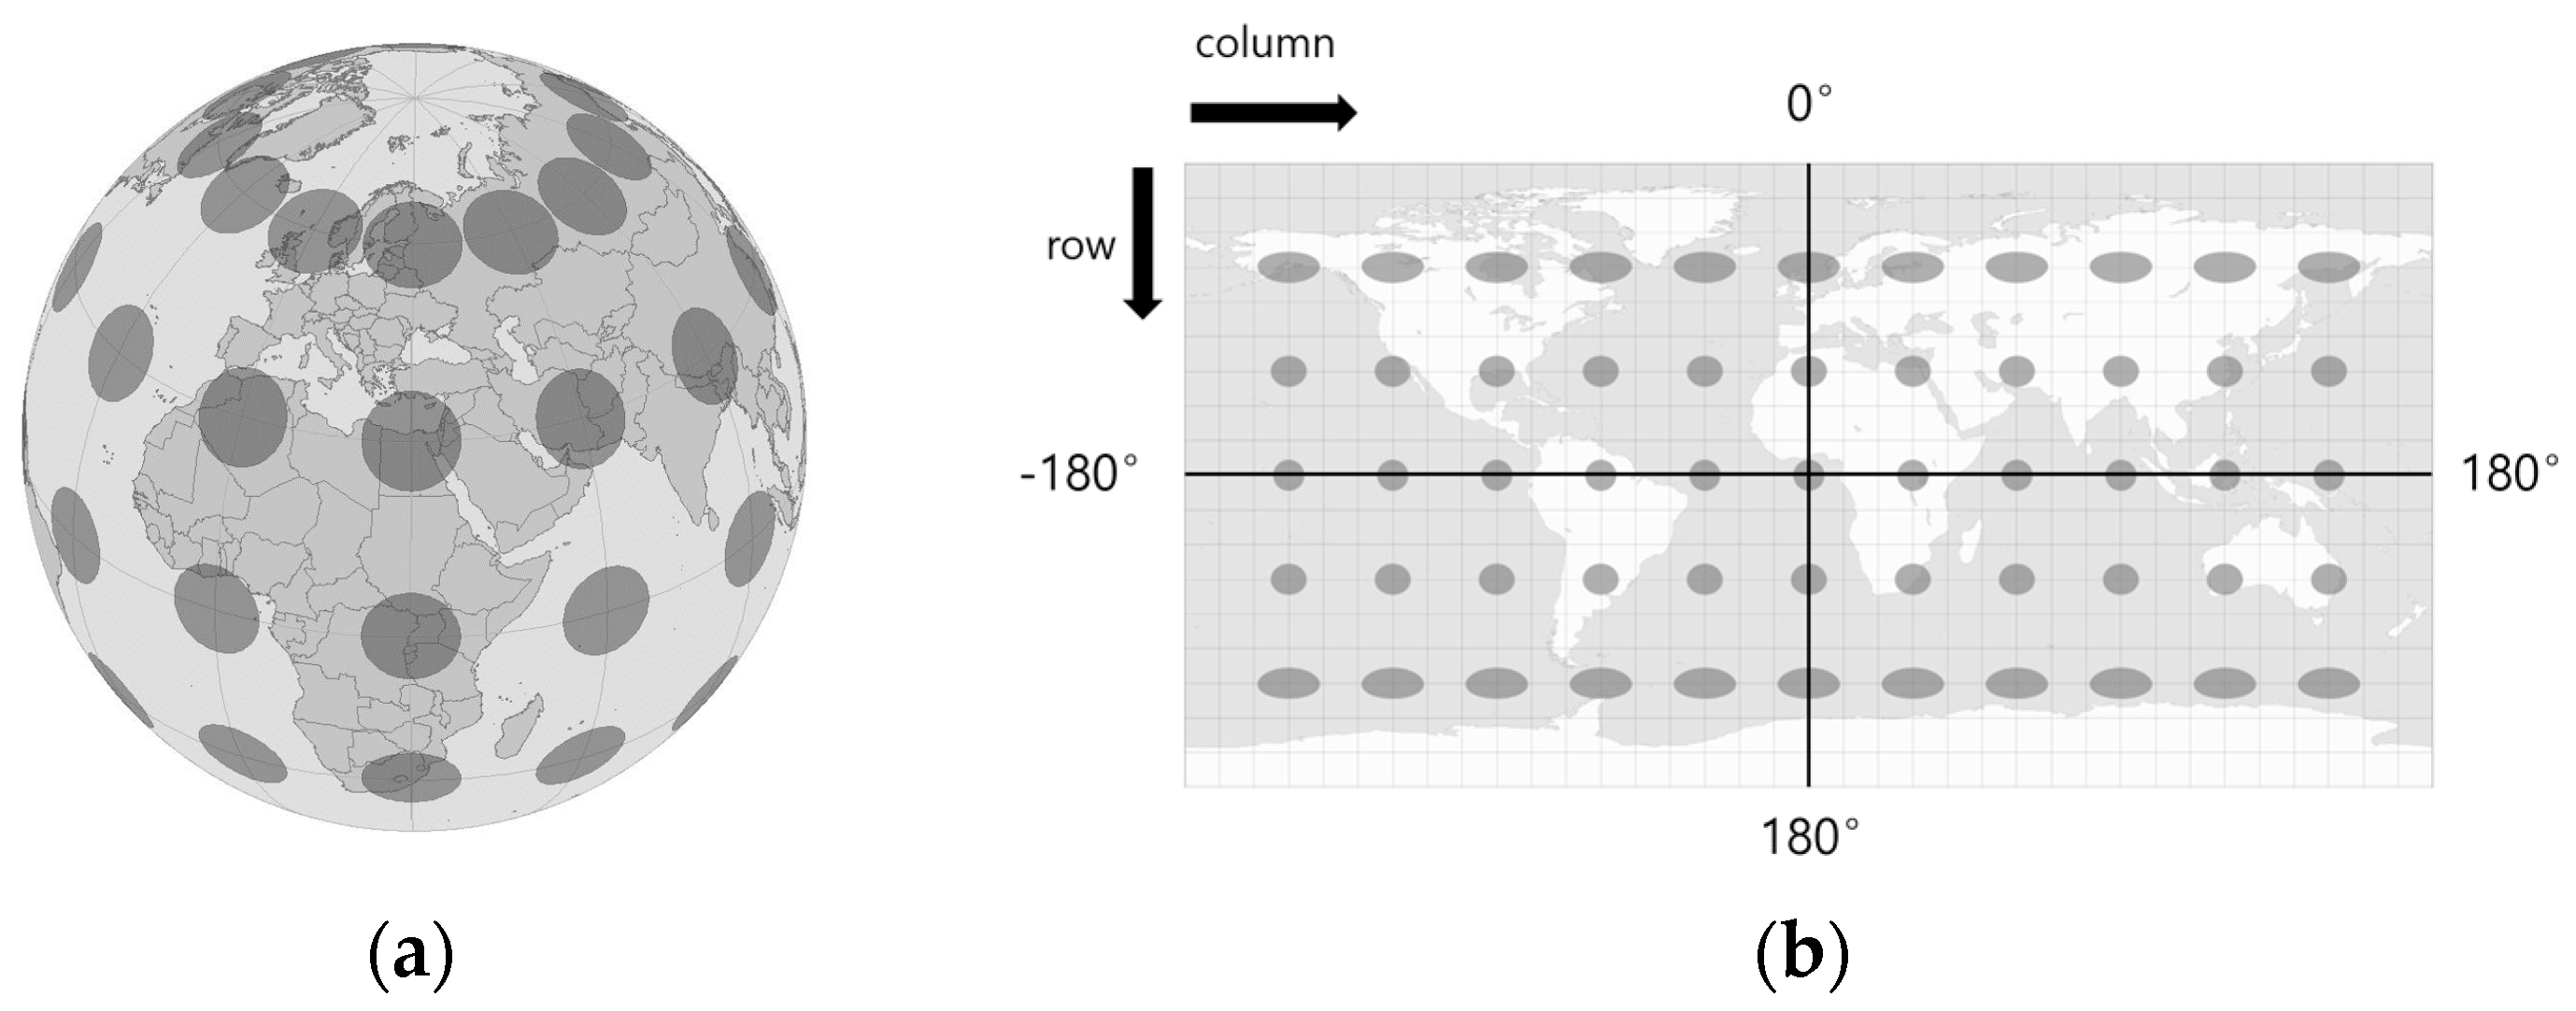
Equirectangular projection maps all of the locations on the sphere onto a flat image. Generally, a simple geometric model is used to represent the sphere, for example, the Earth. Equirectangular projection maps parallels to equally spaced straight horizontal lines and meridians to equally spaced straight vertical lines. It is neither conformal nor equal in area. Figure 2a shows Tissot’s indicatrices on the sphere that are used to illustrate the projection’s distortions. Figure 2b shows the projected equirectangular results from Tissot’s indicatrices.
Two standard parallels are equidistant from the Equator on the map at latitudes of 30 degrees north and south. If the location is too close to the Equator, the scale is too small. If the location is farther away from the Equator along the parallels, the scale increases. Area and local shape are highly distorted at most locations except for latitudes of 30 degrees north and south. Therefore, the objects in the 360-degree image are difficult to recognize.

3.2. Rectilinear Projection

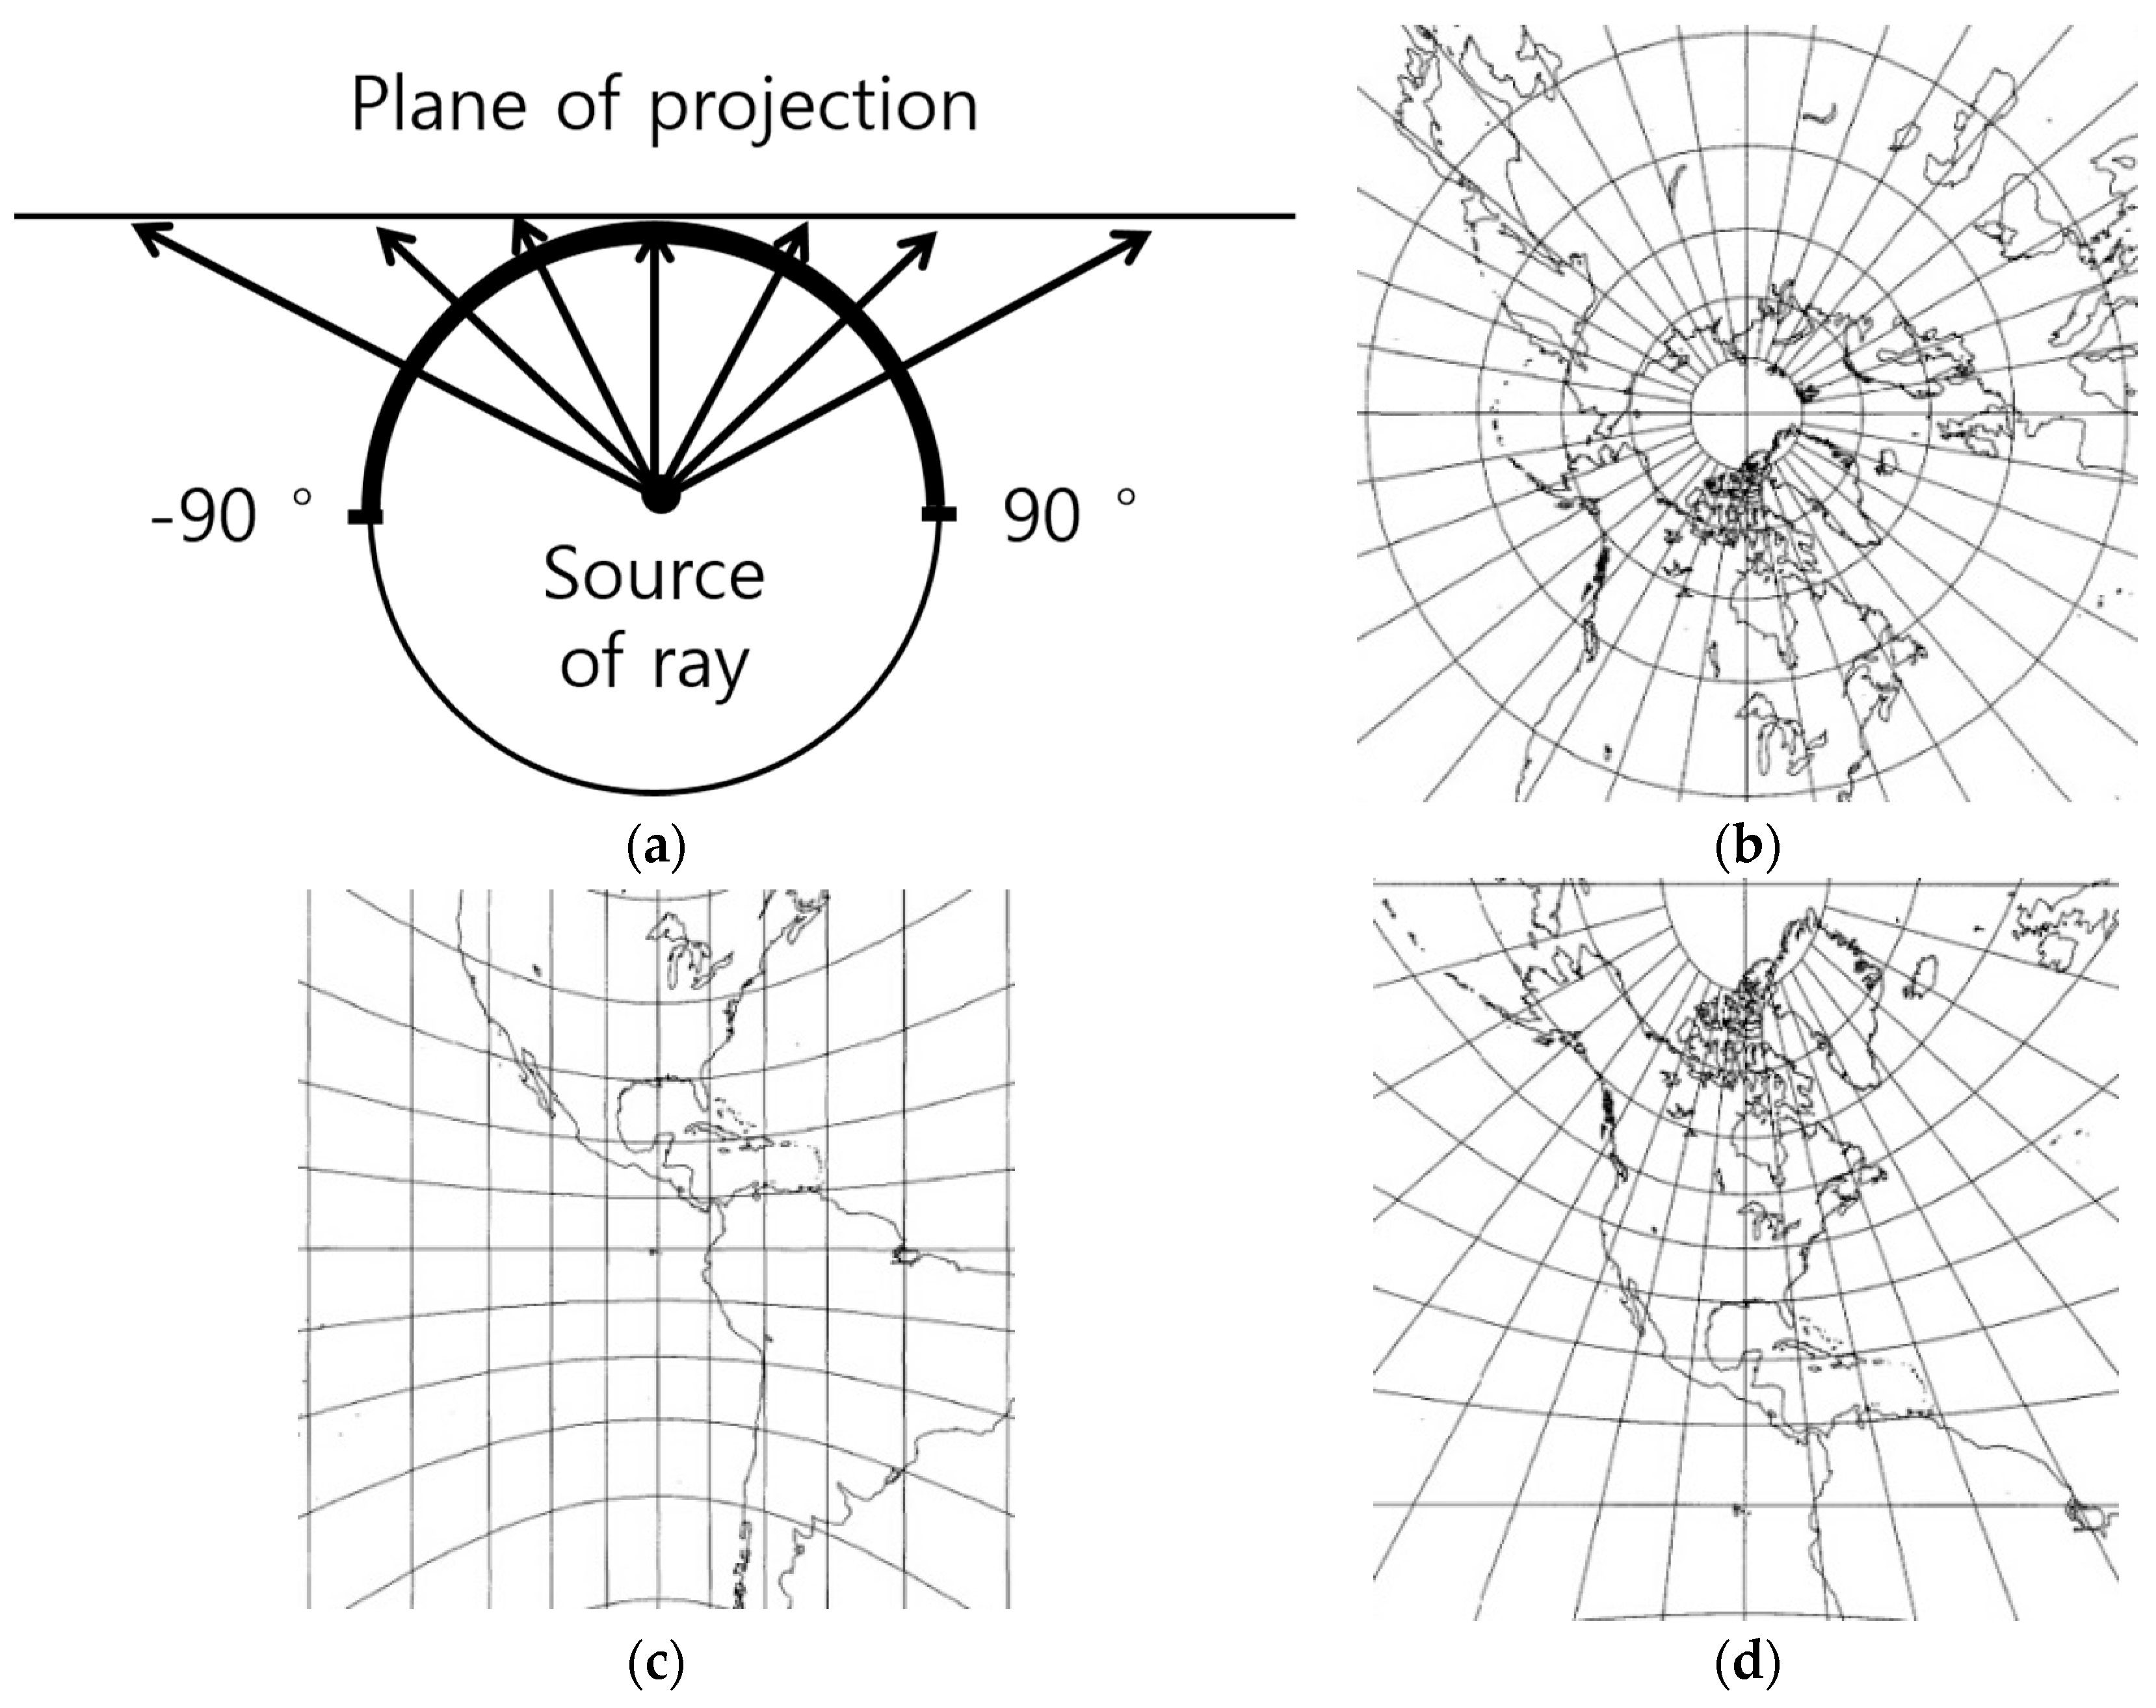
Equirectangular projected images are not ideal for viewing applications. The image must be re-projected to provide viewers with an approximate natural perspective. The rectilinear projection maps a specific portion of locations that are on the sphere onto a flat image, a process that is referred to as gnomonic projection. This is a fundamental projection strategy for panoramic imaging approaches. Figure 3a shows the basic theory for rectilinear projection and Figure 3b–d demonstrate three types of projected results.
The rectilinear projected image is composed of the points on the plane of projection. It is obtained when the rays from the center of the sphere pass through the points on the surface and cast the points onto the plane. Less than half of the sphere can be projected onto the plane. When the points on the projection plane are located further away from the source of ray, there will be more distortions. Figure 3b shows the projected result of a pole. The opposite hemisphere cannot be projected onto the plane. The distortions are increased away from the pole. Figure 3c shows an equatorial rectilinear projection. Only the points that are within 90 and −90 degrees of the central meridian (0 degrees) can be projected, and the poles cannot be shown. The distortions will be increased away from the central meridian and the Equator. Figure 3d shows an oblique rectilinear projection. If the central parallel is at a northern latitude, its colatitude is projected as a parabolic arc. The parallels in the southern regions are hyperbolas and those in the northern regions are ellipses, which become more concave toward the nearest pole and vice versa if the central parallel is at a southern latitude.

4. Polyhedron-Based Rectilinear Projection

According to the properties of the two projections illustrated in the previous section, both projections incur distortions. After the rectilinear projection, the pixels near the boundary of the projected image will be stretched when the size of the viewing range is larger, specifically when the angle of the viewing range is greater than 120 degrees. However, the distortion of the rectilinear projected image will be reduced with appropriate decreases in the size of the viewing range. We divide the 360-degree image into several areas and transform the equirectangular projected 360-degree image into several rectilinear projected images.
To divide the 360-degree image into appropriately sized areas, we use a polyhedron-based method. Several types of polyhedrons are based on several polygonal faces, edges, and vertices. The number of projected rectilinear images is equal to the number of polygons. However, the photograph of the artwork can be taken from any angle, which indicates that the artwork in the 360-degree image can be located at any position. Thus, the 360-degree image must be averagely partitioned. In a previous work [75], we used 32-hedron to partition the 360-degree image. However, in this work, to measure the effects of the number, size, and direction of the polygons for identification, we use three types of polyhedrons for rectilinear projection: 32-hedron, dodecahedron, and octahedron. Figure 4 shows three geometric models for the polyhedrons that have radii of 1 and the center as an origin. The 32-hedron consists of 12 pentagons and 20 hexagons and is a typical model of a soccer ball. There are 60 vertices on the 32-hedron. The dodecahedron consists of 12 pentagons and 20 vertices. The octahedron consists of eight triangles and six vertices. We define the number of polygons in each polyhedron as n and the number of vertices for each polygon as t . Each vertex on each polyhedron is defined as v t j ( a j , b j , c j ) , where the j denotes the number of vertices in a polyhedron. The 360-degree image will be divided and projected into n images. Each projected image is obtained by rectilinear projection for a portion of the 360-degree image through each polygon based on its direction and size.
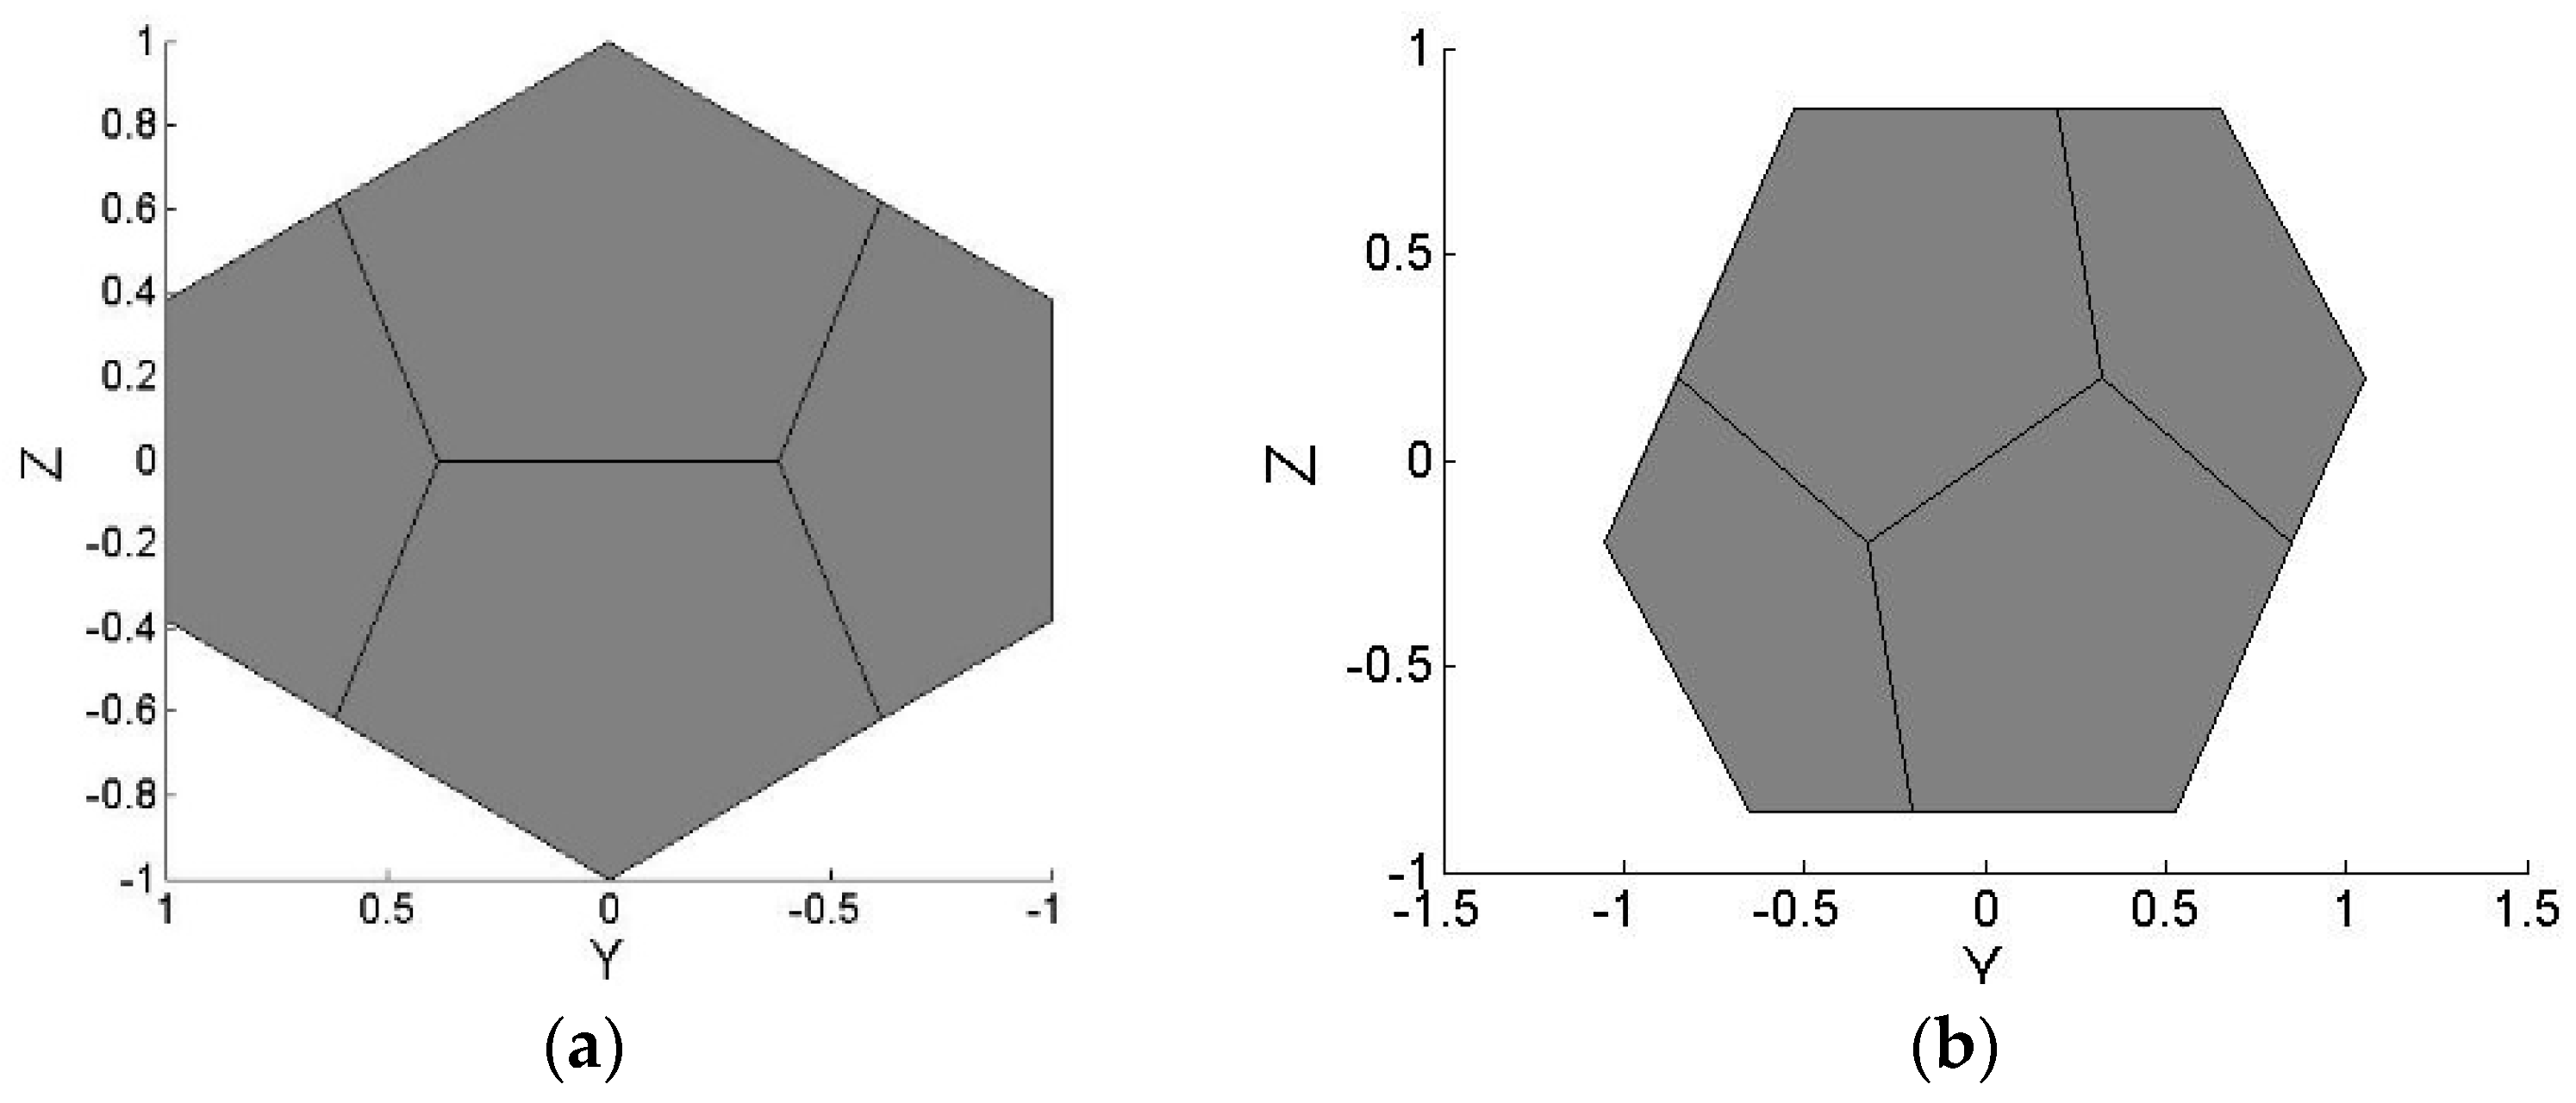
Generally, most artwork is hung vertically on walls instead of on the ceiling or the ground. Thus, after taking 360-degree photos, the artwork is usually located above, below, or near the Equator. The regular dodecahedron is shown in Figure 5a. In this case, four polygons face toward two poles. The polygons are not efficient for rectilinear projection of the artwork. Therefore, we rotate the dodecahedron around the x-axis by 31.7 degrees (90-dihedral angle/2), so that the normal vector of a pole-faced polygon is parallel to the z-axis, as in Figure 5b. Then, only two polygons face towards the two poles. The remaining polygons can be efficiently used for rectilinear projecting of the artwork.
As noted in the previous section, the further away the points are located on the plane of projection, the more distortions will occur. Accordingly, the distortions of the locations around the edges of the polyhedrons are larger than at the other locations. For the octahedron, we retain four polygons facing north and another four polygons facing south.
The 360-degree image is transformed into a sphere with a radius, r = 1 , with the center as the origin. It overlaps with the polyhedrons. Based on Figure 2b in the previous section, the rows and columns for the equirectangular projected 360-degree image can be indicated as the sphere’s vertical ϕ and horizontal angles θ . The spherical coordinates can be defined as ( r , θ , ϕ ) . The three dimensional Cartesian coordinates ( x , y , z ) are represented as Equations (1)–(3). Thus, we define each point on the sphere as, p t i ( x i , y i , z i ) , where the i denotes the number of pixels in the 360-degree image.
x = r cos θ sin ϕ
y = r sin θ sin ϕ
z = r cos ϕ
The center o n ( a c n , b c n , c c n ) of each polygon is obtained by computing the mean of the vertices for each polygon as follows:
o n ( a c n , b c n , c c n ) = 1 t l = 1 t v t l ( a l , b l , c l )
The points on the sphere that are closest to the vertices of each polyhedron and the centers of polygons are computed with the Euclidian distance as Equations (5) and (6). The points that are the closest to the vertices are defined as V j and the points that are the closest to the centers are defined as C n .
V j = argmin p t i { ( x i a j ) 2 + ( y i b j ) 2 + ( z i c j ) 2 }
C n = argmin p t i { ( x i a c n ) 2 + ( y i b c n ) 2 + ( z i c c n ) 2 }
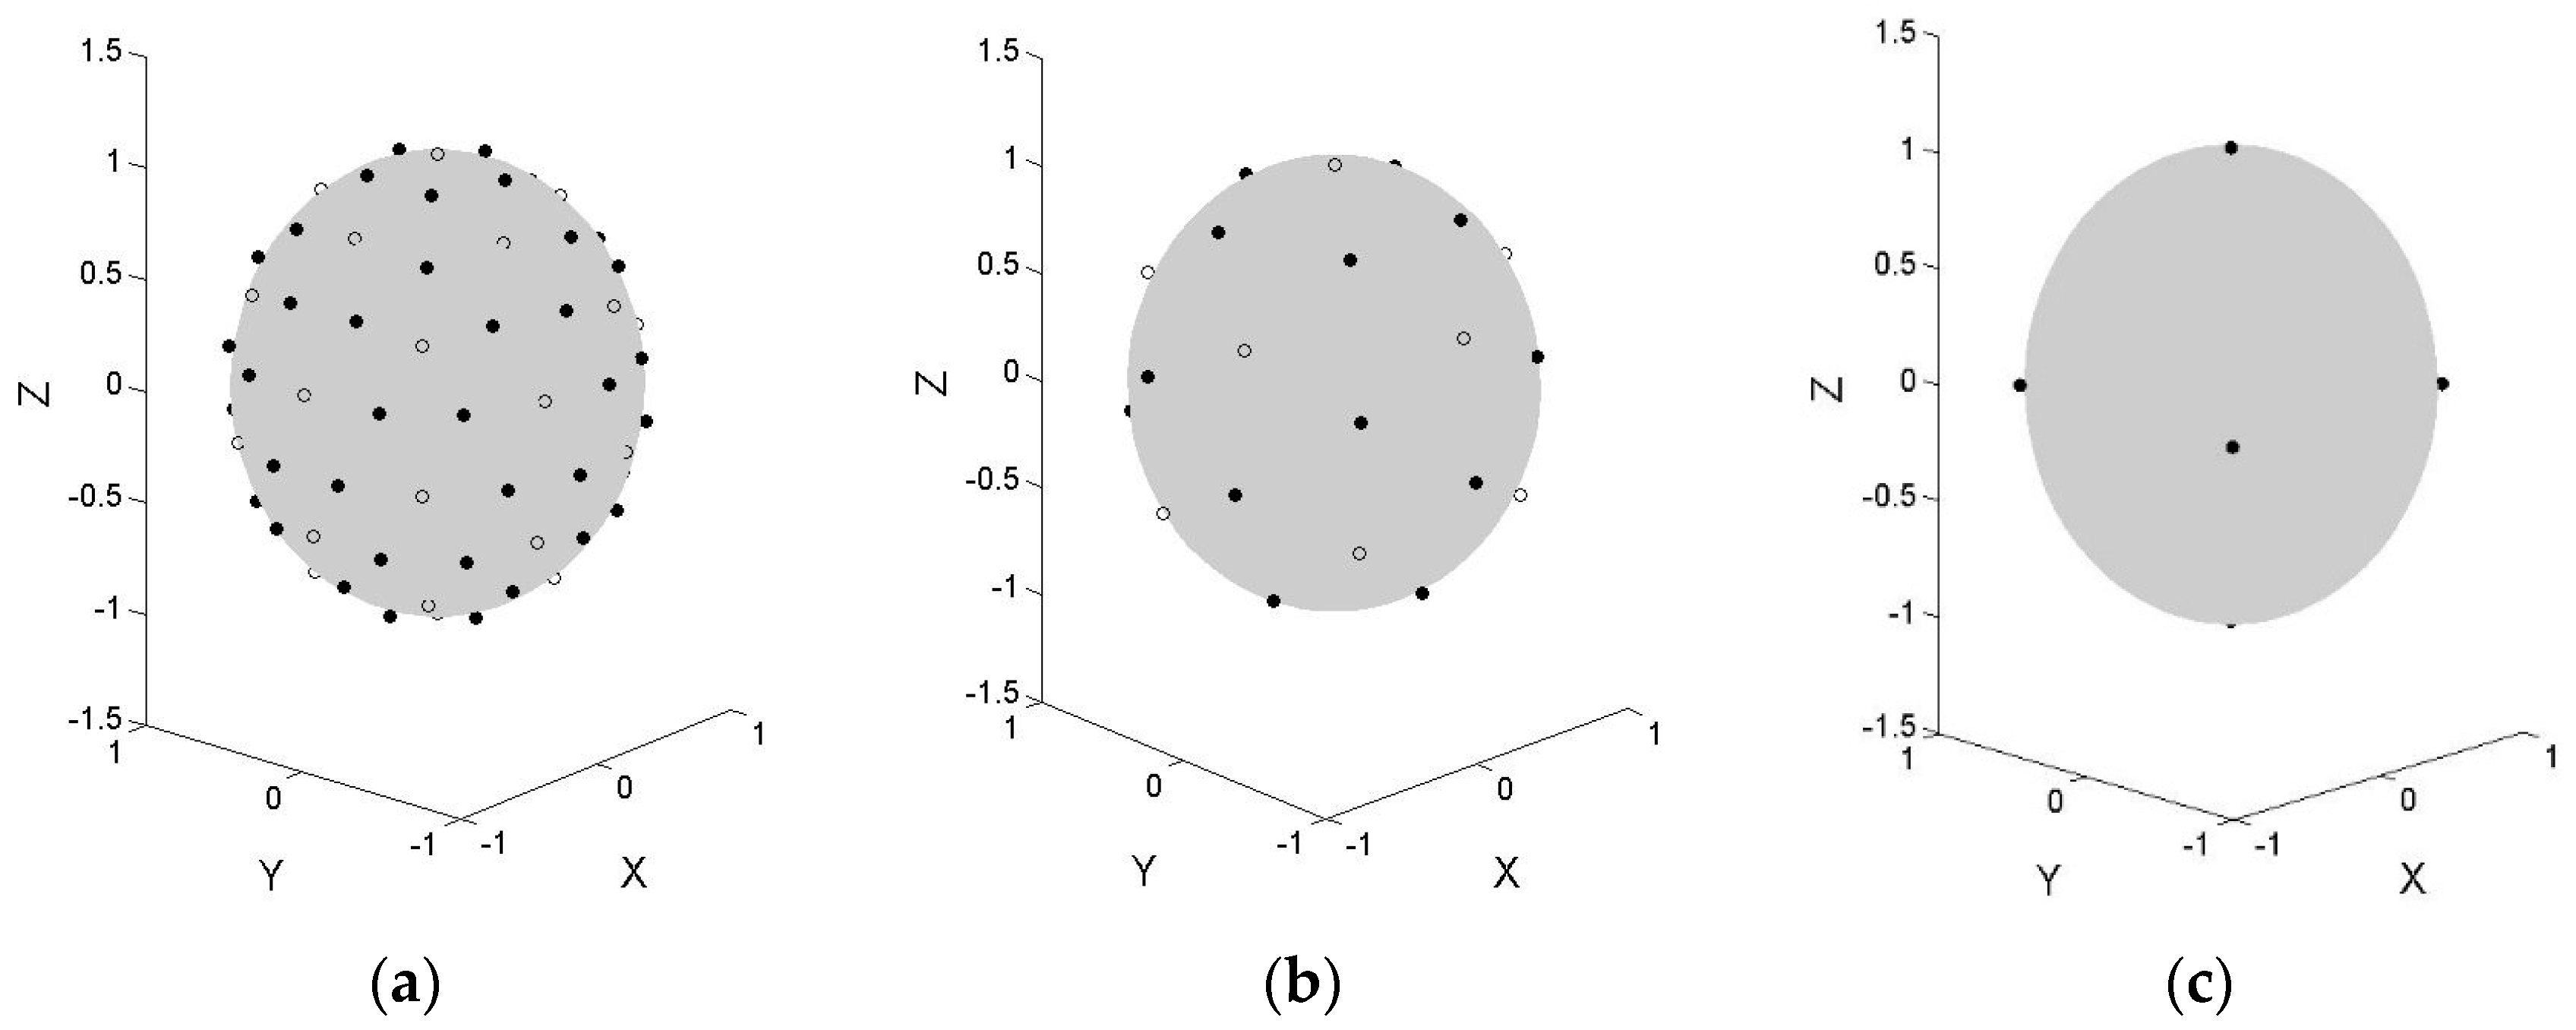
Figure 6 shows the points that are marked on the sphere. The black points are the closest to the vertices and the circles are the closest to the centers. The circles are used to determine the directions of the rectilinear projections. For the octahedron, instead of locating the circles, the directions are fixed as north and south latitudes at 45 degrees.
With the points V j , we can compute the size of the viewing range. There are three types of polyhedrons. Thus, we propose three methods for computing the sizes of the viewing range for the three polyhedrons. The units for the width and height of the viewing range are represented in degrees. For the 32-hedron, we first transform the V j into spherical coordinates. The vertical angle ϕ V and horizontal angle θ V are obtained using the inverse sine and the four-quadrant inverse tangent as follows:
ϕ V = asin ( z / r )
θ V = atan 2 ( y , x )
We select the points that have the maximum and minimum vertical and horizontal angles. For each polygon, the difference d v between the maximum and minimum vertical angles, and the difference d h between the maximum and minimum horizontal angles are represented as in Equations (9) and (10). The height, h v , and width, w v , of the viewing range for each polygon is set to the maximum values in d v and d h , which are greater than 0 and less than 120 degrees. Then, we obtain a wide viewing angle with low distortion.
d v = max { ϕ V } min { ϕ V }
d h = max { θ V } min { θ V }
h v = max { d v | 0 < d v < 120 }
w v = max { d h | 0 < d h < 120 }
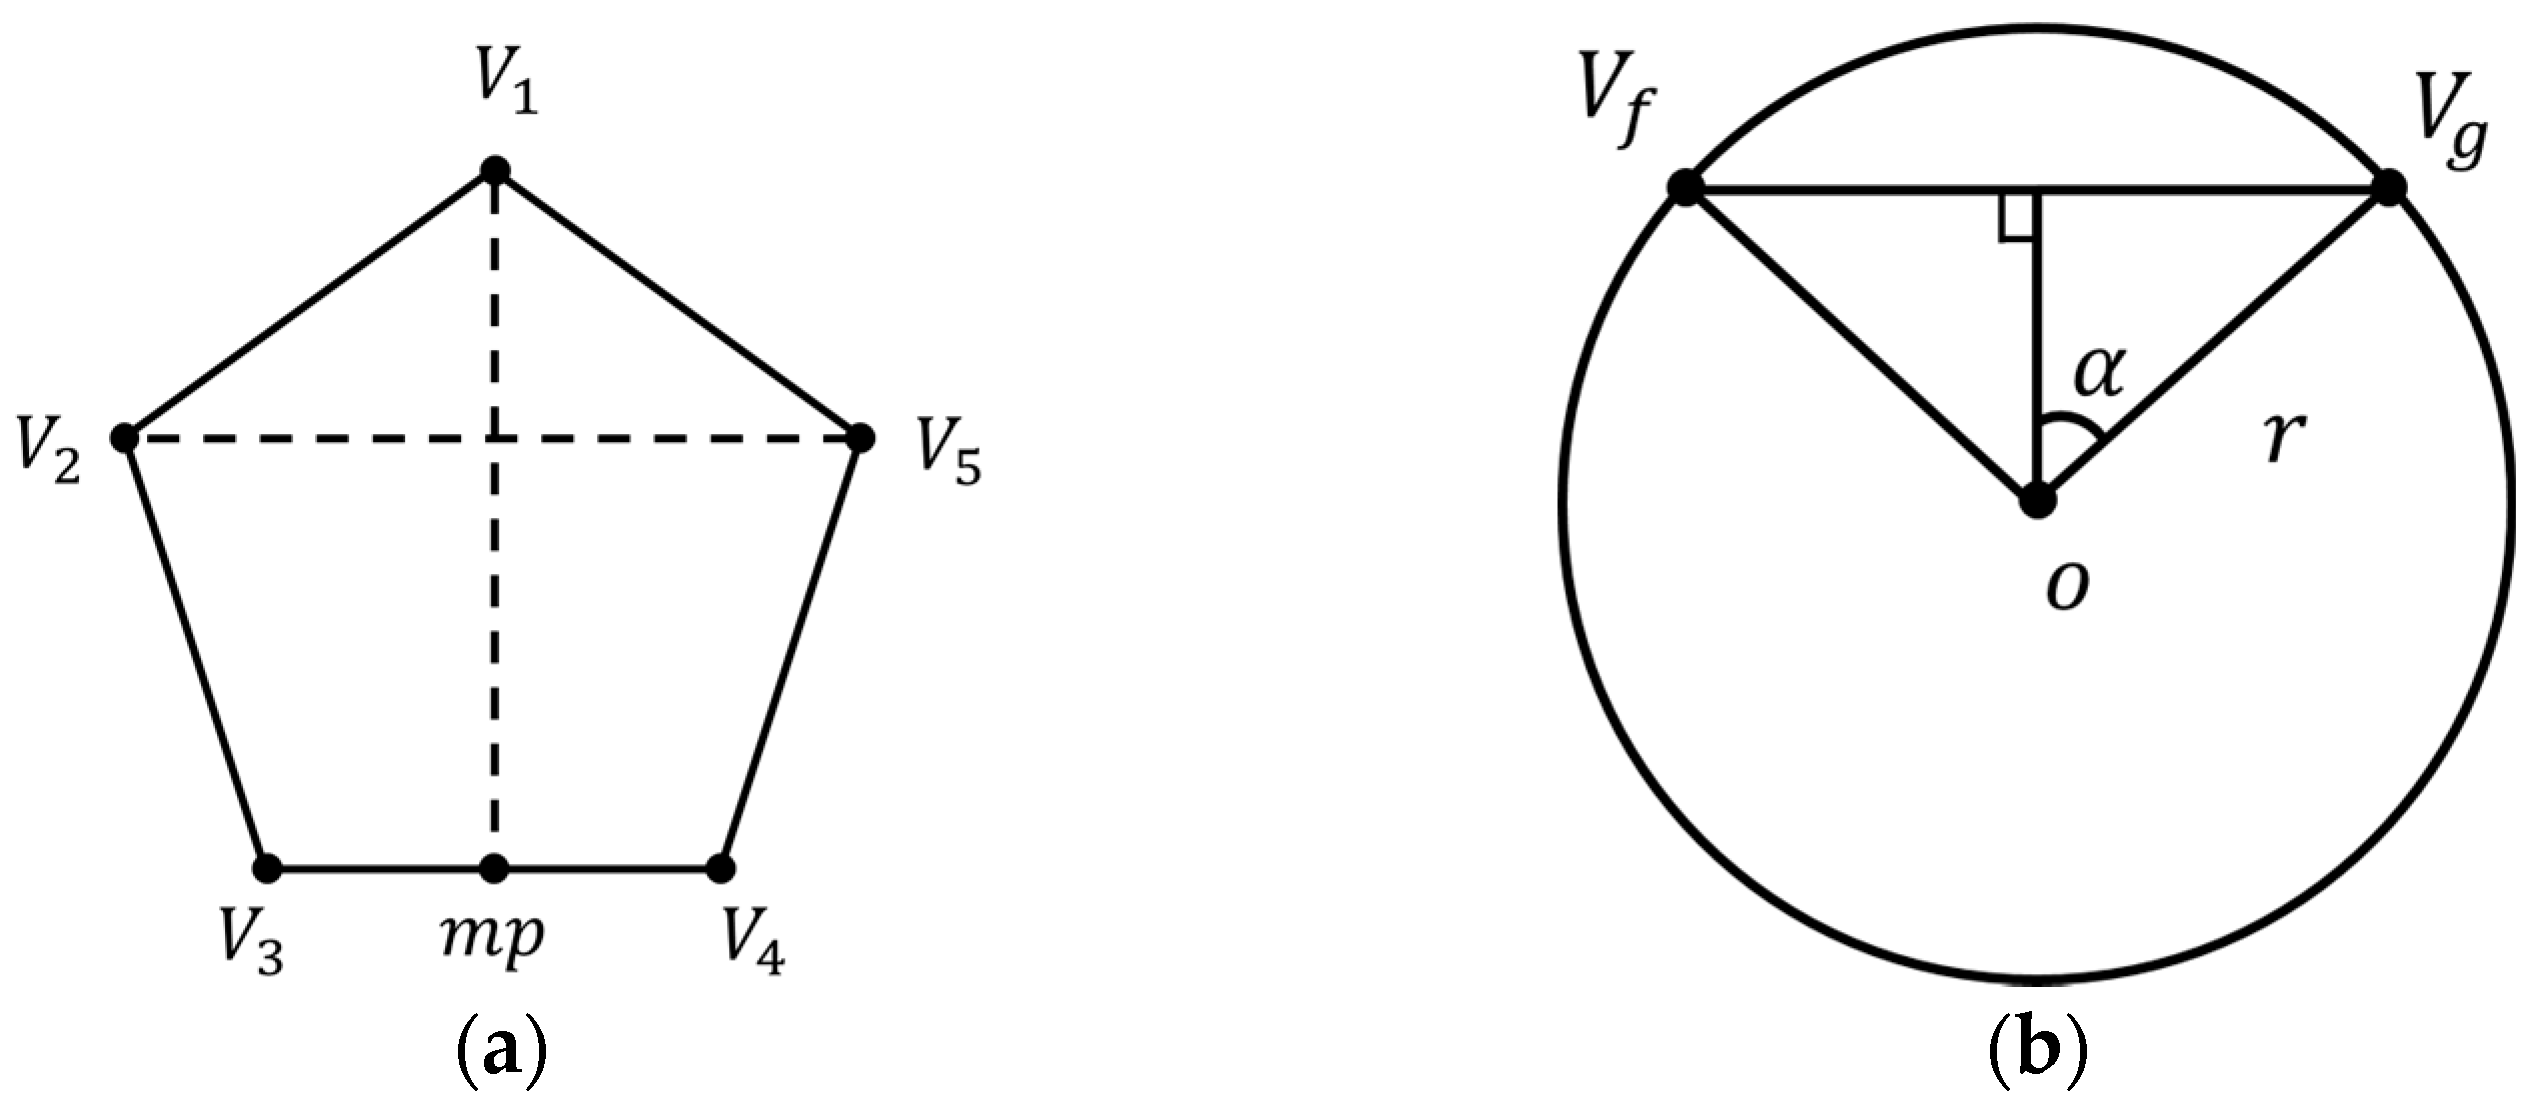
For the dodecahedron, the size of the viewing range is computed using a different method. The width w v of the viewing range is based on the distance V 2 V 5 between non-adjacent points, as shown in Figure 7a. The points V 2 and V 5 are the points V f and V g on the sphere in Figure 7b. Then, the w v can be computed as follows:
w v = 2 · asin ( V f V g 2 · 1 r )
The point m p is the midpoint between V 3 and V 4 . The m p has the closest point on the sphere. That point and the V 1 are also the points V f and V g . Therefore, the height h v for the viewing range can be computed with Equation (13).
For both the 32-hedron and the dodecahedron, the C n determines the direction of the rectilinear projection. The angles are obtained with Equations (7) and (8) based on the coordinates of C n . The width of the viewing range is the angle between two adjacent points on the Equator. The height is the angle between a point on a pole and a point on the Equator. With the angles of viewing ranges and directions, we obtain rectilinear projected images as follows:
t x = cos ( r h v ) · sin ( r w v l o n ) sin ( l a t ) · sin ( r h v ) + cos ( l a t ) · cos ( r h v ) · cos ( r w v l o n )
t y = cos ( l a t ) · sin ( r h v ) sin ( l a t ) · cos ( r h v ) · cos ( r w v l o n ) sin ( l a t ) · sin ( r h v ) + cos ( l a t ) · cos ( r h v ) · cos ( r w v l o n )
where t x and t y denote the pixel coordinates for each rectilinear projected image. The r h v and r w v denote the relative coordinates, which are greater than l a t h v / 2 and l o n w v / 2 , and less than l a t + h v / 2 and l o n + w v / 2 . The l o n and l a t denote the longitude and latitude of the viewing direction. We set the viewing direction as the center of the projection and project a portion of the sphere on the range onto a flat image. We fix the height of the projected image as h p , whereas the width w p is variable and depends on the ratio between the size of the viewing range and the height. Otherwise, there will be an increase in the distortion of the projected image. The width is computed as follows:
w p = h p 2 r · sin ( h v 2 ) · 2 r · sin ( w v 2 ) = h p · sin ( h v 2 ) sin ( w v 2 )
The 2 r · sin ( w v 2 ) and 2 r · sin ( h v 2 ) are based on the same principle of computing the distance V f V g , which is shown in Figure 7b. After generating a projected image, the features are extracted from this distortion reduced image.

5. Feature Extraction and Matching

In 2015, five leading feature extraction algorithms, SIFT, SURF, BRIEF, BRISK, and FREAK, were used to generate keypoint descriptors of radiographs to classify assessments of bone age [4]. After comparing the five algorithms, SIFT performed the best in terms of precision. Although there were increased extraction speeds for the other feature algorithms, there were also decreases in precision. In 2016, a survey was administered to evaluate object recognition methods based on local invariant features from a robotics perspective [3]. The evaluation results concluded that the best performing keypoint descriptor was SIFT because it is robust in real-world conditions.
This paper primarily focuses on identification precision rather than identification speed. In this section, instead of illustrating all of the feature algorithms, we provide a brief review of the most representative algorithm, specifically, the SIFT feature extraction and matching methods. Before extracting features, we convert the color images into YIQ color space. The features are extracted from the Y components.
SIFT transforms images into scale-invariant coordinates and generates many features. The number of features is important for recognition. For reliable identification, at least three features must be correctly matched to identify small objects [10]. A large number of robust keypoints can be detected in a typical image. The keypoint descriptors are useful because they are distinct and are obtained by assembling a vector of local gradients.
SIFT is widely used for extracting rotation, scale, and translation-invariant features from images. With geometric transformation-invariant SIFT keypoints, object recognition has an increased performance for feature matching. Generally, the matching procedure for a keypoint occurs by finding its closest neighbor, which is the keypoint with the least amount of distance. However, an additional measure is used to discard features that have weak matches. The distance d 1 between a keypoint and its closest neighbor is compared to the distance d 2 between the keypoint and its second-closest neighbor. The second-closest match is an estimate of the density of false matches, specifically an incorrect match [10]. To achieve a reliably matched keypoint, the d 1 must be significantly less than the d 2 . The comparison is simply defined as τ × d 1 < d 2 . When the threshold τ is set to 3, the matched results for artwork are better than those that use the default value of 1.5. However, we found that this additional measure does not provide adequate effects for all types of keypoints for identifying artwork in the 360-degree images. Although this approach is helpful to the SIFT, it is not suitable for the other features that are discussed in this paper. Thus, it is used in conjunction with SIFT and not combined with the other features for evaluating identification.
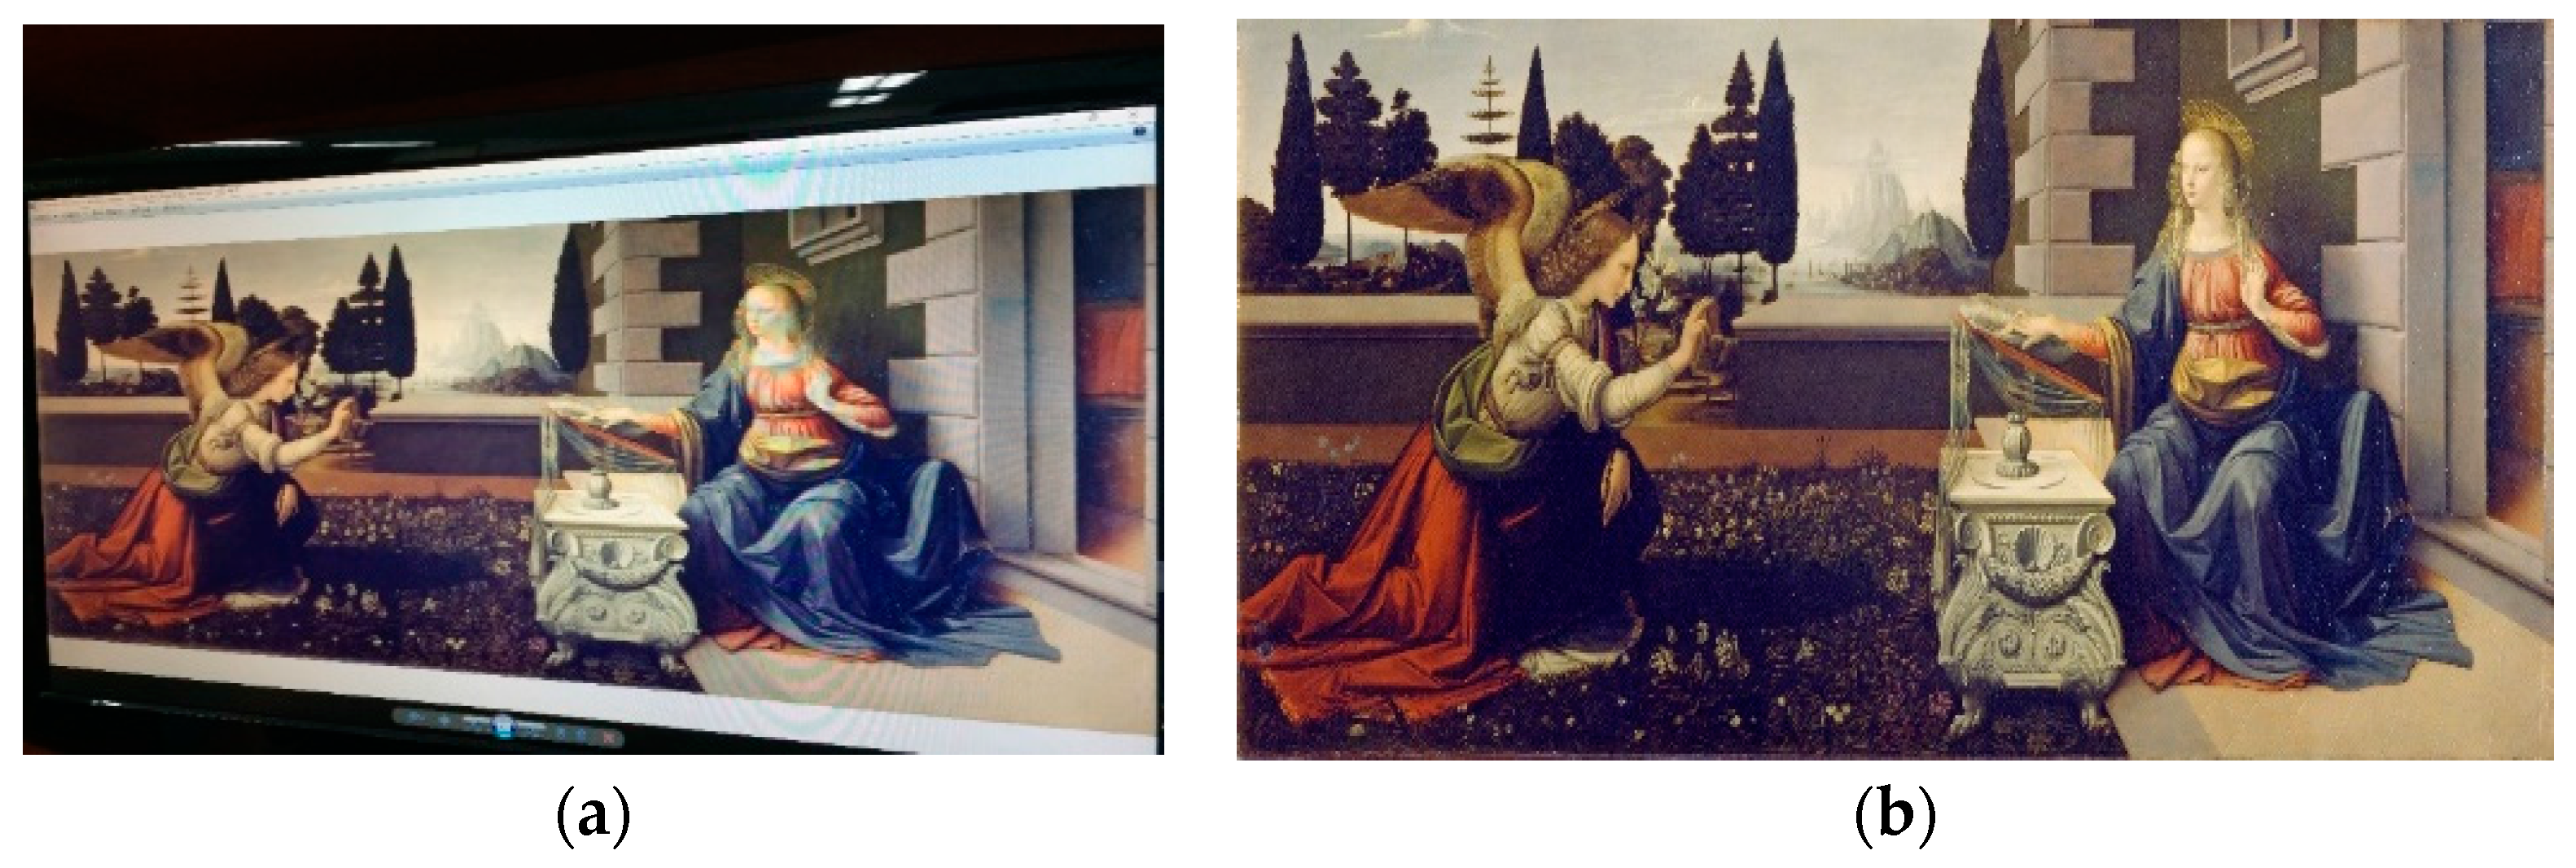
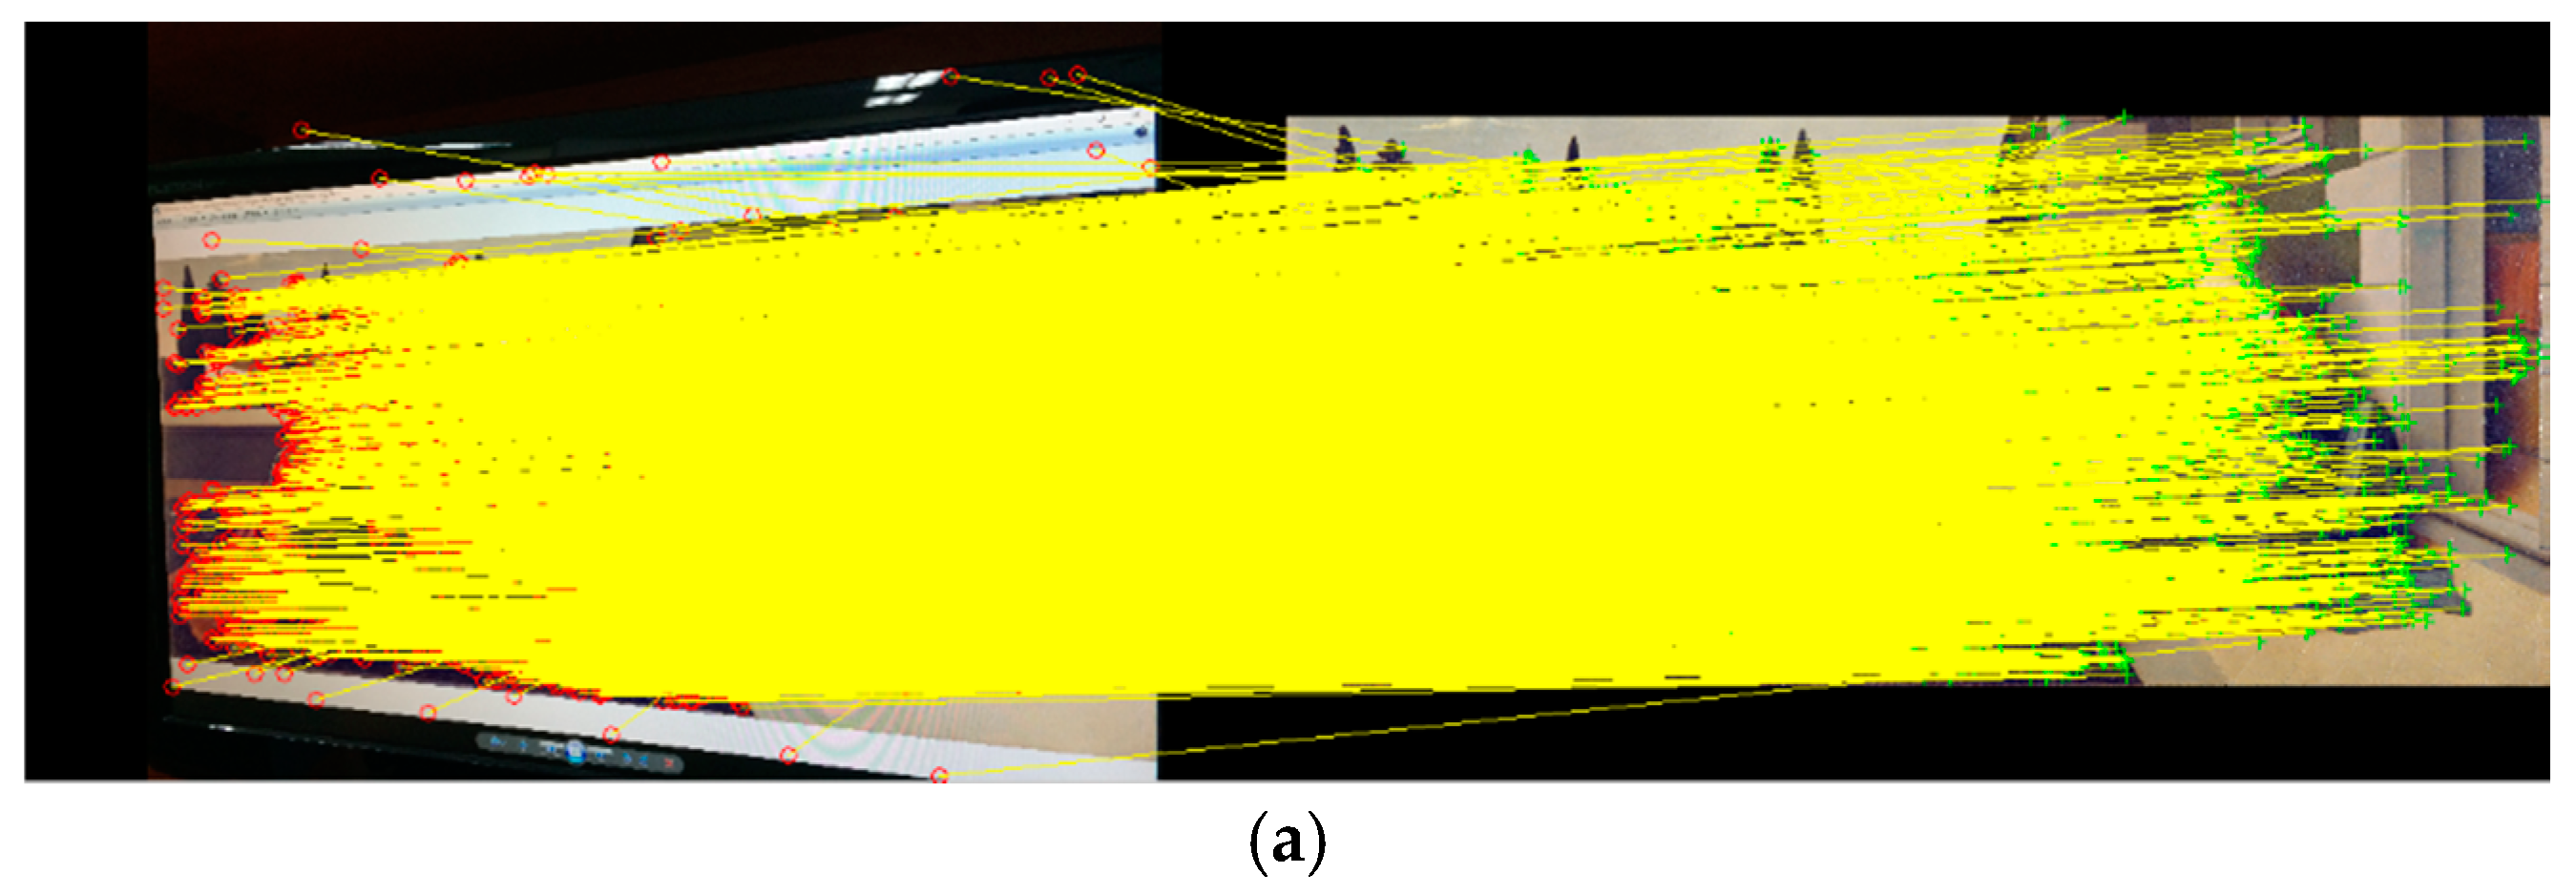
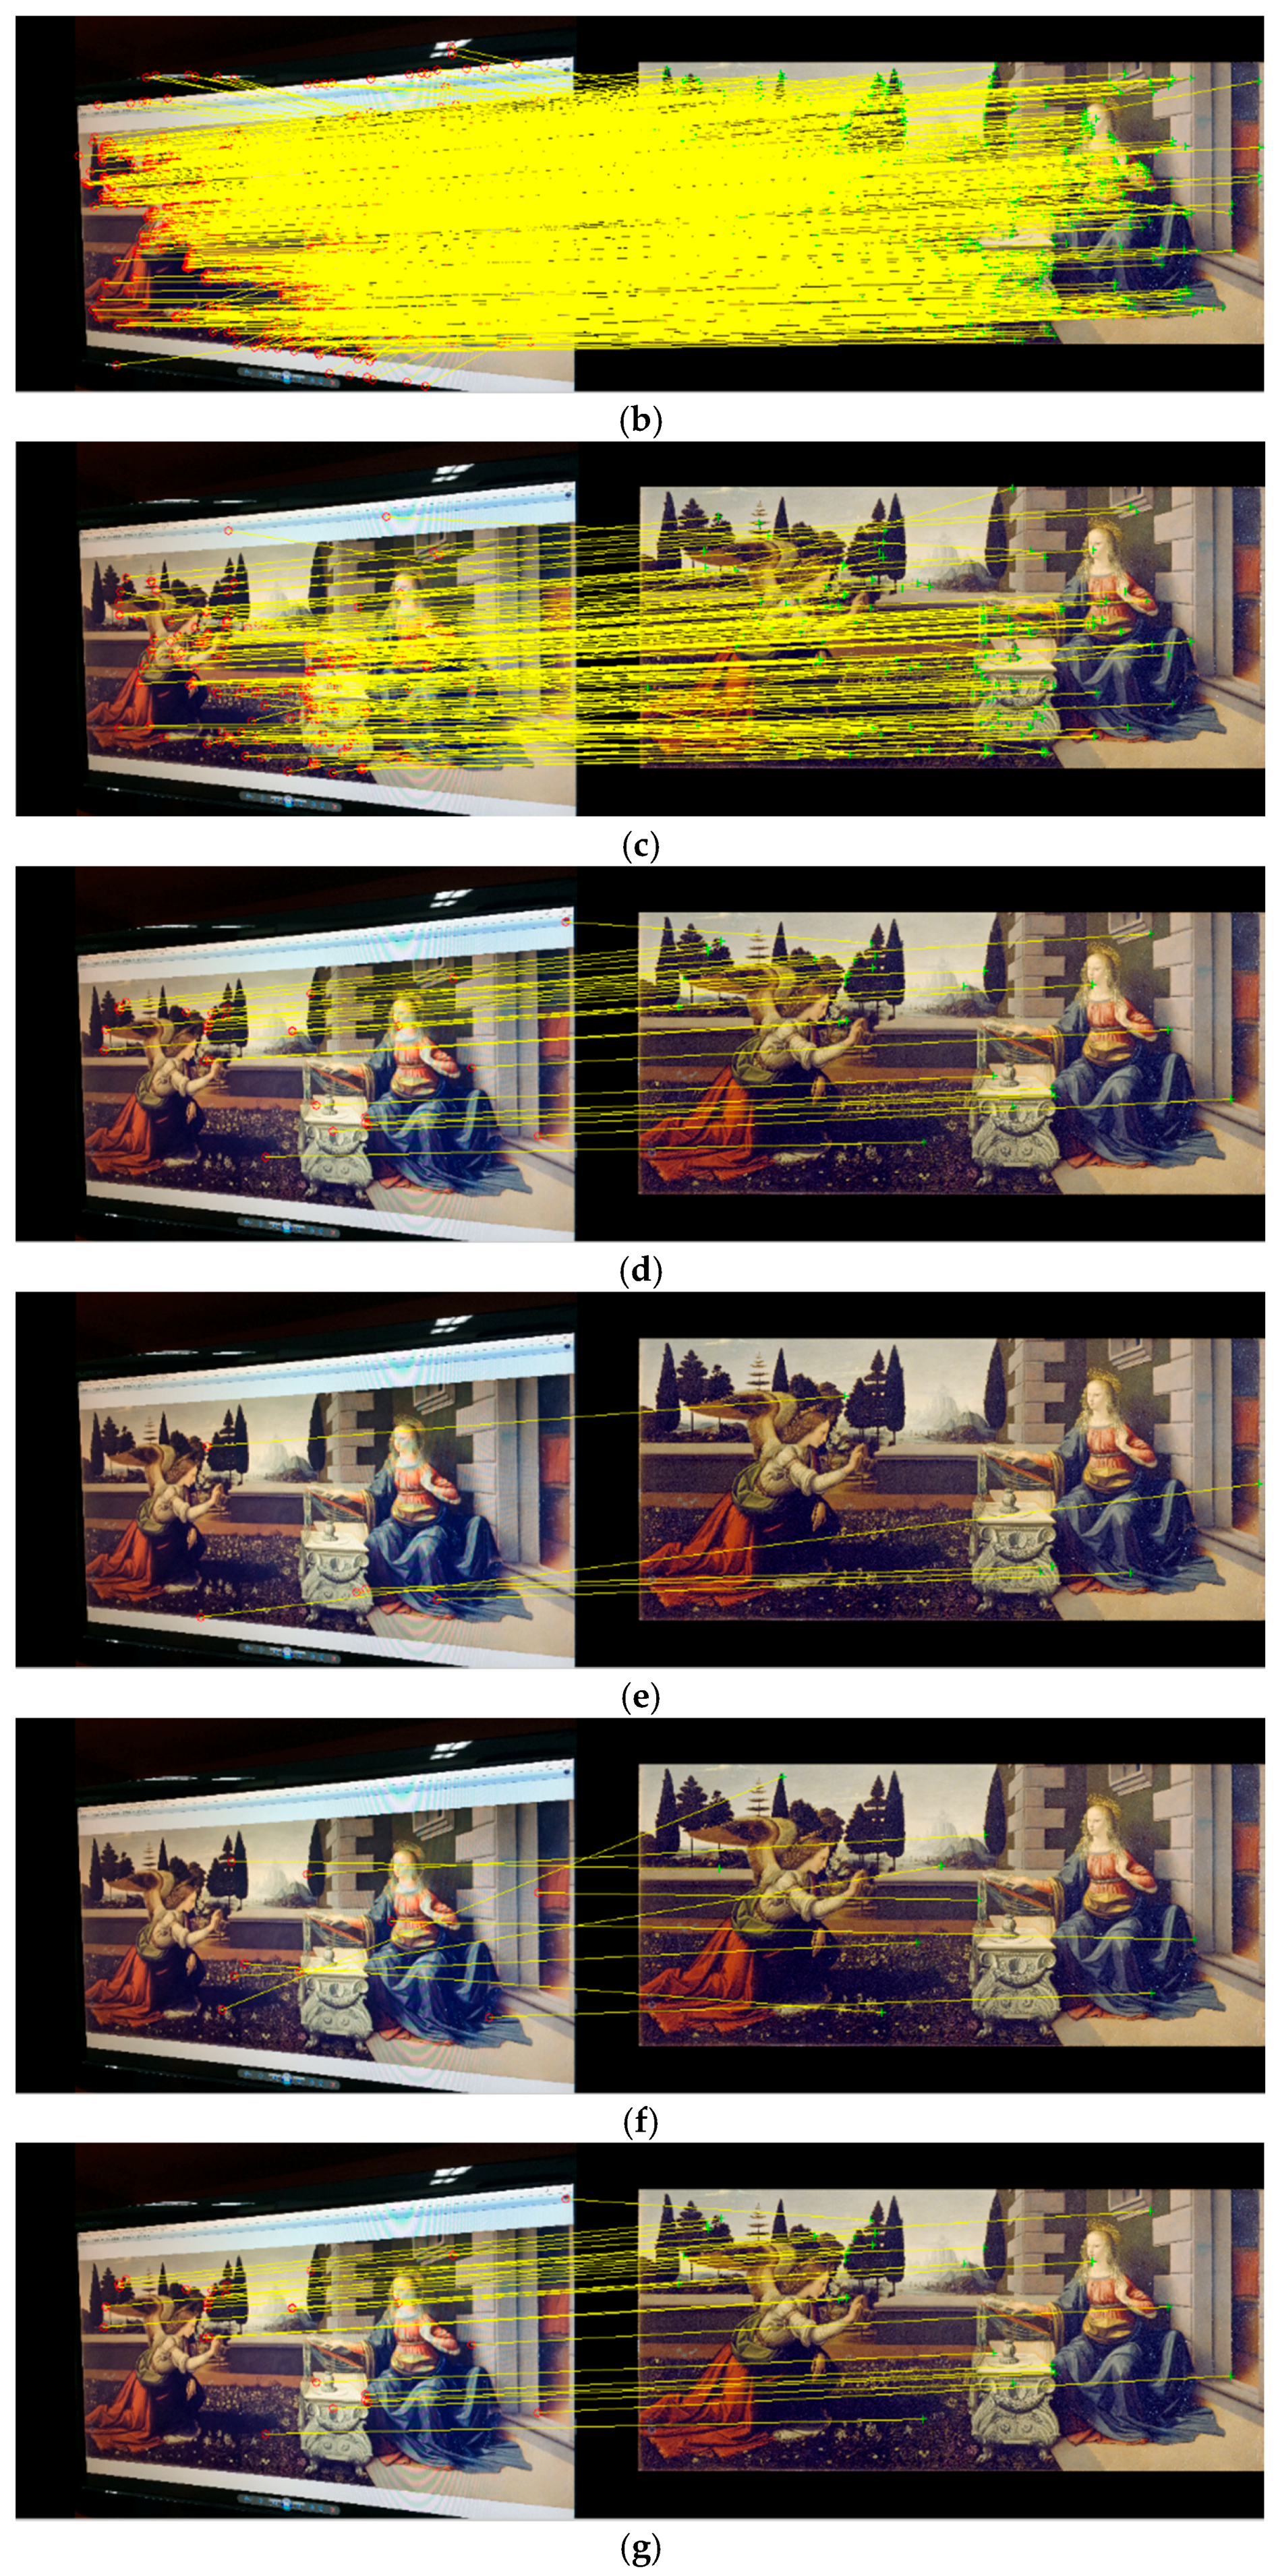
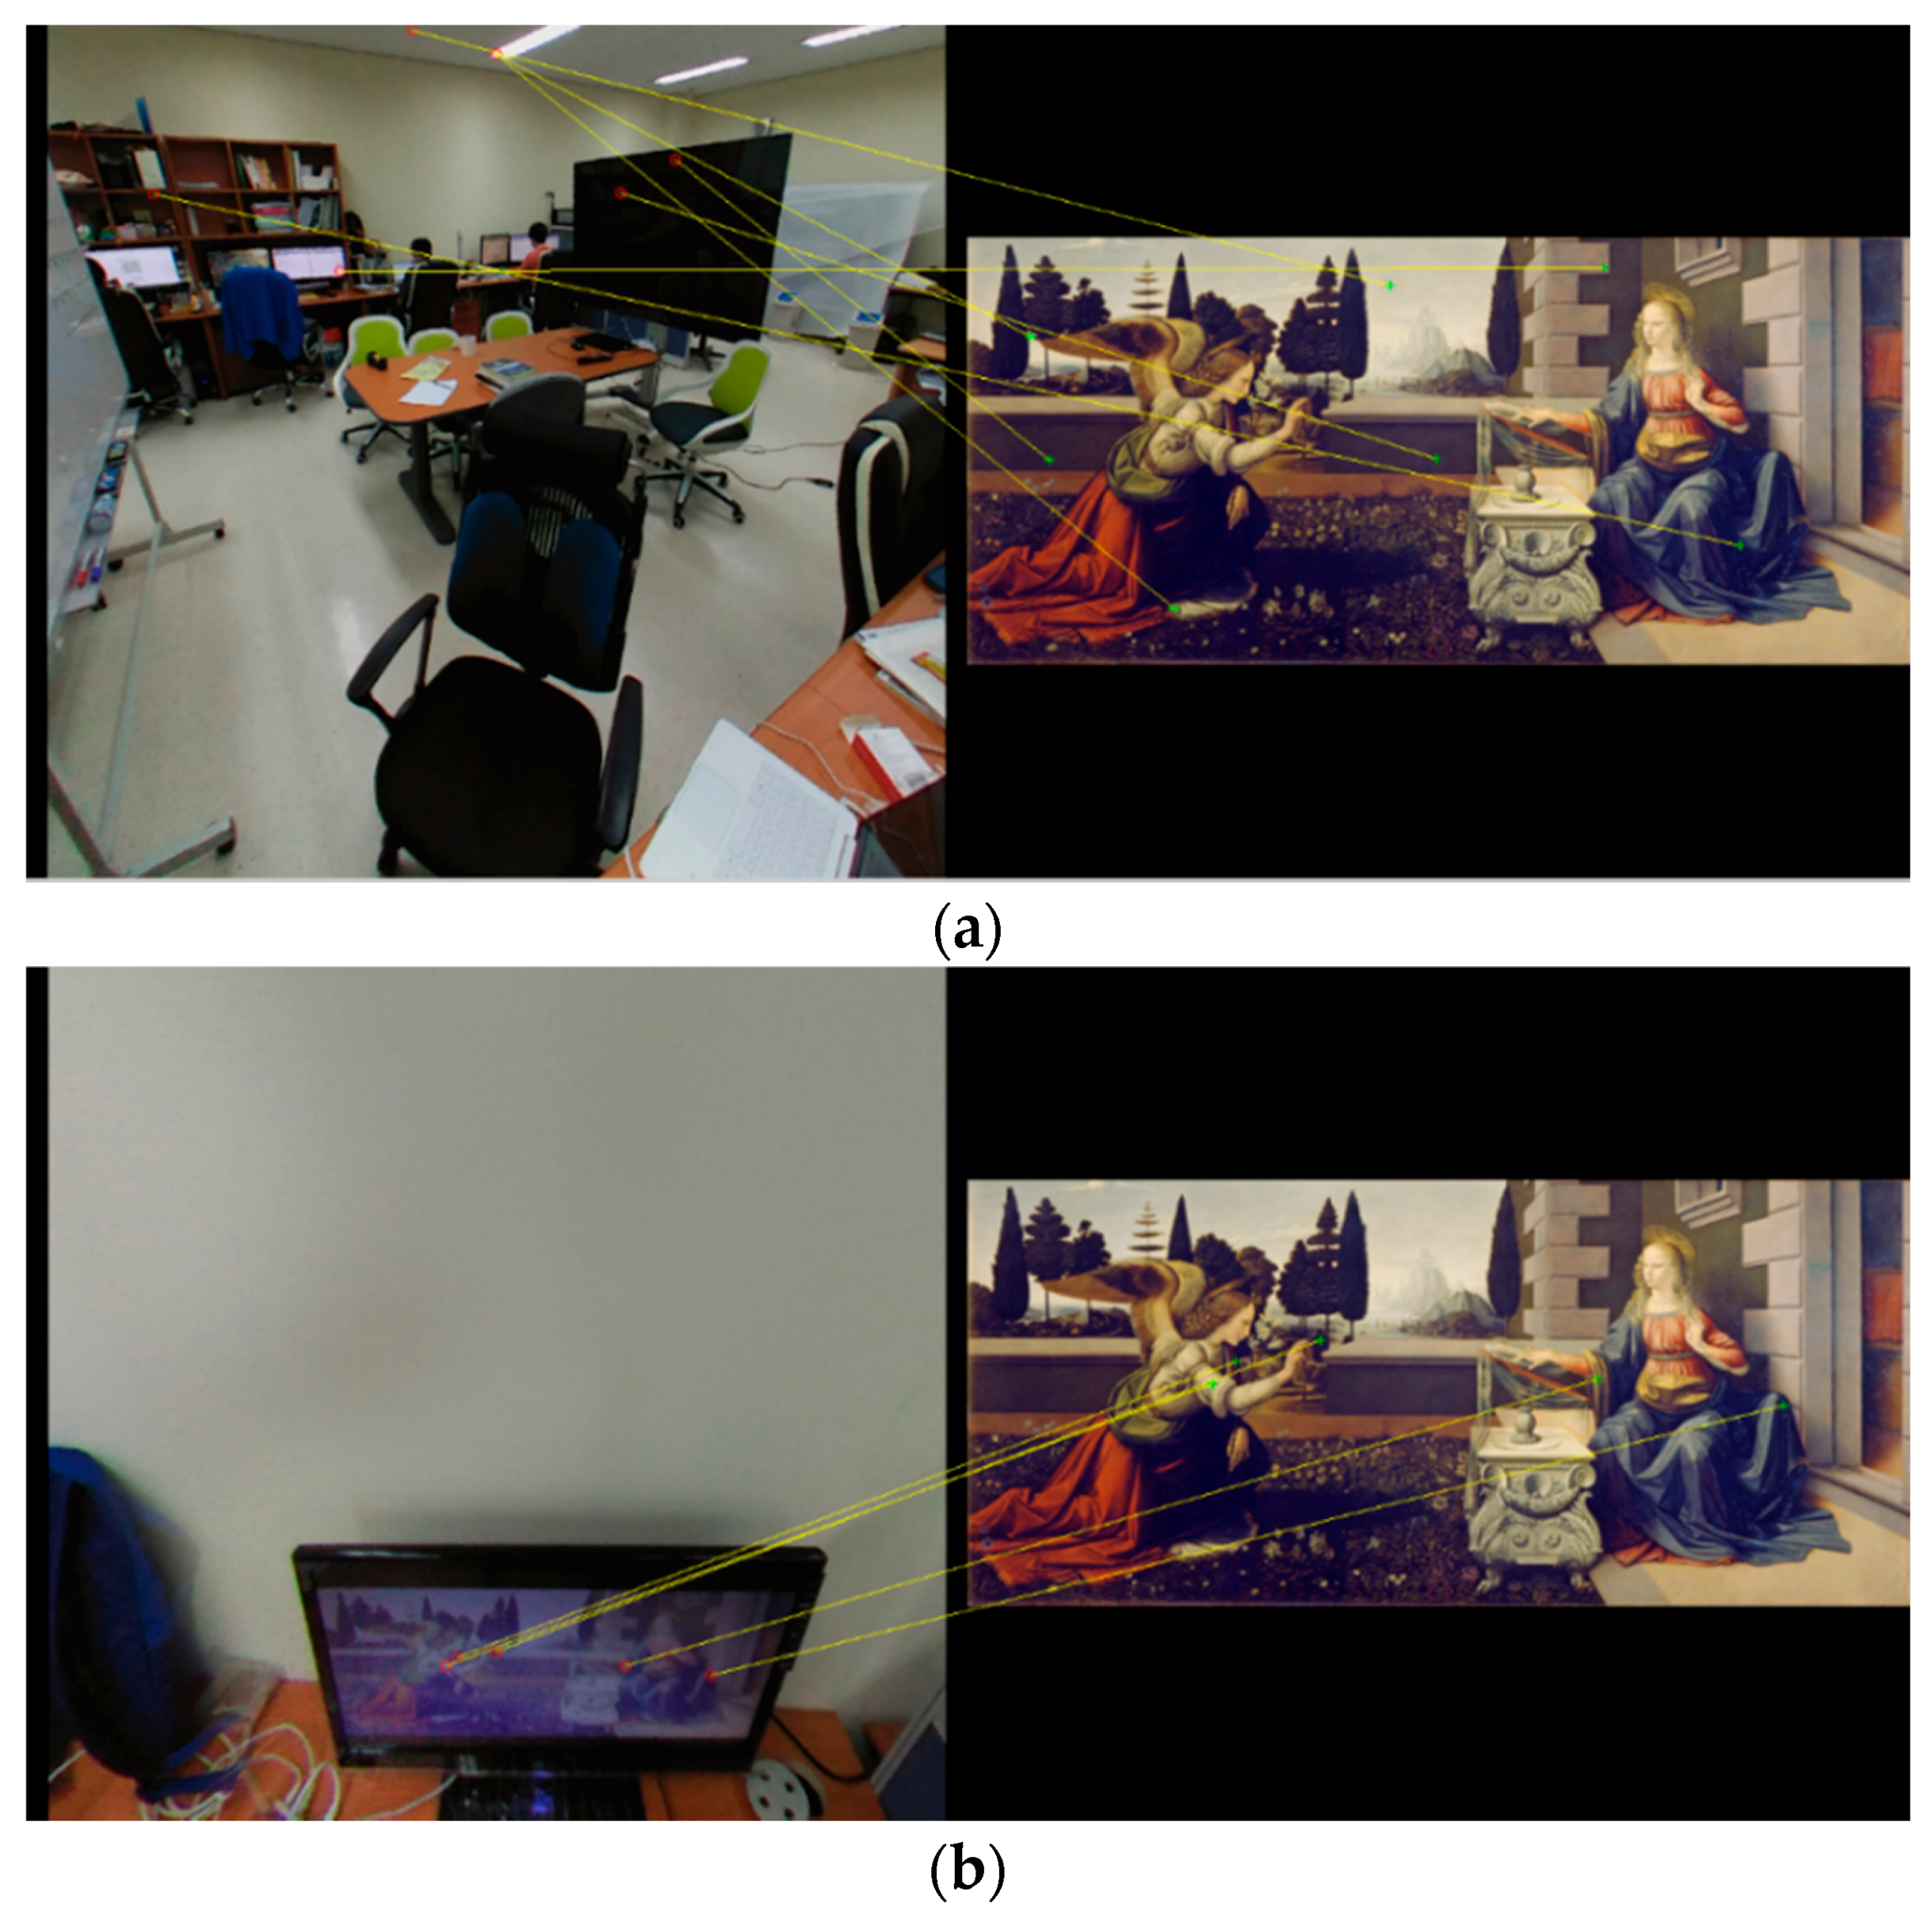
Figure 8b shows a digital image of the original artwork The Annunciation, which has a size of 4057 × 1840. Figure 8a shows an ordinary photograph of the artwork that has a size of 3264 × 2448 and was taken from a 23-inch monitor. Figure 9a–g show the matched keypoints from the SIFT, SURF, MSER, BRISK, FAST, HOG, and FREAK descriptors. For the HOG and FREAK descriptors, the keypoints were detected using the FAST and BRISK methods. The features are well matched because they were extracted from common pictures that are not affected by stitching and projection. In the experimental results section, we show the matched results with 360-degree images.
Digital images of artworks have several sizes, most of which are very large. Thus, too many keypoints will be extracted, increasing the size of the feature data. In addition, the matching results will be poor when there is a large difference between the sizes of two matched objects. Therefore, before extracting features from original artwork, we normalize the sizes of the original artwork images to half the size of a rectilinear projected image to accelerate the feature extraction and matching and decrease the size of the feature data.

6. Differences in the Shapes of the Keypoints

Although the distortion in the 360-degree image is significantly reduced by using the polyhedron-based rectilinear projection, it is apparent in the transformed image and may result in false matches after matching the keypoints. When the image for matching is seriously distorted, there will be more false matches. Accordingly, the shorter the distance between the artwork and a pole, the more false matches will occur. With the DSK, we can further reduce the influence of decreasing the identification precision.
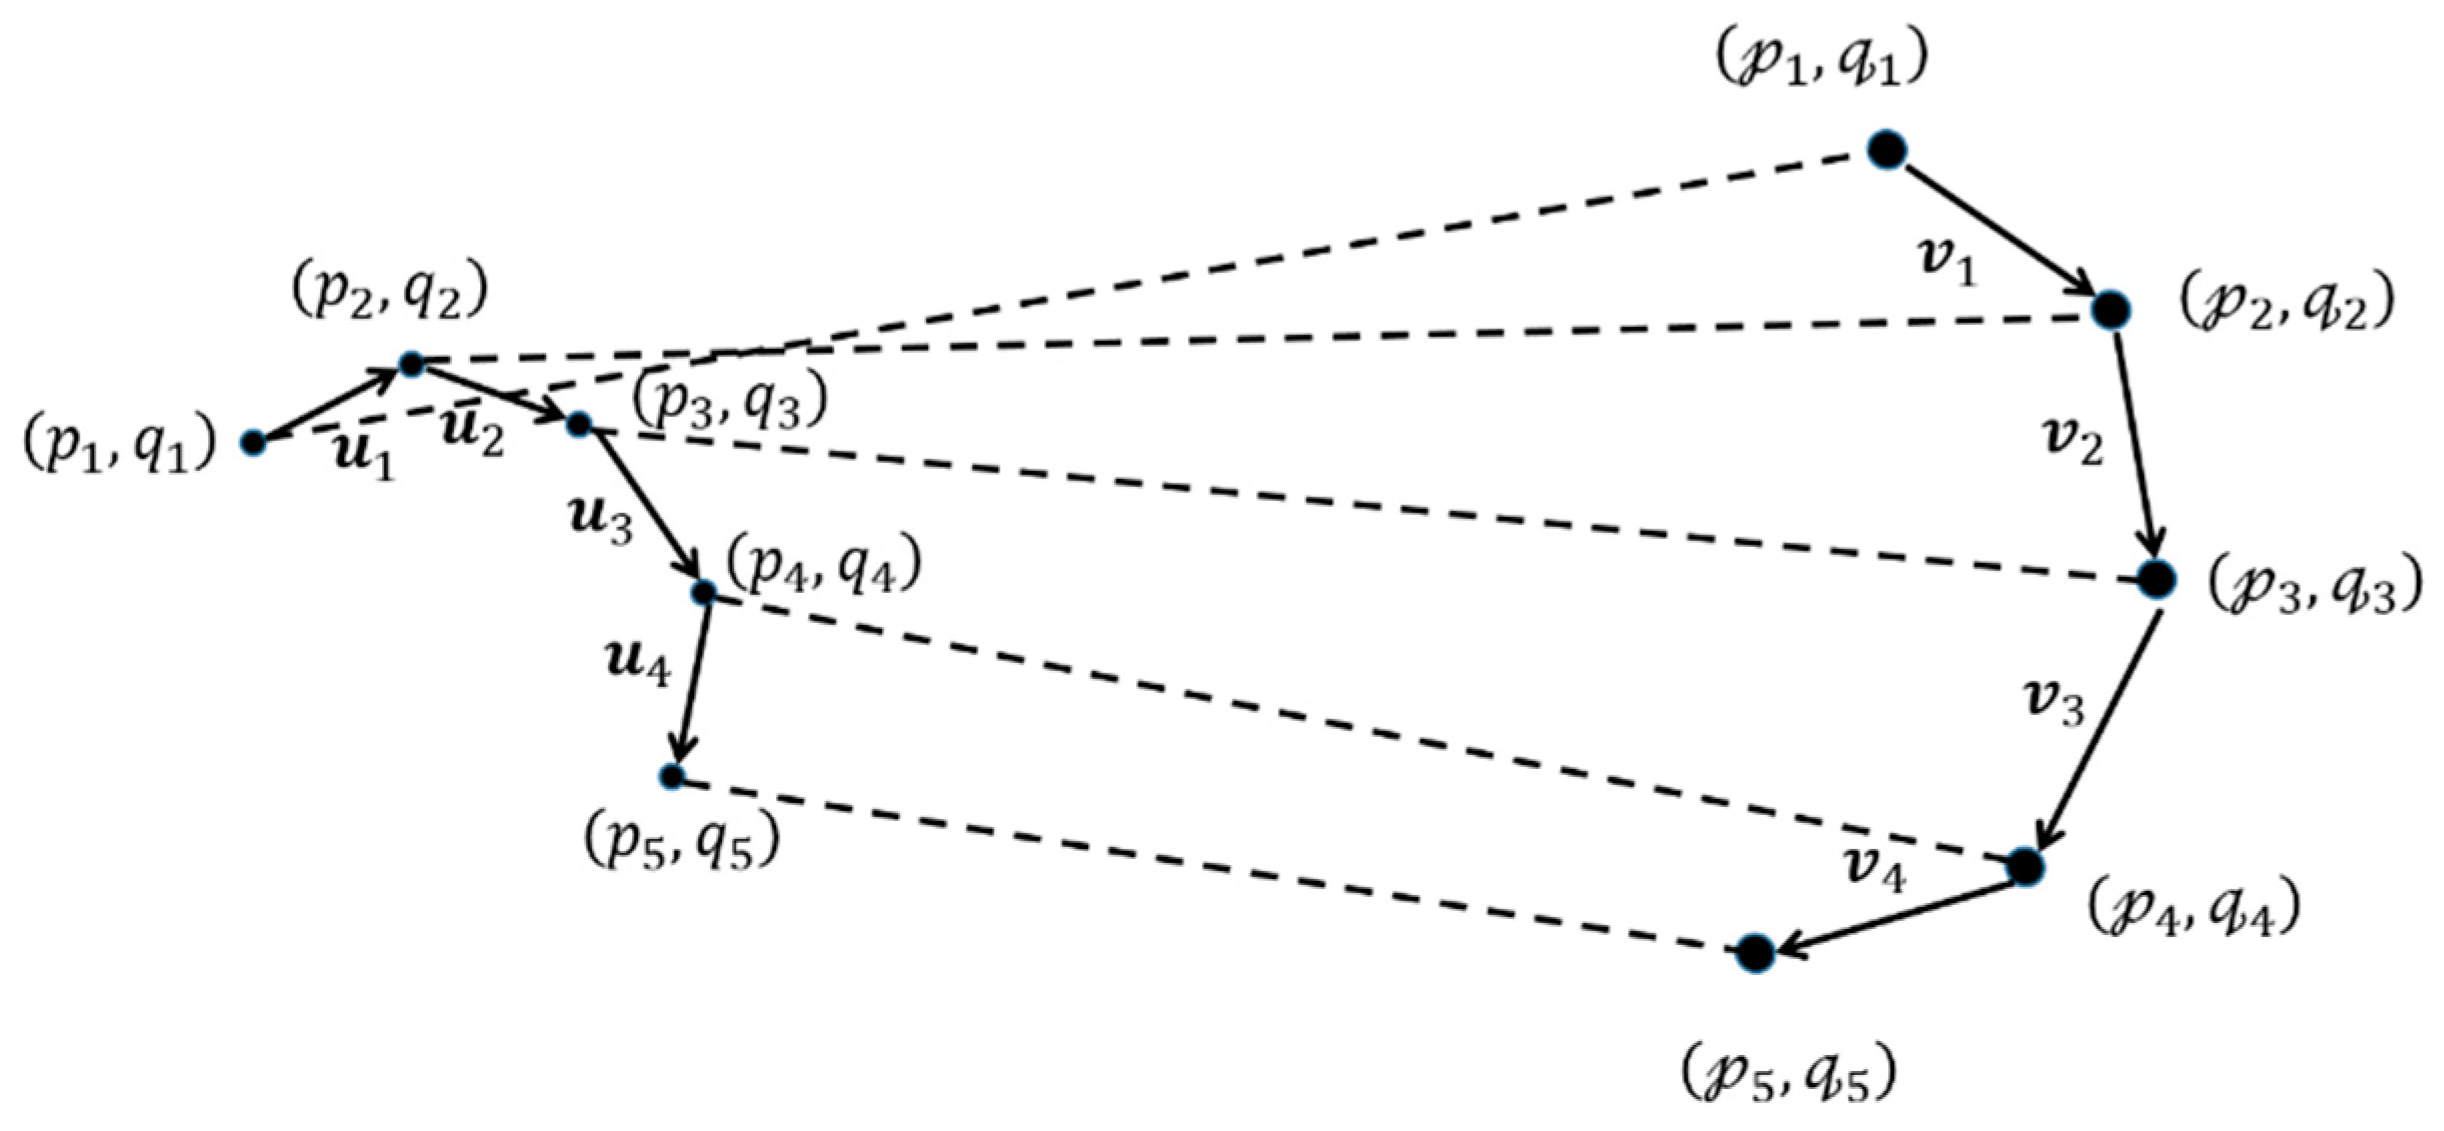
This strategy uses a simple and practical method. The shape of keypoints is represented by the proportion of vector norms for the connected keypoints. First, the coordinates of the m matched keypoints in a normal image of original artwork are defined as, ( Applsci 07 00528 i001), i = 1 ,   2 , , m , and those in the rectilinear projected image are defined as ( p i , q i ) . Each pair of keypoints with the same index constitutes the matched two keypoints, such as ( Applsci 07 00528 i002) and ( p 1 , q 1 ) . The keypoints are connected one by one in ascending order of m as shown in Figure 10. Then, for each group of keypoints, m 1 vectors are generated to represent the keypoint’s shape.
The figure shows that the global shapes for the two groups of keypoints are similar, but there are differences in the sizes and orientations of the shapes. For local shapes, the lengths and orientations of the two vectors of the matched keypoints are different, such as those for v 1 and u 1 . However, the proportions of the ( i + 1 ) th and the i th vector norms for the two groups are close. Thus, we further change the representative shape to the proportion P of the Euclidean norm. For example, the P v for the normalized image is defined as follows:
P v = v 2 2 v 1 2 , v 3 2 v 2 2 , , v m 1 2 v m 2 2
The difference d s k between P v and P u measures the similarity between the two shapes as follows:
d s k = | P v P u | m 1
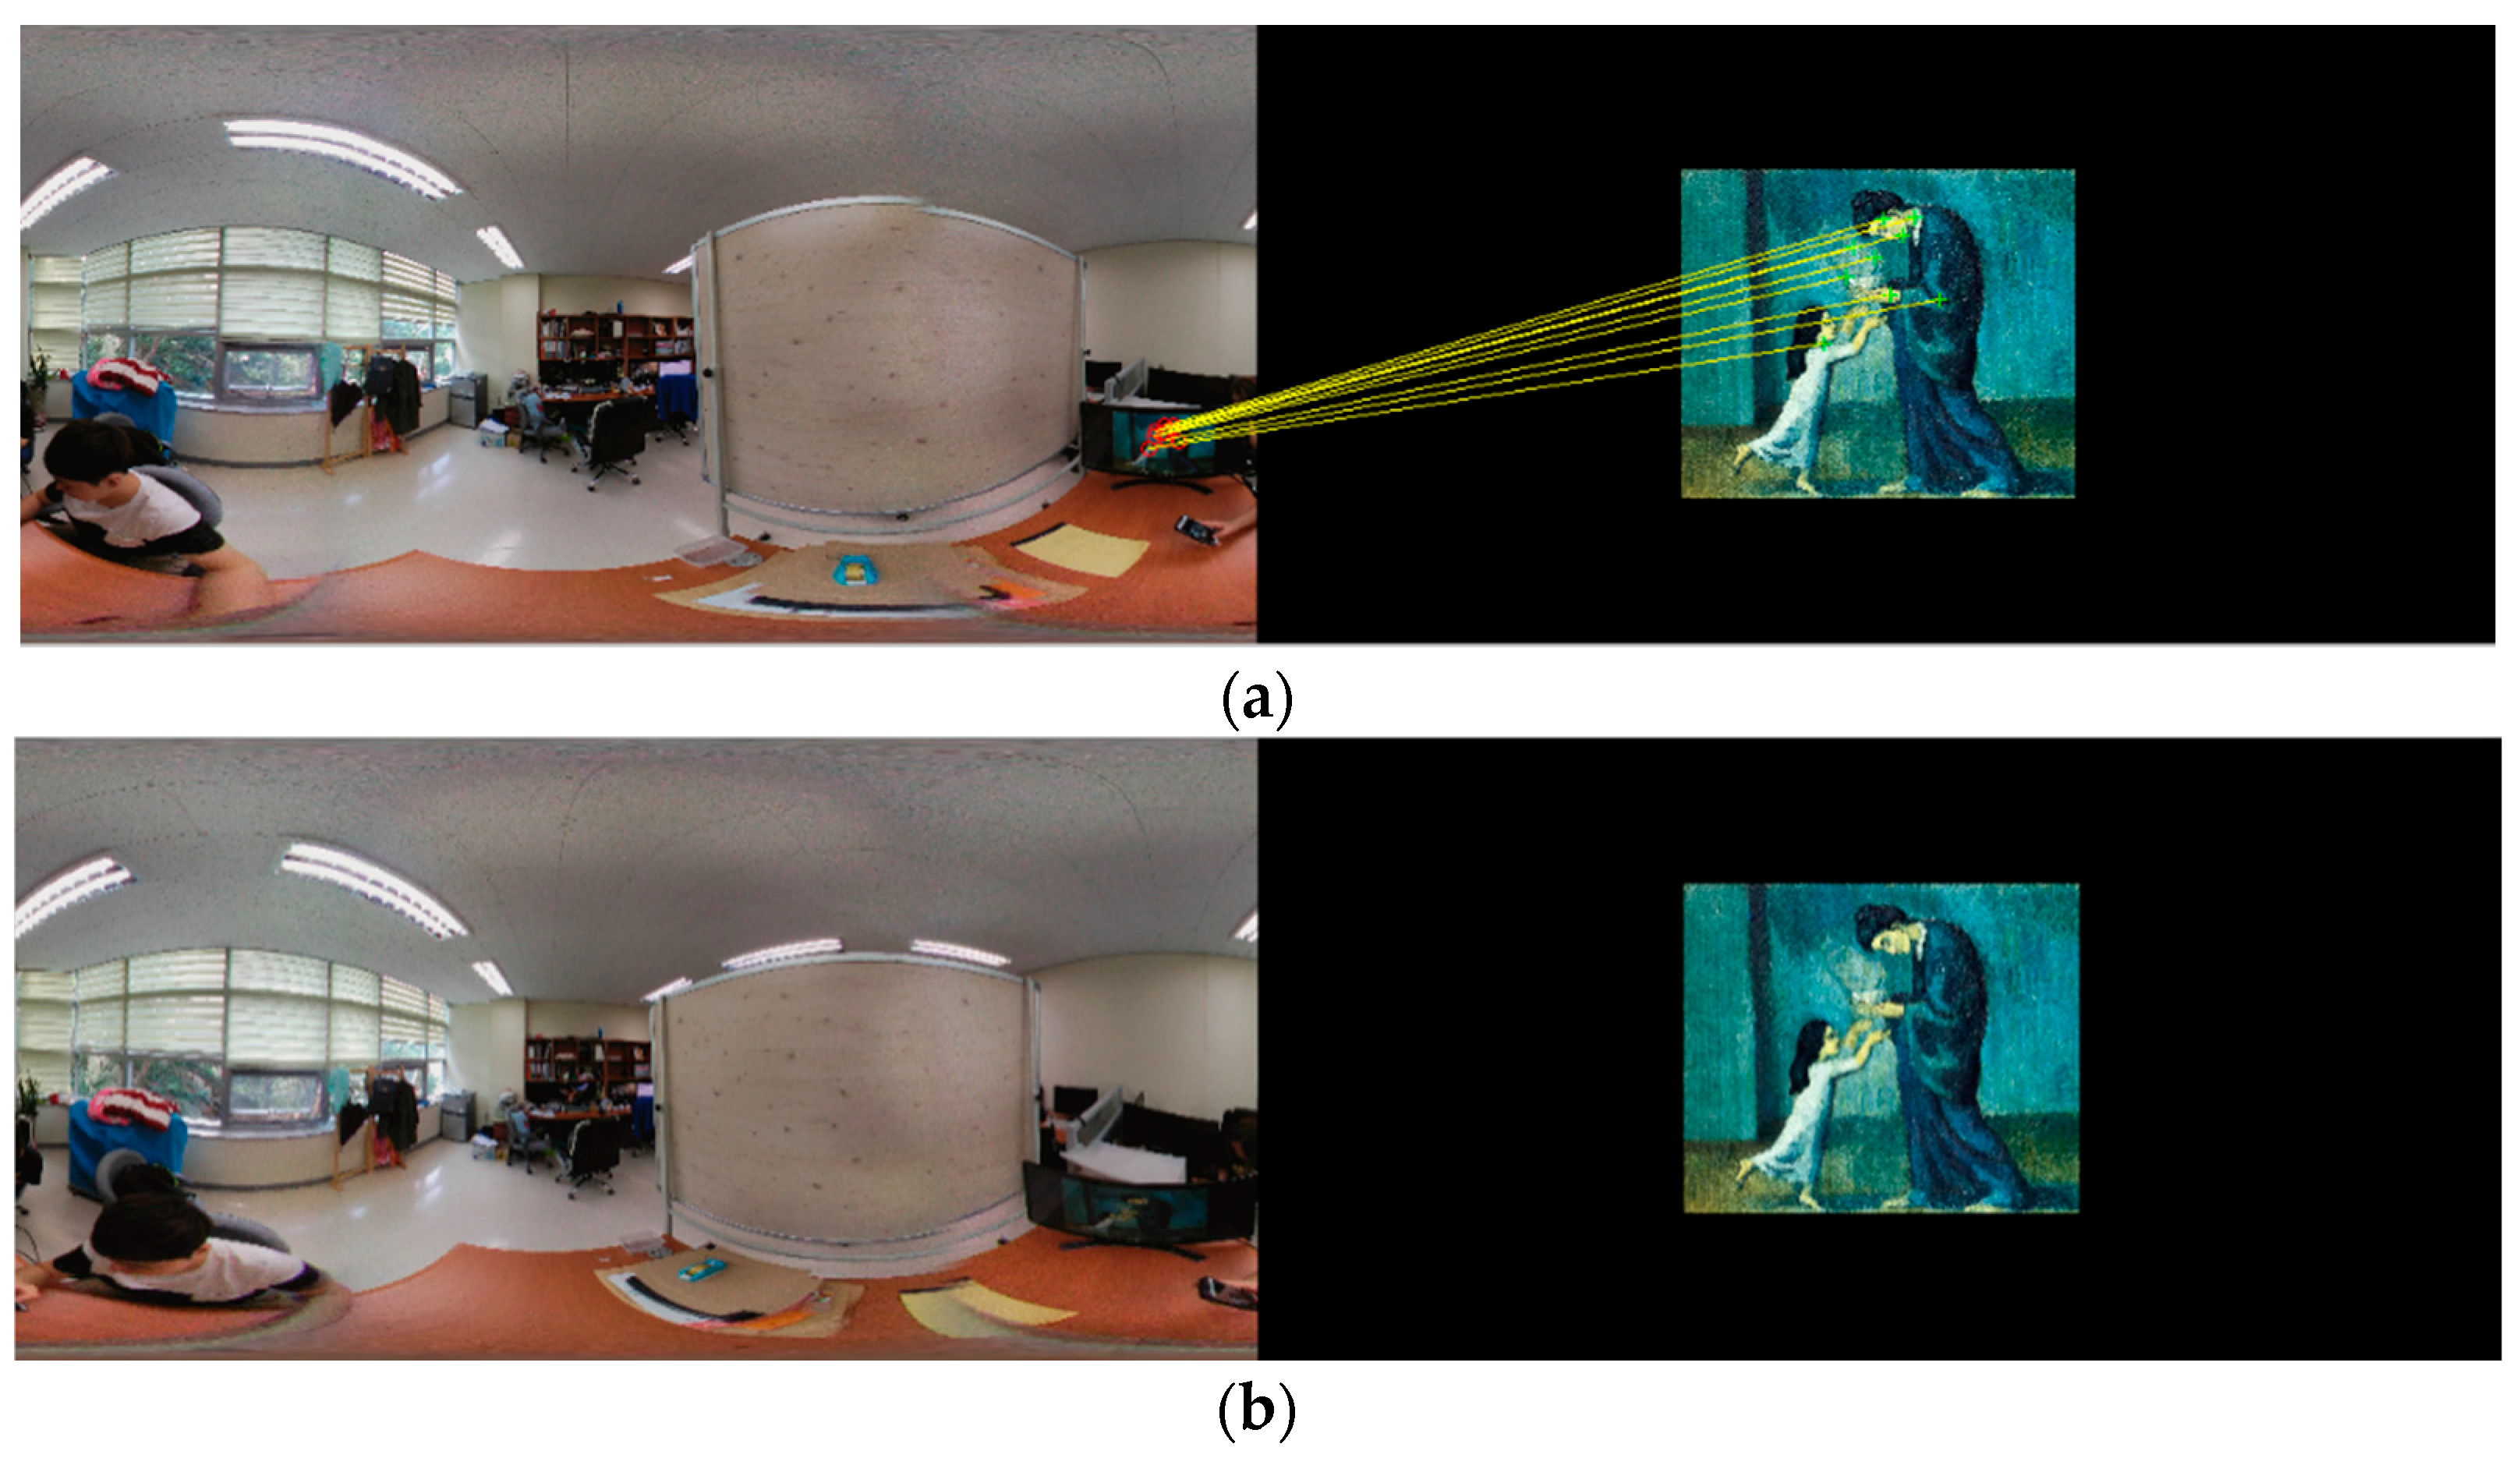
The lower the d s k , the more similar the two shapes, which indicates that the matching result is more accurate. Figure 11a provides an example of false matched keypoints using the SIFT. The keypoints for the original artwork of the right image are matched to those from irrelevant objects inside the left 360-degree image. Figure 11b shows the matching results for the same artwork. However, the number of matched keypoints for Figure 11a is larger than for Figure 11b. As mentioned in [10], the success of recognition often depends on the number of matched keypoints, not the percentage of matching. Based on this theory, identification in this example will fail. However, the DSK for Figure 11a is 0.8681 and Figure 11b is 0.0046. Therefore, we can determine the false matching rates with the DSK.

7. Performance Evaluation

This section evaluates the performance of the proposed methods and compares experimental results from before and after using the proposed methods. We conducted two major experiments. The first experiment compared the matched features of the artwork. The second compared identification precision for the artwork. First, we introduce the experimental data, platform, and materials. Second, we show and discuss the experimental results.

7.1. Experimental Data and Platform

We collected 20 digital images of famous artwork from Wikipedia. The images were downloaded in JPG format with original image sizes that are shown in Table 1. Most of the images were very large. To measure the effects of artwork size in 360-degree images on artwork identification, we displayed the artwork on three LG monitors of different sizes before photographing the artwork images. The monitor sizes were 79, 32, and 23 inches. The largest monitor was mounted on a stand that was 800 mm high. The other two monitors were on a desk that was 750 mm high. The 360-degree panoramic photos were captured with an LG 360 CAM that had dual wide-angle cameras. We used a smartphone application called the 360 CAM Manager to connect to the camera and capture the 360-degree panoramic photos. The application automatically stitches the photos and creates a 360-degree image that has a size of 5660 × 2830 (72 DPI).
As discussed in the previous section, the shorter the distance between the artwork and a pole, the more false matches will occur. Thus, to measure the effects of the 360-degree image artwork position on artwork identification, we mounted the camera at three different heights to capture the artwork in 360-degree images in three different positions. The artwork positions appear to be moving toward to the South Pole and away from the Equator. The first position was close to the Equator. The second position was shifted toward the south. The third position was close to the South Pole. The feature extraction and matching procedures were performed on a computer that had i7 3.6 GHz CPU, 16 GB RAM, and a Windows 10 64 bit OS.

7.2. Experimental Results

An experiment to compare the matched features of artwork was conducted with the following goals: (1) to evaluate the relation between the artwork size in the 360-degree image and the matched results; (2) to evaluate the relation between the position of the artwork in the 360-degree image and the matched results; and (3) to determine whether the proposed method improves the matched results.
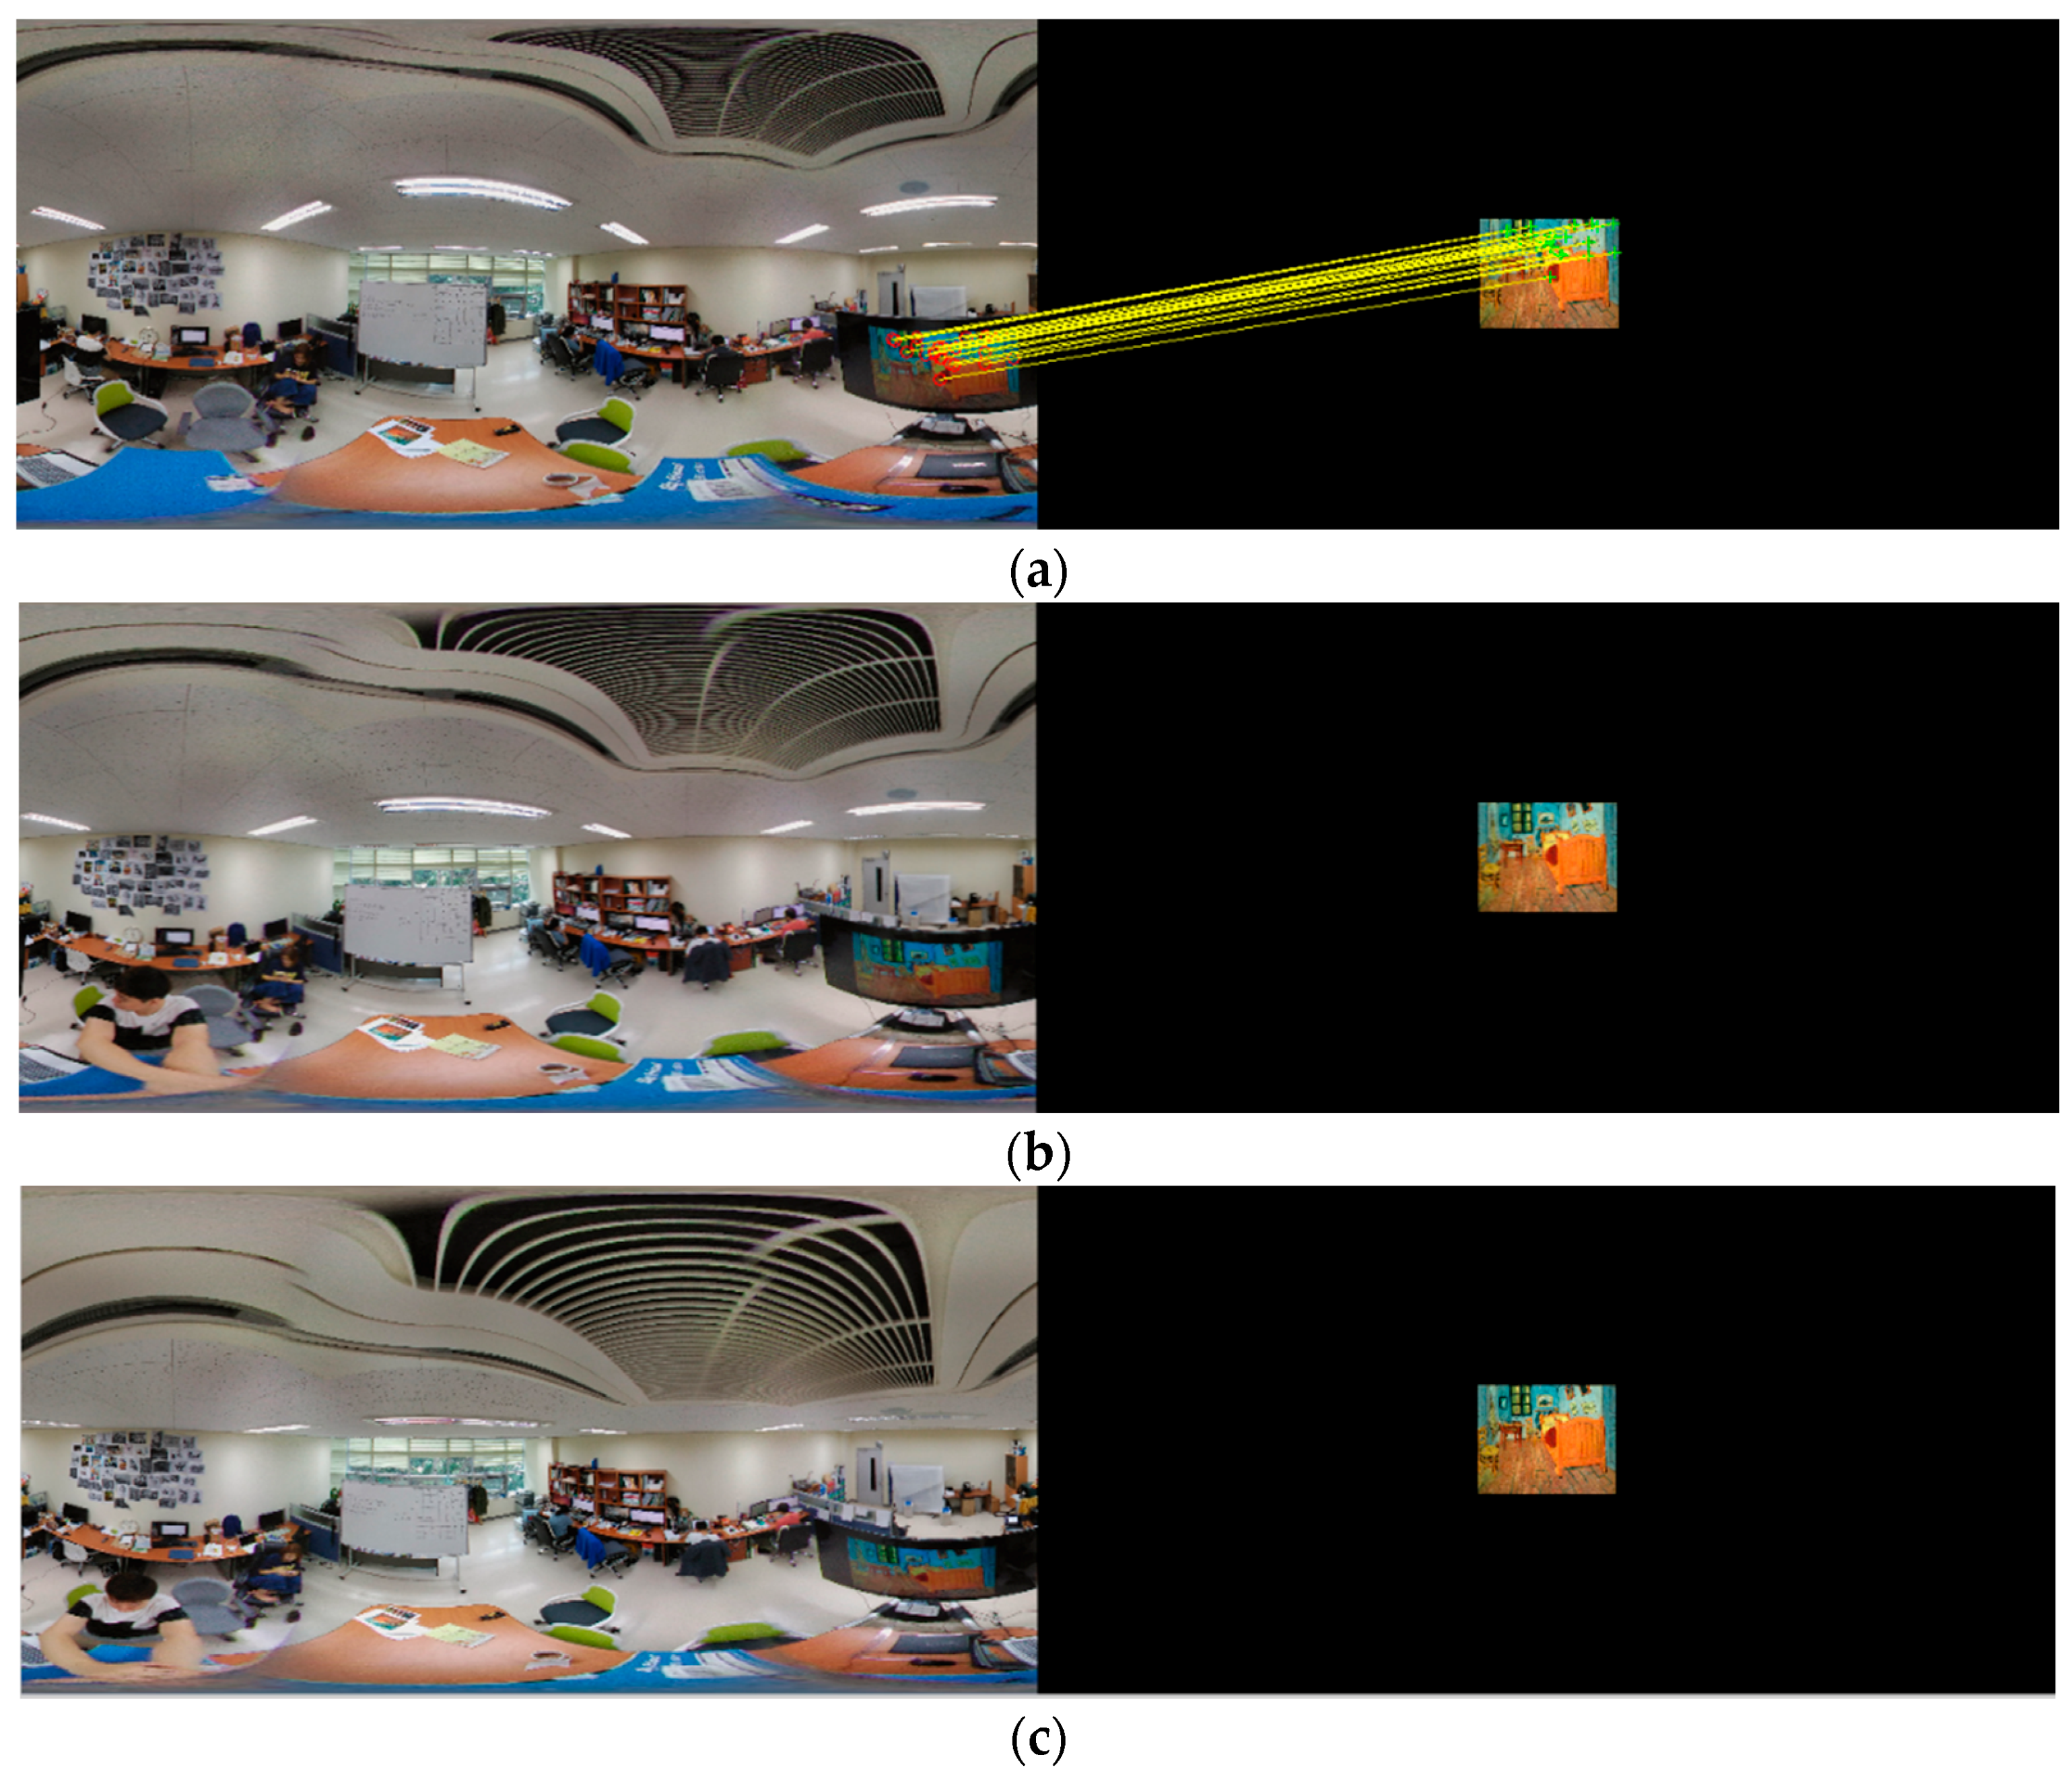
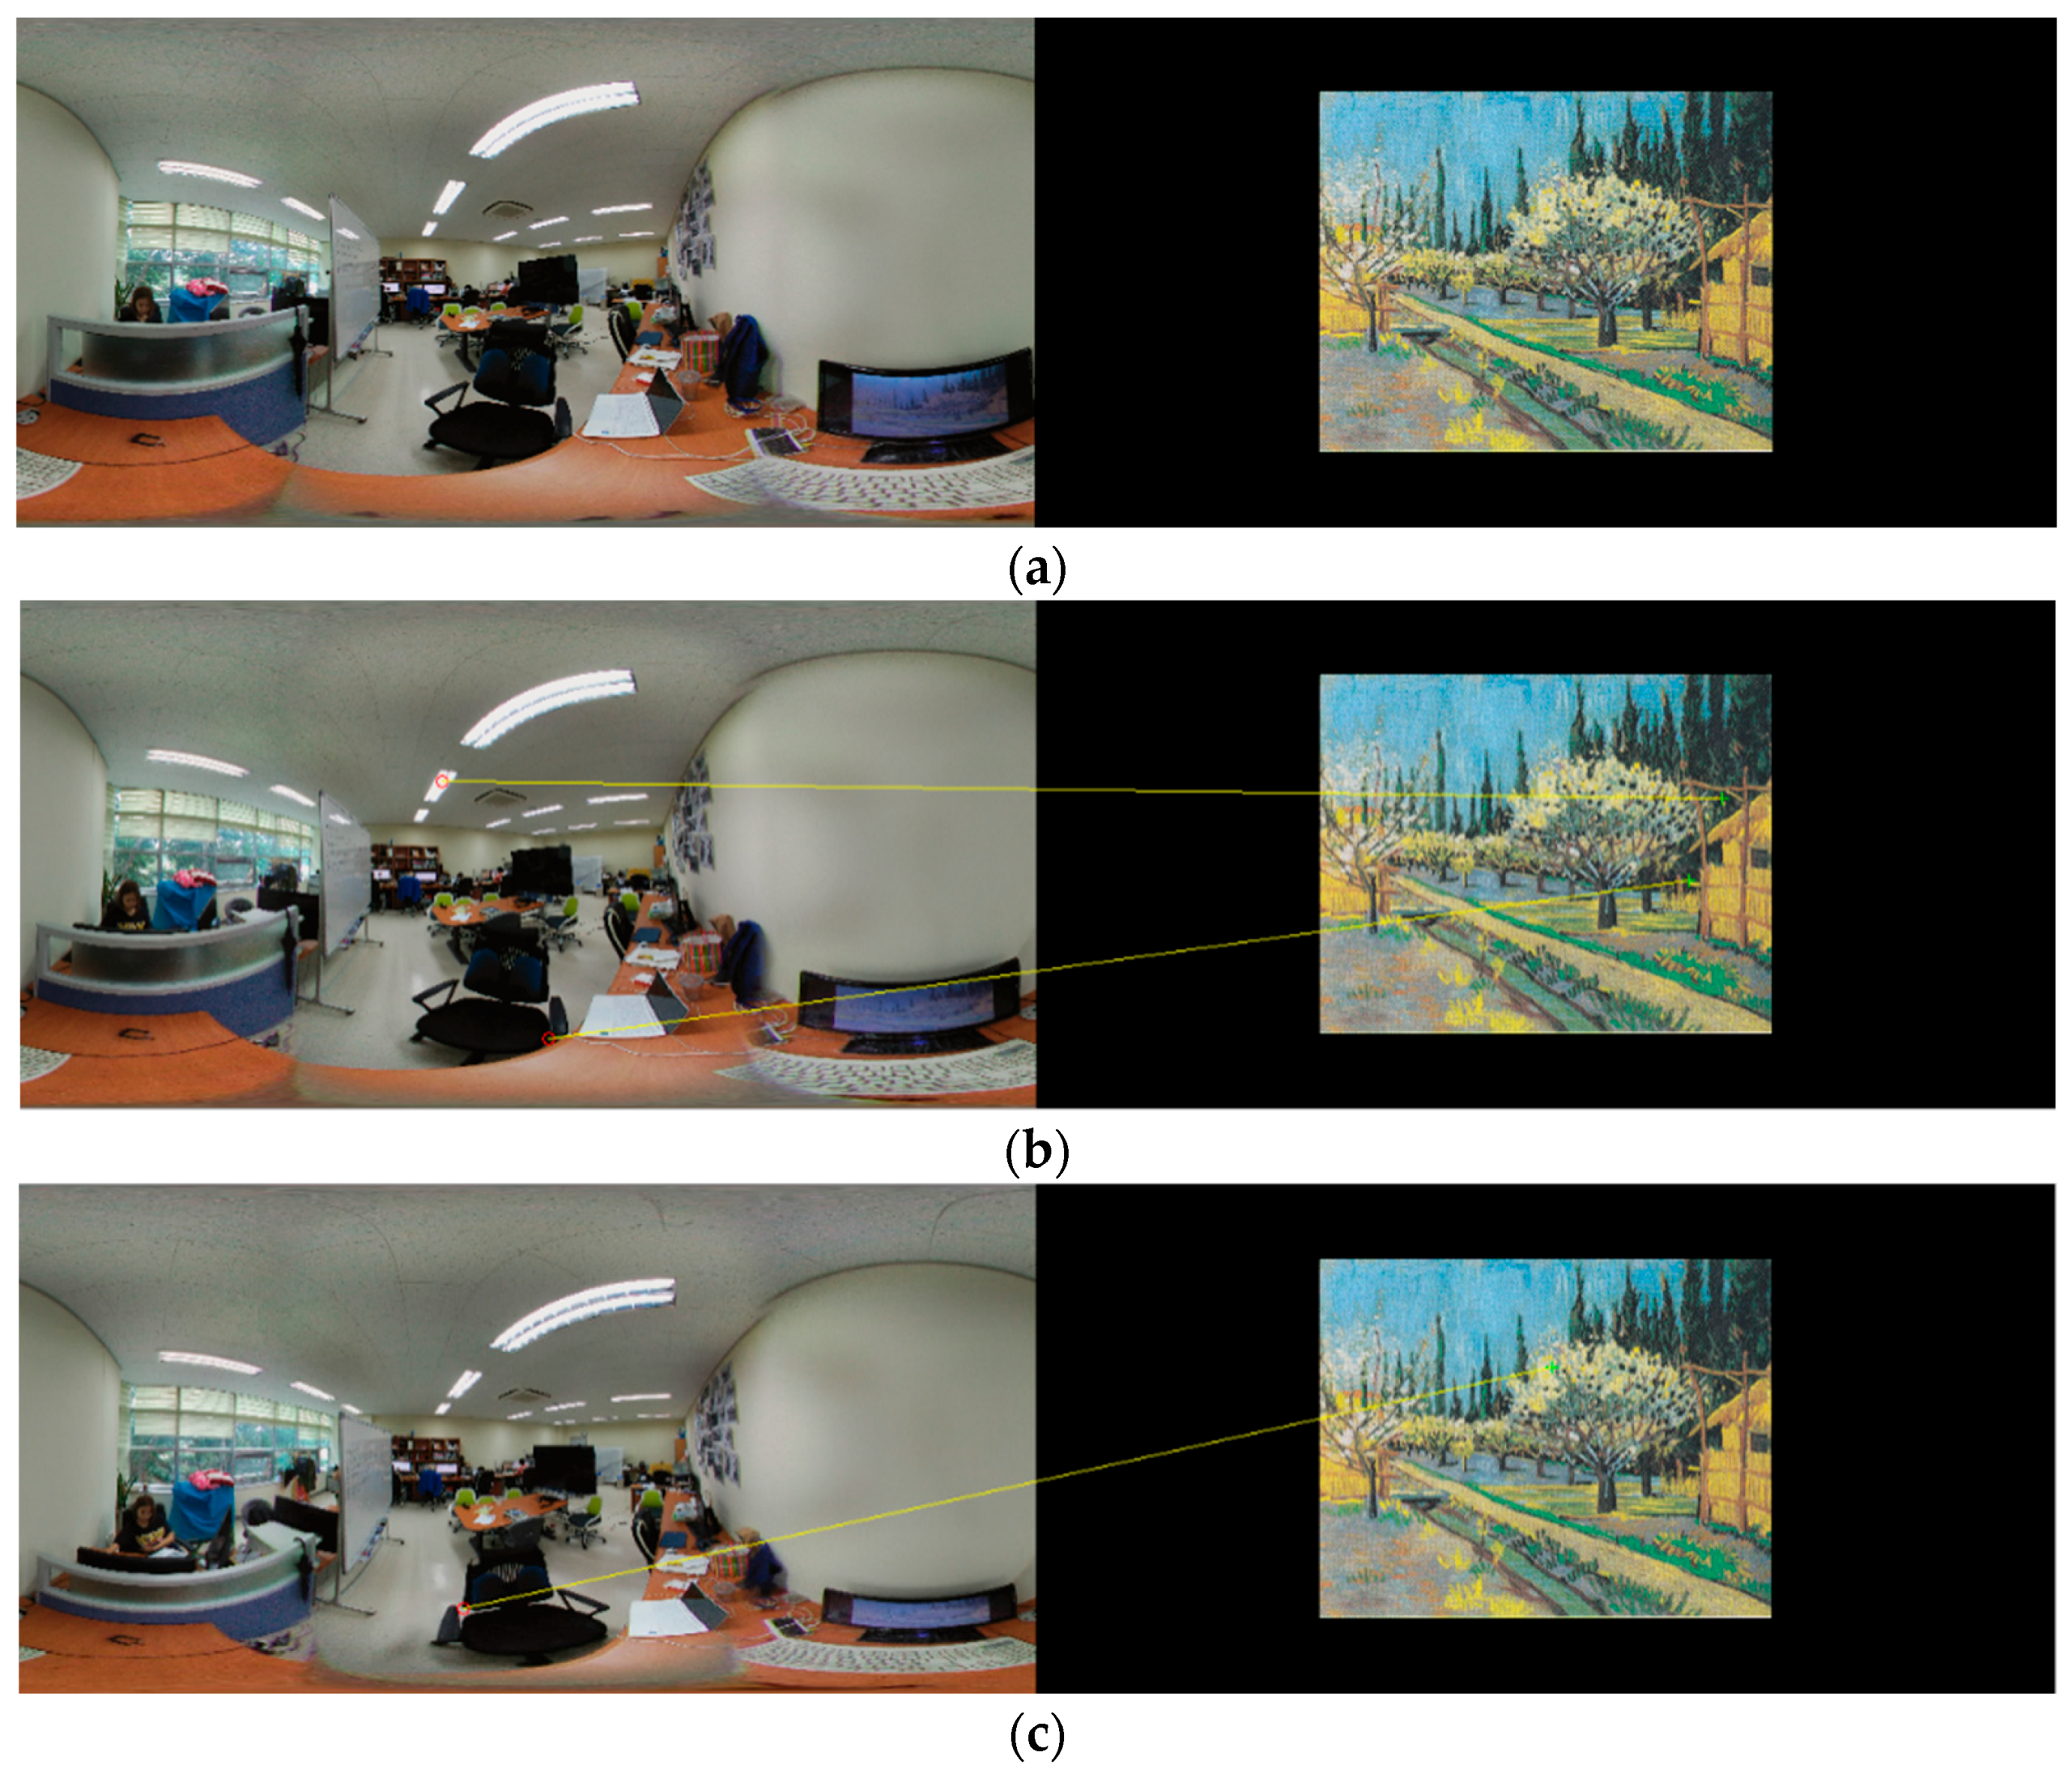
Of the experimental results from the feature matching, we only show the matched results from the SIFT, instead of reporting the results from all types of features. Figure 12a–c show the matched results between three 360-degree images and the artwork Bedroom in Arles. In the three 360-degree images on the left, the same artwork is displayed on the 79-inch monitor and was captured in the three different positions. We connected the matched features with yellow lines. In Figure 12a, the artwork is well matched, because it is large in size and close to the Equator. In Figure 12b, the camera is mounted higher and the monitor is shifted towards south, which increases the distortion. As a result, there are no matched features. In Figure 12c, the monitor is shifted further away from the Equator. The artwork is more seriously distorted and there are no matched features. The three matched results indicate that even though the artwork size is large, it cannot be recognized when it is not close to the Equator.
Figure 13a–c show matched results for the artwork The Soup. The artwork is displayed on the 32-inch monitor. Thus, the artwork size is substantially decreased. However, the features are well matched, because the artwork is close to the Equator, as shown in Figure 13a. In Figure 13b, the artwork is shifted towards the south, and there are no matched features. In Figure 13c, after shifting the artwork further away from the Equator, there is a false match. These three matched results suggest that the position has a larger effect on 360-degree image feature matching than the size.
Figure 14a–c show the matched results from the artwork Flowering orchard, surrounded by cypress. The artwork is displayed on the 23-inch monitor. The position of the artwork in Figure 14a is a little closer to the South Pole than the position of the artwork in Figure 12a and Figure 13a. There are no matched features. In Figure 14b,c, there are a few false matches after shifting the artwork towards the south. These three matched results suggest that the probability of a false match will increase when the artwork is shifted further away from the Equator, because there is an increase in distortion.
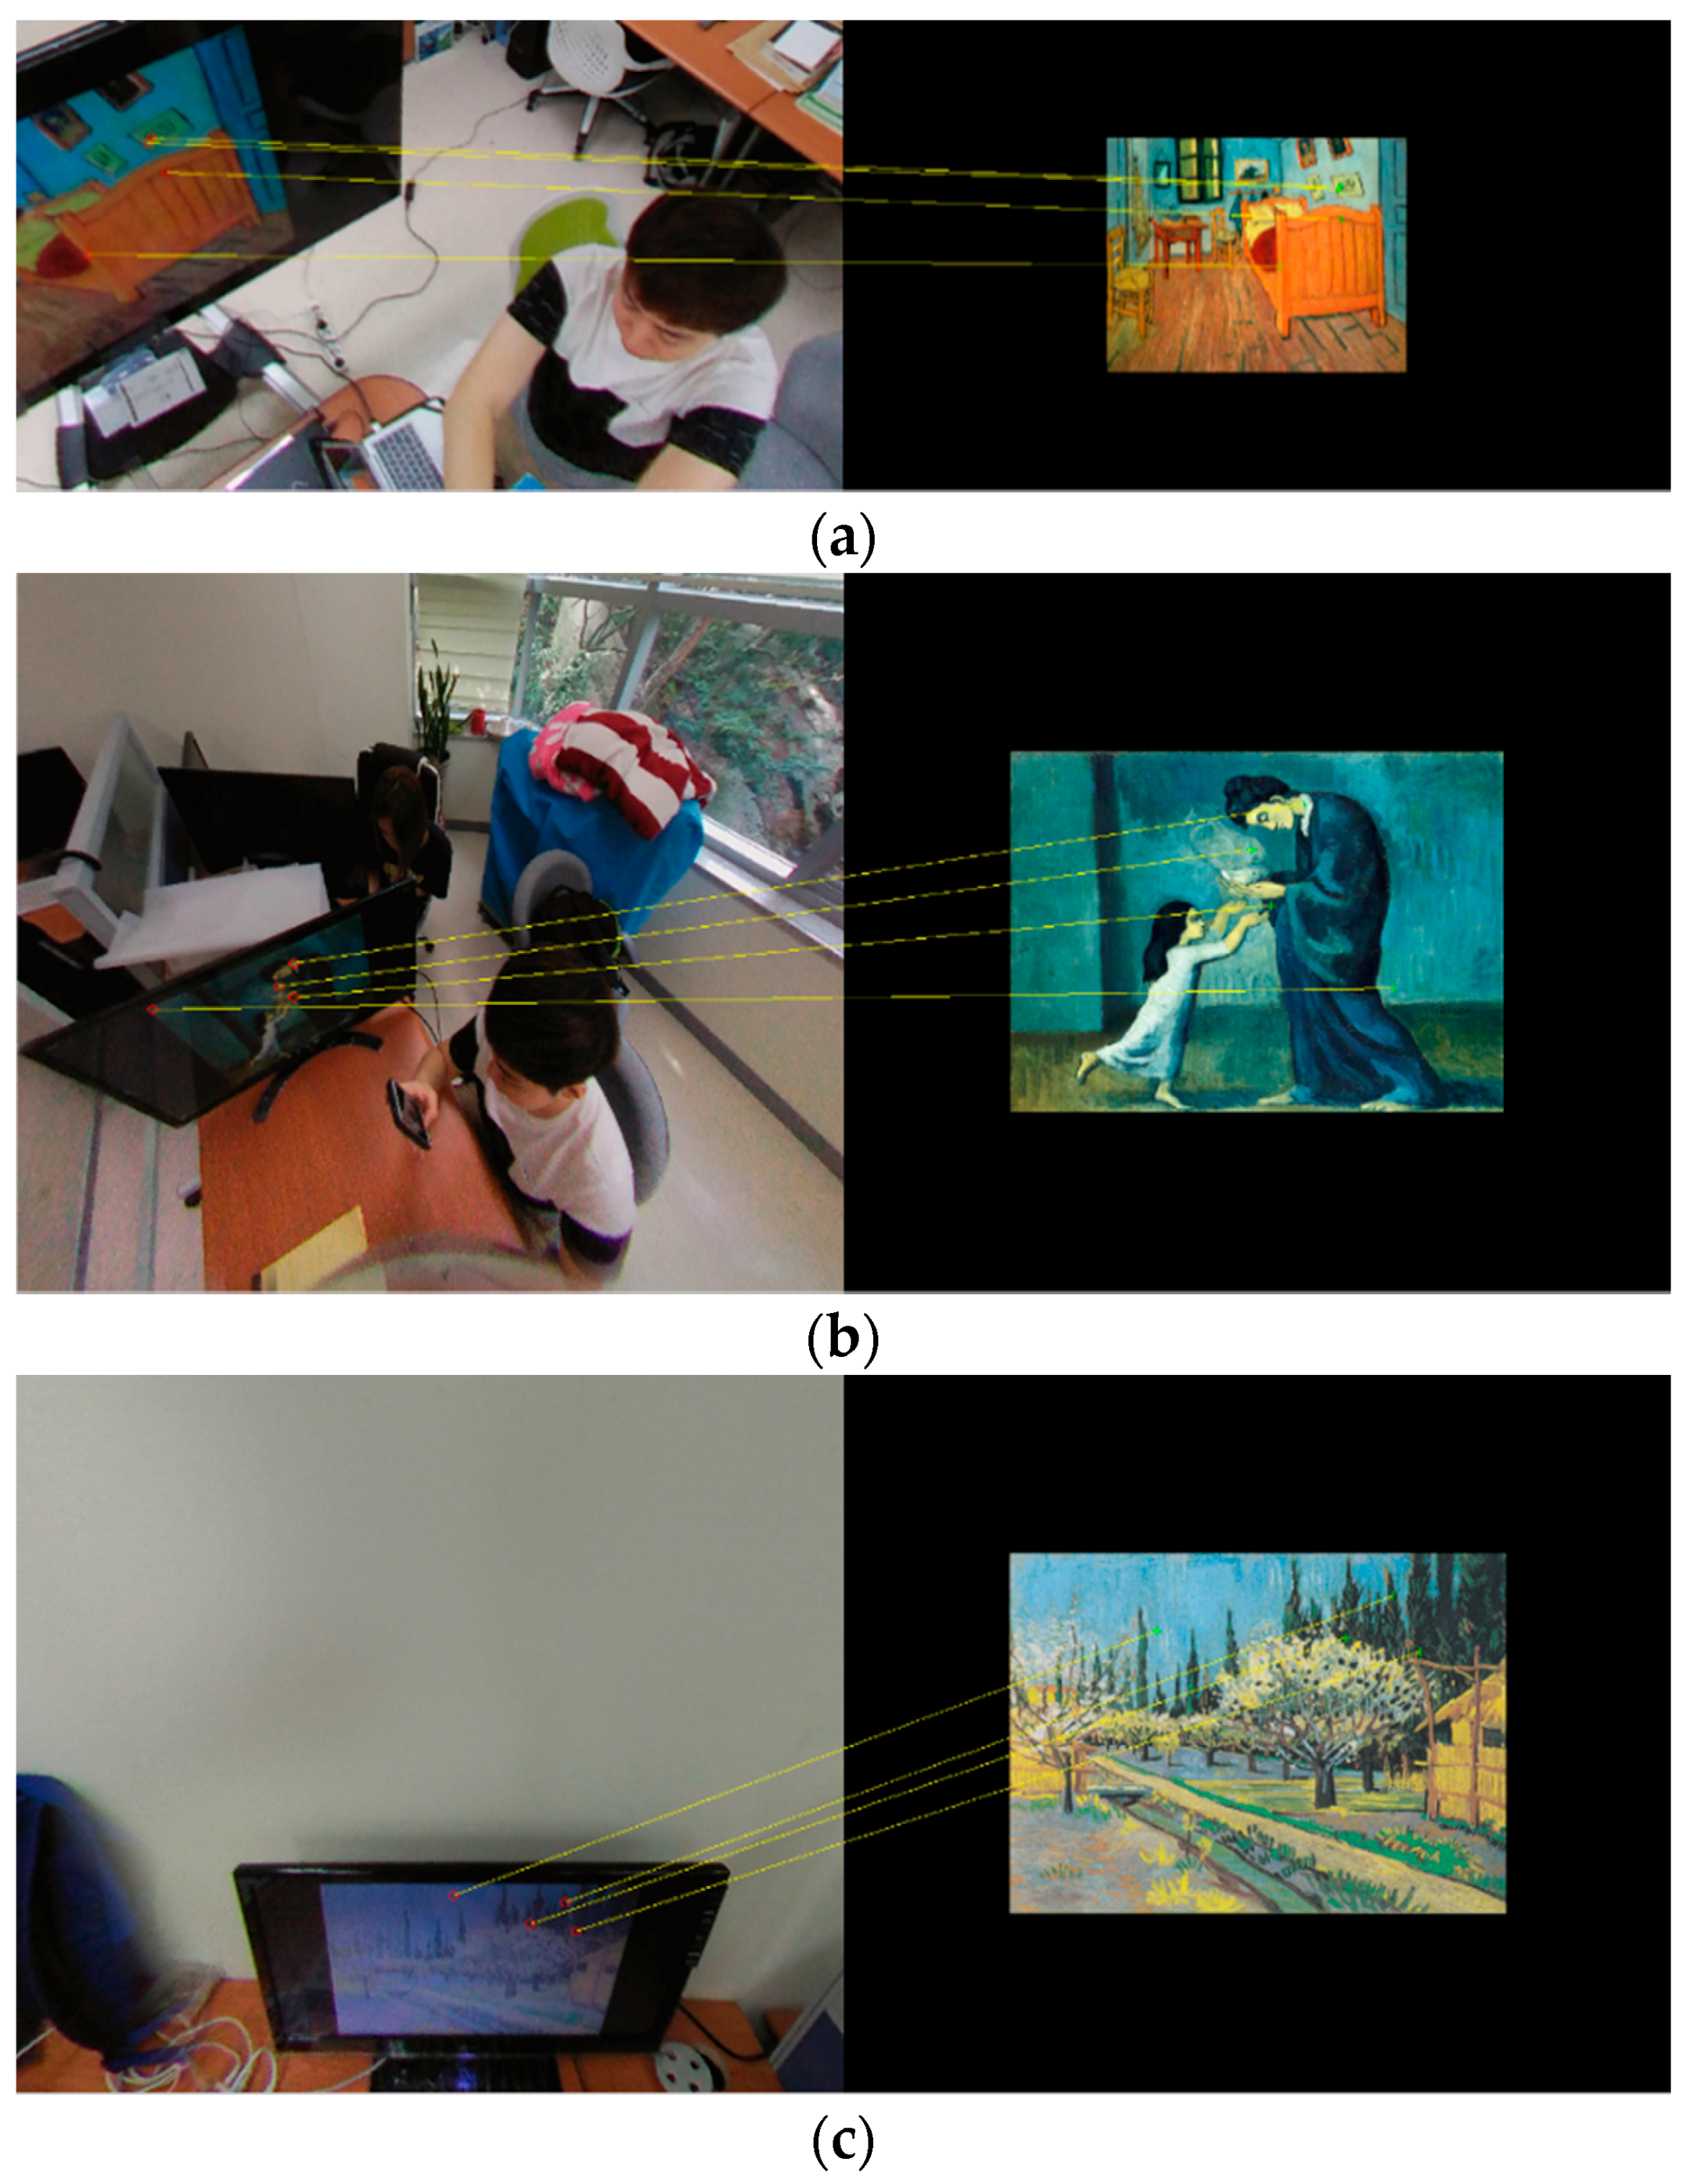
Based on the previous experiments, it is clear that the features are difficult to match directly using the 360-degree image when the artwork is positioned away from the Equator. To improve the feature matching, we used the proposed polyhedron-based rectilinear projection to divide and project the 360-degree image into several images. We applied this method to several of the 360-degree images that were previously shown. Figure 15a shows a projected image of Figure 12c using the 32-hedron. There are four correctly matched features. Figure 15b shows a projected image of Figure 13b using the octahedron. Although there are four matched features, one is a false match. Figure 15c shows a projected image of Figure 14b using the dodecahedron. There are three correctly matched features and an almost matched feature. The feature matching is improved from the no match results to at least three correct matches. Clearly, there are significant improvements in feature matching.
After matching the features from the artwork, the precision of the artwork identification is automatically computed based on the matched results without artificial participation. An experiment to compare precision was conducted with the following goals: (1) to evaluate the effects of the number and sizes of the polygons on precision; (2) to evaluate the effects of the DSK on precision; and (3) to determine whether the proposed method increases the precision of the artwork identification.
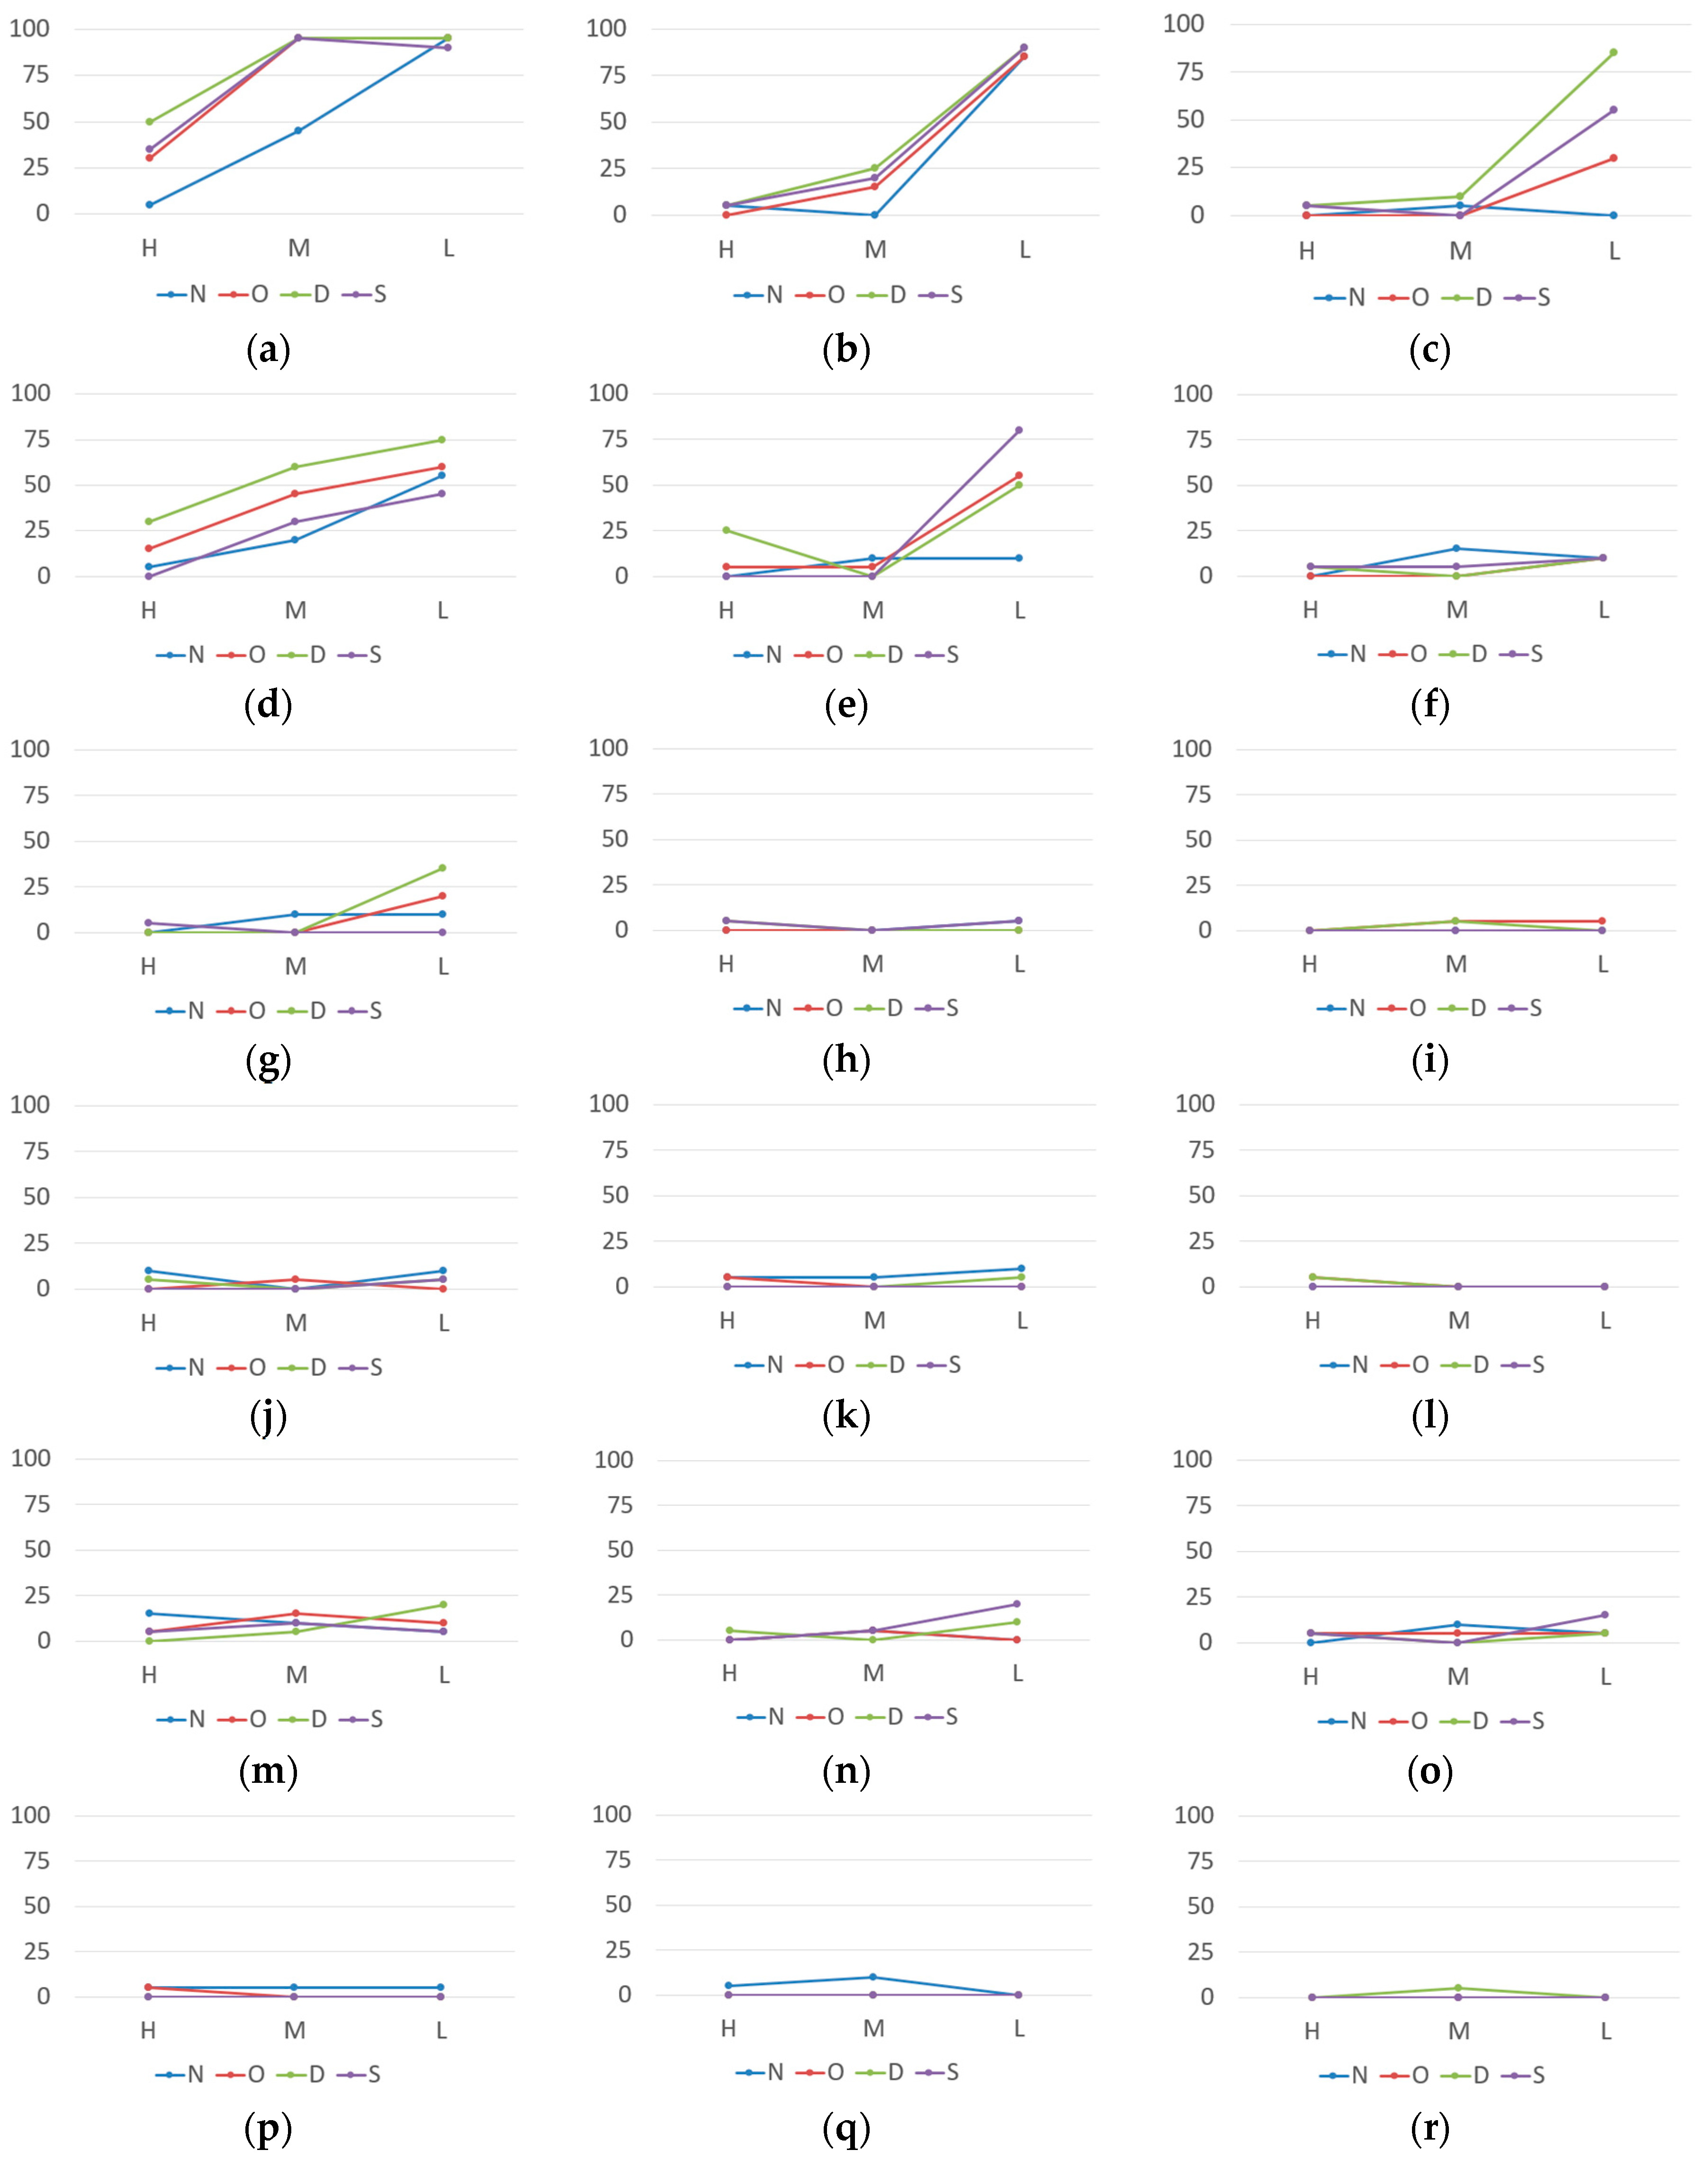
First, we evaluated precision based on the number of matched features. Each of the divided n images from a 360-degree image was matched to the original artwork images. The maximum number of matched features among the n images represented the similarity between the 360-degree image and the original artwork. The original artwork with the maximum number was selected as the identified artwork. Precision was computed by dividing the number of correctly identified artwork by the total number of artwork. Figure 16a–u show the precision of the artwork identification for seven types of features: SIFT, SURF, FAST, BRISK, MSER, HOG, and FREAK. The x-axis denotes the level of distortion, which is represented by high (H), middle (M), and low (L), and is based on the distance between the artwork and the Equator. The y-axis denotes the percentage of precision. The acronyms N, O, D, and S denote no-projection, octahedron, dodecahedron, and 32-hedron (soccer ball).
Comparing the precisions for the blue line N from the seven features, it is clear that the SIFT is the most robust feature for remedying distortion of the 360-degree image. The precision for identifying artwork that was located at the position of L-distortion without using the proposed method for the 79-inch monitor (79-SIFT-N-L) is 95%, which is the highest value for directly matching the features of 360-degree images to those from the original images. However, an increase in distortion results in a decrease in precision to 45% for M-distortion and 5% for H-distortion. For the 32- and 23-inch monitors (32, 23-SIFT-N-L), there is a decrease in precision to 85% and 0%. In addition, when there is an increase in distortion for M and to H (32, 23-SIFT-N-M, H), the precision is less than 25%.
The second robust feature that contrasts distortion of the 360-degree image is the SURF. Precision for a 79-inch monitor at the L-distortion position (79-SURF-N-L) is 55%. However, the precision decreases to below 25% when there is either an increase in distortion or a decrease in artwork size. The precision for the other five features was less than 25% under all conditions. The five features are vulnerable to distortion of the 360-degree image. Thus, they are not suitable for identifying artwork inside the 360-degree images.
After applying the polyhedron-based rectilinear projection to the 360-degree images for the 79-inch monitor, there was a 50% increase in the precision of the SIFT for M-distortion (79-SIFT-O, D, S-M). For H-distortion (79-SIFT-O, D, S-H), there were 25%, 45%, and 30% increases in precision after applying the octahedron, dodecahedron, and 32-hedron, respectively. For the SURF features, there were increases in the precision for H, M, and L-distortions of 5%, 25%, and 10% after using the octahedron (79-SURF-O-H, M, L), and 25%, 40%, and 20% after using the dodecahedron (79-SURF-D-H, M, L). However, the 32-hedron-based rectilinear projection did not significantly improve the SURF’s precision for the 79-inch monitor. For the FAST features, after using the octahedron and dodecahedron, there were 10% and 25% increases in precision for the L-distortion (79-FAST-O, D-L). Summarizing the experiments from the 79-inch monitor, the dodecahedron-based method has the largest influence on improving precision, followed by the octahedron-based method.
After applying the polyhedron-based methods to SIFT for the 32-inch monitor, there were 15%, 25%, and 20% increases in precision for the M-distortion (32-SIFT-O, D, S-M), whereas the precision was 0% without the proposed methods. For the SURF features, there were 45%, 40%, and 70% increases in precision for the L-distortion (32-SURF-O, D, S-L). The 32-hedron-based method improves the precision of the SURF for the 32-inch monitor, but does not improve that of the SURF for the 79-inch monitor. This is because the polygon sizes in the 32-hedron are small. There is an increased probability of segmenting the artwork into more than one projected image when the artwork size is large and the polygon sizes are small.
After applying the proposed methods to the SIFT for the 23-inch monitor, there are 30%, 85% and 55% increases in precision for the L-distortion (23-SIFT-O, D, S-L), whereas the precision was 0% without using the proposed methods. After summarizing the experiments for the three types of monitors and distortions, the performance of the dodecahedron-based rectilinear projection is the best. However, there were only minimal increases in precision for the M- and H-distortions in the 32 and 23-inch monitors using the proposed methods because the M- and H-distortions for 32 and 23-inch monitors are extremely challenging. Thus, there is serious damage to the artwork inside the 360-degree image.
To further improve the identification precision of the artwork that is located in the highly distorted position, we applied DSK to the matched features. For reliable identification, there should be at least three matched features [10]. However, we increased the recommended number of matched features to five to exclude increases in false matches. Thus, when the number of matched features was less than five, the DSK was set to zero. The artwork that had the minimum number of nonzero DSK was selected as the identified artwork. Figure 17a shows the numbers of matched features between the artwork “Mona Lisa” and 360-degree images of 20 pieces of artwork displayed on the 79-inch monitor and located at a high distortion position. The octahedron-based rectilinear projection was applied to the 360-degree images. The number of matched features between the artwork Mona Lisa and the 360-degree image that contained the same artwork was five, whereas the maximum number of matched features was six for the artwork Cafe Terrace at Night. However, the DSK between the artwork and the 360-degree image that contained the same artwork was 0.32 (in red circle), whereas the DSK between the artwork and the misidentified 360-degree image was 10.05, as shown in Figure 17b. Therefore, the misidentified results can be corrected and may further improve the identification precision for artwork that is located in the highly distorted position.
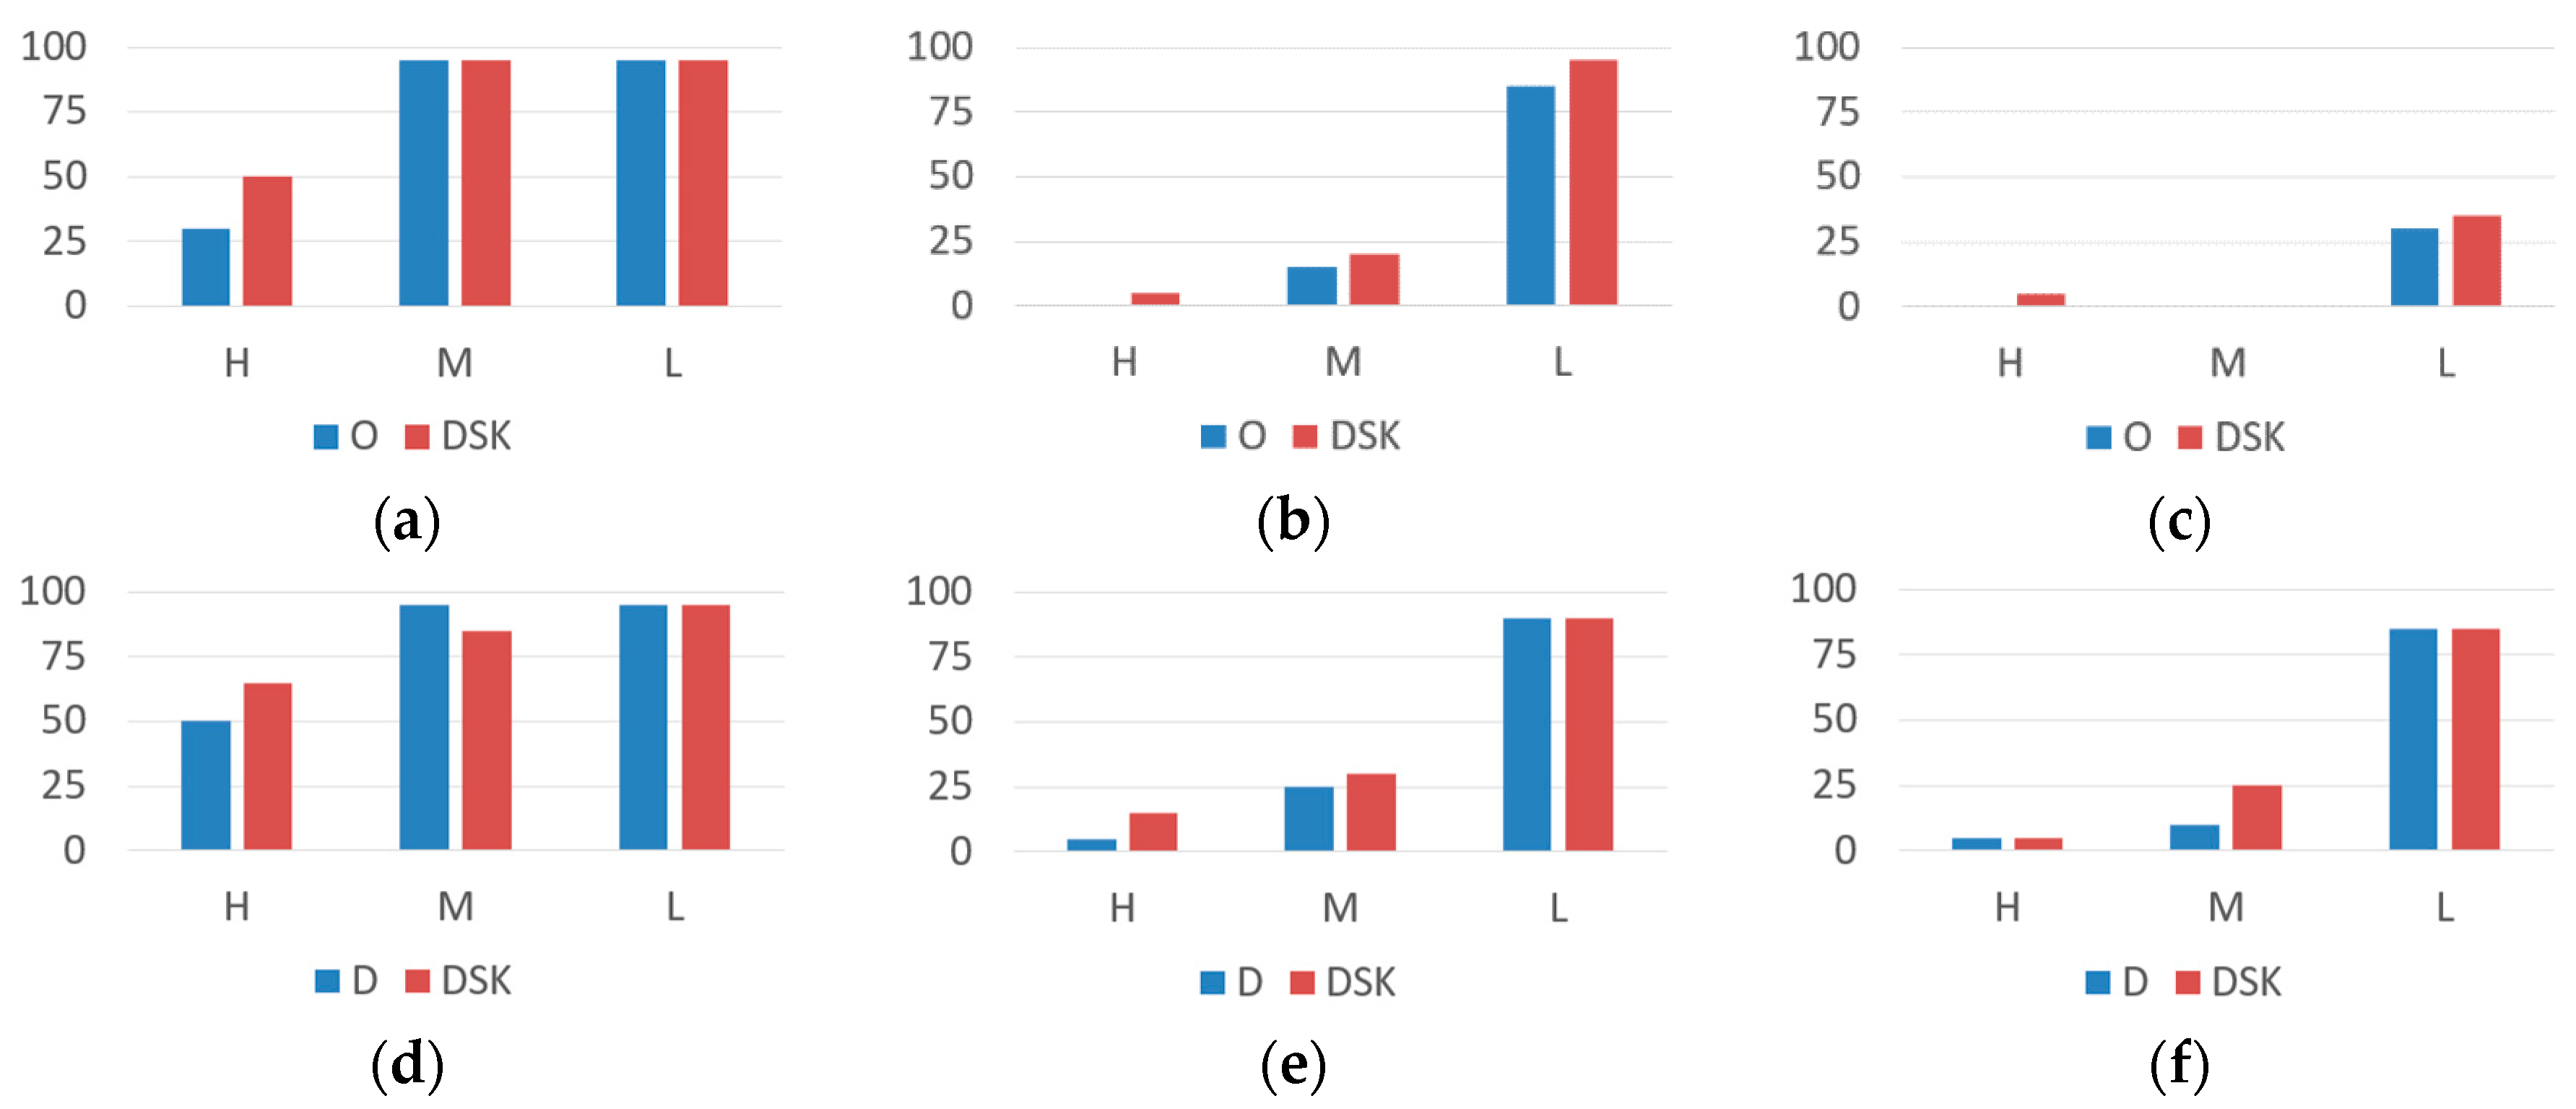
Because SIFT performs best for precision, we show comparisons from before and after applying the DSK for the SIFT using the octahedron and dodecahedron-based methods. In Figure 18, the blue bars are the precision without using the DSK, and the red bars are the precision after applying the DSK. It is clear that the precision after using the DSK is larger than the precision without using the DSK for the H-distortion. Specifically, for the 79-inch monitor, the precision increases 20% and 15% for the octahedron and dodecahedron. For the L-distortion with the dodecahedron, there are no improvements in precision, whereas the precision increases approximately 5% for the octahedron. It is more efficient to combine the DSK with the octahedron. For the 79-inch monitor under the M-distortion using the dodecahedron, there is a decrease in precision after applying the DSK. Occasionally, when the 360-degree image contained the correct artwork, there were several false matches to irrelevant objects. Therefore, based on the mechanism of the DSK, there is a reduction in the similarity between two keypoint shapes. However, overall, the DSK enhances precision.
Based on the principle of the proposed approach, the features from the original artwork are extracted and stored in advance. Thus, to evaluate the computational complexity, we primarily focus on the feature extraction and matching times for the 360-degree images. Table 2 shows the average times (in seconds) for feature extraction and matching for one projected image. The SP and SH denote the pentagon and hexagon for the 32-hedron. The feature extraction time includes the time to generate a projected image. The extraction time is primarily based on the image size. Because the 360-degree image is large in size, the overall extraction speeds are not fast. Comparing the times for the different features reveals that the fastest feature is the FREAK, and the slowest is the SIFT. However, feature matching performs quickly for matching the projected image to an original artwork. Based on the amount of time for processing an entire polyhedron, the octahedron-based method performed better than the others.

8. Conclusions

This paper proposes an artwork identification methodology for 360-degree images using three polyhedron-based rectilinear projections and the DSK. A polyhedron-based rectilinear projection is used to reduce the distortion caused by an equirectangular projected 360-degree image. After comparing the matched features before and after applying the polyhedron-based method, feature matching is improved from no matched results to at least three correct matches. We used octahedron-, dodecahedron-, and 32-hedron-based rectilinear projections to identify artwork for analyzing the effects of the size, direction, and number of polygons on artwork identification. After summarizing the experiments from the 23-, 32-, and 79-inch monitors that were located at three different distortion positions, we found that the dodecahedron-based method has the most improved precision, which indicates that there should be neither too many nor too few polygons. The DSK further improved the identification precision for the artwork that was located in the highly distorted position. With DSK, we can distinguish false matches and correct misidentified results. For the SIFT features of the artwork displayed on the 79-inch monitor and located in the seriously distorted position, there was a 45% increase in precision after applying the dodecahedron-based method. After using DSK, there is an additional 15% improvement in precision.
The proposed approach is useful for automatic artwork identification applications in 360-degree images and has an important role in object recognition for 360-degree images. In the future, we will extend our method to three-dimensional sculpture identification in 360-degree images.

Acknowledgments

This research was supported by the Ministry of Culture, Sports and Tourism (MCST) and Korea Creative Content Agency (KOCCA) in the Culture Technology (CT) Research & Development Program 2016.

Author Contributions

Both authors contributed to the research work. Both authors designed the new method and planned the experiments. Jongweon Kim led and reviewed the research work. Xun Jin performed the experiments and wrote the paper.

Conflicts of Interest

The authors declare no conflict of interest.

References

  1. Kelion, L. Technology News of BBC. Available online: http://www.bbc.com/news/technology-36073009 (accessed on 3 November 2016).
  2. McDowell, M. Business News Media of WWD. Available online: http://wwd.com/business-news/media/facebook-users-can-now-share-view-360-degree-photos-10449295/ (accessed on 3 November 2016).
  3. Loncomilla, P.; Ruiz-del-Solar, J.; Martinez, L. Object recognition using local invariant features for robotic applications: A survey. Pattern Recognit. 2016, 60, 499–514. [Google Scholar] [CrossRef]
  4. Kashif, M.; Deserno, T.M.; Haak, D.; Jonas, S. Feature description with SIFT, SURF, BRIEF, BRISK, or FREAK? A general question answered for bone age assessment. Comput. Biol. Med. 2016, 68, 67–75. [Google Scholar] [CrossRef] [PubMed]
  5. Andreopoulos, A.; Tsotsos, J.K. 50 Years of Object Recognition: Directions Forward. Comput. Vis. Image Underst. 2013, 117, 827–891. [Google Scholar] [CrossRef]
  6. Ragland, K.; Tharcis, P. A Survey on Object Detection, Classification and Tracking Methods. Int. J. Eng. Res. Technol. 2014, 3, 622–628. [Google Scholar]
  7. Prasad, D.K. Survey of the Problem of Object Detection in Real Images. Int. J. Image Proc. 2012, 6, 441–466. [Google Scholar]
  8. Sukanya, C.M.; Gokul, R.; Paul, V. A Survey on Object Recognition Methods. Int. J. Comput. Sci. Eng. Technol. 2016, 6, 48–52. [Google Scholar]
  9. Shantaiya, S.; Verma, K.; Mehta, K. A Survey on Approaches of Object Detection. Int. J. Comput. Appl. 2013, 65, 14–20. [Google Scholar]
  10. Lowe, D.G. Distinctive image features from scale-invariant keypoints. Int. J. Comput. Vis. 2004, 60, 91–110. [Google Scholar] [CrossRef]
  11. Kisku, D.R.; Gupta, P.; Sing, J.K. Face Recognition using SIFT Descriptor under Multiple Paradigms of Graph Similarity Constraints. Int. J. Multimedia Ubiquitous Eng. 2010, 5, 1–18. [Google Scholar]
  12. Sadeghipour, E.; Sahragard, N. Face Recognition Based on Improved SIFT Algorithm. Int. J. Adv. Comput. Sci. Appl. 2016, 7, 548–551. [Google Scholar] [CrossRef]
  13. Krizaj, J.; Struc, V.; Pavesic, N. Adaptation of SIFT Features for Robust Face Recognition. In Image Analysis and Recognition; Campiho, A., Kamel, M., Eds.; Springer: Berlin/Heidelberg, Germany, 2010; pp. 394–404. [Google Scholar]
  14. Pan, D.; Shi, P. A method of TV Logo Recognition based on SIFT. In Proceedings of the 3rd International Conference on Multimedia Technology; Springer: Berlin, Germany, 2013; pp. 1571–1579. [Google Scholar]
  15. Berretti, S.; Amor, B.B.; Daoudi, M.; Bimbo, A.D. 3D facial expression recognition using SIFT descriptors of automatically detected keypoints. Vis. Comput. 2011, 27, 1021–1036. [Google Scholar] [CrossRef]
  16. Lenc, L.; Kral, P. Novel Matching Methods for Automatic Face Recognition using SIFT. Artif. Intell. Appl. Innov. 2012, 381, 254–263. [Google Scholar]
  17. Choudhury, R. Recognizing Pictures at an Exhibition Using SIFT. Available online: https://web.stanford.edu/class/ee368/Project_07/reports/ee368group11.pdf (accessed on 3 November 2016).
  18. Ali, N.; Bajwa, K.B.; Sablatnig, R.; Chatzichristofis, S.A.; Iqbal, Z.; Rashid, M.; Habib, H.A. A Novel Image Retrieval Based on Visual Words Integration of SIFT and SURF. PLoS ONE 2016, 11, e0157428. [Google Scholar] [CrossRef] [PubMed]
  19. Bakar, S.A.; Hitam, M.S.; Yussof, W.N.J.H.W. Content-Based Image Retrieval using SIFT for binary and greyscale images. In Proceedings of the 2013 IEEE International Conference on Signal and Image Processing Applications, Melaka, Malaysia, 8–10 October 2013; pp. 83–88. [Google Scholar]
  20. Bay, H.; Ess, A.; Tuytelaars, T.; Gool, L.V. Speeded-Up Robust Features (SURF). Comput. Vis. Imag. Underst. 2008, 110, 346–359. [Google Scholar] [CrossRef]
  21. Alfanindya, A.; Hashim, N.; Eswaran, C. Content Based Image Retrieval and Classification using speeded-up robust features (SURF) and grouped bag-of-visual-words (GBoVW). In Proceedings of the International Conference on Technology, Informatics, Management, Engineering and Environment, Bandung, Indonesia, 23–26 June 2013; pp. 77–82. [Google Scholar]
  22. Du, G.; Su, F.; Cai, A. Face recognition using SURF features. Proc. SPIE 2009, 7496, 1–7. [Google Scholar]
  23. Carro, R.C.; Larios, J.A.; Huerta, E.B.; Caporal, R.M.; Cruz, F.R. Face Recognition Using SURF, In Intelligent Computing Theories and Methodologies; Huang, D., Bevilacqua, V., Premaratne, P., Eds.; Springer International Publishing: Cham, Switzerland, 2015; pp. 316–326. [Google Scholar]
  24. Calonder, M.; Lepetit, V.; Strecha, C.; Fua, P. BRIEF: Binary Robust Independent Elementary Features. In Computer Vision ECCV; Daniilidis, K., Maragos, P., Paragios, N., Eds.; Springer: Berlin, Germany, 2010; pp. 778–792. [Google Scholar]
  25. Leutenegger, S.; Chli, M.; Siegwart, R.Y. BRISK: Binary Robust Invariant Scalable Keypoints. In Proceedings of the 2011 International Conference on Computer Vision, Washington, DC, USA, 6–13 November 2011; pp. 2548–2555. [Google Scholar]
  26. Parnav, G.S. Registration of Face Image Using Modified BRISK Feature Descriptor. Master’s Thesis, Department of Electrical Engineering, National Institute of Technology, Rourkela, Niort, France, 2016. [Google Scholar]
  27. Mazzeo, P.L.; Spagnolo, P.; Distante, C. BRISK Local Descriptors for Heavily Occluded Ball Recognition. In Image Analysis and Processing; Murino, V., Puppo, E., Eds.; Springer International Publishing: Cham, Switzerland, 2015; pp. 172–182. [Google Scholar]
  28. Xiao, T.; Zhao, D.; Shi, J.; Lu, M. High-speed Recognition Algorithm Based on BRISK and Saliency Detection for Aerial Images. Res. J. Appl. Sci. Eng. Technol. 2013, 5, 5469–5473. [Google Scholar]
  29. Oh, J.H.; Eoh, G.; Lee, B.H. Appearance-Based Place Recognition Using Whole-Image BRISK for Collaborative Multi-Robot Localization. Int. J. Mech. Eng. Robot. Res. 2015, 4, 264–268. [Google Scholar]
  30. Kim, M. Person Recognition using Ocular Image based on BRISK. J. Korea Multimedia Soc. 2016, 19, 881–889. [Google Scholar] [CrossRef]
  31. Iglesias, F.S.; Buemi, M.E.; Acevedo, D.; Berlles, J.J. Evaluation of Keypoint Descriptors for Gender Recognition. In Progress in Pattern Recognition, Image Analysis, Computer Vision, and Applications; Corrochano, E.B., Hancock, E., Eds.; Springer International Publishing: Cham, Switzerland, 2014; pp. 564–571. [Google Scholar]
  32. Paek, K.; Yao, M.; Liu, Z.; Kim, H. Log-Spiral Keypoint: A Robust Approach toward Image Patch Matching. Comput. Intell. Neurosci. 2015, 2015, 1–12. [Google Scholar] [CrossRef] [PubMed]
  33. Dalal, N.; Triggs, B. Histograms of oriented gradients for human detection. In Proceedings of the 2005 IEEE Computer Society Conference on Computer Vision and Pattern Recognition, San Diego, CA, USA, 20–25 June 2005; pp. 886–893. [Google Scholar]
  34. Ren, H.; Li, Z.N. Object detection using edge histogram of oriented gradient. In Proceedings of the 2014 IEEE International Conference on Image Processing, Paris, France, 27–30 October 2014; pp. 4057–4061. [Google Scholar]
  35. Stefanou, S.; Argyros, A.A. Efficient Scale and Rotation Invariant Object Detection based on HOGs and Evolutionary Optimization Techniques. Adv. Vis. Comput. 2012, 7431, 220–229. [Google Scholar]
  36. Zhang, B. Offline signature verification and identification by hybrid features and Support Vector Machine. Int. J. Artif. Intell. Soft Comput. 2011, 2, 302–320. [Google Scholar] [CrossRef]
  37. Tsolakidis, D.G.; Kosmopoulos, D.I.; Papadourakis, G. Plant Leaf Recognition Using Zernike Moments and Histogram of Oriented Gradients. In Artificial Intelligence: Methods and Applications; Likas, A., Blekas, K., Kalles, D., Eds.; Springer International Publishing: Cham, Switzerland, 2014; pp. 406–417. [Google Scholar]
  38. Ebrahimzadeh, R.; Jampour, M. Efficient Handwritten Digit Recognition based on Histogram of Oriented Gradients and SVM. Int. J. Comput. Appl. 2014, 104, 10–13. [Google Scholar] [CrossRef]
  39. Carcagni, P.; Coco, M.D.; Leo, M.; Distante, C. Facial expression recognition and histograms of oriented gradients: A comprehensive study. SpringerPlus 2015, 4, 1–25. [Google Scholar] [CrossRef] [PubMed]
  40. Torrione, P.A.; Morton, K.D.; Sakaguchi, R.; Collins, L.M. Histograms of Oriented Gradients for Landmine Detection in Ground-Penetrating Radar Data. IEEE Trans. Geosci. Remote Sens. 2014, 52, 1539–1550. [Google Scholar] [CrossRef]
  41. Yan, G.; Yu, M.; Yu, Y.; Fan, L. Real-time vehicle detection using histograms of oriented gradients and AdaBoost classification. Optik-Int. J. Light Electron Opt. 2016, 127, 7941–7951. [Google Scholar] [CrossRef]
  42. Rybski, P.E.; Huber, D.; Morris, D.D.; Hoffman, R. Visual Classification of Coarse Vehicle Orientation using Histogram of Oriented Gradients Features. In Proceedings of the 2010 IEEE Intelligent Vehicles Symposium, San Diego, CA, USA, 21–24 June 2010; pp. 1–8. [Google Scholar]
  43. Beiping, H.; Wen, Z. Fast Human Detection Using Motion Detection and Histogram of Oriented Gradients. J. Comput. 2011, 6, 1597–1604. [Google Scholar] [CrossRef]
  44. Zhu, Q.; Avidan, S.; Yeh, M.; Cheng, K. Fast Human Detection Using a Cascade of Histograms of Oriented Gradients. In Proceedings of the 2006 IEEE Computer Society Conference on Computer Vision and Pattern Recognition, New York, NY, USA, 17–23 June 2006; pp. 1491–1498. [Google Scholar]
  45. Kobayashi, T.; Hidaka, A.; Kurita, T. Selection of Histograms of Oriented Gradients Features for Pedestrian Detection. In Neural Information Processing; Ishikawa, M., Doya, K., Miyamoto, H., Yamakawa, T., Eds.; Springer: Berlin/Heidelberg, Germany, 2008; pp. 598–607. [Google Scholar]
  46. Matas, J.; Chum, O.; Urban, M.; Pajdla, T. Robust Wide Baseline Stereo from Maximally Stable Extremal Regions. In Proceedings of the 2002 British Machine Vision Conference, Cardiff, UK, 2–5 September 2002; pp. 384–393. [Google Scholar]
  47. Tian, S.; Lu, S.; Su, B.; Tan, C.L. Scene Text Segmentation with Multi-level Maximally Stable Extremal Regions. In Proceedings of the 2014 International Conference on Pattern Recognition, Lanzhou, China, 13–16 July 2014; pp. 2703–2708. [Google Scholar]
  48. Oh, I.-S.; Lee, J.; Majumber, A. Multi-scale Image Segmentation Using MSER. In Computer Analysis of Images and Patterns; Wilson, R., Hancock, E., Bors, A., Smith, W., Eds.; Springer: Berlin/Heidelberg, Germany, 2013; pp. 201–208. [Google Scholar]
  49. Zhu, H.; Sheng, J.; Zhang, F.; Zhou, J.; Wang, J. Improved maximally stable extremal regions based method for the segmentation of ultrasonic liver images. Multimedia Tools Appl. 2016, 75, 10979–10997. [Google Scholar] [CrossRef]
  50. Adlinge, G.; Kashid, S.; Shinde, T.; Dhotre, V. Text Extraction from image using MSER approach. Int. Res. J. Eng. Technol. 2016, 3, 2453–2457. [Google Scholar]
  51. Lee, S.; Yoo, C.D. Robust video fingerprinting based on affine covariant regions. In Proceedings of the 2008 International Conference on Acoustics, Speech and Signal Processing, Las Vegas, NV, USA, 31 March–4 April 2008. [Google Scholar]
  52. Zhang, L.; Dai, G.J.; Wang, C.J. Human Tracking Method Based on Maximally Stable Extremal Regions with Multi-Cameras. Appl. Mech. Mater. 2011, 44, 3681–3686. [Google Scholar] [CrossRef]
  53. Obdrzalek, S.; Matas, J. Object Recognition Using Local Affine Frames on Maximally Stable Extremal Regions. In Toward Category-Level Object Recognition; Ponce, J., Hebert, M., Schmid, C., Zisserman, A., Eds.; Springer: Berlin/Heidelberg, Germany, 2006; pp. 83–104. [Google Scholar]
  54. Rosten, E.; Drummond, T. Machine Learning for High-Speed Corner Detection. In Computer Vision-European Conference on Computer Vision; Leonardis, A., Bischof, H., Pinz, A., Eds.; Springer: Berlin/Heidelberg, Germany, 2006; pp. 430–443. [Google Scholar]
  55. Rosten, E.; Drummond, T. Fusing Points and Lines for High Performance Tracking. In Proceedings of the 2005 IEEE International Conference on Computer Vision, Beijing, China, 15–21 October 2005; pp. 1508–1515. [Google Scholar]
  56. Lu, H.; Zhang, H.; Zheng, Z. A Novel Real-Time Local Visual Feature for Omnidirectional Vision Based on FAST and LBP. In RoboCup 2010: Robot Soccer World Cup XIV; Ruiz-del-Solar, J., Chown, E., Ploger, P.G., Eds.; Springer: Berlin/Heidelberg, Germany, 2011; pp. 291–302. [Google Scholar]
  57. Pahlberg, T.; Hagman, O. Feature Recognition and Fingerprint Sensing for Guiding a Wood Patching Robot. In Proceedings of the 2012 World Conference on Timber Engineering, Auckland, New Zealand, 15–19 July 2012. [Google Scholar]
  58. Bharath, R.; Rajalakshmi, P. Fast Region of Interest detection for fetal genital organs in B-mode ultrasound images. In Proceedings of the 2014 Biosignals and Biorobotics Conference on Biosignals and Robotics for Better and Safer Living, Bahia, Brazil, 26–28 May 2014. [Google Scholar]
  59. Olaode, A.A.; Naghdy, G.; Todd, C.A. Unsupervised Region of Interest Detection Using Fast and Surf. In Proceedings of the 2015 International Conference on Signal, Image Processing and Pattern Recognition, Delhi, India, 23–25 May 2015; pp. 63–72. [Google Scholar]
  60. Alahi, A.; Ortiz, R.; Vandergheynst, P. FREAK: Fast Retina Keypoint. In Proceedings of the 2012 IEEE Conference on Computer Vision and Pattern Recognition, Providence, RI, USA, 16–21 June 2012; pp. 510–517. [Google Scholar]
  61. Yaghoubyan, S.H.; Maarof, M.A.; Zainal, A.; Rohani, M.F.; Oghaz, M.M. Fast and Effective Bag-of-Visual-Word Model to Pornographic Images Recognition Using the FREAK Descriptor. J. Soft Comput. Decis. Support Syst. 2015, 2, 27–33. [Google Scholar]
  62. Caetano, C.; Avila, S.; Schwartz, W.R.; Guimaraes, S.J.F.; Araujo, A.A. A mid-level video representation based on binary descriptors: A case study for pornography detection. Neurocomputing 2016, 213, 102–114. [Google Scholar] [CrossRef]
  63. Gomez, C.H.; Medathati, K.; Kornprobst, P.; Murino, V.; Sona, D. Improving FREAK Descriptor for Image Classification. In Computer Vision Systems; Nalpantidis, L., Kruger, V., Eklundh, J., Gasteratos, A., Eds.; Springer International Publishing: Cham, Switzerland, 2015; pp. 14–23. [Google Scholar]
  64. Strat, S.T.; Benoit, A.; Lambert, P. Retina Enhanced Bag of Words Descriptors for Video Classification. In Proceedings of the 2014 European Signal Processing Conference, Lisbon, Portugal, 1–5 September 2014; pp. 1307–1311. [Google Scholar]
  65. Chen, Y.; Xu, W.; Piao, Y. Target Matching Recognition for Satellite Images Based on the Improved FREAK Algorithm. Math. Probl. Eng. 2016, 2016, 1–9. [Google Scholar] [CrossRef]
  66. Ju, M.H.; Kang, H.B. Stitching Images with Arbitrary Lens Distortions. Int. J. Adv. Robot. Syst. 2014, 11, 1–11. [Google Scholar] [CrossRef]
  67. Brown, M.; Lowe, D.G. Automatic Panoramic Image Stitching using Invariant Features. Int. J. Comput. Vis. 2007, 74, 59–73. [Google Scholar] [CrossRef]
  68. Oh, S.H.; Jung, S.K. Vanishing Point Estimation in Equirectangular Images. In Proceedings of the 2012 International Conference on Multimedia Information Technology and Applications, Beijing, China, 8–10 December 2012; pp. 1–3. [Google Scholar]
  69. Bildirici, I.O. Quasi indicatrix approach for distortion visualization and analysis for map projections. Int. J. Geogr. Inf. Sci. 2015, 29, 2295–2309. [Google Scholar] [CrossRef]
  70. Snyder, J.P.; Voxland, P.M. An Album of Map Projections; USGS Professional Paper 1453; U.S. Government Printing Office: Washington, DC, USA, 1989.
  71. Temmermans, F.; Jansen, B.; Deklerck, R.; Schelkens, P.; Cornelis, J. The Mobile Museum Guide: Artwork Recognition with Eigenpaintings and SURF. In Proceedings of the International Workshop on Image Analysis for Multimedia Interactive Services, Delft, The Netherlands, 13–15 April 2011. [Google Scholar]
  72. Morel, J.M.; Yu, G. ASIFT: A new framework for fully affine invariant image comparison. SIAM J. Imaging Sci. 2009, 2, 438–469. [Google Scholar] [CrossRef]
  73. Boussias-Alexakis, E.; Tsironis, V.; Petsa, E.; Karras, G. Automatic Adjustment of Wide-Base Google Street View Panoramas. Int. Arch. Photogramm. Remote Sens. Spat. Inf. Sci. 2016, XLI-B1, 639–645. [Google Scholar] [CrossRef]
  74. Apollonio, F.I.; Ballabeni, A.; Gaiani, M.; Remondino, F. Evaluation of feature-based methods for automated network orientation. Int. Arch. Photogramm. Remote Sens. Spat. Inf. Sci. 2014, XL-5, 47–54. [Google Scholar] [CrossRef]
  75. Jin, X.; Kim, J. ArtWork recognition in 360-degree image using 32-hedron based rectilinear projection and scale invariant feature transform. In Proceedings of the 2016 IEEE International Conference on Electronic Information and Communication Technology, Harbin, China, 20–22 August 2016; pp. 356–359. [Google Scholar]
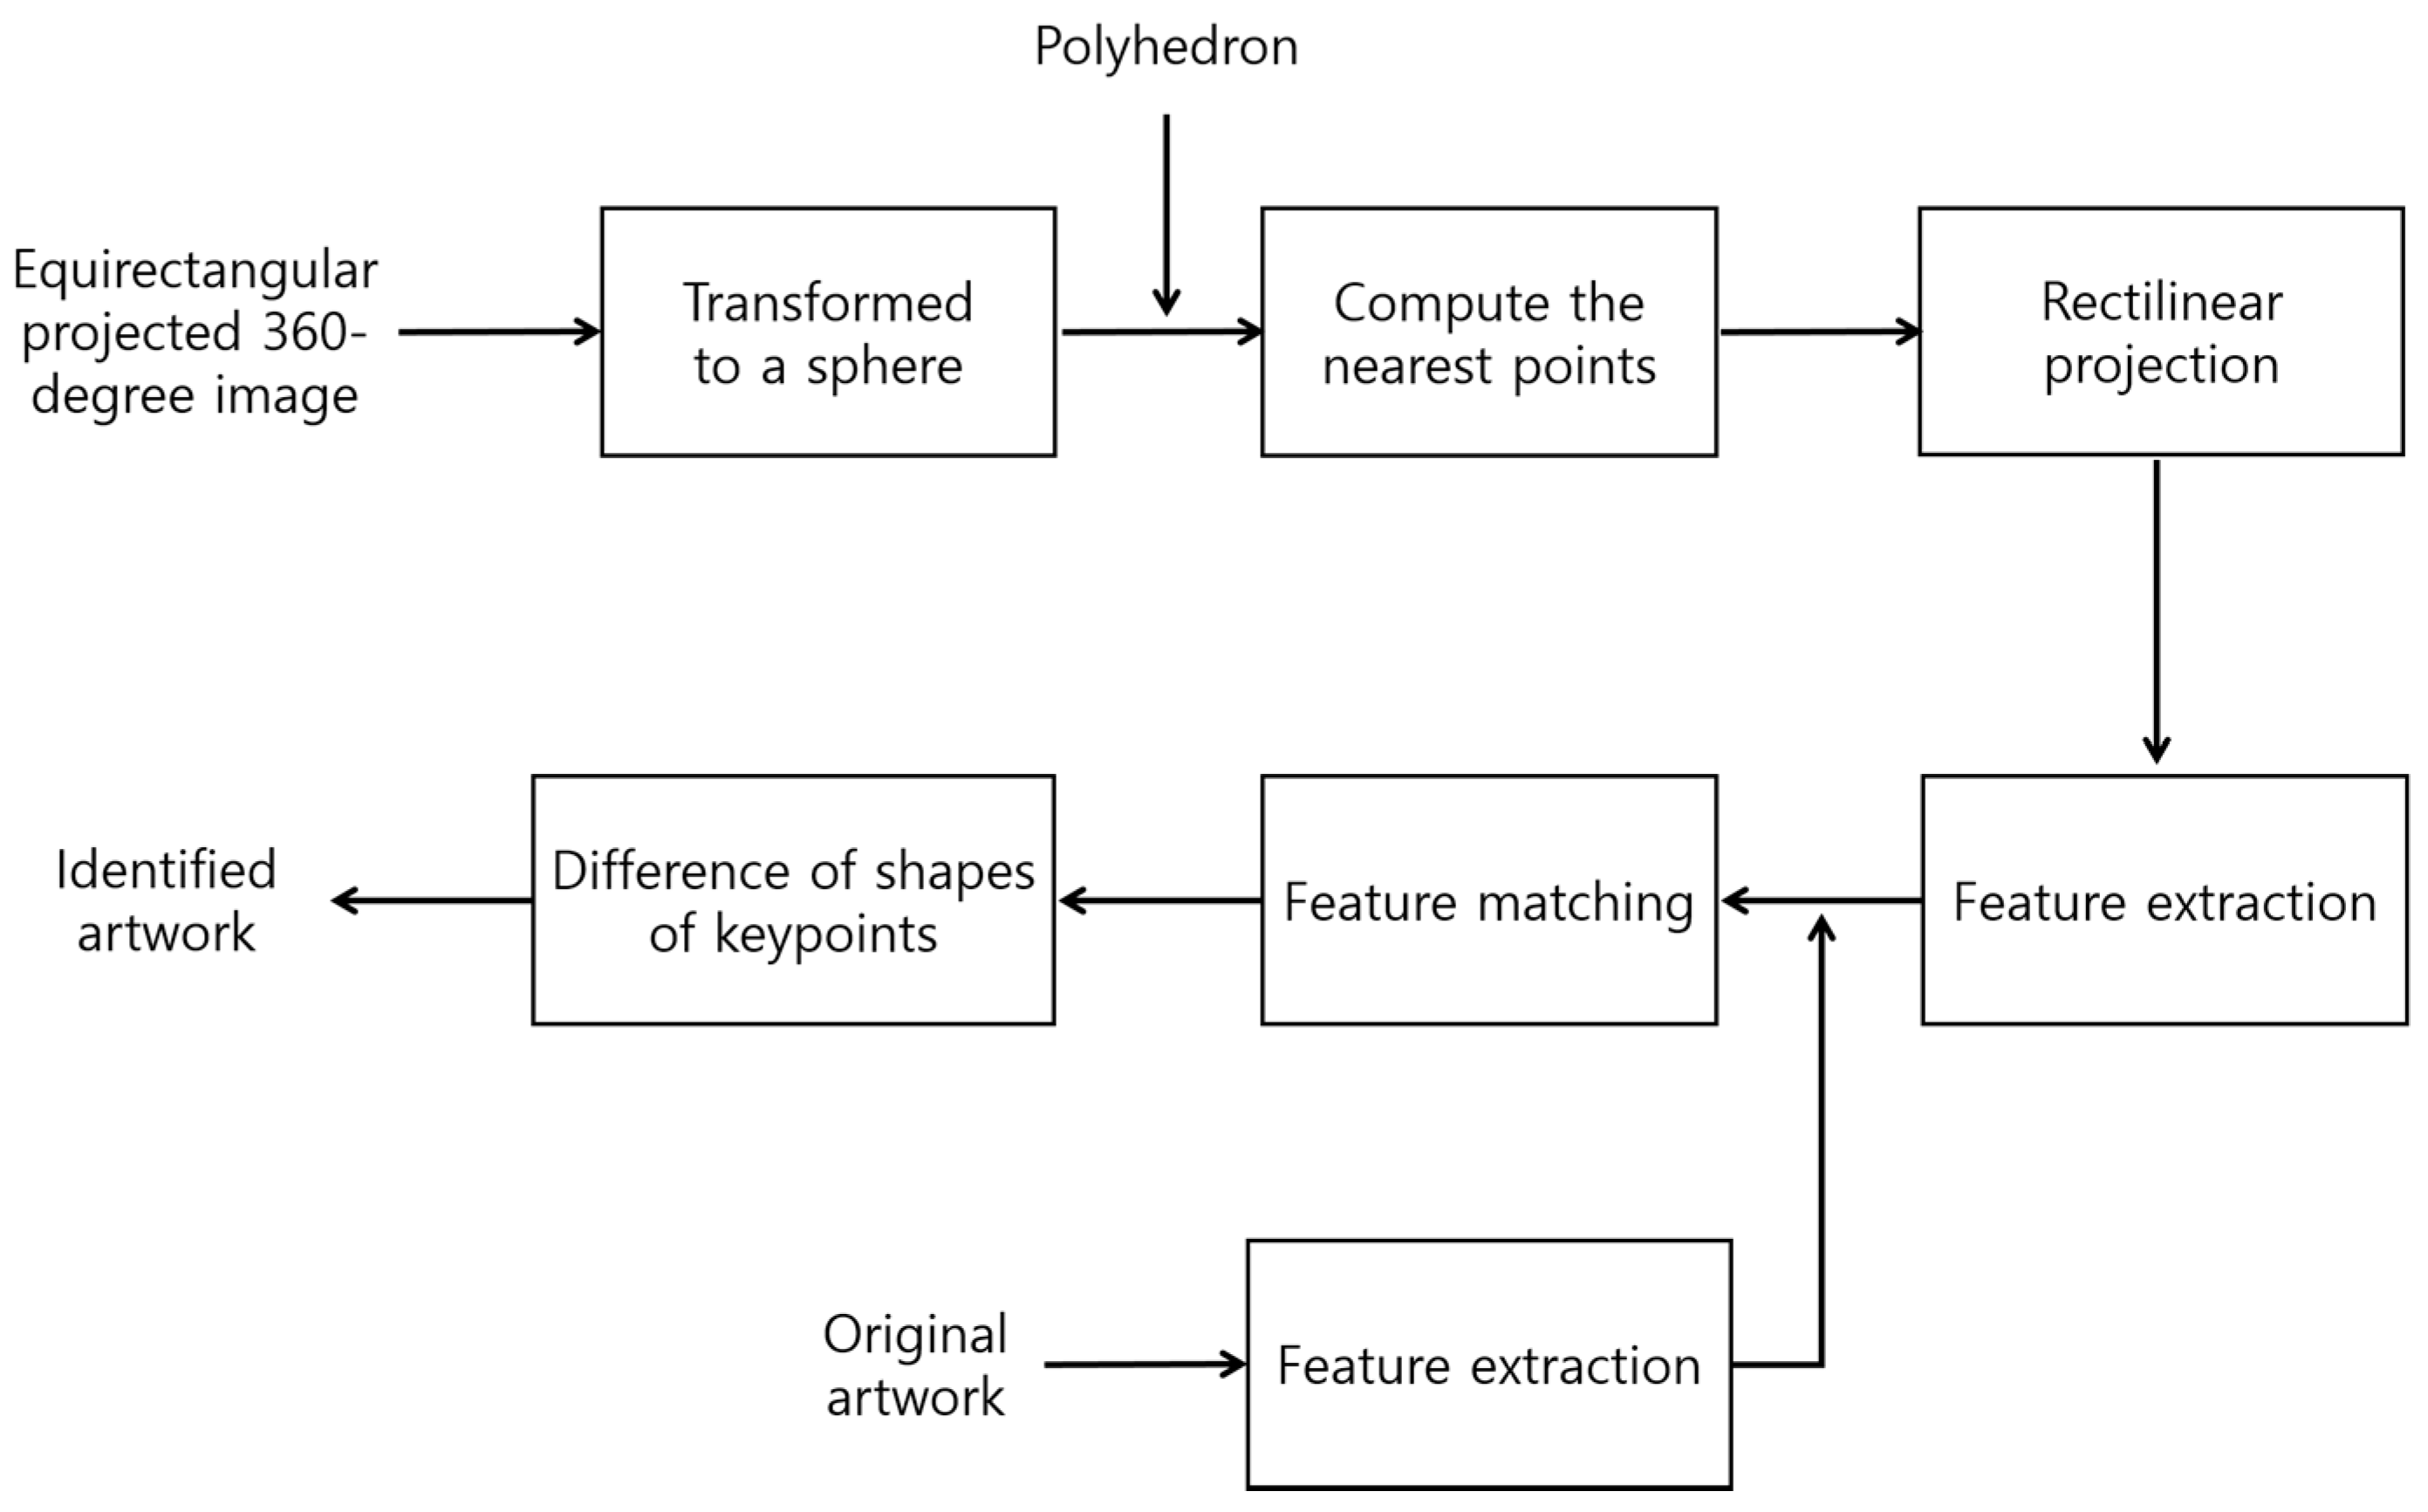
Figure 1. Flowchart of the proposed method.
Applsci 07 00528 g001
Figure 2. Tissot’s indicatrices and the projected equirectangular results. (a) Tissot’s indicatrices; (b) Equirectangular projected image.
Applsci 07 00528 g002
Figure 3. Basic theory of rectilinear projection and three types of projected results. (a) Basic theory for rectilinear projection; (b) Polar rectilinear projection; (c) Equatorial rectilinear projection; (d) Oblique rectilinear projection.
Applsci 07 00528 g003
Figure 4. Three types of polyhedrons. (a) 32-hedron; (b) Dodecahedron; (c) Octahedron.
Applsci 07 00528 g004
Figure 5. Regular and rotated dodecahedrons. (a) Regular dodecahedron; (b) Rotated dodecahedron.
Applsci 07 00528 g005
Figure 6. Points closest to the vertices and centers of the polygons of three polyhedrons. (a) Points on the 32-hedron; (b) Points on the dodecahedron; (c) Points on the octahedron.
Applsci 07 00528 g006
Figure 7. Illustration of width and height of the viewing range for the dodecahedron. (a) Width and height of viewing range; (b) Cross section of the sphere.
Applsci 07 00528 g007
Figure 8. Original image and ordinary photograph of The Annunciation. (a) Ordinary photograph; (b) Original image.
Applsci 07 00528 g008
Figure 9. Matched keypoints for the seven types of features. (a) SIFT; (b) SURF; (c) MSER; (d) BRISK; (e) FAST; (f) HOG; (g) FREAK.
Applsci 07 00528 g009aApplsci 07 00528 g009b
Figure 10. The shapes of the connected keypoints.
Applsci 07 00528 g010
Figure 11. An example of false and correct matches. (a) False matches; (b) Correct matches.
Applsci 07 00528 g011
Figure 12. Matched results for the 79-inch monitor for three types of distortions. (a) Matched results for low distortion; (b) Matched results for middle distortion; (c) Matched results for high distortion.
Applsci 07 00528 g012
Figure 13. Matched results for the 32-inch monitor for three types of distortions. (a) Matched results for low distortion; (b) Matched results for middle distortion; (c) Matched results for high distortion.
Applsci 07 00528 g013aApplsci 07 00528 g013b
Figure 14. Matched results for the 23-inch monitor for three types of distortions. (a) Matched results for low distortion; (b) Matched results for middle distortion; (c) Matched results for high distortion.
Applsci 07 00528 g014
Figure 15. Projected images using the three types of polyhedrons. (a) A projected image using the 32-hedron; (b) A projected image using the octahedron; (c) A projected image using the dodecahedron.
Applsci 07 00528 g015
Figure 16. Artwork identification precision for the seven types of features for the three types of monitors. (a) 79-SIFT; (b) 32-SIFT; (c) 23-SIFT; (d) 79-SURF; (e) 32-SURF; (f) 23-SURF; (g) 79-FAST; (h) 32-FAST; (i) 23-FAST; (j) 79-BRISK; (k) 32-BRISK; (l) 23-BRISK; (m) 79-MSER; (n) 32-MSER; (o) 23-MSER; (p) 79-HOG; (q) 32-HOG; (r) 23-HOG; (s) 79-FREAK; (t) 32-FREAK; (u) 23-FREAK.
Applsci 07 00528 g016aApplsci 07 00528 g016b
Figure 17. Number of matched features and the DSK for the artwork Mona Lisa. (a) Number of matched features; (b) DSK.
Applsci 07 00528 g017
Figure 18. Comparisons of before and after applying the DSK. (a) 79-octahedron; (b) 32-octahedron; (c) 23-octahedron; (d) 79-dodecahedron; (e) 32-dodecahedron; (f) 23-dodecahedron.
Applsci 07 00528 g018
Table 1. Original list of artworks.
No.NameImage SizeFile Size
1Cafe Terrace at Night1761 × 2235 (300 DPI)641 KB
2Lady with an Ermine3543 × 4876 (300 DPI)3.33 MB
3Family of Saltimbanques1394 × 1279 (180 DPI)233 KB
4Flowers in a Blue Vase800 × 1298 (96 DPI)385 KB
5Joan of Arc at the Coronation of Charles1196 × 1600 (96 DPI)460 KB
6The Apotheosis of Homer1870 × 1430 (300 DPI)3.1 MB
7Romulus’ Victory over Acron2560 × 1311 (72 DPI)384 KB
8The Annunciation4057 × 1840 (72 DPI)7.52 MB
9The Last Supper5381 × 2926 (96 DPI)3.19 MB
10Mona Lisa7479 × 11146 (72 DPI)89.9 MB
11The Soup1803 × 1510 (240 DPI)359 KB
12The Soler Family2048 × 1522 (72 DPI)1.91 MB
13The Red Vineyard2001 × 1560 (240 DPI)4.12 MB
14Flowering orchard, surrounded by cypress2514 × 1992 (600 DPI)2.89 MB
15Flowering Orchard3864 × 3036 (600 DPI)5.94 MB
16Woman Spinning1962 × 3246 (600 DPI)3.79 MB
17Wheat Fields with Stacks3864 × 3114 (600 DPI)6.01 MB
18Bedroom in Arles767 × 600 (96 DPI)40.9 KB
19The Starry Night1879 × 1500 (300 DPI)761 KB
20A Wheat Field, with Cypresses3112 × 2448 (72 DPI)7.22 MB
Table 2. Feature extraction and matching times.
FeaturesFeature Extraction Time (s)Feature Matching Time (s)
ODSPSHODSPSH
SIFT1.1921.2561.5612.2250.0270.0290.0490.061
SURF0.9410.9751.1251.6300.0020.0030.0020.002
MSER1.0261.0501.1611.6890.0020.0020.0010.001
FAST0.9260.9581.1081.5970.0040.0030.0020.002
BRISK0.9290.9621.1131.6010.0020.0020.0020.002
HOG1.1611.1471.1631.7480.0030.0020.0010.001
FREAK0.9250.9581.1091.5950.0020.0020.0020.002