1. Introduction
Drilling a structurally complex well, irrespective of whether it is a horizontal well, a directional well, an extended reach well, or a multilateral well, has become commonplace in the oil and natural gas industry, as companies seek to drill deeper and further optimize the oil and gas production in the target field [
1,
2,
3]. As a result, the high frictional resistance of a drill-string against the borehole rock has become a concern in the drilling process [
4,
5,
6]. This source of additional torque and drag will lead to a low rate of penetration (ROP), the wear of drilling tools, short runs, wellbore instability, and complex stress of the drill string, etc. [
1]. In particular, wellbore instability sometimes leads to the pipe becoming stuck, which may require plugging and side tracking, significantly driving up the cost of reservoir development [
7]. Moreover, the driller’s ability to maintain tool face control and to transfer weight to the bit can be severely limited because of the excessive friction, which limits the depth and accuracy of the drilled boreholes [
1,
8].
There are a series of methods and tools used for torque and drag reduction, and which ultimately allow the drill-string to drill to the total depth. Axial oscillation tools (AOTs) and lateral vibration tools (LVTs) are the two most common tools used to generate benign vibrations within the drill-string and/or bottom-hole assembly (BHA) to reduce friction [
9]. AOTs usually employ sliding or rotating valves driven by mud to generate pressure pulses, and the pressure pulses can be converted into an axial oscillating motion by a shock tool that is run above or incorporated into the AOT [
10]. LVTs usually employ eccentric rotating masses driven by mud to create a vibration between the borehole wall and the tool, thereby reducing friction. Both of these tools have been previously demonstrated to be effective, although AOTs exhibit a better performance than LVTs [
9,
11]. One of the most popular AOTs currently on the market is the Drilling Agitator System (DAS), which was developed by National Oilwell Varco
® and was introduced into the market in 2002 [
6,
12,
13]. It has been used for drilling practices in thousands of runs globally and has shown a clear improvement in drilling performance by reducing the drag and torque at the drill-string. The Friction Drag Reducer (FDR) tool is another AOT on the market which has been widely used for coiled tubing (CT) [
14]. This tool is a double acting hydraulic cylinder, generating axial oscillation in the BHA by mechanical valves, causing a minor reciprocating movement. A representative LVT is the drag reduction tool based on a rotary-eccentric mass [
15]. It can generate lateral vibration by the internal periodic rotation of an eccentric shaft driven by a screw motor. There are still some less common friction reduction tools on the market, such as the LoTAD
TM drilling system of Weatherford
®, which is neither an AOT nor an LVT, using innovative rollers to minimize torque, drag, and tool-joint wear while drilling [
16]. The Surface Acoustic Pulse Generator (SAPG) is another friction reduction tool, generating an intense pressure pulse by creating a water hammer in flowing mud at a location at the surface to vibrate the drill-string, resulting in a reduced torque requirement [
17]. All of the friction reduction tools motioned above have been successfully used in numerous drilling engineering projects. However, due to the complicated structure with deformable or movable parts and the subsequent maintenance, technical difficulties associated with erosion, wear, and failures have slowed down the improvement of these tools and made it challenging to use them within practical applications.
By using a no-moving-component output-fed bistable fluidic oscillator to control fluid which alternatively flows into a parallel path where a piston moves forth and back, generating an intense pressure pulse by creating a water hammer at the stoke end of the piston, Liu [
18] proposed a novel AOT, namely the fluidic axial oscillation tool(FAOT). Its feasibility in terms of its application to horizontal directional well drilling was verified by He et al. [
19], by using CFD (Computational Fluid Dynamics) simulations and experimental tests. Because of the absence of any movable or deformable parts and the manufacture with an all-metal construction, the working life of an FAOT can be remarkably extended, exhibiting a resistance to high temperatures, corrosive environments, and other extreme ambient conditions. A number of field tests have shown that the drilling efficiency of FAOTs in directional well drilling can be improved by more than 50% (on average) compared with the conventional drilling method [
20,
21]. Moreover, this tool can work for more than 155 h without failure in a down-hole complex environment [
21]. Therefore, FAOTs seem to be a promising solution to develop the new generation of friction reduction tools for the drilling process of a complex well.
The FAOT is not a totally new design, as it seems to be an analogue of the fluidic hammer patented in the 1970s—based on an output-fed bistable fluidic oscillator—as discussed by Zhang et al. [
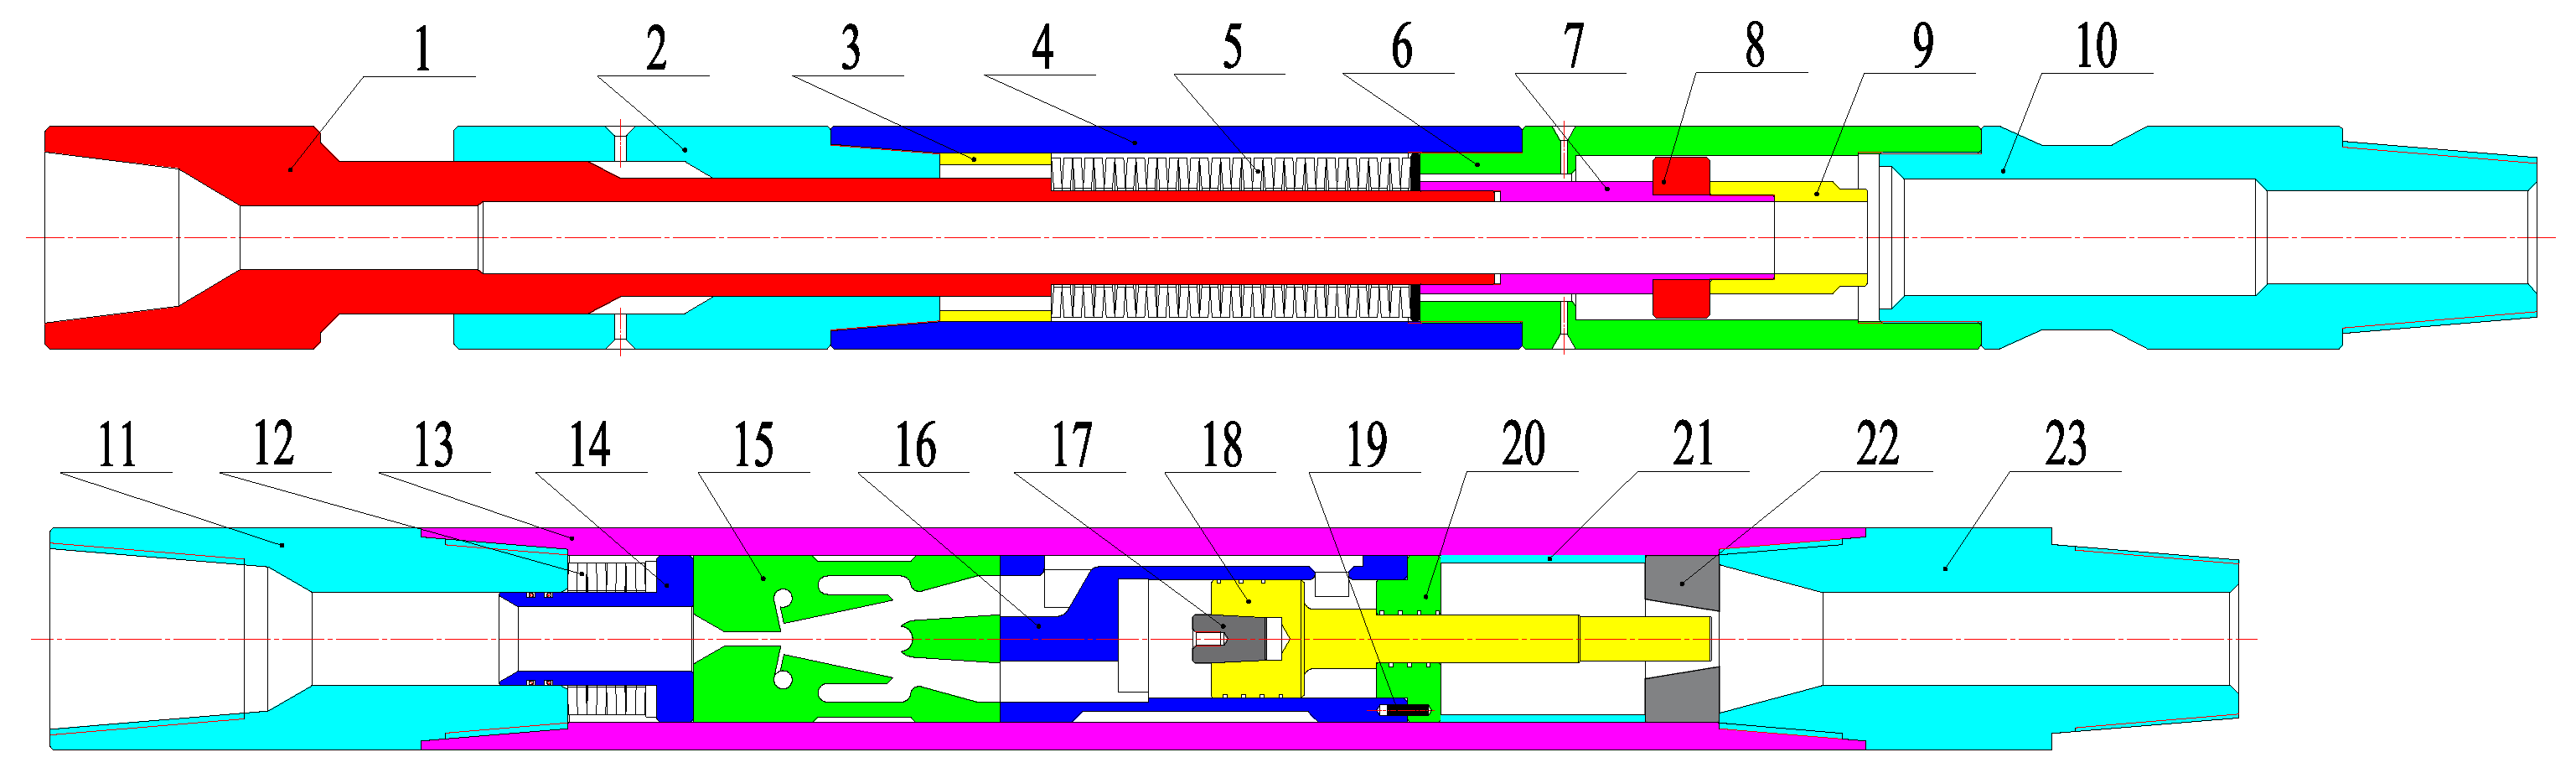
22]. As presented in
Figure 1, in the original design of an FAOT, a throttle plate was introduced into the pressure pulsation assembly to enhance the intensity of pressure pulsation. When the fluidic oscillator actuates the piston to move forth and back, cyclical restrictions are generated in the flow path as the piston rod passes over the taper hole of the throttle plate. The total flow area changes from the maximum to minimum value, generating the desired pressure pulses which can be superimposed on the pressure pulses generated in the working chamber caused by the sudden stop of the piston. Following this, the superimposed pressure pulses propagate to the axial oscillation assembly, where they are converted into an axial oscillating motion. However, this specially designed structure may be questionable or even counterproductive, as it can also serve as a cushion which may buffer the forward movement of the piston, resulting in a lower stroke end velocity of the piston. According to Joukowsky’s law [
23], the produced water hammer pressure is proportional to the stroke end velocity of the piston (ignoring the velocity rebounded), which implies that a lower stroke end velocity leads to weaker pressure pulses being generated in the working chamber. This impairment may be stronger than the enhancement of the synergistic effect, or at least counteract it to some extent. Besides, an additional pressure drop caused by this throttling structure is not desired. Therefore, the performance analysis of an FAOT with the absence of a throttling plate is meaningful and poses some possibilities for making improvements.
3. Experimental Apparatus and Approach
The original design of the FAOT with a throttling plate is here described as the LFT design and the present focused case with the absence of a throttling plate is described as the ZFT design. An LFT tool with a 120 mm diameter was manufactured, and subsequently, a ZFT could be modified from the LFT. As displayed in
Figure 3, in order to experimentally evaluate the working performance of an FAOT, three pressure transducers (Sensata Technologies, Inc., Attleboro, MA, USA) with the same specifications were used to sense the pressure fluctuation at three different positions of the oscillation tool, i.e., (i) the inlet of the fluidic oscillator; (ii) one of the side passages; and (iii) the front chamber of the cylinder. Besides, a displacement transducer (Sensata Technologies, Inc., Attleboro, MA, USA) was mounted on the sleeve to measure the amplitude of axial oscillation. All of the experimental tests were carried out on level ground and the drilling mud in the experiments was the conventional drilling fluid successfully used in directional well drilling. The tested FAOT was driven by a high pressure truck-mounted pump (Yantai Jereh Oilfield Services Group Co., Ltd., Yantai, China), which supplied it with drilling mud. Various quantities (volume flow rate,
QV) of drilling fluid were supplied to the fluidic oscillator, to drive the oscillation tool to work. As depicted in
Figure 3, both the pressure and displacement at the measuring positions of the oscillation tool were acquired and recorded by a data acquisition system. The statistic of the measured pressure and displacement spectrum was 0.5%, at a 95% confidence level. In the end, the received data were analyzed and displayed by a computer.
In order to study the performance of the fluidic axial oscillation tool with the absence of a throttling plate and try to figure out the differences between the ZFT and LFT designs, a comparison analysis in terms of the pressure drop, oscillation amplitude, and pressure fluctuations in the measured positions between the two designs was performed by the experimental system. In addition, the oscillation frequency and the dependence between the supplied volume flow rate and the oscillation frequency are also some of our main concerns.
4. Results and Discussion
Figure 4 illustrates the measured pressure
P (static pressure) at three different positions of a ZFT versus the measuring time
T when the supply volume flow rate
QV was 16 L/s. As displayed, periodic pressure pulses were produced at (i), (ii), and (iii), respectively. Both of the pressure values and the pulse amplitude measured at (i) were larger than that at (ii) and (iii), and the pressure values at (iii) were the smallest. However, in the study of He et al. [
19], the pressure values at the front chamber (iii) were larger than the pressure at the side passage. This difference is caused by the throttling action of the throttling plate, which raised the pressure in the front chamber to a certain level. In our study, we focus more on the pressure at (i), as this is the direct power actuating the oscillation assembly to implement oscillation movement. Besides, if we use the pressure at the outlet of the oscillation tool as the reference for the evaluation of pressure difference and ignore the kinetic energy at the inlet of the fluidic oscillator, the pressure drop of the system is equal to the pressure measured at (i). The pulse amplitude of pressure drop
A is defined as:
where
Pmax and
Pmin are the maximum and minimum of the pressure at (i), respectively. Additionally,
Pmea is the mean value of the pressure drop (mean value of the pressure drop in a working cycle) of the system. Another dimensionless performance index is defined as the relative pulse amplitude of pressure drop
AP', which can be calculated from:
A larger pulse amplitude AP implies a stronger ability of pressure pulse production and a smaller mean pressure drop Pmea implies lower system power consumption. Combining both AP and Pmea, it can be concluded that an FAOT exhibits a better performance at a higher value of relative pulse amplitude AP′.
In order to investigate the working process of a ZFT, a unit (cycle) of pressure fluctuation (curve i) is divided into four sections by five highlighted circles corresponding to four working states of the fluidic oscillation tool. At the a-b state, the value of pressure drop
P decreases with increasing time
T and reaches the minimum at b; this phenomenon conforms to the case when the piston is moving forward and the main jet is attached to the attachment wall flowing to the rear chamber of the cylinder. This is because, while the piston is moving forward, its velocity increases with the increase of time, which leads to an increase of flow recovery. An increased flow recovery means a lower hydraulic resistance downstream of the output channel connected to the rear chamber, as issuing flow can easily enter the working chamber of the cylinder. Therefore, a decrease of pressure drop will be obtained. Because of the existence of the piston rod, the liquid action area of the rear chamber is larger than that of the front chamber, and the forward stroke end velocity of the piston is greater than the backward stroke end velocity. That is why the pressure drop at d is higher than b, and the state of c-d should be the case when the piston is moving backward. The subsequent state of b-c represents the jet switching process which occurred at the forward stroke end of the piston. A pressure pulse caused by the sudden stop of the piston is produced and the value of
P reaches the maximum at c. Analogously, the d-e state corresponds to the jet switching process when the piston moves to the backward stroke end and is rebounded to move forward again. It can be found that per unit of pressure fluctuation includes two pulses—one large and one small. The pressure value at e (or a) is smaller than c, which can be attributed to the fact that the forward stroke end velocity is faster than the backward stroke end velocity, resulting in a higher water hammer pressure. As displayed in
Figure 4, corresponding velocity contours of the computed flow fields are presented to describe the four working states of the fluidic oscillation tool.
Figure 5 compares the numerical data of the mean pressure drop and oscillation frequency with the experimental data. The data of the numerical and experimental mean pressure drop and oscillation frequency are almost identical, where only a slight difference is noticed, and the difference does not exceed 15%, showing considerable agreement between the results. The data obtained by the CFD simulations are slightly larger than those of the experimental tests. This is probably due to the fact that the leakage and frictional force were ignored in the numerical simulations.
Figure 6 shows the comparison of variation of pressure drop
P with time
T, between LFT and ZFT. It indicates that the pressure pulse amplitude increases when increasing the supply flow rate. When the supply flow rate is at a given constant value, the pressure drop of the ZFT will be lower than that of the LFT. The absence of the throttling plate effectively minimizes the pressure drop of an FAOT, and at the same time, the pressure pulse amplitude
AP of the ZFT does not absolutely decline, but even increases compared with the LFT.
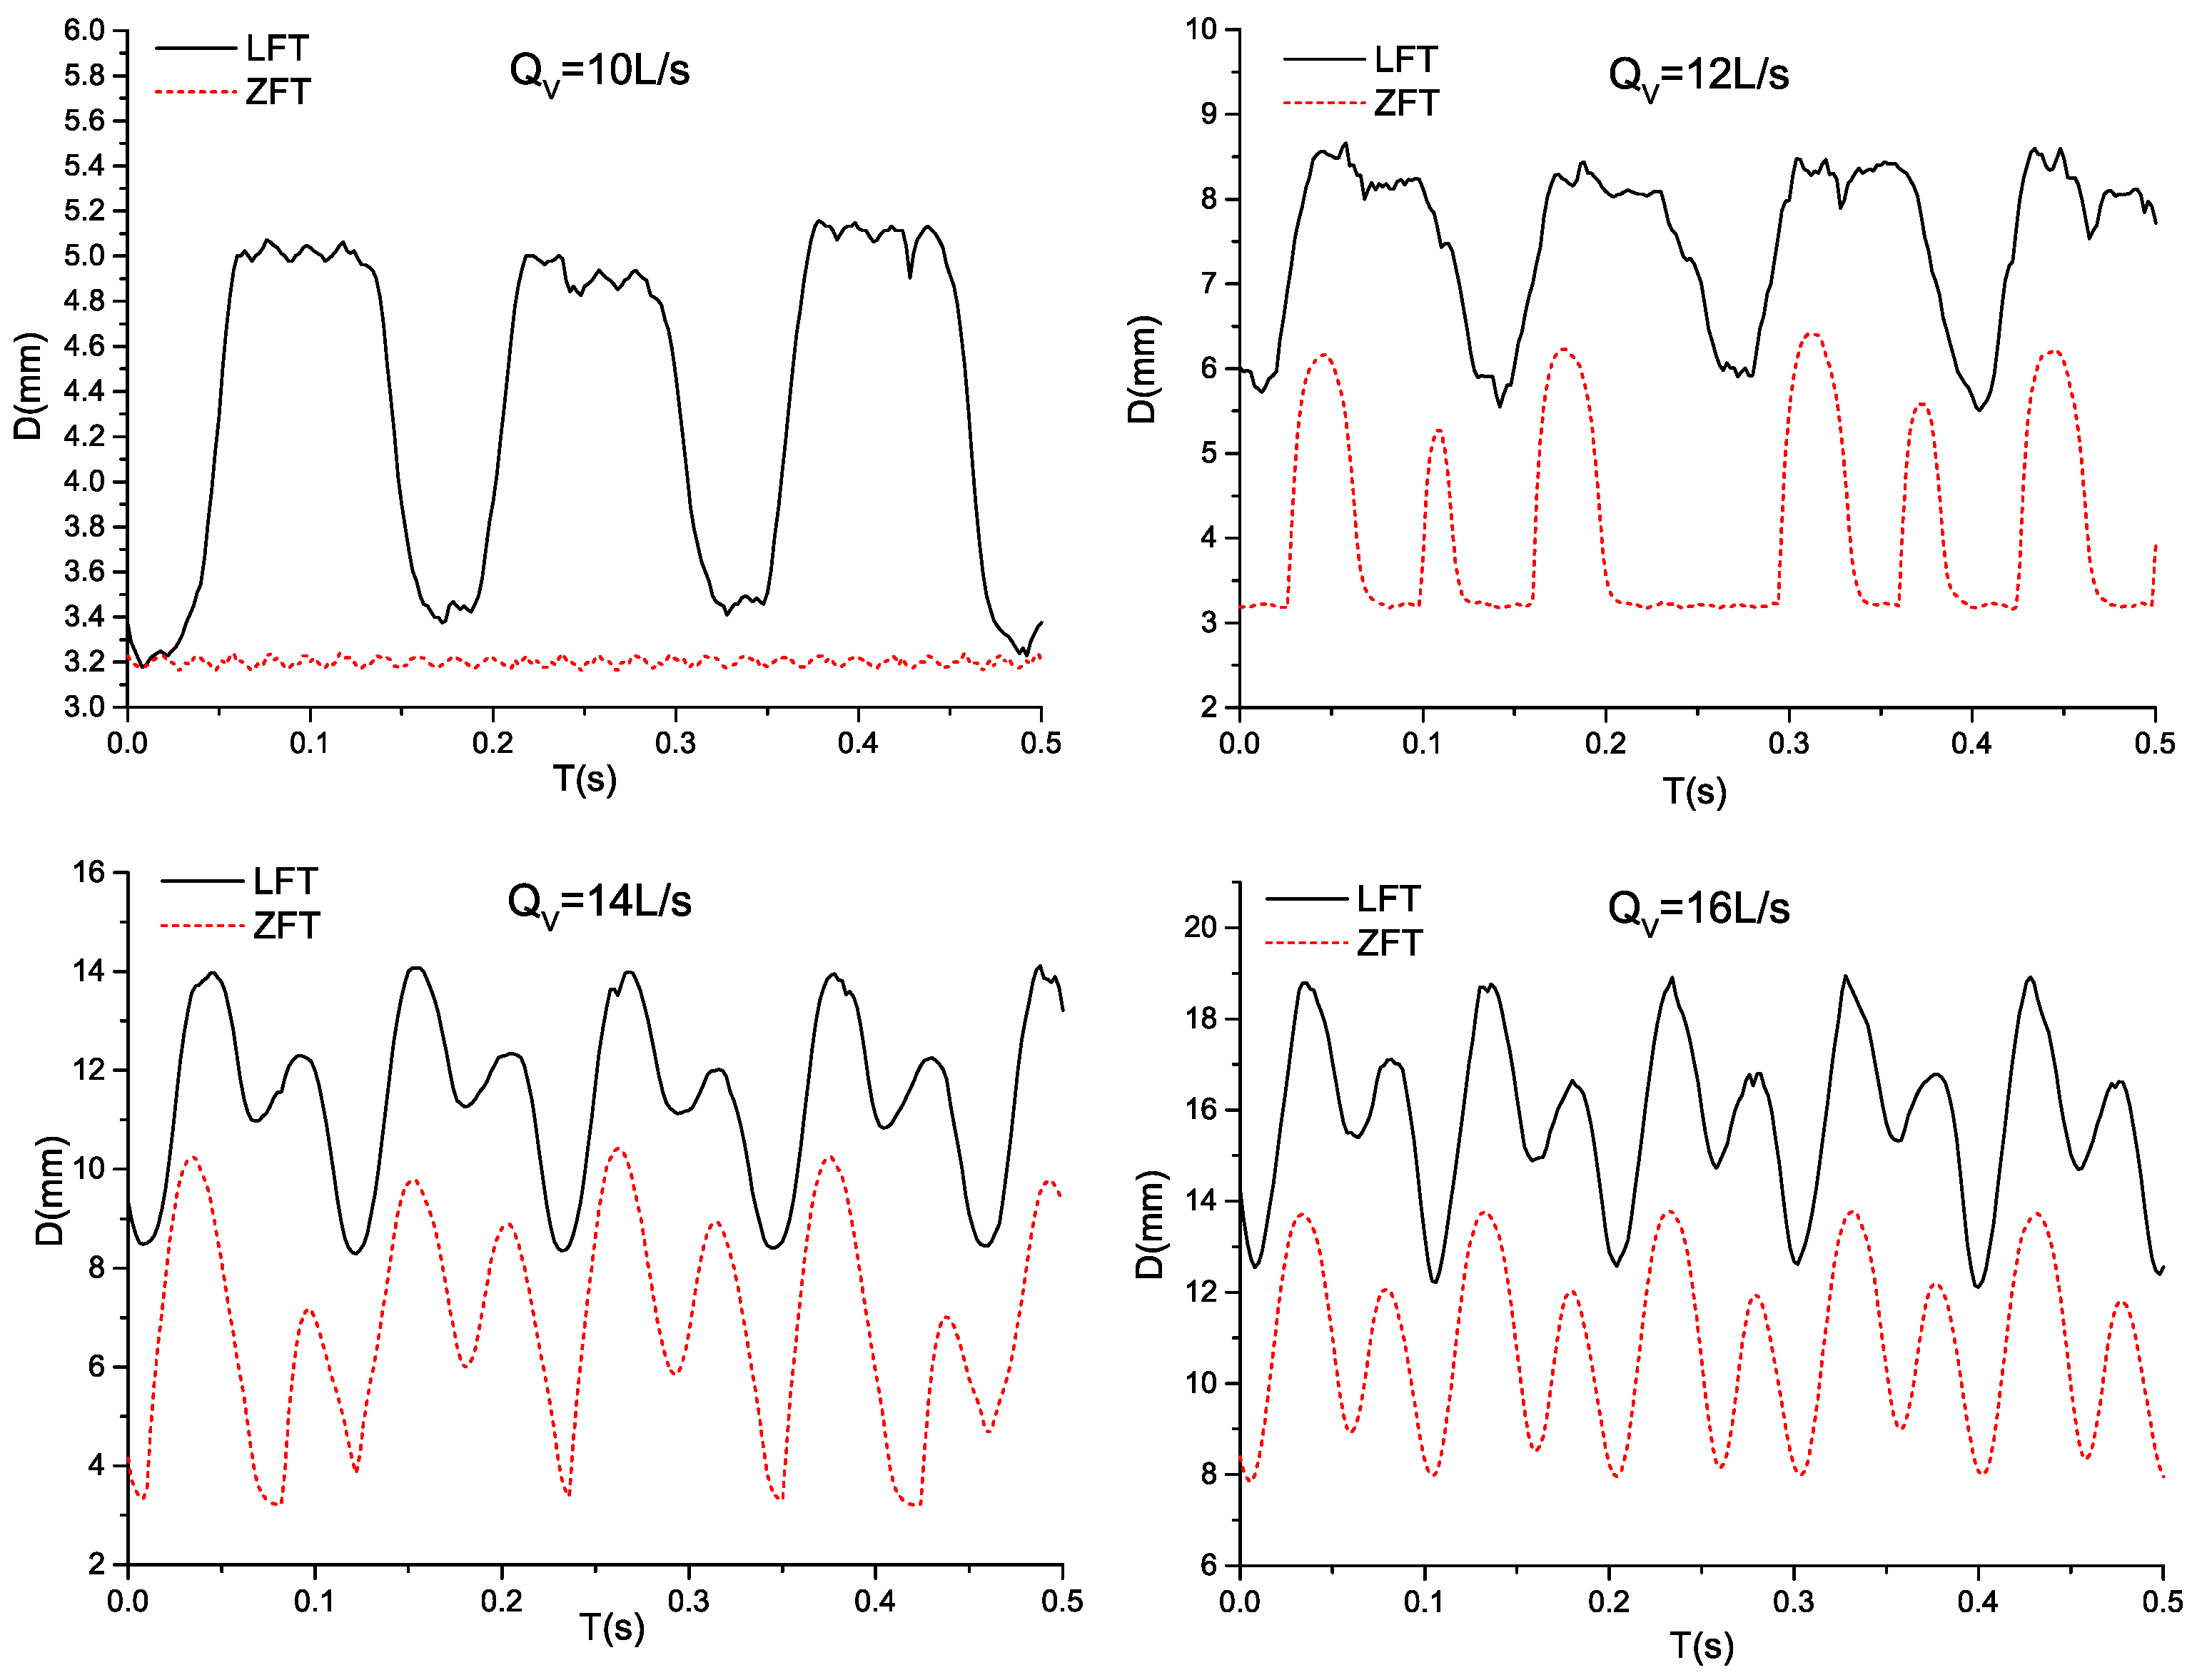
Figure 7 provides the variation of measured displacement
D with time
T for different supply volume flow rates
QV. The oscillation motion of an FAOT is quantified by the measured displacement
D which is nearly proportional to the pressure measured at (i). As illustrated in
Figure 7, when
QV = 10 L/s, the measured displacement for ZFT is hovering in a narrow range around a certain value of about 3.2 mm, while the displacement of LFT exhibits relatively obvious fluctuations. The reason for this is that the ZFT the pressure at (i) is not strong enough to prevail over the pre-tightening force of the disc springs (Numbering 5 in
Figure 1), thus the oscillation motion of the mandrel is not distinguished. Besides, in another case when
QV = 12 L/s, the measured displacement for ZFT levels off to a steady value (about 3.2 mm), which is maintained in the bottom of the curve. Hence, it can be inferred that the initial value of the displacement transducer is about 3.2 mm. In addition, similar variation trends of displacements are obtained in the cases when
QV = 14 L/sand
QV = 16 L/s. In these cases, there exists two pulses of displacement in a cycle, which coincides with the variable pressure drop displayed in
Figure 6. Therefore, the frequency of pulses is double the oscillation frequency of the fluidic oscillator. In order to sufficiently generate benign oscillations and to minimize the impact on the Measurements While Drilling (MWD) and Logging While Drilling (LWD) tools, the pulse frequency is encouraged to be limited to 10 per second [
1]. According to the study of Zhang et al. [
22], increasing the diameter of the piston rod will significantly reduce the backward stroke end velocity of the piston, thus decreasing the amplitude of the smaller pulse, as displayed in
Figure 6. Moreover, when the liquid force caused by the decreased pressure pulse is lower than the pre-tightening force of the disc springs, the pulse frequency of the displacement will be consistent with the oscillation frequency of the fluidic oscillator, which is about 5~10 Hz. In addition, comparing
Figure 6 and
Figure 7, it can be found that the variation of displacements lags behind the pressure measured at (i).
Figure 8 shows the variation of the relative pulse amplitude of the pressure drop with the supply flow rate. Numerically predicted results of the relative pulse amplitude of the pressure drop are in good agreement with those calculated from experimental data. It indicates that when the supply flow rate
QV is no greater than 16 L/s, the relative pulse amplitude of the pressure drop of ZFT is higher than that of LFT, and
QV = 14 L/s seems to be the optimum operating condition for ZFT as
AP′ reaches its maximum value under this circumstance. It can also be concluded from the CFD simulation results that when the supply flow rate
QV is greater than a certain value, the relative pulse amplitude of the pressure drop of LFT will be higher than that of ZFT.
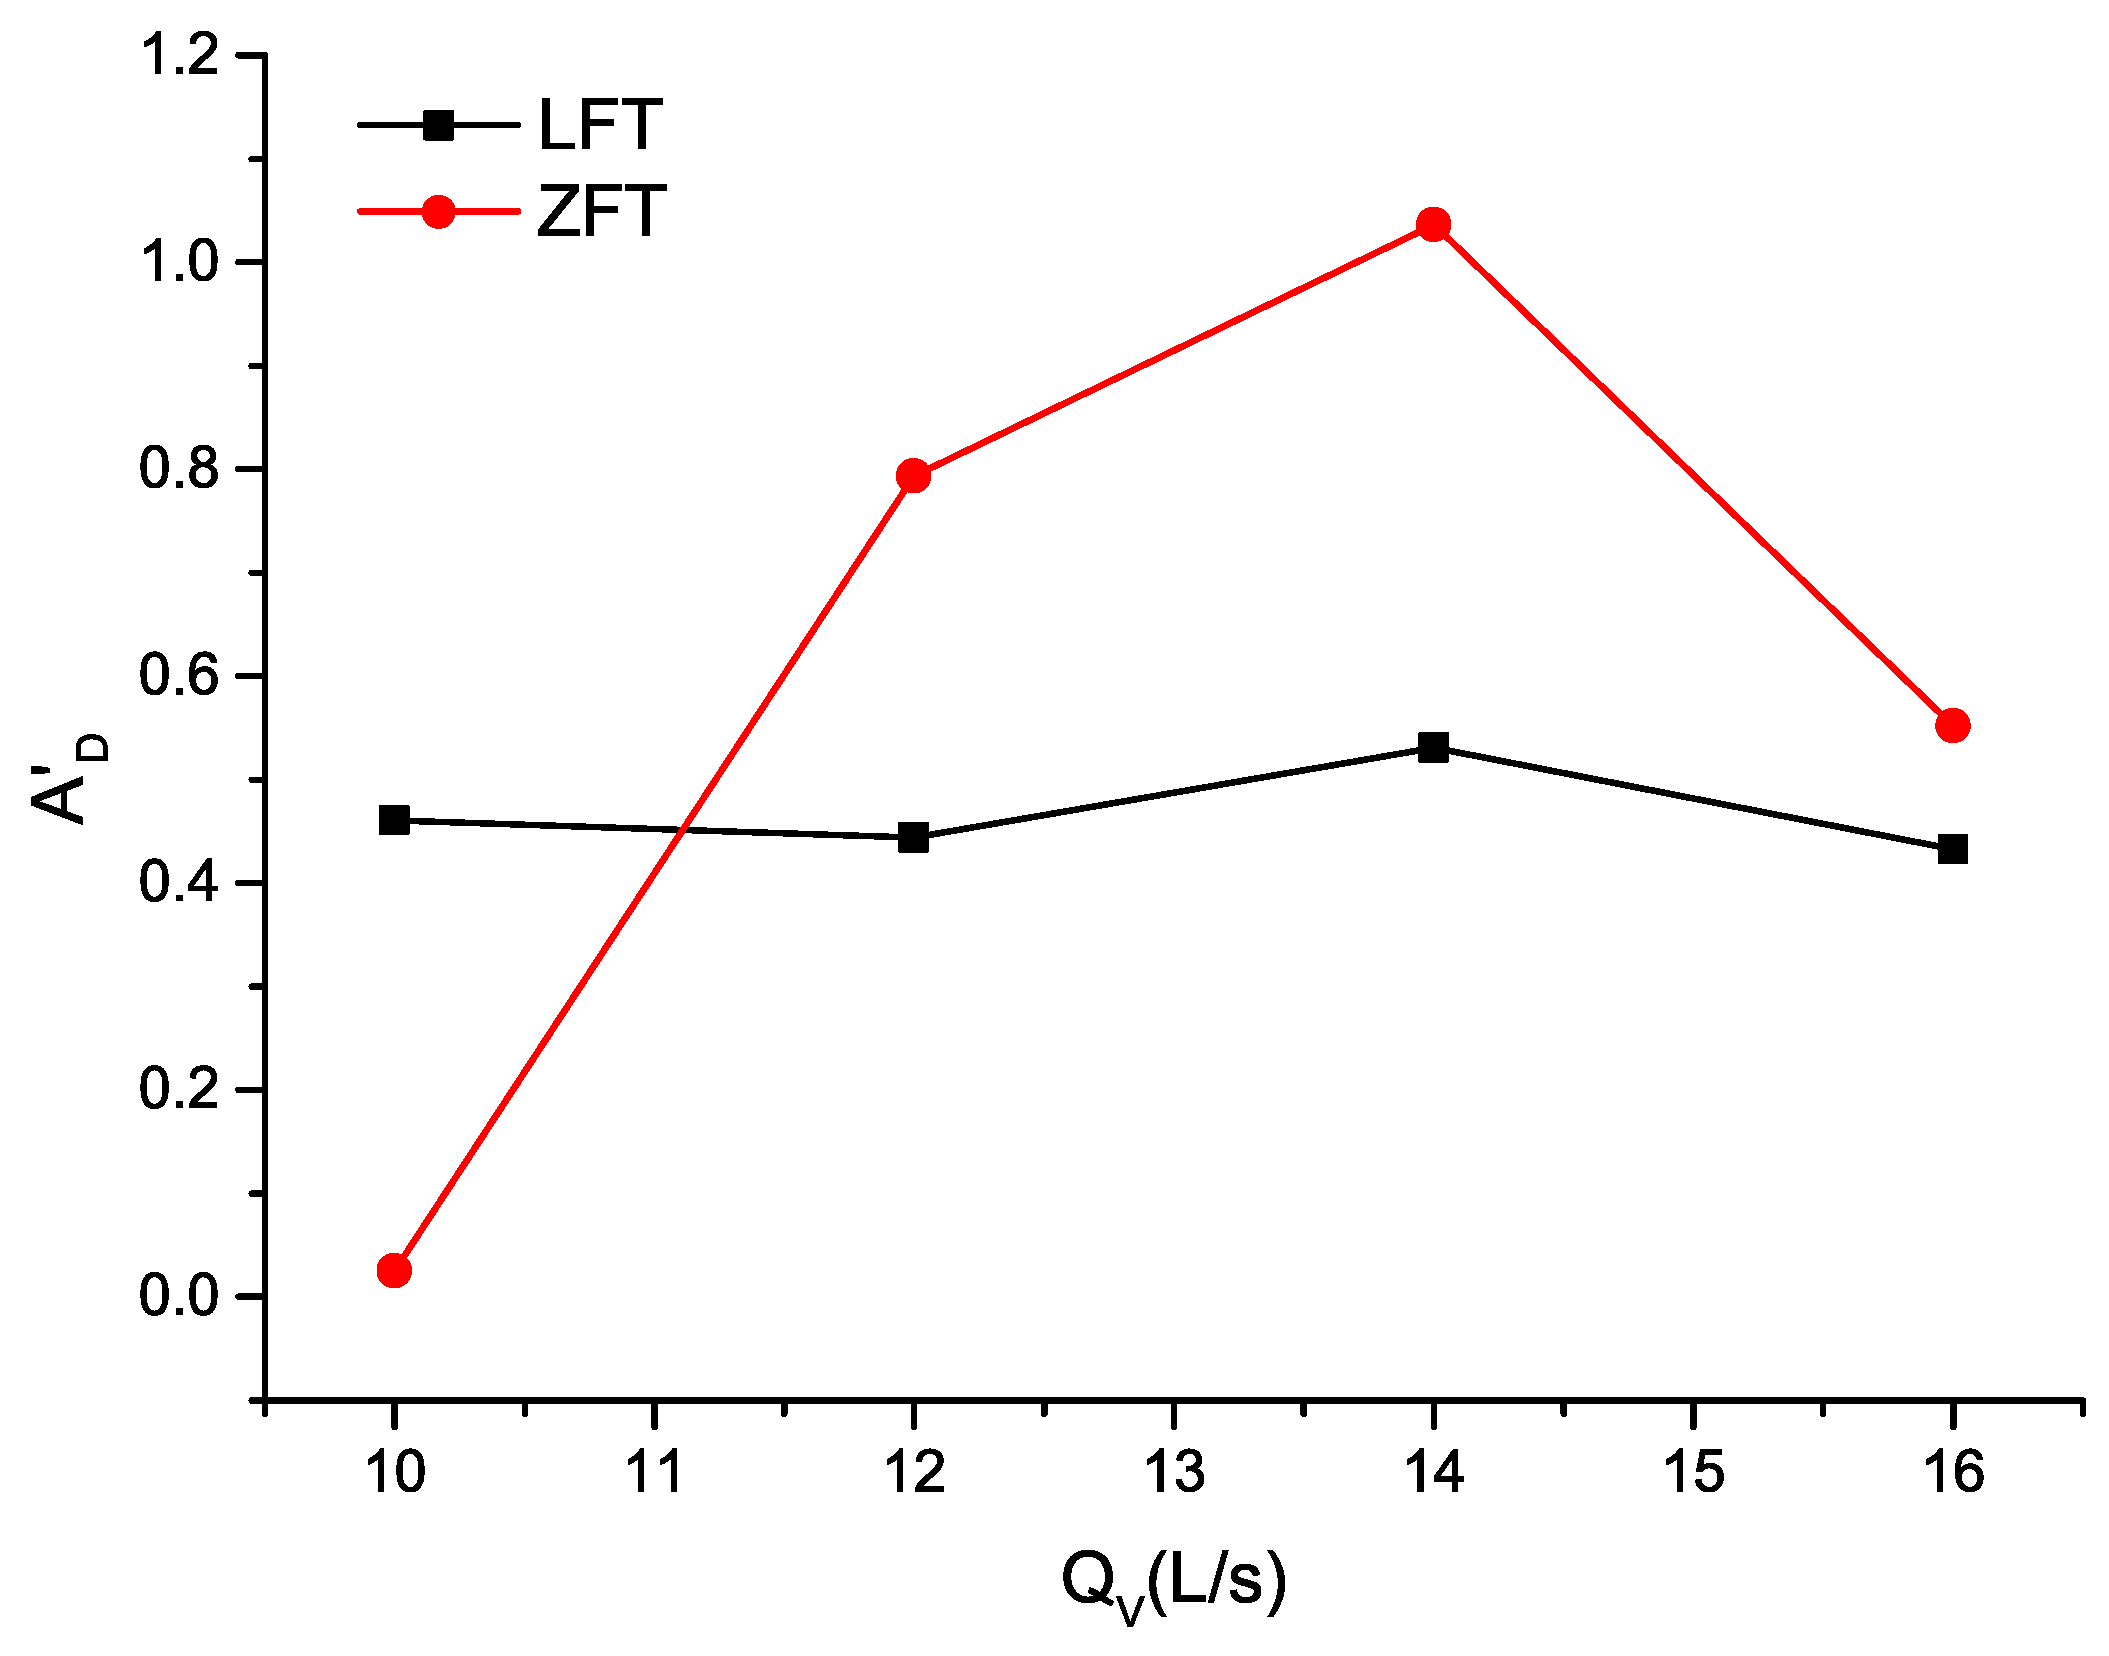
In a similar manner, the pulse amplitude of displacement can also be nondimensionalized and defined as the relative pulse amplitude of displacement:
where
AD represents the difference between the minimum and maximum values of the measured displacement
D and
Dmea denotes the mean value of displacement (mean value of the measured displacement in a working cycle). The trend of the relative pulse amplitude of displacement
AD′ with respect to the supply flow rate
QV is provided in
Figure 9. When
QV = 10 L/s, the value of
AD′ for ZFT is near to zero. This is because the pressure at (i) is not strong enough to prevail over the pre-tightening force of the disc springs, which have been discussed previously, and the amplitude of the oscillation is thus very weak. A similar result is obtained for the
AD′ value of ZFT, which reaches its maximum at
QV = 14 L/s. In addition, as shown in
Figure 9, the
AD′ differences between LFT and ZFT reduce remarkably after
QV = 14 L/s. According to the CFD results of
AP′ displayed in
Figure 8, it can be inferred that when the value of
QV continually increases, the
AD' value of LFT will be higher than that of ZFT. If the pressure pulses generated are considered as important as the pressure drop, higher values of
AP′ and
AD′ can be regarded as demonstrating a better FAOT performance. It seems reasonable to draw the conclusion that when the supply flow rate
QV is relatively low or higher than a certain value, the LFT poses a better performance; otherwise, the ZFT seems to be a preferred alternative.


