Article

UniMiB SHAR: A Dataset for Human Activity Recognition Using Acceleration Data from Smartphones

Department of Informatics, System and Communication, University of Milano Bicocca, Viale Sarca 336, 20126 Milan, Italy
*
Author to whom correspondence should be addressed.
Appl. Sci. 2017, 7(10), 1101; https://doi.org/10.3390/app7101101
Submission received: 10 October 2017 / Revised: 18 October 2017 / Accepted: 19 October 2017 / Published: 24 October 2017

Abstract

:
Smartphones, smartwatches, fitness trackers, and ad-hoc wearable devices are being increasingly used to monitor human activities. Data acquired by the hosted sensors are usually processed by machine-learning-based algorithms to classify human activities. The success of those algorithms mostly depends on the availability of training (labeled) data that, if made publicly available, would allow researchers to make objective comparisons between techniques. Nowadays, there are only a few publicly available data sets, which often contain samples from subjects with too similar characteristics, and very often lack specific information so that is not possible to select subsets of samples according to specific criteria. In this article, we present a new dataset of acceleration samples acquired with an Android smartphone designed for human activity recognition and fall detection. The dataset includes 11,771 samples of both human activities and falls performed by 30 subjects of ages ranging from 18 to 60 years. Samples are divided in 17 fine grained classes grouped in two coarse grained classes: one containing samples of 9 types of activities of daily living (ADL) and the other containing samples of 8 types of falls. The dataset has been stored to include all the information useful to select samples according to different criteria, such as the type of ADL performed, the age, the gender, and so on. Finally, the dataset has been benchmarked with four different classifiers and with two different feature vectors. We evaluated four different classification tasks: fall vs. no fall, 9 activities, 8 falls, 17 activities and falls. For each classification task, we performed a 5-fold cross-validation (i.e., including samples from all the subjects in both the training and the test dataset) and a leave-one-subject-out cross-validation (i.e., the test data include the samples of a subject only, and the training data, the samples of all the other subjects). Regarding the classification tasks, the major findings can be summarized as follows: (i) it is quite easy to distinguish between falls and ADLs, regardless of the classifier and the feature vector selected. Indeed, these classes of activities present quite different acceleration shapes that simplify the recognition task; (ii) on average, it is more difficult to distinguish between types of falls than between types of activities, regardless of the classifier and the feature vector selected. This is due to the similarity between the acceleration shapes of different kinds of falls. On the contrary, ADLs acceleration shapes present differences except for a small group. Finally, the evaluation shows that the presence of samples of the same subject both in the training and in the test datasets, increases the performance of the classifiers regardless of the feature vector used. This happens because each human subject differs from other subjects in performing activities even if she shares with them the same physical characteristics.

1. Introduction

Nowadays, many people lead a sedentary life due to the facilities that the increasingly pervasive technologies offer.
Unfortunately, it is recognized that insufficient physical activity is one of the 10 leading risk factors for global mortality: people with poor physical activity are subjected to a risk of all-cause mortality that is 20% to 30% higher then people performing at least 150 min of moderate intensity physical activity per week [1]. Another important global phenomenon currently affecting our society is population aging: the decline or even decrease of the natural population growth rates due to a rise in life expectancy [2] and to a long-term downtrend in fertility (expecially in Europe [3]). Falls are a major health risk that impacts the quality of life of elderly people. Indeed, among elderly people, accidental falls occur frequently: 30% of the over 65 population falls at least once per year; the proportion increases rapidly with age [4]. Moreover, fallers who are not able to get up are more likely require hospitalization or, even worse, die [5].
Thus, research on techniques able to recognize activities of daily living (ADLs), also known as human activities (HA), and to detect falls is very active in recent years: the recognition of ADLs may allow to infer the amount of physical activity that a subject perform daily, while a prompt detection of falls may help in reducing the consequence (even fatal) that a fall may cause mostly in elderly people.
ADLs recognition and fall detection techniques usually accomplish their task by analizing samples from sensors, which can be physically deployed in the ambient surroundings (ambient sensors, e.g., cameras, vibration sensors, and microphones) or worn by people (wearable sensors, e.g., accelerometers, gyroscopes, and barometers) [6]. To train and evaluate their techniques, researchers usually build their own dataset of samples and rarely make it publicly available [7,8,9]. This practice makes difficult to compare in an objective way the several newly proposed techniques and implementations due to a lack of a common source of data [9,10,11]. Cameras (ambient sensors) and inertial sensors (wearable devices) are the mainly used sensors to record public publicly datasets containing kinematic data of human subjects. HumanEva [12] , CMU Mocap [13] , and those reported in the survey by Chaquet et al. [14] , are examples of datasets including samples from cameras, while the works by Wang et al. [15] and Urtasum et al. [16] are some examples of methods for learning dynamical models of human motion from camera data. Only very recently, Janidarmian et al. combined 14 publicly available datasets focusing on acceleration patterns in order to conduct an analysis on feature representations and classification techniques for human activity recognition [17]. Unfortunately, they do not make the resulting dataset available for downloading.
The few publicly available datasets can been primary divided into three main sets: acquired by ambient sensors, acquired by wearable devices, and a combination of the two. Recently, a lot of attention has been paid to wearable sensors because they are less intrusive, work outdoors, and often cheaper than the ambient ones. This is confirmed by the increasing number of techniques that are based on wearable sensors (see for example the survey by Luque et al. related to fall detection techniques relying on data from smartphones [18]).
Wearable sensors are divided in two main groups: ad-hoc wearable devices (e.g., SHIMMER sensor nodes), and smartphones (e.g., Android). Concerning fall detection, several studies concluded that, in order to be used, fall detection devices must not stigmatize people nor disturb their daily life [19,20,21]. Unfortunately, devices such as ad-hoc wearable devices and ambient sensors are not well accepted by elderly people because mostly of their intrusiveness. On the contrary, smartphones are good candidate devices for hosting fall detection systems: they are are widespread and daily used by a very large number of person, included elderly people. This, on the one hand, reduces costs, and on the other, eliminates the problem of having to learn how to use a new device. Moreover, studies demonstrated that samples from smartphones sensors (e.g., accelerometer and gyroscope) are accurate enough to be used in clinical domain, such as ADLs recognition [22]. This is also confirmed by the amount of publications that rely on the use of smartphones as acquisition devices for fall detection systems [18,23] and ADLs recognition.
For these reasons we concentrate our attention on smartphones as acquisition devices both for ADL recognition and fall detection. Thus, we searched the publicly available datasets acquired with smartphones in order to identify their strengths and weaknesses so as to outline an effective method for carrying out a new acquisition campaign. We searched the most common repository (IEEE, ACM Digital Library , Google, and Google Scholar) by using in our query the terms ADL dataset and Fall dataset in combination with the following words smartphone, acceleration, accelerometer, inertial, IMU (Inertial Measurement Unit), sensor, and wearable. We selected the first 100 results for each query. Removing duplicate entries, we obtained less then 200 different references. Then we manually examined the title, the abstract, and the introduction to eliminate references unrelated to ADL recognition and fall detection, and references that were based on ambient sensors such as camera, microphones, or RFID (Radio Frequency Identification) tags. We then read carefully the remaining references and discarded those that do not make publicly available the dataset used in the experimentation. Finally, we added the relevant references that we missed with our searches but were cited in the papers we selected. At the end of the process, we individuated 13 datasets with data from smartphones and 19 with data from wearable ad-hoc sensors. We then included only those datasets that have been recorded starting from 2012 (We considered the year in which the dataset has been made available. This year does not necessarily coincide with the year in which the related article has been published) mostly because the oldest dataset including samples from smartphones is dated 2012. This choice makes the datasets homogeneous with respect to the sensors technologies related to acquisition sensors which rapidly evolves year by year.
At the end of the process, we individuated 13 datasets with data from smartphones and 13 with data from wearable ad-hoc sensors. In the following, we will detail some relevant characteristics of the 13 datasets from smartphones since our aim was to build a new dataset containing acceleration patters from smartphone able to complement the existing ones. As it will presented in 
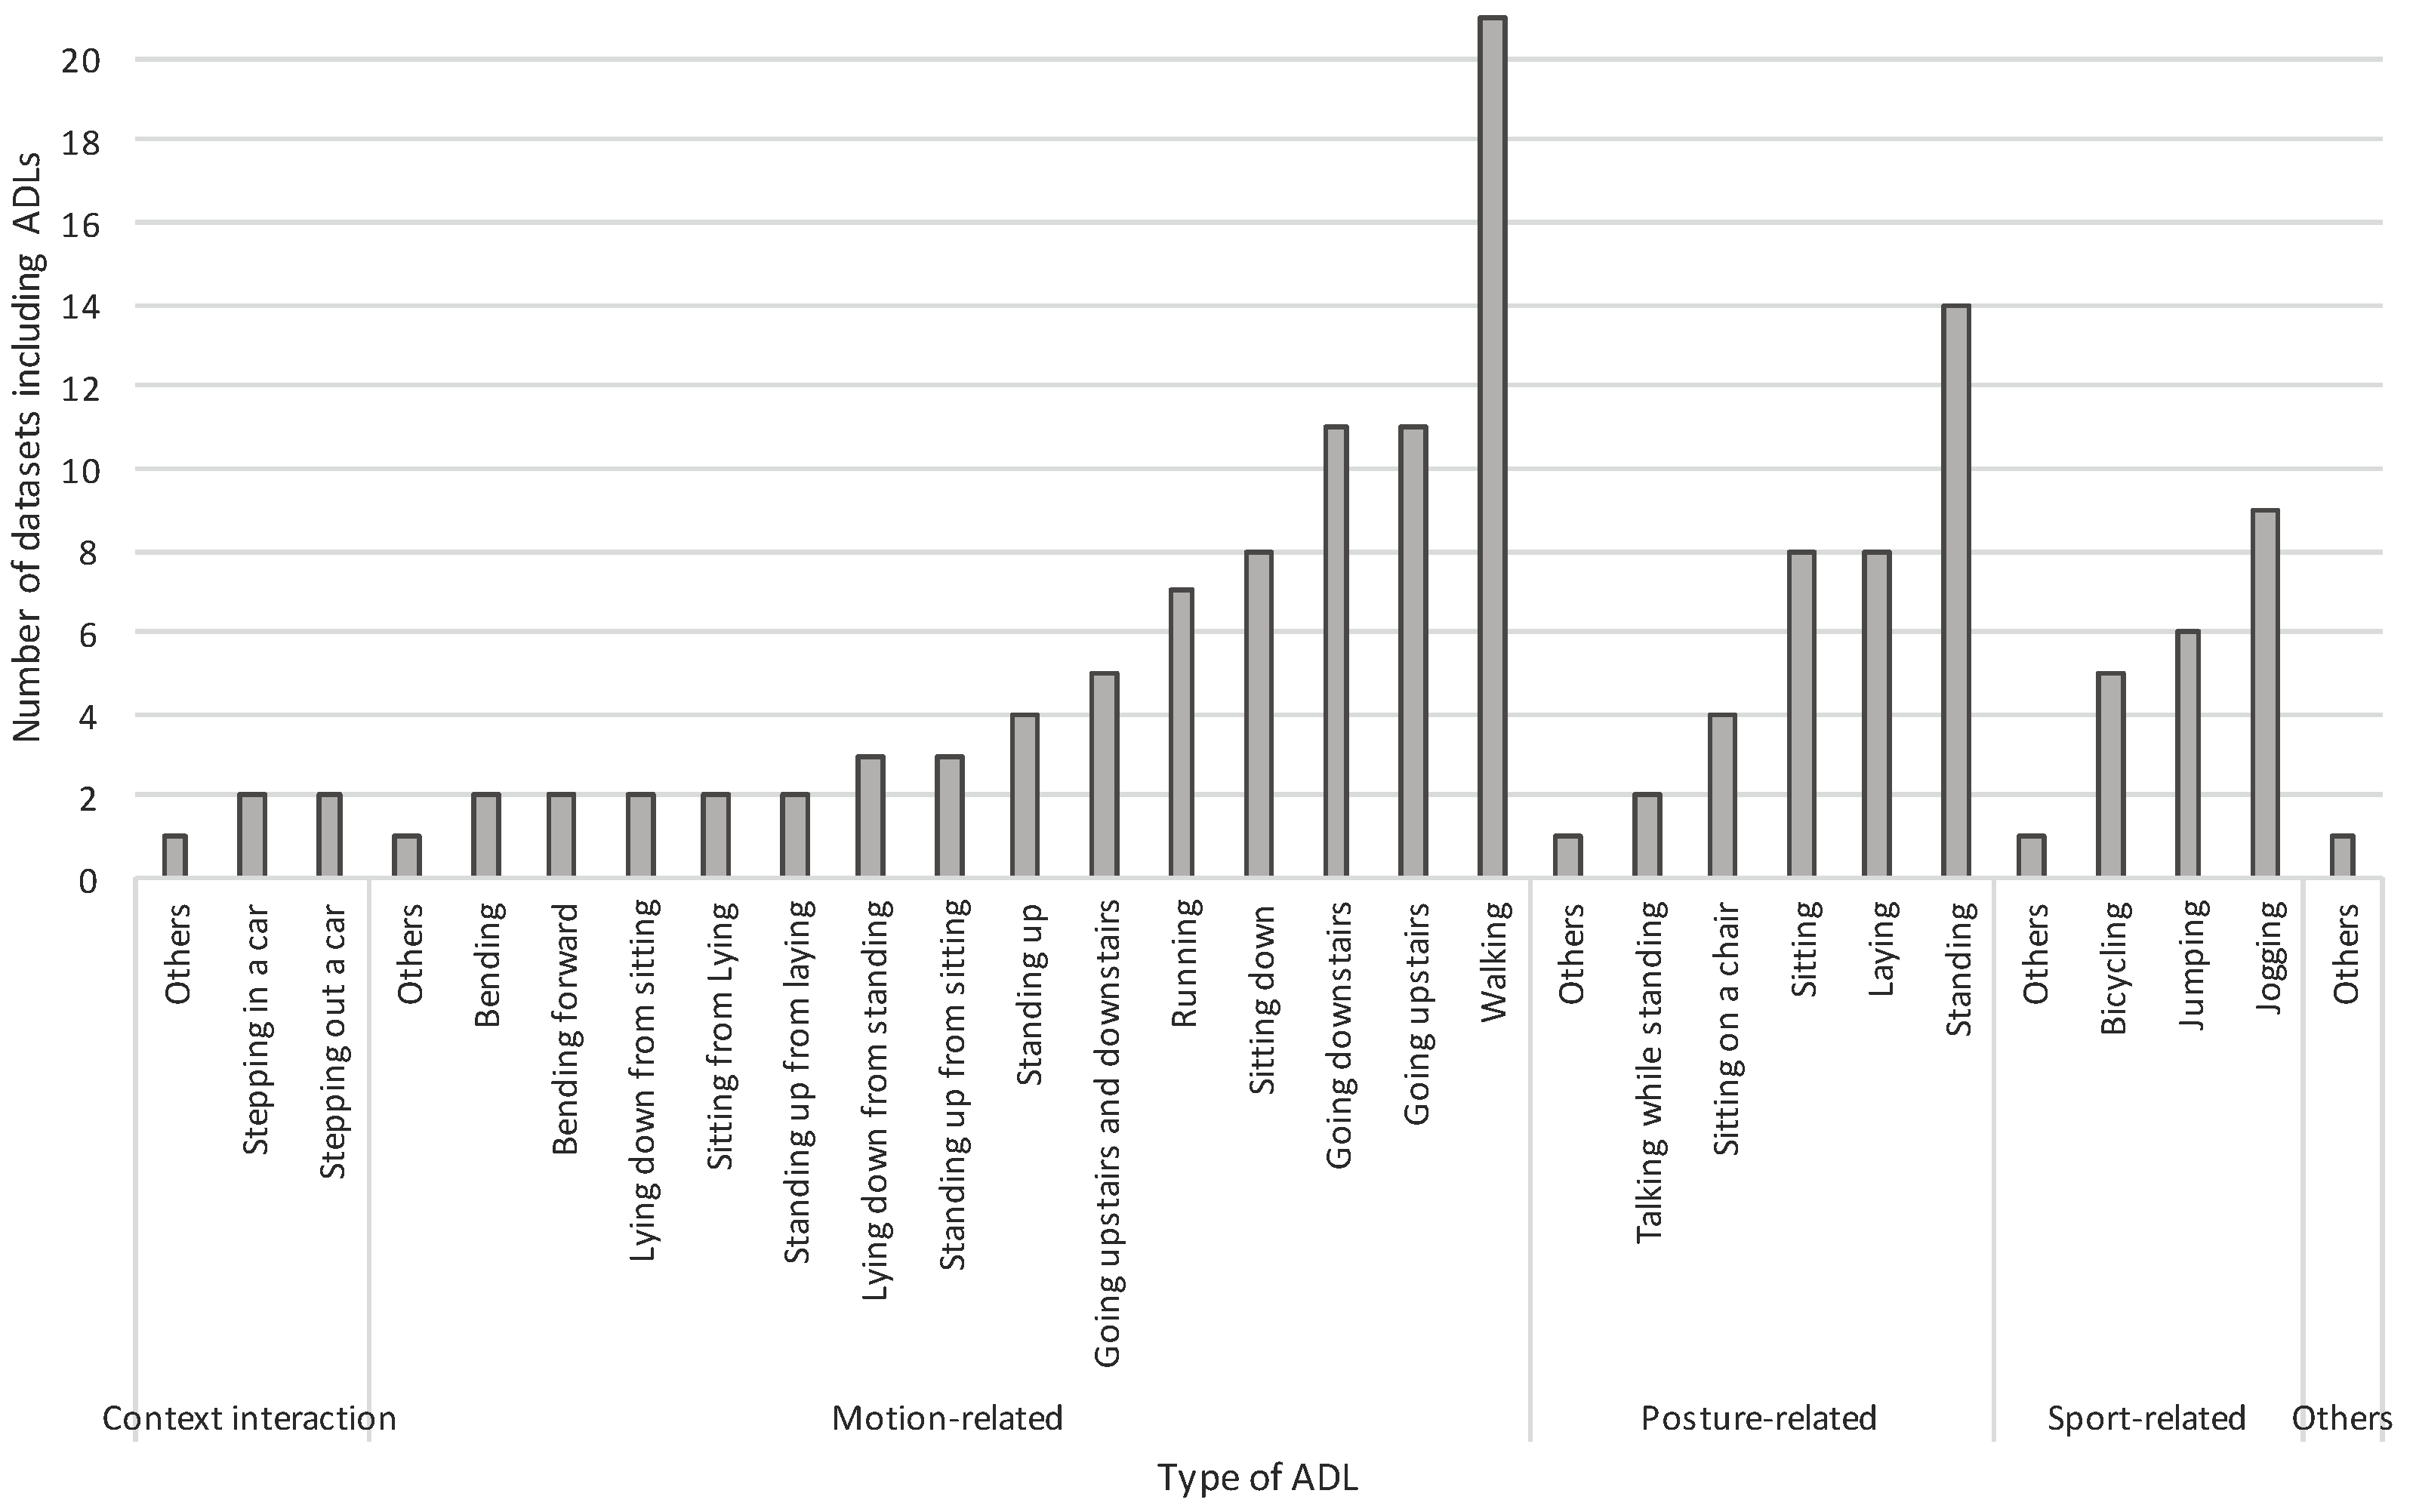
Section 2, the datasets from ad-hoc wearable devices have be examined with the aim of identifying the most common ADLs and falls.
Table 1 shows the publicly available datasets recorded by means of smartphones and their characteristics. Table 1 also includes the dataset we realized in the last row, in order to ease the comparison.
The total number of datasets decreases to 11 because MobiAct and UCI HAPT are updated versions of MobiFall and UCI HAR respectively. Thus, in the following we will refer to 11 datasets overall, discarding MobiFall and UCI HAR.
The 11 datasets have been recorded in the period 2012 to 2016 (column Year). Only 5 datasets out of 11 contain both falls (column Falls) and ADLs (column ADLs).
The average number of subjects for dataset is 18 (column Nr. of subjects). The datasets that specify the gender of the subjects (which are MobiAct, RealWorld (HAR), Shoaib PA, Shoaib SA, tFall, and UMA Fall) contain in mean 6 women and 13 men (columns Gender-Female and Gender-Male respectively).
DMPSBFD, UCI UIWADS, and WISDM do not specify the age of the subjects (column Age). In the remaining 8 datasets, subjects are aged between 21 and 43 on average with a standard deviation of 4 and 11 respectively.
Finally, only Gravity, MobiAct, RealWorld (HAR), tFall, and UMA Fall datasets provide detailed information about the height and the weight of the subjects (columns Height and Weight respectively).
The detailed information reported in Table 1 have been collected from the web site hosting the dataset, the readme files of each dataset, and the related papers. It is remarkable to notice that in many cases such information get lost in the downloaded dataset. Grey cells in Table 1 indicate that samples are stored so that they can be filtered according to the information contained in the cell.
For instance, in all the datasets, with the exception of tFall, it is possible to select subsets of samples according to the specific ADL (column ADLs). For example, it is possible to select all the samples that have been labeled walking. tFall is an exception because the samples are simply labeled as generic ADL, thus not specifying which specific kind of ADL are.
Concerning falls (column Falls), all the datasets have organized samples maintaining the information related to the specific type of fall they are related to (e.g., forward).
As specified in column Nr. of subjects, the samples are linked to the subjects that performed the related activities and, where provided, falls. This means that in all the datasets (with the exception of Shoaib PA) it is possible to select samples related to a specific subject. However, this information is unhelpful if there is no information on the physical characteristics of the subject. Looking at the double column Gender, only MobiAct, RealWorld (HAR), Shoaib PA, Shoaib SA, and UMA Fall maintain information related to the gender of the subject. Finally, it is surprising that only Gravity, MobiAct, RealWorld (HAR), and UMA Fall allow to select samples according to age, height, and/or weight of the subjects (columns Age, Height, and Weight).
In view of this analysis, only MobiAct, RealWorld (HAR), and UMA Fall allow us to select samples according to several dimensions, such as the age, the gender, the weight of the subjects, or the type of ADL. MobiAct and UMA Fall allow us to select samples also according to the type of fall. Unfortunately, the other datasets are not suitable in some experimental evaluations. For example, the evaluation of the effects of personalization in classification techniques [35] taking into account the physical characteristics of the subjects, that is, operating leave-one-subject-out cross-validation [36].
To further contribute to the worldwide collection of accelerometer patterns, in this paper we present a new dataset of smartphone accelerometer samples, named UniMiB SHAR (University of Milano Bicocca Smartphone-based Human Activity Recognition). The dataset was created with the aim of providing the scientific community with a new dataset of acceleration patterns captured by smartphones to be used as a common benchmark for the objective evaluation of both ADLs recognition and fall detection techniques.
The dataset has been designed keeping in mind on one side the limitations of the actual publicly available datasets, and on the other the characteristics of MobiAct, RealWorld (HAR), and UMA Fall, so to create a new dataset that juxtaposes and complements MobiAct, RealWorld (HAR), and UMA Fall with respect to the data that is missing. Thus, such a dataset would have to contain a large number of subjects (more than the 18 on average), with a large number of women (to compensate MobiAct, RealWorld (HAR), and UMA Fall), with subjects over the age of 55 (to extend the range of UMA Fall (We do not consider RealWorld (HAR) since it contains ADLs only. Indeed, it is most difficult to recruit elderly subjects performing falls), with different physical characteristics (to maintain heterogeneity), performing a wide number of both ADLs and falls (to be suitable in several contexts). Moreover, the dataset would have to contain all the information required to select subjects or ADLs and falls according to different criteria, such as for example, all the female whose height is in the range 160–168 cm, all the men whose weight is in the range 80–110 Kg, all the walking activities of the subjects whose age is in the range 45–60 years.
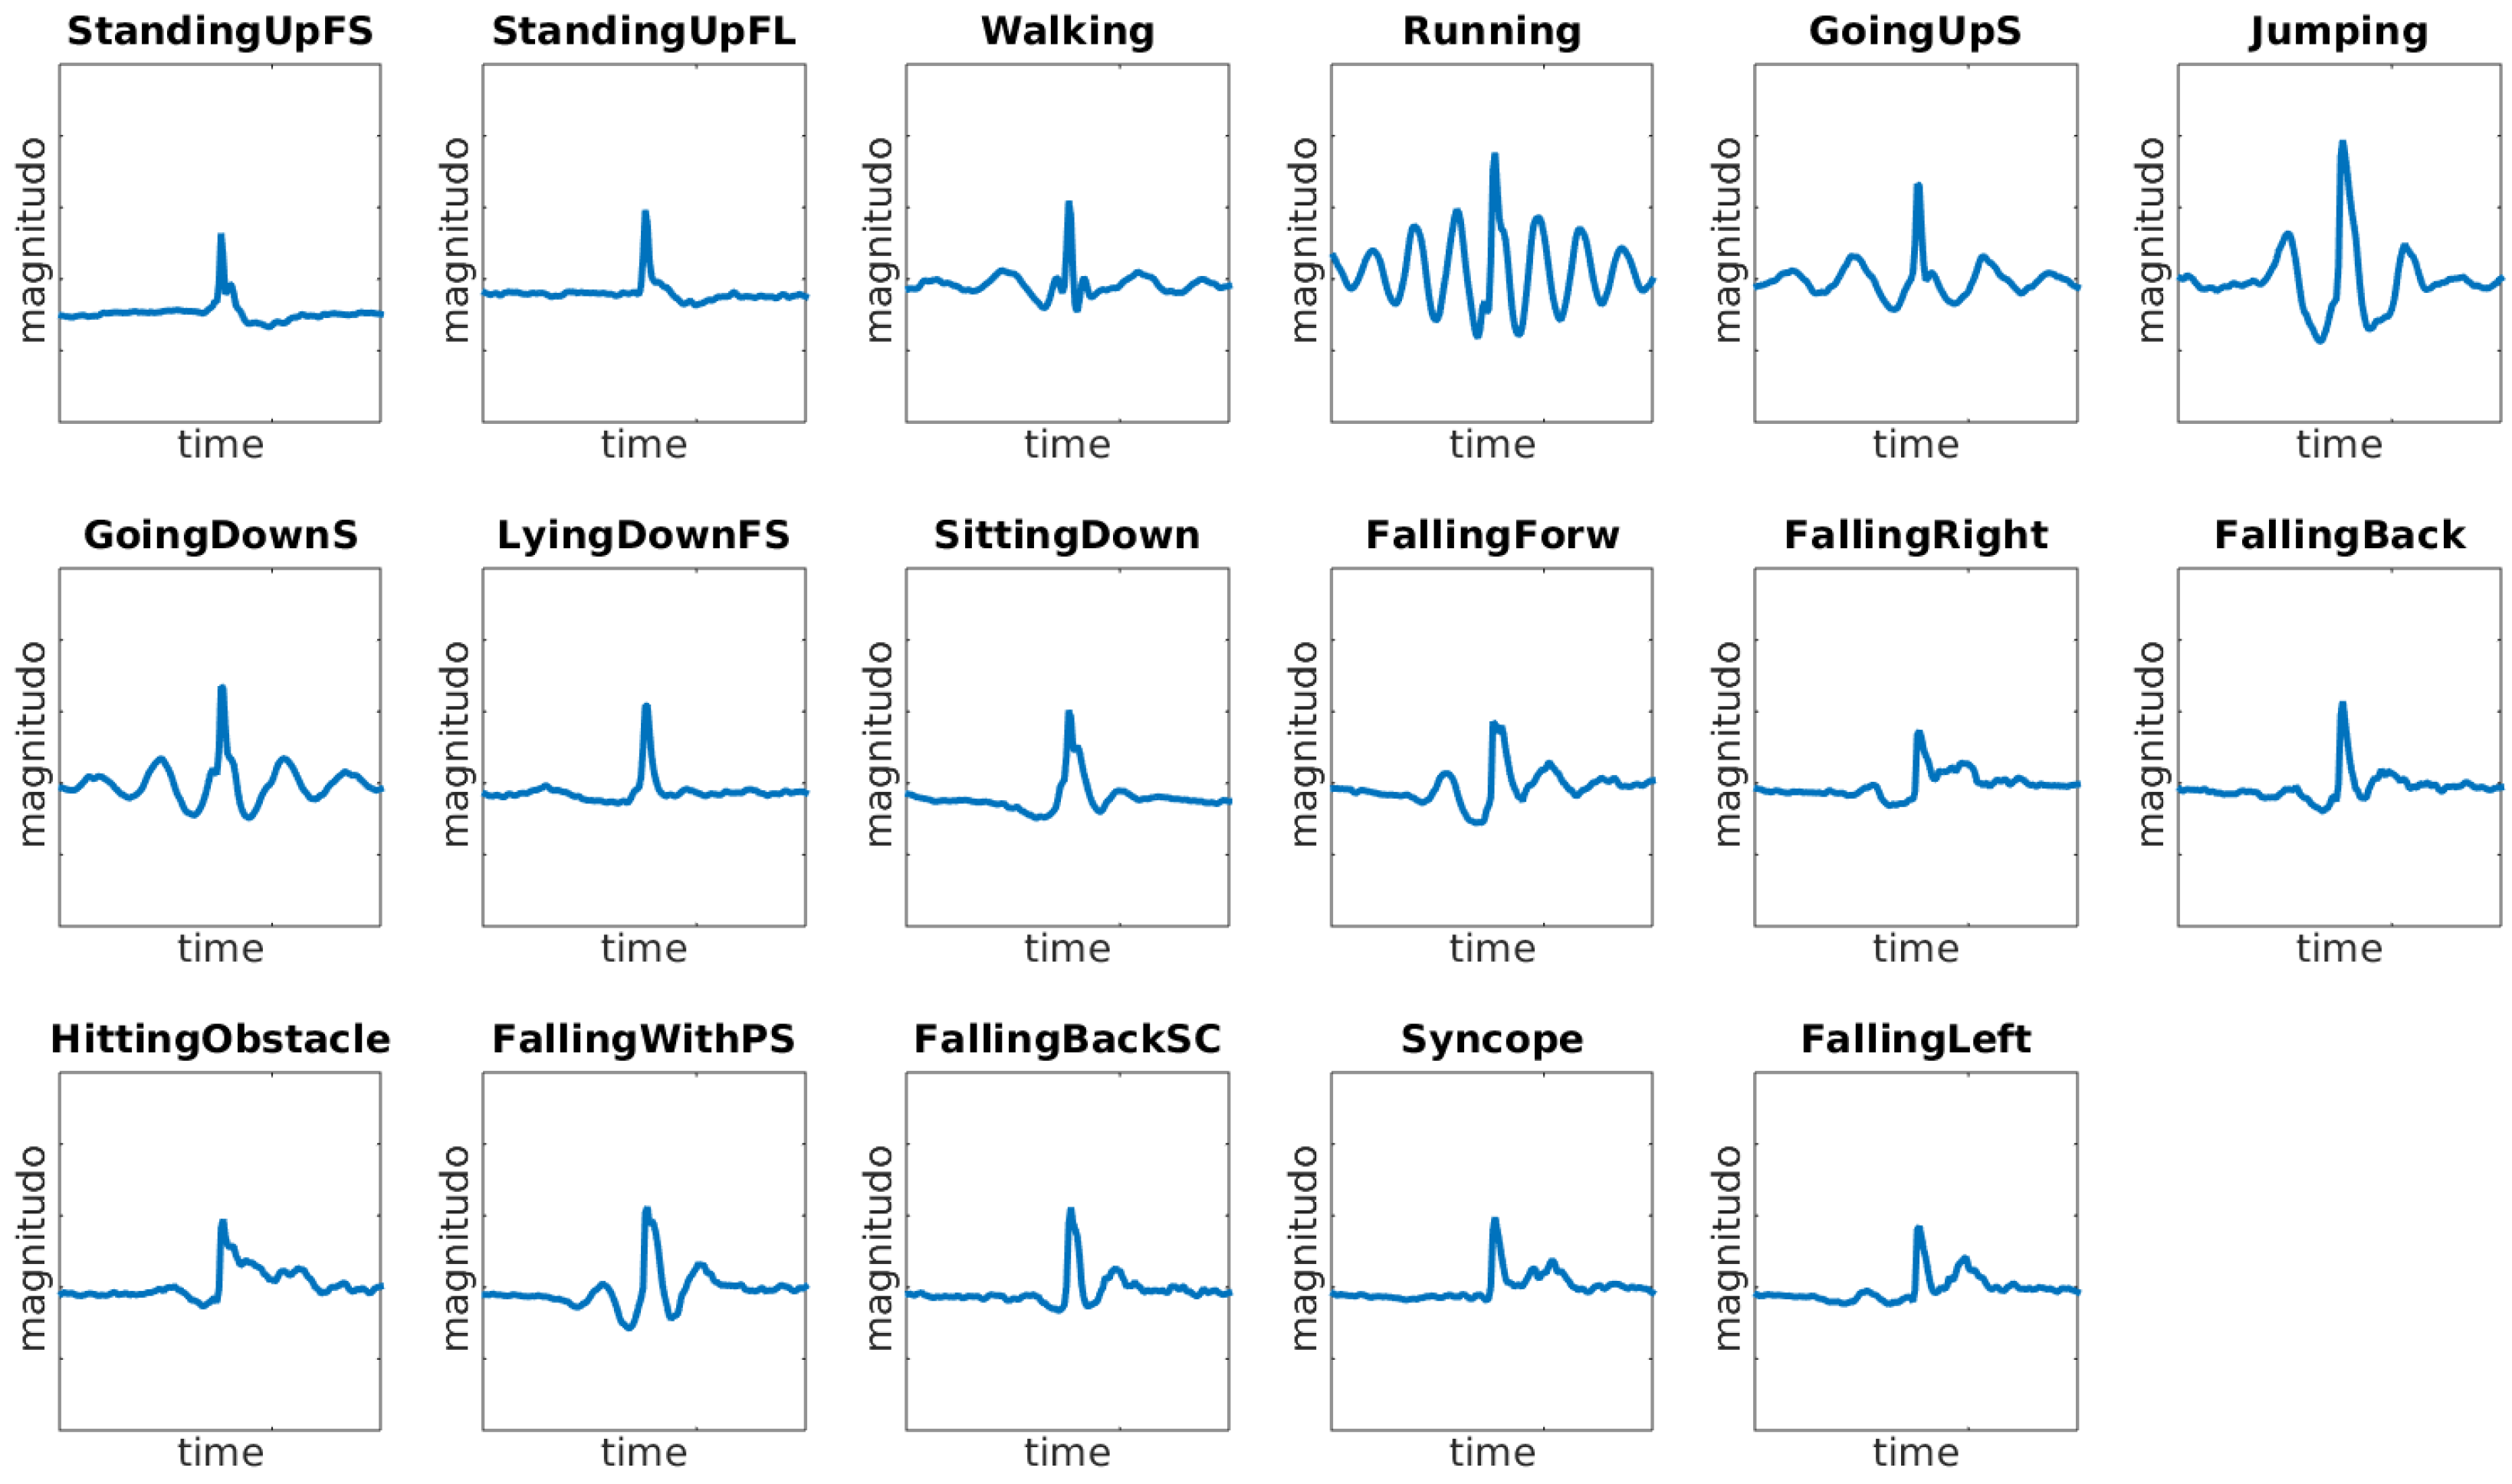
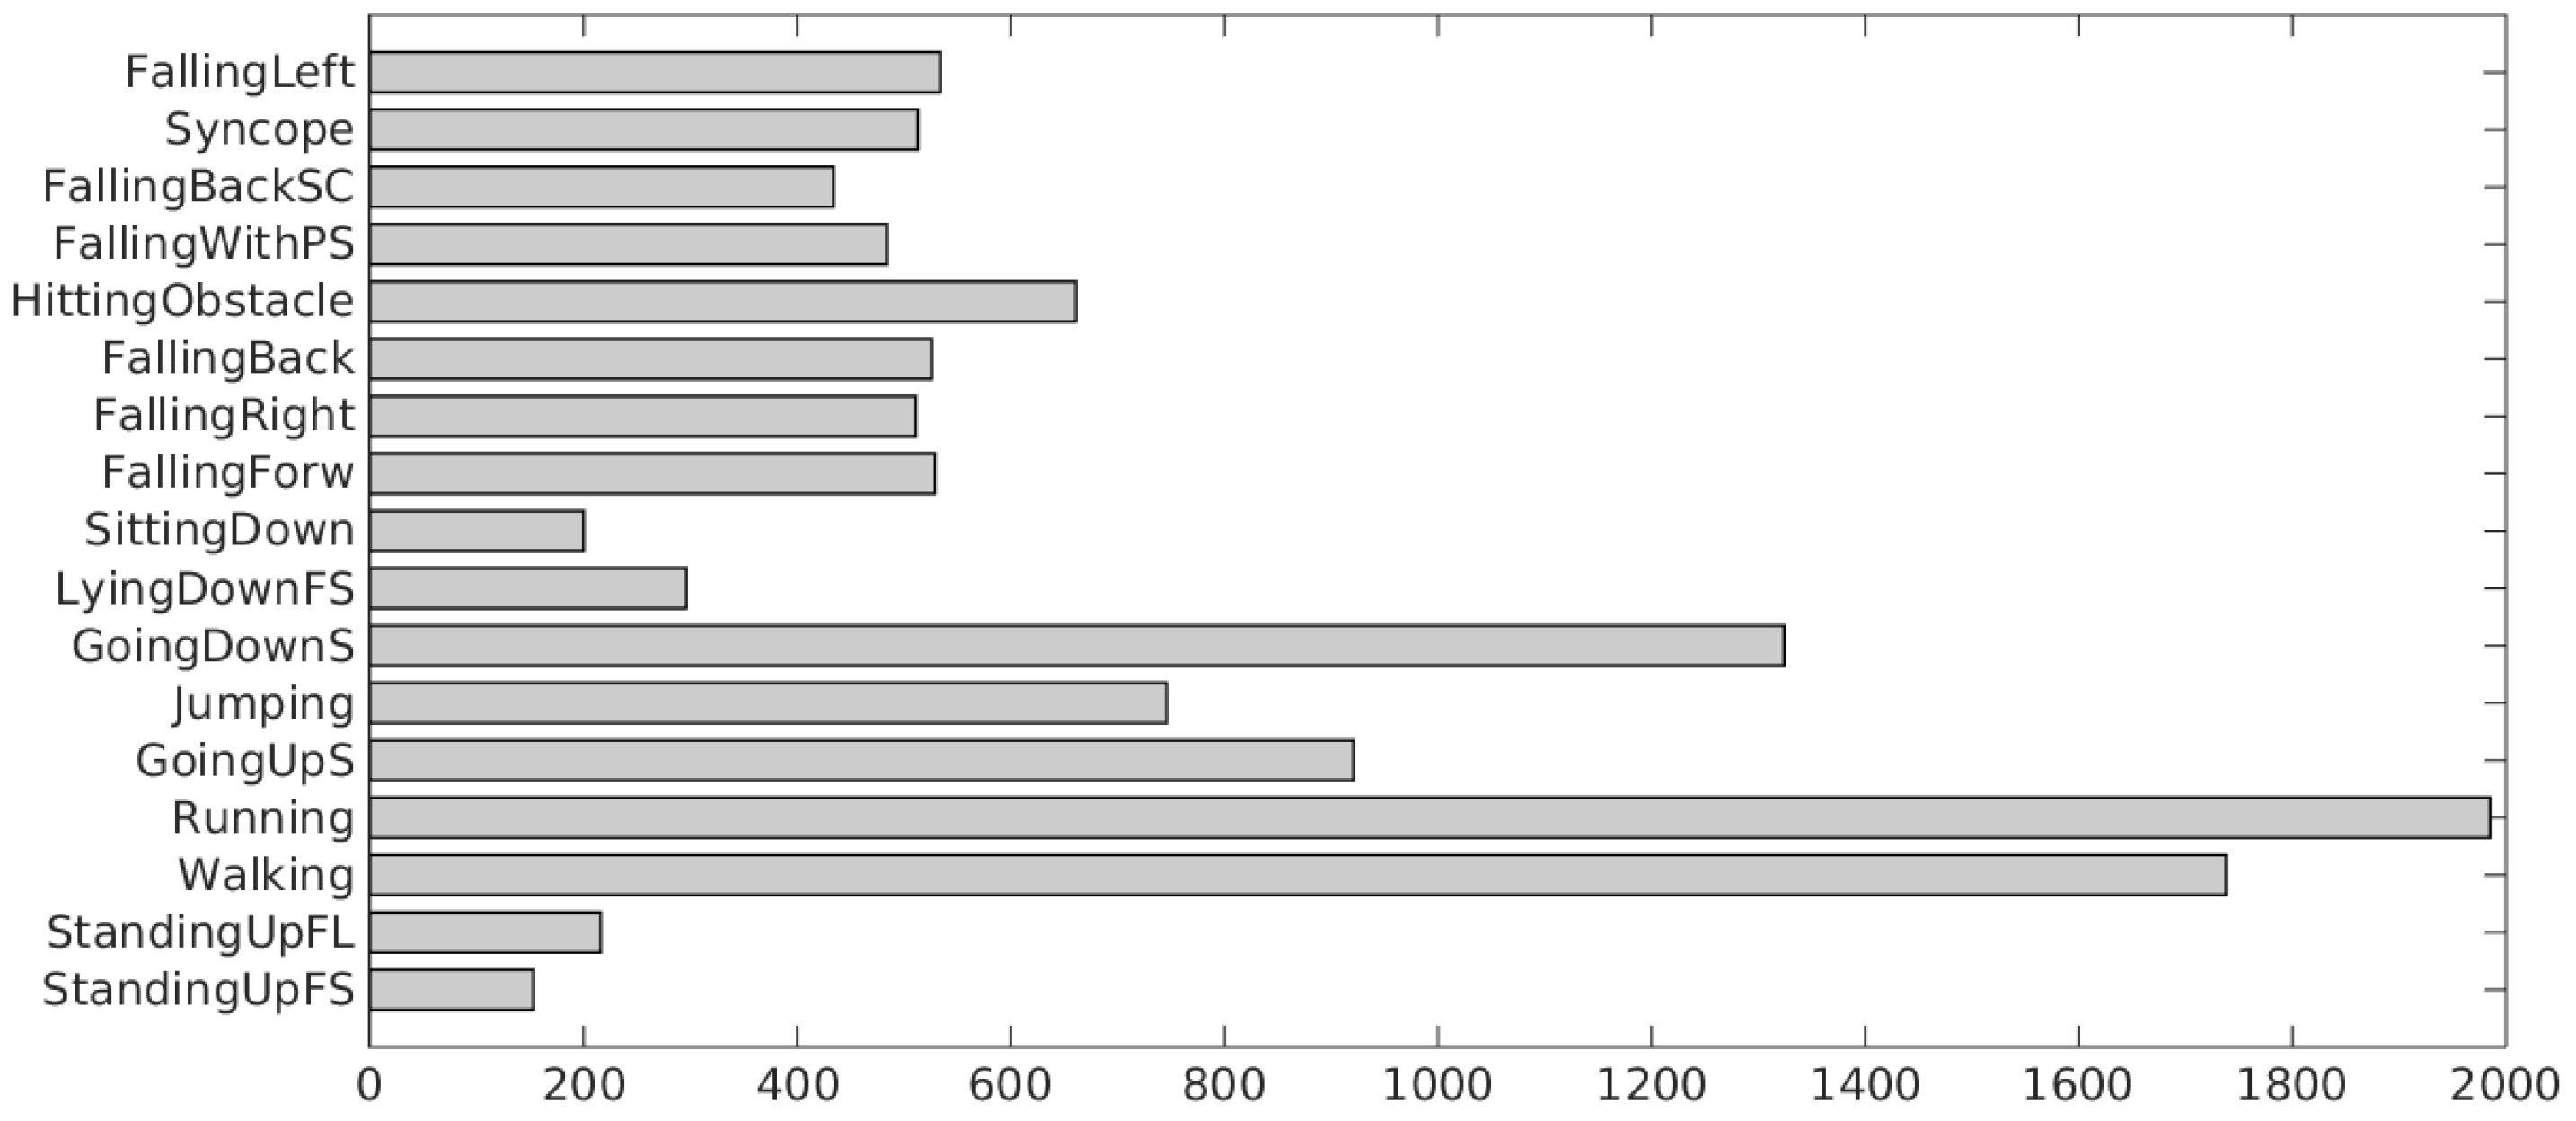
To fulfil those requirements, we built a dataset including 9 different types of ADLs and 8 different types of falls. The dataset contains a total of 11,771 samples describing both activities of daily living (7579) and falls (4192) performed by 30 subjects, mostly females (24), of ages ranging from 18 to 60 years. Each sample is a vector of 151 accelerometer values for each axis. Each accelerometer entry in the dataset maintains the information about the subject that generated it. Moreover, each accelerometer entry has been labeled by specifying the type of ADL (e.g., walking, sitting, or standing) or the type of fall (e.g., forward, syncope, or backward).
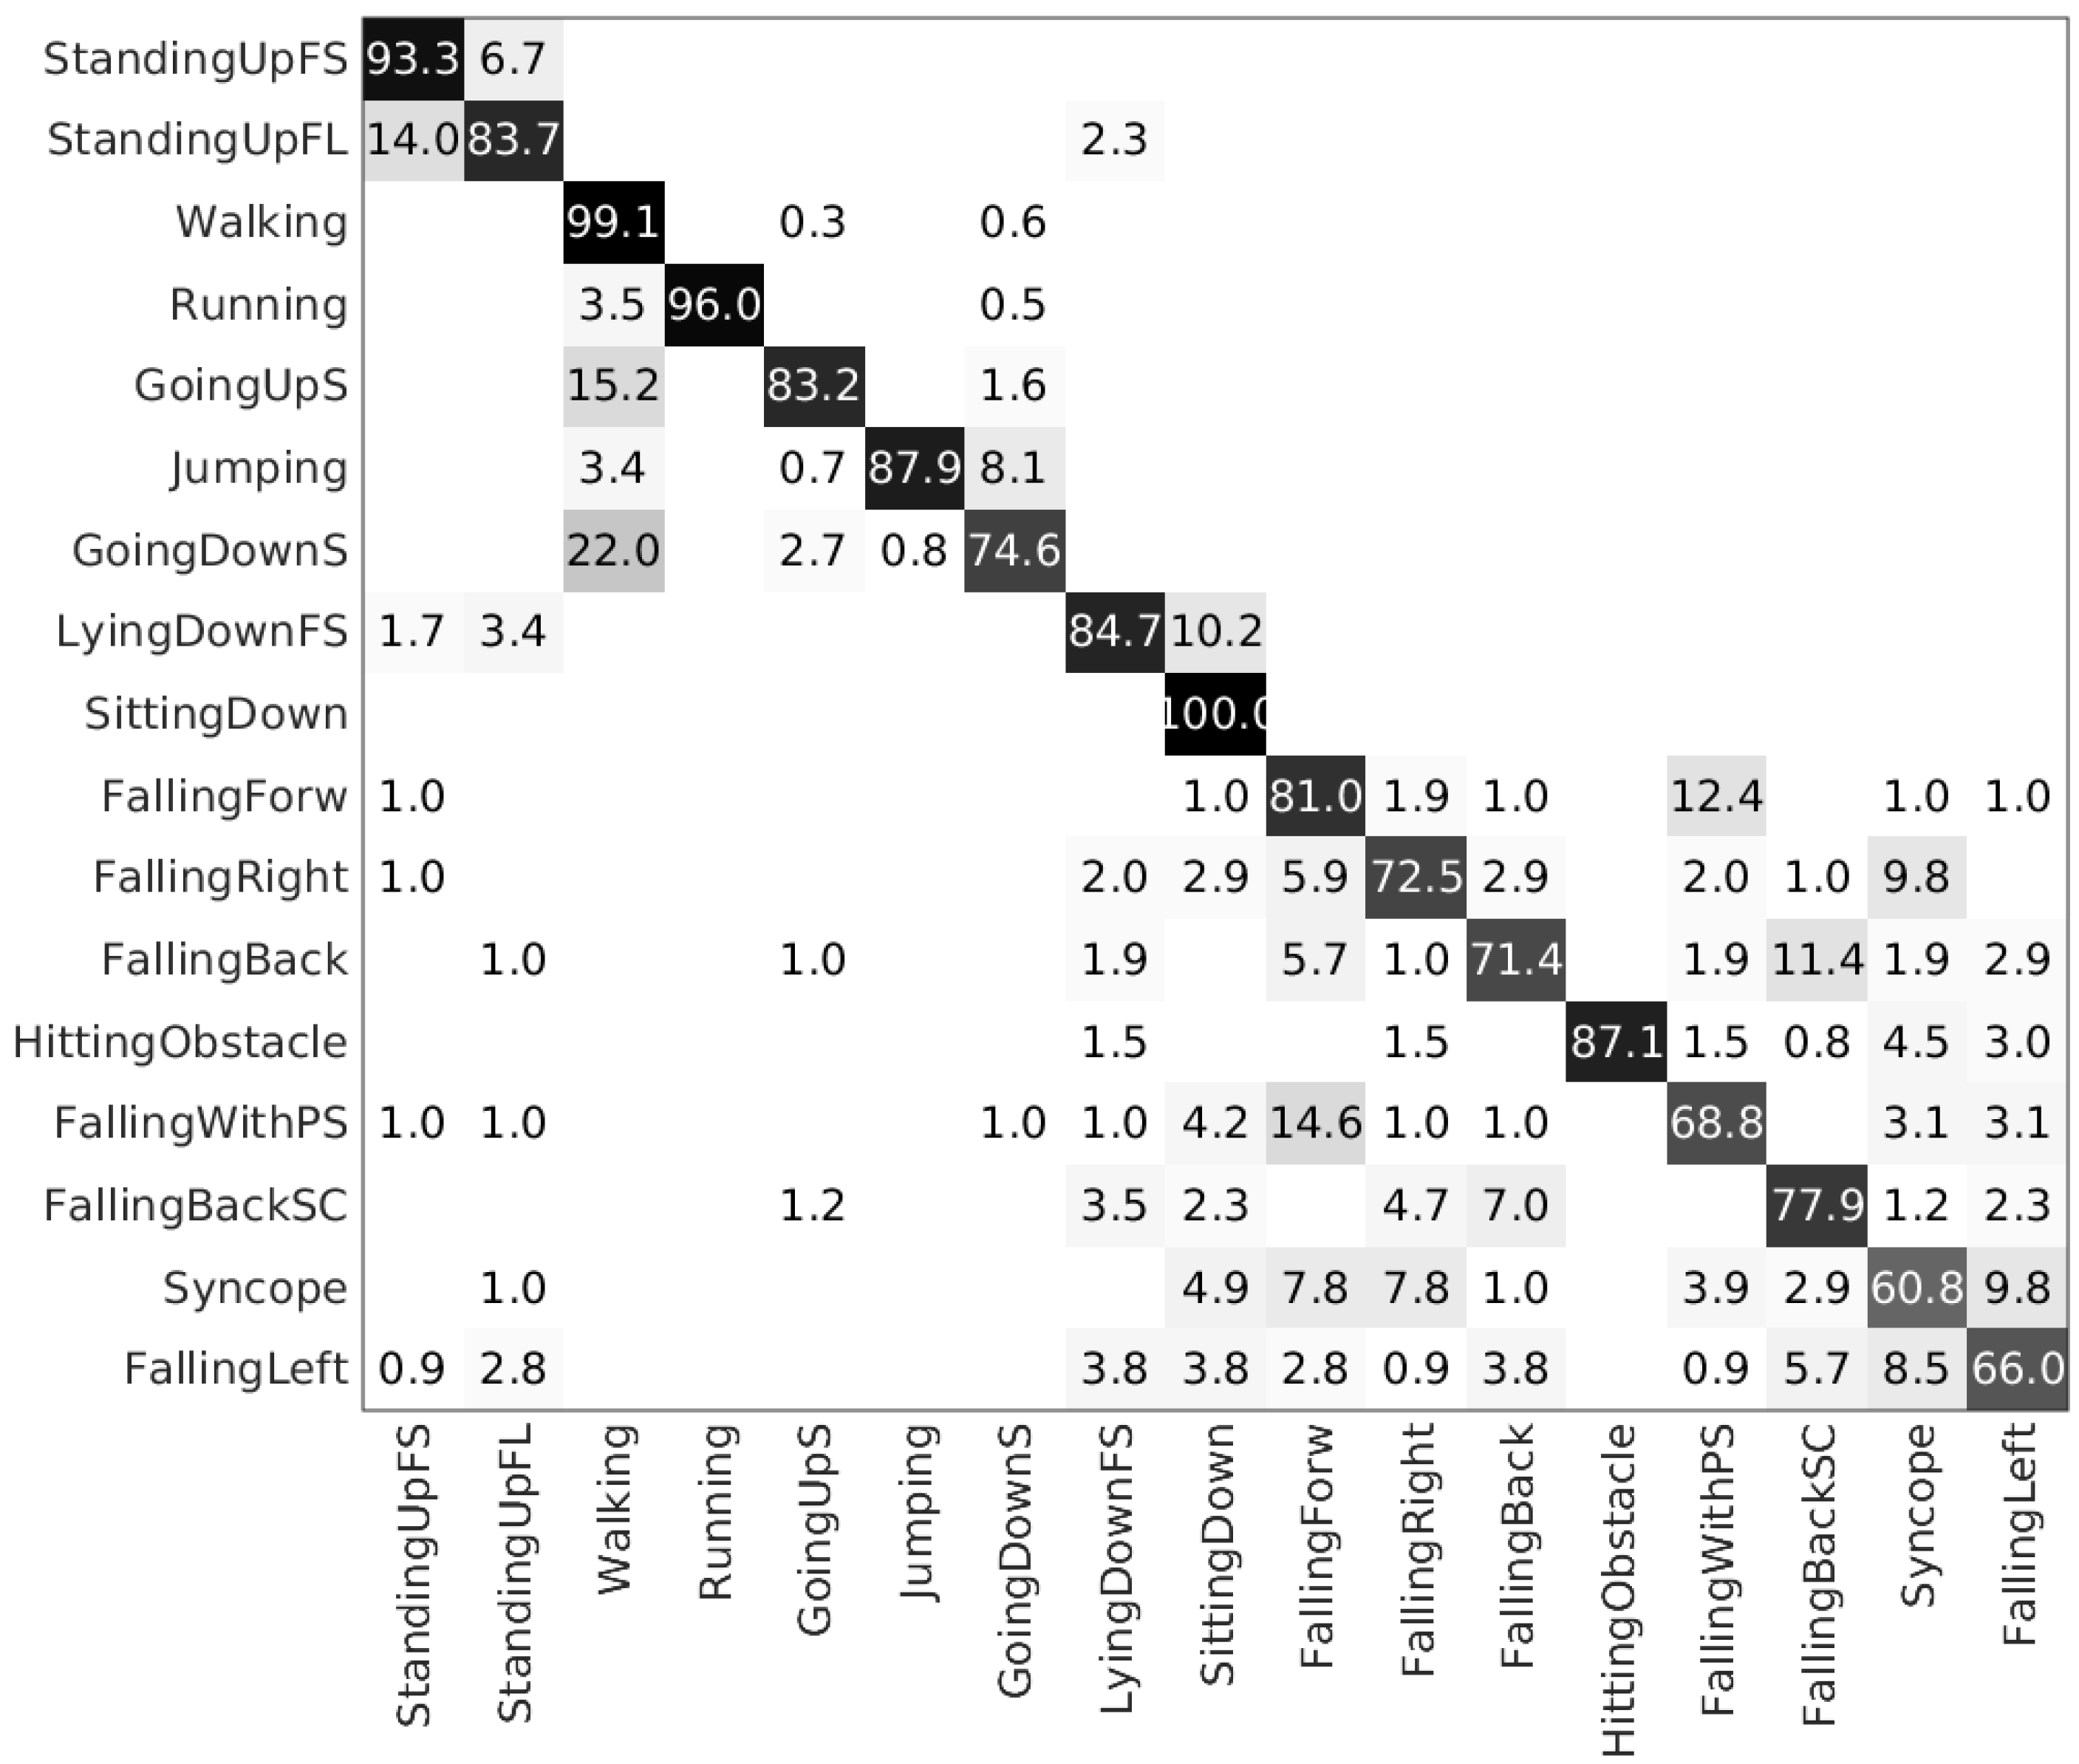
We benchmarked the dataset by performing several experiments. We evaluated four classifiers: k-Nearest Neighbour (k-NN), Support Vector Machines (SVM), Artificial Neural Networks (ANN), and Random Forest (RF). Raw data and magnitudo have been considered as feature vectors. Finally, for each classification we performed a 5-fold cross validation and a leave-one-subject-out evaluation. Results show how much the proposed dataset is challenging with respect to a set of classification tasks.
The article is organized as follows. Section 2 describes the method used to build the datasets. Section 3 presents the dataset evaluation and Section 4 discusses the results of the evaluation. Finally, Section 5 provides final remarks.

2. Dataset Description

This section describes the method used to acquire and pre-process samples in order to produce the UniMiB SHAR dataset.

2.1. Data Acquisition

The smartphone used in the experiments was a Samsung Galaxy Nexus I9250 with the Android OS version 5.1.1 and equipped with a Bosh BMA220 acceleration sensor. This sensor is a triaxial low-g acceleration sensor. It allows measurements of acceleration in three perpendicular axes, and allows acceleration ranges from ± 2 g to ± 16 g and sampling rates from 1 KHz to 32 Hz. The Android OS both limits to ± 2 g with a resolution of 0.004 g the acceleration range, and takes samples at a maximum frequency of 50 Hz. However, the Android OS does not guarantee any consistency between the requested and the effective sampling rate. Indeed, the acquisition rate usually fluctuates during the acquisition. For the experiments presented in this paper, we resampled the signal in order to have a constant sampling rate of 50 Hz, which is commonly used in literature for activity recognition from data acquired through smartphones [28,29,30]. The accelerometer signal is for each time instant made of a triplet of numbers (x, y, z) that represents the accelerations along each of the 3 Cartesian axes.
We used also the smartphone built-in microphone to record audio signals with a sample frequency of 8000 Hz, which are used during the data annotation process.
The subjects were asked to place the smartphone in their front trouser pockets: half of the time in the left one and the remaining time in the right one.
Acceleration triples and corresponding audio signals have been recorded using a mobile application specially designed and implemented by the authors, which stores data into two separated files inside the memory of the smartphone.

2.2. ADLs and Falls

In order to select both the ADLs and the falls, we analyzed the datasets in Table 1 and the most recent publicly available datasets recorded with wearable ad-hoc devices. As discussed in Section 1, we considered the datasets acquired from 2012 to be compliant with the year of the older smartphone-based dataset. This set includes, sorted by year of creation from the oldest the most recent, the following datasets: DLR v2 [37], Ugulino [38], USC HAD [39], DaLiAc [10], EvAAL [40], MHEALTH [41], UCI ARSA [32], BaSA [42], UR Fall Detection [43], MMsys [9], SisFall [44], UMA Fall (UMA Fall contains samples from both smartphones and ad-hoc wearable devices.) [23], and REALDISP [45].
Regarding ADLs, Figure 1 shows the most common ones in the overall 24 datasets we analyzed (11 with samples from smartphones and sketched in Table 1 and 13 with samples from wearable ad-hoc devices listed above). The y axis represents the number of datasets that include the specified ADL. ADLs are grouped by category. The following categories have been identified by analizyng the datasets: Context-related, which includes activities that someway deal with the context (e.g., Stepping in a car), Motion-related, which includes activities that imply some kind of physical movement (e.g., Walking), Posture-related, which includes activities in which the person maintains the position for a certain amount of time (e.g., Standing), Sport-related, which includes any kind of activity that requires a physical effort (e.g., Jumping), and Others, which includes activities that are presented in one dataset only (e.g., Vacuuming in category Housekeeping-related). The Jogging and Running activities deserve a clarification. In all the datasets we analyzed, they are mutually exclusive, that is, datasets that contain Running, do not contain Jogging and vice versa. The datasets REALDISP and MHEALT are an exception because they include both the activities. These datasets, besides being realized by the same institution, are primarily oriented towards the recognition of physical activities (warm up, cool down and fitness exercises). Moreover, none of the datasets analyzed exactly specify what the Jogging and Running activities are related to. Thus, even though they may be considered very similar activities, we have decided to keep them separated in oder to do not loose their specificity. We classify Jogging as a sport-related activity (in the sense, for instance, of jogging in the park), and Running as a motion-related activity (in the sense, for instance, of running for the bus). For each category, the x axis shows all the ADLs we found and that are present in at least 2 datasets. Under the label Others fall all the ADLs for the corresponding category that have been included in one dataset only (e.g., Walking left-circle in category Motion-related).
Table 2 shows the 9 ADLs we have selected among the most popular included in the analyzed publicly available datasets. UniMiB SHAR includes the top 5 most popular Motion-related activities (i.e., Walking, Going upstairs, Going downstairs, Sitting down, and Running). Moreover, we detailed the generic Standing up, by including the Standing up from sitting and Standing up from laying activities. Finally, we included also the Lying down from standing.
In the Sport-related category, we did not included Jogging even if it is the most popular activity in its category because we included the Running activity in the Motion-related category. In Sport-related category, we chose the Jumping activity being the second most popular one.
Our dataset does not include Postural-related activities. Indeed, we were interested in acquiring acceleration data from activities related to movements both because from them it is possible to estimate the overall physical activity performed by a person, and because people are more likely to fall during movements [46].
We do not include ADLs belonging to categories such as Housekeeping-, Cooking-, or Personal care-related (those fall in the Others category in Table 1, because we are interested in low order activities of daily living, which include simple activities such as, Standing, Sitting down, Walking, rather than high order activities of daily living, which include complex activities such as, Washing dishes, Combing hair, Preparing a sandwich. The same holds for contex-related activities that are intended as high order activities. This choice was also motivated by the fact that these activities are scarcely present in the analyzed datasets (in particular, each activity belonging in the above mentioned categories is present in only one of the 24 analyzed datasets).
Finally, among the ADLs related to movements, we selected the ADLs most used in literature as demonstrated by the analysis we performed, which is also confirmed by Pannurat et al. in [47].
Regarding falls, we analized DMPSBFD, Gravity, MobiAct, tFall, and UMAFall datasets from smartphones (see Table 1), and DLR v2, EvAAL, MMsys, SISFall, UMA Fall, and UR Fall Detection datasets from wearable ad-hoc devices, since they are the only datasets that contain falls. From this set, we excluded DLR v2, EvAAL because they do not specify the type of fall.
Figure 2 shows the most common falls in the resulting 9 datasets we analyzed. The y axis represents the number of datasets that include the specified fall. Likewise ADLs, falls are grouped by category. Falling backward, Falling forward, and Falling sideward include back-, front-, and side-ward falls respectively. Sliding category can be further specialized so that to include Sliding from a chair, Sliding form a bed, and Generic sliding that not specifies details about the type of sliding. Finally, the category Specific fall includes different type of falls that have not been further specialized.
For each category, the x axis shows all the types of falls we found. The label Others includes all the falls for the corresponding category that have been included in one dataset only. The Specific fall category is an exception since it includes falls types not particularly present in the analyzed datasets.
Choosing which falls to include in the dataset was driven by the following considerations: the number of falls should have been comparable to that of the other datasets, and the dataset should have included a set of representative types of falls. Thus, having four categories (not considering Sliding, which includes only one type of fall that has been considered by two datasets only), we selected two falls from each of them. In each category, we selected the first two most popular falls. The category Falling sideward is an exception since we preferred to choose the two most specific falls instead of including the too generic Generic falling sideward. Table 3 shows the 8 falls that we selected according the adopted criterion.
Finally, studies on this topic confirm the falls we selected are common in real-life [29,48,49,50].

2.3. Subjects

Thirty healthy subjects have been involved in the experiments: 24 were women and 6 men. The subjects, whose data are shown in Table 4, are aged between 18 and 60 years (27 ± 12 years), have a body mass between 50 and 82 kg (64.4 ± 9.7 kg), and a height between 160 and 190 cm (169 ± 7 cm). Note that we included more women and older ages to compensate for the lack of MobiAct.
All the subjects performed both ADLs and Falls. The subjects gave written informed consent and the study was conducted in accordance with the WMA (World Medical Association) Declaration of Helsinki [51].

2.4. Protocols

To simplify the data annotation process, we asked each subject to clap her hands early before and after she performed the activity/fall to be recorded. Moreover, to reduce background noise, we asked each subject to wear gym trousers with front pockets.
Concerning ADLs, in order to avoid mistakes by the subjects due to too long sequences of activities, registrations have been subdivided in the three protocols showed in Table 5. Each protocol has been performed by each subject twice, the first one with the smartphone in the right pocket and the second in the left. Those smartphone positions were chosen because both they are the most natural ones and they are exactly the positions used in the analyzed references dealing with smartphones.
Protocol 1 includes Walking and Running activities. We opted for moderate walking and running so as to include even older people. Protocol 2 includes activities related to both climbing and descending stairs, and jumps. In our registration, we selected straight stairs ramps, and asked each volunteer to perform jumps with a moderate elevation, with little effort, and spaced each other about 2 s. Protocol 3 includes ascending and descending activities. The Sitting down and Standing up from sitting activities have been performed with a chair without armrests; the Lying down from standing and Standing up from laying have been performed on a sofa. The duration of the actives are on average similar to those reported in [52] that reviews a set of public datasets for wearable fall detection systems.
Falls have been recorded individually, always following the pattern of making a start and end clap (see Table 6). In cases where the volunteer ended in a prone position, the clap has been performed by an external subject to avoid as far as possible any movements that might lead to recording events outside the study. To carry out the simulation safely, a mattress of about 15 cm in height was used. Each fall was repeated six times, the first three with the smartphone in the right pocket, the others in the left. Finally, falls have been simulated, started from a standing straight up position, and self-started.

2.5. Segmentation and Preprocessing

The audio files helped in the identification of the start and stop time instants for each recorded activity. From the labelled recorded accelerometer data, we extracted a signal window of 3 s each time a peak was found, that is, when the following conditions were verified:
  • the magnitude of the signal m t at time t was higher than 1.5 g , with g being the gravitational acceleration;
  • the magnitude m t 1 at the previous time instant t 1 was lower than 1.5 g .
Each signal window of 3 s was centered around each peak and it is likely that several overlaps between subsequent windows may happen. We adopted this segmentation technique instead of selecting overlapped sliding windows because our dataset is mostly focused on motion-related recognition of ADLs and falls. The choice of taking 3 s window has been motivated by: (i) the cadence of an average person walking is within 90–130 steps/min [30,53]; (ii) at least a full walking cycle (two steps) is preferred on each window sample.
Figure 3 shows samples of acceleration shapes. For each activity, we displayed the average magnitude shape obtained by averaging all the subjects’ shapes.
Since the device used for data acquisition records accelerometer data with a sample frequency of 50 Hz, for each activity, the accelerometer data vector is made of 3 vectors of 151 values (a vector of size 1 × 453), one for each acceleration direction. The dataset is thus composed of 11,771 samples describing both ADLs (7759) and falls (4192) not equally distributed across activity types. This is because the activity of running and walking were performed by subjects for a time longer than the time spent for other activities. Originally, 6000 time windows of the running activity were found. In order to make the final dataset as much as balanced, we have deleted about 4000 samples related to running activities. The resulting samples distribution is plotted in Figure 4, where the samples related to running activities are about 2000. On our web site we release both datasets, the one balanced and the original one.
We preprocessed the acceleration signal s ( t ) in order to remove the gravitational component g ( t ) . Since the gravitational force is assumed to have only low frequency components, we applied a Butterworth ( B W ) low-pass filter with a cut off frequency of 0.3 Hz [30]: g ( t ) = B W ( s ( t ) , 0.3 ) . The accelerometer data without gravitational component is then obtained as: s ( t ) ˜ = s ( t ) g ( t ) . The dataset is freely downloadable at the following address: http://www.sal.disco.unimib.it/technologies/unimib-shar/.

3. Dataset Evaluation

We organized the accelerometer samples in order to evaluate four classification tasks:
  • AF-17 contains 17 classes obtained by grouping all the 9 classes of ADLs and 8 classes of FALLs. This subset permits to evaluate the capability of the classifier to distinguish among different types of ADLs and FALLs;
  • AF-2 contains 2 classes obtained by considering all the ADLs as one class and all the FALLs as one class. This subset permits to evaluate, whatever is the type of ADL or FALL, the classifier robustness in distinguishing between ADLs and FALLs;
  • A-9 contains 9 classes obtained by considering all the 9 classes of ADLs. This subset permits to evaluate how much the classifier is capable to distinguish among different types of ADLs;
  • F-8 contains 8 classes obtained by considering all the 8 classes of FALLs. This subset permits to evaluate how much the classifier is capable to distinguish among different types of FALLs.
We initially evaluated the classifiers by performing a traditional 5-fold cross-validation. This means that all the data have been randomly split into 5 folds. Each fold has been considered as test data and the remaining ones as training data. Results are computed by averaging the result obtained on each test fold. The folds have been obtained by applying the stratified random sampling that ensures samples of the same subject in both the test and the training folds. We refer to this evaluation also as subject-dependent.
To make the dataset evaluation independent from the effect of personalization, we conducted another evaluation by performing a leave-one-subject-out cross-validation. Each test fold is made of accelerometer samples of one user only, namely the test user, while the training folds contain accelerometer samples of all the other users except the samples of the test user. We refer to this evaluation also as subject-independent.
Previous studies have explored a wide range of feature vector representations for acceleration signals. Some examples are [48,54,55]: raw data, magnitude of the signal, frequency-domain features, signal moments, cepstral frequency, and other heuristic features.
Here we considered two feature vectors:
  • raw data: the 453-dimensional patterns obtained by concatenating the 151 acceleration values recorded along each Cartesian direction;
  • magnitude of the accelerometer signal, that is a feature vector of 151 values.
We experimented with four different classifiers:
  • k-Nearest Neighbour (k-NN) with k = 1 ;
  • Support Vector Machines (SVM) with a radial basis kernel;
  • Artificial Neural Networks (ANN). We set up a three-layers feed forward network with back propagation. The network architecture includes an input layer, a layer of hidden neurons and an output layer that includes a softmax function for class prediction. The number of hidden neurons n has been set in such a way that n = m × k , where m is the number of neurons in the input layer and k is the number of neurons in the output layer, namely the number of classes [56].
  • Random Forest (RF): bootstrap-aggregated decision trees with 300 bagged classification trees.
All the classifiers have been implemented exploiting the MATLAB Statistics and Machine Learning Toolbox and the Neural Network Toolbox.

Evaluation Metrics

As shown in Figure 4, each of the 17 sets containing samples related to a specific activity is different in size. To cope with the class imbalance problem of the dataset we used as metric the macro average accuracy [57].
Given E the set of all the activities types, a E , N P a the number of times a occurs in the dataset, and T P a the number of times the activity a is recognized, MAA (Macro Average Accuracy) is defined by Equation (1).
M A A = 1 | E | a = 1 | E | A c c a = 1 | E | a = 1 | E | T P a N P a .
MAA is the arithmetic average of the accuracy A c c a of each activity. It allows each partial accuracy to contribute equally to the evaluation.

4. Results and Discussion

In the following, we discuss separately the results achieved with the traditional 5-fold cross-validation and the leave-subject-out cross-validation.

4.1. 5-Fold Evaluation

The k-fold evaluation is the most employed evaluation scheme in literature [58]. This evaluation considers a training set and a test set made of activity samples performed by all the human subjects. The resulting classifier is subject-dependent and usually exhibits a very high performance. Results of the k-fold evaluation (here we used k = 5) scheme are showed in Table 7 for raw data and magnitude. Overall, the performances achieved using raw data are better than the ones obtained using magnitude as a feature vector. This confirms a result already achieved in previous works [48,54].
The AF-17 recognition task is quite challenging with a MAA of about 83% in the case of raw data with KNN, and a MAA of about 66% in the case of magnitude with RF. This means that is quite difficult to distinguish among types of activities especially in the case when magnitude is adopted as feature vector. Figure 5 shows the confusion matrix of the k-NN experiment in the case of raw data.
The A-9 classification task is quite easy, the MAA obtained by raw data with RF is about 88% while the MAA obtained by magnitude with SVM is about 79%. This means that is quite easy to distinguish between types of activities. Looking at the confusion matrix in Figure 5, the most misclassified pairs of activities are Standing up from laying and Standing up from sitting, Lying down from standing and Sitting down, Going upstairs and Walking, Going downstairs and Walking, Jumping and Going downstairs.
The F-8 recognition task is quite challenging: the MAA is about 78% and 57% in the case of raw data with KNN and magnitude with RF respectively. This result suggests that distinguish among falls is very complicated The most misclassified pairs of falls are Falling with protection strategies and Generic falling forward, Syncope and Falling leftward, Generic falling backward and Falling backward-sitting-chair, Falling rightward and Falling with protection strategies, Falling rightward and Syncope.
In contrast, the AF-2 recognition task is very easy for all the classifiers and for both raw data and magnitude with an MAA of about 99% achieved with raw data and SVM. These results are similar to those obtained by previous researchers on a similar classification task performed on different datasets [29,54]. This means that it is very easy to distinguish between falls and no falls.
To summarize, the F-8 and AF-17 are quite challenging classification tasks. The use of this dataset for those tasks will permit researchers:
  • to design and evaluate more robust feature representations as well as more robust classification schemes for human activity recognition.
  • to study more robust features to deal with accelerometer samples of different types of falls.

4.2. Leave-One-Subject-Out Evaluation

Table 8 shows the results obtained by performing the leave-one-subject-out evaluation. In this case the training set is made of activity samples of subjects not included in the test set. This evaluation is also known as subject independent evaluation and shows the feasibility of a real smartphone application for human activity recognition [35,59,60] where data of a given subject are usually not included in the training set of the classifier.
From the results it is almost evident the drop of performances with respect to the case of 5-fold evaluation. Human subject performs activities in a different way and this influences the recognition accuracy especially when it is necessary to distinguish between fine grained types of activities, that is in the case of AF-17, A-9 and F8 recognition tasks. In particular, in the case of AF-17 the best MAA is 56.58% using RF and magnitude. In the case of A-9 the best MAA is 73.17% using RF and raw data. In the case of F-8 the best MAA is 49.35% using SVM and magnitude. In contrast, distinguishing between coarse grained activities, such as falls vs no falls, is quite easy with a MAA of 97.57% with SVM for both raw data and magnitude. Overall the magnitude feature vector performs slightly better than the case of raw data. This suggests that using the magnitude as a feature vector in the case of subject-independent evaluations could be more reliable than raw data.
The low performance achieved in the case of subject-independent evaluation permits the researcher to investigate the following issues:
  • the study of a more robust feature vector that is able to reduce as much as possible the performance gap between the subject-dependent and subject-independent evaluation;
  • the study of on-line learning classification schemes that permit us, with the use of a few subject-dependent data, to improve the performance as much as possible.

5. Conclusions

Almost all publicly available datasets from smartphones do not allow the selection of samples based on specific criteria related to the physical characteristics of subjects and the activities (and/or falls) they performed. Of the 11 datasets containing smartphone measurements, only MobiAct, RealWorld (HAR), and UMA Fall are the exception. These three datasets include more men than women. Considering only datasets that include falls (MobiAct and UMA Fall), the maximum age of the subjects is 47 years. Our goal was therefore to create a new dastaset that would be complementary to the more complete ones and that also include falls. The result is UniMiB SHAR dataset that includes 9 ADLs and 8 falls performed by 30 humans, mostly female, with a huge range of ages, from 18 to 60 years.
The classification results obtained on the proposed dataset showed that the raw data performs somewhat better than magnitude as feature vector in the case of subject-dependent evaluation, and, on the opposite, the magnitude performs quite better than raw data in the case of subject-independent evaluation. The classification of different types of activities is simpler than the classification of different types of falls. It is very easy to distinguish between falls and no falls for both raw data and magnitude. The subject-independent evaluation showed that recognition performance strongly depends on the subject data.
As future work we plan to include other alternative artificial neural network architectures such as Recurrent Neural Networks (RNNs) and Deep Convolutional Neural Networks (CNNs). An RNN, especially its variant built on Long short-term memory (LSTM) units, is well suited to model temporal dynamics. Deep Convolutional Neural Networks (CNNs) are a class of learnable architectures used in many domains such as image recognition, image annotation, image retrieval etc. The combination of a CNN and RNN has demonstrated to be very effective for activity recognition [61].
UniMiB SHAR dataset will permit researchers to study several issues, such as: (i) robust features to deal with falls; (ii) robust features and classification schemes to deal with personalization issues.
We are planning to carry out an evaluation of the state-of-the-art techniques for ADLs recognition on both UniMiB SHAR and all the publicly available datasets of accelerometer data from smartphone to have and objective comparison. Moreover, we have planned to make experimentation on personalization by using those datasets that include information about the characteristics of the subjects. We want to investigate whether the training set containing samples acquired by subjects with similar characteristics to the testing subject may result in a more effective classifier. Finally, we are planning to check if and how data from smartwatches and smartphones can jointly improve the performances of the classifiers. To this end, we are improving the data acquisition application used for UniMiB SHAR.

Supplementary Materials

The dataset, the Matlab scripts to repeat the experiments, the app used to acquire samples, and additional materials (e.g., images with samples of acceleration shapes) are available at the following address: http://www.sal.disco.unimib.it/technologies/unimib-shar/.

Author Contributions

All authors contributed equally to this work.

Conflicts of Interest

The authors declare no conflicts of interest.

References

  1. World Health Organization. Global Recommendations on Physical Activity for Health; World Health Organization: Geneva, Switzerland, 2010. [Google Scholar]
  2. United Nations. World Populatin Ageing Report; United Nations: New York, NY, USA, 2015. [Google Scholar]
  3. Grant, J.; Hoorens, S.; Sivadasan, S.; van het Loo, M.; DaVanzo, J.; Hale, L.; Gibson, S.; Butz, W. Low Fertility and Population Ageing. 2004. Available online: http://www.rand.org/pubs/monographs/MG206.html (accessed on 23 October 2017).
  4. Tromp, A.M.; Pluijm, S.M.; Smit, J.H.; Deeg, D.J.; Bouter, L.M.; Lips, P. Fall-risk screening test: A prospective study on predictors for falls in community-dwelling elderly. J. Clin. Epidemiol. 2001, 54, 837–844. [Google Scholar] [CrossRef]
  5. Tinetti, M.E.; Liu, W.L.; Claus, E.B. Predictors and prognosis of inability to get up after falls among elderly persons. JAMA 1993, 269, 65–70. [Google Scholar] [CrossRef] [PubMed]
  6. Mubashir, M.; Shao, L.; Seed, L. A Survey on Fall Detection: Principles and Approaches. Neurocomputing 2013, 100, 144–152. [Google Scholar] [CrossRef]
  7. Chen, J.; Kwong, K.; Chang, D.; Luk, J.; Bajcsy, R. Wearable sensors for reliable fall detection. In Proceedings of the Annual International Conference of the Engineering in Medicine and Biology Society (IEEE-EMBS), Shanghai, China, 17–18 January 2006. [Google Scholar]
  8. Li, Q.; Stankovic, J.A.; Hanson, M.A.; Barth, A.T.; Lach, J.; Zhou, G. Accurate, fast fall detection using gyroscopes and accelerometer-derived posture information. In Proceedings of the International Workshop on Wearable and Implantable Body Sensor Networks (BSN), Washington, DC, USA, 3–5 June 2009. [Google Scholar]
  9. Ojetola, O.; Gaura, E.; Brusey, J. Data Set for Fall Events and Daily Activities from Inertial Sensors. In Proceedings of the ACM Multimedia Systems Conference (MMSys), New York, NY, USA, 18–20 March 2015. [Google Scholar]
  10. Leutheuser, H.; Schuldhaus, D.; Eskofier, B.M. Hierarchical, Multi-Sensor Based Classification of Daily Life Activities: Comparison with State-of-the-Art Algorithms Using a Benchmark Dataset. PLoS ONE 2013, 8, 1–11. [Google Scholar] [CrossRef] [PubMed]
  11. Vavoulas, G.; Pediaditis, M.; Chatzaki, C.; Spanakis, E.G.; Manolis, T. The MobiFall Dataset: Fall Detection and Classification with a Smartphone. Int. J. Monit. Surveill. Technol. Res. 2014, 44–56. [Google Scholar] [CrossRef]
  12. Sigal, L.; Balan, A.O.; Black, M.J. HumanEva: Synchronized Video and Motion Capture Dataset and Baseline Algorithm for Evaluation of Articulated Human Motion. Int. J. Comput. Vis. 2009, 87. [Google Scholar] [CrossRef]
  13. Carnegie Mellon Motion Capture Database. 2008. Available online: http://mocap.cs.cmu.edu (accessed on 18 October 2017).
  14. Chaquet, J.M.; Carmona, E.J.; Fernández-Caballero, A. A survey of video datasets for human action and activity recognition. Comput. Vis. Image Underst. 2013, 117, 633–659. [Google Scholar] [CrossRef]
  15. Wang, J.M.; Fleet, D.J.; Hertzmann, A. Gaussian process dynamical models for human motion. IEEE Trans. Pattern Anal. Mach. Intell. 2008, 30, 283–298. [Google Scholar] [CrossRef] [PubMed]
  16. Urtasun, R.; Fleet, D.J.; Geiger, A.; Popović, J.; Darrell, T.J.; Lawrence, N.D. Topologically-constrained latent variable models. In Proceedings of the 25th International Conference on Machine Learning, ACM, Helsinki, Finland, 5–9 July 2008; pp. 1080–1087. [Google Scholar]
  17. Janidarmian, M.; Fekr, A.R.; Radecka, K.; Zilic, Z. Acceleration Sensors in Human Activity Recognition. Sensors 2017, 17, 529. [Google Scholar] [CrossRef] [PubMed]
  18. Luque, R.; Casilari, E.; Morón, M.J.; Redondo, G. Comparison and Characterization of Android-Based Fall Detection Systems. Sensors 2014, 14, 18543–18574. [Google Scholar] [CrossRef] [PubMed]
  19. Steele, R.; Lo, A.; Secombe, C.; Wong, Y.K. Elderly persons’ perception and acceptance of using wireless sensor networks to assist healthcare. Int. J. Med. Inform. 2009, 78, 788–801. [Google Scholar] [CrossRef] [PubMed]
  20. Feldwieser, F.; Marchollek, M.; Meis, M.; Gietzelt, M.; Steinhagen-Thiessen, E. Acceptance of seniors towards automatic in home fall detection devices. J. Assist. Technol. 2016, 10, 178–186. [Google Scholar] [CrossRef]
  21. Jeffs, E.; Vollam, S.; Young, J.D.; Horsington, L.; Lynch, B.; Watkinson, P.J. Wearable monitors for patients following discharge from an intensive care unit: practical lessons learnt from an observational study. J. Adv. Nurs. 2016, 72, 1851–1862. [Google Scholar] [CrossRef] [PubMed]
  22. Mourcou, Q.; Fleury, A.; Franco, C.; Klopcic, F.; Vuillerme, N. Performance Evaluation of Smartphone Inertial Sensors Measurement for Range of Motion. Sensors 2015, 15, 23168–23187. [Google Scholar] [CrossRef] [PubMed] [Green Version]
  23. Vilarinho, T.; Farshchian, B.; Bajer, D.G.; Dahl, O.H.; Egge, I.; Hegdal, S.S.; Lones, A.; Slettevold, J.N.; Weggersen, S.M. A Combined Smartphone and Smartwatch Fall Detection System. In Proceedings of the IEEE International Conference on Computer and Information Technology; Ubiquitous Computing and Communications; Dependable, Autonomic and Secure Computing; Pervasive Intelligence and Computing (CIT/IUCC/DASC/PICOM), Liverpool, UK, 26–28 October 2015. [Google Scholar]
  24. Dataset for Mobile Phone Sensing Based Fall Detection (DMPSBFD). 2015. Available online: https://figshare.com/articles/Dataset_for_Mobile_Phone_Sensing_Based_Fall_Detection/1444405 (accessed on 1 October 2016).
  25. Vavoulas, G.; Chatzaki, C.; Malliotakis, T.; Pediaditis, M.; Tsiknakis, M. The MobiAct Dataset: Recognition of Activities of Daily Living using Smartphones. In Proceedings of the International Conference on Information and Communication Technologies for Ageing Well and e-Health (ICT4AWE), Rome, Italy, 21–22 April 2016. [Google Scholar]
  26. Sztyler, T.; Stuckenschmidt, H. On-body Localization of Wearable Devices: An Investigation of Position-Aware Activity Recognition. In Proceedings of the IEEE International Conference on Pervasive Computing and Communications (PerCom), Sydney, Australia, 14–19 March 2016. [Google Scholar]
  27. Shoaib, M.; Scholten, H.; Havinga, P.J.M. Towards Physical Activity Recognition Using Smartphone Sensors. In Proceedings of the IEEE International Conference on Ubiquitous Intelligence and Computing and International Conference on Autonomic and Trusted Computing (UIC/ATC), Vietri sul Mere, Italy, 18–21 December 2013. [Google Scholar]
  28. Shoaib, M.; Bosch, S.; Incel, O.D.; Scholten, H.; Havinga, P.J.M. Fusion of Smartphone Motion Sensors for Physical Activity Recognition. Sensors 2014, 14, 10146–10176. [Google Scholar] [CrossRef] [PubMed]
  29. Medrano, C.; Igual, R.; Plaza, I.; Castro, M. Detecting falls as novelties in acceleration patterns acquired with smartphones. PLoS ONE 2014, 9. [Google Scholar] [CrossRef] [PubMed]
  30. Anguita, D.; Ghio, A.; Oneto, L.; Parra, X.; Reyes-Ortiz, J.L. A Public Domain Dataset for Human Activity Recognition Using Smartphones. In Proceedings of the European Symposium on Artificial Neural Networks, Computational Intelligence and Machine Learning (ESANN), Bruges, Belgium, 24–26 April 2013. [Google Scholar]
  31. Reyes-Ortiz, J.L.; Oneto, L.; Sama, A.; Parra, X.; Anguita, D. Transition-Aware Human Activity Recognition Using Smartphones. Neurocomputing 2016, 171, 754–767. [Google Scholar] [CrossRef] [Green Version]
  32. Casale, P.; Pujol, O.; Radeva, P. Personalization and User Verification in Wearable Systems Using Biometric Walking Patterns. Pers. Ubiquitous Comput. 2012, 16, 563–580. [Google Scholar] [CrossRef]
  33. Casilari, E.; Santoyo-Ramón, J.A.; Cano-García, J.M. Analysis of a Smartphone-Based Architecture with Multiple Mobility Sensors for Fall Detection. PLoS ONE 2016, 11, 1–17. [Google Scholar] [CrossRef] [PubMed]
  34. Kwapisz, J.R.; Weiss, G.M.; Moore, S.A. Activity Recognition Using Cell Phone Accelerometers. SIGKDD Explor. Newsl. 2011, 12, 74–82. [Google Scholar] [CrossRef]
  35. Medrano, C.; Plaza, I.; Igual, R.; Sánchez, A.; Castro, M. The Effect of Personalization on Smartphone-Based Fall Detectors. Sensors 2016, 16, 117. [Google Scholar] [CrossRef] [PubMed]
  36. Khan, S.S.; Karg, M.E.; Kulia, D.; Hoey, J. Detecting falls with X-Factor Hidden Markov Models. Appl. Soft Comput. 2017, 55, 168–177. [Google Scholar] [CrossRef]
  37. Frank, K.; Vera Nadales, M.J.; Robertson, P.; Pfeifer, T. Bayesian Recognition of Motion Related Activities with Inertial Sensors. In Proceedings of the ACM International Conference Adjunct Papers on Ubiquitous Computing-Adjunct (Ubicomp), Copenhagen, Denmark, 26–29 September 2010. [Google Scholar]
  38. Ugulino, W.; Cardador, D.; Vega, K.; Velloso, E.; Milidiú, R.; Fuks, H. Wearable Computing: Accelerometers’ Data Classification of Body Postures and Movements. In Proceedings of the 21th Brazilian Symposium on Artificial Intelligence Conference on Advances in Artificial Intelligence-SBIA 2012, Curitiba, Brazil, 20–25 October 2012; Springer: Berlin/Heidelberg, Germany, 2012; pp. 52–61. [Google Scholar]
  39. Zhang, M.; Sawchuk, A.A. USC-HAD: A Daily Activity Dataset for Ubiquitous Activity Recognition Using Wearable Sensors. In Proceedings of the ACM Workshop on Situation, Activity and Goal Awareness (SAGAware), colocated with the International Conference on Ubiquitous Computing (Ubicomp), Pittsburgh, PA, USA, 5–8 September 2012. [Google Scholar]
  40. Kozina, S.; Gjoreski, H.; Gams, M.; Luštrek, M. Three-layer Activity Recognition Combining Domain Knowledge and Meta- classification Author list. J. Med. Biol. Eng. 2013, 33, 406–414. [Google Scholar] [CrossRef]
  41. Banos, O.; Villalonga, C.; Garcia, R.; Saez, A.; Damas, M.; Holgado-Terriza, J.A.; Lee, S.; Pomares, H.; Rojas, I. Design, implementation and validation of a novel open framework for agile development of mobile health applications. BioMed. Eng. OnLine 2015, 14. [Google Scholar] [CrossRef] [PubMed]
  42. Leutheuser, H.; Doelfel, S.; Schuldhaus, D.; Reinfelder, S.; Eskofier, B.M. Performance Comparison of Two Step Segmentation Algorithms Using Different Step Activities. In Proceedings of the International Conference on Wearable and Implantable Body Sensor Networks (BSN), Zurich, Switzerland, 16–19 June 2014. [Google Scholar]
  43. Kwolek, B.; Kepski, M. Human fall detection on embedded platform using depth maps and wireless accelerometer. Comput. Methods Progr. Biomed. 2014, 117, 489–501. [Google Scholar] [CrossRef] [PubMed]
  44. Sucerquia, A.; López, J.D.; Vargas-Bonilla, J.F. SisFall: A Fall and Movement Dataset. Sensors 2017, 17, 198. [Google Scholar] [CrossRef] [PubMed]
  45. Banos, O.; Damas, M.; Pomares, H.; Rojas, I.; Tóth, M.A.; Amft, O. A Benchmark Dataset to Evaluate Sensor Displacement in Activity Recognition. In Proceedings of the ACM Conference on Ubiquitous Computing (UbiComp), Pittsburgh, PA, USA, 5–8 September 2012. [Google Scholar]
  46. Robinovitch, S.N.; Feldman, F.; Yang, Y.; Schonnop, R.; Lueng, P.M.; Sarraf, T.; Sims-Gould, J.; Loughin, M. Video Capture of the Circumstances of Falls in Elderly People Residing in Long-Term Care: An Observational Study. Lancet 2013, 381, 47–54. [Google Scholar] [CrossRef]
  47. Natthapon, P.; Thiemjarus, S.; Nantajeewarawat, E. Automatic Fall Monitoring: A Review. Sensors 2014, 14, 12900–12936. [Google Scholar]
  48. Igual, R.; Medrano, C.; Plaza, I. A comparison of public datasets for acceleration-based fall detection. Med. Eng. Phys. 2015, 37, 870–878. [Google Scholar] [CrossRef] [PubMed]
  49. Kangas, M.; Vikman, I.; Nyberg, L.; Korpelainen, R.; Lindblom, J.; Jämsä, T. Comparison of real-life accidental falls in older people with experimental falls in middle-aged test subjects. Gait Posture 2012, 35, 500–505. [Google Scholar] [CrossRef] [PubMed]
  50. Klenk, J.; Becker, C.; Lieken, F.; Nicolai, S.; Maetzler, W.; Alt, W.; Zijlstra, W.; Hausdorff, J.; van Lummel, R.; Chiari, L.; et al. Comparison of acceleration signals of simulated and real-world backward falls. Med. Eng. Phys. 2011, 33, 368–373. [Google Scholar] [CrossRef] [PubMed]
  51. World Medical Association. WMA Declaration of Helsinki-Ethical principles for medical research involving human subjects. JAMA 2013, 310. [Google Scholar] [CrossRef]
  52. Casilari, E.; Santoyo-Ramón, J.A.; Cano-García, J.M. Analysis of Public Datasets for Wearable Fall Detection Systems. Sensors 2017, 17. [Google Scholar] [CrossRef] [PubMed]
  53. BenAbdelkader, C.; Cutler, R.; Davis, L. Stride and cadence as a biometric in automatic person identification and verification. In Proceedings of the IEEE International Conference on Automatic Face Gesture Recognition (FG), Washington, DC, USA, 20–21 May 2002. [Google Scholar]
  54. Micucci, D.; Mobilio, M.; Napoletano, P.; Tisato, F. Falls as anomalies? An experimental evaluation using smartphone accelerometer data. J. Ambient Intell. Humaniz. Comput. 2017, 8, 87–99. [Google Scholar] [CrossRef]
  55. Vanrell, S.R.; Milone, D.H.; Rufiner, H.L. Assessment of homomorphic analysis for human activity recognition from acceleration signals. IEEE J. Biomed. Health Inform. 2017. [Google Scholar] [CrossRef] [PubMed]
  56. Xu, H.; Liu, J.; Hu, H.; Zhang, Y. Wearable Sensor-Based Human Activity Recognition Method with Multi-Features Extracted from Hilbert-Huang Transform. Sensors 2016, 16, 2048. [Google Scholar] [CrossRef] [PubMed]
  57. He, H.; Ma, Y. Imbalanced Learning: Foundations, Algorithms, and Applications; John Wiley & Sons: Hoboken, NJ, USA, 2013. [Google Scholar]
  58. Kittler, J.; Devyver, P.A. Pattern Recognition. A statistical Approach; Prentice Hall: Upper Saddle River, NJ, USA, 1982. [Google Scholar]
  59. Sztyler, T.; Stuckenschmidt, H. Online personalization of cross-subjects based activity recognition models on wearable devices. In Proceedings of the 2017 IEEE International Conference on Pervasive Computing and Communications (PerCom), Kona, Big Island, HI, USA, 13–17 March 2017; pp. 180–189. [Google Scholar]
  60. Weiss, G.M.; Lockhart, J.W. The impact of personalization on smartphone-based activity recognition. In Proceedings of the AAAI Workshop on Activity Context Representation: Techniques and Languages, Toronto, ON, Canada, 22–23 July 2012; pp. 98–104. [Google Scholar]
  61. Ordóñez, F.J.; Roggen, D. Deep convolutional and lstm recurrent neural networks for multimodal wearable activity recognition. Sensors 2016, 16, 115. [Google Scholar] [CrossRef] [PubMed]
Figure 1. Activities of daily living (ADLs) and theirs occurrence in the publicly available datasets analysed grouped by category.
Applsci 07 01101 g001
Figure 2. Falls and theirs occurrence in the publicly available datasets analysed grouped by category.
Applsci 07 01101 g002
Figure 3. Samples of acceleration shapes.
Applsci 07 01101 g003
Figure 4. Activity samples distribution.
Applsci 07 01101 g004
Figure 5. Confusion matrix of the AF-17 classification achieved with k-Nearest Neighbour (k-NN).
Applsci 07 01101 g005
Table 1. The publicly available datasets containing samples from smartphones sensors.
DatasetYearADLsFallsNr. of SubjectsGenderAgeHeightWeight
FemaleMale(Years)(cm)(Kg)
DMPSBFD [24]2015yesyes5-----
Gravity [23]2016yesyes2--26–32170–18563–80
29 ± 4.2178 ± 10.671.5 ± 12
MobiFall [11]2014yesyes2471722–47160–18950–103
27 ± 5175 ± 776.4 ± 14.5
MobiAct [25]2016yesyes57154220–47160–19350–120
25 ± 4175 ± 476.6 ± 14.4
RealWorld (HAR) [26]2016yesno167816–62163–18348–95
32 ± 12173 ± 774.1 ± 13.3
Shoaib PA [27]2013yesno40425–30--
-
Shoaib SA [28]2014yesno1001025–30--
-
tFall [29]2013yesyes107320–42161–18454–98
31 ± 9173 ± 169.2 ± 13.1
UCI HAR [30]2012yesno30--19–48--
-
UCI HAPT [31]2015yesno30--19–48--
-
UCI UIWADS [32]2013yesno22-----
-
UMA Fall [33]2016yesyes1761114–55155–19550–93
27 ± 10172 ± 969.9 ± 12.3
WISDM [34]2012yesno29-----
UniMiB SHAR2016yesyes3024618–60160–19050–82
27 ± 11169 ± 764.4 ± 9.7
Table 2. ADLs performed by the subjects In the UniMiB SHAR dataset.
CategoryNameDescriptionLabel
Motion-relatedStanding up from layingFrom laying on the bed to standingStandingUpFL
Lying down from standingFrom standing to lying on a bedLyingDownFS
Standing up from sittingFrom standing to sitting on a chairStandingUpFS
RunningModerate runningRunning
Sitting downFrom standing to sitting on a chairSittingDown
Going downstairsClimb the stairs moderatelyGoingDownS
Going upstairsDown the stairs moderatelyGoingUpS
WalkingNormal walkingWalking
Sport-relatedJumpingContinuos jumpingJumping
Table 3. Falls performed by the subjects in teh UniMiB SHAR dataset.
CategoryNameDescriptionLabel
Falling backwardFalling backward-sitting-chairFall backward while trying to sit on a chairFallingBackSC
Generic falling backwardGeneric fall backward from standingFallingBack
Falling forwardFalling with protection strategiesFalls using compensation strategies to prevent the impactFallingWithPS
Generic falling forwardFall forward from standing, use of hands to dampen fallFallingForw
Falling sidewardFalling rightwardFall right from standingFallingLeft
Falling leftwardFall right from standingFallingRight
Specific fallHitting an obstacle in the fallFalls with contact to an obstacle before hitting the groundHittingObstacle
SyncopeGetting unconsciousSyncope
Table 4. The characteristics of the subjects.
TotalFemaleMale
Subjects30246
age18–6018–5520–60min–max
27 ± 1124 ± 936 ± 15mean ± std
height160–190160–172170–190min–max
169 ± 7166 ± 4179 ± 6mean ± std
weight50–8250–7855–82min–max
64.4 ± 9.761.9 ± 7.874.7 ± 9.7mean ± std
Table 5. The protocols for ADLs aquisition.
ProtocolActionIteration
Protocol 1Start the registration1 time
Put the smartphone in the pocket
clap
Walking for 30 s
clap
Running for 30 s
clap
Pull the smartphone from the pocket
Stop the registration
Protocol 2Start the registration1 time
Put the smartphone in the pocket
clap
Climb 15 steps
clap
Go down 15 steps
clap
Wait 2 s
clap
Jump 5 times
clap
Pull the smartphone from the pocket
Stop the registration
Protocol 3Start the registration1 time
Put the smartphone in the pocket
clap5 times
Sitting down
clap
Standing up from sitting
clap
Wait 2 s
clap5 times
Lying down from standing
clap
Standing up from laying
clap
Wait 2 s
Pull the smartphone from the pocket1 time
Stop the registration
Table 6. Protocol for each fall.
ActionIteration
Start the registration6 times
Put the smartphone in the pocket
clap
fall
clap
Pull the smartphone from the pocket
Stop the registration
Table 7. Five-fold evaluation. Mean Average Accuracy for each classification task using raw data and magnitude as feature vectors. In bold are the best results for each classification task and feature vector employed.
5-fold
Raw DataMagnitude
DataKNNSVMANNRFKNNSVMANNRF
AF-1782.8678.7556.0681.4865.3065.7141.9565.96
AF-297.7898.7198.5798.0995.5697.4296.7195.74
A-987.7781.6272.1388.4177.3778.9462.8175.14
F-878.5575.6355.0778.2753.3156.3437.6657.26
Table 8. Leave-one-subject-out. Mean Average Accuracy for each classification task using raw data and magnitude of the signal as feature vectors. In bold the best results for each classification task and feature vector employed.
Leave-One-Subject-Out
Raw DataMagnitude
DataKNNSVMANNRFKNNSVMANNRF
AF-1752.1455.1548.0056.5352.1455.0948.0056.58
AF-292.9097.5795.4197.0292.9097.5796.0797.05
A-963.7963.3263.6373.1763.7963.3663.6372.67
F-843.6648.8438.5045.8843.6649.3538.5045.26

