A Comparative Study of Clustering Analysis Method for Driver’s Steering Intention Classification and Identification under Different Typical Conditions


Abstract
:
1. Introduction
2. Experiment
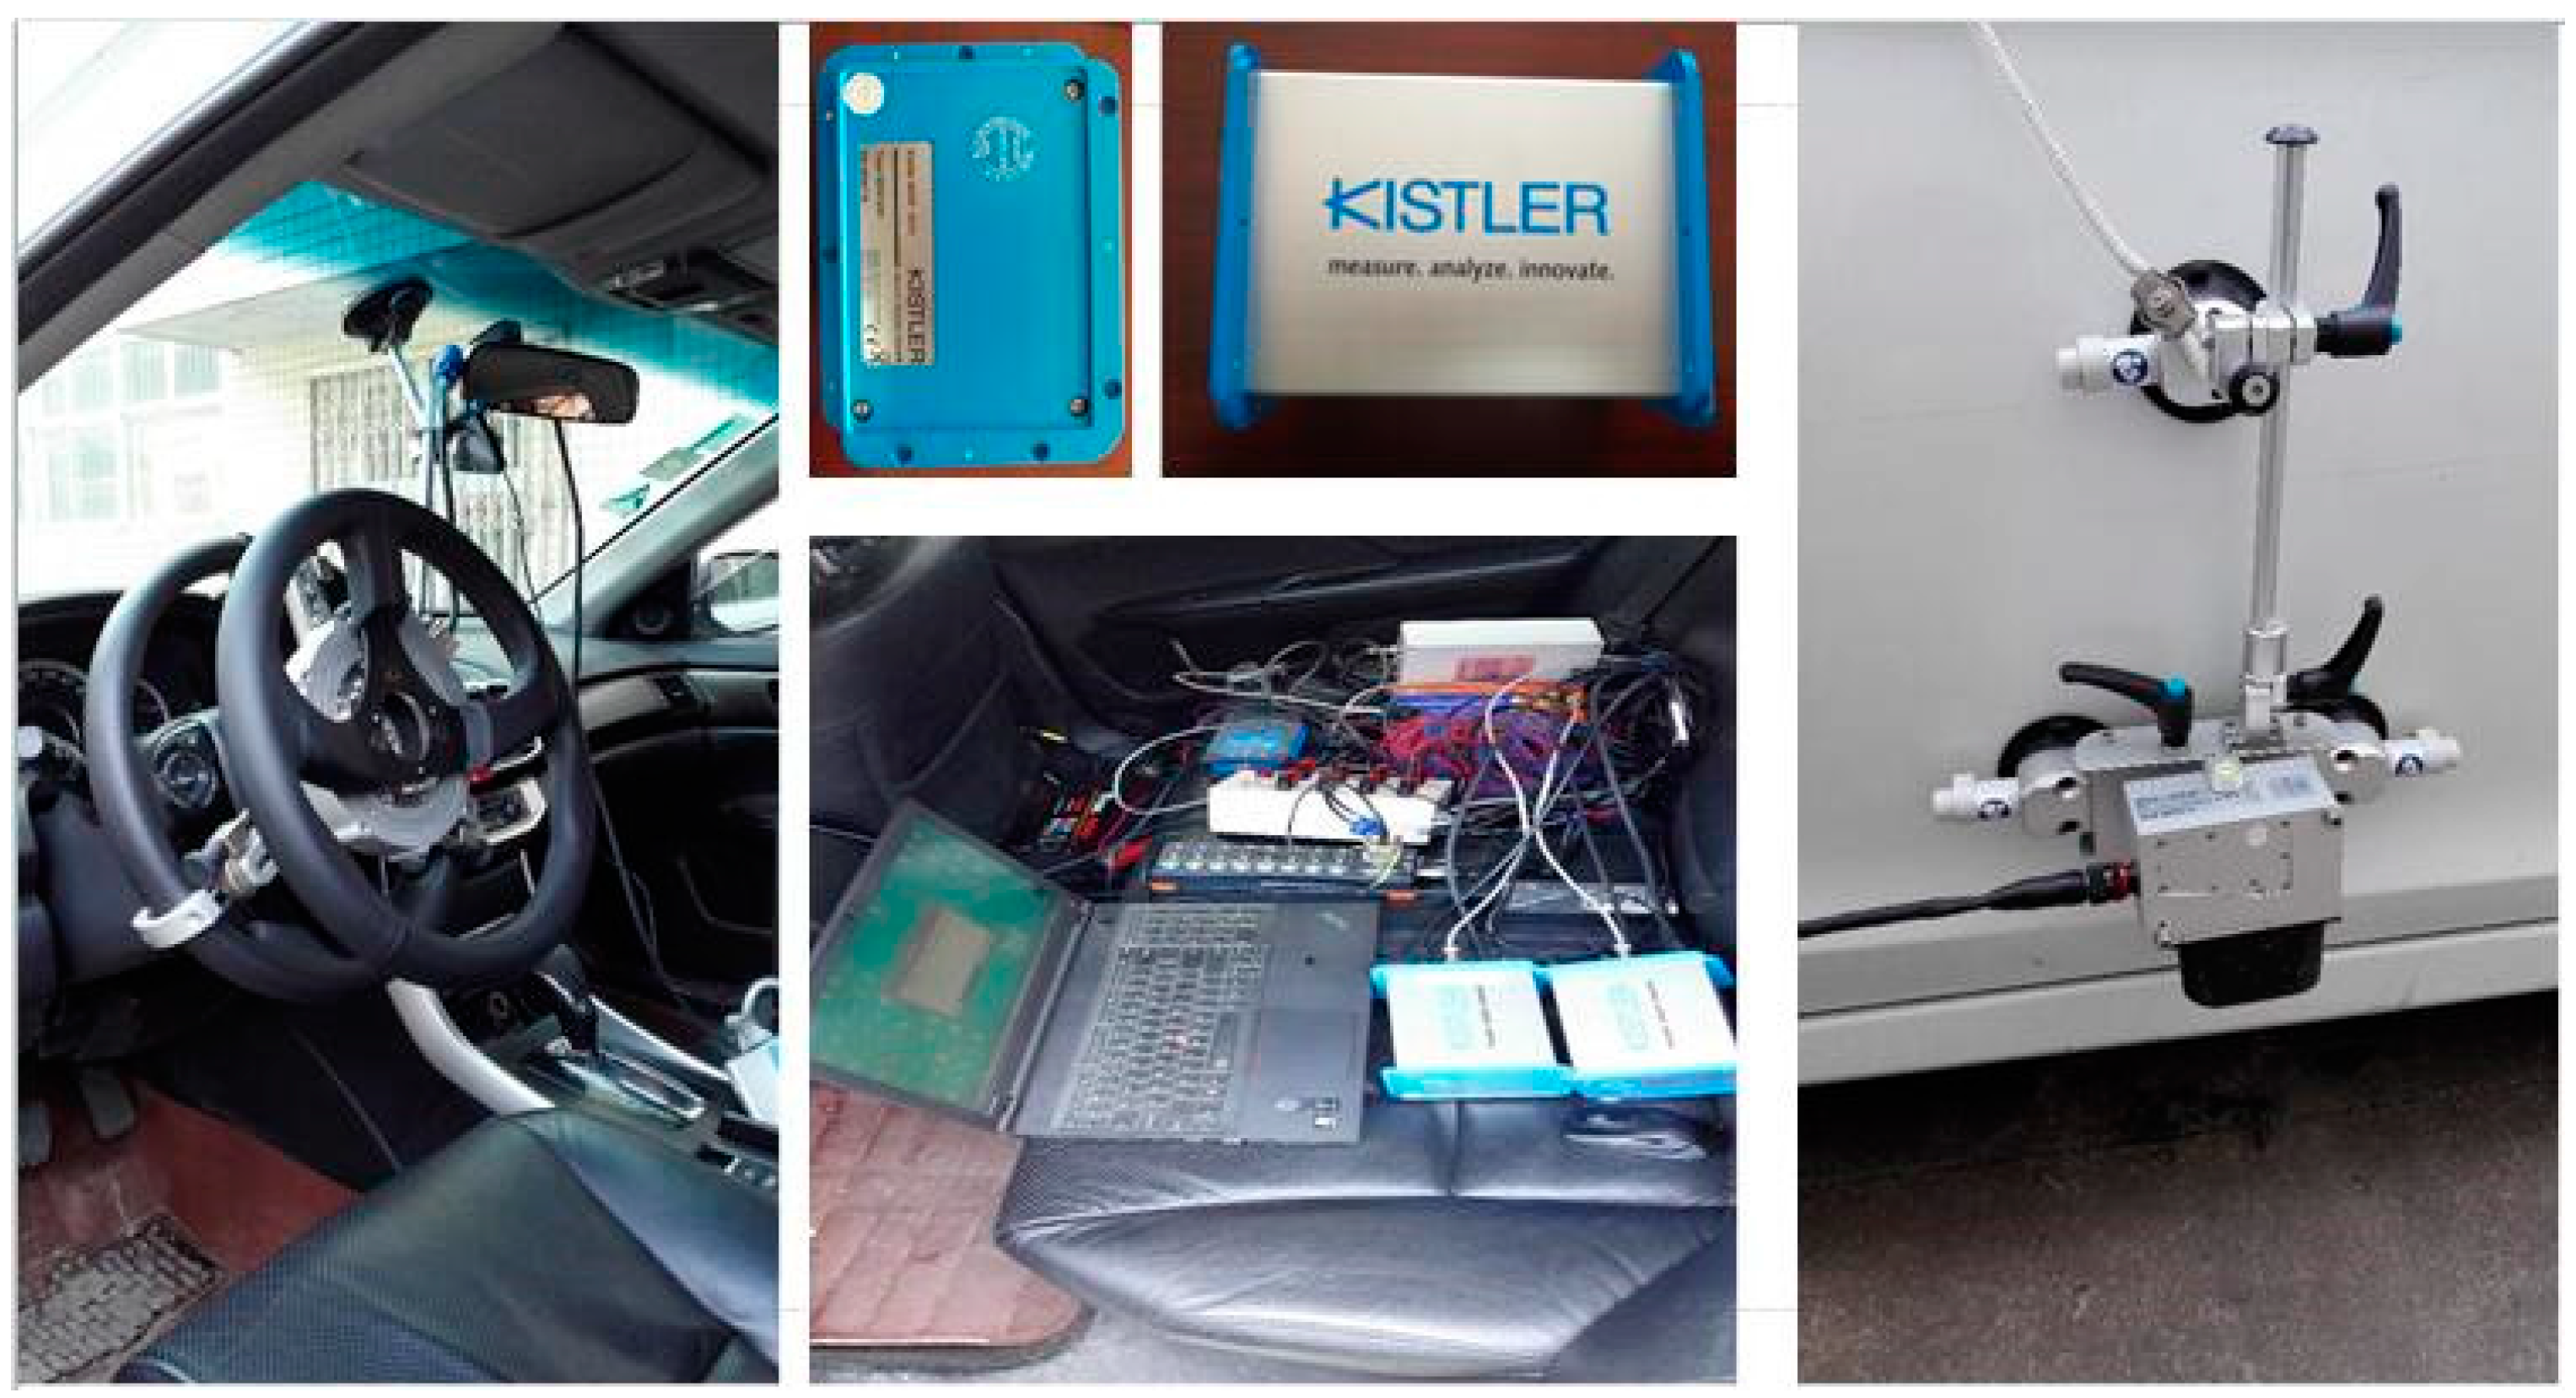
2.1. Experimental Devices
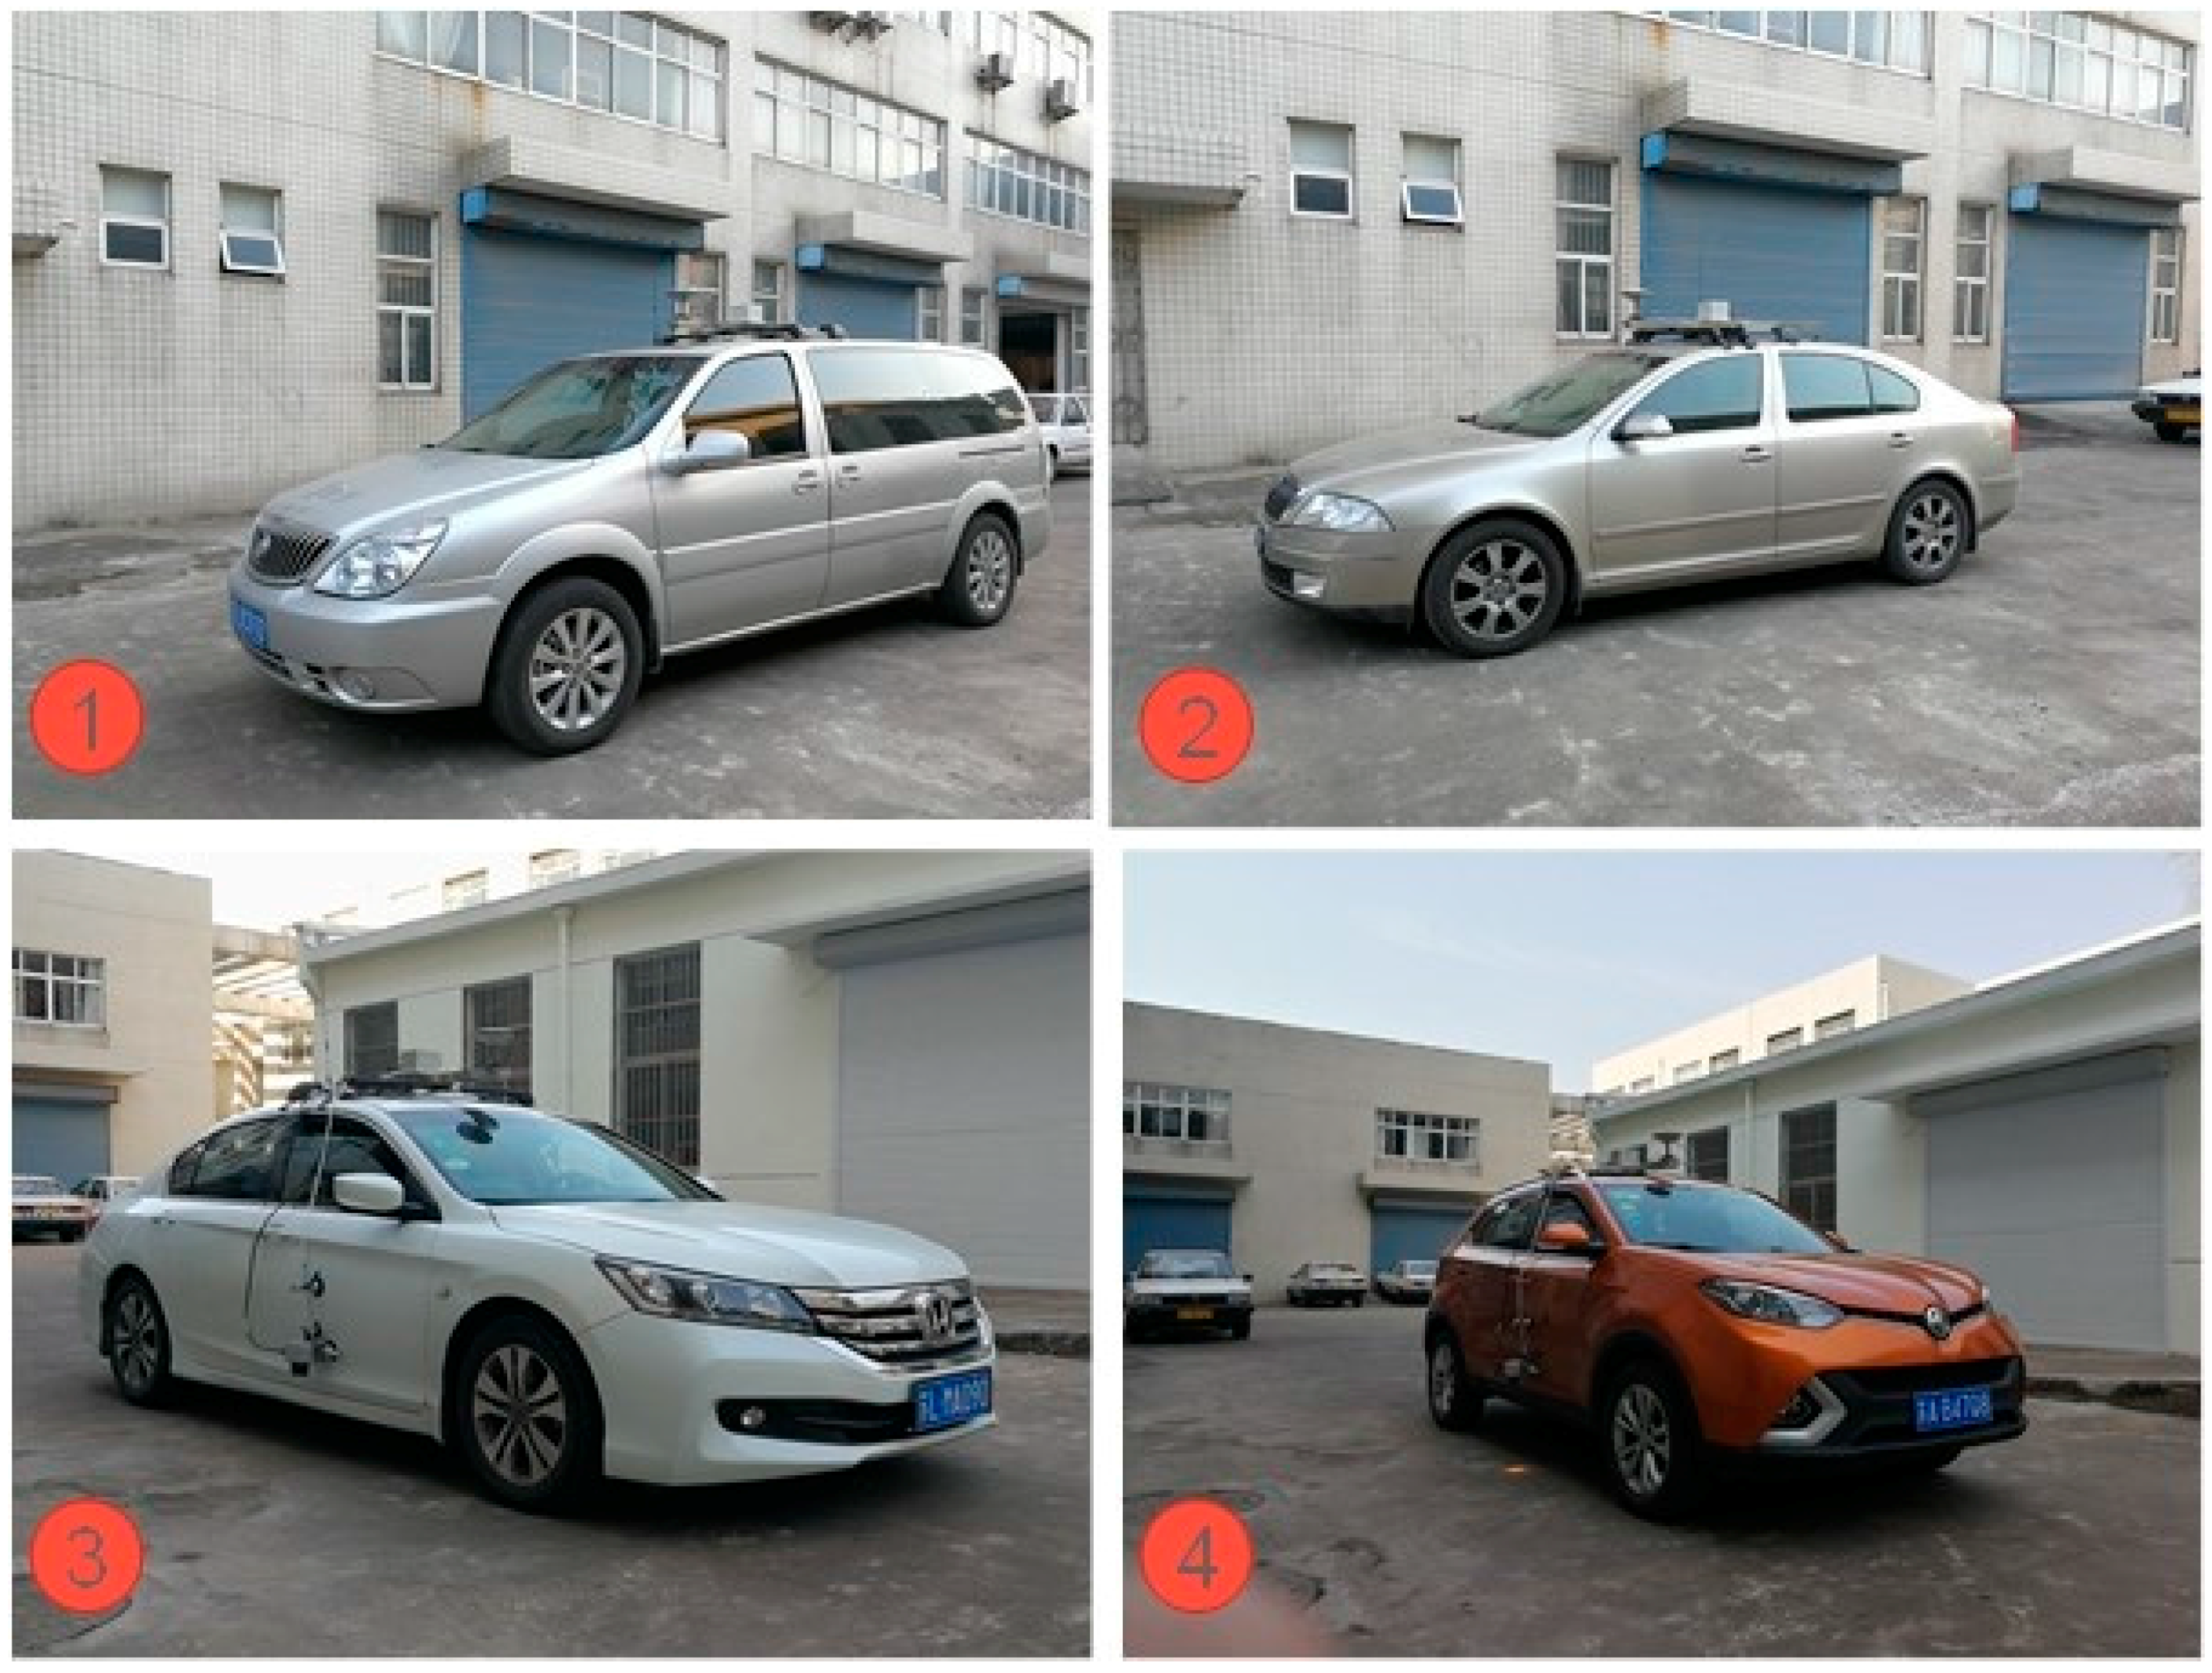
2.2. Experimental Design and Experimental Vehicles
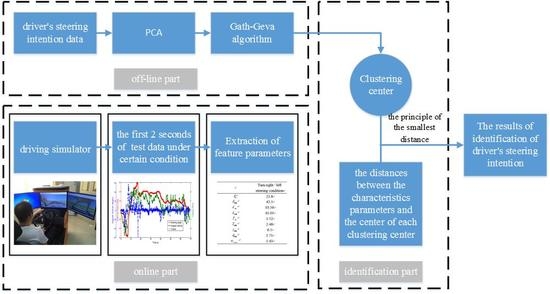
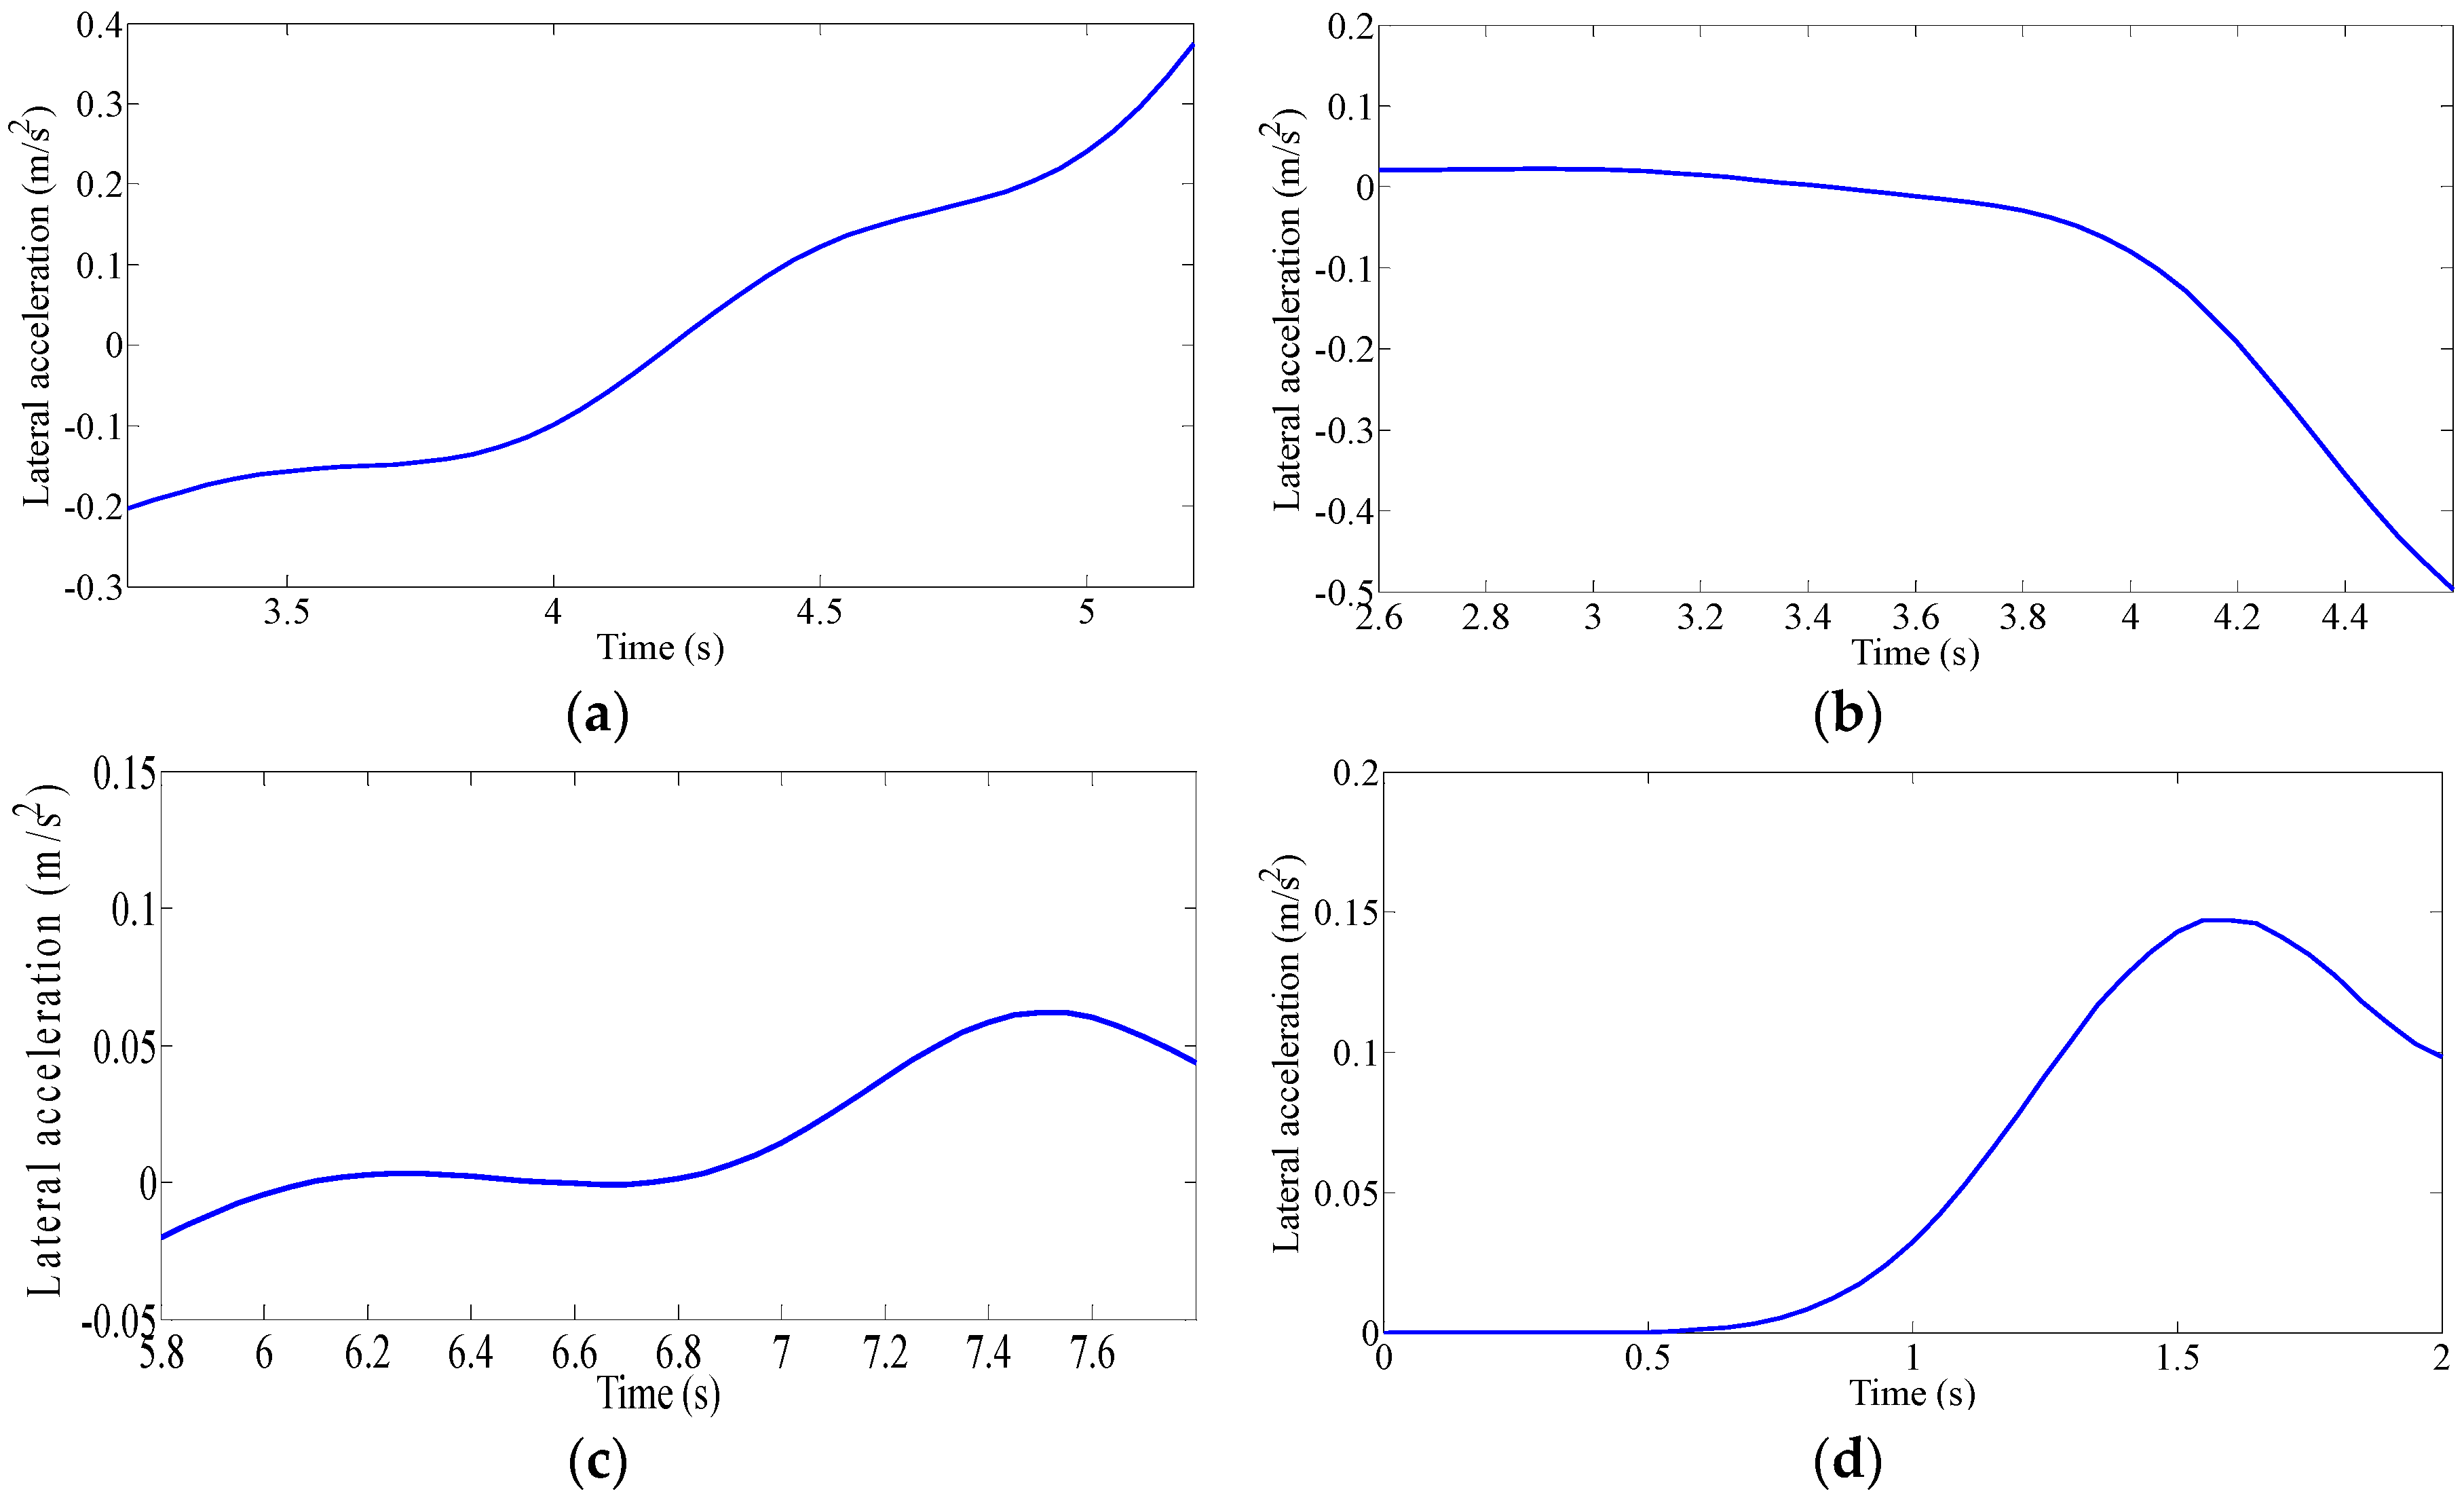
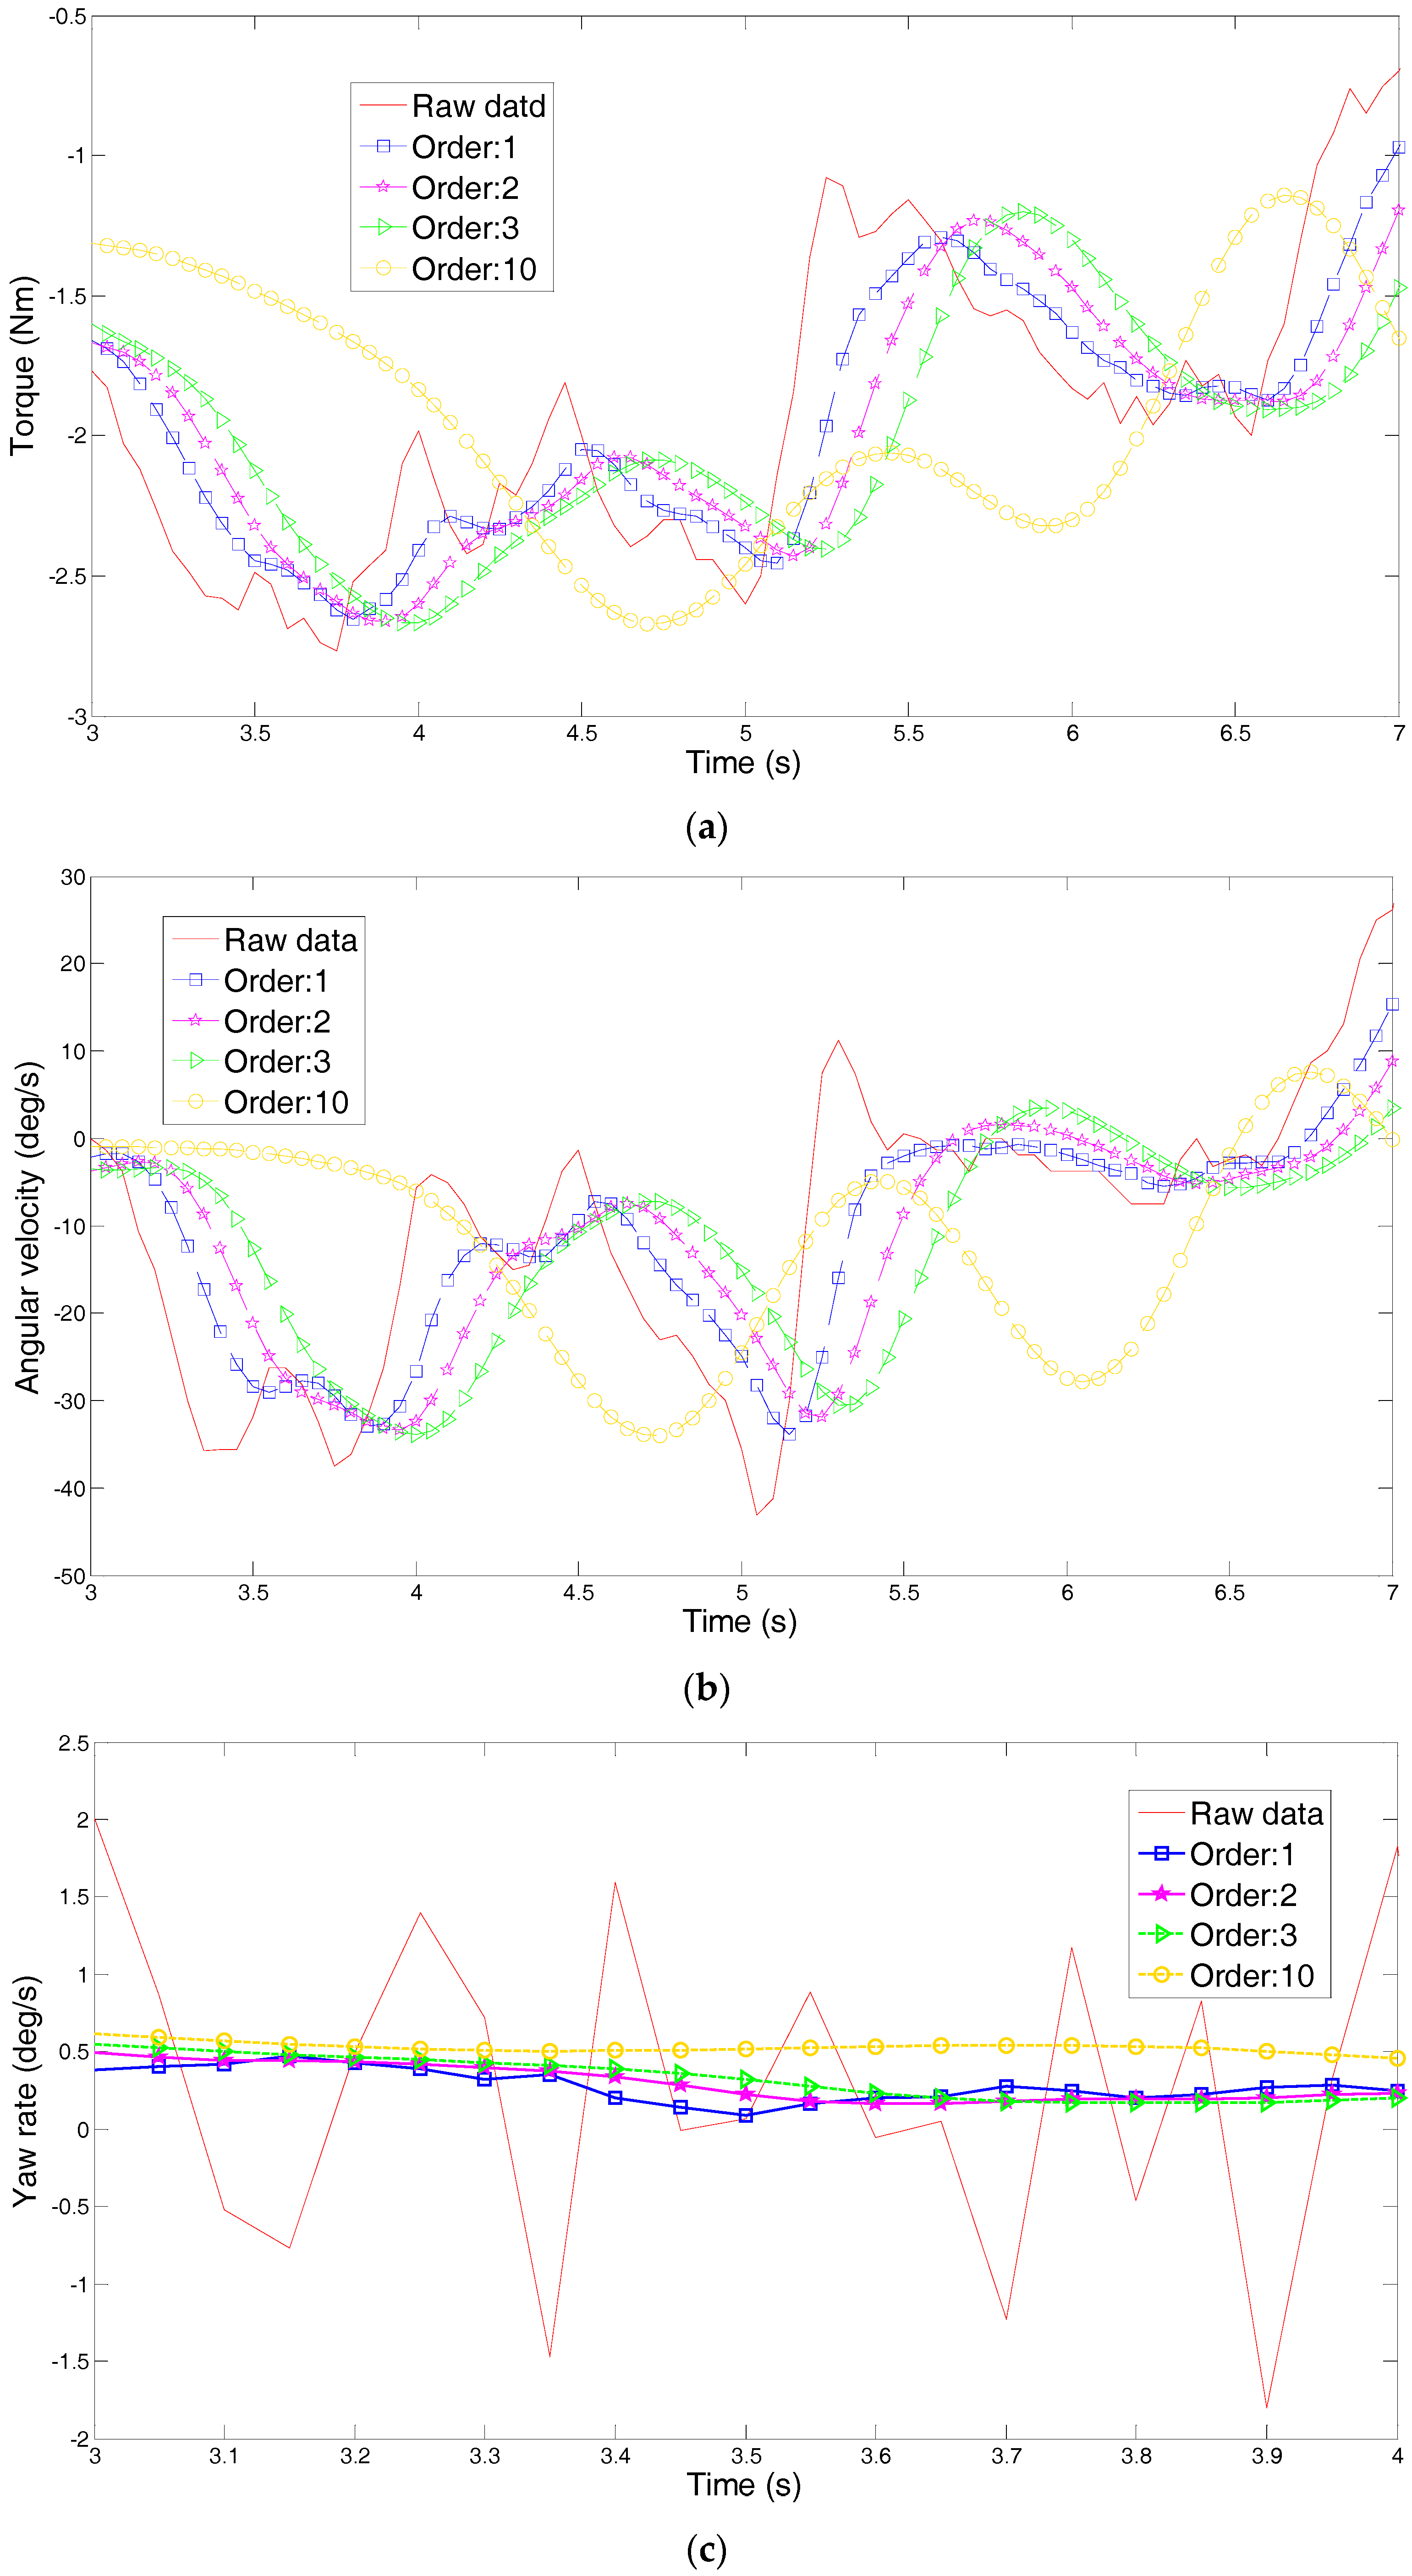
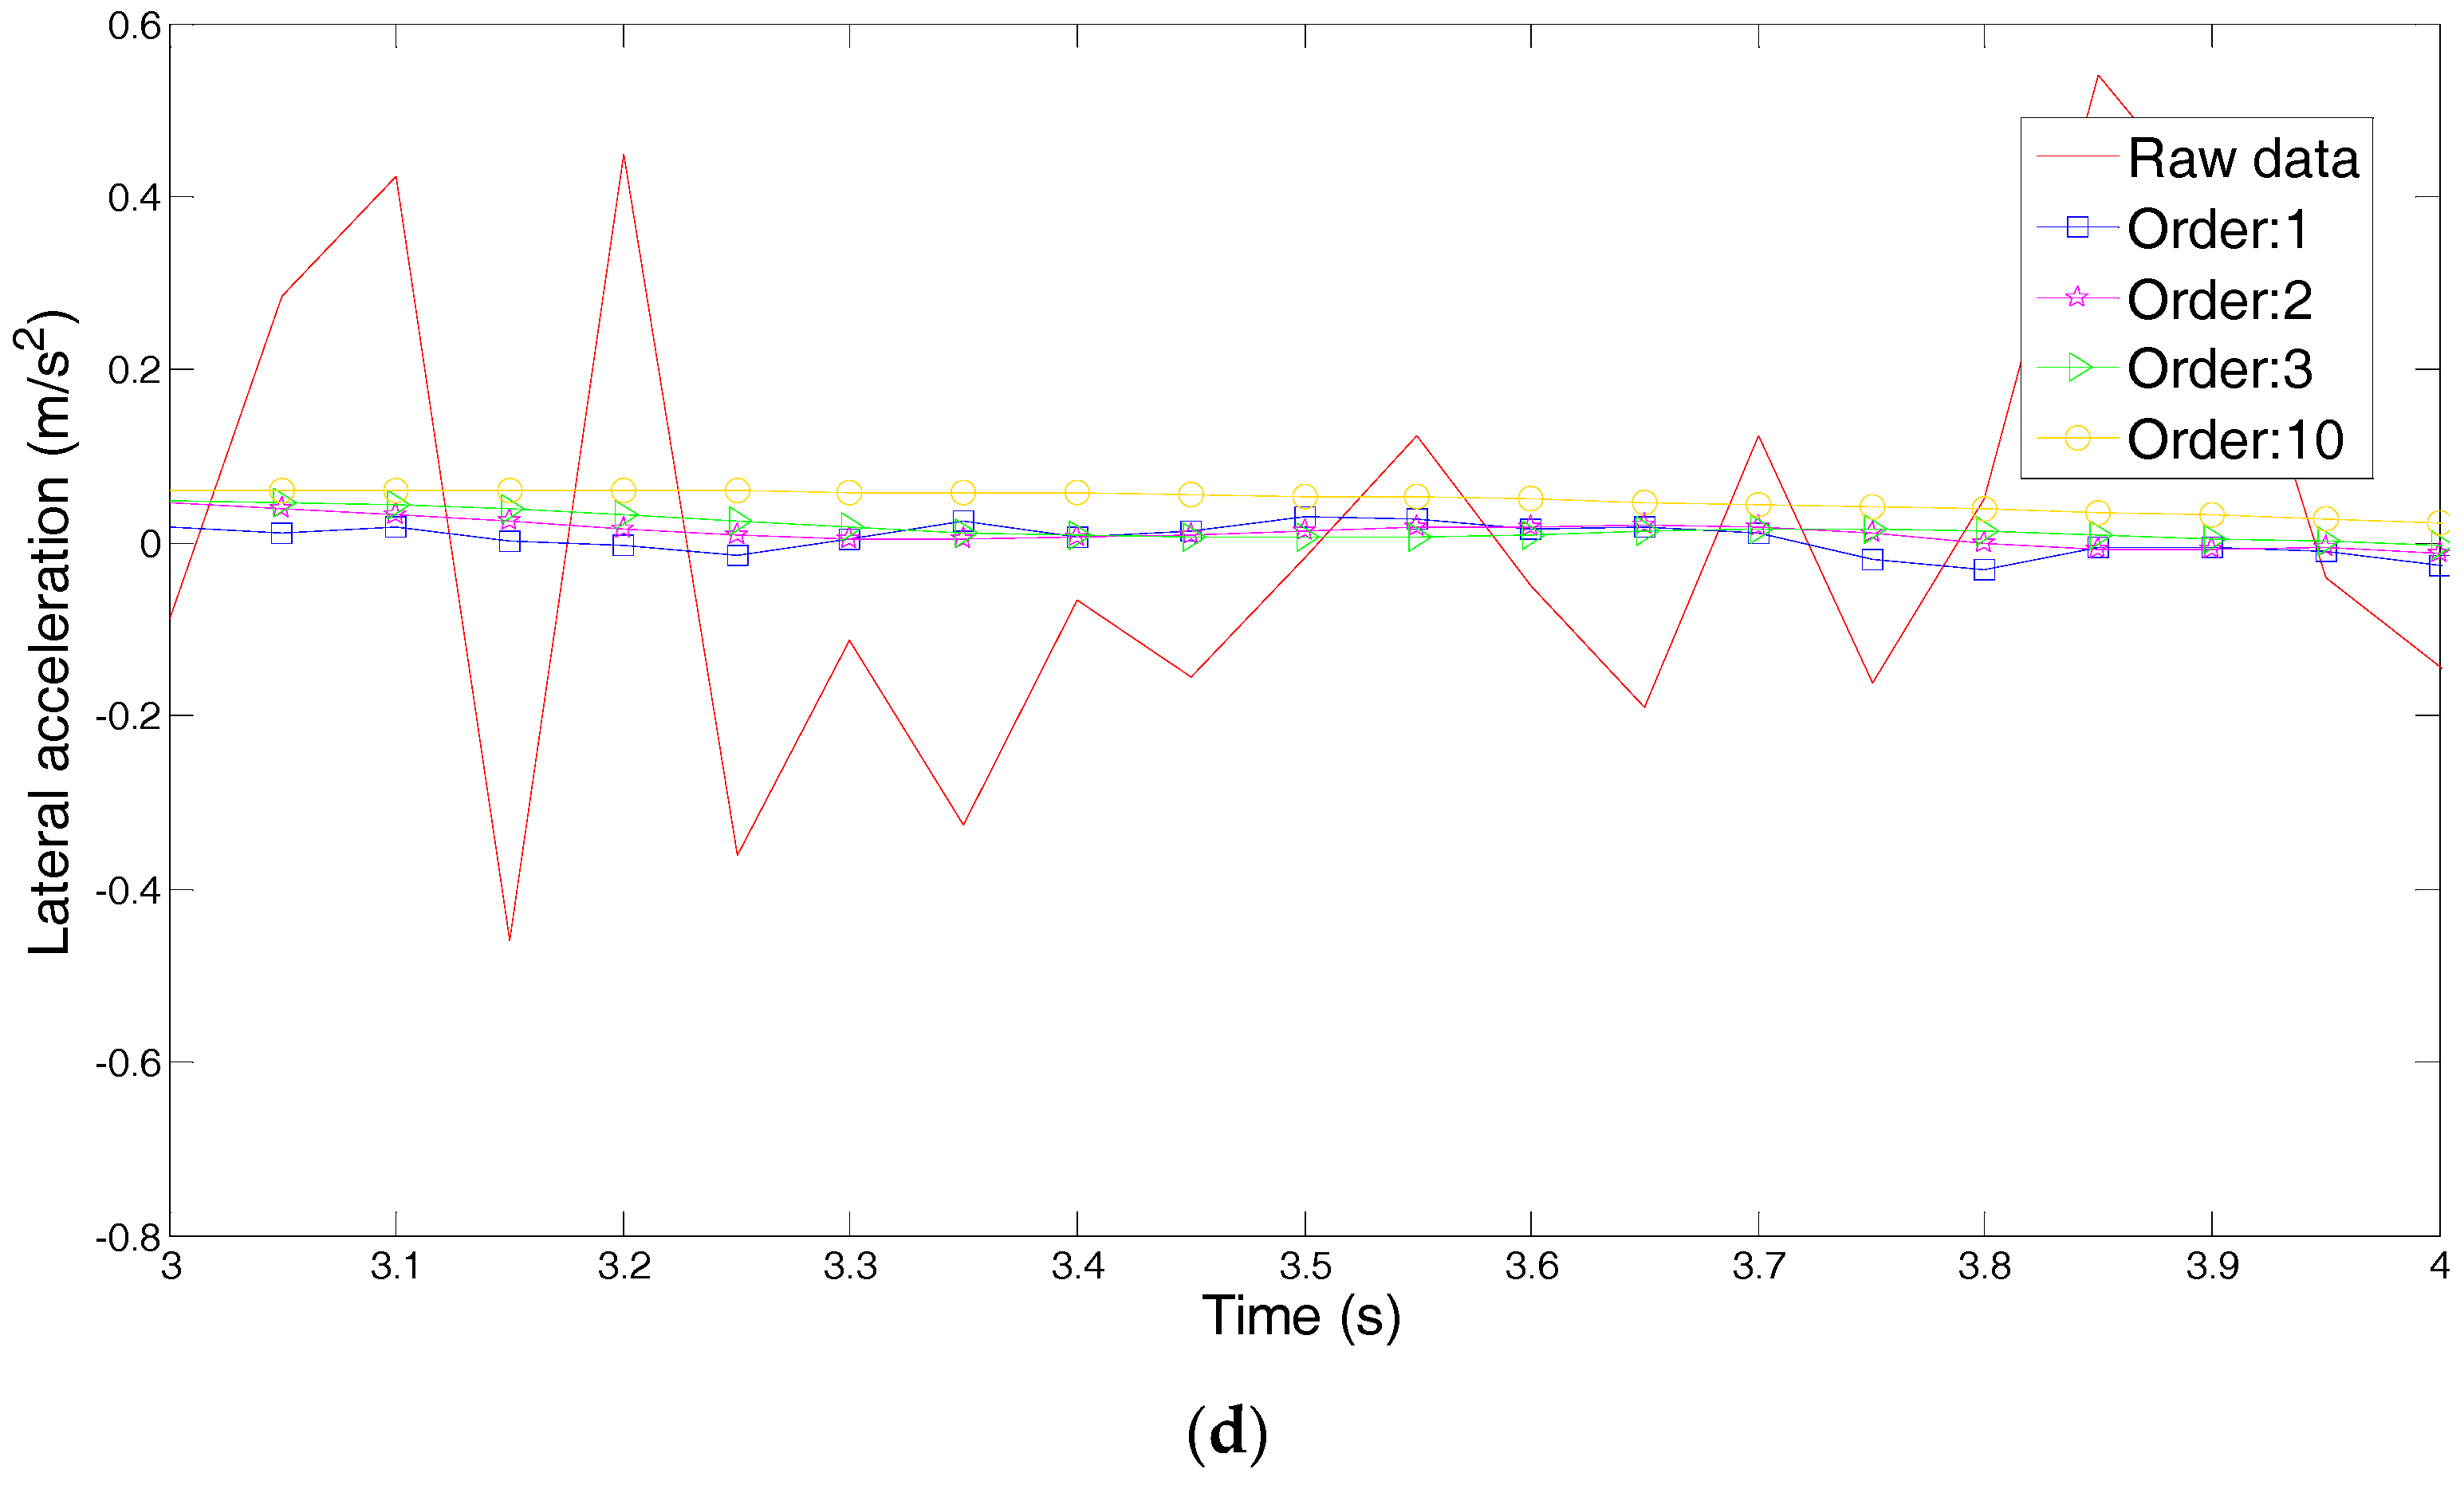
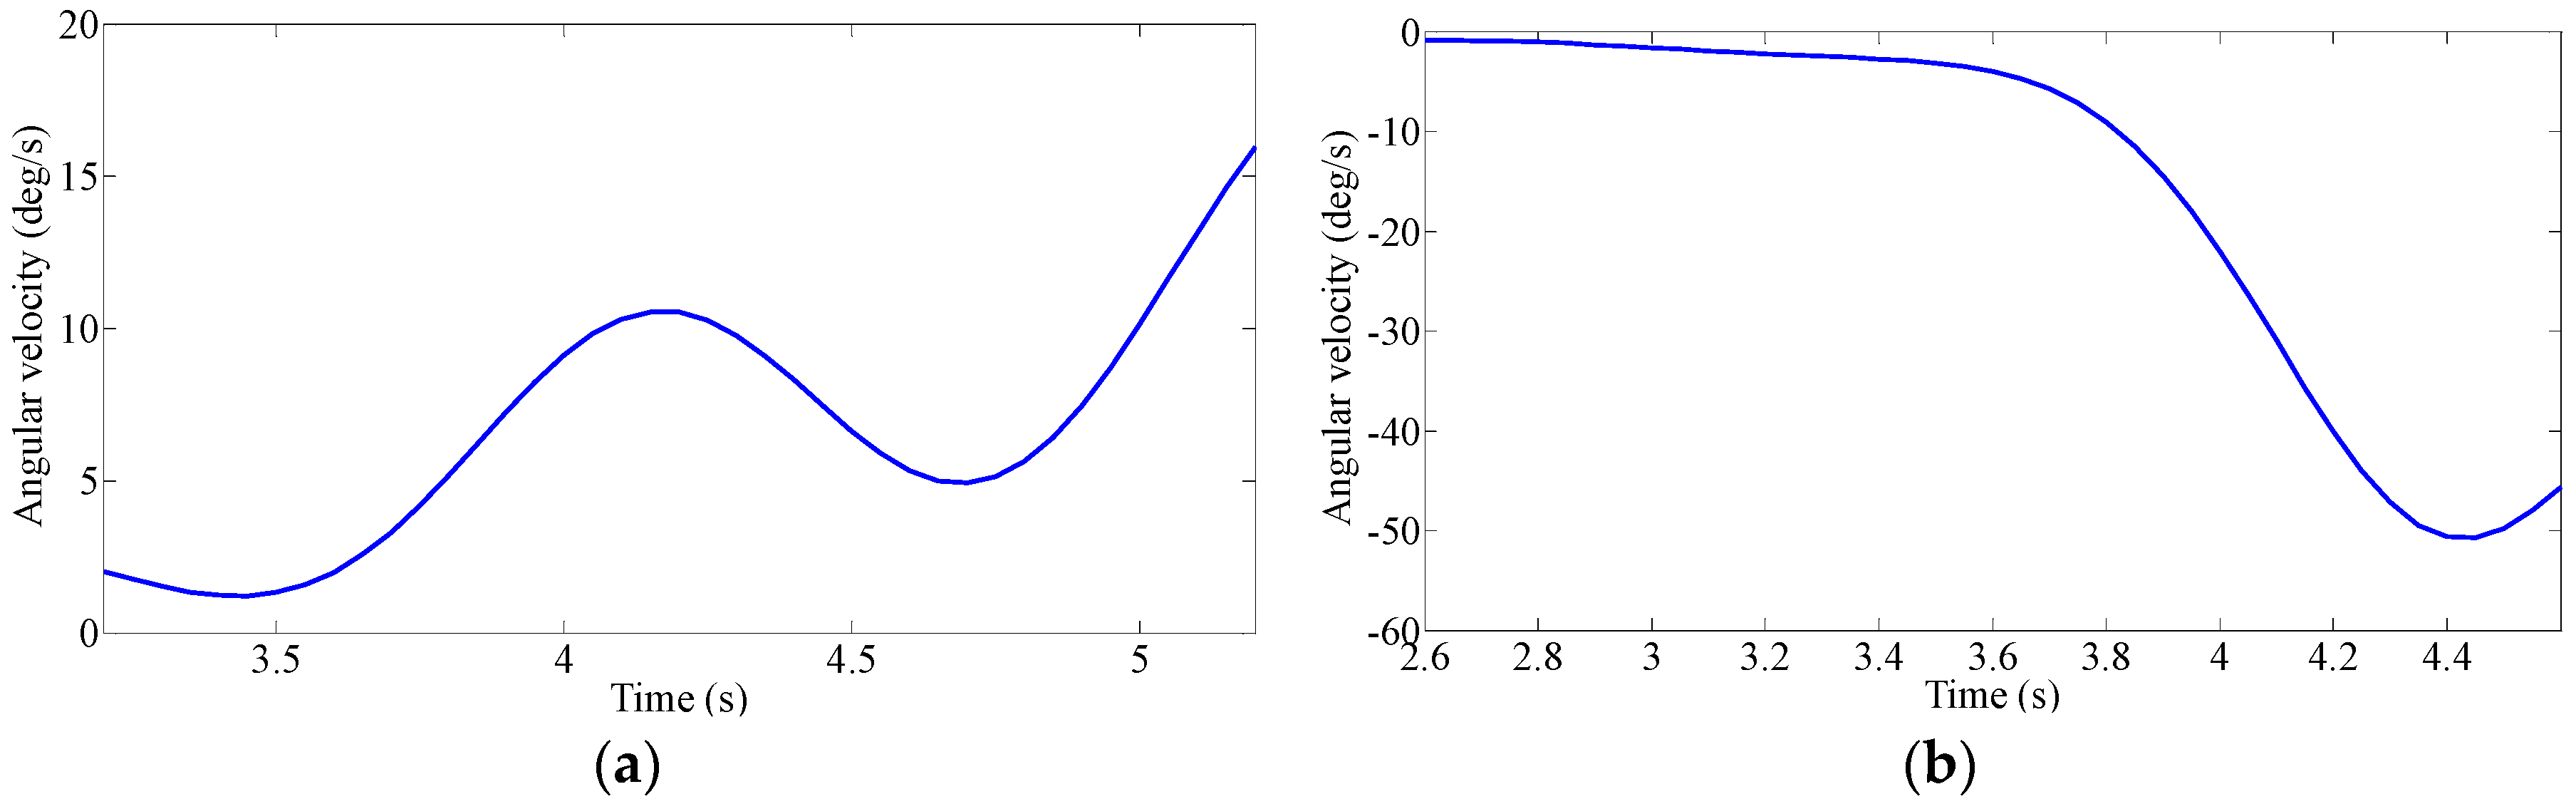
3. The Method of the Driver’s Intention Identification
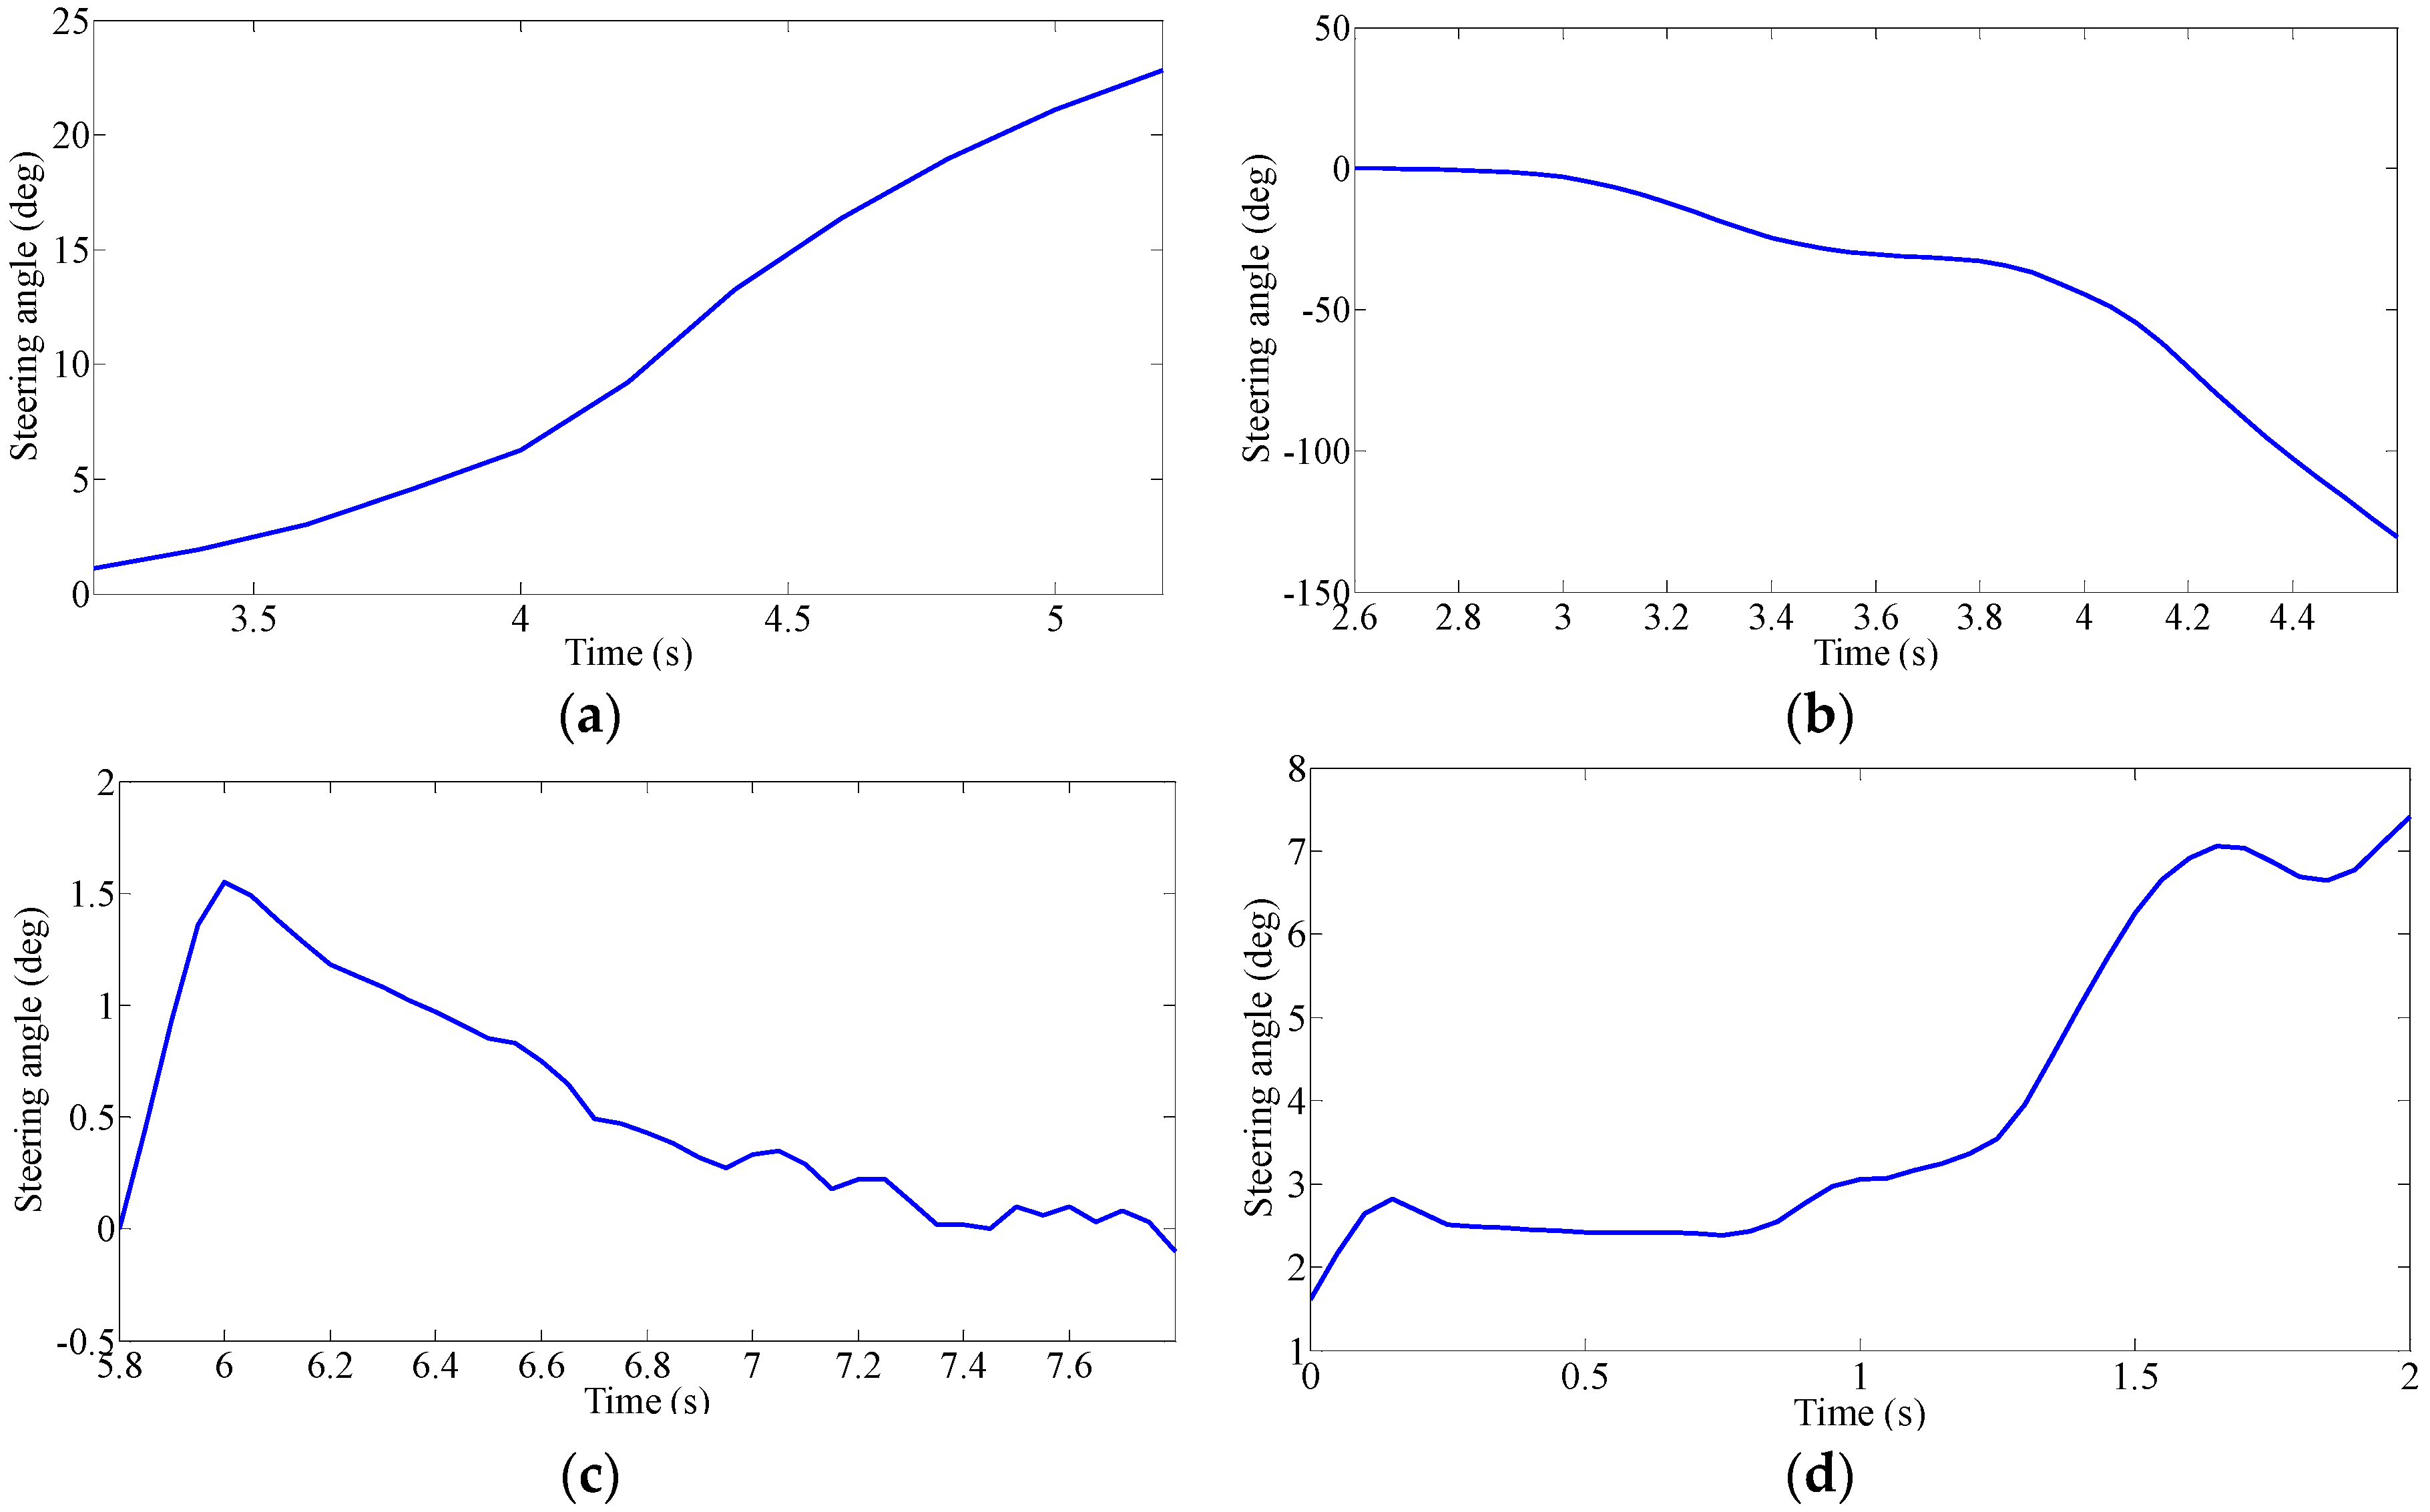
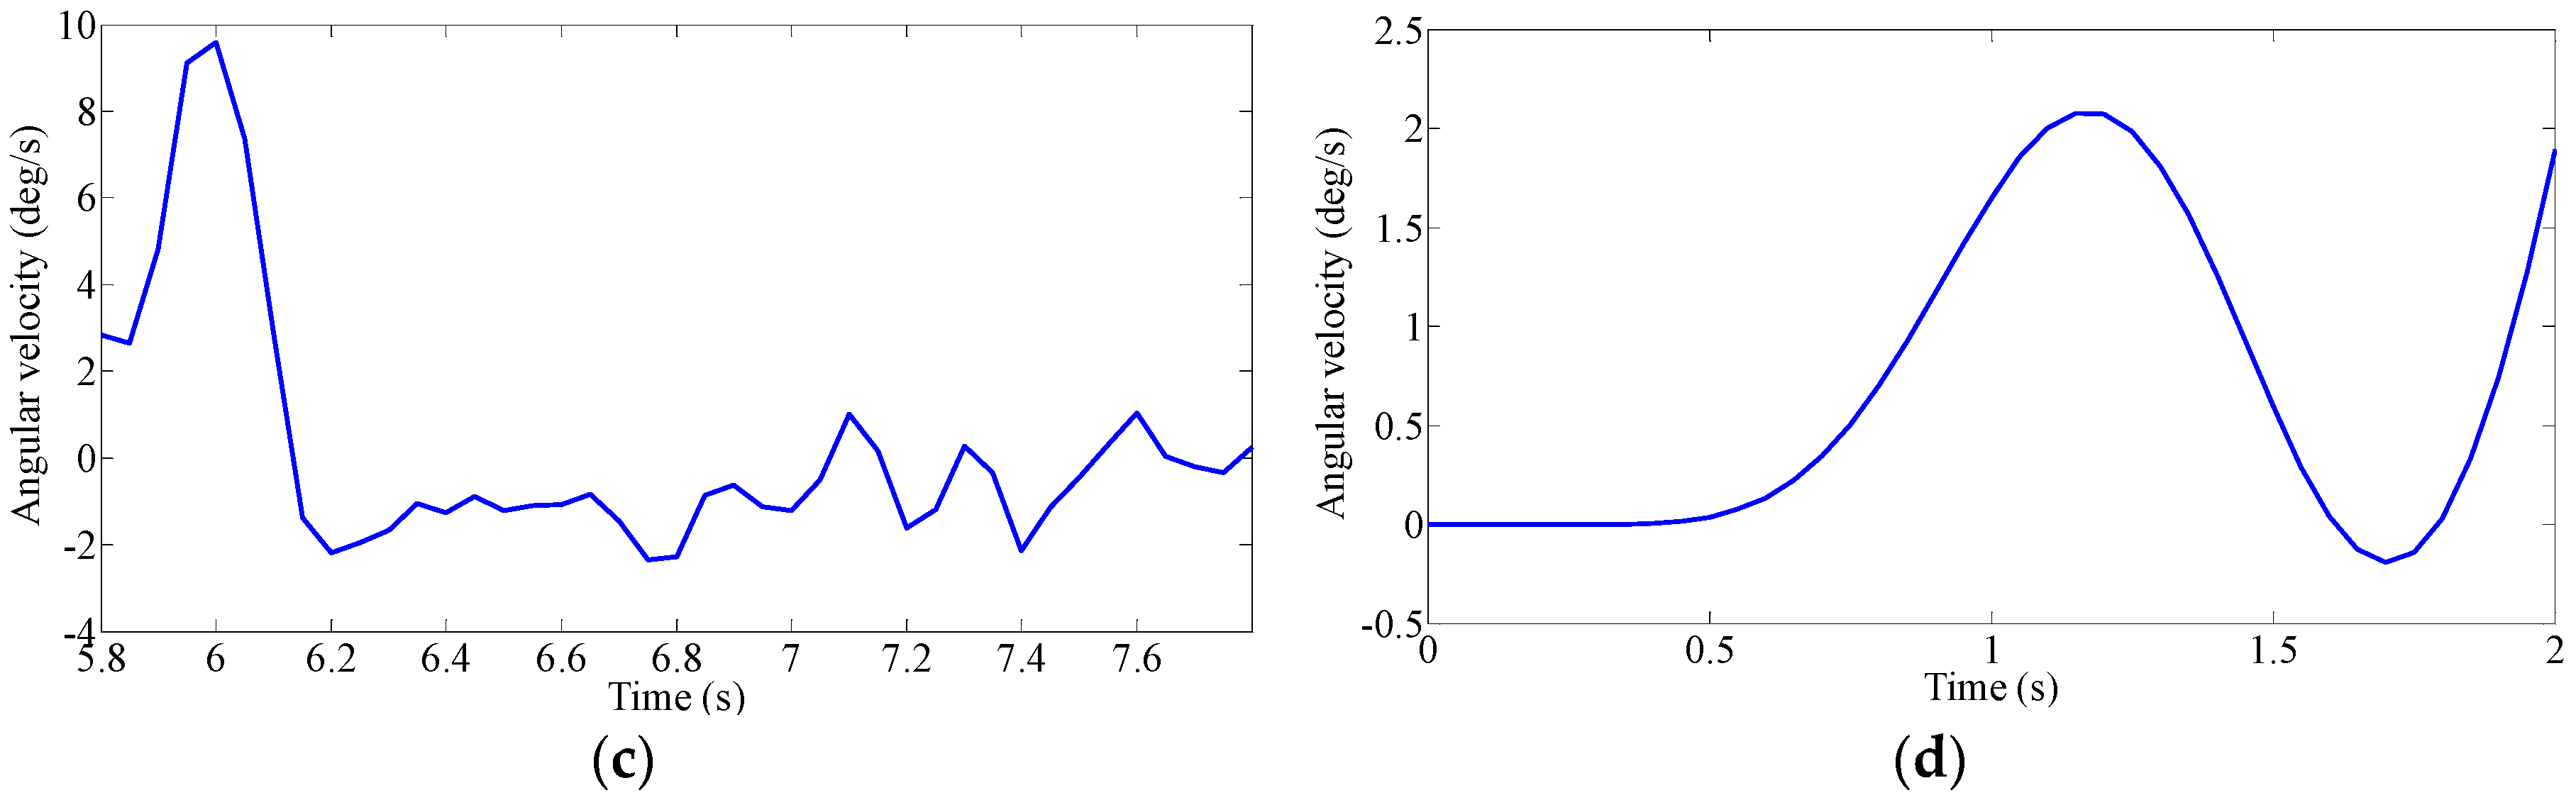
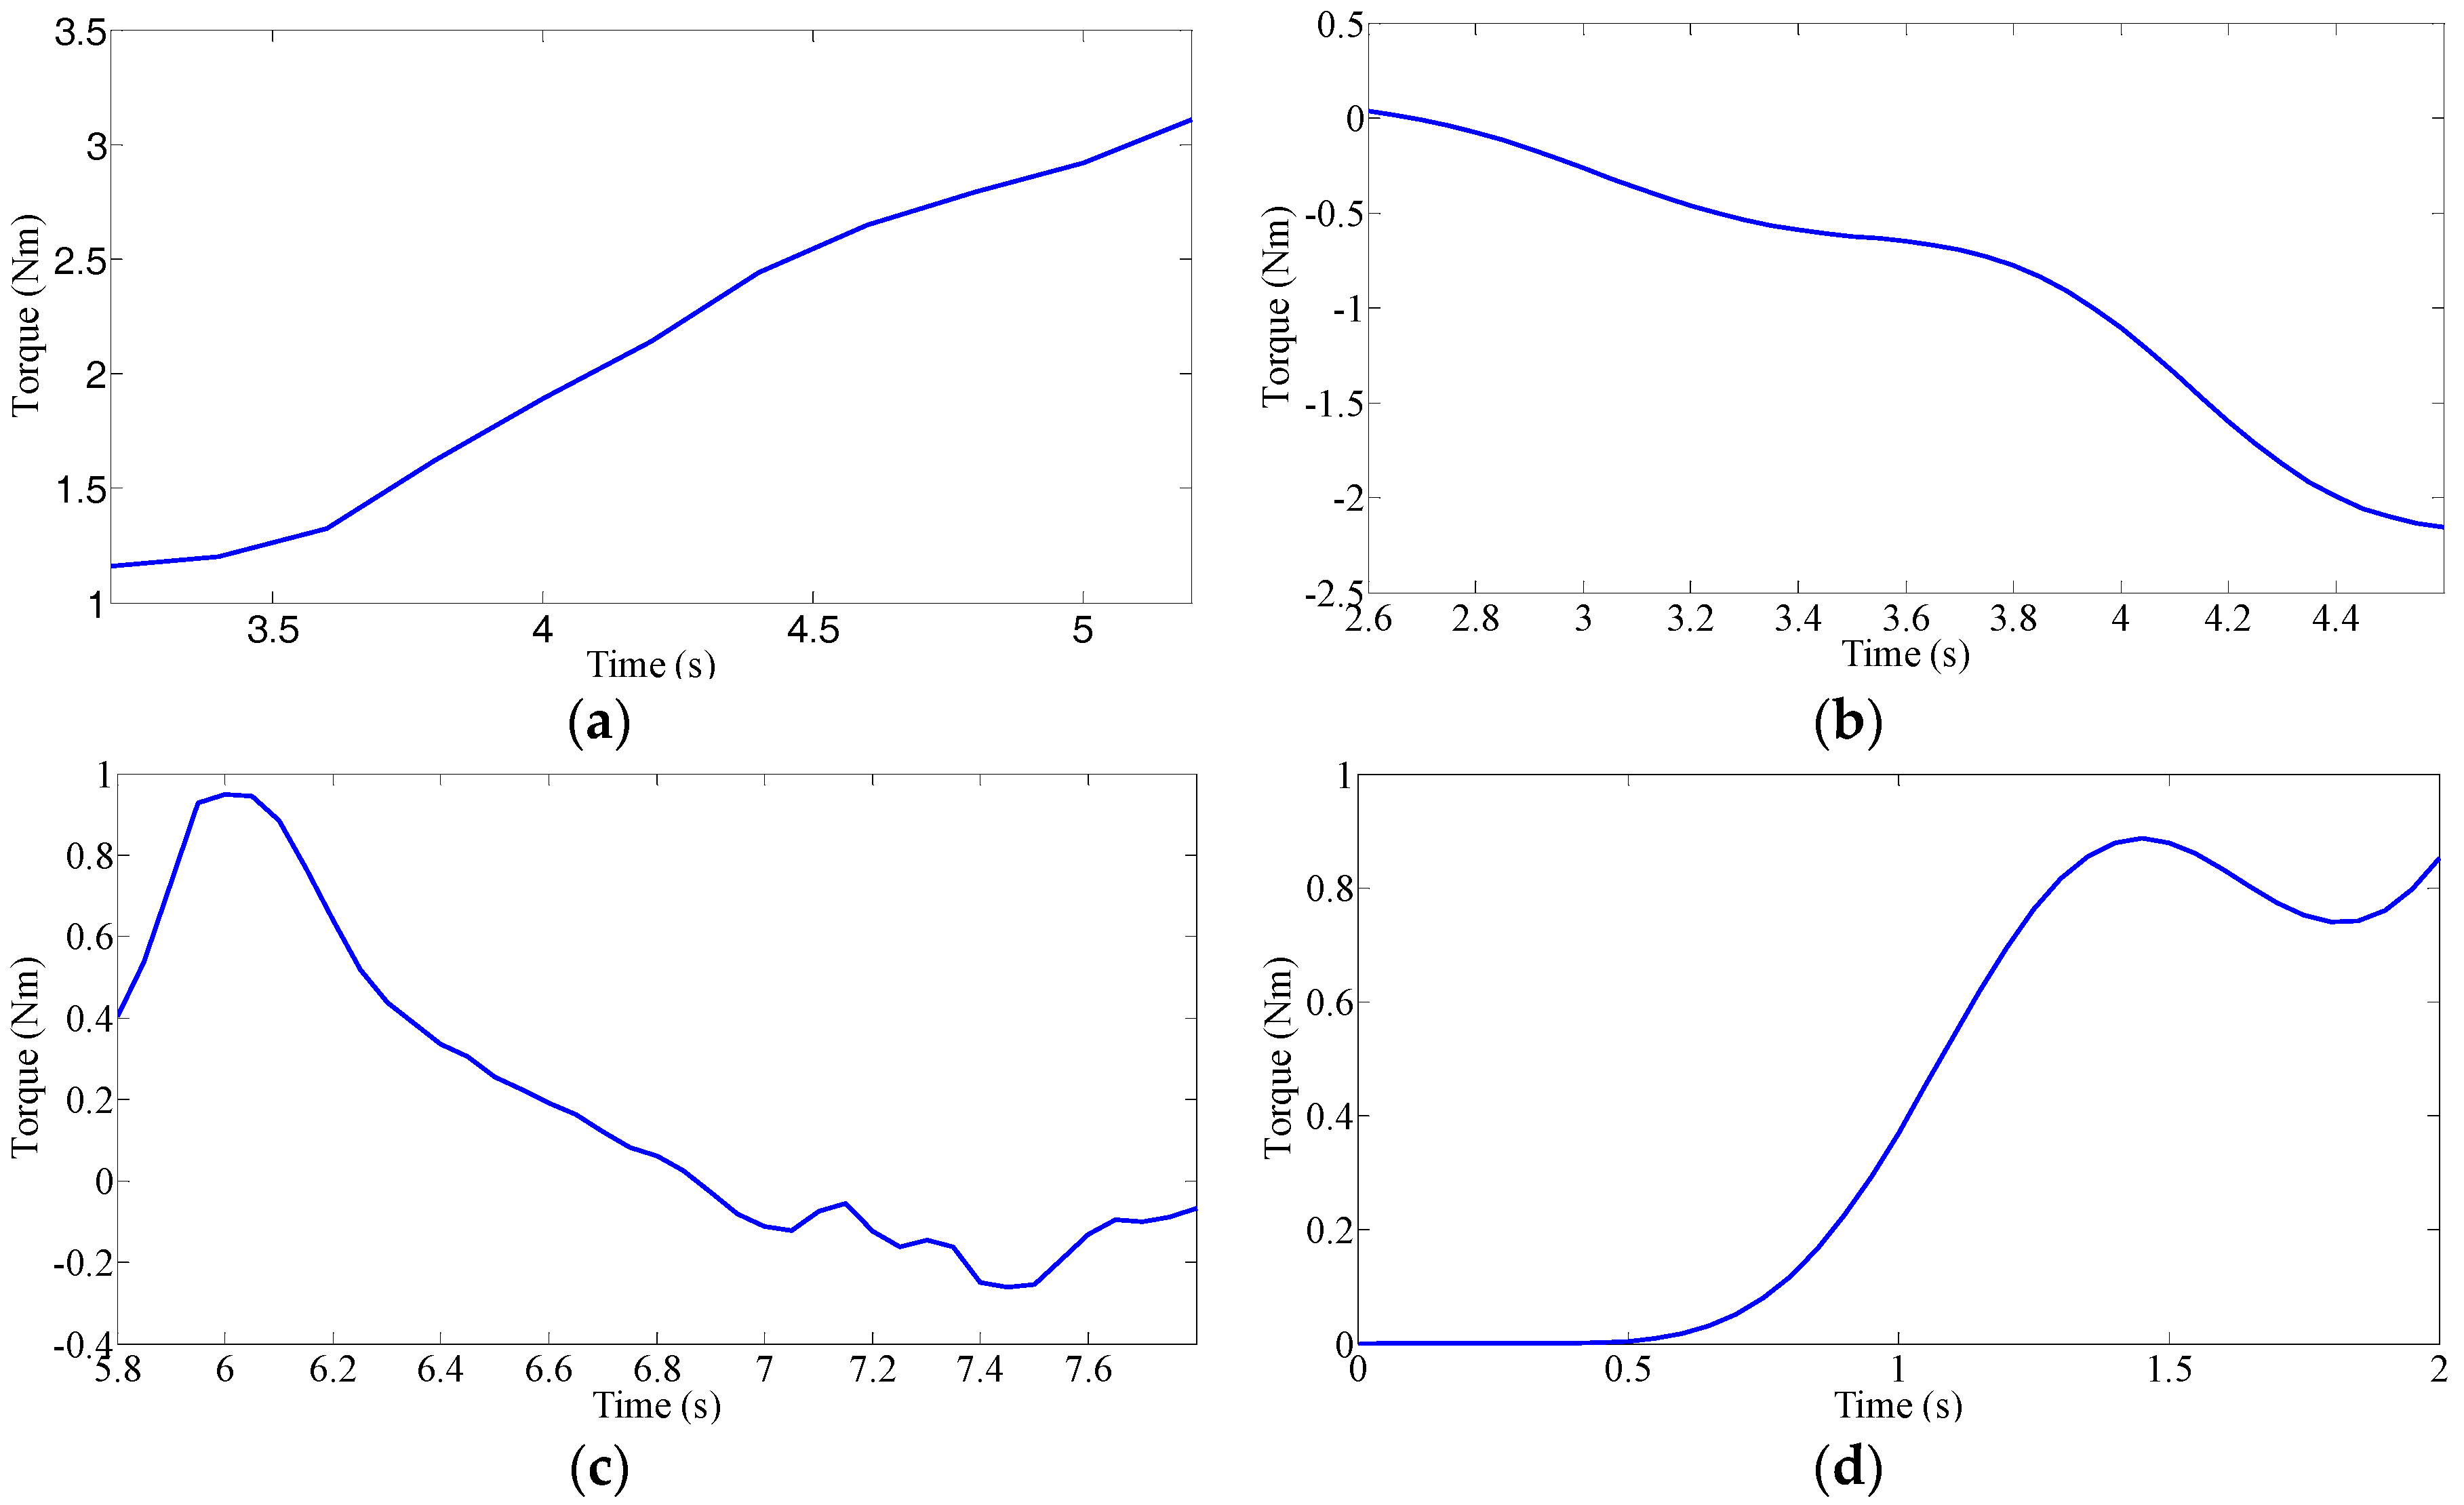
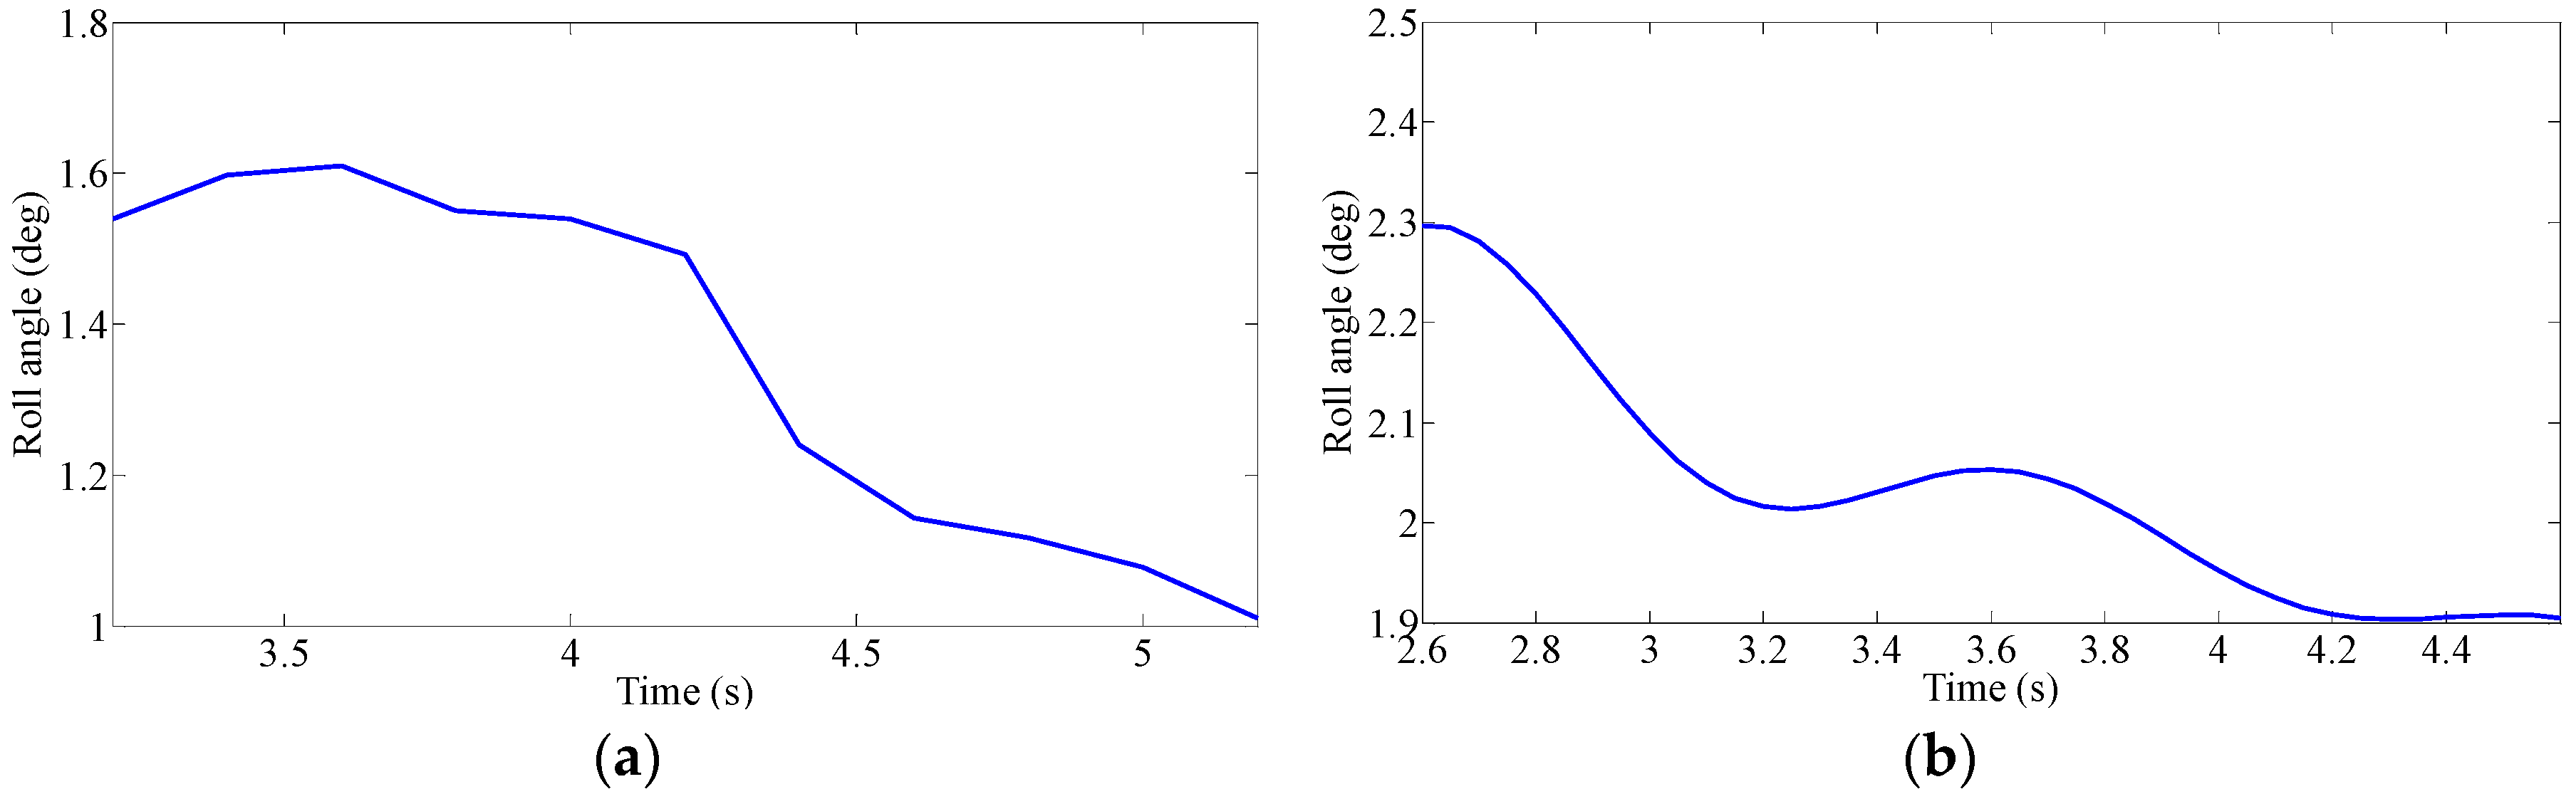
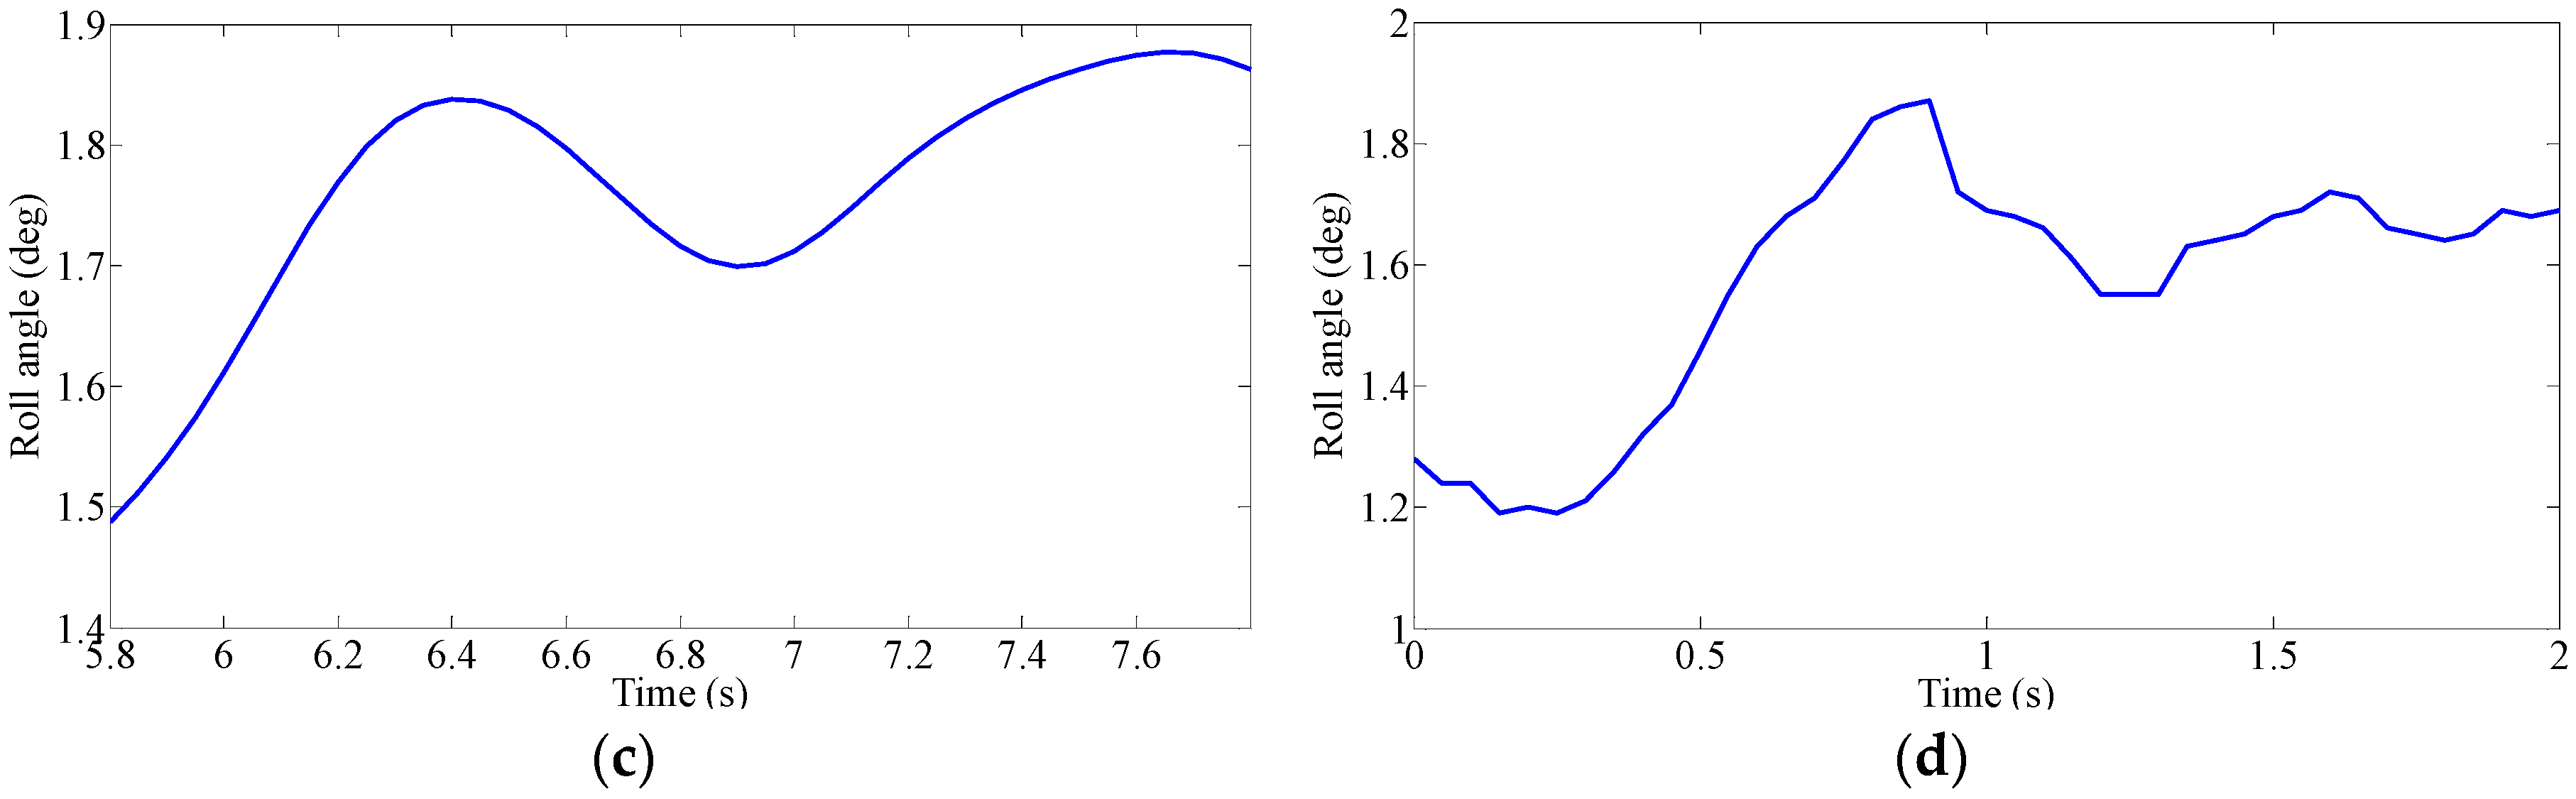
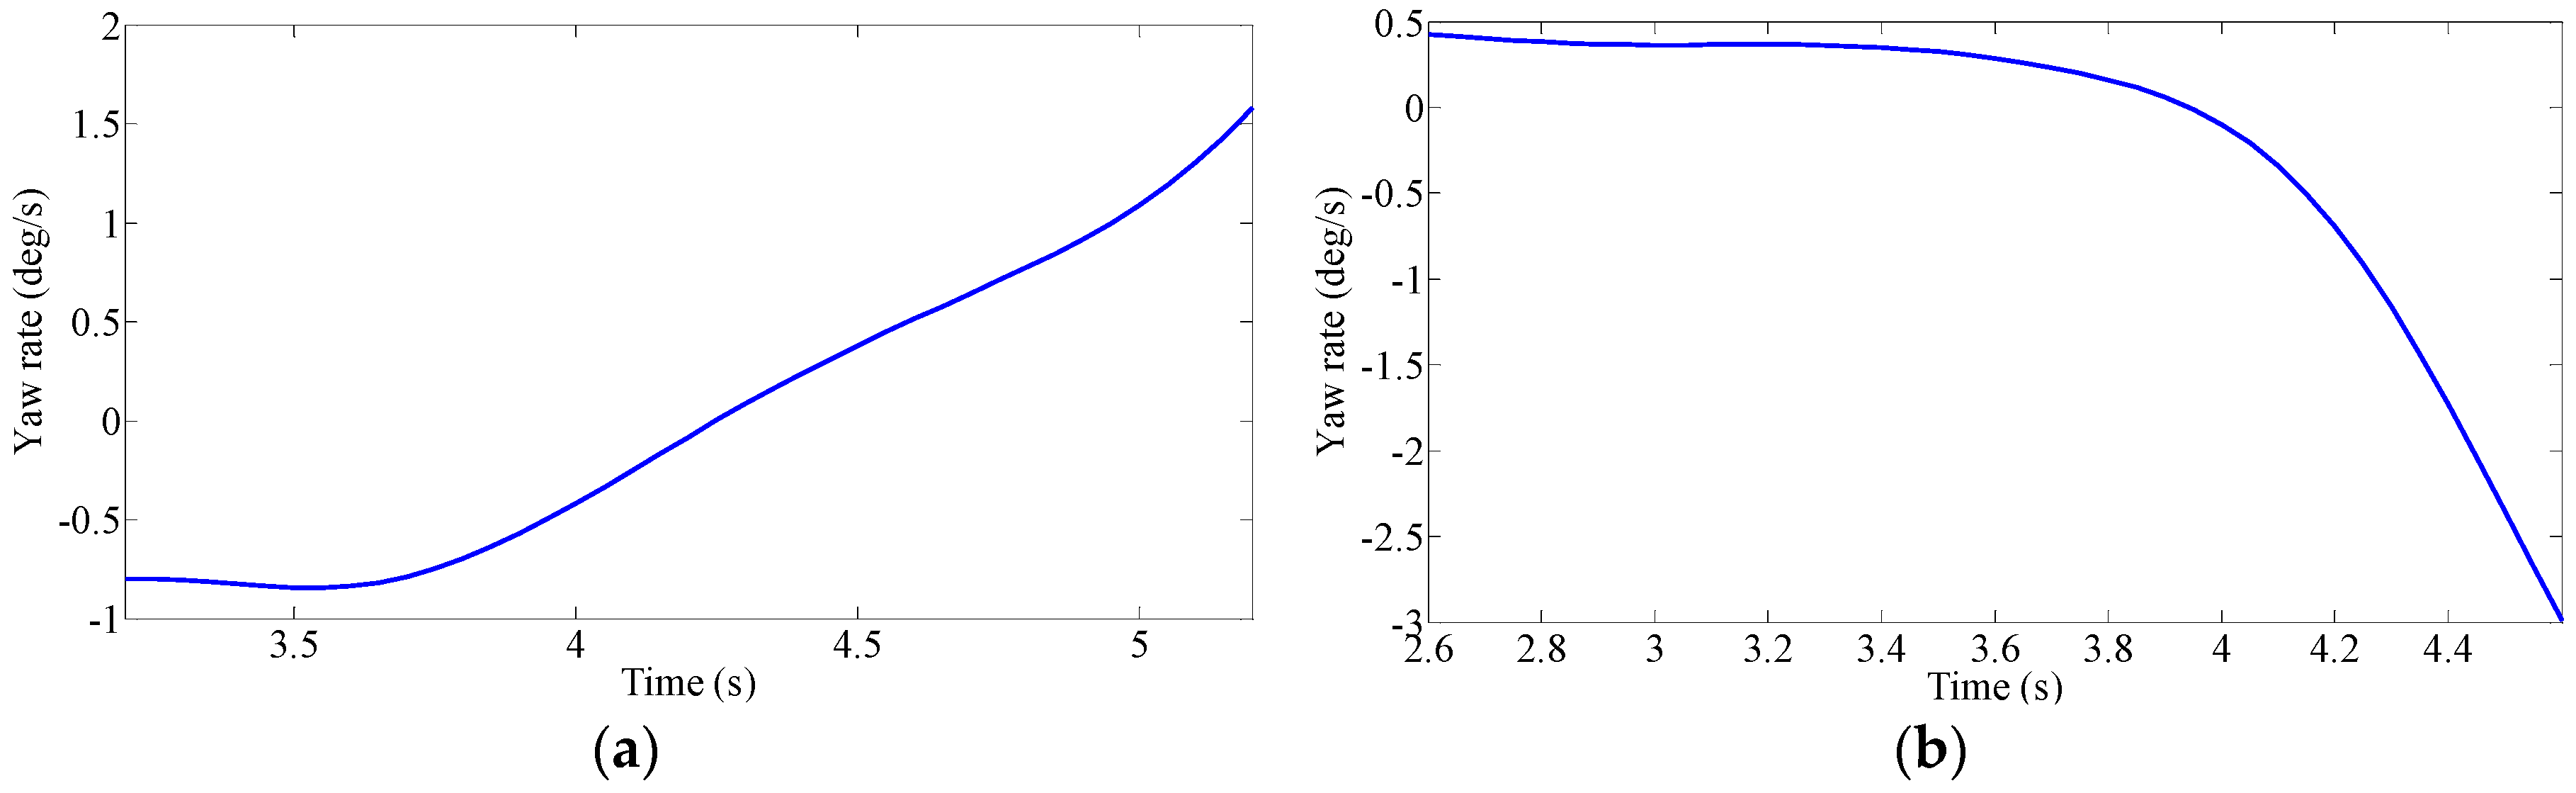
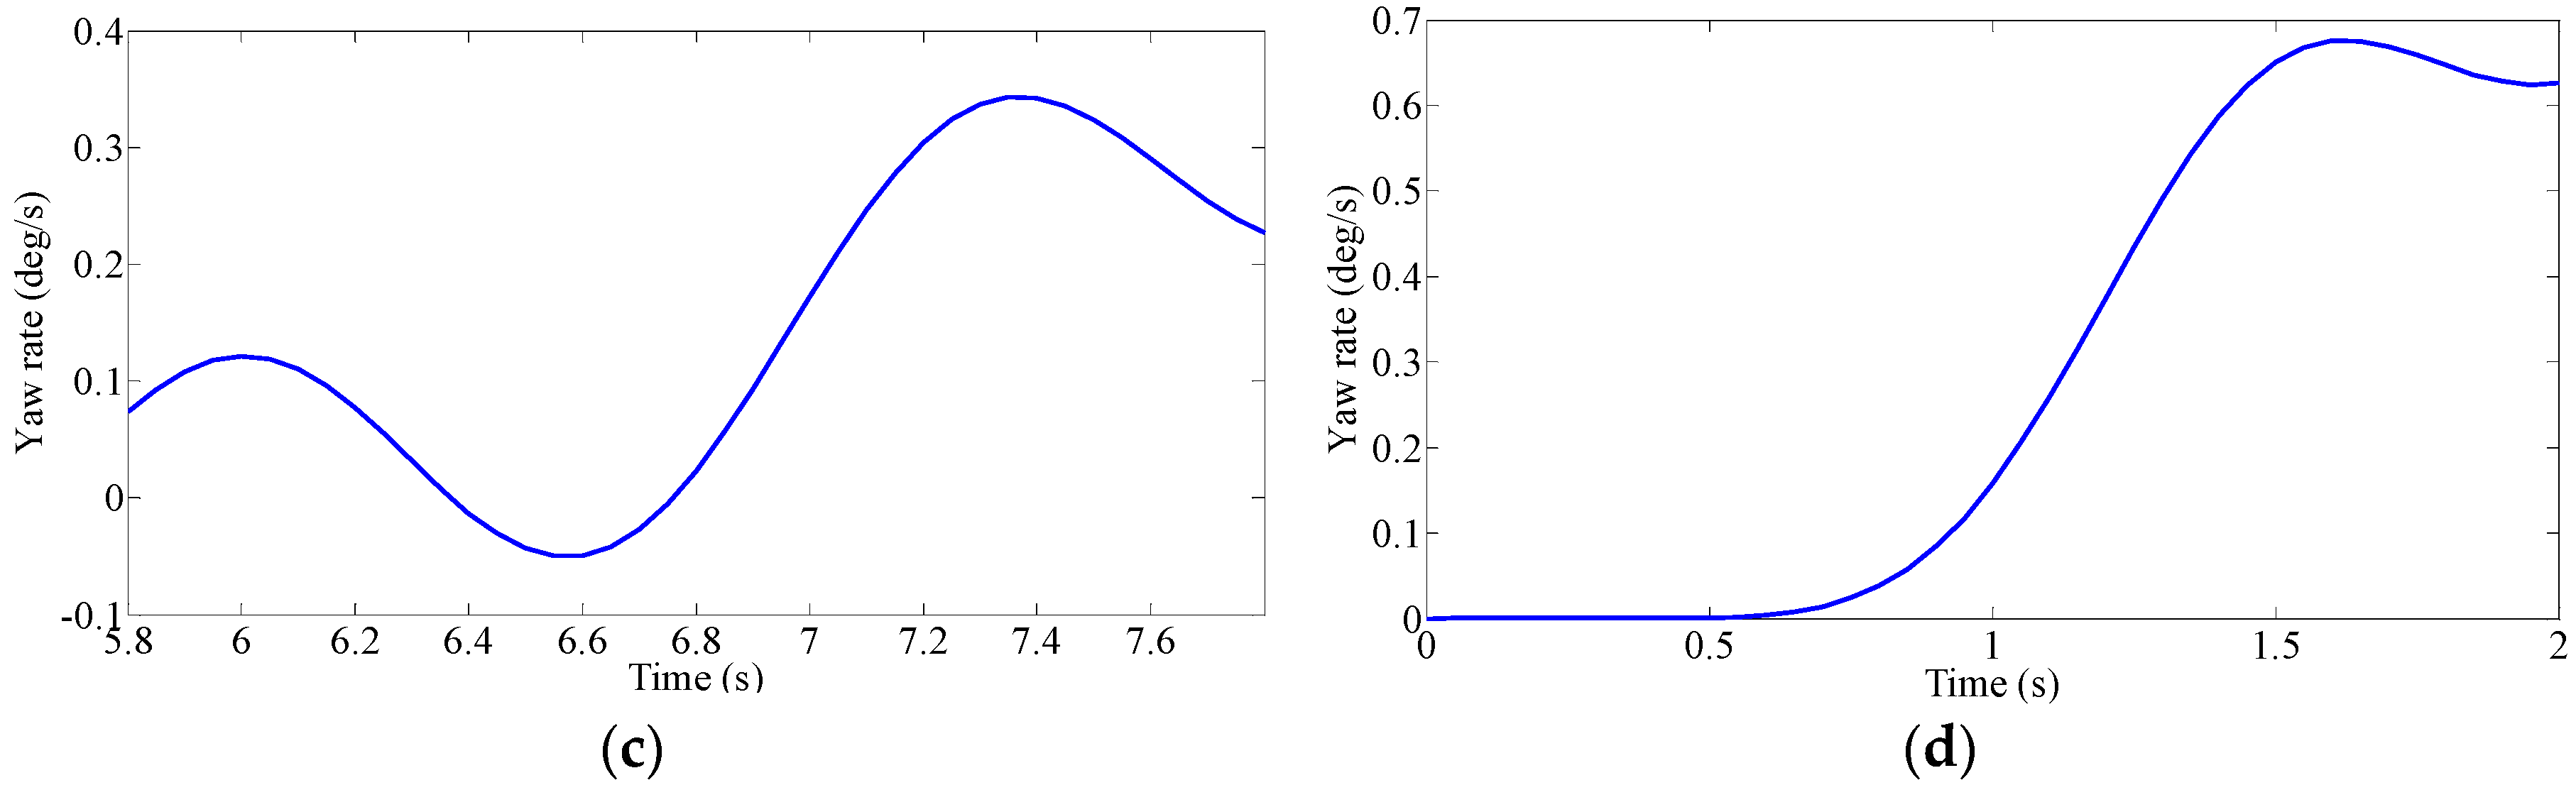
Driver’s Characteristic Steering Parameter under Different Conditions
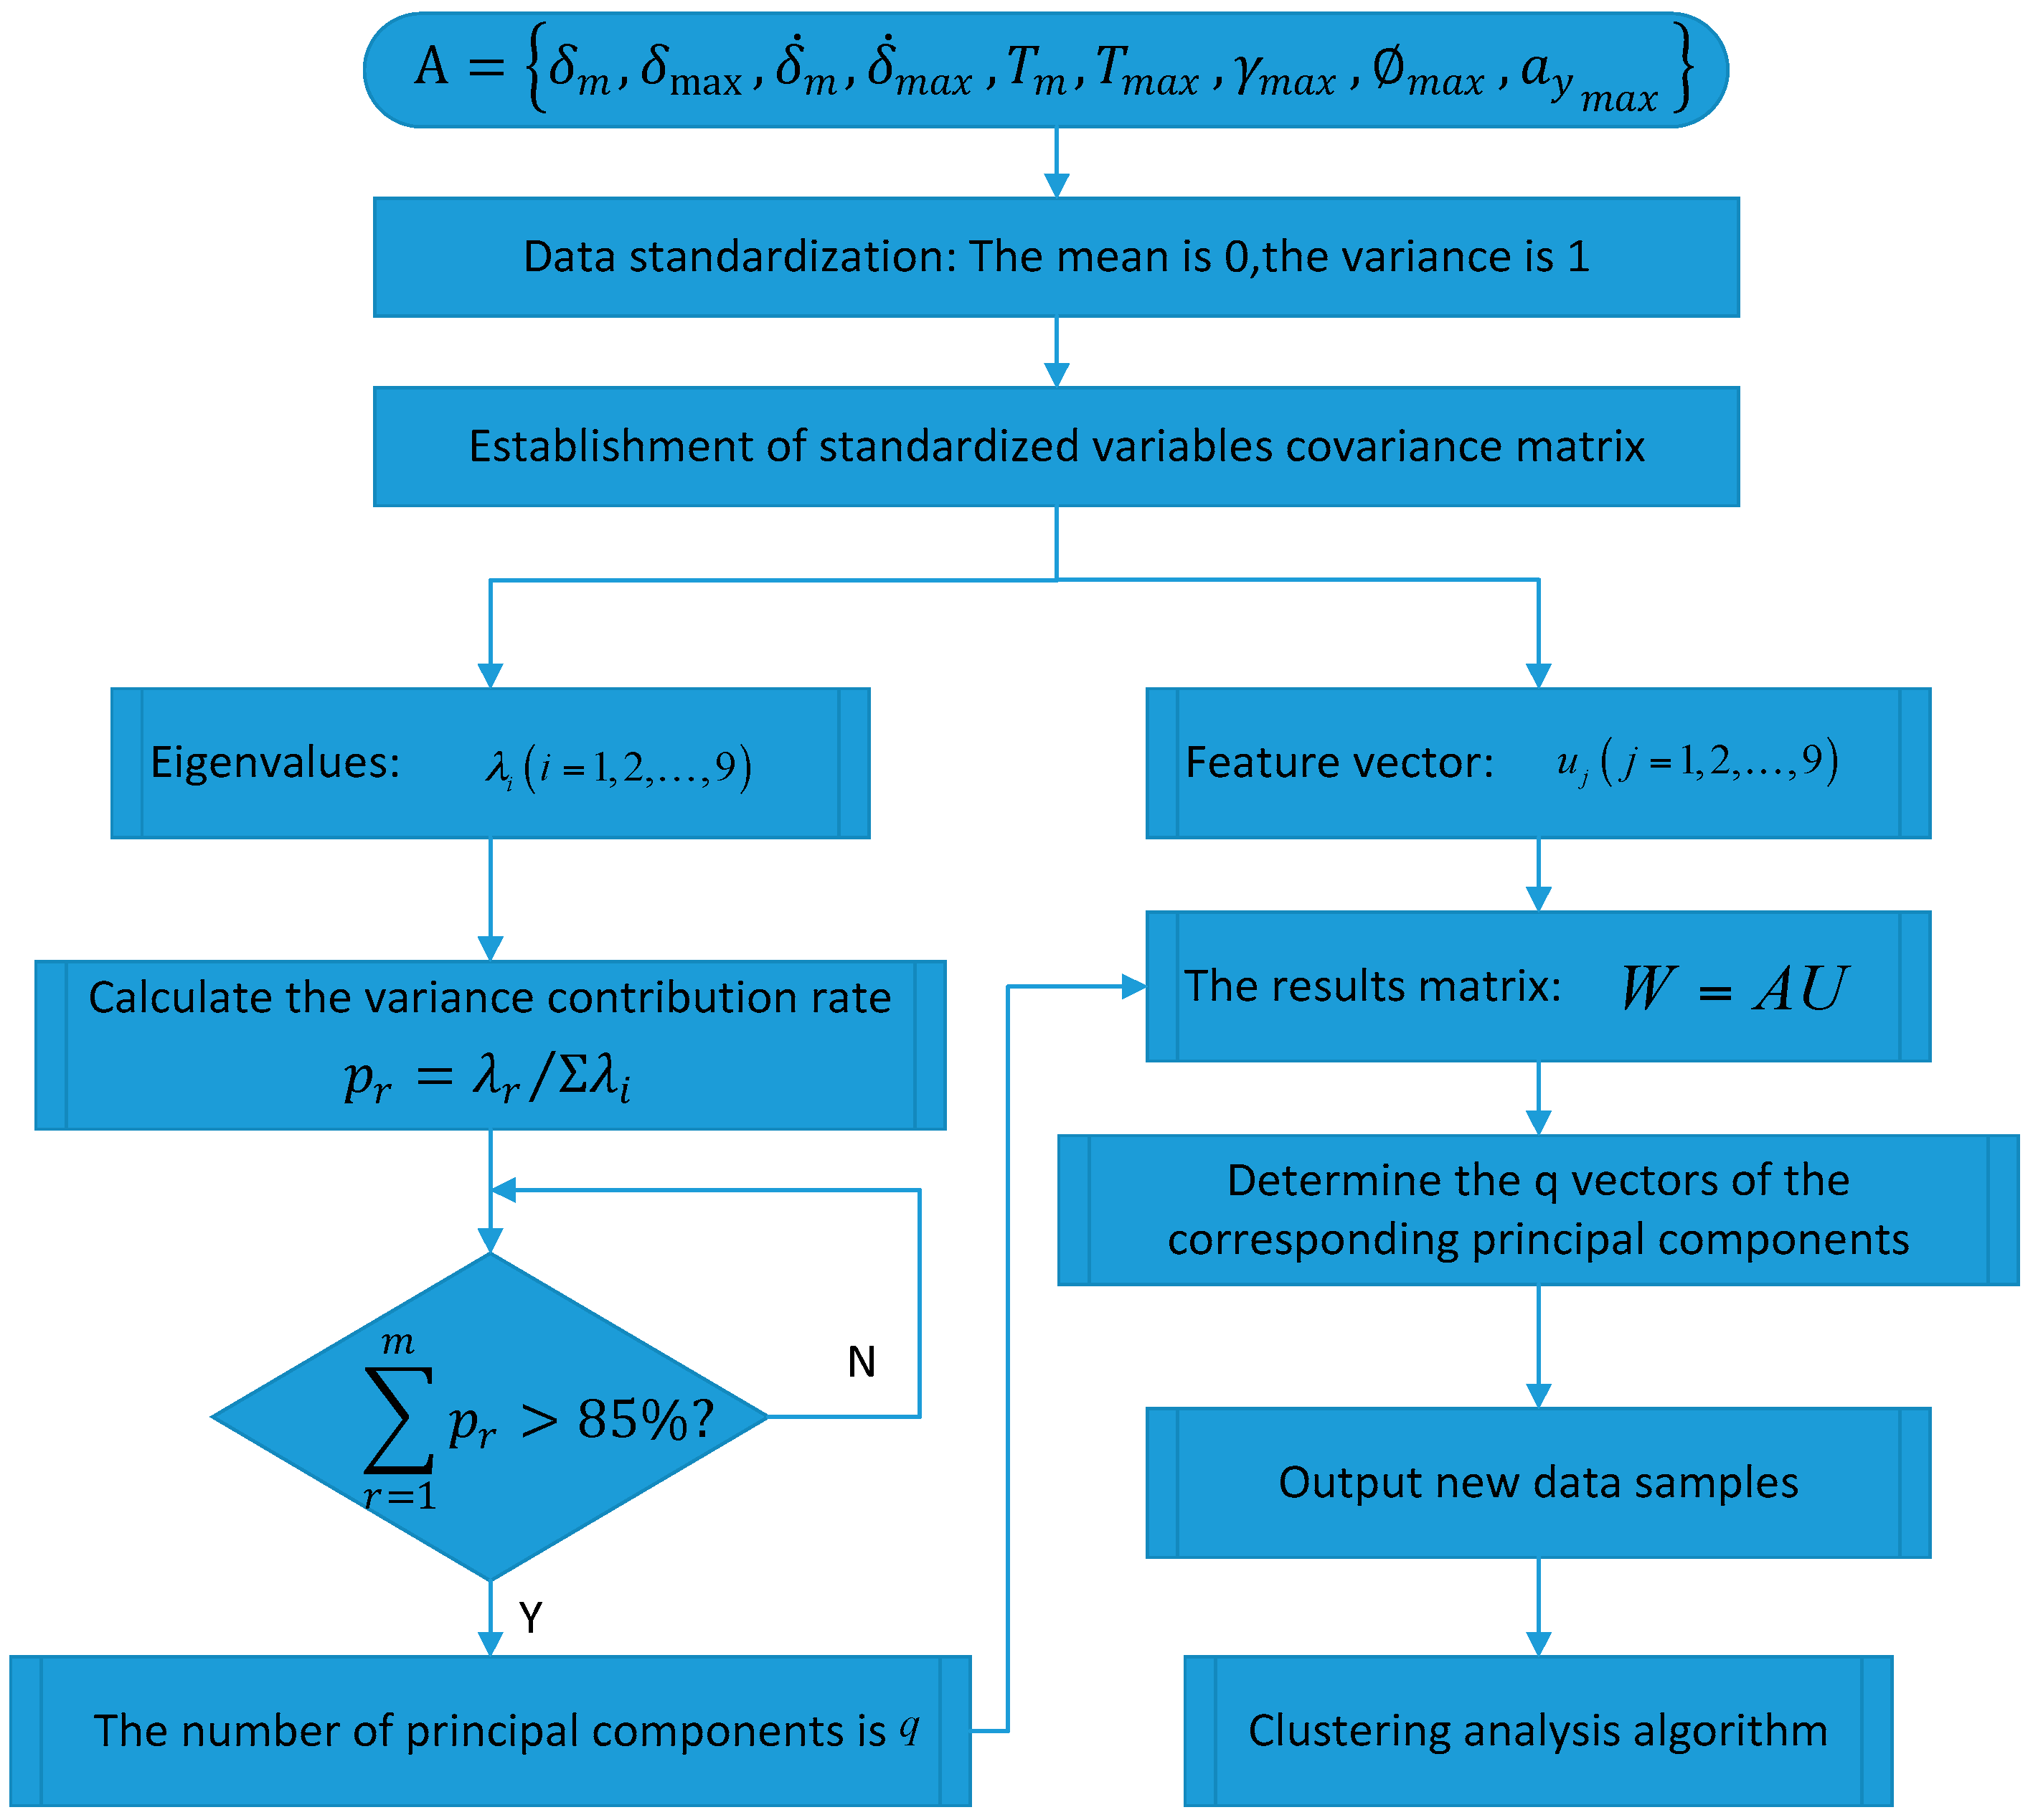
4. Principal Component Analysis of Steering Parameters
5. Comparison of Clustering Analysis Methods
5.1. Fuzzy C-Means Algorithm
5.2. Gustafson–Kessel Algorithm
5.3. Gath–Geva Algorithm
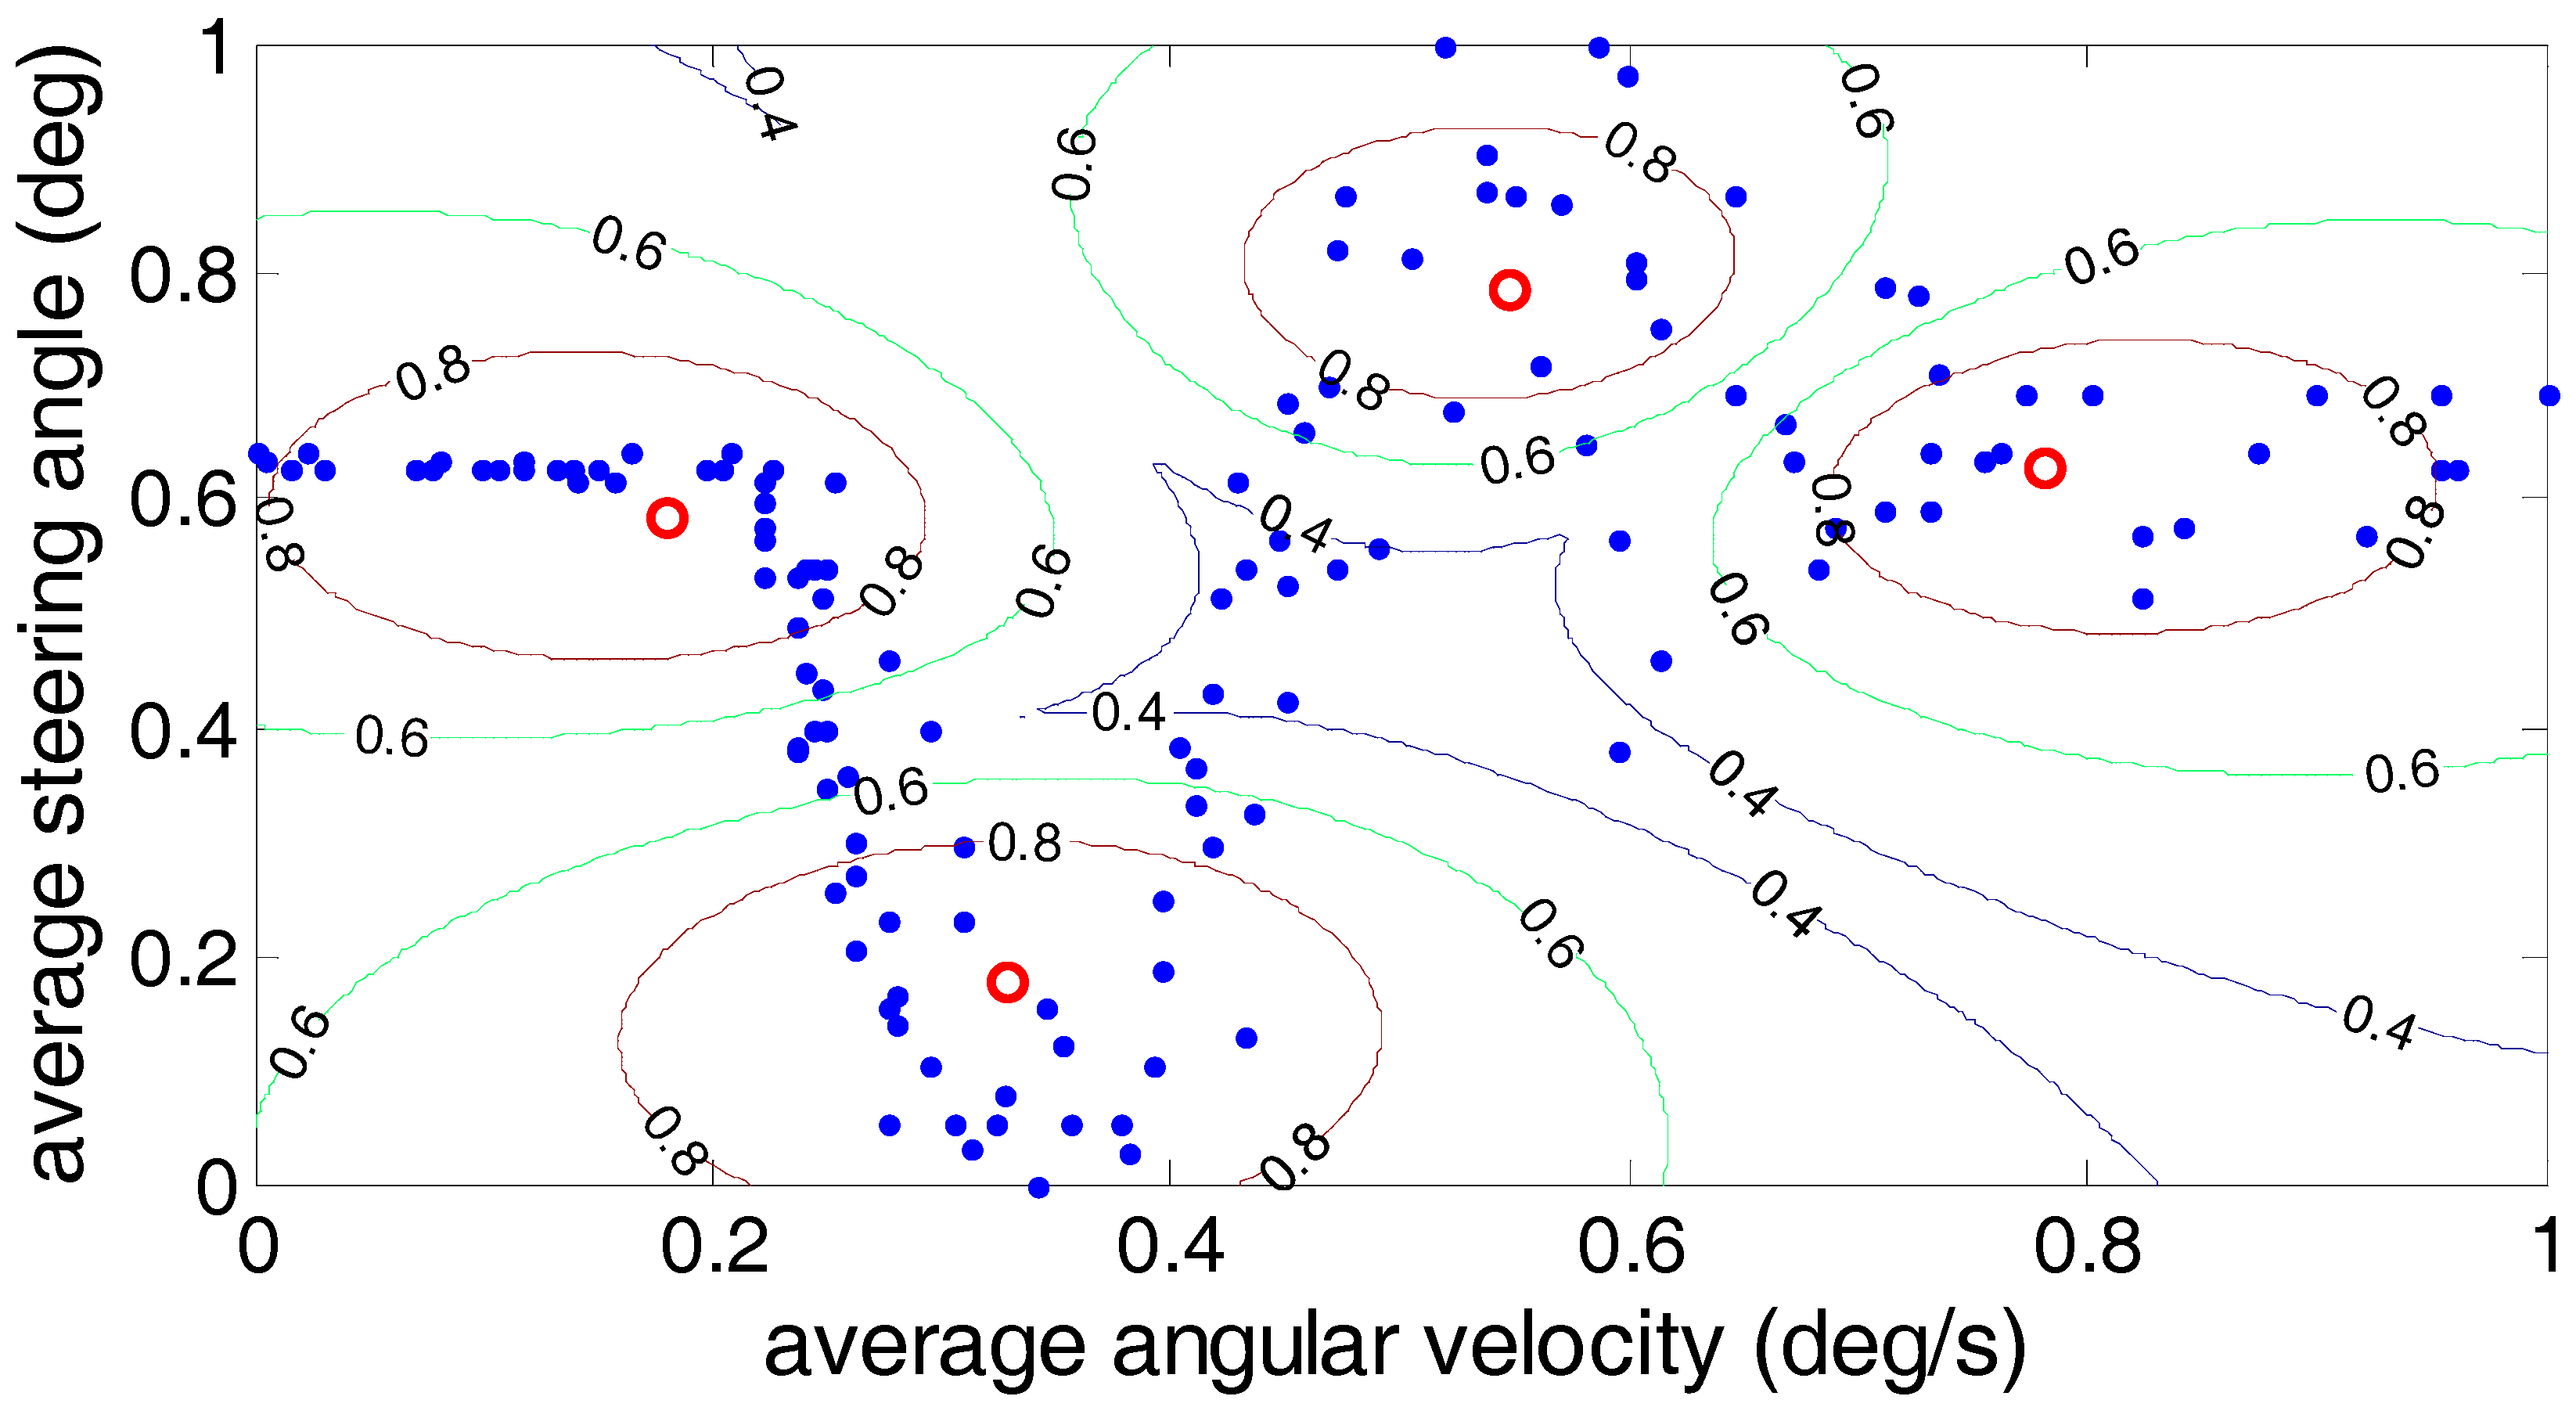
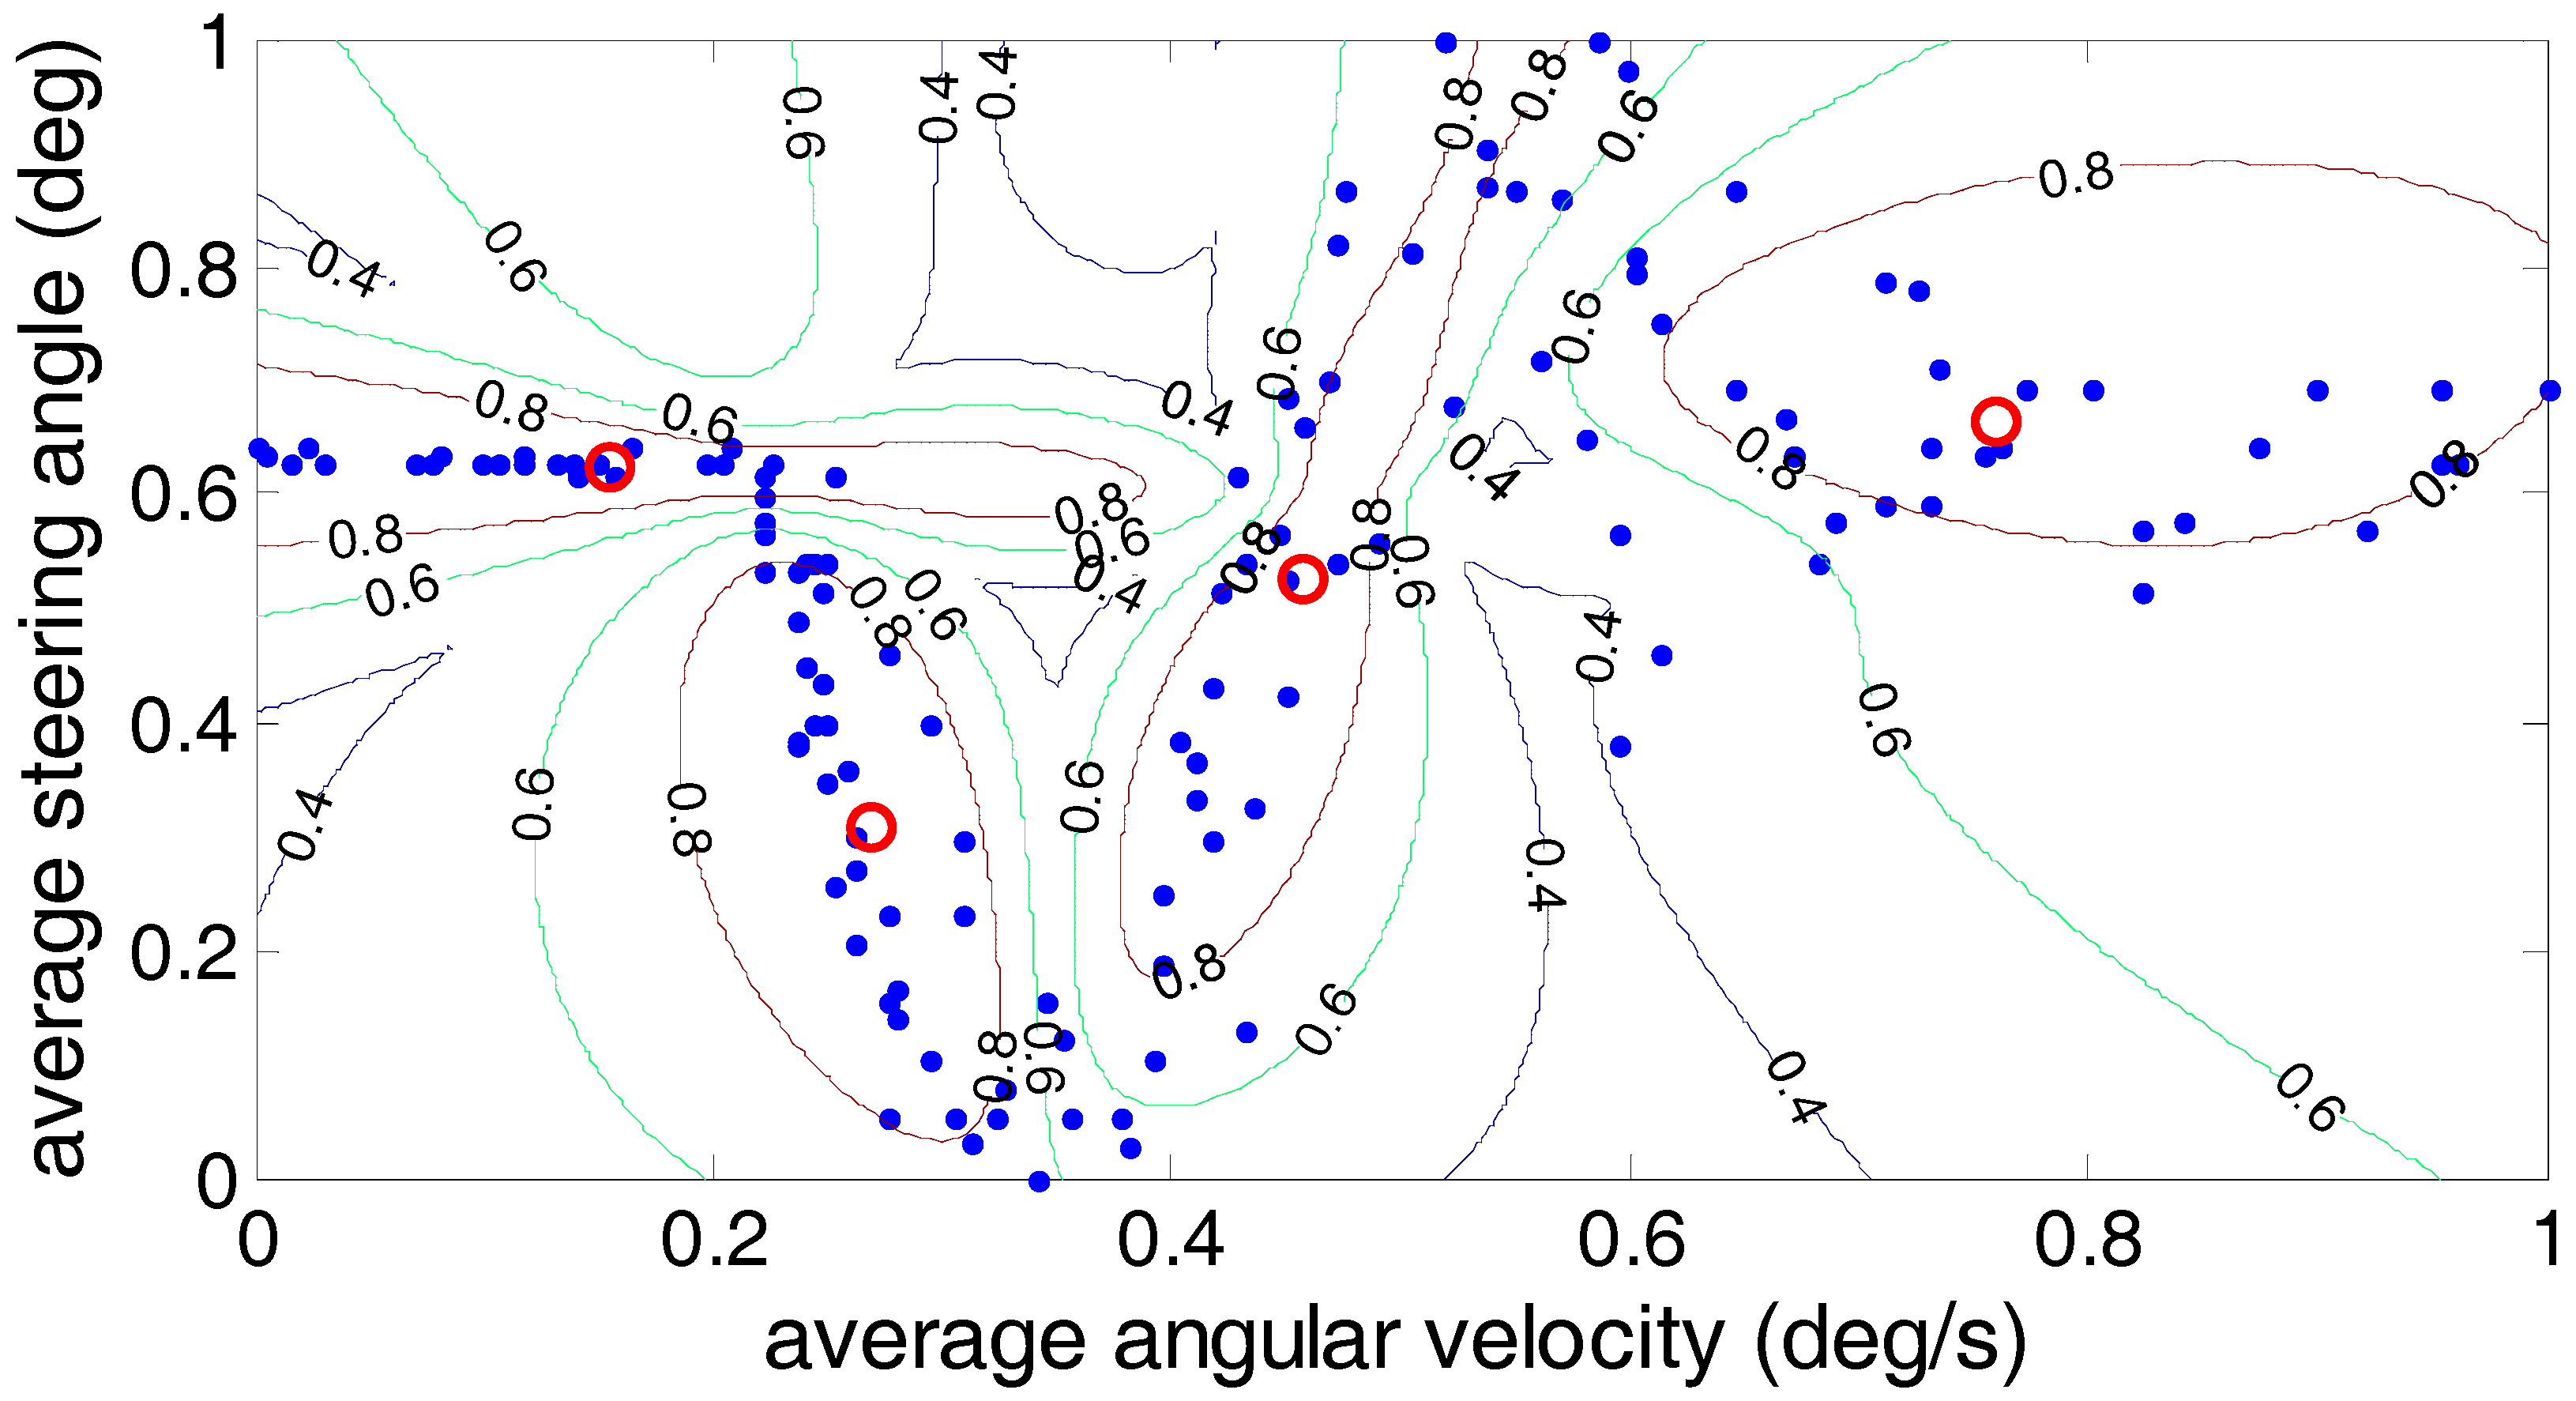
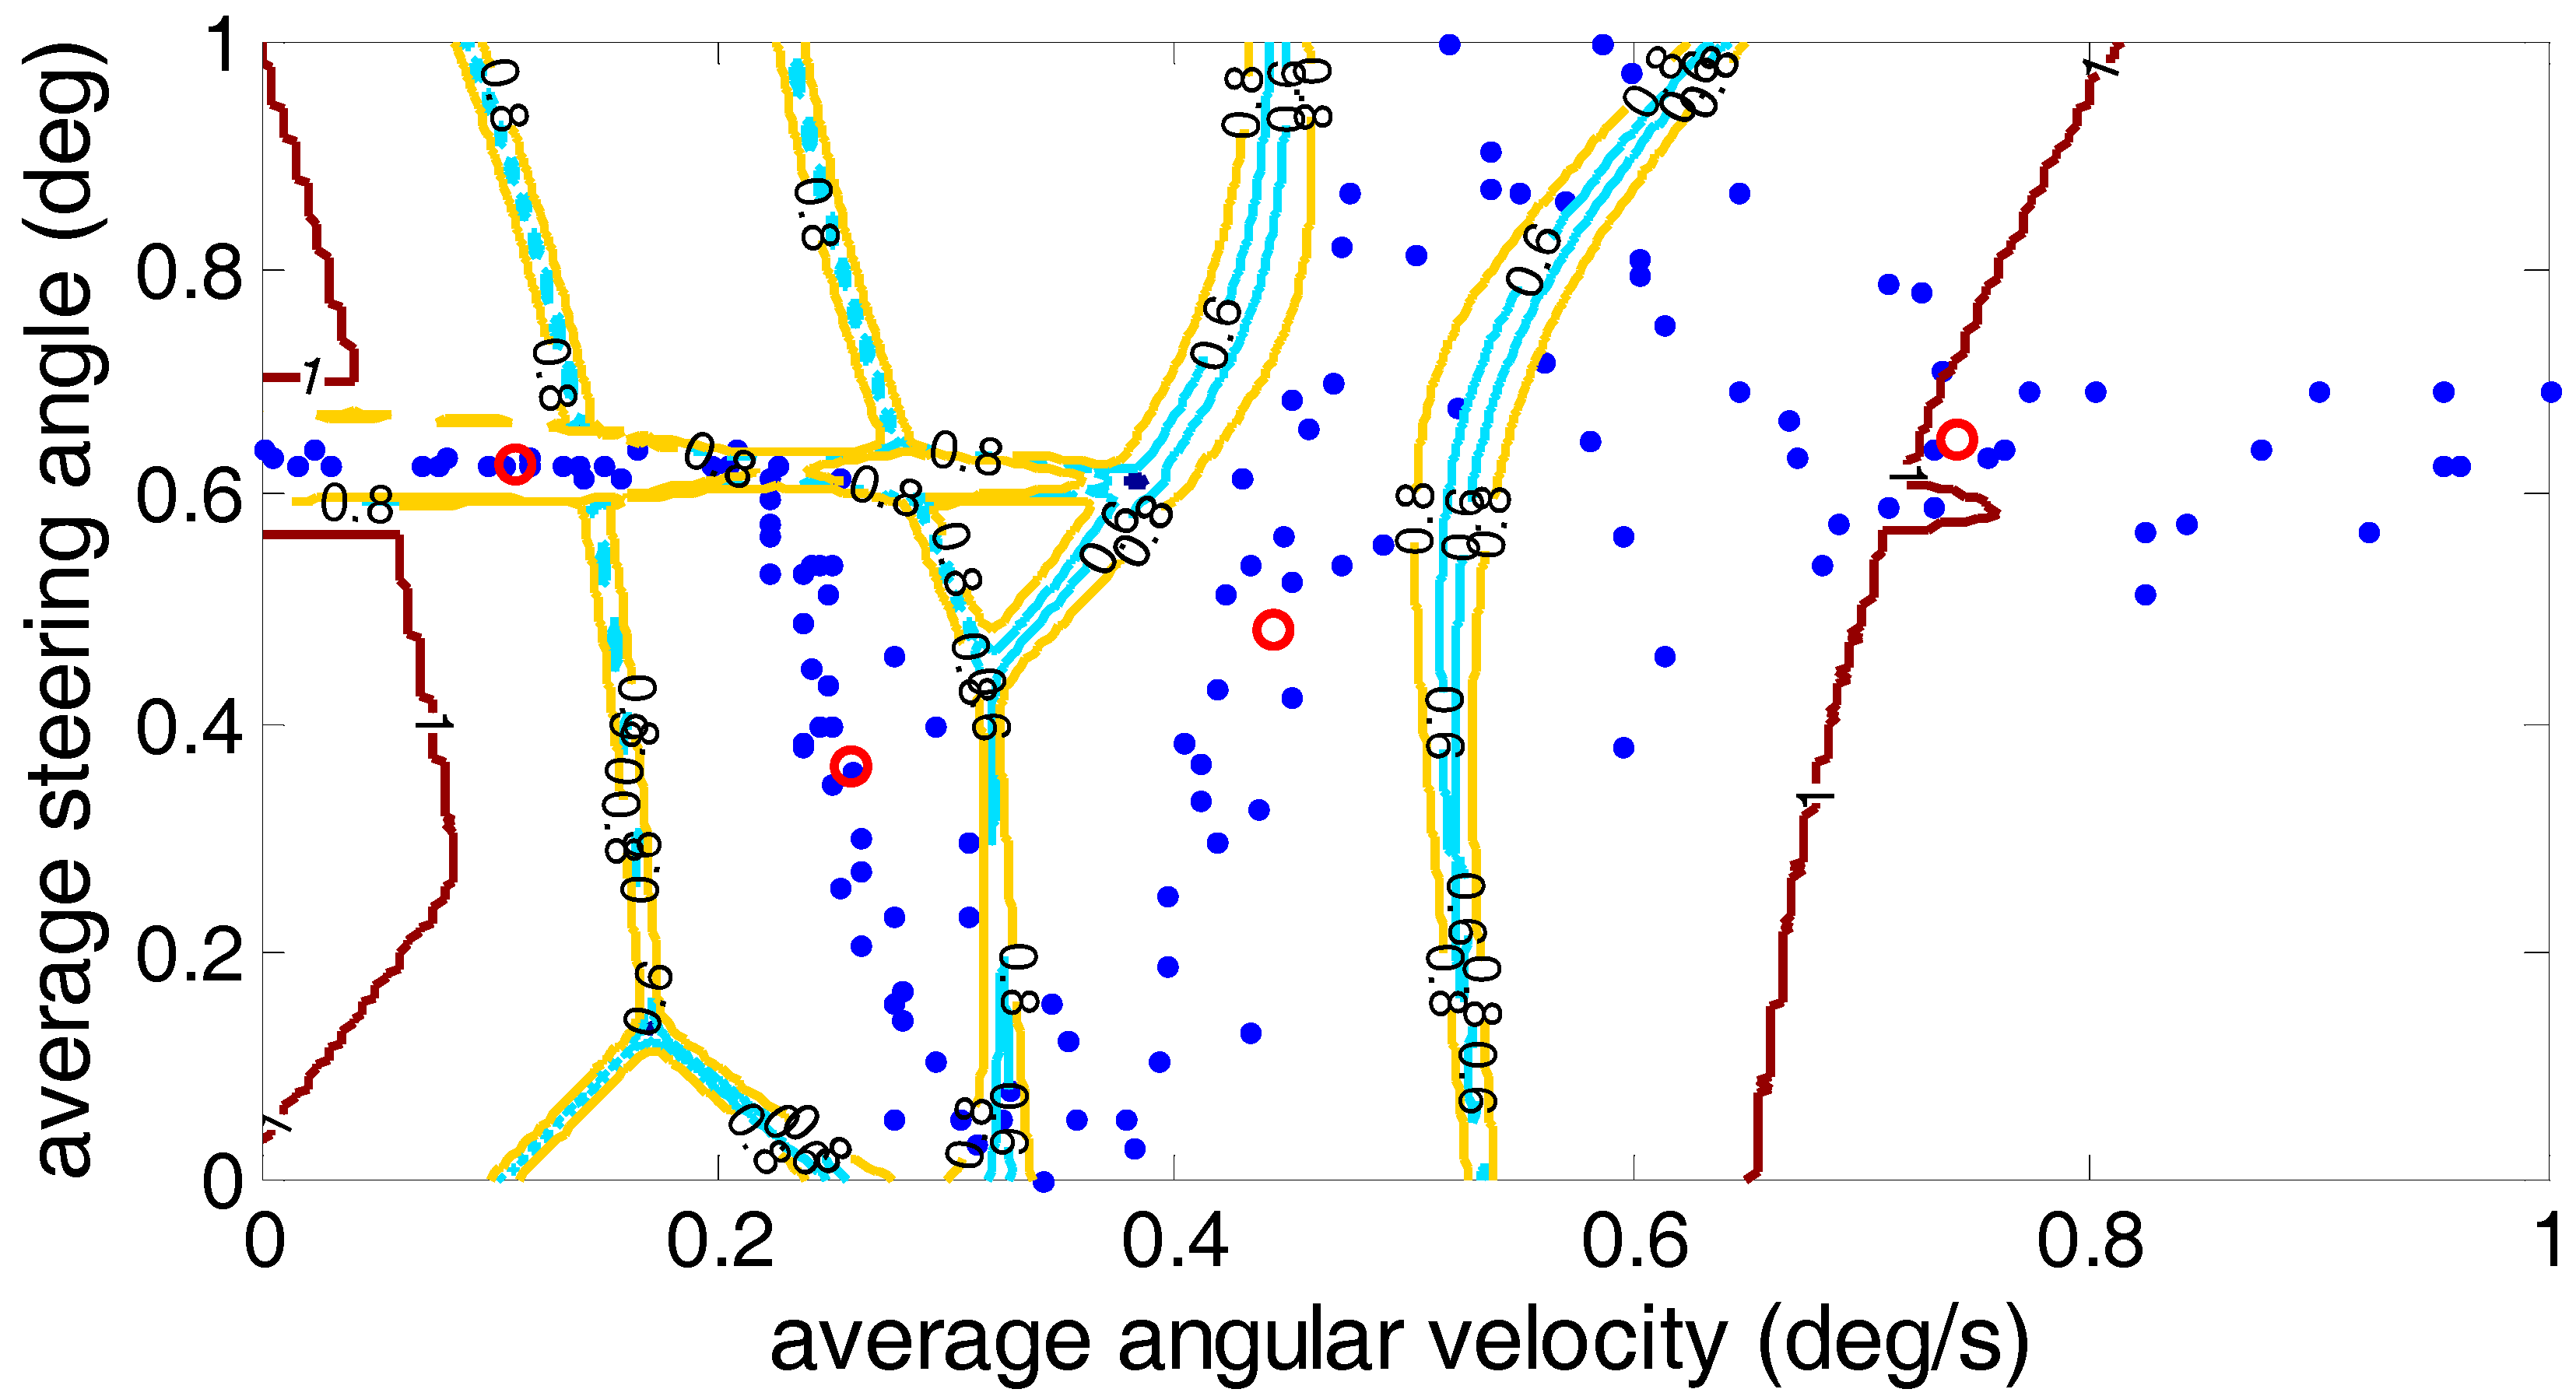
6. Clustering Results and Analysis
7. The Results of the Identification of Driver’s Steering Intention
8. Conclusions
Acknowledgments
Author Contributions
Conflicts of Interest
References
- Sun, Y.; Xiong, G.G.; Chen, H.Y. Evaluation of Intelligent Behavior of Unmanned Vehicles Based on Fuzzy-EAHP. Automot. Eng. 2014, 36, 22–27. [Google Scholar]
- Sai, S. Current and future ITS. IEICE Trans. Inf. Syst. 2013, 96, 176–183. [Google Scholar] [CrossRef]
- Mueller, C.; Siedersberger, K.H.; Faerber, B. Active roll motion as feedback for decoupled steering interventions in Advanced Driver Assistance Systems (ADAS). Forsch. Ingenieurwesn 2017, 81, 41–55. [Google Scholar]
- Anaya, J.J.; Ponz, A.; Garcia, F. Motorcycle detection for ADAS through camera and V2V Communication, a comparative analysis of two modern technologies. Expert Syst. Appl. 2017, 77, 148–159. [Google Scholar] [CrossRef]
- Zhao, R.C.; Wong, P.K.; Xie, Z.C. Real-time weighted multi-objective model predictive controller for adaptive cruise control systems. Int. J. Automot. Technol. 2017, 18, 279–292. [Google Scholar] [CrossRef]
- Li, S.B.; Guo, Q.Q.; Xin, L. Fuel-Saving Servo-Loop Control for an Adaptive Cruise Control System of Road Vehicles with Step-Gear Transmission. IEEE Trans. Veh. Technol. 2017, 66, 2033–2043. [Google Scholar] [CrossRef]
- Zheng, B.; Anwar, S. Yaw stability control of a steer-by-wire equipped vehicle via active front wheel steering. Mechatronics 2009, 19, 799–804. [Google Scholar] [CrossRef]
- Sun, X.D.; Chen, L.; Jiang, H.B.; Yang, Z.B.; Chen, J.C.; Zhang, W.Y. High-performance control for a bearingless permanent magnet synchronous motor using neural network inverse scheme plus internal model controllers. IEEE Trans. Ind. Electron. 2016, 63, 3479–3488. [Google Scholar] [CrossRef]
- Sun, X.D.; Shi, Z.; Chen, L.; Yang, Z.B. Internal model control for a bearingless permanent magnet synchronous motor based on inverse system method. IEEE T. Energy Convers. 2016, 31, 1539–1548. [Google Scholar] [CrossRef]
- Sun, X.D.; Su, B.K.; Chen, L.; Yang, Z.B.; Xu, X.; Shi, Z. Precise control of a four degree-of-freedom permanent magnet biased active magnetic bearing system in a magnetically suspended direct-driven spindle using neural network inverse scheme. Mech. Syst. Signal Process. 2017, 88, 36–48. [Google Scholar] [CrossRef]
- Cheng, L.; Qiao, T.Z. Localization in the Parking Lot by Parked-Vehicle Assistance. IEEE Trans. Intell. Transp. 2016, 17, 3629–3634. [Google Scholar] [CrossRef]
- Sun, X.D.; Chen, L.; Yang, Z.B. Overview of bearingless permanent magnet synchronous motors. IEEE Trans. Ind. Electron. 2013, 60, 5528–5538. [Google Scholar] [CrossRef]
- Cheon, D.S.; Nam, K.H. Steering torque control using variable impedance models for a steer-by-wire system. Int. J. Automot. Technol. 2017, 18, 263–270. [Google Scholar] [CrossRef]
- Kim, W.H.; Son, Y.S.; Chung, C.C. Torque-Overlay-Based Robust Steering Wheel Angle Control of Electrical Power Steering for a Lane-Keeping System of Automated Vehicles. IEEE Trans. Veh. Technol. 2016, 65, 4379–4392. [Google Scholar] [CrossRef]
- Sun, X.D.; Chen, L.; Yang, Z.B.; Zhu, H.Q. Speed-sensorless vector control of a bearingless induction motor with artificial neural network inverse speed observer. IEEE ASME Trans. Mech. 2013, 18, 1357–1366. [Google Scholar] [CrossRef]
- Windridge, D.; Shaukat, A.; Hollnagel, E. Characterizing Driver Intention via Hierarchical Perception-Action Modeling. IEEE Trans. Hum. Mach. Syst. 2013, 43, 17–31. [Google Scholar] [CrossRef]
- Li, L.; Zhu, Z.B.; Wang, X.Y. Identification of a driver’s starting intention based on an artificial neural network for vehicles equipped with an automated manual transmission. Proc. Inst. Mech. Eng. D J. Automob. 2016, 230, 1417–1429. [Google Scholar] [CrossRef]
- Takano, W.; Matsushita, A.; Iwao, K. Recognition of human driving behaviors based on stochastic symbolization of time series signal. In Proceedings of the IEEE/RSJ International Conference on Intelligent Robots and Systems, Nice, France, 22–26 September 2008; pp. 167–172. [Google Scholar]
- Raksin, C.P.; Mizushima, T.; Nagai, M. Direct yaw moment control system based on driver behavior recognition. Veh. Syst. Dyn. 2008, 46, 911–921. [Google Scholar]
- Tesheng, H. Time-varying system identificationvia maximum a posteriori estimation and its application to driver steering models. In Proceedings of the American Control Conference, Westin Seattle Hotel, Seattle, WA, USA, 11–13 June 2008; pp. 11–13. [Google Scholar]
- Harmouche, J. Incipient fault detection and diagnosis based on Kullback Leibler divergence using PCA: Part I. Signal Process. 2014, 94, 278–287. [Google Scholar] [CrossRef]
- Nguyen, T.H.; Kim, H. Novel and efficient pedestrian detection using bidirectional PCA. Pattern Recogn. 2013, 46, 2220–2227. [Google Scholar] [CrossRef]
- Ding, M. Adaptive KPCA. Signal Process. 2010, 90, 1542–1553. [Google Scholar] [CrossRef]
- Zhou, K.; Yang, S. Exploring the uniform effect of FCM clustering: A data distribution perspective. Knowl. Based Syst. 2016, 96, 76–83. [Google Scholar] [CrossRef]
- Andrea, B.; Palma, B. A survey of fuzzy clustering algorithms for pattern recognition I. IEEE Trans. Syst. Man. Cybern. Soc. 1999, 29, 778–785. [Google Scholar]
- Zarita, Z.; Pauline, O. Design of wavelet neural networks based on symmetry fuzzy c-means for function approximation. Neural Comput. Appl. 2013, 23, 247–259. [Google Scholar]
- Zhou, D.G.; Zhou, H. A modified strategy of fuzzy clustering algorithm for image segmentation. Soft Comput. 2015, 19, 3261–3272. [Google Scholar] [CrossRef]
- Saber, S.; Selamat, A.; Fujita, H. Systematic mapping study on granular computting. Knowl. Based Syst. 2015, 80, 78–97. [Google Scholar]
- Abonyi, J.; Babuska, R.; Szeifert, F. Modified Gath-Geva fuzzy clustering for identification of Takagi-Sugeno fuzzy models. IEEE Trans. Syst. Man Cybern. B 2002, 32, 612–621. [Google Scholar] [CrossRef] [PubMed]
- Sarbu, C.; Zehl, K.; Einax, J.W. Fuzzy divisive hierarchical clustering of soil data using Gustafson-Kessel algorithm. Chemom. Intell. Lab. 2007, 86, 121–129. [Google Scholar] [CrossRef]
- Price, A.L.; Patterson, N.J.; Plenge, R.M. Principal components analysis corrects for stratification in genome-wide association studies. Nat. Genet. 2006, 38, 904–909. [Google Scholar] [CrossRef] [PubMed]
- Gustafson, D.E.; Kessel, W.C. Fuzzy clustering with fuzzy covariance matrix. In Proceedings of the 1978 IEEE Conference on Decision and Control including the 17th Symposium on Adaptive Processes, San Diego, CA, USA, 10–12 January 1979; pp. 761–766. [Google Scholar]
- Bezdek, J.C. Pattern Recognition with Fuzzy Objective Function Algorithms; Plenum Press: New York, NY, USA, 1981. [Google Scholar]


| No. | Ages (Years) | Driving Experience (Years) | Gender |
|---|---|---|---|
| Driver 1 | 55 | 33 | female |
| Driver 2 | 28 | 10 | male |
| Driver 3 | 53 | 31 | male |
| Driver 4 | 46 | 22 | male |
| Driver 5 | 53 | 21 | male |
| Symbol | Meaning | Units |
|---|---|---|
| Average steering angle | deg | |
| Maximum steering angle | deg | |
| Average angular velocity | deg/s | |
| Maximum angular velocity | deg/s | |
| Average torque | Nm | |
| Maximum torque | Nm | |
| Maximum yaw rate | deg/s | |
| Maximum roll angle | deg | |
| Maximum lateral acceleration | m/s2 |
| The Number of Experiment and the Speed Limit | Typical Steering Conditions | ||||
|---|---|---|---|---|---|
| Turning Right/Left Condition | U-Turn Condition | Lane Keeping Condition | Lane Changing Condition | The Sum of All the Conditions | |
| Number of Experimental Data | 320 | 82 | 160 | 162 | 724 |
| Speed Conditions (km/h) | 20–50 | 20–30 | 30–60 | 30–40 | 20–60 |
| Main Ingredient | Eigenvalues | Contribution Rate (%) | Cumulative Contribution Rate (%) |
|---|---|---|---|
| Y1 | 4.279 | 41.33 | 41.33 |
| Y2 | 1.439 | 17.42 | 58.75 |
| Y3 | 1.235 | 14.53 | 73.28 |
| Y4 | 1.005 | 11.95 | 85.23 |
| Y5 | 0.699 | 5.12 | 90.35 |
| Y6 | 0.325 | 4.91 | 95.26 |
| Y7 | 0.032 | 3.61 | 98.87 |
| Y8 | 0.006 | 1.09 | 99.96 |
| Y9 | 0.005 | 0.04 | 100 |
| Algorithm | PC (c) | CE (c) | Time Consumed (s) |
|---|---|---|---|
| Fuzzy C-means | 0.6935 | 0.6096 | 5.1685 |
| Gustafson–Kessel | 0.7356 | 0.4892 | 5.7304 |
| Gath–Geva | 0.9493 | 0.0377 | 5.5268 |
| Distances | Condition 1 | Condition 2 | Condition 3 | Condition 4 | Condition 5 |
|---|---|---|---|---|---|
| The distance to Clustering Center 1 | 3.4 | 2.3 | 0.28 | 2.8 | 3.64 |
| The distance to Clustering Center 2 | 6.8 | 6.1 | 4.03 | 0.65 | 7.39 |
| The distance to Clustering Center 3 | 0.25 | 0.74 | 2.79 | 2.7 | 5.71 |
| The distance to Clustering Center 4 | 2.2 | 3.0 | 4.99 | 2.47 | 0.16 |
| The result of identification | Clustering 3 | Clustering 3 | Clustering 1 | Clustering 2 | Clustering 4 |
© 2017 by the authors. Licensee MDPI, Basel, Switzerland. This article is an open access article distributed under the terms and conditions of the Creative Commons Attribution (CC BY) license (http://creativecommons.org/licenses/by/4.0/).
Share and Cite
Hua, Y.; Jiang, H.; Tian, H.; Xu, X.; Chen, L. A Comparative Study of Clustering Analysis Method for Driver’s Steering Intention Classification and Identification under Different Typical Conditions. Appl. Sci. 2017, 7, 1014. https://doi.org/10.3390/app7101014
Hua Y, Jiang H, Tian H, Xu X, Chen L. A Comparative Study of Clustering Analysis Method for Driver’s Steering Intention Classification and Identification under Different Typical Conditions. Applied Sciences. 2017; 7(10):1014. https://doi.org/10.3390/app7101014
Chicago/Turabian StyleHua, Yiding, Haobin Jiang, Huan Tian, Xing Xu, and Long Chen. 2017. "A Comparative Study of Clustering Analysis Method for Driver’s Steering Intention Classification and Identification under Different Typical Conditions" Applied Sciences 7, no. 10: 1014. https://doi.org/10.3390/app7101014
APA StyleHua, Y., Jiang, H., Tian, H., Xu, X., & Chen, L. (2017). A Comparative Study of Clustering Analysis Method for Driver’s Steering Intention Classification and Identification under Different Typical Conditions. Applied Sciences, 7(10), 1014. https://doi.org/10.3390/app7101014