Article

Reverse Circulation Drilling Method Based on a Supersonic Nozzle for Dust Control

College of Construction Engineering, Jilin University, Changchun 130026, China
*
Author to whom correspondence should be addressed.
Appl. Sci. 2017, 7(1), 5; https://doi.org/10.3390/app7010005
Submission received: 5 November 2016 / Revised: 13 December 2016 / Accepted: 19 December 2016 / Published: 27 December 2016

Abstract

:
To reduce dust generated from drilling processes, a reverse circulation drilling method based on a supersonic nozzle is proposed. The suction performance is evaluated by the entrainment ratio. A series of preliminary laboratory experiments based on orthogonal experimental design were conducted to test the suction performance and reveal the main factors. Computational fluid dynamics (CFD) were conducted to thoroughly understand the interaction mechanism of the flows. The Schlieren technique was further carried out to reveal the flow characteristic of the nozzle. The results show that the supersonic nozzle can significantly improve the reverse circulation effect. A high entrainment ratio up to 0.76 was achieved, which implied strong suction performance. The CFD results agreed well with experimental data with a maximum difference of 17%. This work presents the great potential for supersonic nozzles and reverse circulation in dust control, which is significant to protect the envrionment and people’s health.

Graphical Abstract

1. Introduction

Air drilling technology is a basic and important technique which is widely used in mineral production and foundation construction. The heavy dust due to drilling processes has always been a key issue. The adverse effects of fugitive dust emissions to the local environment and human health, including workers and the general public, has attracted attention from researchers [1,2,3]. Hence, we proposed a reverse-circulation drilling method to solve this problem. This method utilizes the nozzle suction effect to draw in and pump a significant amount of air with the cuttings and dust to the ground for collection. It is a highly efficient and cleaner drilling technique aimed to protect the environment and human health [4]. A high penetration rate and good quality of borehole are also important advantages to shorten time and save cost. Satisfying dust control performance was achieved after drilling to a certain depth, however, heavy dust can still be observed in the initial drilling phase because of lower annular space pressure and deficient suction capability. Additionally, leakage loss of air at fractured formations is another problem due to deficient suction performance.
The combination of a supersonic nozzle and reverse-circulation drilling method is likely to be a potential solution to this issue. A supersonic nozzle is a minor and simple mechanical component utilizing the conversion of pressure energy and kinetic energy of the motive or primary stream to entrain and pump flows. It is widely used in aerospace [5], fuel cell [6], refrigeration [7], waste heat recovery [8], and solar power technologies [9]. Considering its simplicity in construction and high efficiency, the supersonic nozzle seems to be available to the reverse-circulation drilling technique for better dust control. How to make the best of the supersonic nozzle to maximize the entrainment ratio has attracted significant attention from researchers. Some of them focused on the design of the nozzle structure. A lobed supersonic nozzle was proposed by Tillman et al. [10] to improve entrainment and mixing within a rectangular ejector. Fanshi et al. [11] compared the performance of the Chevron nozzle and a conventional nozzle, and stated that the Chevron nozzle has a positive effect on the supersonic ejector performance. Srisha et al. [12] developed two supersonic nozzles named the Tip Ring nozzle and Elliptic Sharp Tipped Shallow (ESTS) lobed nozzle, and the results show that both nozzles achieved a 30% increase in entrainment of the secondary flow. Nevertheless, the relative complexity of these nozzle geometries is such that it is not easy to fabricate them. A group of studies focused on geometry parameter matching. Yan et al. [13] investigated the optimum area ratios of the nozzle/mixing chamber and operating conditions with an experimental setup. Eames et al. [14] confirmed that the nozzle exit position (NXP) and primary nozzle geometry had a strong influence on the entrainment performance. Varga et al. [15] and Rusly et al. [16] also observed that the position of the nozzle was an important design parameter, and the nozzle exit position affected the critical back pressure considerably.
For the reverse-circulation method, the effect of area ratio can be regarded as the relationship between the nozzle and the center passage area. The difference is that the supersonic nozzle is not coaxial with the “mixing chamber” (center passage). The supersonic nozzle was designed inclined with an unequal-length divergent part which was different from the axial symmetry nozzle in previous studies. Furthermore, multiple supersonic nozzles were distributed in the radial direction instead of a single nozzle. The flows from nozzles in adjacent or opposite positions may interact and, hence, change the back pressure in the center passage. Therefore, it is necessary to thoroughly understand the flow characteristic and mixture mechanism for suction performance improvement.
In the past, significant effort was made to investigate the entrainment performance of a supersonic nozzle based on one-dimensional gas dynamics theory. Keenan et al. [17] proposed a one-dimensional model called as constant area model. Later, they modified the model with the concept of constant pressure mixing [18]. Huang et al. [19] further proposed a model that could calculate the entrainment ratio. Zhu et al. [20] proposed a shock circle model to predict the velocity distribution at the entrance of the constant-area mixing chamber. The one-dimensional method is effective and helpful, however, it seems harder to accurately predict the internal flow field in a complex three-dimensional structure.
Visualized analysis, including computational fluid dynamics (CFD) and the Schlieren technique, constitute incontestably powerful routes to enable accurate predictions and visualizations of aerodynamics in complex structures. Bartosiewicz et al. [21] investigated ejector flow characteristics using CFD techniques. They compared different models and proposed that the RNG k-epsilon model was suitable to represent the entrainment ratio of the ejector. Pianthong et al. [22] carried out a CFD method to investigate the effect of operating conditions, NXP, and throat length on ejector performance. Hakkaki-Fard et al. [23] conducted a computational methodology for ejector design and performance maximization based on CFD. Chong et al. [24] studied the performance and flow field inside ejectors numerically and experimentally. They considered that there existed an optimal NXP corresponding to a maximum entrainment ratio and the CFD results were in agreement with the experimental data.
To visualize the shock structures and yield better understanding of complex flow phenomena and the performance characteristics, Dvorak and Safarik [25] investigated the transonic instability in the mixing chamber of a high-speed ejector using the Schlieren technique. They found that the instability caused the movement of the position of the boundary layer separation, the structure of shock waves changed, and all flow structures oscillated. Sugiyama et al. [26] further studied the shock wave and turbulent boundary layer interactions in supersonic rectangular ducts using color Schlieren photographs. More recently, Zhu et al. [27,28] investigated the entrainment performance and the shock wave structures in a three-dimensional ejector by CFD and Schlieren flow visualization. They drew a conclusion that the entrainment ratio of a convergent–divergent nozzle was greater than that of the convergent nozzle for the same first shock wave length.
In this work, CFD and Schlieren methods were also applied to thoroughly understand the flow characteristics and entrainment mechanism. Orthogonal design was also conducted to reduce test times and study the suction performance more systematically.

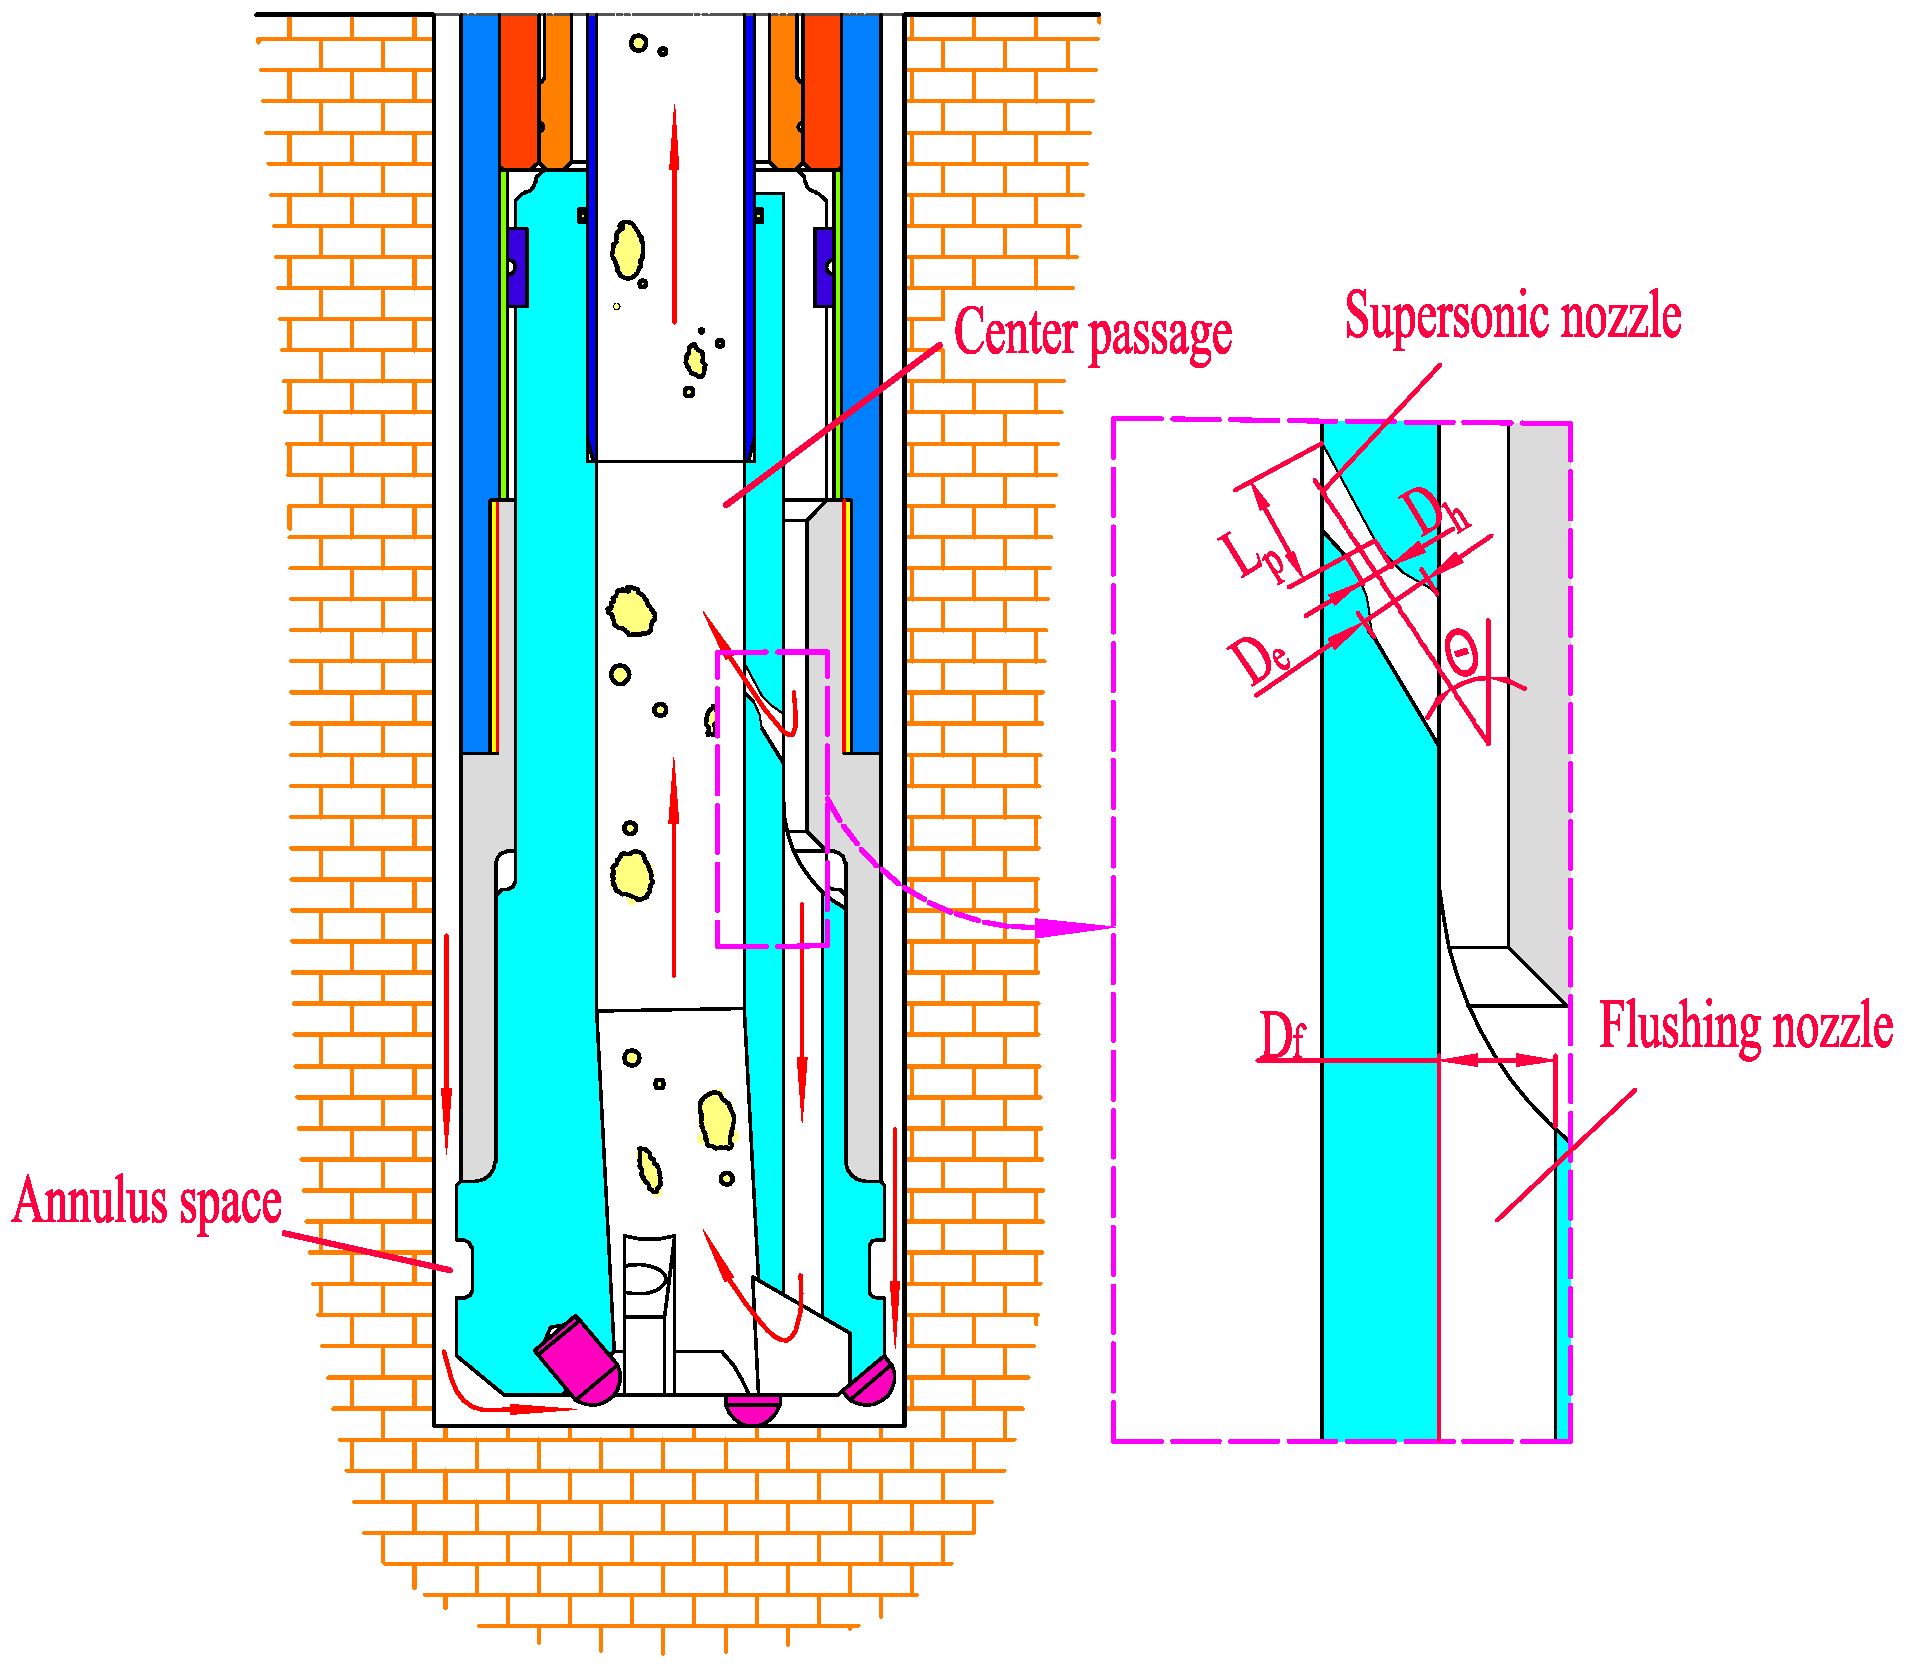
2. Description of the Suction Process and Nozzle Structure

The reverse-circulation drilling method aims at dust control, which utilizes the suction and entrainment performance of a supersonic nozzle with no need for an additional precipitator. As shown in Figure 1, compressed air flows into the supersonic nozzle and the flushing nozzle, which are located on the drill bit body towards the center passage and the borehole bottom, respectively. The flushing nozzle is designed to cool the working face and suspend rock debris. The motive air from the supersonic nozzle induces ambient air upward, and converts the pressure energy to kinetic energy, resulting in a decrease of pressure in the center passage. The difference of pressure between the center passage and the annulus space causes the suction of a lot of air into the center passage. By this process, the cuttings and dust are carried into the center passage by the air and collected by a dust bag at passage outlet.

3. Experimental

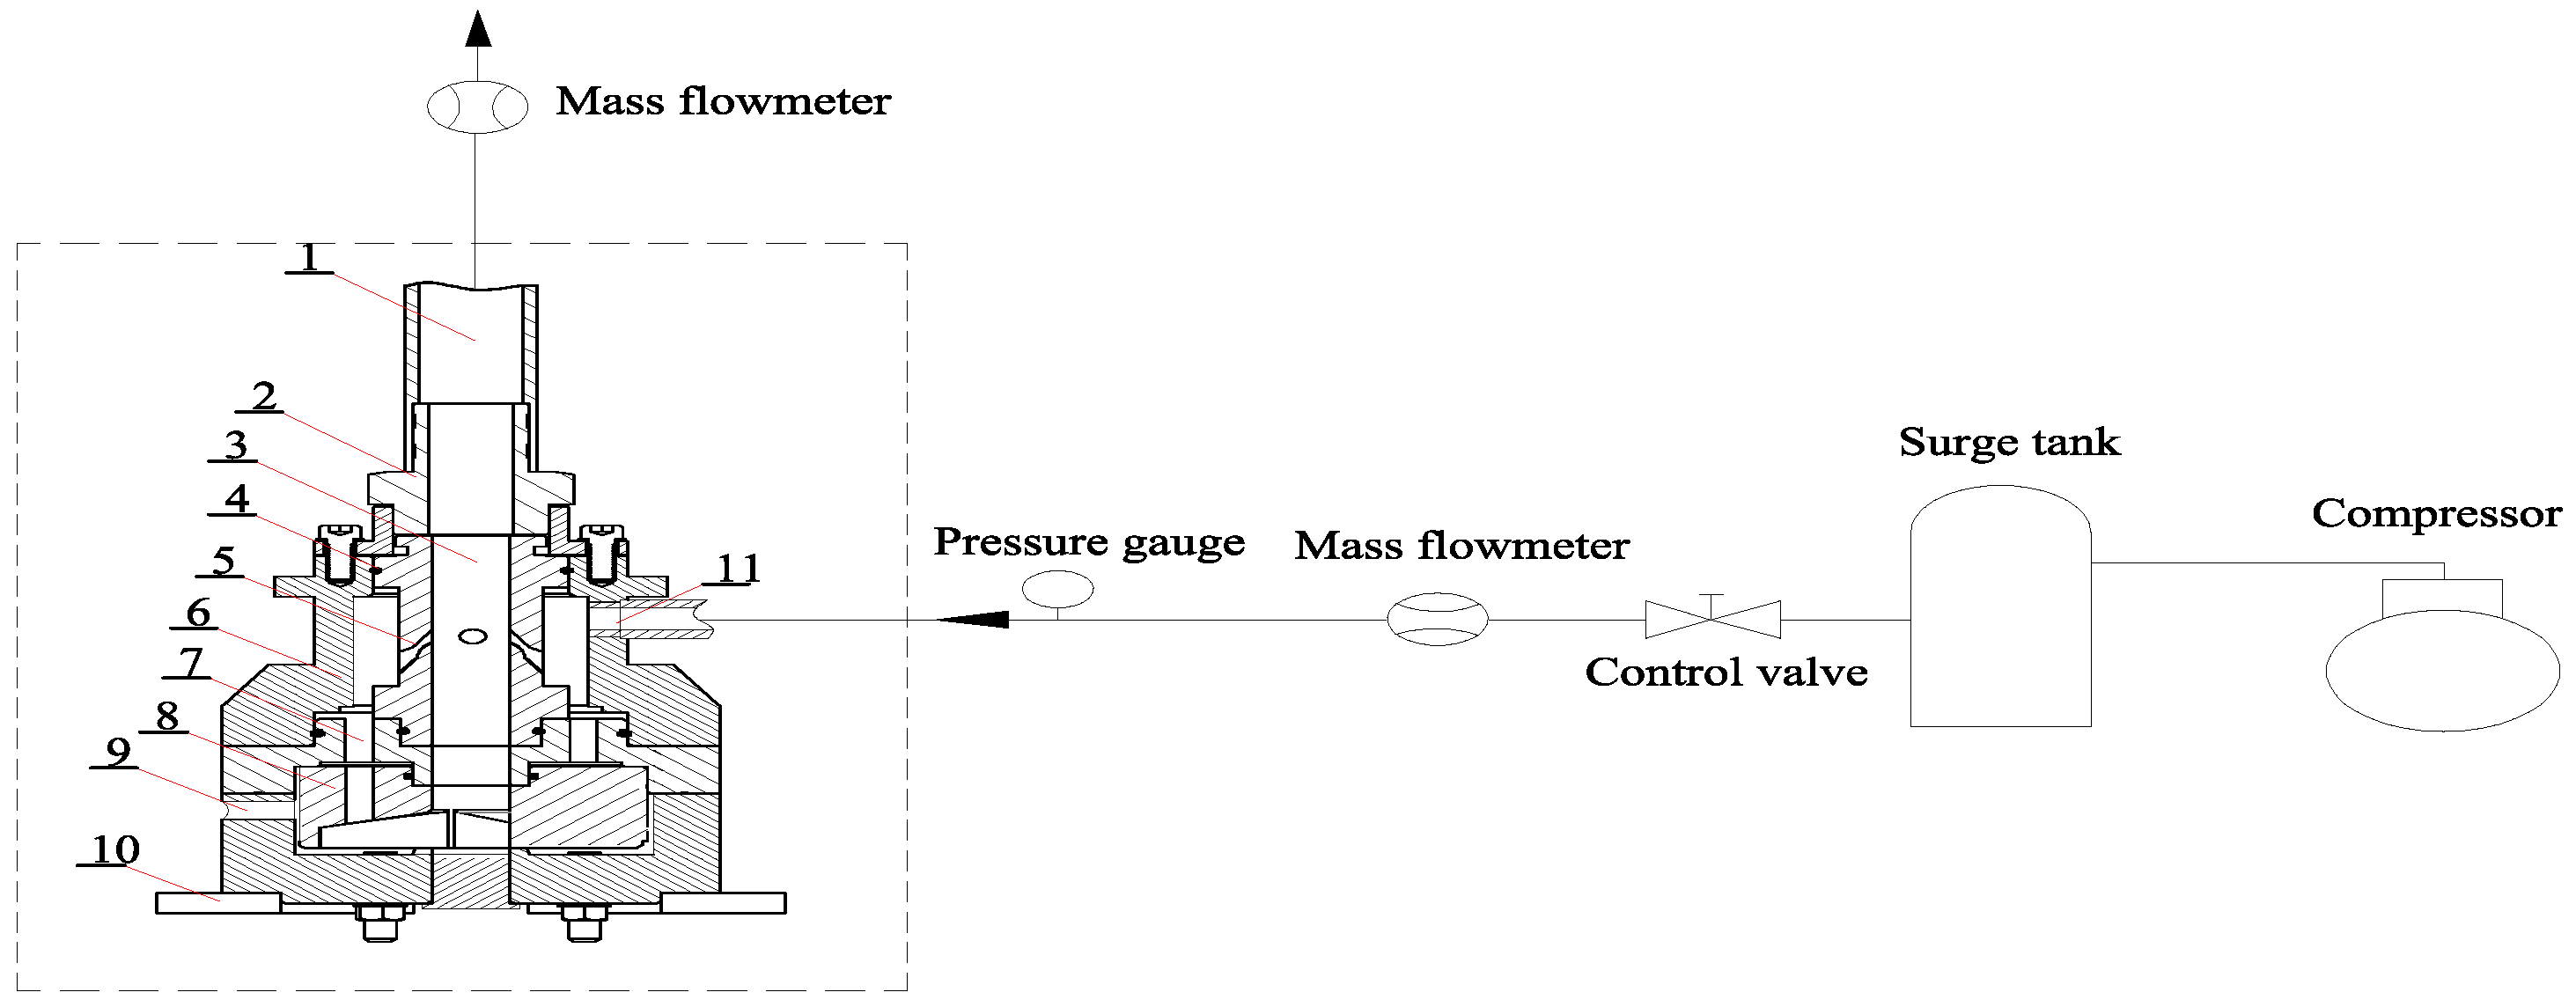
3.1. Orthogonal Experimental Design and Experimental Setup

As shown in Figure 2, the experimental reverse-circulation apparatus consists of three parts, a supporting pedestal, a simulated reverse-circulation bit, and an upper discharge passage, respectively. For easier facility parameter adjustment, a modular design method was applied to the design of the simulated bit in the laboratory. The simulated reverse-circulation bit is divided into two modules; namely, the center passage with supersonic nozzles and flushing nozzle modules. The center passage is connected to the upper discharge passage so that the flow rate of the mixing air can be measured by mass flow meter. There exists a certain gap between the supporting pedestal and bit to simulate the annular space in borehole where the outside air can be inhaled into the bit through the air vent on the supporting pedestal. An air compressor is used as the air source, and a surge tank is utilized to provide a steady pressure in experimental system.
As the analysis using conventional experimental methods is inefficient and expensive, the orthogonal design is applied in this paper. By application of this method, less experimental work is required to study multiple levels of all input parameters and some effects due to statistical variations can be filtered out. The quantity of the supersonic nozzle (Ns), the flushing nozzle diameter (Df), divergent part length (the longer side) of the supersonic nozzle (Ls), the spray angle of the supersonic nozzle (θ), the supersonic nozzle height (H), and the center passage diameter (Dc) are determined as six factors of the orthogonal experiment and each factor has three levels. For each factor, three levels are selected to eliminate the influence and validate the experimental results. To thoroughly understand the interrelationships between the factors, the interaction terms (Ns × Df and Ns × Ls) are investigated. The considered factors and levels are listed in Table 1.
The nozzle diameters of the entrance and throat were 6.6 mm and 2.8 mm, respectively. Twenty-seven tests derived from the L27 (313) orthogonal array design are shown in Table 2. The blank columns are not shown in this table. The entrainment ratio was defined as ω = mS/mP. Ki represented the sum of the experimental values with the same level in any column. Further analysis was conducted by the method of analysis of variance (ANOVA). Based on the results given in Table 2, the total sum of squares of deviation (SST) was calculated by the following expression:
SST = QR
where Q and R were defined as:
Q = i = 1 27 ω i 2
R = ( i = 1 27 ω i ) 2 27
Similarly, the sum of squares of deviation of each factor was expressed as:
S S = K 1 2 + K 2 2 + K 3 2 9 R
Then F-test was carried out to gain a better understand of mentioned parameters. The mean square and the value of F of each factor can be calculated from the following equations:
M S   =   S S d f
F   =   M S M S e
where df represented the degree of freedom and MSe represented the mean square of error term, respectively.

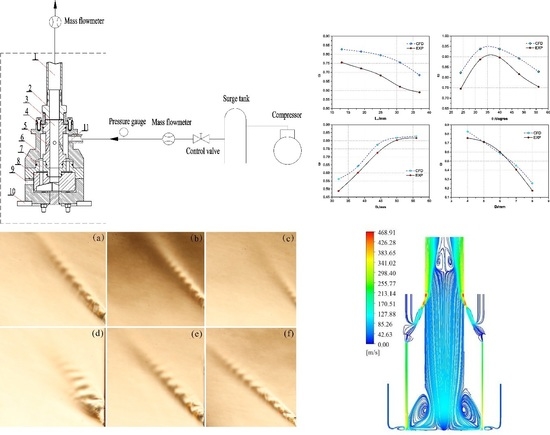
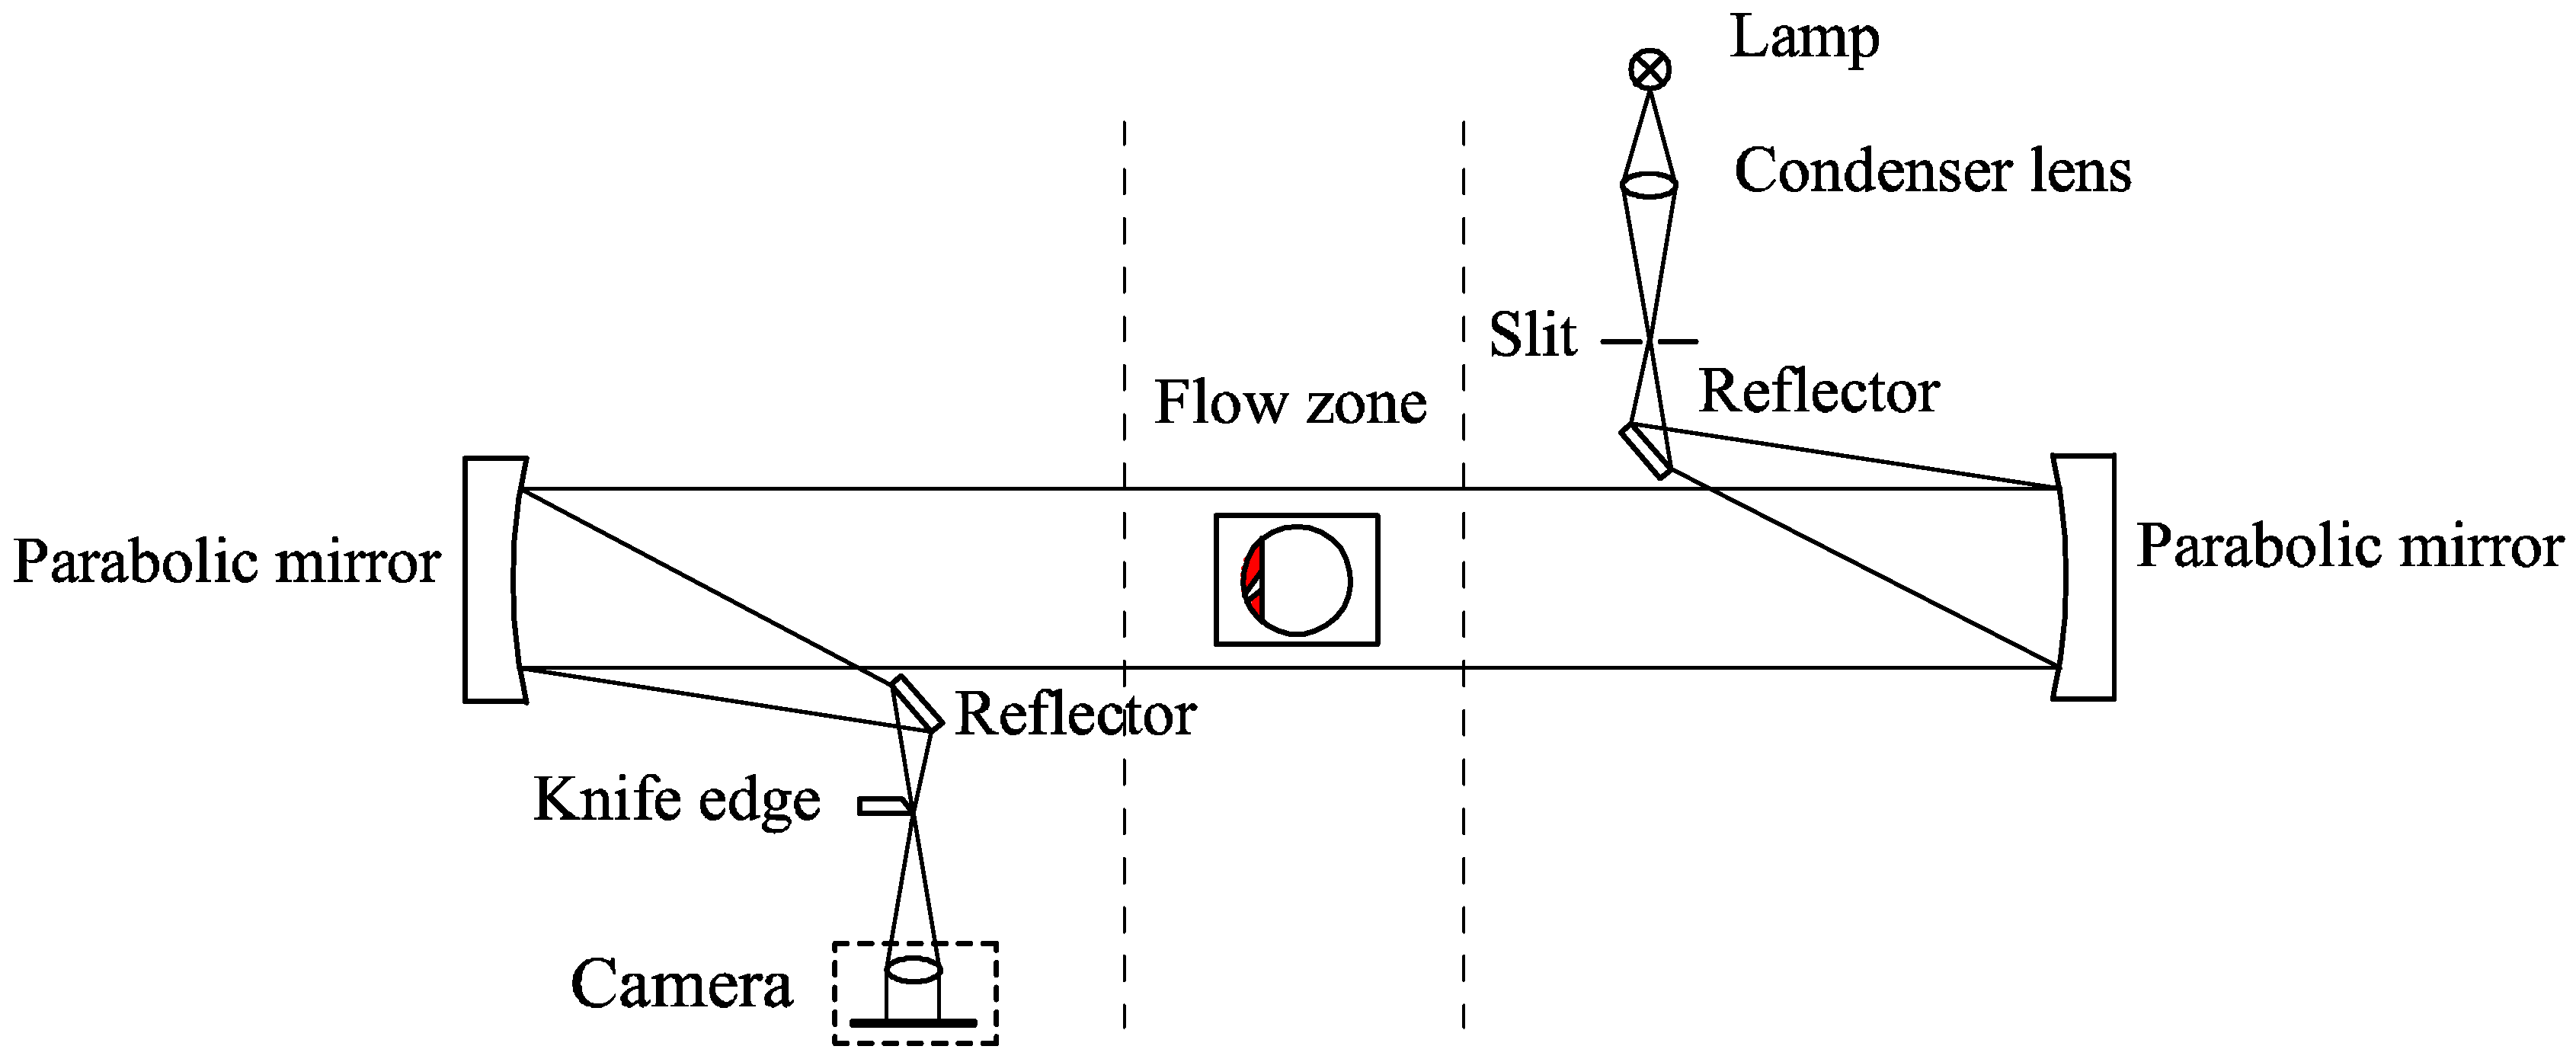
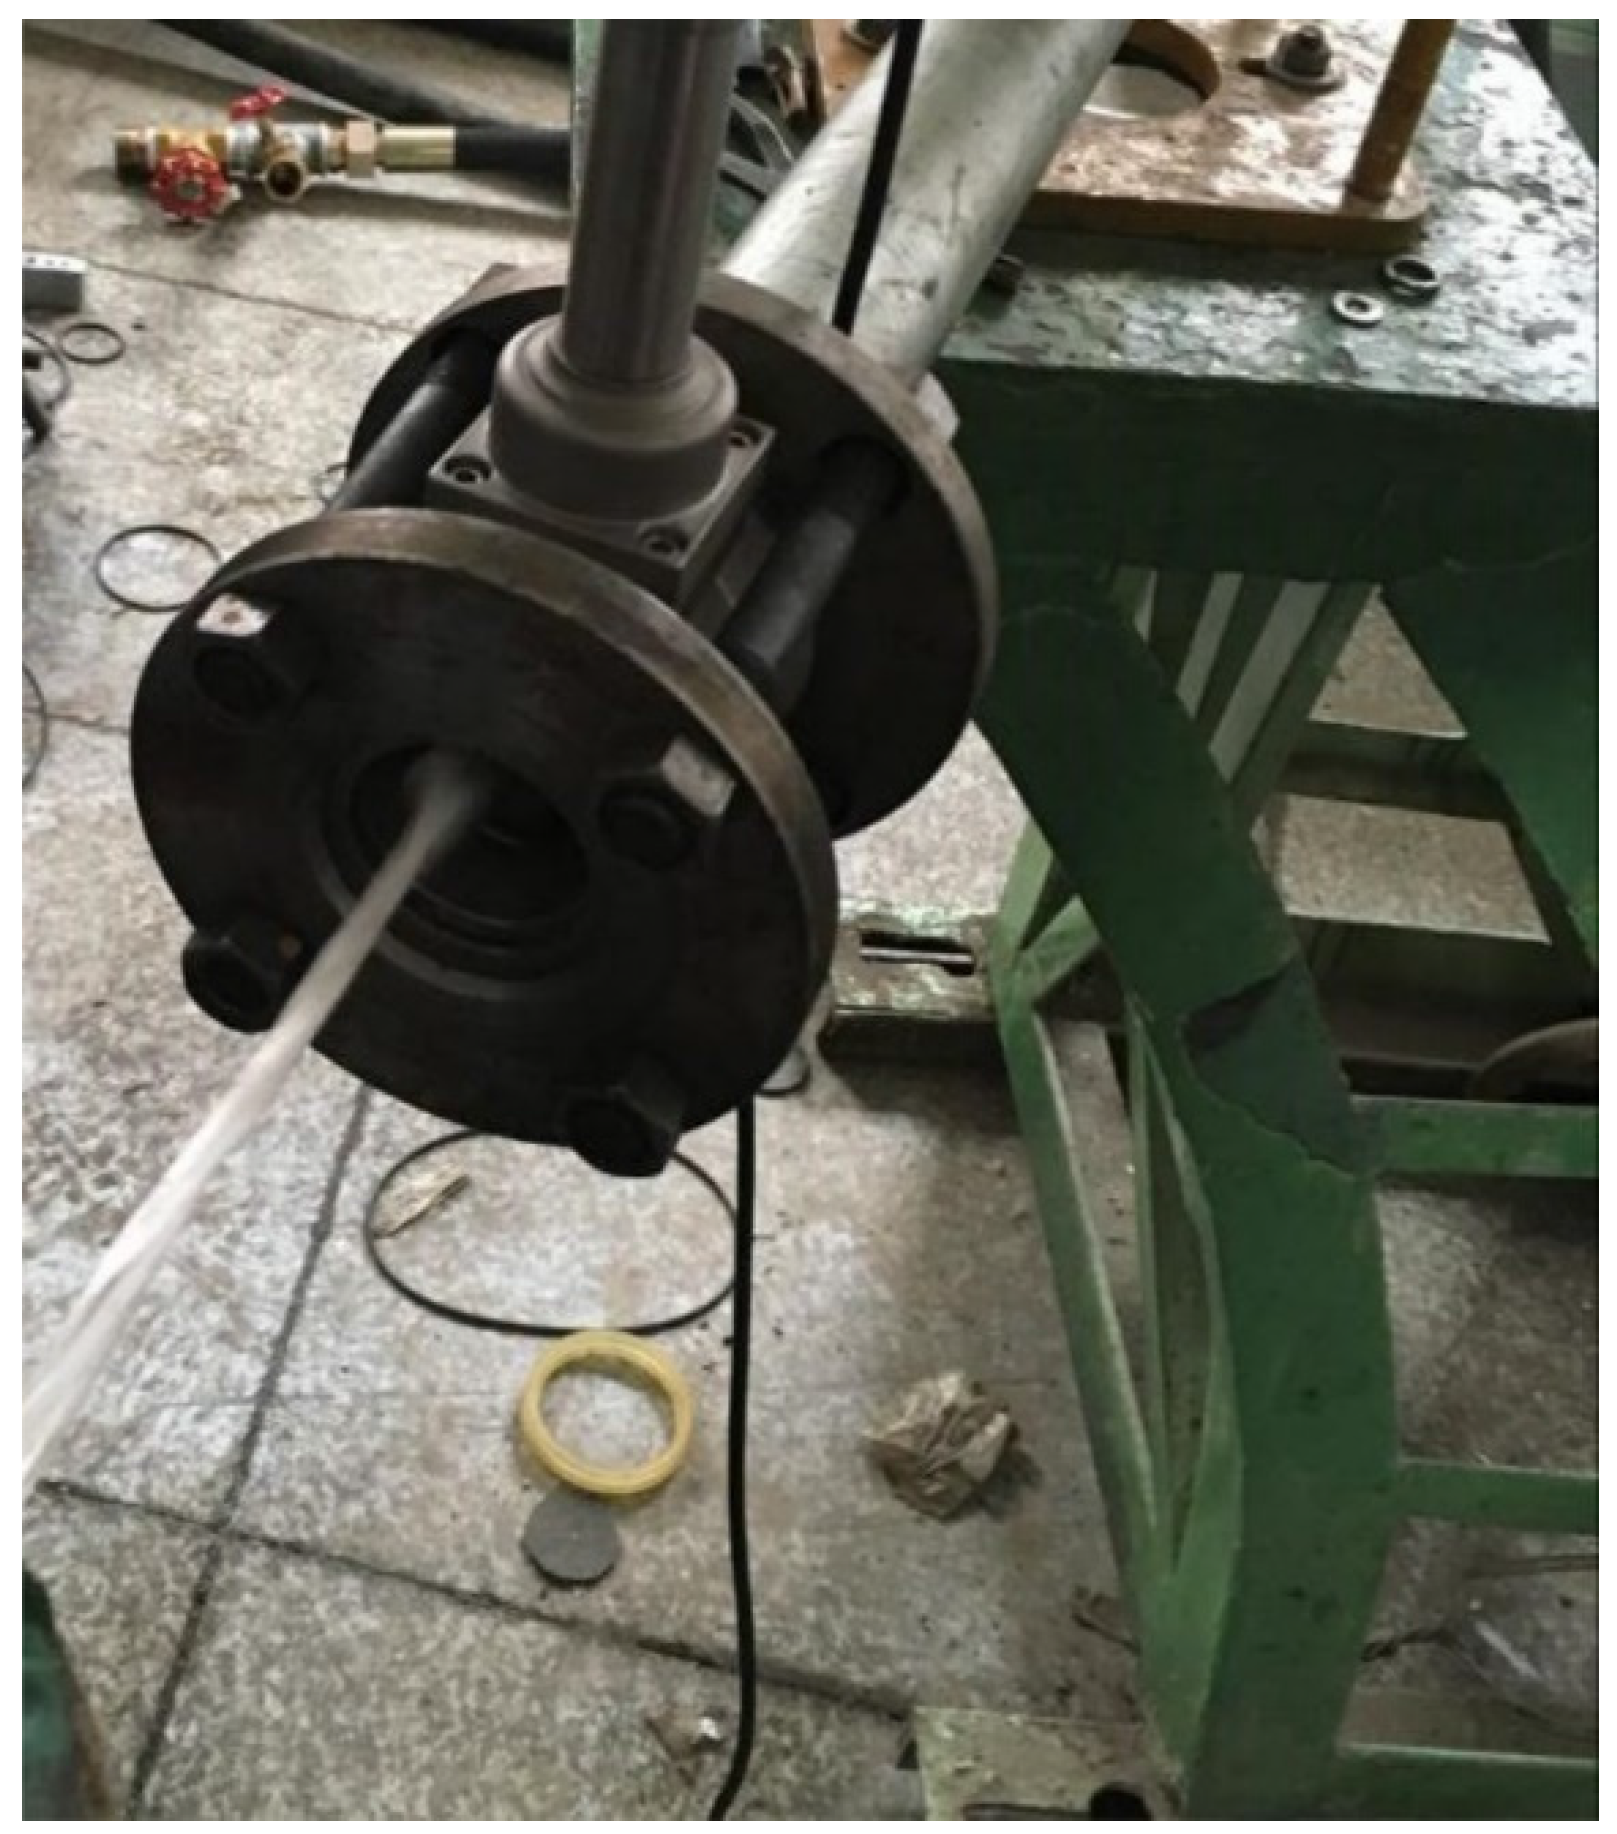
3.2. Schlieren Experiment

As shown in Figure 3, Schlieren method is based on the light deflection by the refractive index gradient due to the variation of flow density. In this test, a tungsten halogen lamp was chosen as the light source. The light passed through a condenser lens and was reflected to a parabolic mirror by a reflector. A collimated light beam was generated from the parabolic mirror and then passed through the flow zone where the supersonic nozzle was placed. After that, a similar light path was accomplished by another parabolic mirror and reflector. Finally, the converged light spot is cut by a knife edge and imaged in a camera. The Schlieren system is designed in such a way that the phase difference can be eliminated and saves limited space. The inlet pressure was kept at 0.7 MPa.

4. CFD Method

Although the model of solid and gas dual-phase flows (particles and gas) can evaluate the suction performance more directly [29], considering that compared with the Schlieren results and a tremendous amount of simulation it is more convenient and reasonable to use a fluid model. Mathematical modeling of the experiment was accomplished using the commercial CFD software package FLUENT14 (ANSYS Inc., Pittsburgh, PA, USA). The detailed three-dimensional geometry is built up using SolidWorks software and meshed by Hyper Mesh software. In order to obtain sufficient accuracy, the simulation domain, including supersonic nozzles and a partial center passage in the vicinity of the nozzle exit, adopt the grid refining. The mesh profile is established with 4.5 million elements, which has been validated by grid-independence analysis and proven to be reasonable. A segregated implicit solver is chosen to solve the non-linear governing equations. The controlling equations of mass conservation, momentum conservation, and energy conservation are set to steady-state forms, which neglects time derivatives. It can be written as:
d i v ( ρ U φ     Γ φ g r a d φ )   =   S φ
where φ , U, Γ, and S represent the dependent variable, velocity vector, diffusion coefficient, and source term, respectively [23]. As the concerned fluid is high-speed and compressible (Mach > 0.3), the COUPLED algorithm was applied to obtain velocity and pressure fields. The second order upwind scheme was chosen as the interpolation scheme to discretize the convective terms for its second-order accuracy. The discussion about turbulence models has been continued. Zhu et al. rendered that the RNG k-epsilon turbulence viscosity model agreed best with the shock wave structures [27], while Besagni compared seven models and showed that the k–ω SST presented a better performance [30]. Considering the calculating time and convergence rate, the standard model was applied to simulate the high speed flow in this work. Additionally, the predictions of the mass flow rate were nearly the same for these two models when the inlet pressure reached 0.6 MPa [27].
The ideal gas model was used as the air definition due to the normal temperature condition. In all cases, the walls are considered to be smooth and no-slip adiabatic boundaries. Numerous studies about the influence of operating conditions (temperature, inlet pressure, and outlet pressure) have been conducted. According to their results, the variation trends of the entrainment ratio that changed with pressure are similar [22,27]. Hence, this content will not be discussed in this paper. The inlet pressure was set to a constant value of 0.7 MPa.

5. Results and Discussion

5.1. Parameter Analysis

Factors should be recalculated into the error term if the mean square of some factor is less than that of the error term. As the MS values of the Ns, Ns × Df, Ns × Ls, Hc are all less than the MSe, these factors have little influence on the entrainment ratio and the interaction effect can be negligible. It can be inferred that the quantity of four nozzles was sufficient to achieve good suction performance. By readjustment of the error term, the analysis results are shown in Table 2.
As there exist some pressure fluctuation when the compressor starts and stops, the average mass flow rate in the stable stage is selected as the experimental value. As shown in Table 3, the parameter order between the primary and secondary is Dc > Df > Ls> θ according to the value of F. Furthermore, by comparison to F0.05 (2, 18) = 3.55 and F0.01 (2, 18) = 6.01, the θ has significant effects on entrainment and suction performance, and Ls, Df, and Dc have very significant effects.
The result show that the supersonic nozzle can obviously improve the suction performance. Obvious suction phenomena can be observed during the test, as shown in Figure 4. A high entrainment ratio up to 0.76 was obtained, which made an approximate doubling improvement of the entrainment ratio compared with 0.3 of the previous reverse-circulation drilling method [4]. The results obtained by orthogonal design and ANOVA reveal the primary and secondary sequence of the factors, however, how these factors work on the suction performance need to be further investigated.

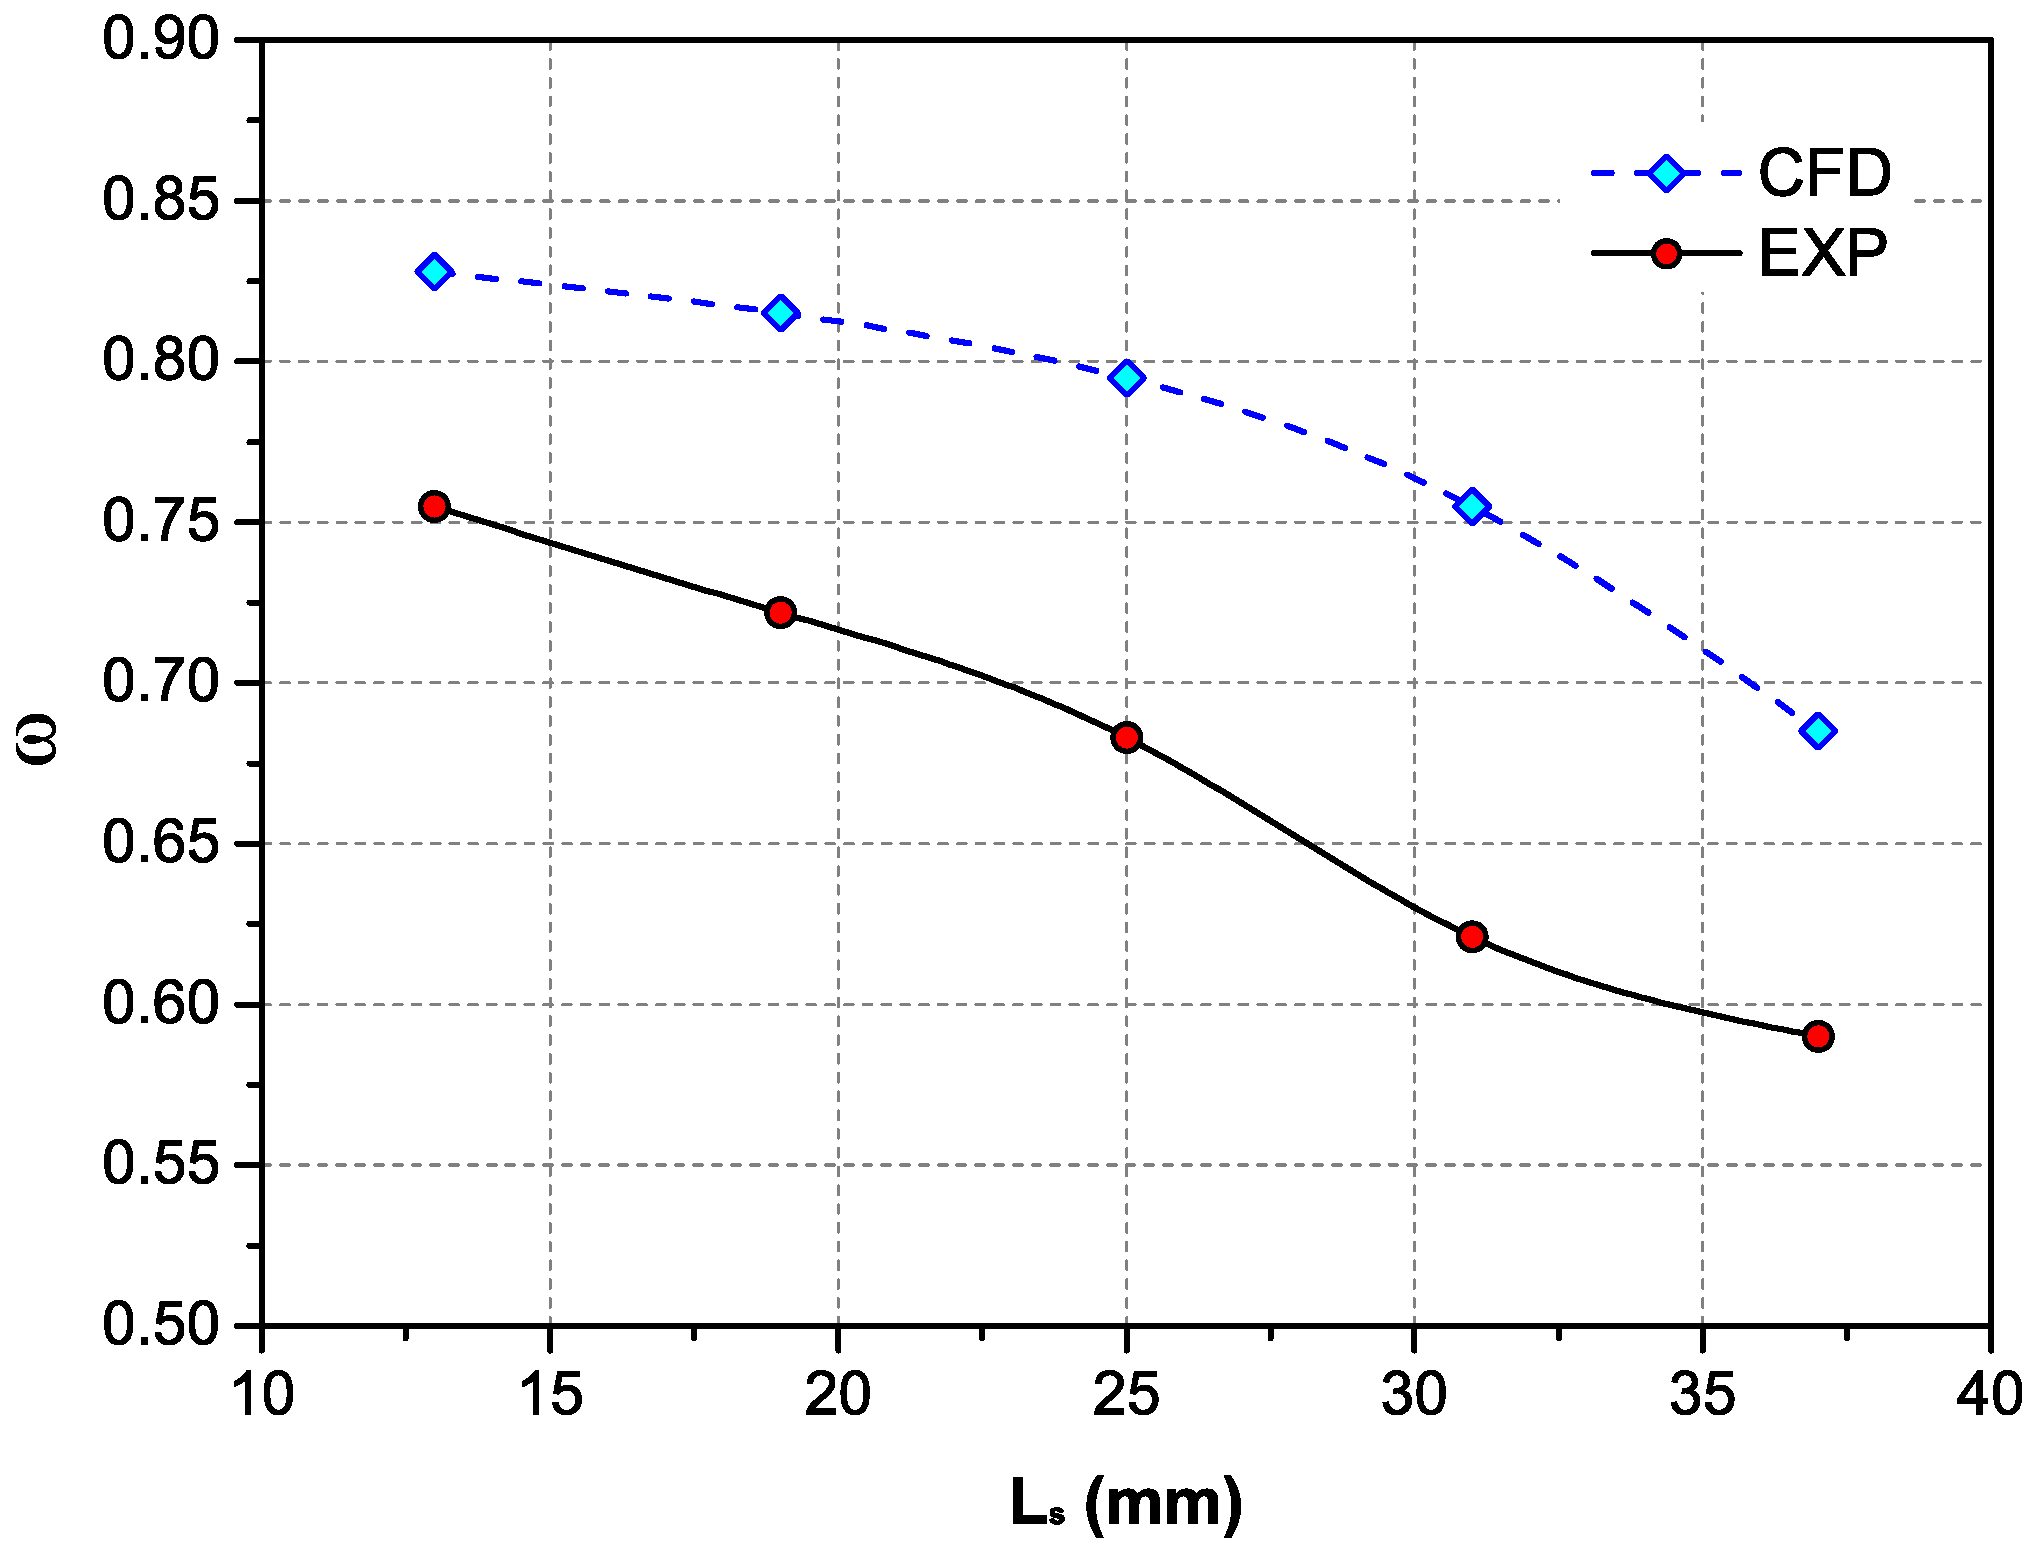
5.2. Influence of the Dominant Effective Parameters

Single factor analysis was carried out and the parameter combination of group 1 in Table 2 was selected. The static pressure near the wall along the axial direction of the center passage is shown in Figure 5. The pressures were all below 1 bar below the nozzle and there existed a sudden pressure drop near the nozzle exit which resulted in a pressure difference for suction. The drop of pressure was due to the conversion of pressure energy to kinetic energy according to energy conservation. The increase of pressure may be due to the effect of the shock wave.
The impact of divergent section length on the entrainment ratio is presented in Figure 6. The entrainment ratio decreased with the length of divergent part monotonously when the Ls increased from 13 mm to 37 mm. Figure 7 shows the streamlines obtained for different values of Ls. According to previous studies, the flow can be accelerated in the divergent part. The longer the divergent section, the higher speed of air at the nozzle exit can be obtained [31]. The result showed that a longer divergent part did obtain a higher speed in the nozzle; however, the velocity decreased at the nozzle exit, especially for the zone near the wall. As shown in Figure 7a, the high-speed flow was distributed to the longer side of diffuser zone. Expansion waves and shock waves can be seen at the nozzle outlet. This phenomenon seemed not to benefit to entrianment and mixing process, however, the high-speed flow distributed near the wall can reduce the conflict of the primary flows. A larger zone with higher upward velocity can also be observed compared with Figure 7b,c, which was easier to shear and mix with the second flow drawn in. On the contrary, although the flow field was more uniform, the flow seemed “choked” with an obvious velocity decrease before the nozzle exit, which can be seen in Figure 7c. Hence, the divergent part length should be shorter for multiple and oblique crossing supersonic nozzles.
The relation between the entrainment ratio and the spray angle of supersonic nozzle is presented in Figure 8. The curves show that ω increased with θ at first and then turned to constantly decrease. It is indicated that there existed an optimum value of θ in the range of 32° to 40° for the entrainment ratio.
Figure 9 compares the Mach number distribution with different value of θ. Although θ changed, the difference of the largest Mach number between each group seemed quite small when Ls was kept constant. This result further proved that Ls made an obvious effect on the flow. An obvious and large low-speed zone in the center can be observed in Figure 9a, and a narrow high-speed distribution near the wall can be clearly seen at the upper outlet. Figure 9b shows a much better mixing uniformity of the flows in the center zone, the wall, and the upper outlet boundary, indicating that the primary flows successfully transferred the kinetic energy to the inhaled air and entrained to the exit together. As shown in Figure 9c, the non-uniformity zone was also presented at the upper outlet boundary of the center passage and the zone near the wall. One possible explanation is that the flow too close to the wall caused a weaker shear and entrainment to the fluid in center passage if the center passage diameter is larger. Yet, with the increase of the spray angle θ, unnecessary energy consumption was increased due to the increase of multiple fluid collisions in the radial direction.
Figure 10 and Figure 11 present the impacts of flushing nozzle diameter and center-passage diameter on the entrainment ratio, respectively. In Figure 10, the entrainment ratio increased with the center-passage diameter, and then the curve tended to be smoother. It can be inferred that the interaction of nozzles was obvious and the back pressure at the supersonic nozzle outlet would be increased when the expansion process was restricted in a smaller space. The pressure difference between the center-passage and the air in the annular space was likely to decrease, which resulted in poor suction performance. However, the effect gradually decreased when the gas expansion was accomplished and insufficiently supplemented the flow. The flushing nozzle diameter, by contrast, presented a negative relation with the entrainment ratio, as shown in Figure 11. The flushing nozzle was used to suspend the particles in the flow for better suction. However, the backflow caused by the flushing nozzle disturbed the suction process of the annular air, which can be seen in Figure 7. Moreover, it is likely that the total inlet flow was shunted by the flushing nozzles, which caused the flow rate decrease of the supersonic nozzle. Thus, the velocity at the nozzle outlet decreased and poor suction performance was achieved.
According to the analysis above, the CFD method is realiable to estimate the overall suction performance and flow field charactristic. The deviations of calculated results were no more than 17%. The result indicates that the standard k-e model was not sufficient to accurately present the whole details of shock waves; however, it is helpful and convenient to analyze the flow field charactristic, and it is reliable to calculate ω. It was also found that the calculated values were generally less than the experimental values. Undiscovered leakage may be a reason for the difference.

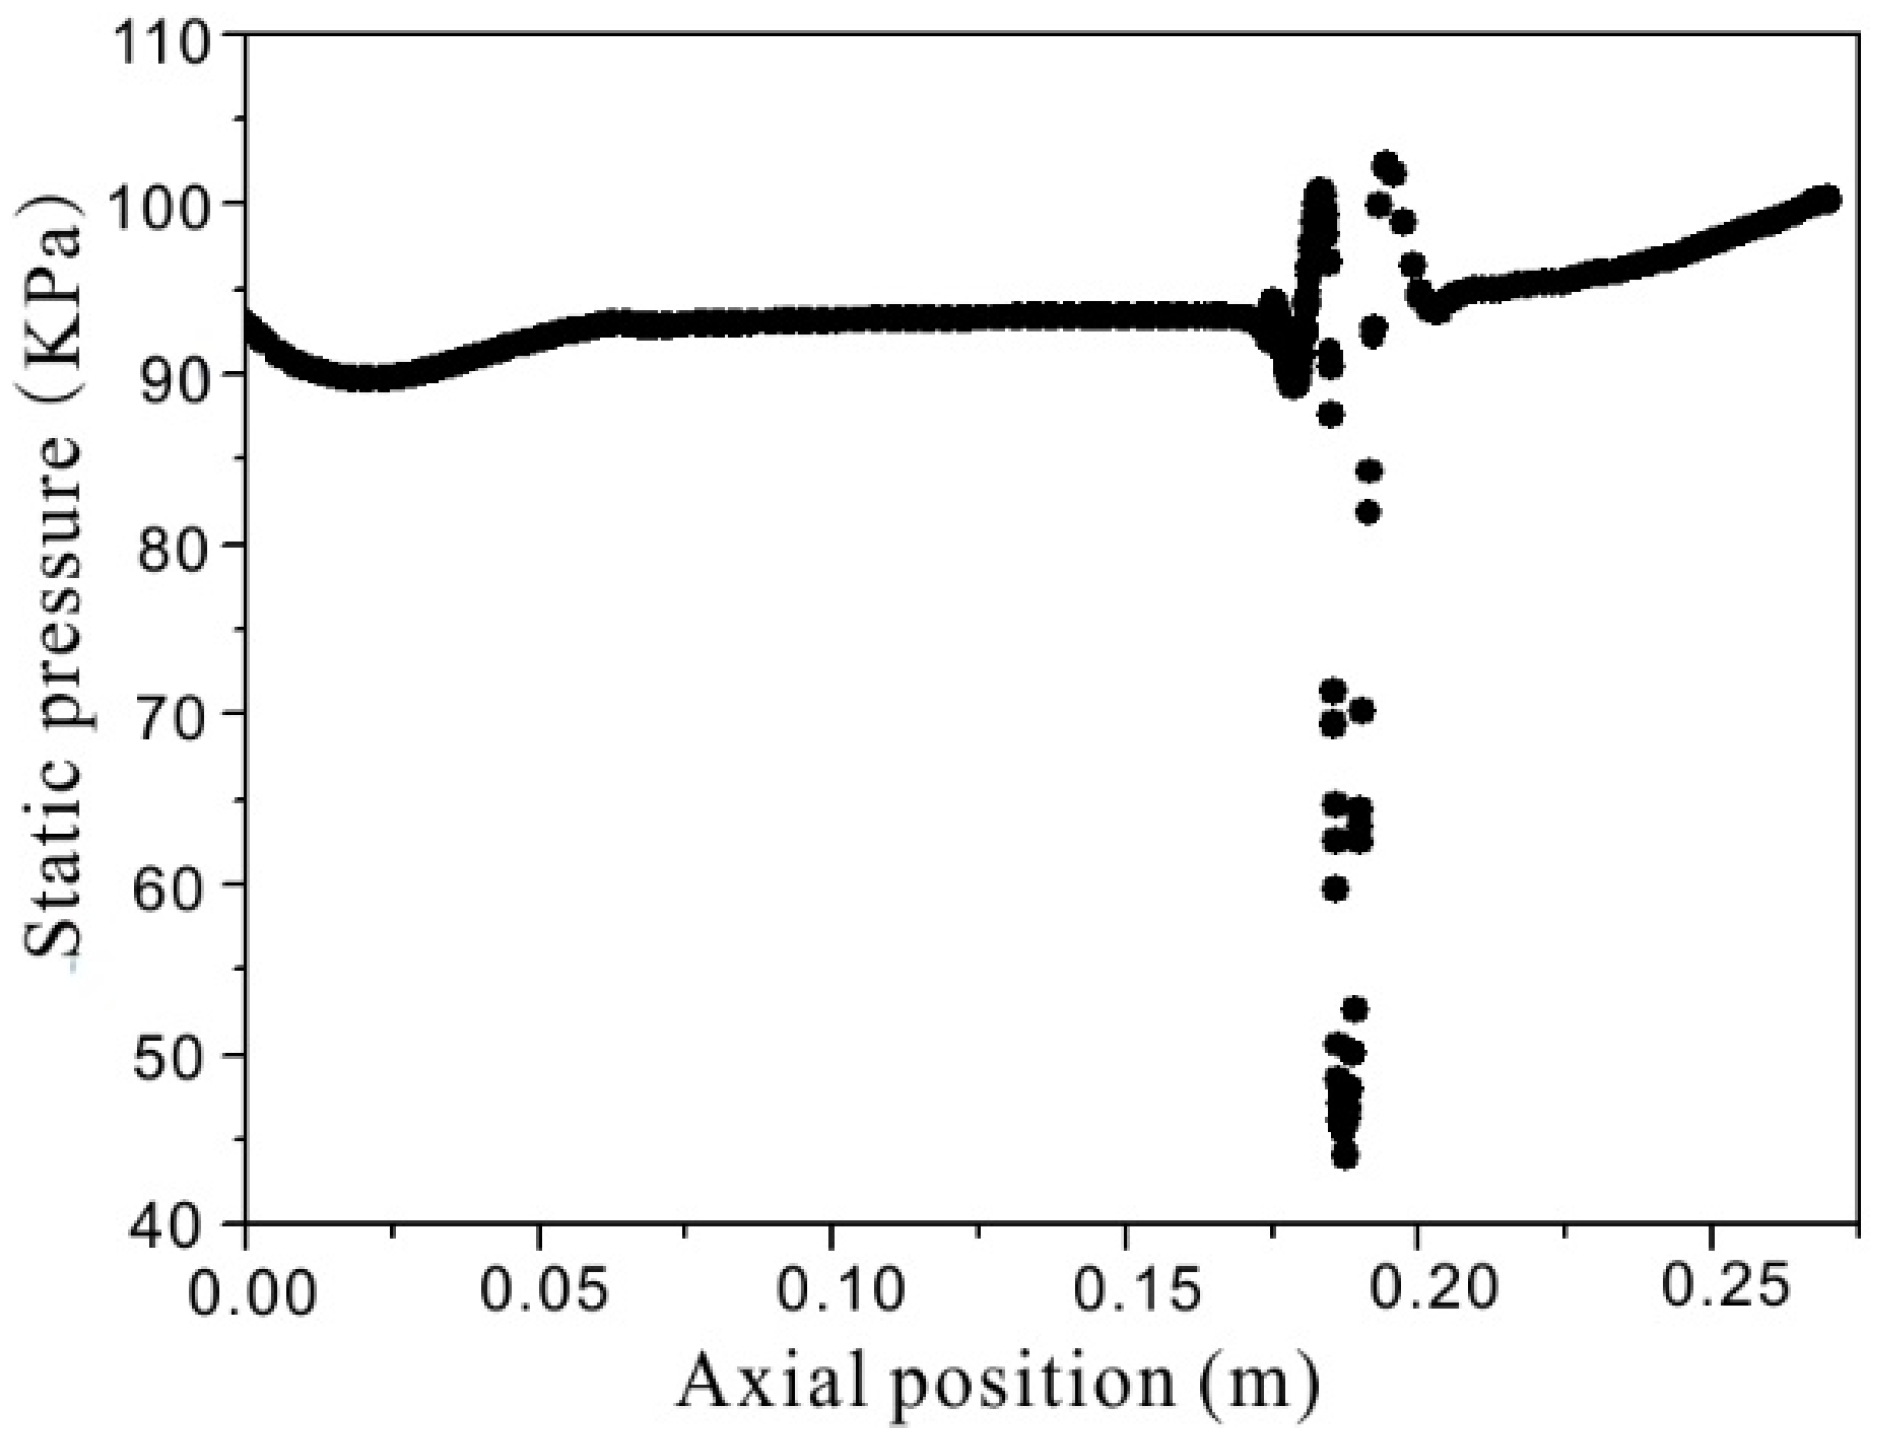
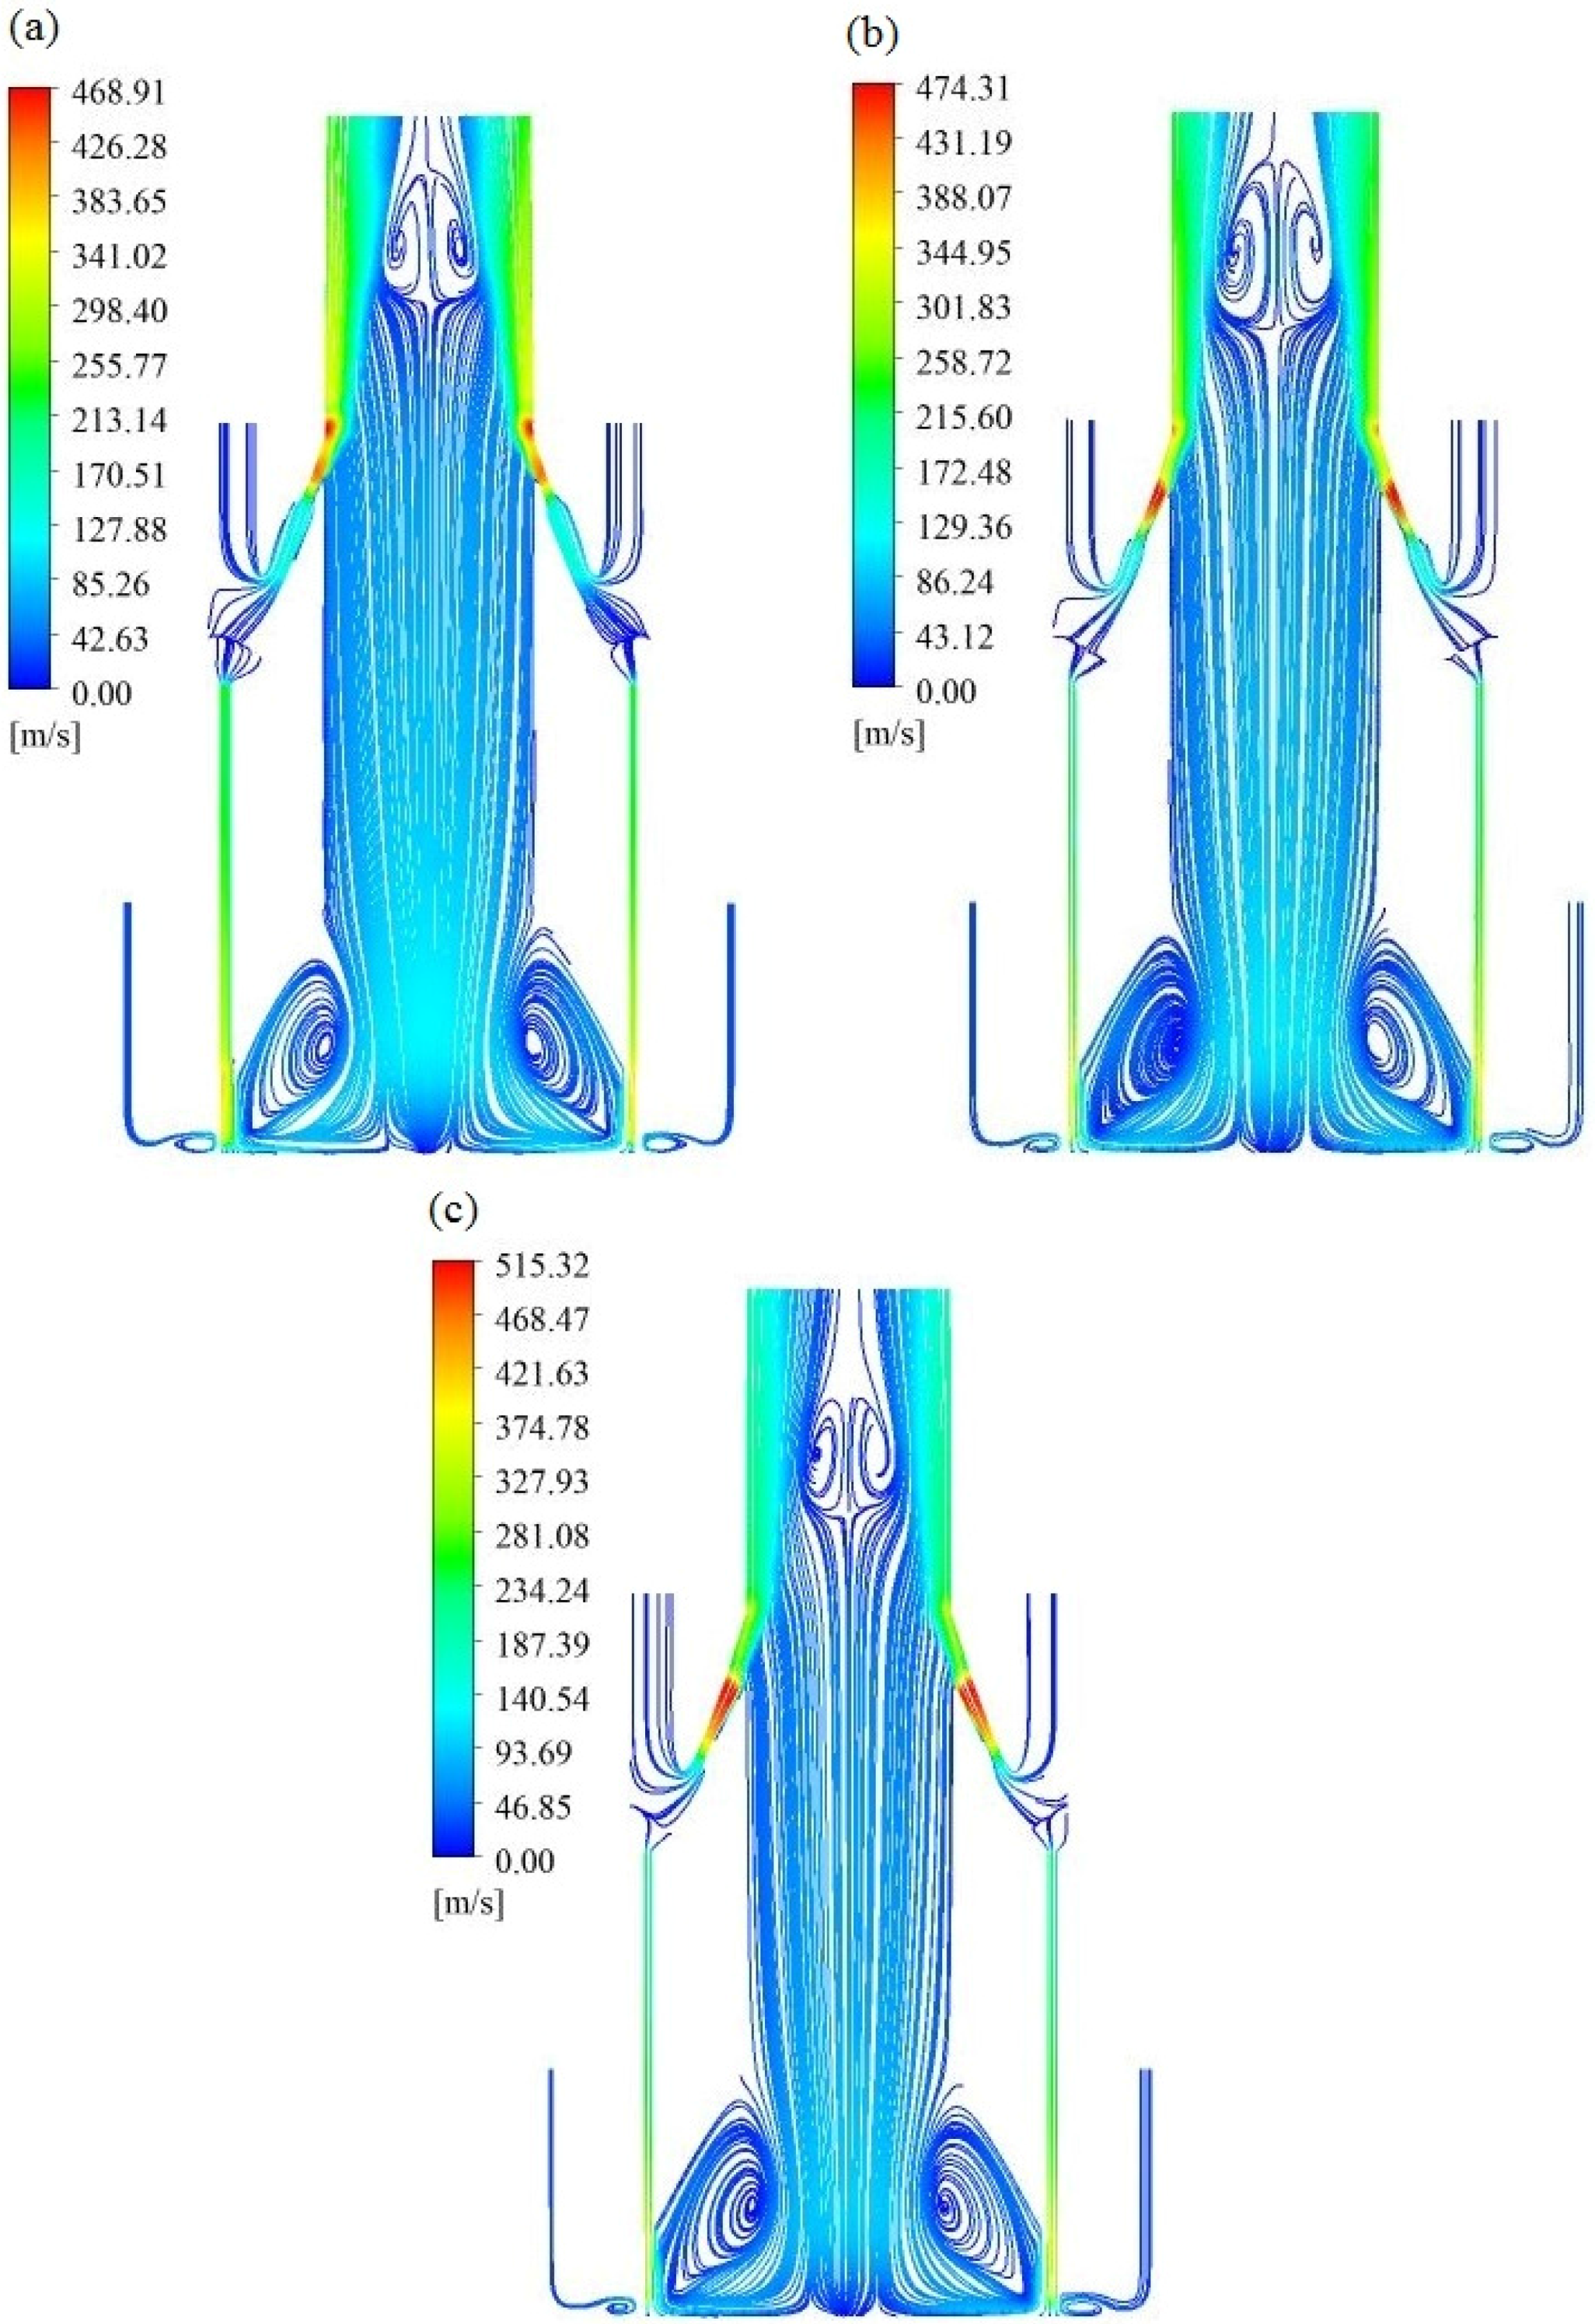
5.3. Observation of Shock Wave Structure

Figure 12 show the experimental Schlieren pictures of the flows after the nozzle exit. With a constant value of θ (32°), a clear under-expanded flow with shock wave can be observed in Figure 12a, and then the shock wave gradually blurred and the shock train length decreased as the increase of Ls. The phenomenon was basically consistent with the CFD result. Although higher pressure at the nozzle outlet is not beneficial to suction performance, and the formation of strong shock waves may result in irreversible energy losses and a nonuniform field [31], the higher flow speed at the nozzle exit presented stronger shear and entrainment processes, which achieved a better performance, finally. It seems that the effect of flow shear and entrainment is more important than that of pressure for the multiple-inclined supersonic nozzle structure.
Clear images of the flow from nozzles with different θ give a comparative picture from which qualitative inferences on the possible mechanisms can be inferred. As can be seen in Figure 12d–f, the length of the shock wave increased with the value of θ and the shock train direction deviated from the nozzle axial. The flow in the unequal-length diffuser zone tended to be close to the wall of the longer side and made a deviation at the nozzle exit due to Coanda effect. When the deflection between the direction of supersonic nozzle exit and center passage wall was in a proper curvature range, the jet stream was easier to flow along the surface resulting in a shorter length of shock wave. It can also be inferred that the very long shock waves from multiple nozzles were likely to collide in the center passage, which led to a lower entrainment ratio. Nevertheless, too much deflection decreased the entrainment and mixture zone in center passage so that the entrainment ratio decreased as well.
In general, the shock trian length did not present a clear relationship with the entrainment ratio. The possible reason is that the design of multiple-inclined supersonic nozzles need a synthetic consideration of the flow shear and mixture, flow collision, and pressure.

6. Conclusions

The suction performance of an optimized reverse circulation drilling method was investigated. The primary and secondary relations of various factors and flow characteristics were systematically discussed. The main findings are summarized as follows:
(1)
The application of a supersonic nozzle can significantly improve the suction performance of reverse-circulation drilling. A high entrainment ratio up to 0.76 was obtained, which implied a strong suction performance for dust control.
(2)
The length of the divergent section (Ls), spray angle (θ), flushing nozzle diameter (Df), and center passage diameter (Dc) had significant effects on entrainment and suction performance, while the effects of nozzle quantity and height can be ignored. The entrainment ratio decreased with Ls monotonously. There existed an optimum value of θ in the range of 32°–40° for better suction performance. The entrainment ratio increased with the center-passage diameter while presenting a negative relation with Df.
(3)
The CFD result agreed well with experimental data with a maximum difference of 17%. The Standard k-e was not proper to describe the details of shockwave, however, it is reliable to predict the entrainment ratio to save time for numerous and complex calculations and is helpful to assisting analysis.
(4)
For the unequal-length divergent part, the flow with high speed tended to distribute along the longer side, which was easier to deflect. The shock train length presented a negtive correlation with Ls and a positve correlation with θ. A synthetic consideration of the effects of flow shear and mixture, flow collision, pressure, and the distributary situation is necessary.
The combination of a supersonic nozzle and reverse circulation drilling method is likely to be a solution to the heavy dust problems caused by drilling processes. The findings above can also provide a reference to the design of other suction structures.

Acknowledgments

The authors gratefully acknowledge the support of China Geological Survey Project (No. 12120113096900) for this work. The authors are also grateful to the reviewers for their helpful advices.

Author Contributions

Qilei Yin and Kun Yin proposed this study. Dongyu Wu and Xinxin Zhang performed the numerical simulations. Dongyu Wu, Jingqing Cheng, Dong Ge and Pengfei Zhang conducted the experiments. Dongyu Wu wrote the paper. Kun Yin reviewed and edited the manuscript. All authors read and approved the manuscript.

Conflicts of Interest

The authors declare no conflict of interest.

Nomenclature

Nsquantity of supersonic nozzle
Lslength of divergent section, mm
θthe spray angle, °
Dfflushing nozzle diameter, mm
Dccenter passage diameter, mm
Hcsupersonic nozzle height, mm
ωentrainment ratio
Ksum of the results
SSsum of squares of deviations
dfdegree of freedom
Mmean square

References

  1. Neuman, C.M.; Boulton, J.W.; Sanderson, S. Wind tunnel simulation of environmental controls on fugitive dust emissions from mine tailings. Atmos. Environ. 2009, 43, 520–529. [Google Scholar] [CrossRef]
  2. National Institute of Occupational Safety and Health. NIOSH Alert: Request for Assistance in Preventing Silicosis and Deaths in Rock Drillers; DHHS Publication No. (NIOSH); US Department of Health and Human Services, Public Health Service, Service, CDC, NIOSH: Cincinnati, OH, USA, 1992; pp. 92–107.
  3. Fan, S.; Wong, Y.; Shen, L.; Lu, W.; Wang, T.; Yu, A.; Shen, Q. The effectiveness of Dust Bubbles on dust control in the process of concrete drilling. Saf. Sci. 2012, 50, 1284–1289. [Google Scholar] [CrossRef]
  4. Luo, Y.J.; Peng, J.M.; Li, L.J.; He, J.; Gan, X.; Yin, K. Development of a specially designed drill bit for down-the-hole air hammer to reduce dust production in the drilling process. J. Clean. Prod. 2016, 112, 1040–1048. [Google Scholar] [CrossRef]
  5. Han, S.; Peddieson, J., Jr.; Gregory, D. Ejector primary flow molecular weight effects in an ejector-ram rocket engine. J. Propuls. Power 2002, 18, 592–599. [Google Scholar] [CrossRef]
  6. Ferrari, M.L.; Bernardi, D.; Massardo, A.F. Design and testing of Ejectors for High Temperature Fuel Cell Hybird Systems. J. Fuel Cell Sci. Technol. 2006, 3, 284–291. [Google Scholar] [CrossRef]
  7. Zhou, M.; Wang, X.; Yu, J. Theoretical study on a novel dual-nozzle ejector enhanced refrigeration cycle for household refrigerator-freezers. Energy Convers. Manag. 2013, 73, 278–284. [Google Scholar] [CrossRef]
  8. Alimohammadi, S.; Persoons, T.; Murray, D.B.; Tehrani, M.S.; Farhanieh, B.; Koehler, J. A Validated Numerical-Experimental Design Methodology for a Movable Supersonic Ejector Compressor for Waste-Heat Recovery. J. Therm. Sci. Eng. Appl. 2013, 6, 021001. [Google Scholar] [CrossRef]
  9. Wang, M.; Wang, J.; Zhao, P.; Dai, Y. Multi-objective optimization of a combined cooling, heating and power system driven by solar energy. Energy Convers. Manag. 2015, 89, 289–297. [Google Scholar] [CrossRef]
  10. Timan, T.G.; Paterson, R.W.; Presz, W.M., Jr. Supersonic nozzle mixer ejector. J. Propuls. Power 1992, 8, 513–519. [Google Scholar]
  11. Kong, F.; Jin, Y.; Setoguchi, T.; Kim, H.D. Numerical analysis of Chevron nozzle effects on performance of the supersonic ejector-diffuser system. J. Therm. Sci. 2013, 22, 459–466. [Google Scholar] [CrossRef]
  12. Rao, S.M.V.; Jagadeesh, G. Novel supersonic nozzles for mixing enhancement in supersonic ejectors. Appl. Therm. Eng. 2014, 71, 62–71. [Google Scholar] [CrossRef]
  13. Jia, Y.; Wenjian, C. Area ratio effects to the performance of air-cooled ejector refrigeration cycle with R134a refrigerant. Energy Convers. Manag. 2012, 53, 240–246. [Google Scholar] [CrossRef]
  14. Eames, I.W.; Ablwaifa, A.E.; Petrenko, V. Results of an experimental study of an advanced jet-pump refrigerator operating with R245fa. Appl. Therm. Eng. 2007, 27, 2833–2840. [Google Scholar] [CrossRef]
  15. Varga, S.; Oliveira, A.C.; Diaconu, B. Influence of geometrical factors on steam ejector performance—A numerical assessment. Int. J. Refrig. 2009, 32, 1694–1701. [Google Scholar] [CrossRef]
  16. Rusly, E.; Aye, L.; Charters, W.; Ooi, A. CFD analysis of ejector in a combined ejector cooling system. Int. J. Refrig. 2005, 28, 1092–1101. [Google Scholar] [CrossRef]
  17. Keenan, J.; Neumann, E. A simple air ejector. ASME J. Appl. Mech. 1942, 64, 75–82. [Google Scholar]
  18. Keenan, J.; Neumann, E.; Lustwerk, F. An investigation of ejector design by analysis and experiment. ASME J. Appl. Mech. 1950, 72, 299–309. [Google Scholar]
  19. Huang, B.; Chang, J.; Wang, C.; Petrenko, V. A 1-D analysis of ejector performance. Int. J. Refrig. 1999, 22, 354–364. [Google Scholar] [CrossRef]
  20. Zhu, Y.; Cai, W.; Wen, C.; Li, Y. Shock circle model for ejector performance evaluation. Energy Convers. Manag. 2007, 48, 2533–2541. [Google Scholar] [CrossRef]
  21. Bartosiewicz, Y.; Aidoun, Z.; Desevaux, P.; Mercadier, Y. Numerical and experimental investigations on supersonic ejectors. Int. J. Heat Fluid Flow 2005, 26, 56–70. [Google Scholar] [CrossRef]
  22. Pianthong, K.; Seehanam, W.; Behnia, M.; Sriveerakul, T.; Aphornratana, S. Investigation and improvement of ejector refrigeration system using computational fluid dynamics technique. Energy Convers. Manag. 2007, 48, 2556–2564. [Google Scholar] [CrossRef]
  23. Hakkaki-Fard, A.; Aidoun, Z.; Ouzzane, M. A computational methodology for ejector design and performance maximisation. Energy Convers. Manag. 2015, 105, 1291–1302. [Google Scholar] [CrossRef]
  24. Chong, D.; Hu, M.; Chen, W.; Wang, J.; Liu, J.; Yan, J. Experimental and numerical analysis of supersonic air ejector. Appl. Energy 2014, 130, 679–684. [Google Scholar] [CrossRef]
  25. Dvorak, V.; Safarik, P. Transonic Instability in Entrance Part of Mixing Chamber of High-Speed Ejector. J. Therm. Sci. 2005, 14, 258–264. [Google Scholar] [CrossRef]
  26. Sugiyama, H.; Tsujiguchi, Y.; Honma, T. Structure and oscillation phenomena of pseudo-shock waves in a straight square duct at Mach 2 and 4. In Proceedings of the 15th AIAA International Space Planes and Hypersonic Systems and Technologies Conference, Dayton, OH, USA, 28 April–1 May 2008. AIAA-2008-2646.
  27. Zhu, Y.; Jiang, P. Experimental and numerical investigation of the effect of shock wave characteristics on the ejector performance. Int. J. Refrig. 2014, 40, 31–42. [Google Scholar] [CrossRef]
  28. Zhu, Y.; Jiang, P. Experimental and analytical studies on the shock wave length in convergent and convergent-divergent nozzle ejectors. Energy Convers. Manag. 2014, 88, 907–914. [Google Scholar] [CrossRef]
  29. Tabernero, I.; Lamikiz, A.; Ukar, E.; de Lacalle, L.N.L.; Angulo, C.; Urbikain, G. Numerical simulation and experimental validation of powder flux distribution in coaxial laser cladding. J. Mater. Process. Technol. 2010, 210, 2125–2134. [Google Scholar] [CrossRef]
  30. Besagni, G.; Mereu, R.; Chiesa, P.; Inzoli, F. An Integrated Lumped Parameter-CFD approach for off-design ejector performance evaluation. Energy Convers. Manag. 2015, 105, 697–715. [Google Scholar] [CrossRef]
  31. Sung, H.J.; Sung, H.P.; Jeong, W.H.; Chang, H.L.; Hyung, J.K. Factors of Nozzle Design Affecting on Supersonic Flow in Cold Spray Process. Mater. Sci. Forum 2006, 510, 1046–1049. [Google Scholar]
Figure 1. Schematic of the reverse-circulation drilling method.
Applsci 07 00005 g001
Figure 2. Reverse-circulation drilling apparatus based on supersonic nozzle. 1. Air outlet; 2. Top joint; 3. Center passage; 4. Seal ring; 5. Supersonic nozzle; 6. Outer shell; 7.Flushing nozzle; 8. Bit crown; 9. Air vent; 10. Work bench; 11. Air inlete.
Applsci 07 00005 g002
Figure 3. Schematic of the Schlieren system.
Applsci 07 00005 g003
Figure 4. Suction performance of the reverse circulation apparatus.
Applsci 07 00005 g004
Figure 5. Distribution of static pressure near the wall along the axial direction of the center passage.
Applsci 07 00005 g005
Figure 6. Comparison of predicted results and experimental data for ω with different Ls.
Applsci 07 00005 g006
Figure 7. Visualization of the streamlines inside the reverse-circulation bit: (a) Ls = 13 mm; (b) Ls = 25 mm; and (c) Ls = 37 mm.
Applsci 07 00005 g007
Figure 8. Comparison of the predicted results and experimental data for ω with different θ.
Applsci 07 00005 g008
Figure 9. Schematic view within the reverse-circulation bit based on the contours of the Mach number: (a) θ = 24°; (b) θ = 32°; and (c) θ = 48°.
Applsci 07 00005 g009aApplsci 07 00005 g009b
Figure 10. Comparison of predicted results and experimental data for ω with different Dc.
Applsci 07 00005 g010
Figure 11. Comparison of predicted results and experimental data for ω with different Df.
Applsci 07 00005 g011
Figure 12. Schlieren photographs of the shock structures at nozzle outlet: (a) Ls = 13 mm; (b) Ls = 25 mm; (c) Ls = 37 mm; (d) θ = 24°; (e) θ = 36°; and (f) θ = 48°.
Applsci 07 00005 g012
Table 1. Factors and levels for L27 (313) orthogonal array.
FactorLevel 1Level 2Level 3
Ns (mm)456
Df (mm)468
Ls (mm)132537
θ (°)243240
Hc (mm)186198210
Dc (mm)564432
Table 2. Design matrix based on the L27 (313) array and the experimental results.
Exp. NumberNsDf(Ns × Df) 1(Ns × Df) 2Ls(Ns × Ls) 1(Ns × Ls) 1θHcDcω
111111111110.7551
211112222220.6238
311113333330.0238
412221112230.3554
512222223310.4100
612223331120.5123
713331113320.2500
813332221130.0762
91333333221-0.0146
1021231232320.2611
1121232313130.1700
1221233121210.6146
1322311233110.7123
1422312311220.4338
152231312233−0.0454
1623121231230.1792
1723122312310.3569
182312312312−0.0815
1931321323230.4054
2031322131310.5654
2131323212120.2985
2232131321320.5369
2332132132130.0115
2432133213210.2446
2533211322110.3823
2633212133220.0538
273321321133−0.1523
K12.9923.7182.6502.7873.8382.4792.7122.2302.8374.027
K22.6013.1722.6073.0022.5322.6532.9223.5212.8962.889
K32.3461.0502.6822.1501.402.8072.3052.1882.2061.024
Table 3. Results of variance analysis.
Source of VarianceSSdfMSF
Df0.44120.22114.73
Ls0.23220.1167.733
θ0.12820.0644.267
Dc0.51120.25517.00
Error0.273180.015-

