1. Introduction
Masonry has been used as a common building material worldwide for many centuries. Masonry is a composite of block units bonded together with mortar. The most effective use of masonry building can be found in load-bearing structures. The manufacturing of masonry units consumes significant amounts of resources and energy. This has added considerable pressure on the construction industry to reduce energy consumption associated with masonry production. Accordingly, many developed countries applied the energy conservation concept in the building technology. This concept can be achieved by introducing alternative building materials that have a low impact on the environment. The use of thermal insulation materials in the production of masonry is one of the most effective ways for green building technology [
1,
2].
A number of studies were carried out in this area, and it is thought that there are many parameters which influence the thickness of an insulator, such as building type, shape, construction materials, insulation materials, and costs [
3,
4,
5,
6]. In general, external insulation methods are common practice around the world. However, use of insulation blocks composed of expanded polystyrene (EPS) foam, which are used to replace the external insulation of buildings, becomes more popular with the intention of thermal insulation. EPS is composed of small, white, and interconnected beads and offers superior engineering properties such as being lightweight, versatile, energy-efficient, and cost effective. Therefore, it is used as insulation material in buildings and it can be molded into many shapes to fit the required purpose [
7].
Most of the previous researches focus on lightweight concrete masonry units as good thermal insulation materials in buildings. This is because they have a lower thermal conductivity compared with normal-weight concrete. Unfortunately, masonry units made from lightweight concrete have low mechanical properties compared with normal-weight concrete [
8,
9,
10,
11,
12]. Inserting insulation material such as EPS into normal-weight concrete with a special configuration of concrete masonry units (CMUs) leads to an increase in their thermal resistance without affecting their mechanical performance [
13]. Recently, a new type of unreinforced masonry system was developed in Europe for use in the construction of small houses. The developed system has an energy-efficiency enclosure without concern for thermal bridges. This type of unreinforced masonry system offers significant contribution regarding the design and construction of cost-effective buildings in seismic regions [
14].
In this research, a new type of concrete masonry unit has been developed with a self-insulating feature. The developed type of self-insulating concrete masonry unit (SCMU) would be applicable for both low and medium height residential buildings in seismic area zones. The main objective of this study was to investigate the mechanical properties, namely, compression strength and shear strength, of the proposed SCMUs. The second objective of this study was to develop numerical models to predict the behavior of grouted specimens using a simplified micro-modeling technique. The successful use of SCMUs in the construction industry can have a potentially significant impact on the sustainability of masonry structures.
2. Experimental Program
A comprehensive testing program was carried out to determine the compressive strength and shear strength of masonry wall assemblages. A total of 12 full-grouted wall assemblages were constructed with a new type of SCMU. Six specimens (Nanjing Shihao Co., Ltd., Nanjing, China) were tested for compression strength, whereas the remaining specimens were tested for shear strength (triplet test). It should be highlighted that all specimens were prepared with the same SCMUs, mortar, and grout properties.
2.1. Materials
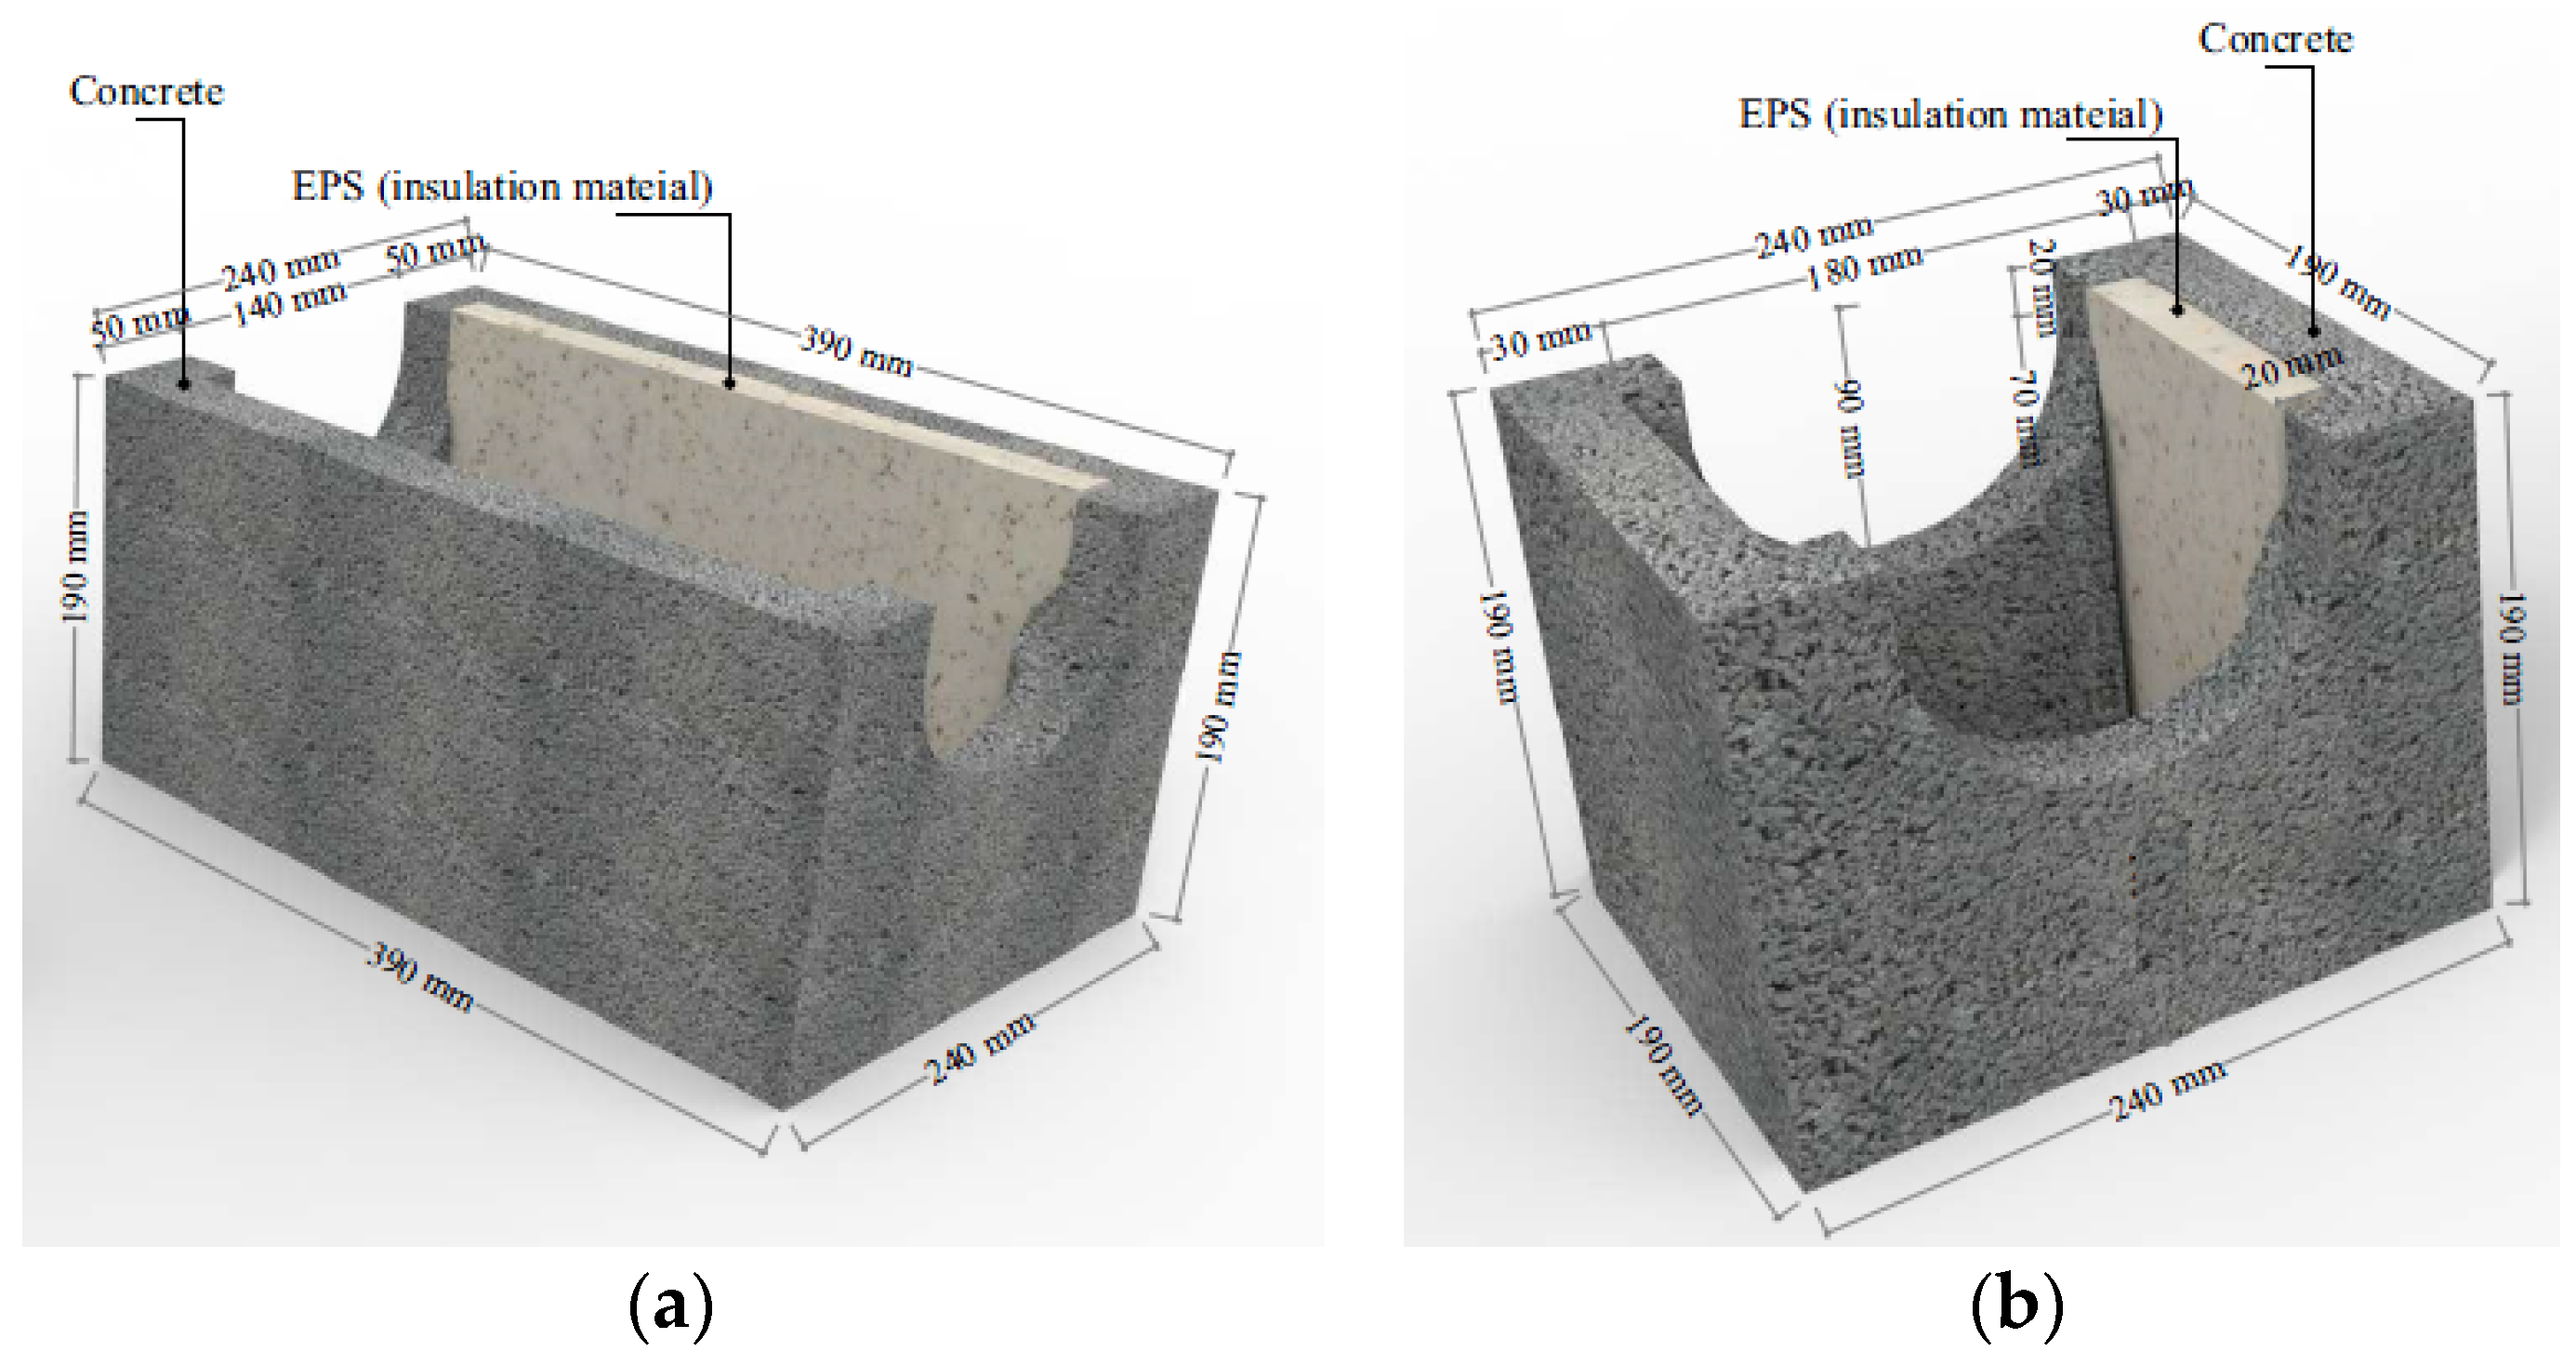
The general dimensions of the new type of self-insulating concrete masonry unit used in this study are 390 mm length, 190 mm height, and 240 mm width for block units and 190 mm length with the same height and width for half-block units as shown in
Figure 1. The SCMU has one core with circular voids at the ends and two chambers: (1) an outer chamber with thickness of 20 mm to accommodate insulation, and (2) an inner chamber with thickness of 160 mm to accommodate reinforcing steel with the filling grouting concrete. The face and web shell thickness is 30 mm. After blocks were produced, the insulation material (EPS) with thickness 20 mm was inserted in chamber (1).
Table 1 shows the mechanical and thermal properties of EPS used in this study.
The compressive strength of SCMUs was determined in accordance with The American Society for Testing and Materials (ASTM) C140 [
15] and ASTM C90 [
16]. The test was conducted using universal machine (Jinan Time Shijin Instruments Co., Ltd., Jinan, China) with load capacity of 2000 kN and load rating of 0.05 ± 0.01 N/mm
2/sec. The average compressive strength value of SCMUs was 6.7 N/mm
2. Also, the weights of SCMUs were measured which have an average density value of 1850 kg/m
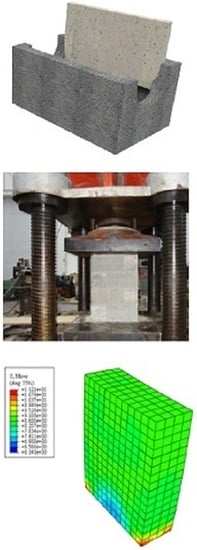
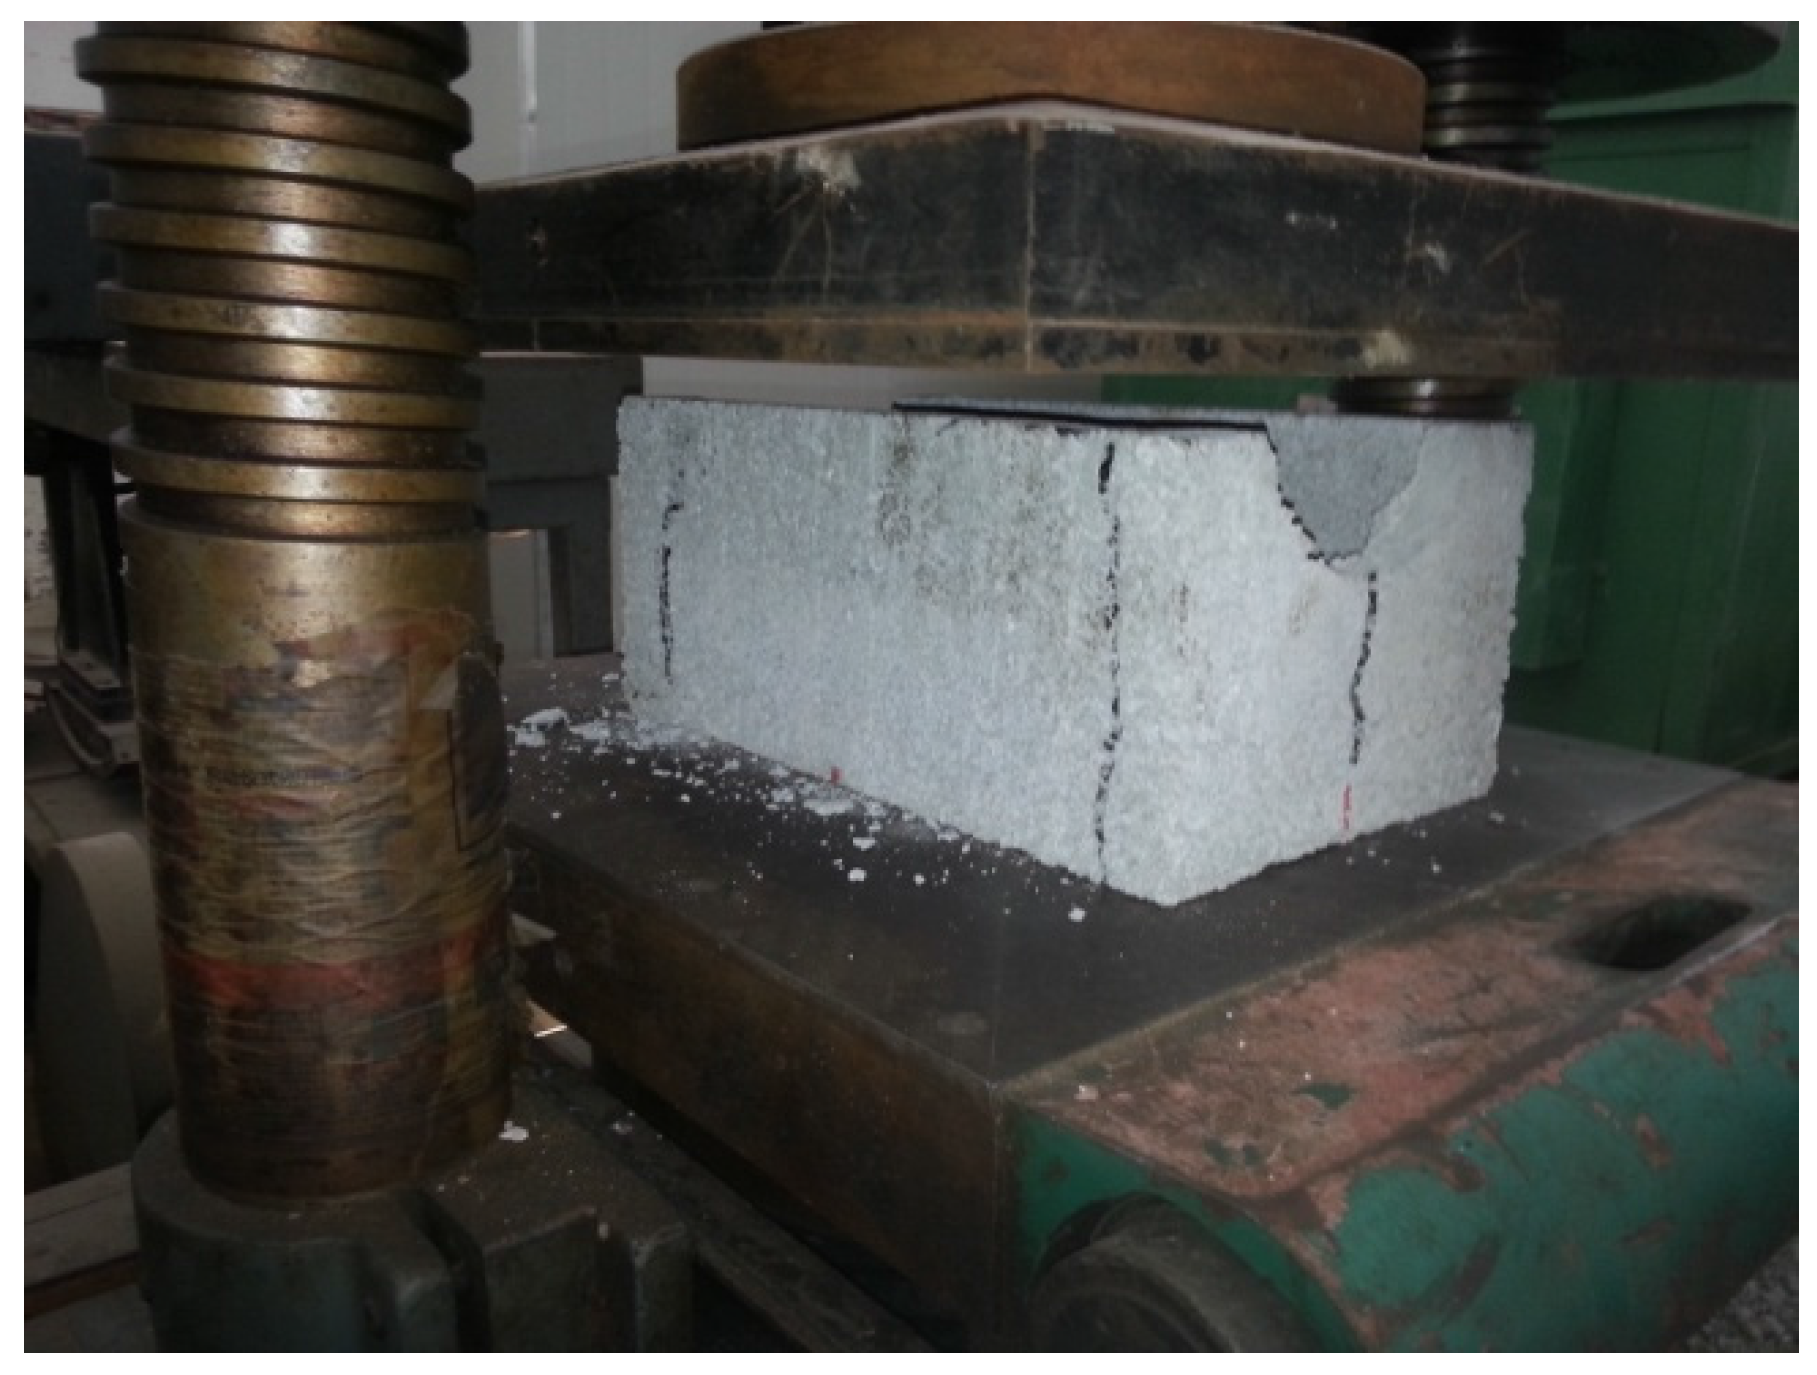
3. The typical mode of failure with face-shell separation was observed during the test for all SCMU specimens as shown in
Figure 2. No cracks were observed during loading of the SCMUs, and the failure was brittle without warning.
Mortar used in this study was Mb15 (GB50003-2010) [
17]. Mortar was composed of cement, sand, lime, and water. The mortar mixtures were prepared according to JGJ/T98-2011 [
18]. Three cubes of 70.7 × 70.7 × 70.7 mm
3 were casted and tested at 28 days of curing time to determine the compressive strength of mortar. The average compressive strength value of the three specimens of mortar was 14.7 N/mm
2.
The grout was used to fill the cores, increasing the effective cross-sectional area of the masonry for load resistance, and permitting the bonding of reinforcing bars to the concrete masonry blocks. Three cubes of 100 × 100 × 100 mm
3 were casted and tested at 28 days of curing time to determine the compressive strength of grout. The grout specimens were tested in accordance with the ordinary concrete mechanical performance test method (GBJ50081-2002) [
19]. The value of the average compressive strength of the three specimens of grout was 24.7 N/mm
2.
2.2. Compressive Strength Test
Six prisms of SCMUs wall assemblages (denoted by PC1–PC6) as illustrated in
Table 2 were prepared according to the procedure specified by the Chinese Masonry Code for compressive strength test [
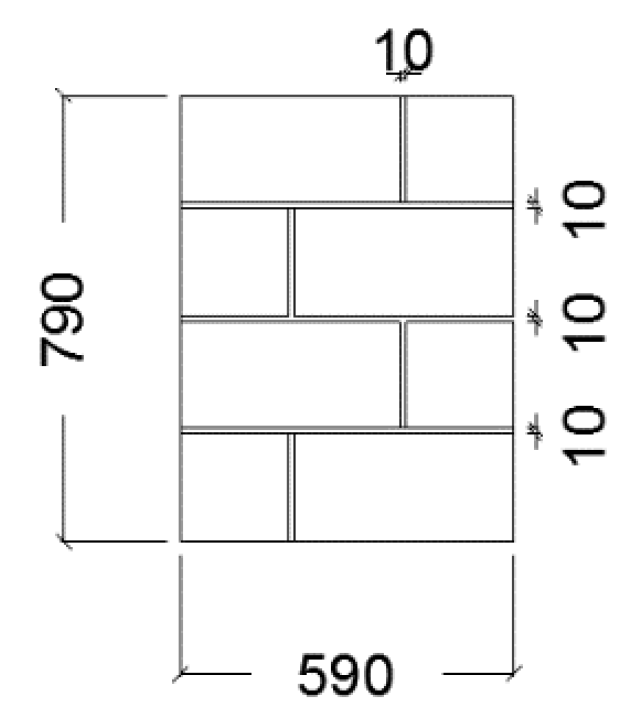
17]. The compressive strength test of masonry prism was conducted on units of dimensions of 590 mm length, 240 mm width, and 790 mm height, as shown in
Figure 3. The masonry prisms were constructed with four courses in running bond pattern. The prisms were fully grouted and wooden forms were used to ensure the proper finishing of the grout at the end of the face-shells. The prisms were cured in standard conditions (22 ± 3 °C and 95% RH) for 28 days. Before testing, the prisms were capped with a 10 mm thick cement mortar to have a uniform bearing surface.
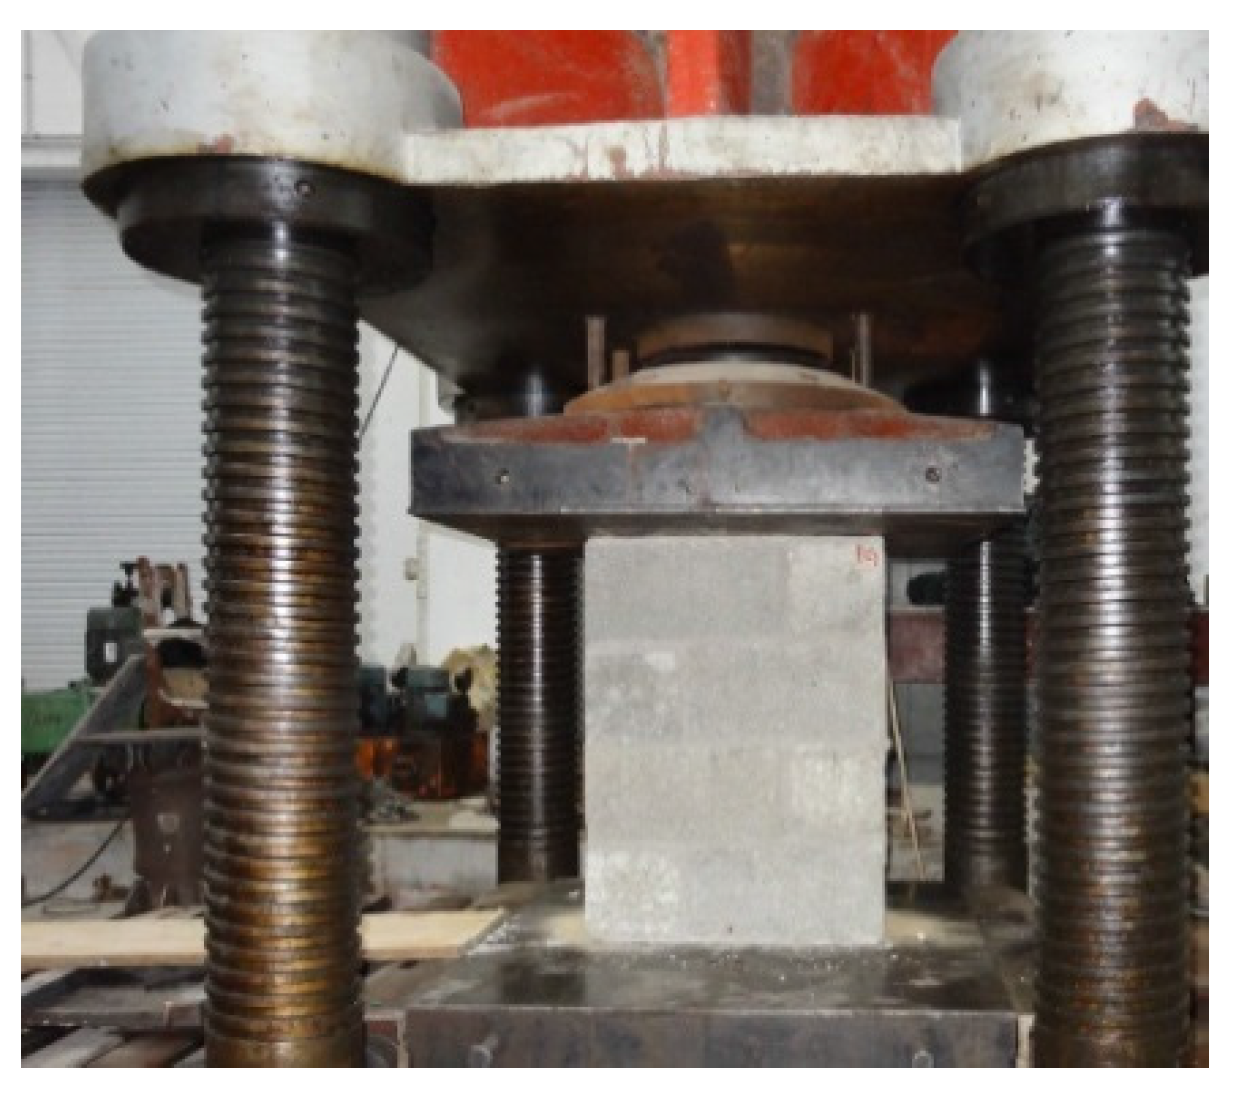
The compressive strength test was performed using a universal machine (Jinan Time Shijin Instruments Co., Ltd., Jinan, China) with capacity of 5000 kN and loading rate of 0.05 ± 0.01 N/mm
2/sec. The prism was placed in the lower plate and then both centroidal axes of the prism and the center of thrust of the machine were aligned. Test setup of compressive strength is shown in
Figure 4.
Table 2 shows the results of compressive strength test of masonry prisms. The results revealed that the average compressive strength and the standard deviation of tested prisms were 9.21 N/mm
2 and 0.4 N/mm
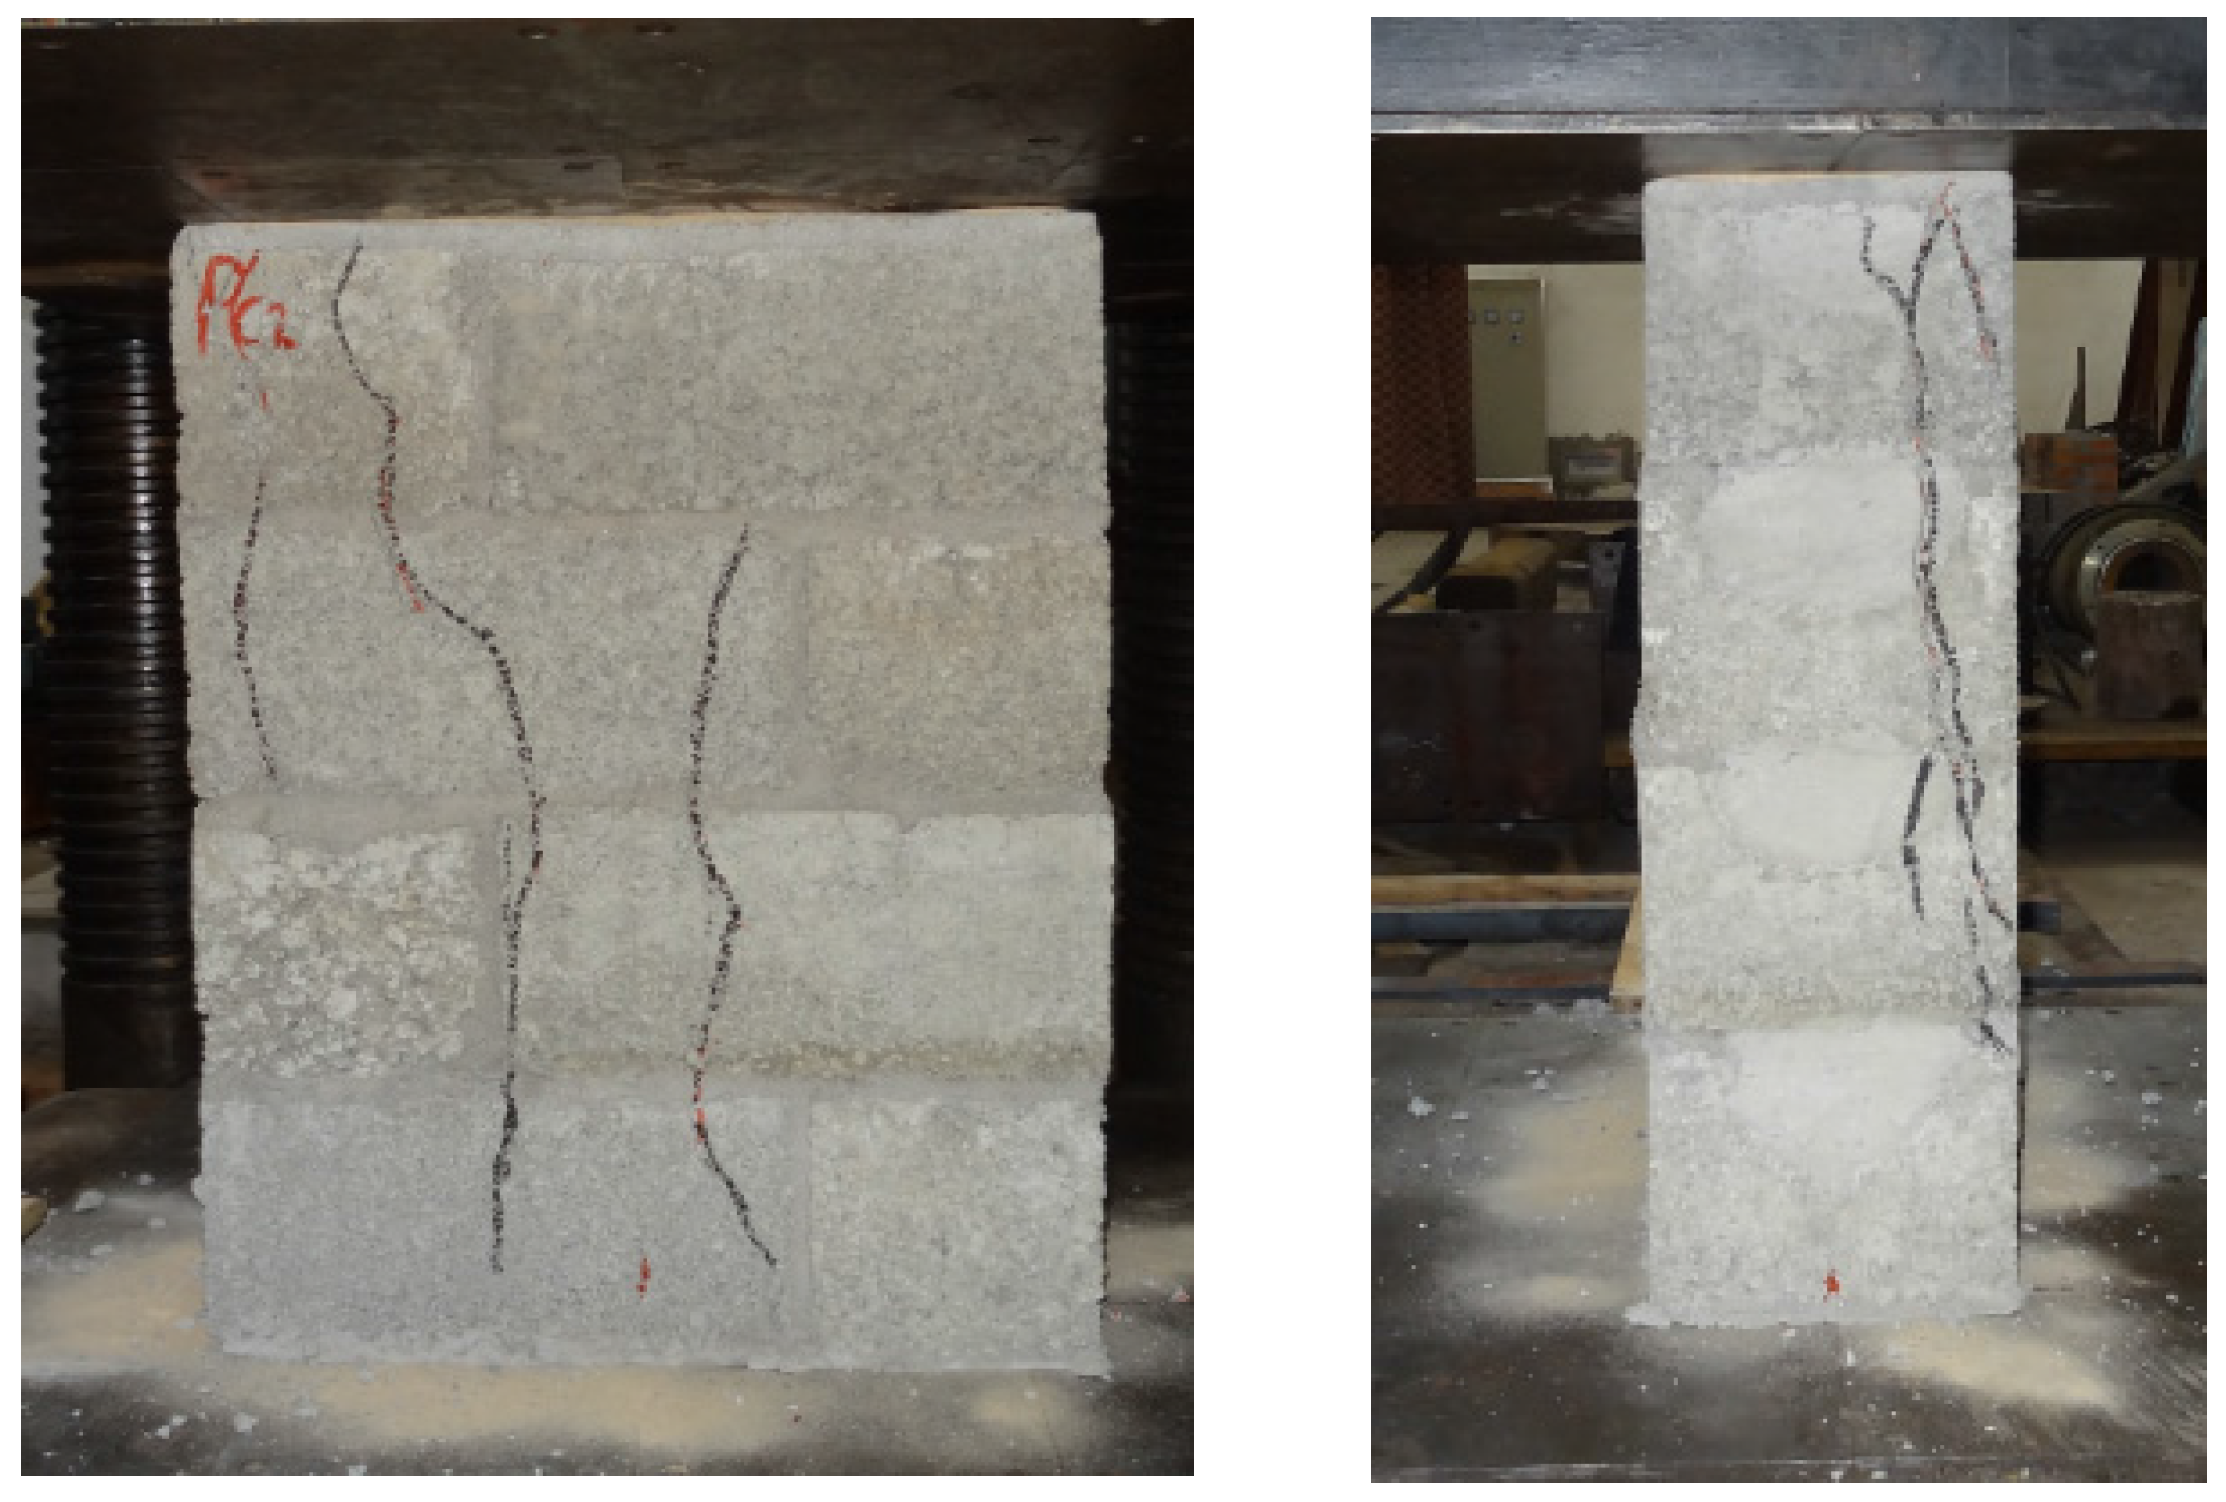
2, respectively. The typical failure pattern observed during the compressive strength test is shown in
Figure 5. It was observed that the prisms failed due to the development of vertical cracks along their height. Apparently, the lateral expansion of the mortar induced high tensile stresses in the blocks, causing them to crack and eventually fail. Generally, the pattern of failure is influenced by the modulus of elasticity of the different materials that made up the masonry system [
20].
2.3. Shear Strength Test
Six masonry prisms of SCMU assemblages (denoted by PS1–PS6), as presented in
Table 3, were prepared according to the procedure specified by the Chinese Masonry Code for shear strength test [
17]. The masonry prism of shear test was 390 mm in length, 240 mm in width, and 590 mm in height, as shown in
Figure 6. The shear prisms were constructed with three courses in running bond pattern. All shear prisms were cured in the standard conditions (22 ± 3 °C and 95% RH) for 28 days. Before testing, the prisms were capped with a 10 mm thick cement mortar to have a uniform bearing surface.
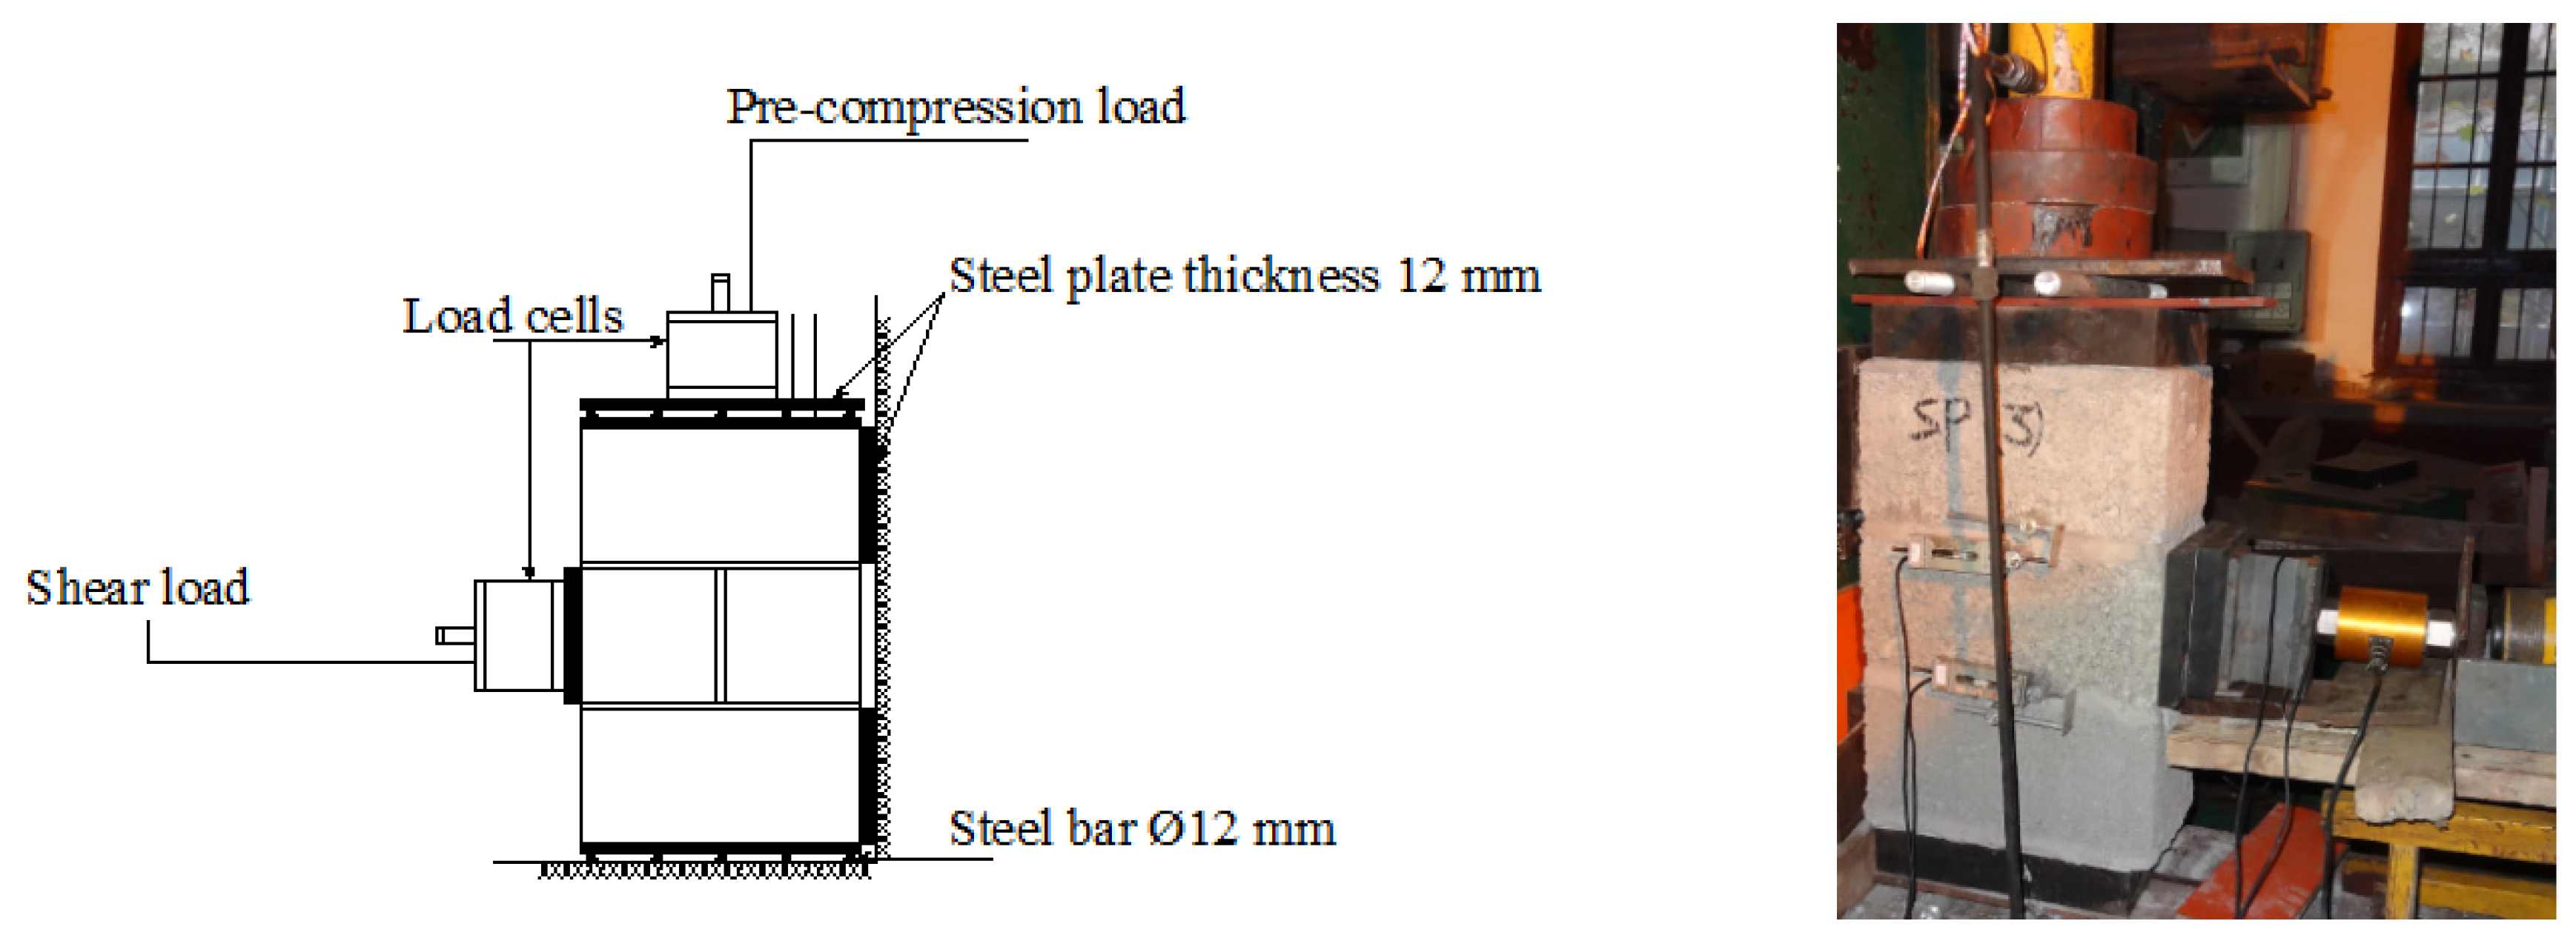
Shear strength test was performed using two load cells. One load cell (Shanghai Huali Sensor Technology Co., Ltd., Shanghai, China) was used to apply a constant vertical precompression load while the second load cell (Shanghai Huali Sensor Technology Co., Ltd., Shanghai, China) was used to apply an increasing horizontal load. Steel plates were installed to ensure a uniform distribution of load and to control the location of supporting points.
Prisms PS1, PS2, and PS3 were tested under precompression of 0.1 N/mm
2, whereas prisms PS4, PS5, and PS6 were tested under precompression of 0.3 N/mm
2. Then the pressures were kept constant while the shear load was applied until the failure of the prism occurred [
21,
22]. Shear load was increased at a rate of 0.1 N/mm
2 per minute.
Four potentiometers (Liyang Instruments Co., Ltd., Liyang, China) (i.e., two at each side) were placed to monitor the slip between the outer and middle units. All measuring devices were connected to a computer (ASUSTeK
® Computer Inc., Taibei, China), which processed the data in real time.
Figure 7 shows the shear strength test setup.
Table 3 shows the results of shear strength test. The influence of the applied level of the pre-compression is clearly visible from
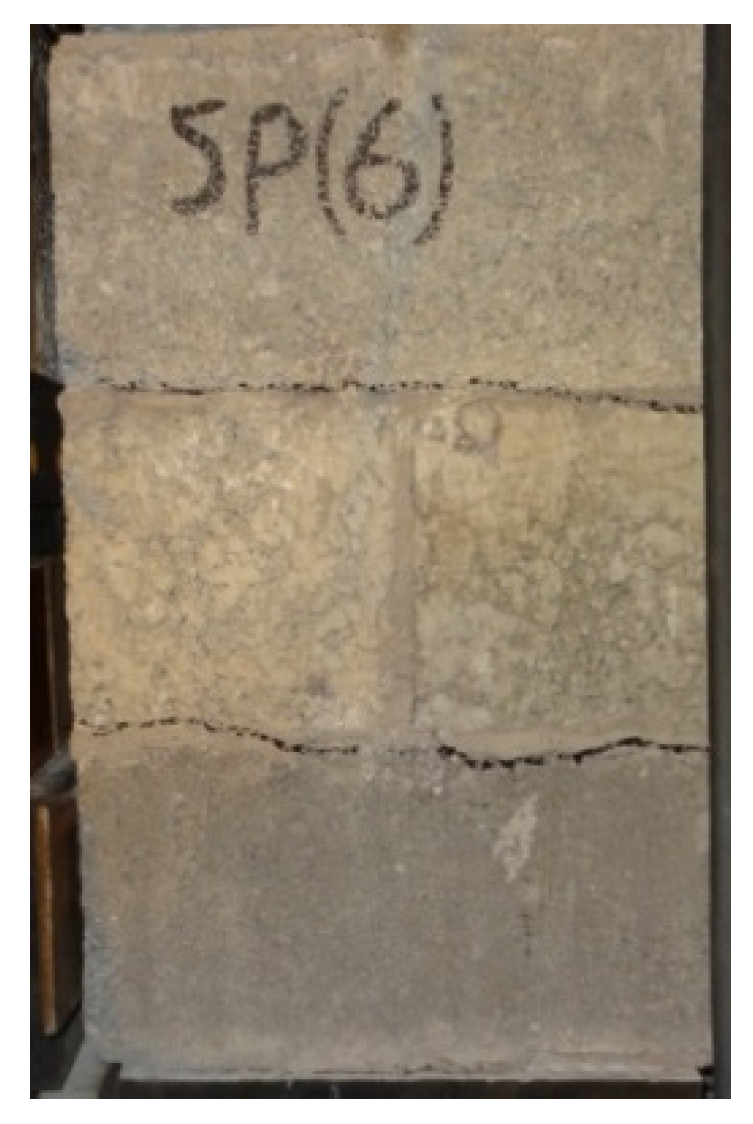
Table 3. The results revealed that the shear resistance increases when increasing the level of pre-compression. The failure occurred at the bed joint for all specimens, as shown in
Figure 8. The failure patterns observed during the tests can be characterized as sliding failure mode. Sliding failure of the prism can be described by the classical Mohr-Coulomb’s failure criterion equation:
where,
c denotes the cohesion,
φ is the angle of internal friction, σ is the normal stress.
Based on the test results presented in
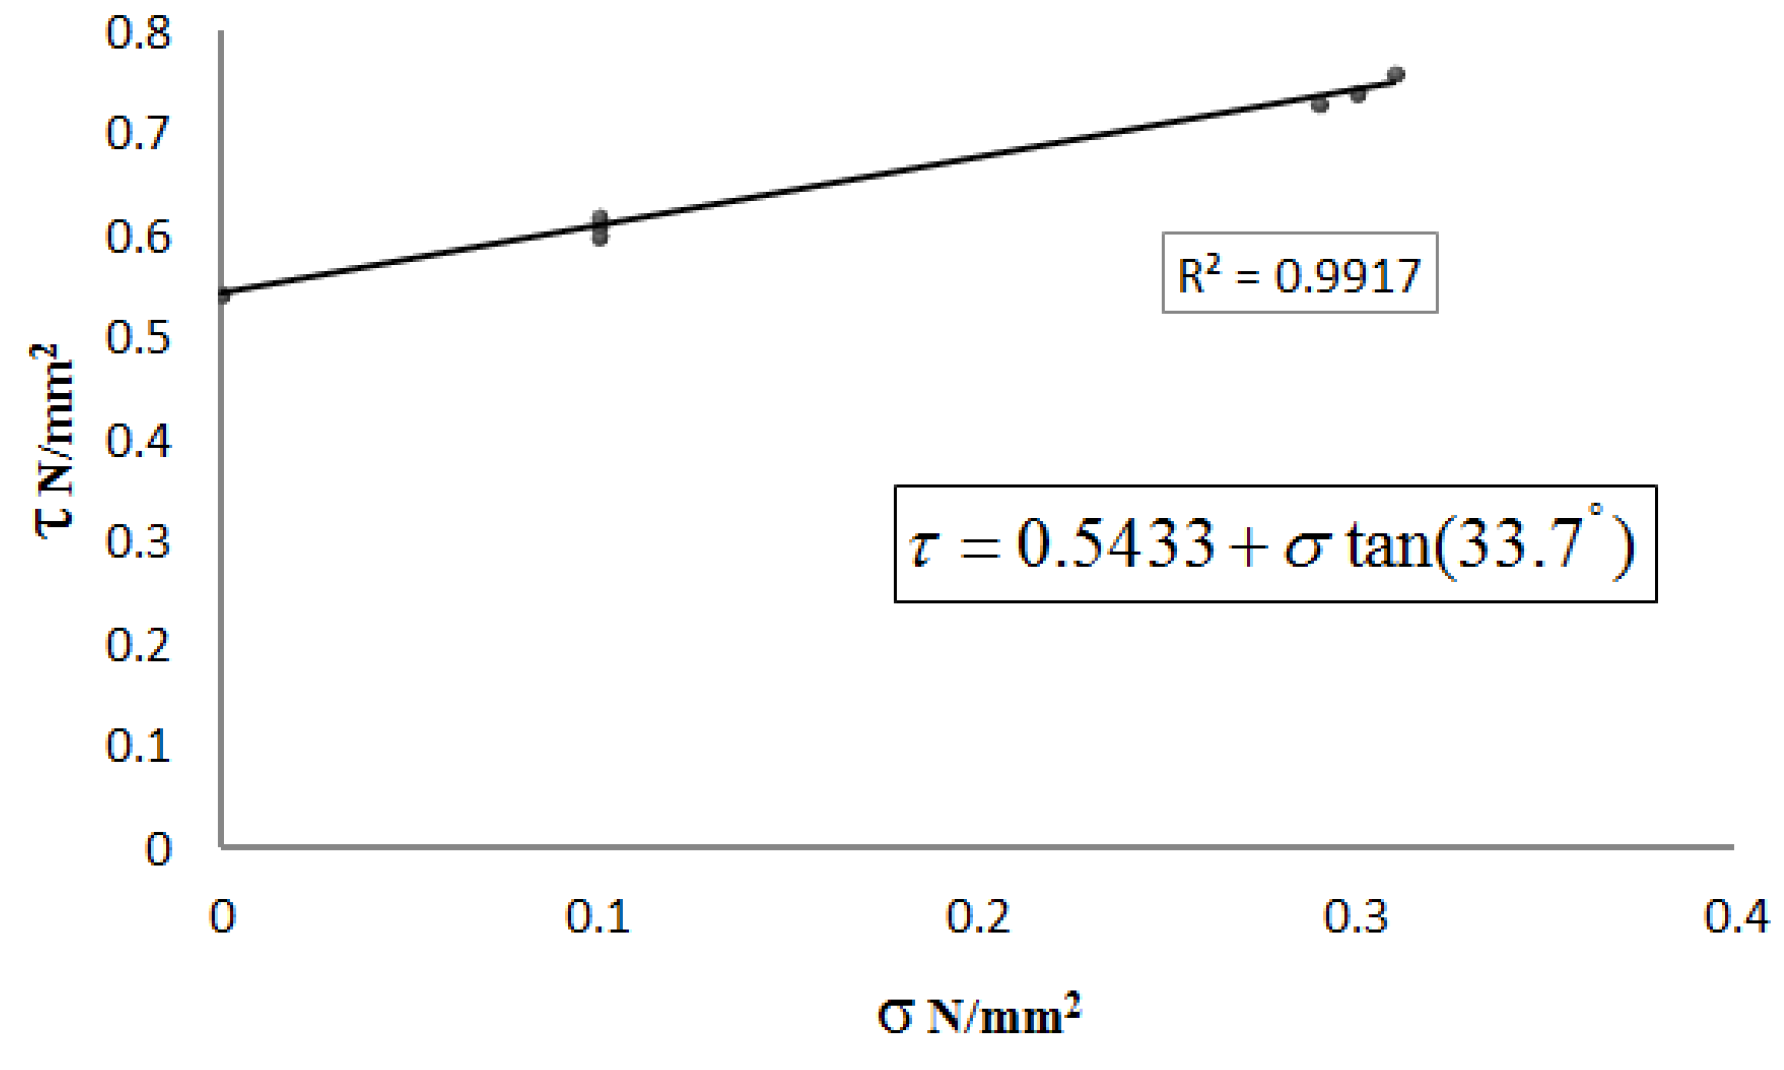
Table 3, the friction coefficient in the bed joint can be calculated based on the levels of compression and shear in the joint once sliding has occurred [
22]. The resulting shear-stress-normal-stress graph is shown in
Figure 9, which has been obtained from a linear regression of points. The average cohesion and friction angle in the bed joints of the SCMU prisms are, respectively, 0.5433 N/mm
2 and 33.7°.
3. Finite Element Modeling
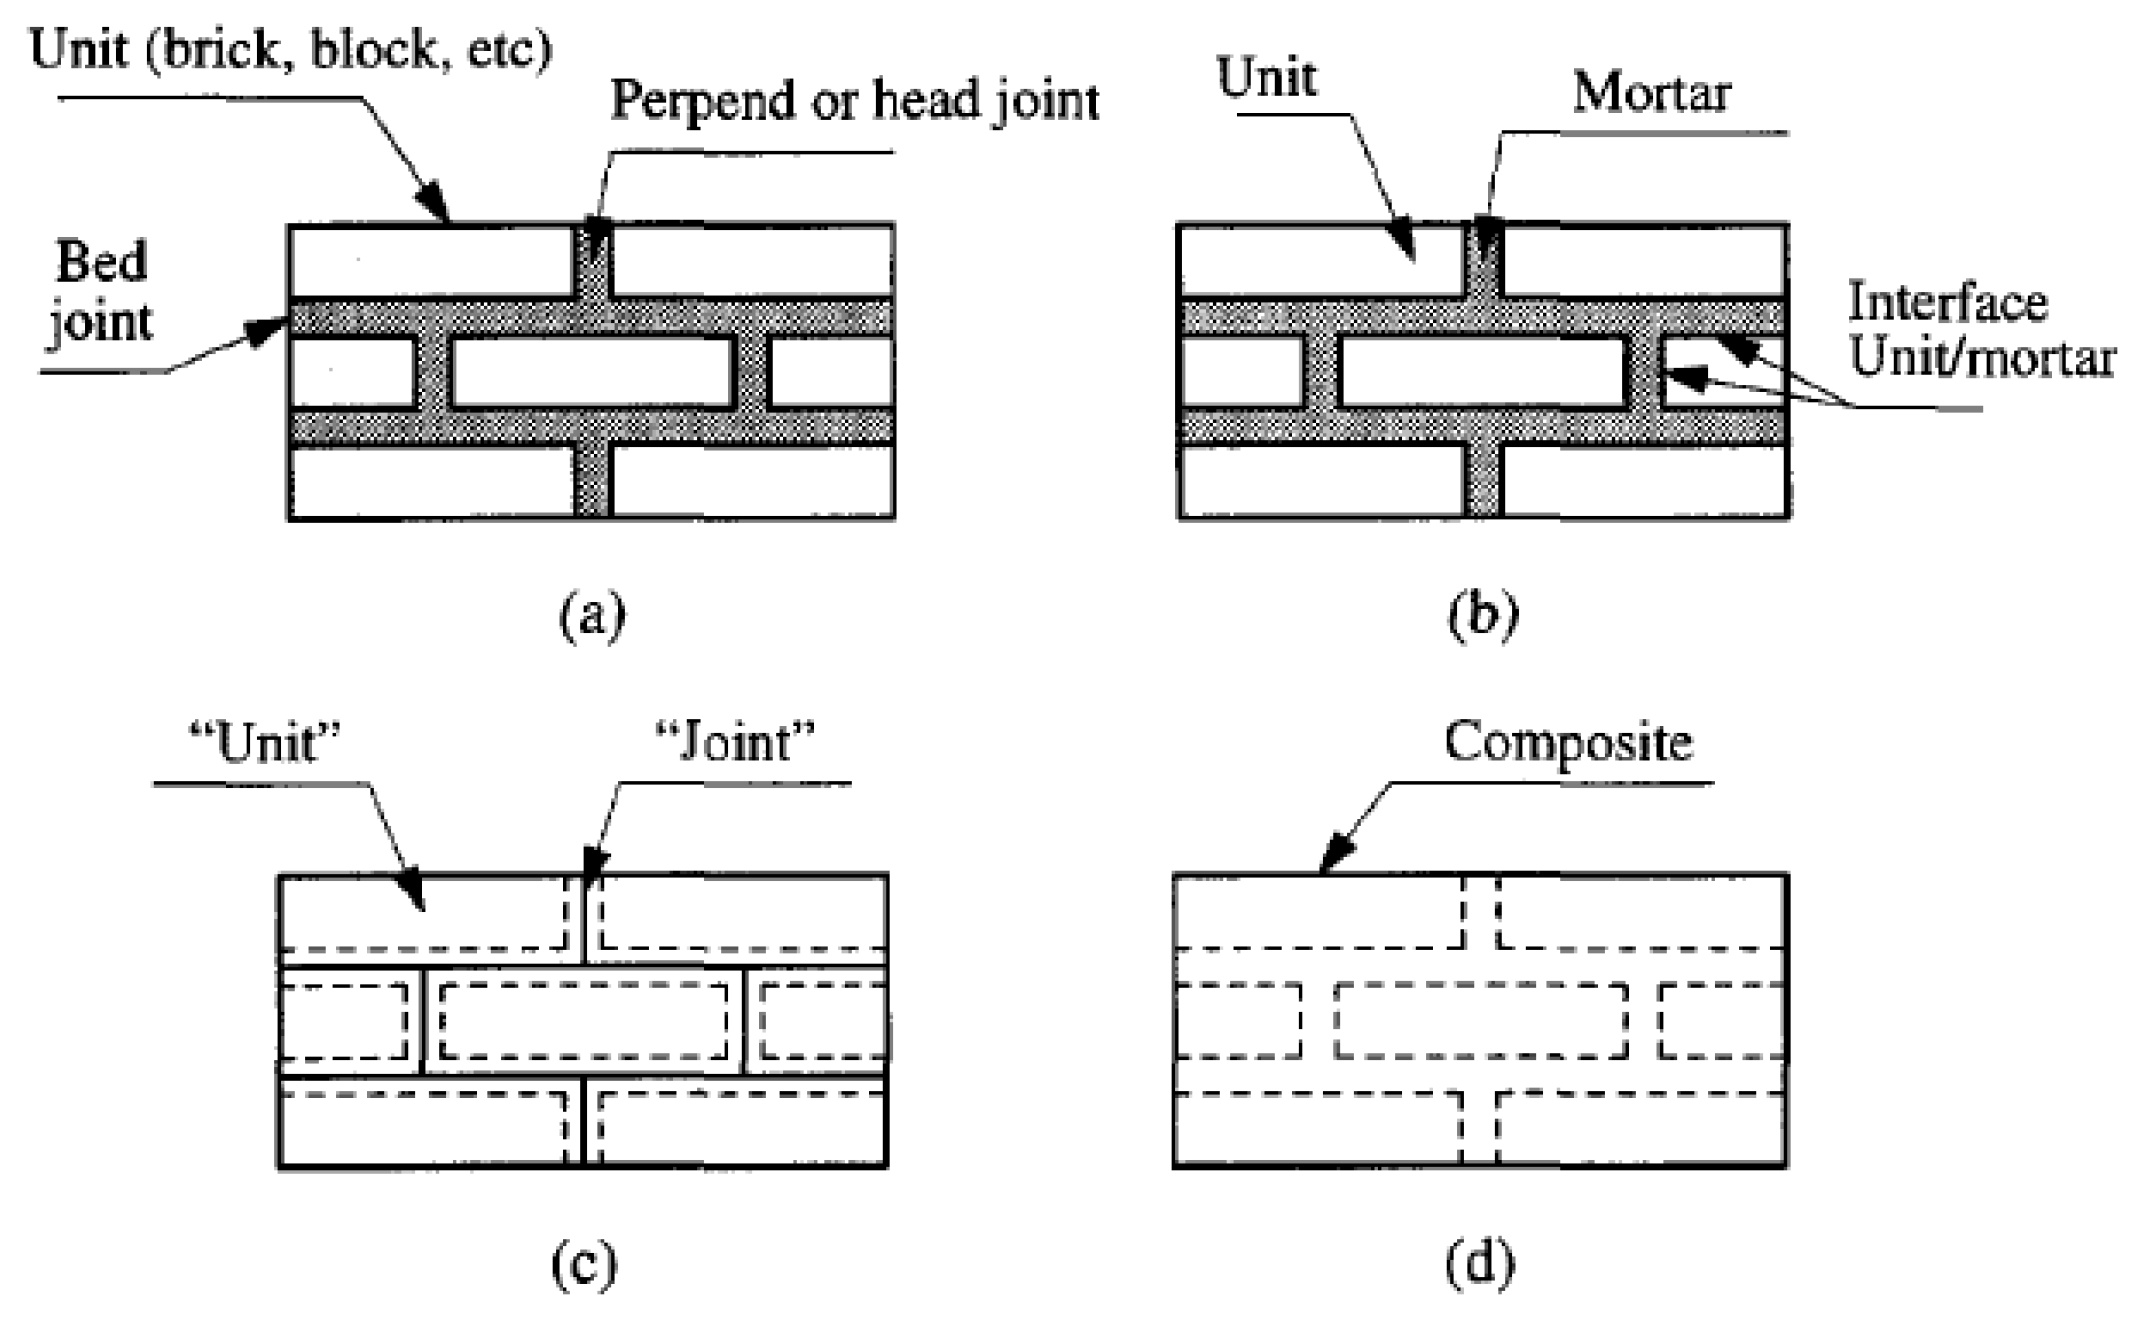
The finite element method (FEM) is one of the powerful tools for modeling a structure with very complicated geometry and materials. There are many strategies, as shown in
Figure 10, to model a masonry structure with FEM, which includes macro- and micro-modeling. The macro-model is based on the assumption of homogenous materials, and the mortar joints and units can be smeared into one isotropic or anisotropic material. This procedure may be preferred for the analysis of large masonry structures due to the reduced time and memory requirements as well as a user-friendly mesh generation. In addition, this type of modeling is most valuable when a compromise between accuracy and efficiency is needed [
23,
24].
More accurate response of a masonry assembly can be deducted by using micro-modeling techniques. In this method, the units and the mortar and unit/mortar interface are represented by continuum and discontinuous elements, respectively. Different properties for both units and mortar were separately applied, and this leads to a realistic response of a masonry assembly with more accurate prediction of its local behavior. Despite these advantages, this approach is uneconomic and inefficient in terms of computational time. To overcome this problem, simplified micro-modeling has been used and, according to pervious research, it can give accurate results with a simple modeling procedure. In this type of modeling, the mortar joints are clamped into the unit/mortar interface as a discontinuous element. Expanded units—up to half of the mortar thickness in horizontal and vertical directions—were simulated to continuum elements. This procedure can successfully predict the shear behavior and crack pattern [
25,
26,
27,
28].
3.1. Constitutive Models
(a) Concrete Damage Plasticity (CDP)
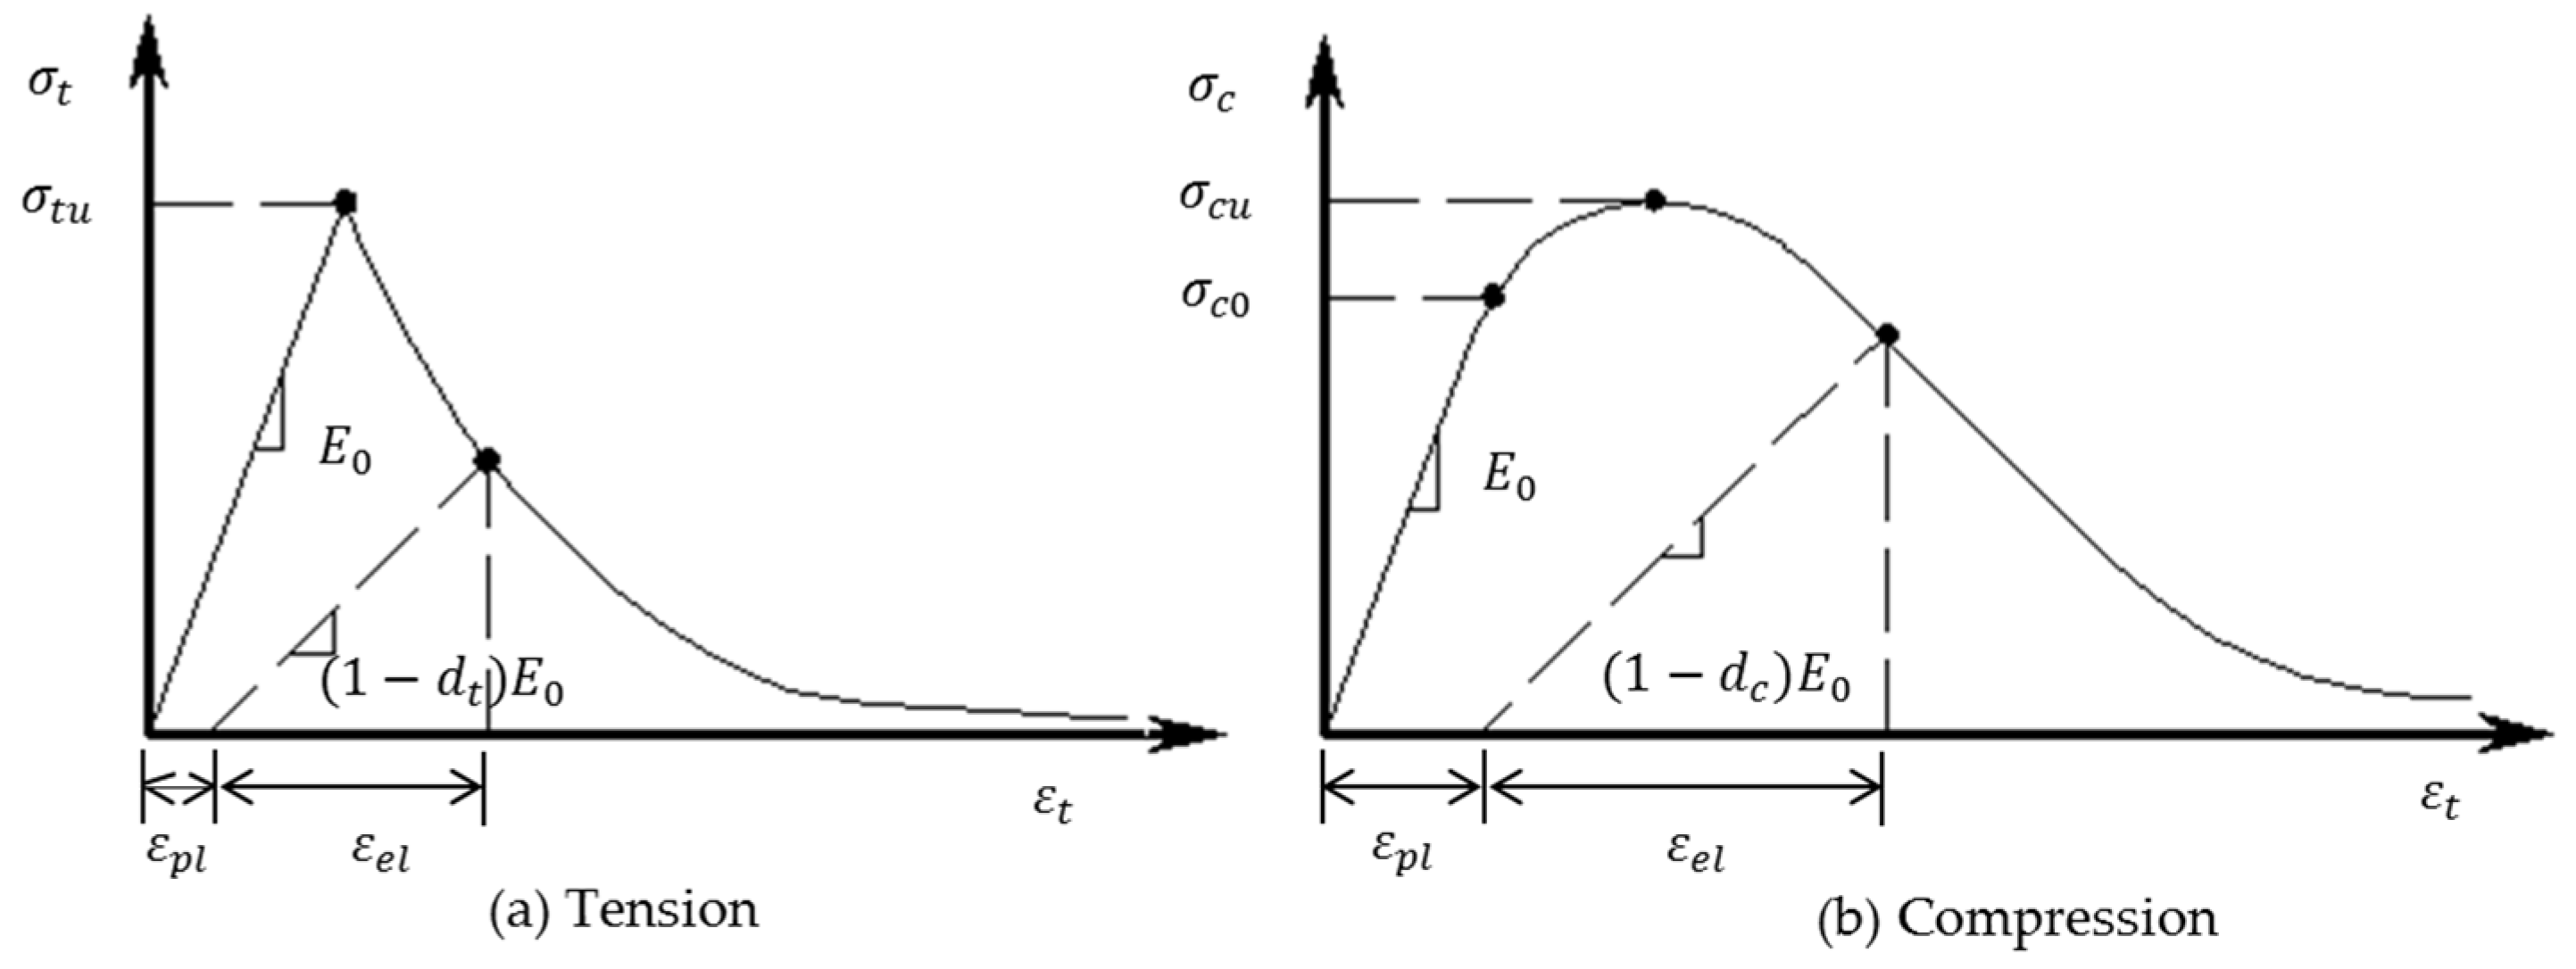
The nonlinear behavior of the masonry can be simulated in Abaqus using the CDP model, which can be used for concrete and other brittle materials [
29]. The failure modes of this model are cracks in tension or crushing in compression. The stress–strain relationship and corresponding damage parameters for the validation models used in this study were based on primary models proposed by Lubliner et al. [
30] and Lee and Fenves [
31]. The uniaxial compressive and tensile response of concrete is described by damage plasticity as shown in
Figure 11.
(b) Cohesive Surface-Based Element
The cohesive interaction is defined as a function of displacement separation between the edges of potential cracks [
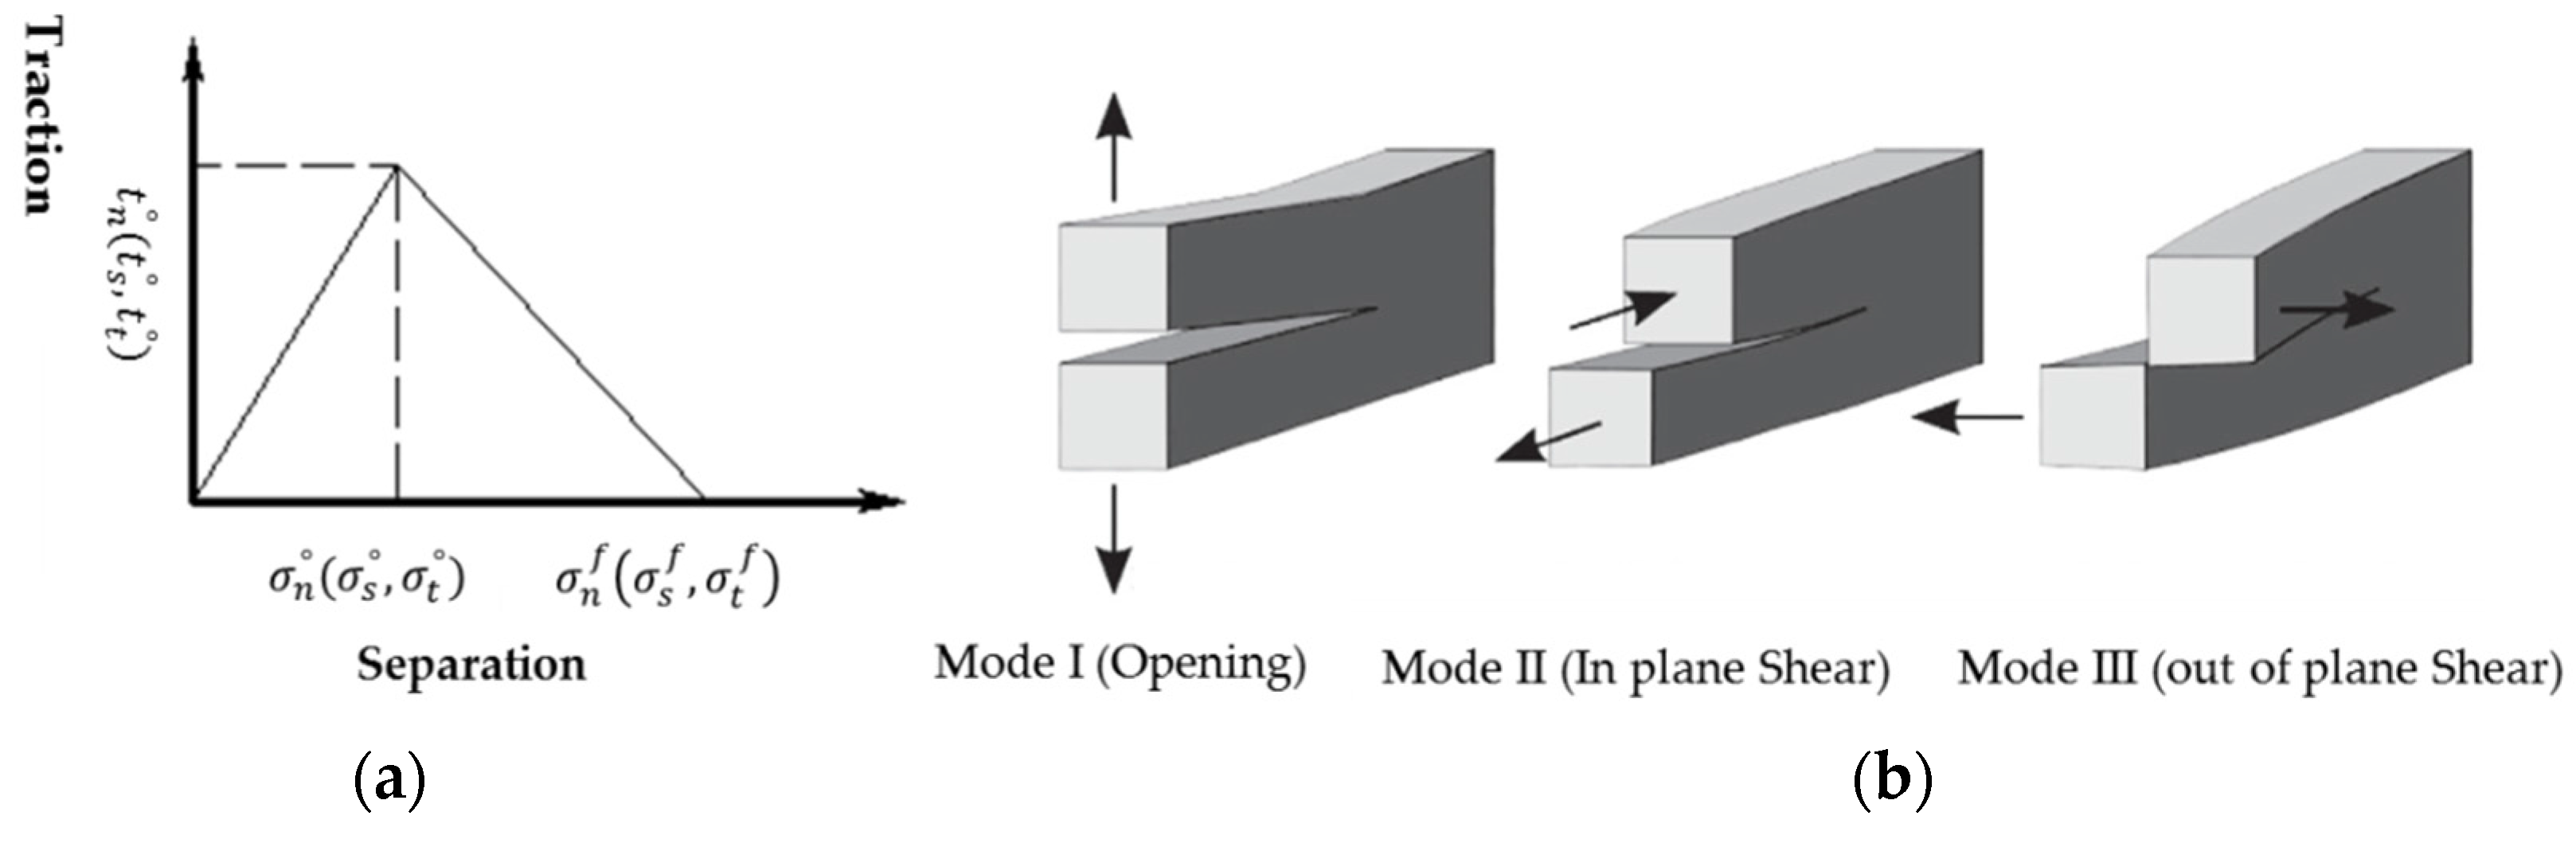
32]. Furthermore, pervious researches have been conducted to study the parameters that affect the cohesive interaction performance for brittle materials. These have concluded that the mechanical behavior of cohesive elements can be defined by three methods: (1) uniaxial stress-based, (2) continuum-based and (3) traction–separation constitutive model. The traction–separation model represents the corresponding initial separation caused by pure normal, in plane, and out plane shear stress as shown in
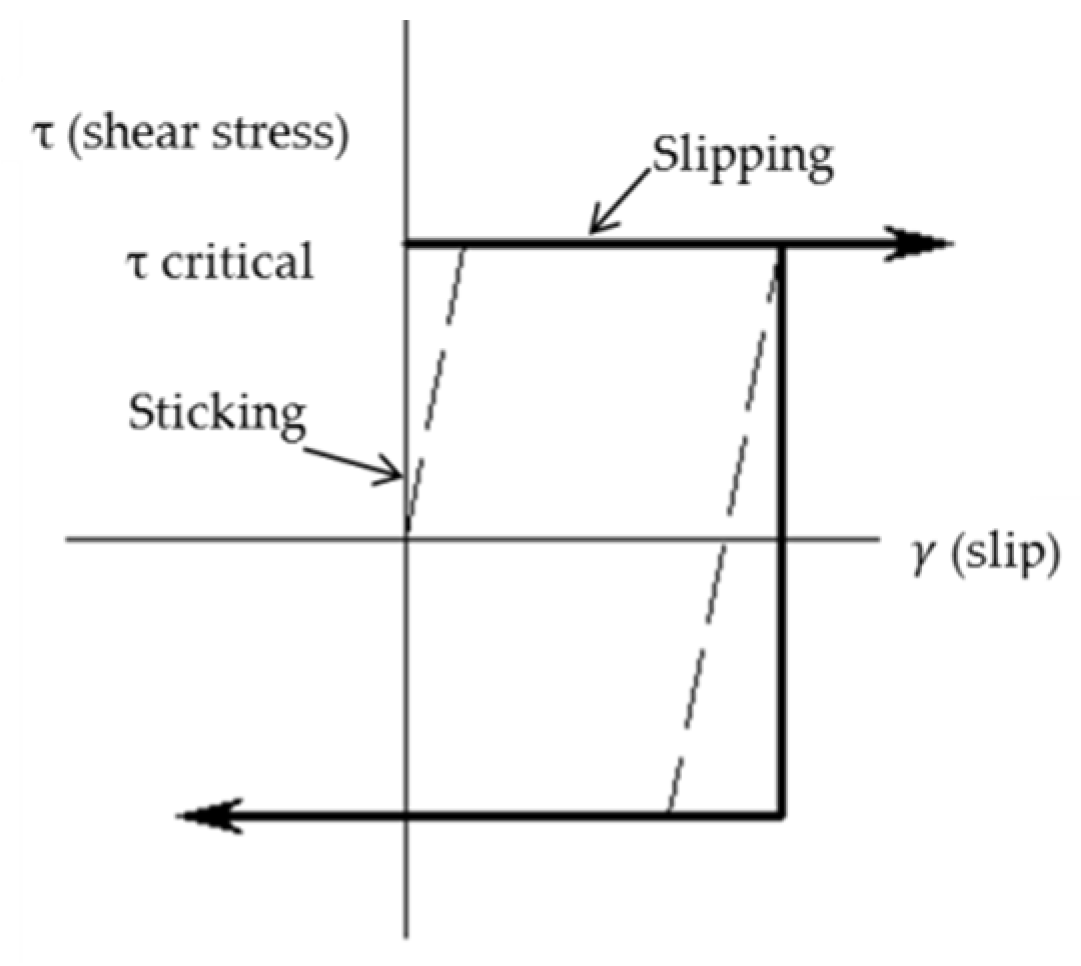
Figure 12. This study takes into consideration the damage evolution which can be specified by either using the post-damage-initiation effective separation at failure or the total fracture energy. Furthermore, Coulomb frictional contact behavior was applied to the current models by introducing a coefficient of friction (μ) which prevents components’ penetration after forming the contact as shown in
Figure 13, especially for the normal behavior of contacts. For this study, surface-to-surface contact was chosen and the contacting properties for the tangential and normal behavior were specified. This type of contact is generally used to describe the behavior of two deformable surfaces connecting together. Also the slip-rate data were specified to define the coefficient of friction [
29,
33].
3.2. FE Model, Results, and Discussion
Three models—compression prism and shear prisms with precompression stress of 0.10 N/mm2 and 0.30 N/mm2—were generated using Abaqus software to simulate the experiments.
3.2.1. Model Inputs
(a) Concrete Damage Plasticity Parameters
The masonry assemblages were modeled according to the materials’ properties in
Table 4. The compression behavior of CDP model was extracted from compression test data for masonry prism.
Table 5 shows the stress–strain and the damage data applied to the models in this study, which were calculated based on set of equations provided by Sinha et al [
34].
(b) Joints Cohesive Behavior Parameters
The most common friction coefficient (
) of concrete masonry is in the range of 0.6–0.8 [
33]. The best fit was obtained when using 0.80 in this study. Cohesive behavior of the bed and vertical joints were defined as shown in
Table 6. However, the average compressive strength of masonry prism of 9.2 N/mm
2 was employed in order to model the normal damage initiation [
33]. Shear (I) presents the in-plane shear, which was determined according to Equation (1) (
Figure 9). It is well known that the shear strength for masonry depends on the mechanical properties of masonry assemblage and the amount of the applied vertical load. This leads to different values of shear strength for the three models as presented in
Table 6. The last parameter of traction–separation model is shear (II) that defines the out-of-plane shear, which was set to zero for all models. Furthermore, the maximum separation and stiffness coefficient specified for shear models only were 1.25 mm and 26 MN/m, respectively. These values were obtained indirectly by trial and error in the calibration process. More tested specimens are needed to specify more accurate values for the maximum separation and stiffness coefficient. The contact was assumed to have a thickness of zero, therefore hard contact was assigned for normal behavior of contact. It is supposed that “hard” contact prevents the penetration of surfaces which can occur in the models.
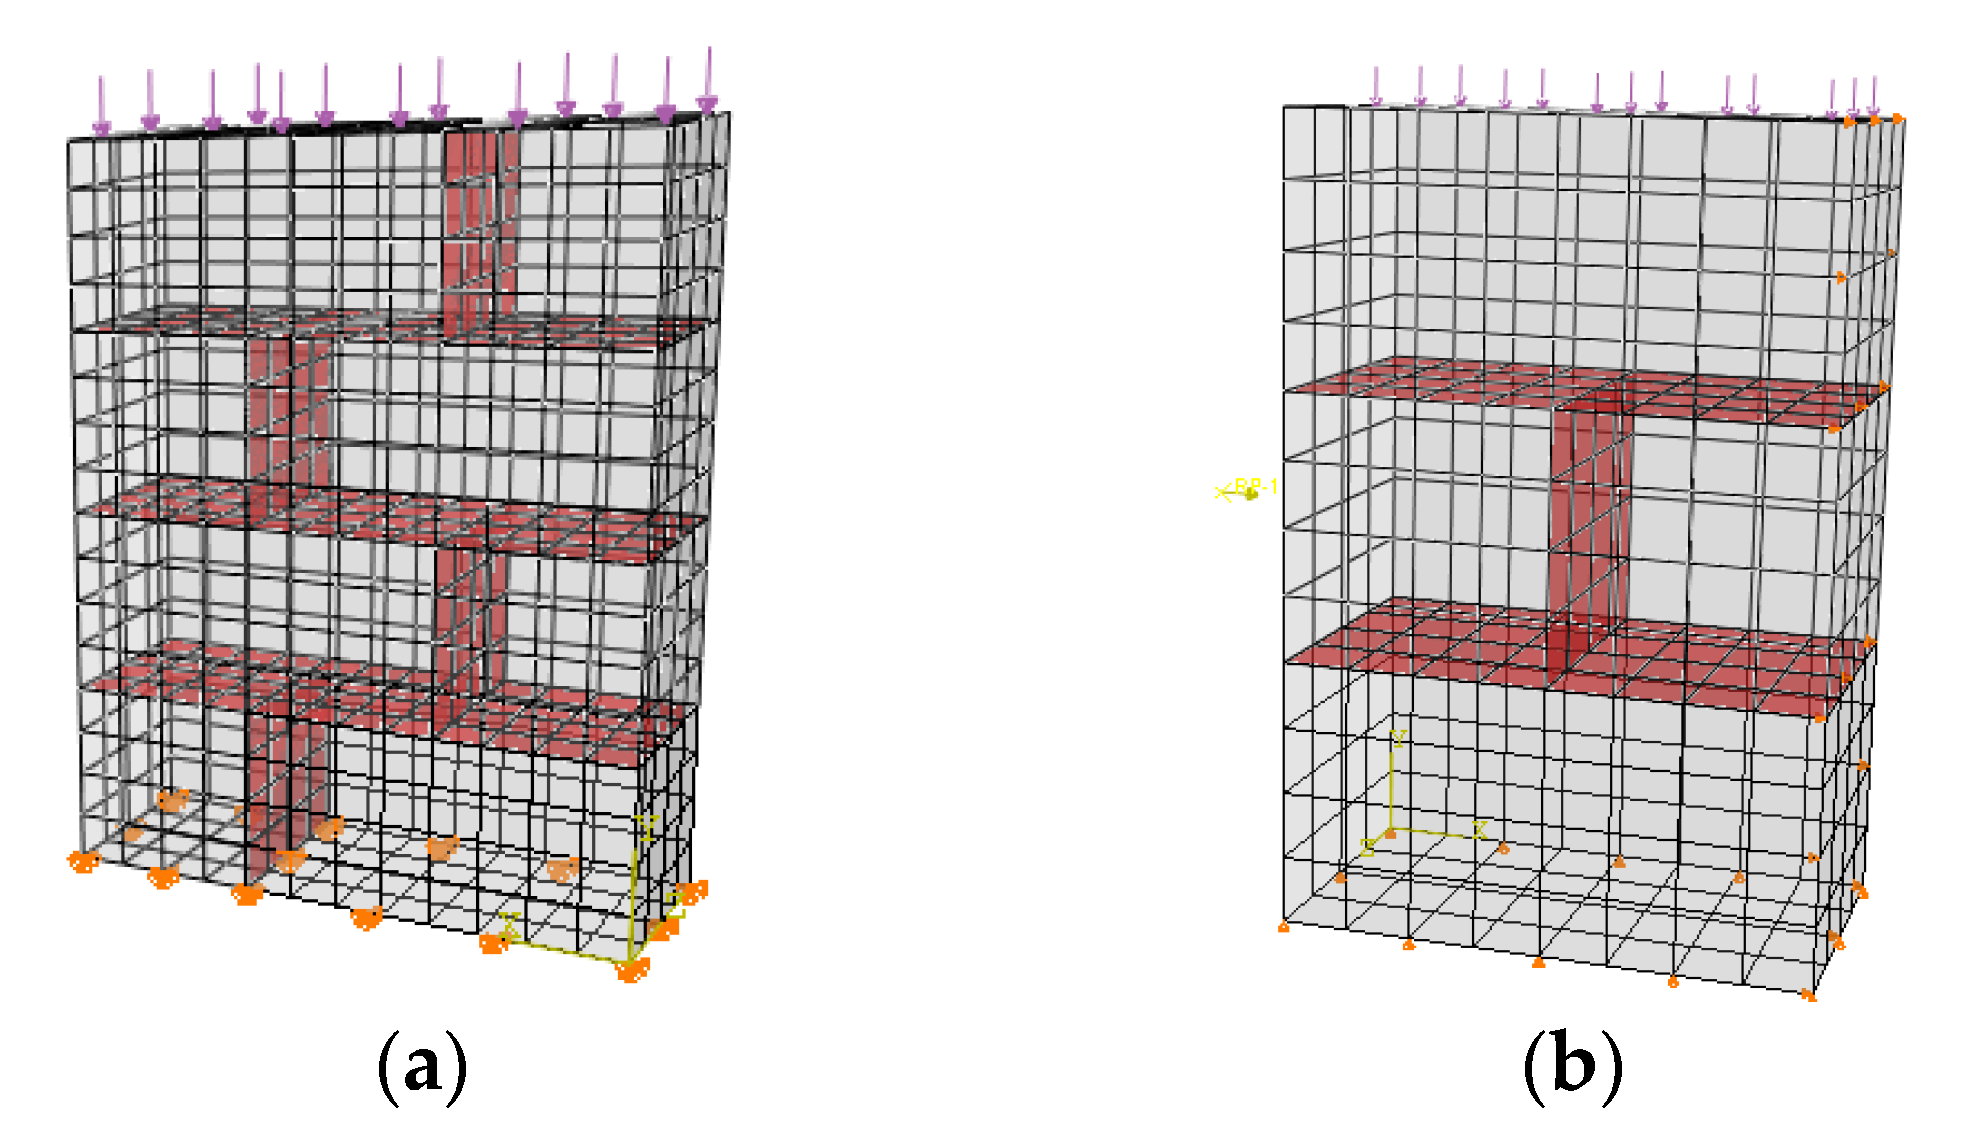
The finite element mesh, boundary conditions, and loading of masonry assemblages are shown in
Figure 14. All the nodes at the bottom of the compression prism were restrained in the three directions (
x,
y, and
z axes) to simulate the friction test condition as shown in
Figure 14a. While in the shear models, the bottom of the prism and the right sides (for bottom and top units) were restrained in the directions against the loading as shown in
Figure 14b.
An eight-node 3D stress linear brick (C3D8R) was used for modeling the masonry assemblages to reduce the computation time without losing the results accuracy [
33]. The geometry of assemblages and defined interaction surfaces between units are shown in
Figure 14. The size of units are 390 × 220 × 195 mm and 195 × 220 × 195 mm with zero thickness of mortar.
3.2.2. Model Outputs
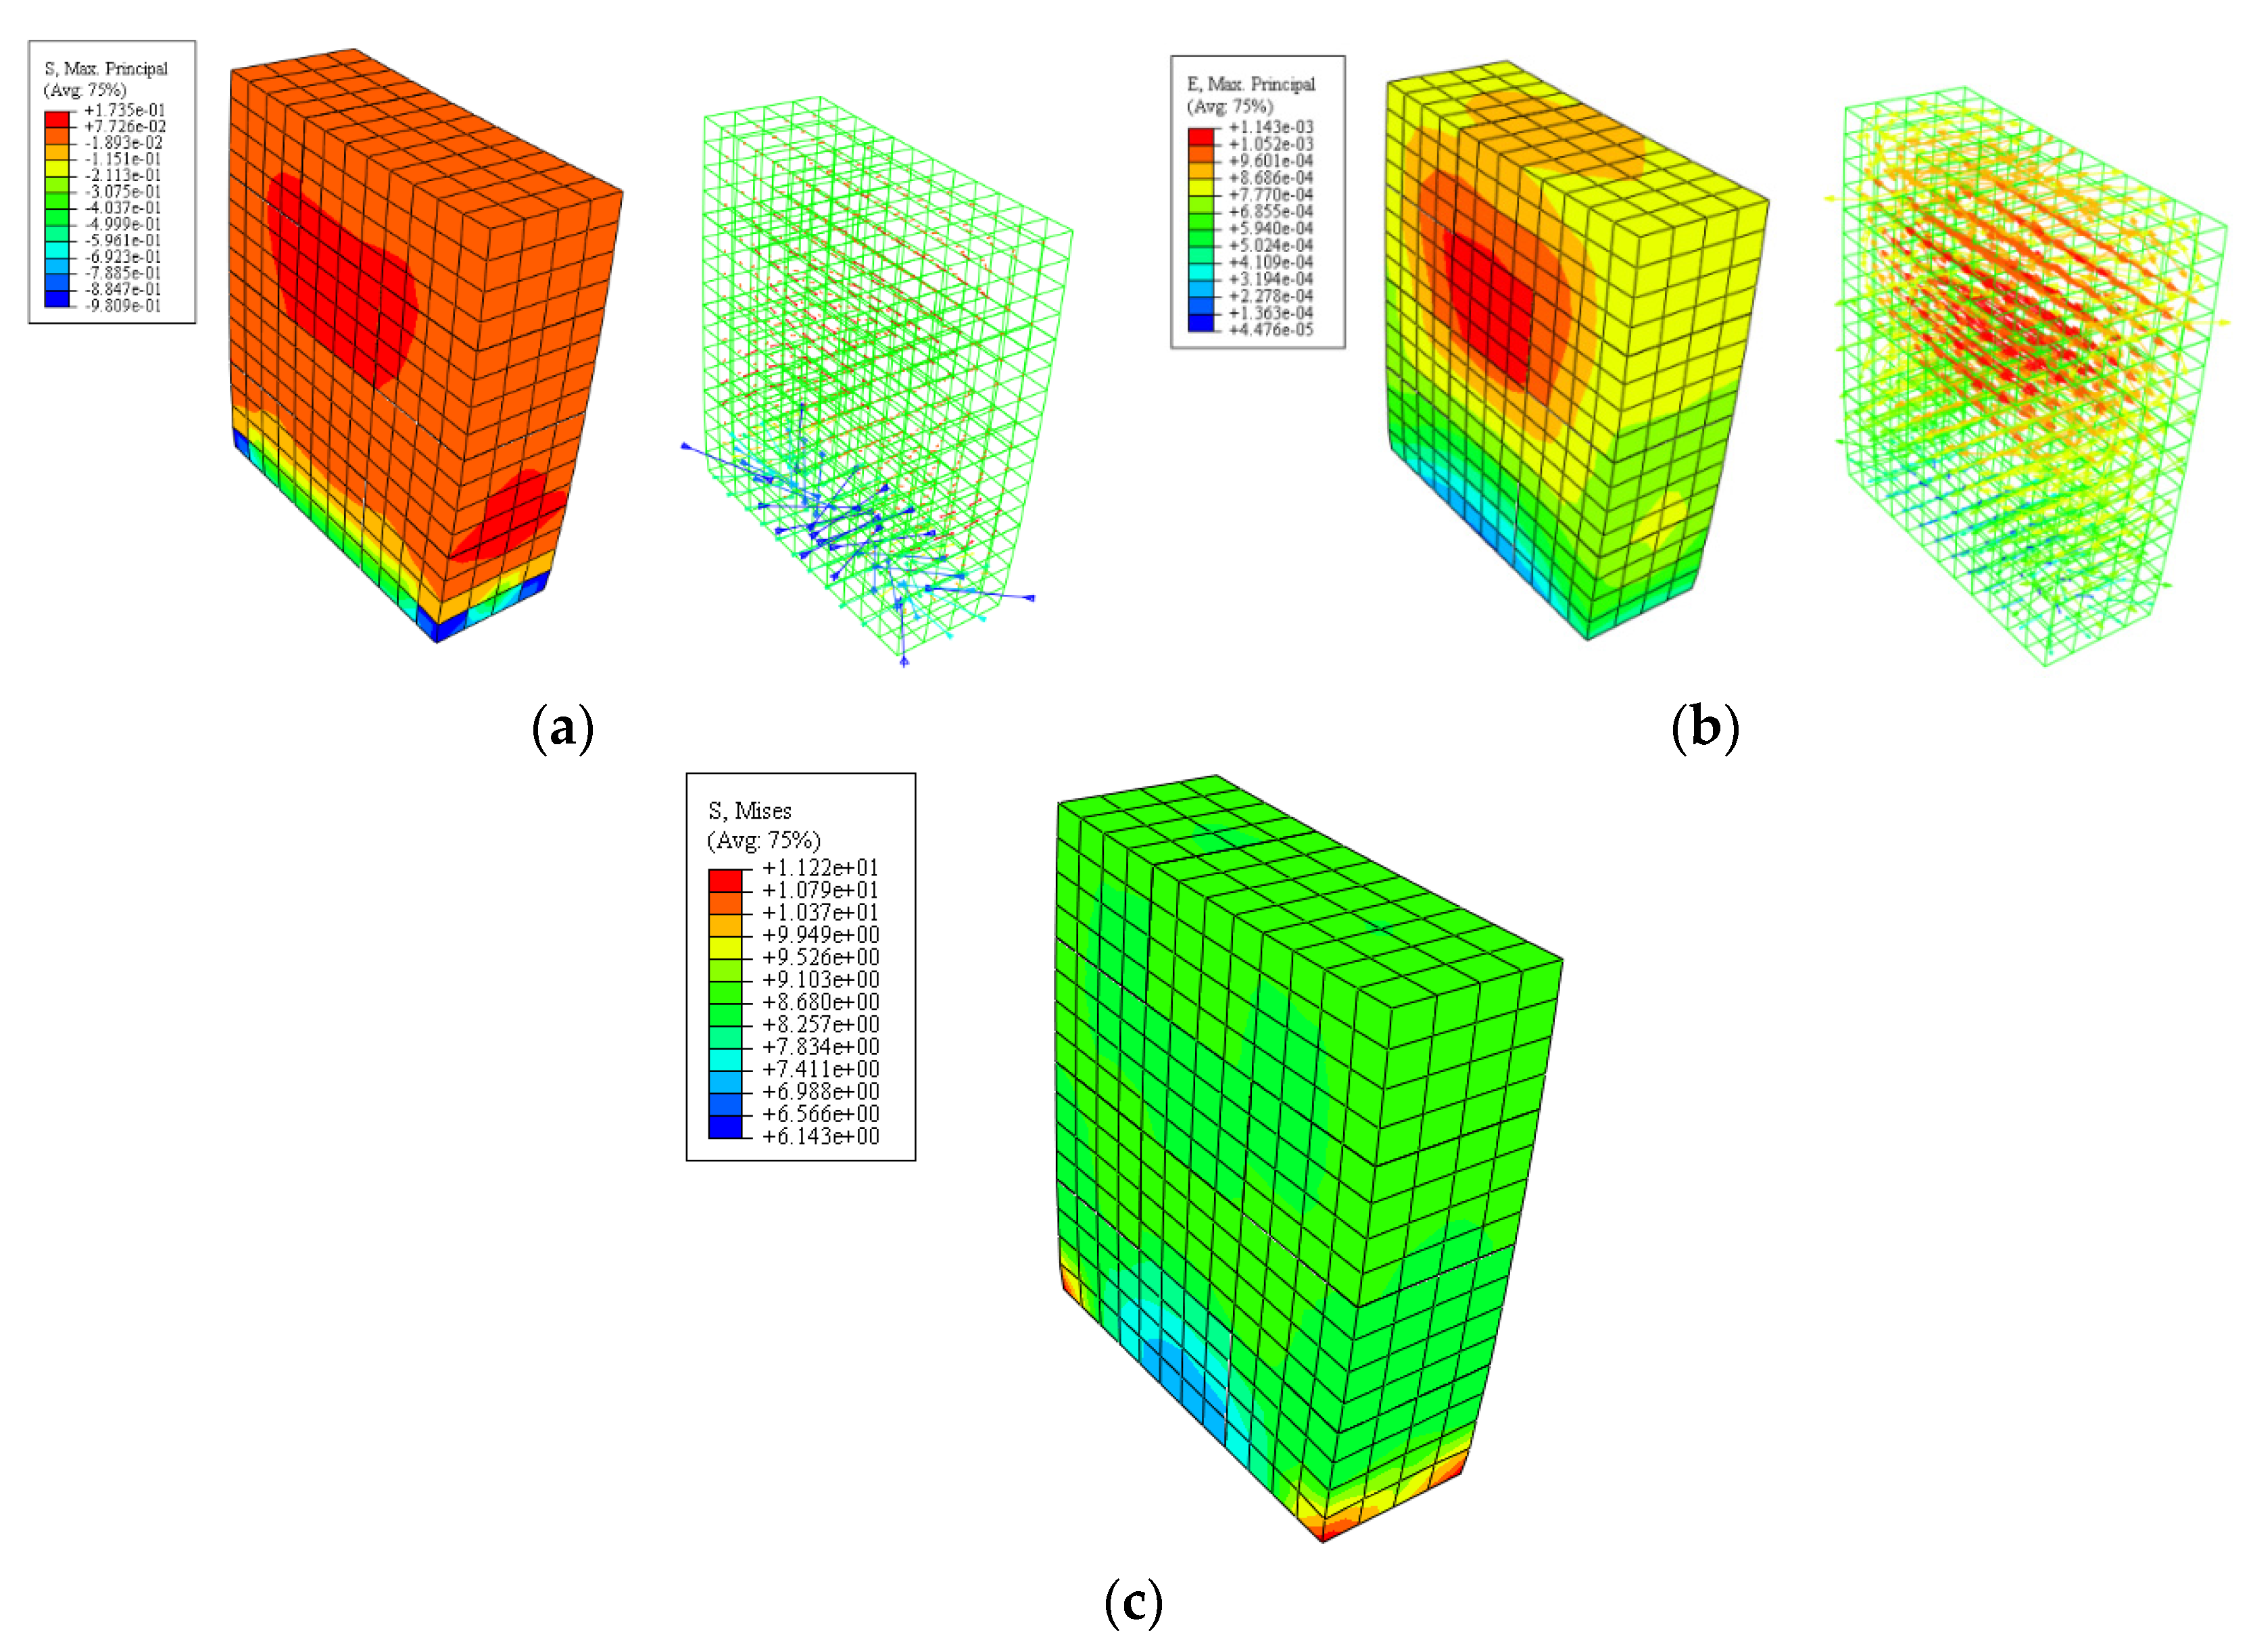
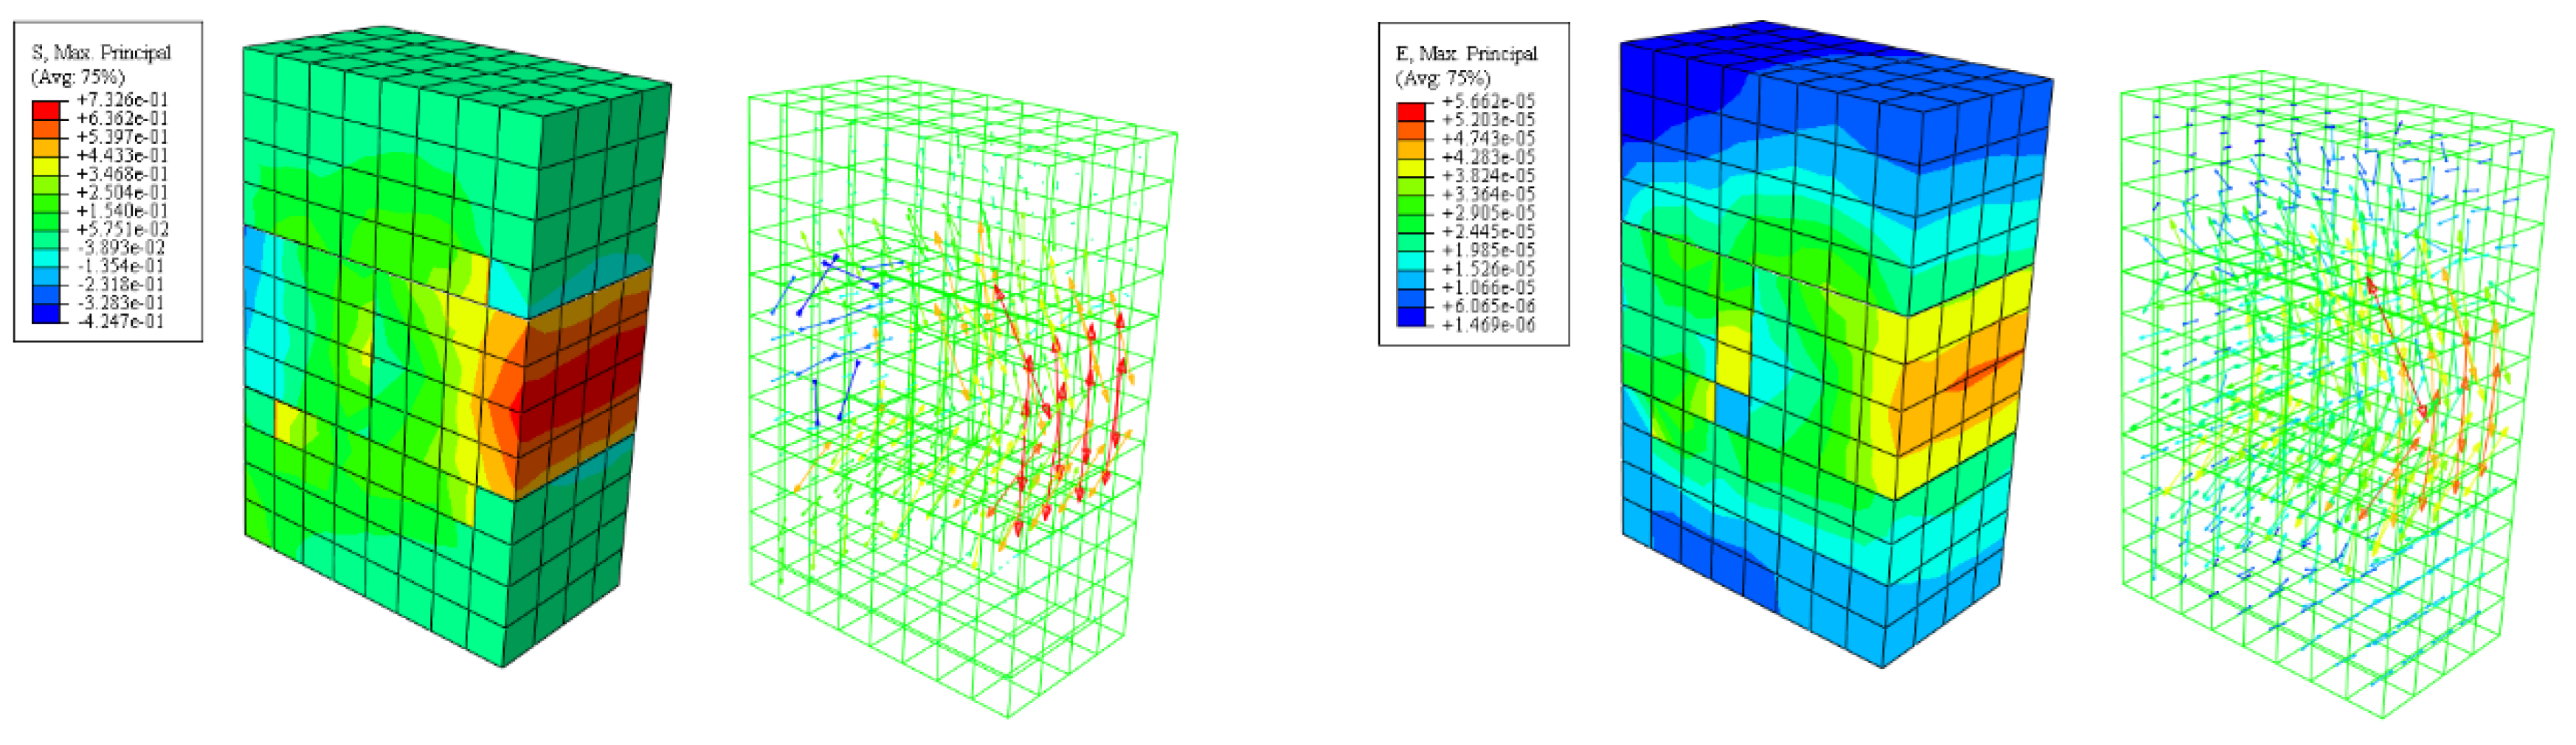
Figure 15 shows the final von Mises and maximum principal stress and strains for compression prism. As can be seen, the maximum stress occurred at the bottom edges of prism, while the maximum strain is located at the middle of the prism. Obviously, this leads to the initiation of vertical tensile splitting cracks at the middle of the prism and spreading to the top and bottom units, which is similar to what was found experimentally. The maximum stress obtained from the numerical model was 8.67 N/mm
2 with a difference of 6% compared with that recorded from experimental results.
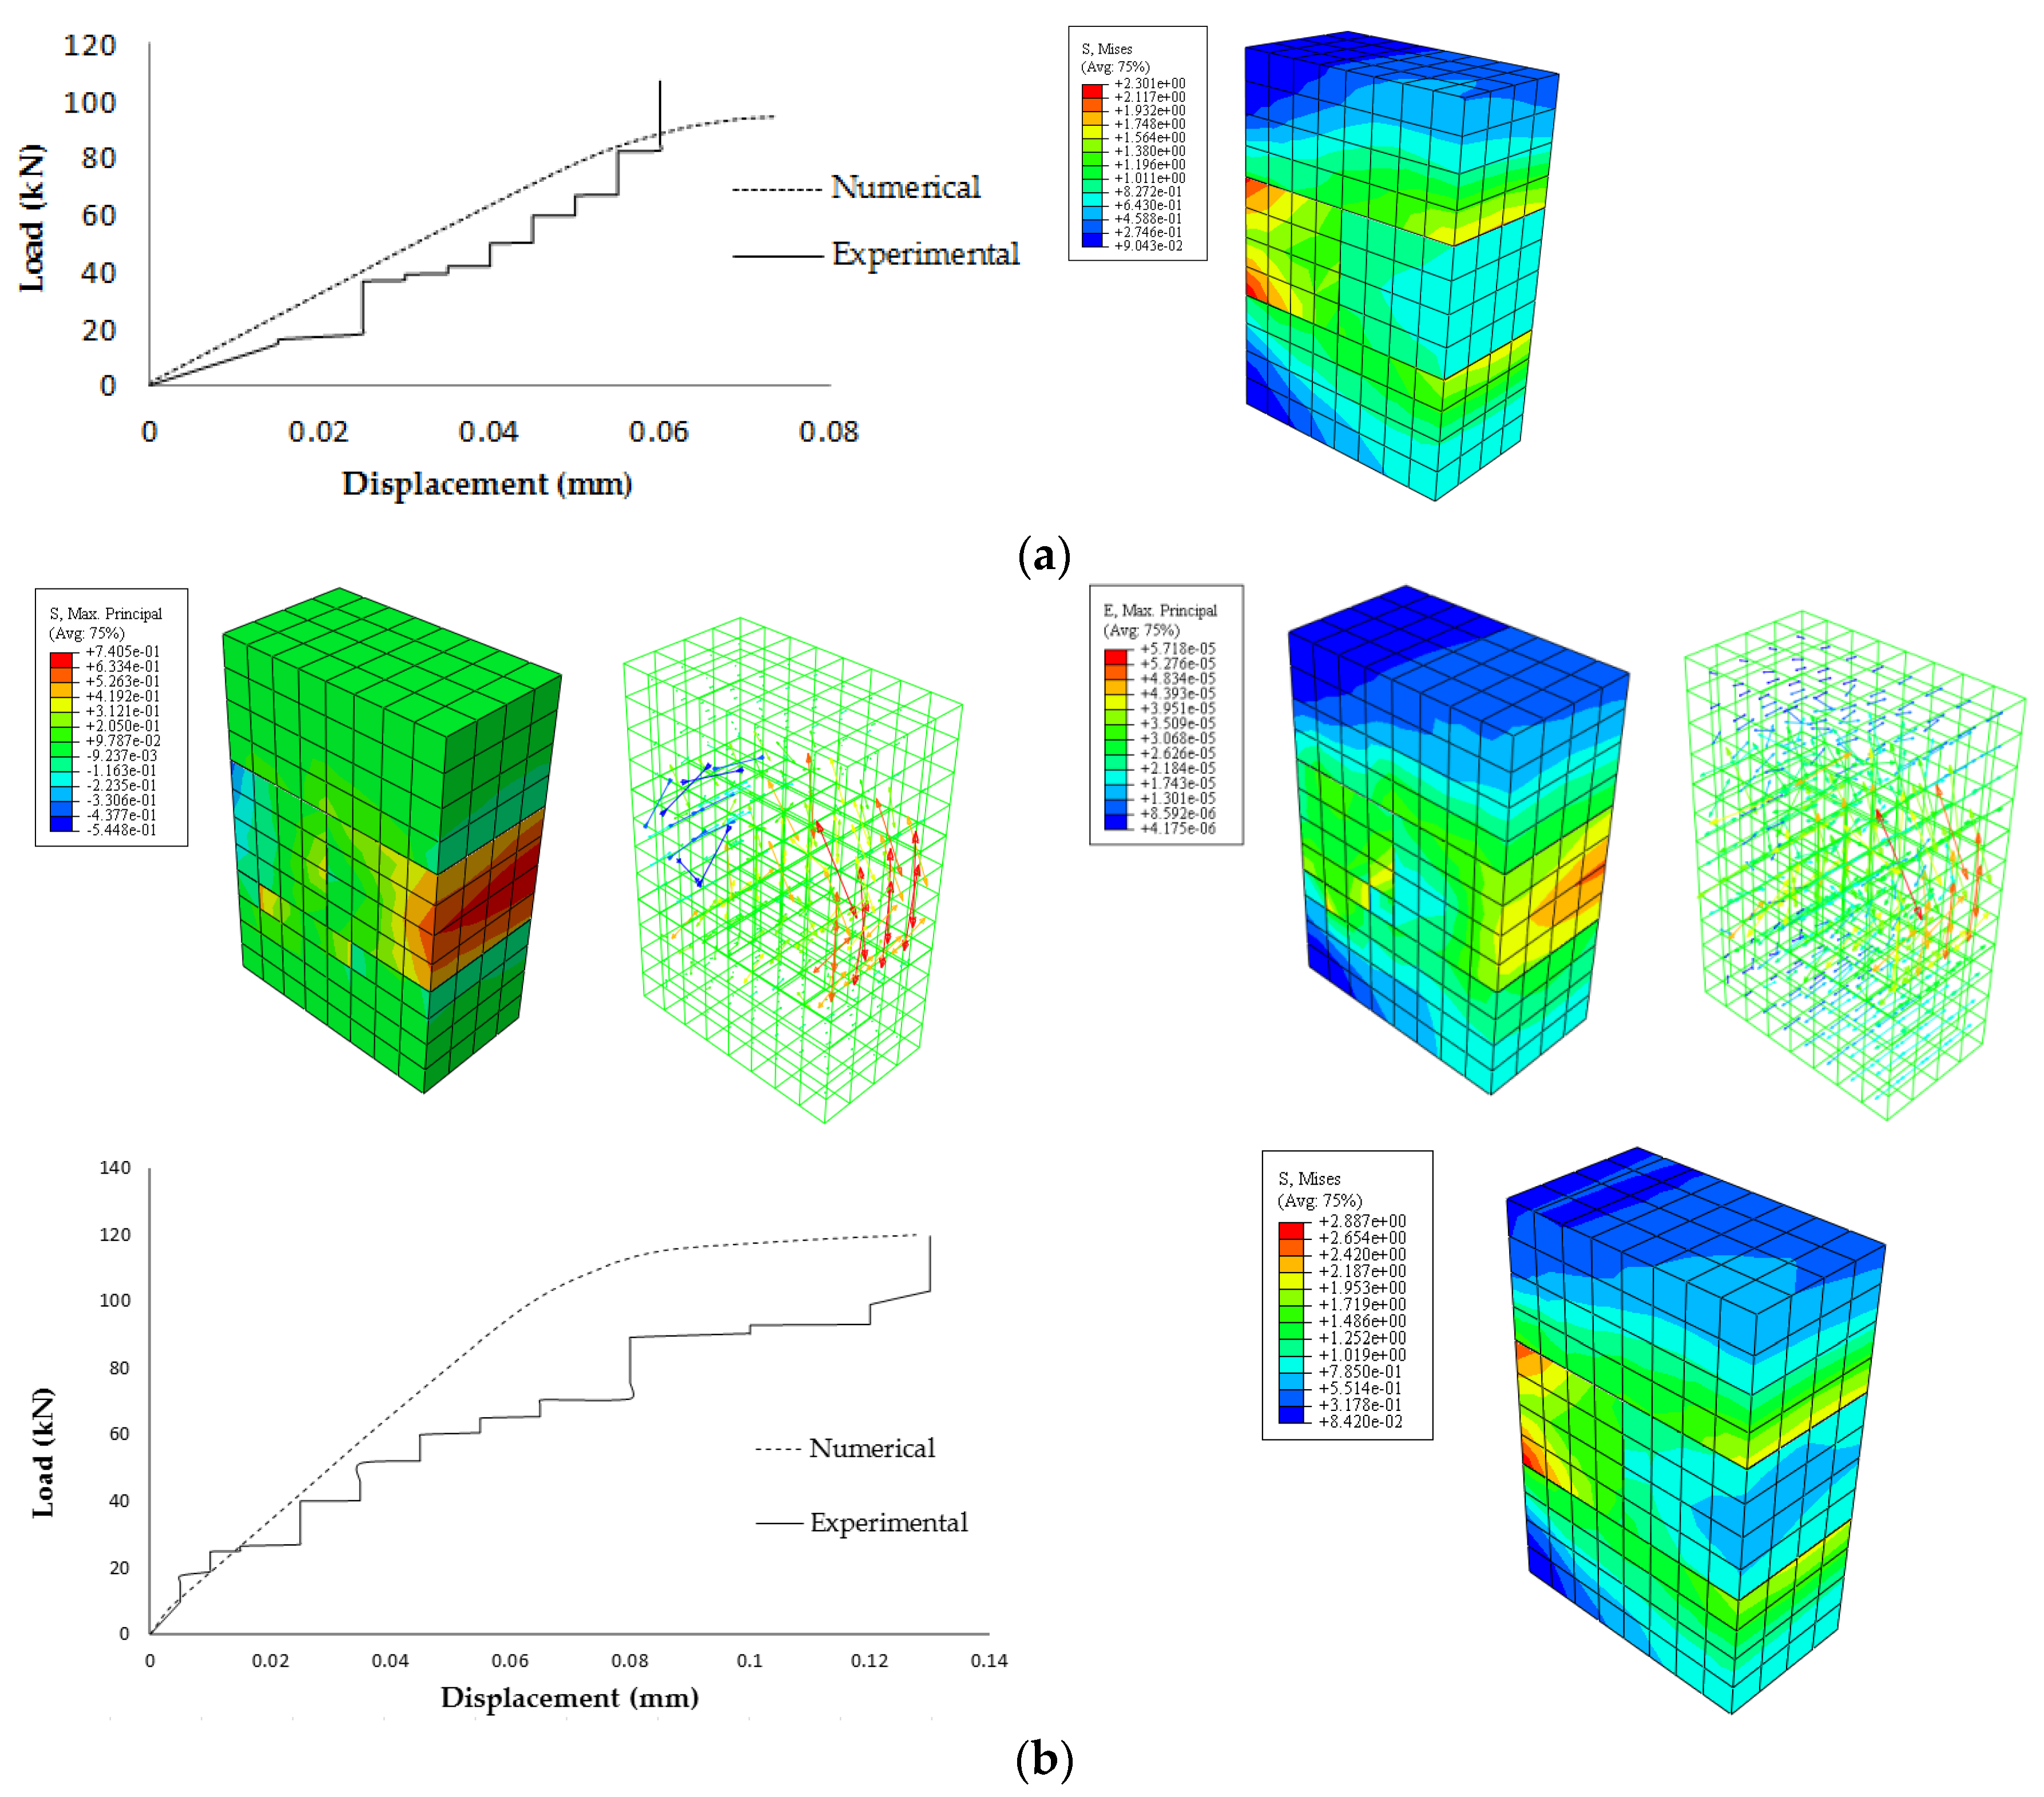
Figure 16 shows the numerical results for the two shear models.
Figure 16a presents the von Mises and principal stresses and strains for shear prism with 0.1 N/mm
2 axial constant stress. In addition, the load displacement curve was obtained and compared with the experimental one. Furthermore,
Figure 16b describes the same output with different axial constant stress of 0.3 N/mm
2. Displacement for model (b) (with an axial constant stress of 0.3 N/mm
2) is much higher than model (a) (with an axial constant stress of 0.1 N/mm
2), which is mainly due to increasing the constant axial stress.
The maximum horizontal loads obtained numerically for the two models were 94.4 kN and 119.9 kN for model (a) (with an axial constant stress of 0.1 N/mm
2) and model (b) (with an axial constant stress of 0.3 N/mm
2), respectively. Moreover, the horizontal displacement corresponding to the maximum horizontal loads was 0.074 mm and 0.13 mm, respectively. These results show a difference not more than 10% compared with the experimental one. The stepped shape for the experimental load-displacement curves took place due to the fact that the load was manually applied with force control. Furthermore,
Figure 16 shows the maximum von Mises stress that occurred at the location of applying the shear loading. The maximum strain is located in the horizontal joints for both models which agreed with the experimental results as shown in
Figure 8. The amount of the horizontal displacement (slip) at the location of bed joint is relatively small, indicating a high degree of brittleness for the materials. Failure modes and load-displacement curves for the numerical models showed good agreement with the experimental results.
4. Conclusions
This paper presents an experimental and analytical study for masonry assemblages which were built from a new type of self-insulating concrete masonry unit (SCMU), and subjected to compression and shear loadings. Based on the results from experimental and numerical analysis, it can be concluded that:
(1) The special configuration of SCMUs has advantages in both structural and thermal properties. The structural advantage is providing stronger bonds than the ordinary concrete masonry units by facilitating the grout between the units, both vertically and horizontally. On the other hand, the thermal advantage is reducing the thermal bridges by using continuous insulation materials.
(2) The shear resistance of SCMUs’ assemblages increased as the level of precompression increased. The shear stress increased from approximately 0.61 N/mm2 to 0.74 N/mm2 as the precompression stress increased from 0.1 N/mm2 to 0.3 N/mm2. A similar trend was obtained from the numerical analysis.
(3) Using a simplified micro-modeling strategy for grouted masonry assemblages gave accurate results with a simple model procedure. Furthermore, the mortar joints were modeled with zero thickness and their behavior was simulated using the traction–separation model of the cohesive element.
(4) The applications of Mohr–Coulomb’s failure criterion and the compressive strength of masonry prism in the traction–separation model displayed an acceptable procedure to deduce the general behavior of grouted masonry assemblages. An average cohesive stress of 0.54 N/mm2 and friction angle of 33.7° for SCMUs’ prism were obtained from a linear regression model (R2 = 0.99).
(5) The crack patterns observed experimentally were in good agreement with those predicted by the F.E. models. Also, excellent correlations between the numerical and experimental results of failure loads, displacement, and stress distribution were recorded. The predicted values of failure load and stress presented not more than 10% error.
Acknowledgments
This research was conducted with the financial support of the National “Twelfth Five-Year” Research Project in the National Science & Technology Pillar Program (Grant No. 2015BAL03B02).
Author Contributions
Abu-Bakre Abdelmoneim Elamin Mohamad wrote the manuscript; Abu-Bakre Abdelmoneim Elamin Mohamad and Zhongfan Chen designed the experiments. Abu-Bakre Abdelmoneim Elamin Mohamad and Zhongfan Chen modified the final paper.
Conflicts of Interest
The authors declare no conflict of interest.
References
- Ghrab-Morcos, N. CHEOPS: A simplified tool for thermal assessment of Mediterranean residential buildings in hot and cold seasons. Energy Build. 2005, 37, 651–662. [Google Scholar] [CrossRef]
- Mohsen, M.S.; Akash, B.A. Some prospects of energy savings in buildings. Energy Convers. Manage. 2001, 42, 1307–1315. [Google Scholar] [CrossRef]
- Al-Homoud, M.S. Performance characteristics and practical applications of common building thermal insulation materials. Build. Environ. 2005, 40, 353–366. [Google Scholar] [CrossRef]
- Ansari, F.A.; Mokhtar, A.S.; Abbas, K.A.; Adam, N.M. A simple approach for building cooling load estimation. Am. J. Environ. Sci. 2005, 1, 209–212. [Google Scholar] [CrossRef]
- Al-Khawaja, M.J. Determination and selecting the optimum thickness of insulation for buildings in hot countries by accounting for solar radiation. Appl. Therm. Eng. 2004, 24, 2601–2610. [Google Scholar] [CrossRef]
- Yu, J.; Yang, C.; Tian, L.; Liao, D. A study on optimum insulation thicknesses of external walls in hot summer and cold winter zone of China. Appl. Energy 2009, 86, 2520–2529. [Google Scholar] [CrossRef]
- Demirel, B. Optimization of the composite brick composed of expanded polystyrene and pumice blocks. Constr. Build. Mater. 2013, 40, 306–313. [Google Scholar] [CrossRef]
- Ding, X.Y.; Luo, Y.-L.; Chen, Z.-F.; Xu, M. Self-insulation concrete block design and optimized design based on thermal and mechanical properties in severe cold zones. Adv. Mater. Res. 2014, 1051, 730–736. [Google Scholar] [CrossRef]
- Javidan, F. Shape optimization of hollow concrete blocks using the lattice discrete particle model. Iranica J. Energy Environ. 2013, 4, 243–250. [Google Scholar] [CrossRef]
- Xunrong, G. An optimization design research of self-heat preservation concrete hollow block for cold region of north-east China. Master’s Thesis, Southeast University, Nanjing, China, June 2013. [Google Scholar]
- Del Coz Diaz, J.J.; García Nieto, P.J.; Rodriguez, A.M.; Martinez-Luengas, A.L.; Biempica, C.B. Non-linear thermal analysis of light concrete hollow brick walls by the finite element method and experimental validation. Appl. Therm. Eng. 2006, 26, 777–786. [Google Scholar] [CrossRef]
- Al-Jabri, K.S.; Hago, A.W.; Al-Nuaimi, A.S.; Al-Saidy, A.H. Concrete blocks for thermal insulation in hot climate. Cem. Concr. Res. 2005, 35, 1472–1479. [Google Scholar] [CrossRef]
- Christine, B. Masonry Design and Detailing: For Architects And Contractors; McGraw-Hill eBooks: New York, NK, USA, 2004. [Google Scholar]
- Marques, R.; Lourenço, P.B. Unreinforced and confined masonry buildings in seismic regions: Validation of macro-element models and cost analysis. Eng. Struct. 2014, 64, 52–67. [Google Scholar] [CrossRef]
- ASTM. Sampling and Testing Concrete Masonry Units and Related Units C140/C140M-15aε1; ASTM International: West Conshohocken, PA, USA, 2016. [Google Scholar]
- ASTM. Loadbearing Concrete Masonry Units C90-16; ASTM International: West Conshohocken, PA, USA, 2016. [Google Scholar]
- Ministry of Housing and Urban-Rural Development of the People’s Republic of China. Code for design of masonry structures GB50003-2011; China Architecture Building Press: Beijing, China, 2011.
- Ministry of Housing and Urban-Rural Development of the People’s Republic of China. The masonry mortar mix design procedure JGJ/T98-2011; China Architecture Building Press: Beijing, China, 2011.
- Ministry of Housing and Urban-Rural Development of the People’s Republic of China. Ordinary concrete mechanical performance test method GBJ50081-2002; China Architecture Building Press: Beijing, China, 2002.
- Fortes, E.S.; Parsekian, G.A.; Fonseca, F.S. Relationship between the compressive strength of concrete masonry and the compressive strength of concrete masonry units. J. Mater. Civ. Eng. 2014, 27. [Google Scholar] [CrossRef]
- Gabor, A.; Ferrier, E.; Jacquelin, E.; Hamelin, P. Analysis and modelling of the in-plane shear behaviour of hollow brick masonry panels. Constr. Build. Mater. 2006, 20, 308–321. [Google Scholar] [CrossRef]
- British Standard. Methods of test for masonry-Part 3: Determination of initial shear strength BS EN 1052-3: 2002; European Committee for Standardization: Brussels, Belgium, 2002. [Google Scholar]
- Lourenco, P.B. Computational strategies for masonry structures; Delft Univirisy press: Delft, Netherlands, 1996. [Google Scholar]
- Marques, R.; Lourenço, P.B. Possibilities and comparison of structural component models for the seismic assessment of modern unreinforced masonry buildings. Comput. Struct. 2011, 89, 2079–2091. [Google Scholar] [CrossRef]
- Berto, L.; Saetta, A.; Scotta, R.; Vitaliani, R. Shear behaviour of masonry panel: Parametric FE analyses. Inter. J. Solids Struct. 2004, 41, 4383–4405. [Google Scholar] [CrossRef]
- La Mendola, L.; Accardi, M.; Cucchiara, C.; Licata, V. Nonlinear FE analysis of out-of-plane behaviour of masonry walls with and without CFRP reinforcement. Constr. Build. Mater. 2014, 54, 190–196. [Google Scholar] [CrossRef]
- Milani, G. 3D upper bound limit analysis of multi-leaf masonry walls. Inter.J. Mech. Sci. 2008, 50, 817–836. [Google Scholar] [CrossRef]
- Koutromanos, I.; Stavridis, A.; Shing, P.B.; Willam, K. Numerical modeling of masonry-infilled RC frames subjected to seismic loads. Comput. Struct. 2011, 89, 1026–1037. [Google Scholar] [CrossRef]
- Dassault Systems. Abaqus analysis user’s manual 6.13-3. RI2013; Dassault Systems Providence: Waltham, MA, USA, 2013. [Google Scholar]
- Lubliner, J.; Oliver, J.; Oller, S.; Onate, E. A plastic-damage model for concrete. Inter. J. Solids Struct. 1989, 25, 299–326. [Google Scholar] [CrossRef]
- Lee, J.; Fenves, G.L. Plastic-damage model for cyclic loading of concrete structures. J. Eng. Mech. 1998, 124, 892–900. [Google Scholar] [CrossRef]
- Dugdale, D.S. Yielding of steel sheets containing slits. Mech. Phys. Solids 1960, 8, 100–104. [Google Scholar] [CrossRef]
- Bolhassani, M.; Hamid, A.A.; Lau, A.C.; Moon, F. Simplified micro modeling of partially grouted masonry assemblages. Constr. Build. Mater. 2015, 83, 159–173. [Google Scholar] [CrossRef]
- Sinha, B.P.; Gerstle, K.H.; Tulin, L.G. Stress-strain relations for concrete under cyclic loading. J. Am. Concr. Ins. 1964, 61, 195–211. [Google Scholar]
© 2016 by the authors; licensee MDPI, Basel, Switzerland. This article is an open access article distributed under the terms and conditions of the Creative Commons Attribution (CC-BY) license (http://creativecommons.org/licenses/by/4.0/).


