Article

Maize Seed Variety Classification Using the Integration of Spectral and Image Features Combined with Feature Transformation Based on Hyperspectral Imaging

1
Key Laboratory of Advanced Process Control for Light Industry, Ministry of Education, Jiangnan University, Wuxi, Jiangsu 214122, China
2
USDA/ARS Environmental Microbial and Food Safety Laboratory, Beltsville Agricultural Research Center, Bldg., 303, BARC-East, 10300 Baltimore Ave., MD 20705-2350, USA
*
Author to whom correspondence should be addressed.
Appl. Sci. 2016, 6(6), 183; https://doi.org/10.3390/app6060183
Submission received: 18 May 2016 / Revised: 12 June 2016 / Accepted: 14 June 2016 / Published: 21 June 2016
(This article belongs to the Special Issue Applications of Hyperspectral Imaging for Food and Agriculture)

Abstract

:
Hyperspectral imaging (HSI) technology has been extensively studied in the classification of seed variety. A novel procedure for the classification of maize seed varieties based on HSI was proposed in this study. The optimal wavelengths for the classification of maize seed varieties were selected using the successive projections algorithm (SPA) to improve the acquiring and processing speed of HSI. Subsequently, spectral and imaging features were extracted from regions of interest of the hyperspectral images. Principle component analysis and multidimensional scaling were then introduced to transform/reduce the classification features for overcoming the risk of dimension disaster caused by the use of a large number of features. Finally, the integrating features were used to develop a least squares–support vector machines (LS–SVM) model. The LS–SVM model, using the integration of spectral and image features combined with feature transformation methods, achieved more than 90% of test accuracy, which was better than the 83.68% obtained by model using the original spectral and image features, and much higher than the 76.18% obtained by the model only using the spectral features. This procedure provides a possible way to apply the multispectral imaging system to classify seed varieties with high accuracy.

Graphical Abstract

1. Introduction

Maize (Zea mays), also known as corn, is a major source of food, forages, fuel, and industrial materials [1]. In recent years, the number of maize seed varieties has considerably increased because of the extensive application of seed hybrid technology. Moreover, in the process of cultivation, harvesting, storage, and transportation, each production procedure may lead to variety mixing, thereby complicating seed classification and decreasing crop yield. Research indicates that a 1% decrease in the purity of maize seeds can decrease maize yield to 9 kg per 667 m2 [2]. Therefore, variety classification or identification before planting is important for maize seeds.
Several traditional methods for maize seed classification have been developed over the past years and vary from each other, such as in morphology method, protein electrophoresis, and DNA molecular marker technology. Most of these methods require professional staff and specialized instruments, and they are often time consuming [3]. Although the traditional method is convenient and economic, its accuracy depends on the experience of the inspectors and is influenced by subjective errors. Therefore, the development of rapid, accurate, and nondestructive methods for classifying and identifying maize seeds is important in the seed industry. Accordingly, optical sensing techniques for the one-time measurement of quality parameters have been the focus of domestic and foreign research on the automated evaluation (classification/sorting) of maize seeds [4,5].
Machine vision and conventional spectroscopy techniques are potential tools for the automatic quality evaluation of seeds [4,6,7,8,9]. However, whether machine vision or the conventional spectroscopy technique is used, some seeds may have similar appearances and differentiating them by image alone is difficult because seed cultivars have been increased. Researchers have studied hyperspectral imaging technology, which integrates the features of spectroscopy and machine vision in one system and provides spectral and spatial data simultaneously [10]. This technology has been widely evaluated by research groups in the quality assessment of agricultural products and foodstuffs.
Hyperspectral imaging technology can provide the spectral and image features of measured objects, but the spectral features are the most commonly used in seed variety classification because of their easy calculation [11,12,13,14]. The model based on spectral features will have the risk of classification accuracy deterioration if there are many seed varieties to be classified, or only a small amount of spectral information of seeds can be used because the need for rapid detection should be met. Therefore, researchers have attempted to extract more classification information from hyperspectral images to improve model performance. Wang et al. [15] used spectral and textural features (i.e., short-run emphasis, long-run emphasis, gray-level non-uniformity, run–length non-uniformity, and run percentage) extracted from six optimal wavelengths to develop the LS–SVM model for classifying the three variety of waxy maize and achieved classification accuracy of 88.89%. Yang et al. [16] reported a 98.2% prediction accuracy in classifying four varieties of maize seed using the combination of spectra, morphologic features (i.e., area, circularity, aspect ratio, roundness, and solidity) and texture features (i.e., energy, contrast, correlation, entropy, and standard deviations) extracted from the 19 optimal wavelengths for germ side. However, only part of the image features was used to classify a small number of varieties in their experiments. When a large number of varieties are to be classified, more classification features should be extracted from hyperspectral images. The extracted features usually contain irrelevant or even useless information because of the lack of effective knowledge to guide feature extraction, thus resulting in a dimension disaster for the classifier.
This study proposed a new procedure implemented for a large number of varieties. The experimental procedure involves the following: (1) selecting wavelengths using the successive projections algorithm (SPA) to improve the speed of hyperspectral acquisition and processing; (2) extracting spectral and image features from the hyperspectral images to achieve a comprehensive extraction of classification information; (3) using two feature transformation/reduction methods to transform/reduce the classification features for overcoming the risk of dimension disaster; (4) and developing the LS–SVM model for the accurate variety classification of maize seed.

2. Materials and Methods
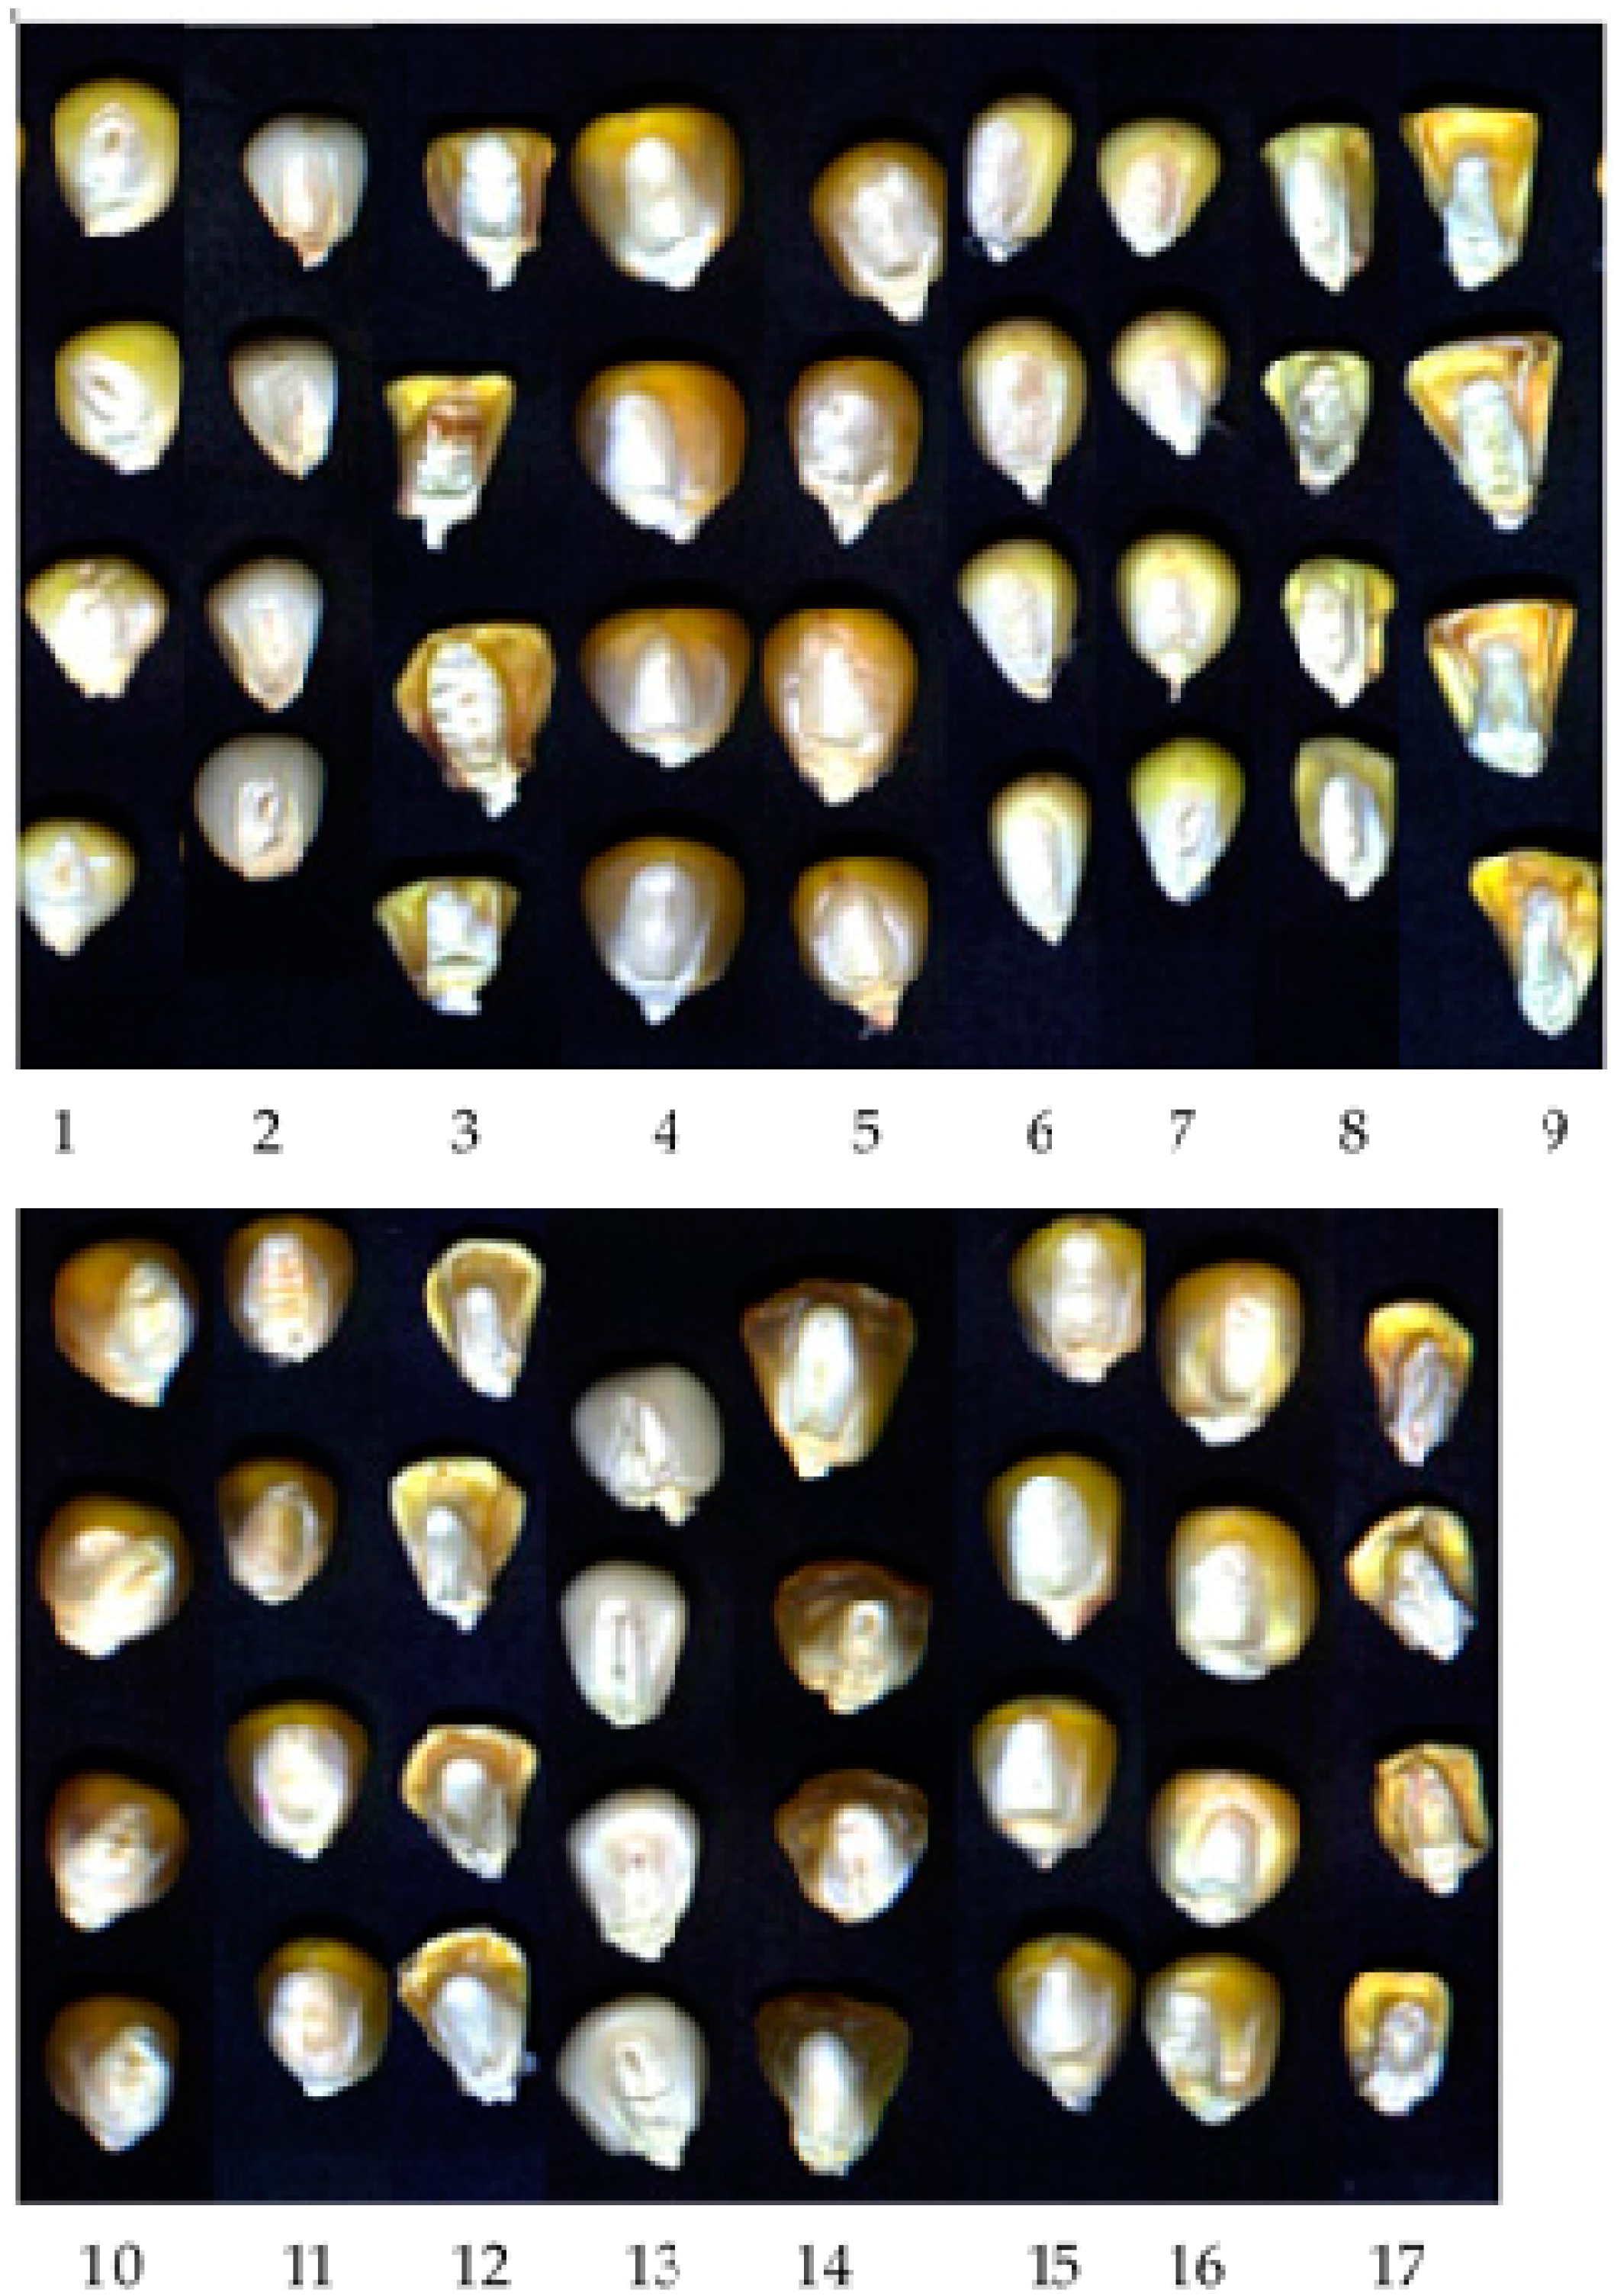
2.1. Maize Seeds

The maize seeds were collected from 17 Chinese varieties, including BNA07, SNN12, Bositian8, Gumang178, Huayu11, Jizaojinxiangnuo, Jinnuowang, Jinsaitian, Jingketian195, Lianyu16, Nongda108, Sida205, Wannuo11, Xiangtiannianyumi, Yudan998, Zhendan958, and Zhongnongdatian413. All seeds were purchased from different seed sellers and produced by different seed companies. A total 1632 seeds (96 seeds from each variety) with uniform sizes and without obvious defects were selected for analysis. Figure 1 illustrates the true appearance of maize seeds of 17 varieties.

2.2. Hyperspectral Reflectance Imaging Ccquisition and Correction

Hyperspectral images of maize seeds were acquired by applying a visible/near infrared line-scan hyperspectral imaging system in reflectance mode. This system consists of a back-illuminated 1392 × 1024 pixel charge-coupled device (CCD) camera (Pixelfly QE IC*285AL, Cooke, Thurmaston, LE, UK), a spectrograph equipped with a 25 µm fixed-size internal slit (1003A-10140 HyperspcTM VNIR C-Series, Headwall Photonics Inc., Fitchburg, MA, USA), a zoom lens (10004A-21226 Lens, F/1.4 FL23 mm, Standard Barrel, C-Mount., Schneider-Kreuzanch, Van Nuys, CA, USA), a single optic line-light powered by a 150 W DC light source (halogen lamp, EKE, 3250K, Techniquip, Norton Fitzwarren, TA, UK), an electric moving stage driven by a stepping motor (VT-80, PI miCos, Auburn, MA, USA), a closed black box, and a computer supported with data acquisition and control software (Hyperspec-M Rev A.2.1.6., Headwall Photonics Inc., Fitchburg, MA, USA, 2010). The line-scanning imaging system has an effective spectral region of 400–1000 nm and exhibits a 0.15 mm/pixel spatial resolution and a 0.64 nm/pixel spectral resolution [14].
For image acquisition, 32 seeds were placed onto a 20 cm × 20 cm black background board in four rows (Figure 2) for easier background segmentation and were automatically moved with a moving stage. When the seeds entered the view slot of the CCD camera, the image was acquired line-by-line constantly at 300 ms exposure time. A total of 812 scanning lines were obtained for each group of seed (32 seeds). After four spectral binning operations, the hyperspectral images were obtained within the spectral range of 400–1000 nm with 2.56 nm interval among contiguous wavelengths (a total of 233 wavelengths). Thus, a hypercube with a size of 1392 × 812 × 233 was generated, and the images were saved in a band-interleaved-by-line format. The entire acquisition was conducted in a closed black box to prevent any possible interference with external light sources.
After every four hyperspectral images of seeds were collected, spectral calibration were performed for image correction of the light source variation effect using the following equation [17]:
I = I O I B I W I B
where I is the relative reflectance intensity of each wavelength slice of hyperspectral imaging, I O is the original reflectance intensity of the hyperspectral image, I B is the intensity of the dark current acquired by covering the lens with its cap and turning off the light source, and I W is the reflectance intensity of the standard white panel (i.e., Teflon). Thus, all the corrected images were used in the following analyses.

2.3. Spectral and Image Feature Extraction

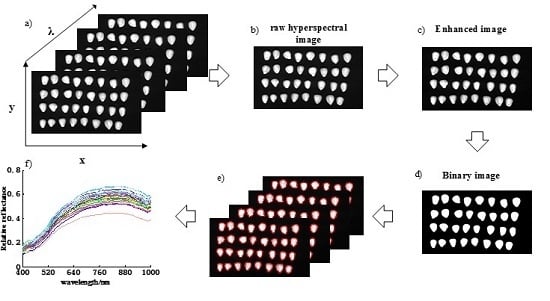
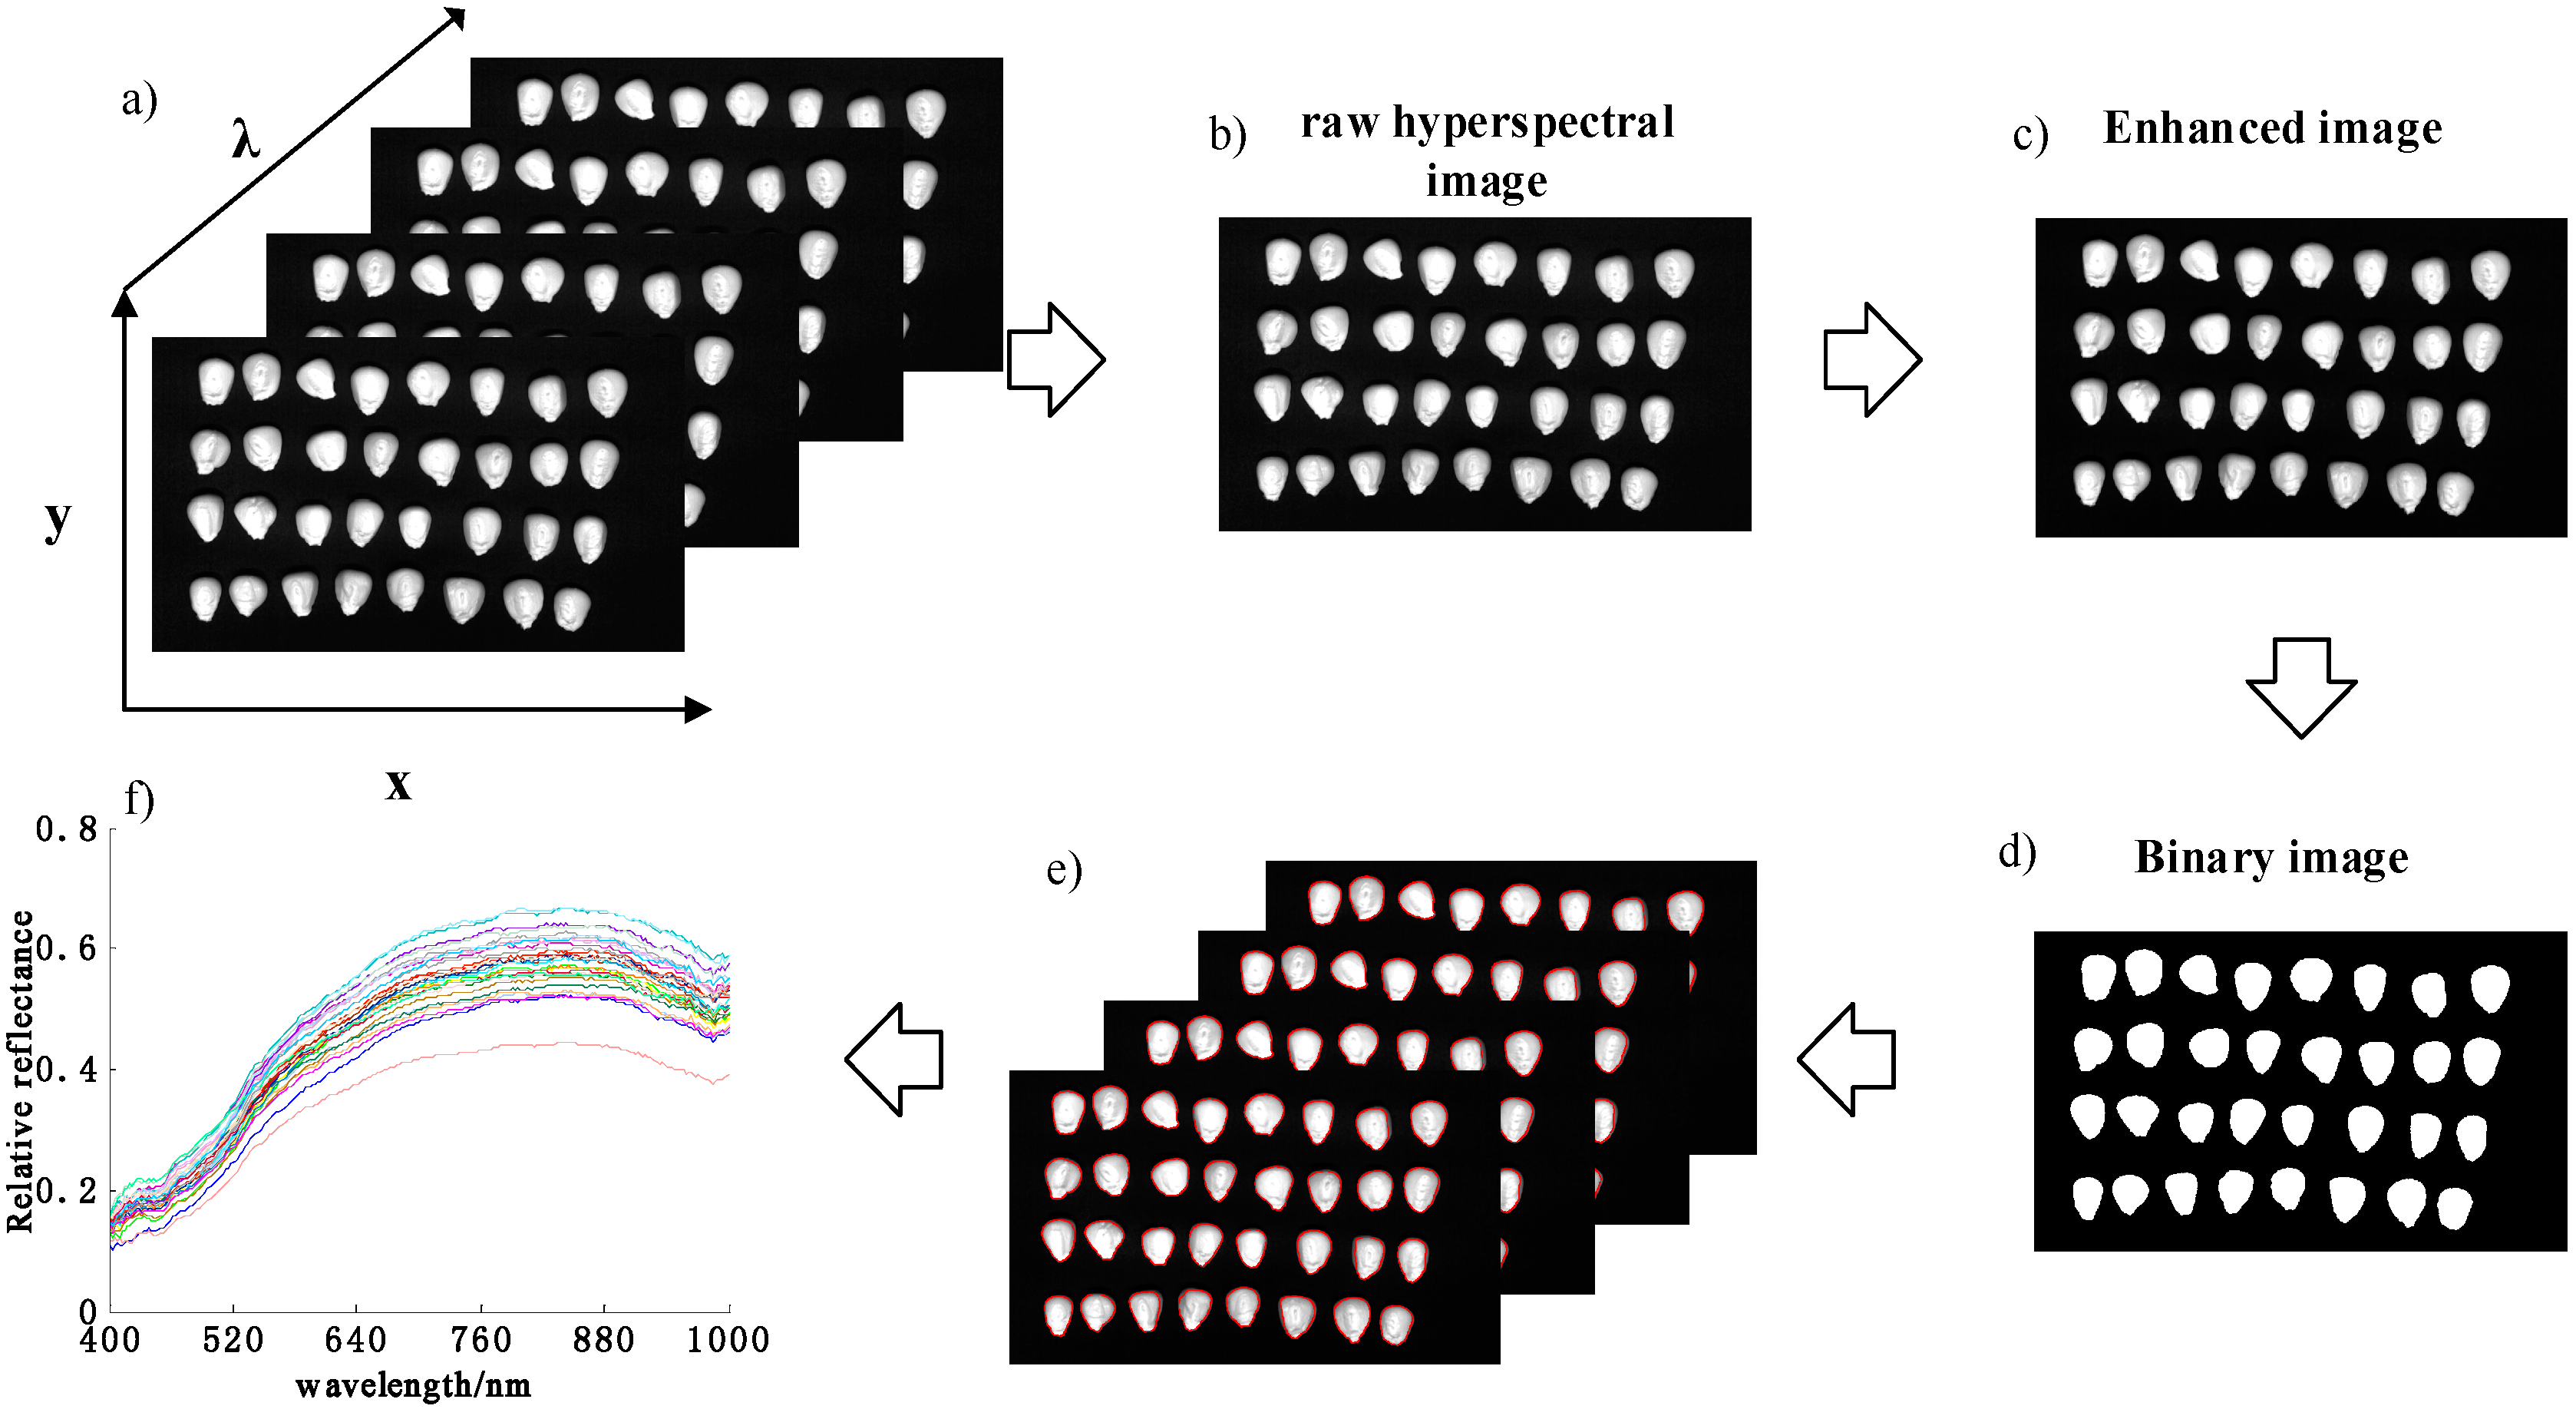
2.3.1. Image Segmentation and Spectral Feature Extraction

Image preprocessing, segmentation, and feature extraction are illustrated in Figure 2, which shows a series of steps to acquire data and develop the mathematical model. Initially, every image was calibrated with the dark current and white reference image with Equation (1). For extracting classification features for model building and testing, segmentation of the true seed images from the hyperspectral image background is a key step. In this study, adaptive threshold segmentation was selected because of its simplicity and high efficiency [18]. Adaptive segmentation and feature extraction were performed for each hypercube as follows. (1) The relative reflectance image at 782.6 nm was selected to identify the regions of interest (ROIs) because of its superior contrast outline in this image. (2) Pre-processing operations, such as image filtering and enhancement, were applied to remove noise on the obtained gray image. (3) Threshold segmentation was then performed to produce a binary mask. (4) The obtained binary mask was applied to segment the true regions of maize seeds from the 233 wavelengths in the hypercube. (5) The mean spectral features were calculated by averaging the intensity values of all pixels in the ROIs of the 233 wavelengths obtained from each maize seed.

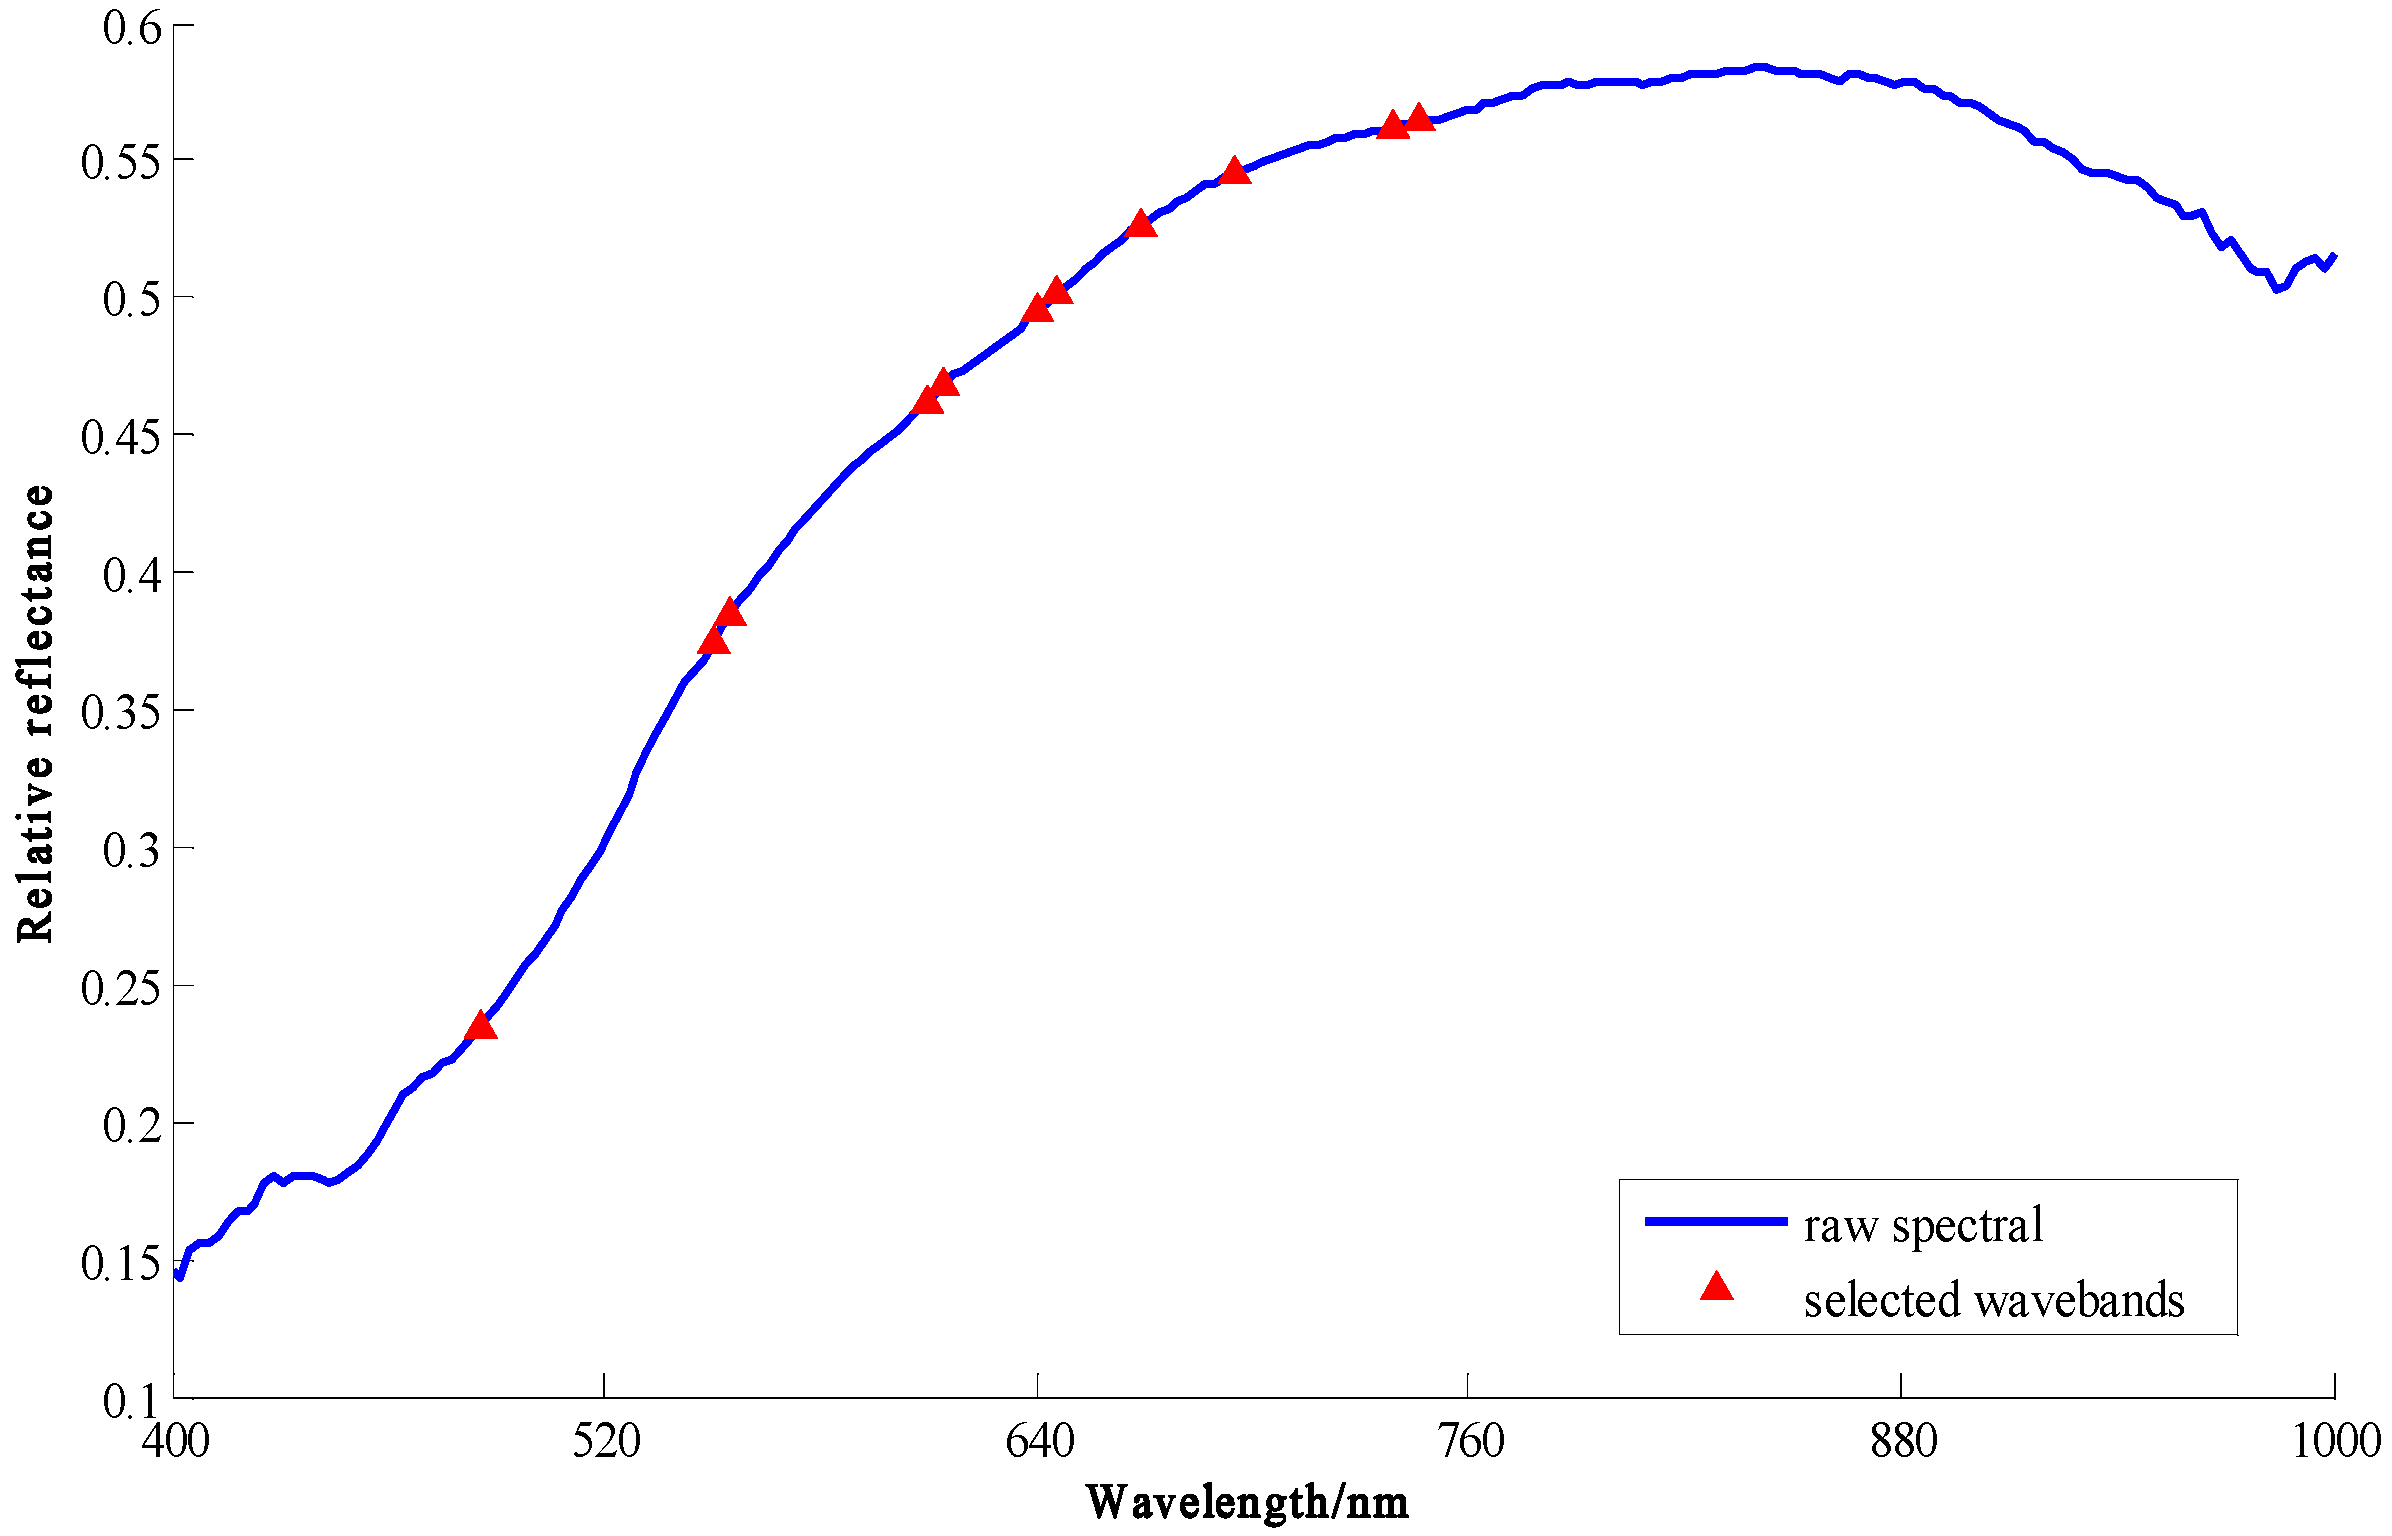
2.3.2. Optimal Wavelength Selection

Each of the extracted spectra consisted of 233 wavelengths and suffered from multicollinearity. Selecting a few important wavelengths for developing more robust classification models and for implementation in a multispectral imaging system for high-speed sorting applications is desirable. SPA is a forward selection method and is proposed for optimal wavelength selection. It can minimize the collinearity among wavelengths and has been used in previous research [19,20,21]. SPA was used for optimal wavelength selection in this study.
Several studies [22,23] reported that the number of selected wavelengths would affect the classification accuracy. To determine the best wavelength number for the following analysis, the selected wavelength number from 5 to 15 was changed. Then, the classification accuracies for different numbers of wavelengths were evaluated to determine the final optimal wavelength number.

2.3.3. Image Feature Extraction

Morphologic features were employed for variety classification in pioneer research [24,25]. According to these previous study results, five morphologic features of each kernel, including area, circularity, aspect ratio, roundness, and solidity, were extracted from an image of 782.6 nm.
Image texture, defined as a function of the spatial variation in pixel intensities, has been widely applied in the quality evaluation and safety inspection of food and agricultural products. Thus, image texture analyses based on first-order and second-order statistics were also extracted from hyperspectral images under selected wavelengths to improve classification accuracy. The first-order statistics provide information on the gray-level distribution of the image while ignoring the spatial interaction between pixels. The five first-order statistics parameters, namely, energy, entropy, skew, standard deviation, and moment, were extracted in this study. The second-order statistics, namely, contrast, correlation, energy, and homogenous derived from the co-occurrence matrix (GLCM), were calculated from the four directions (0°, 45°, 90°, and 135°) with displacement of d = 1. The average value and the standard deviation for each second-order static (contrast, correlation, energy, and homogenous, respectively), were finally obtained. Therefore, 13 texture features, including 5 first-order statistics and 8 second-order statistics, were extracted from each hyperspectral image, and finally 13 × Nw (Nw is the wavelength number selected by SPA) texture features and 5 morphologic features were used as the images features in the following analysis.

2.4. Feature Integration and Transformation/Reduction

Integrating the spectral and image features for each seed is needed to achieve the accurate classification of maize seed. In this study, the integrating features from each seed were created by connecting the spectral features and image features together in a vector. As the features were greatly different in their scales of value, an autoscaling method was used to overcome the problem of large disparity in values among the features. Autoscaling is essentially a normalization procedure expressed as follows [26]:
Y i j = Y i j Y j ¯ S D j
where Y i j and Y i j denote the j-th rescaled and original features for sample i, respectively, Y j ¯ is the mean value of all the samples, and S D j is the corresponding standard deviation. This preprocessing procedure rescales each feature to zero means and unit variance.
After integrating the spectral and image features, the number of features for classification greatly increased. Many classification features provide useful information for the accurate classification of maize seeds, but they also bring the risk of dimension disaster resulting from feature redundancy. Therefore, the two feature transformation/reduction methods, including principle component analysis (PCA) and multidimensional scaling (MDS), were used to overcome the dimension disaster in this study. PCA [27] is a linear dimension transformation/reduction method that aims to convert multiple variables to a small number of integrated variables, namely, the principal component, based on the internal structure of the correlation matrix or the covariance matrix of the original variables. The goals of PCA are to maximize the internal information of the data after transformation/reduction and to measure the importance of the direction by measuring the variance of the data in the direction of the projection. Therefore, PCA is a linear dimension reduction method with the least loss of original data information. MDS [28] is a nonlinear dimensionality reduction method used to maintain the similarity or distance between data points. The purpose of MDS is to transfer a set of dissimilarity data among individualities into space composition through the MDS, thus retaining the relative relationship among the original data. That is, we can visually show the relative relationship among the original data by MDS.
PCA is used mainly to determine the features that can best embody the characteristics of data. Conversely, MDS is more concerned with the relative relation among the original data.

2.5. Developing Classification Models Based on LS–SVM

Support vector machine (SVM) is one of most used nonlinear classification algorithms for pattern recognition and machine learning techniques [29]. In this study, an improved SVM algorithm, namely, least squares–support vector machine (LS–SVM), was utilized to develop the classification models for maize seeds. The LS–SVM model can be trained efficiently and can yield accurate results because it employs equality constraints in solving a set of linear equations instead of inequality constraints in solving the quadratic programming problem of SVM. Furthermore, the radial basis function [30] was selected as the LS–SVM kernel function. The optimal values of the hyper-parameter and kernel parameters were obtained using gradient optimization combined with 10-fold cross validation.
Prior to the model development, the 96 seeds for each variety were randomly divided into two groups: 75% of the seeds were used for training and the remaining 25% were used for independent test. The performance of the classifier may vary depending on the training and test samples, and thus the above training and test procedures were run 10 times. The average results and their distribution over the 10 runs are reported in the following section.

3. Results

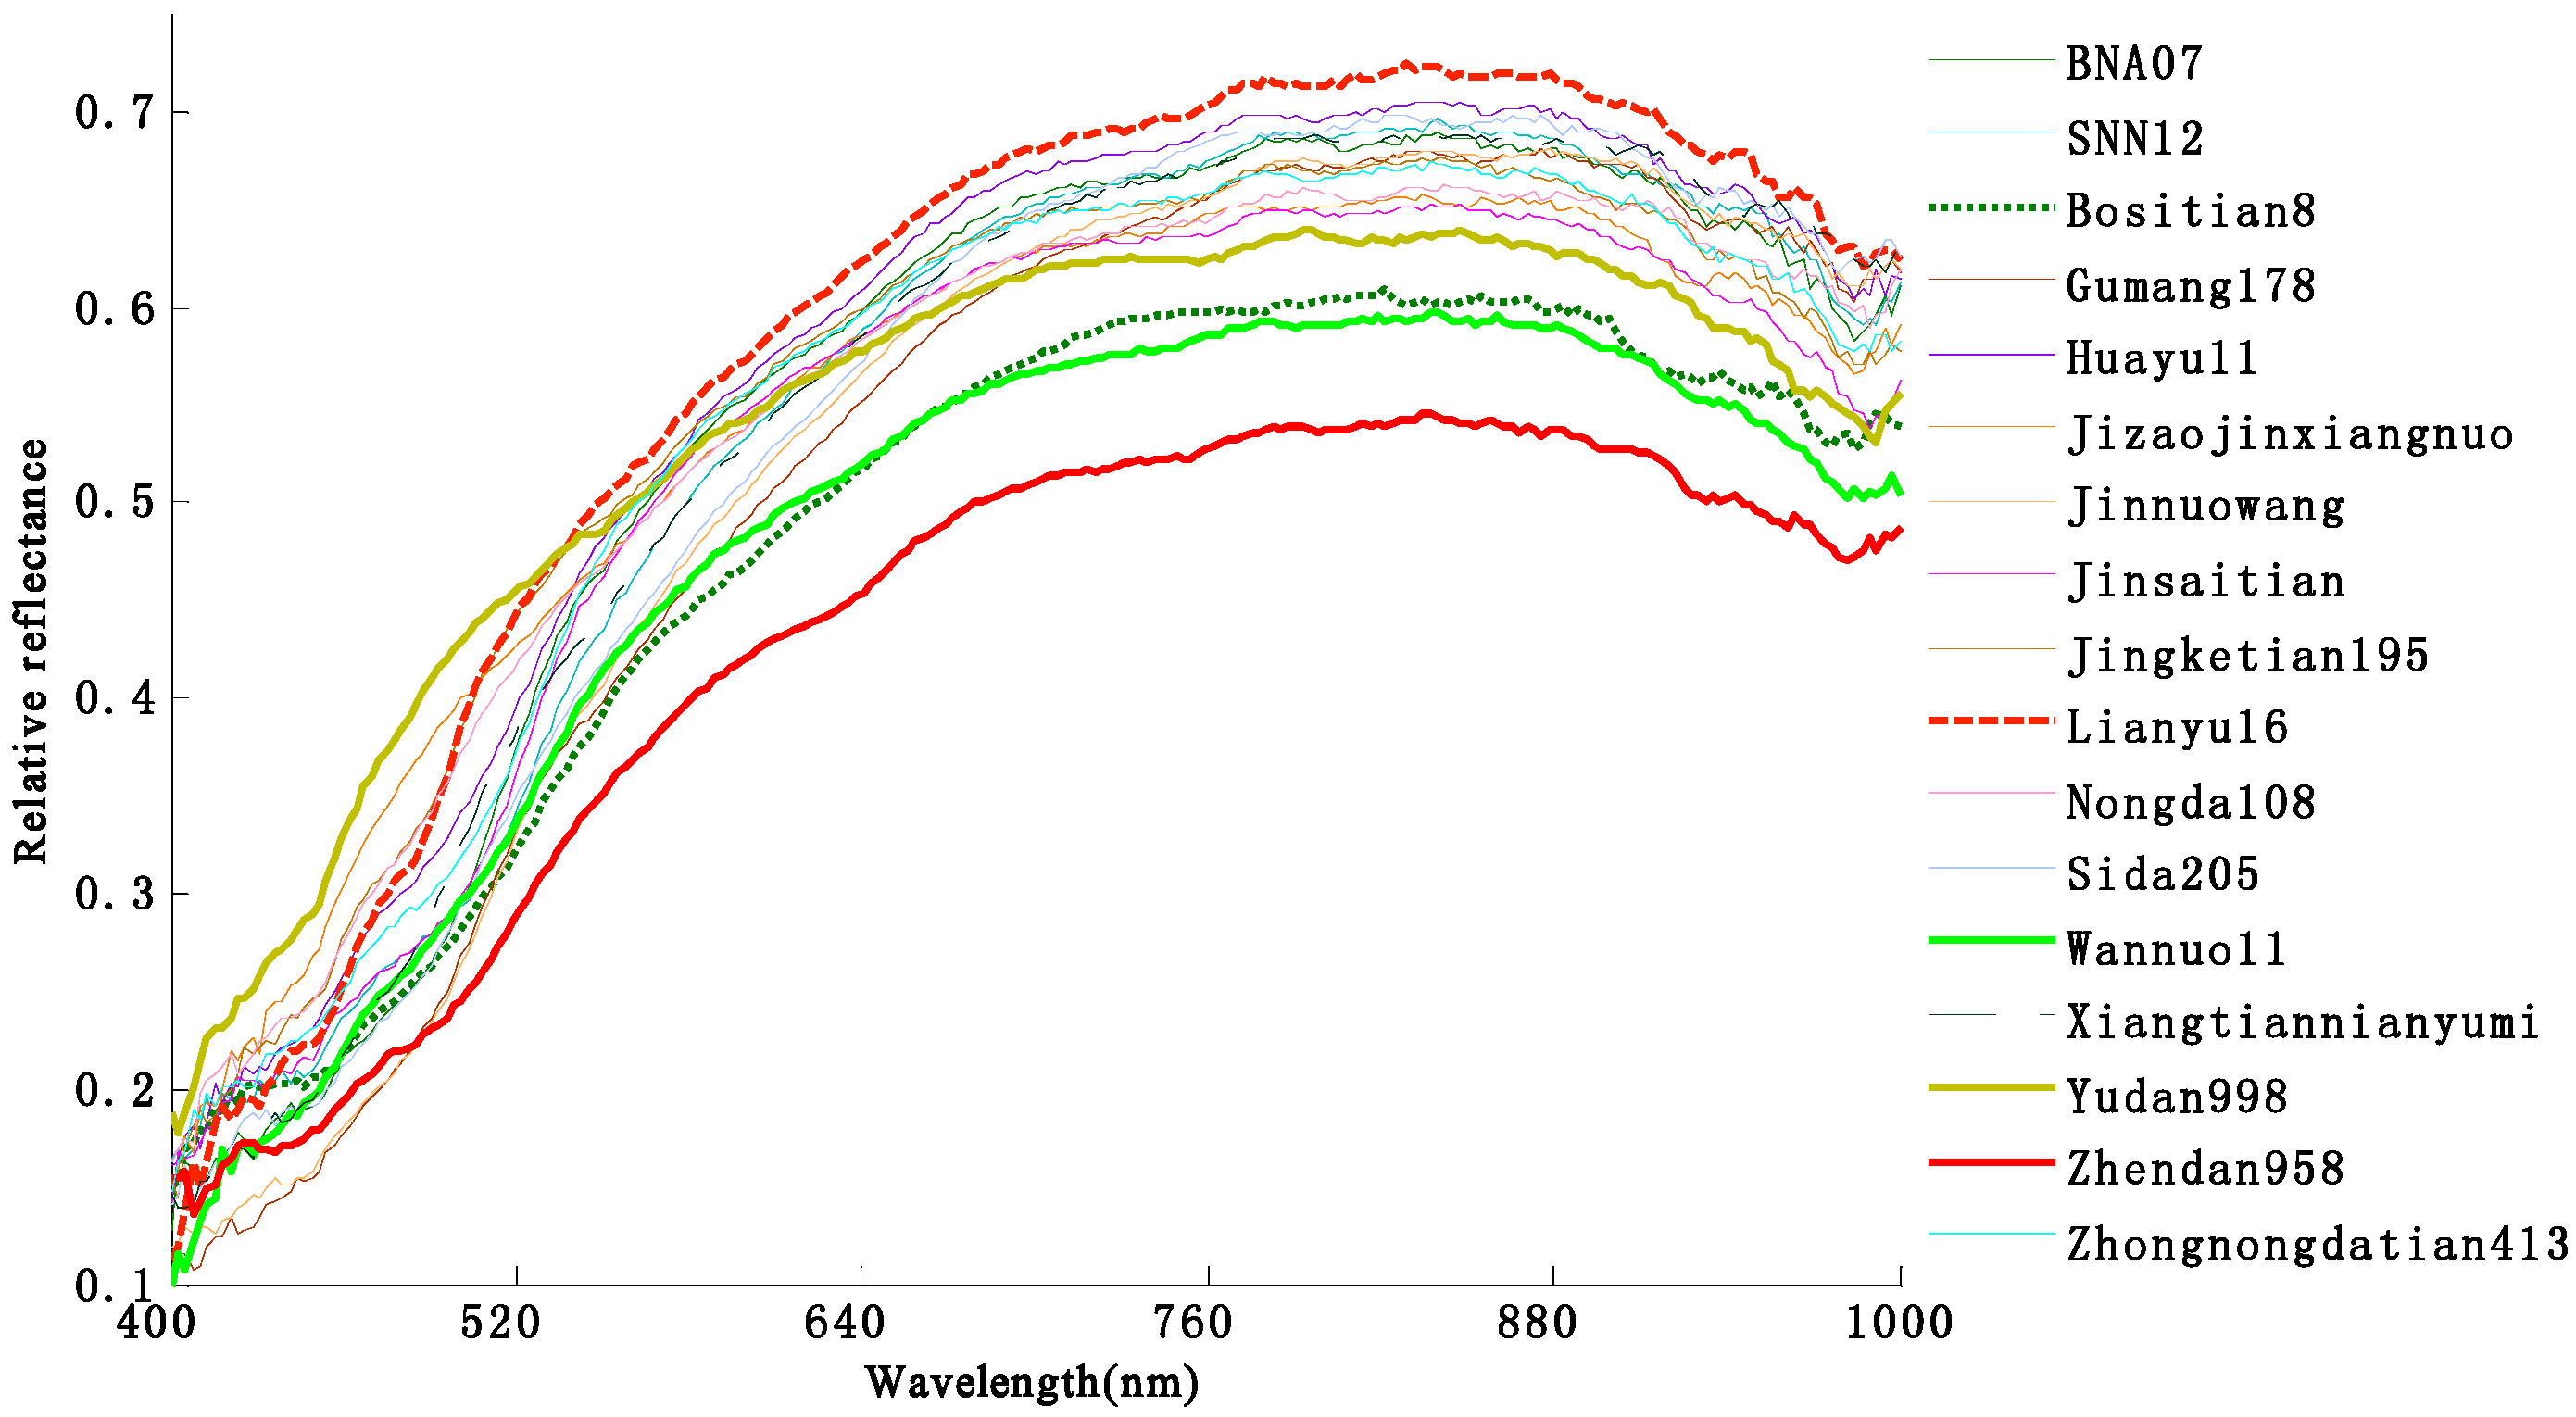
3.1. Characteristics of the Spectral Features of Maize Seeds

Figure 3 shows the mean reflectance spectra for 17 maize seed varieties within the wavelength range of 400–1000 nm. The general trends of the spectral curves are similar. In the wavelength range of 500–700 nm, the average spectral curve shows an upward trend for all of the 17 varieties. Moreover, the average spectral curve becomes flat within the wavelength range of 700–900 nm. A main absorption band observed nearby 1000 nm probably arises from the second overtone of O–H stretching of water interacting with protein [31]. The 400–500 nm absorbance of the spectral proves to be proportional to the protein content of the maize seeds [32]. Higher reflectance spectra are found in the near infrared region, except for the region of water absorption. These spectral differences are effective measures of the specific characteristics of each variety. Thus, these differences provide a basis for the use of hyperspectral imaging data for seed classification.

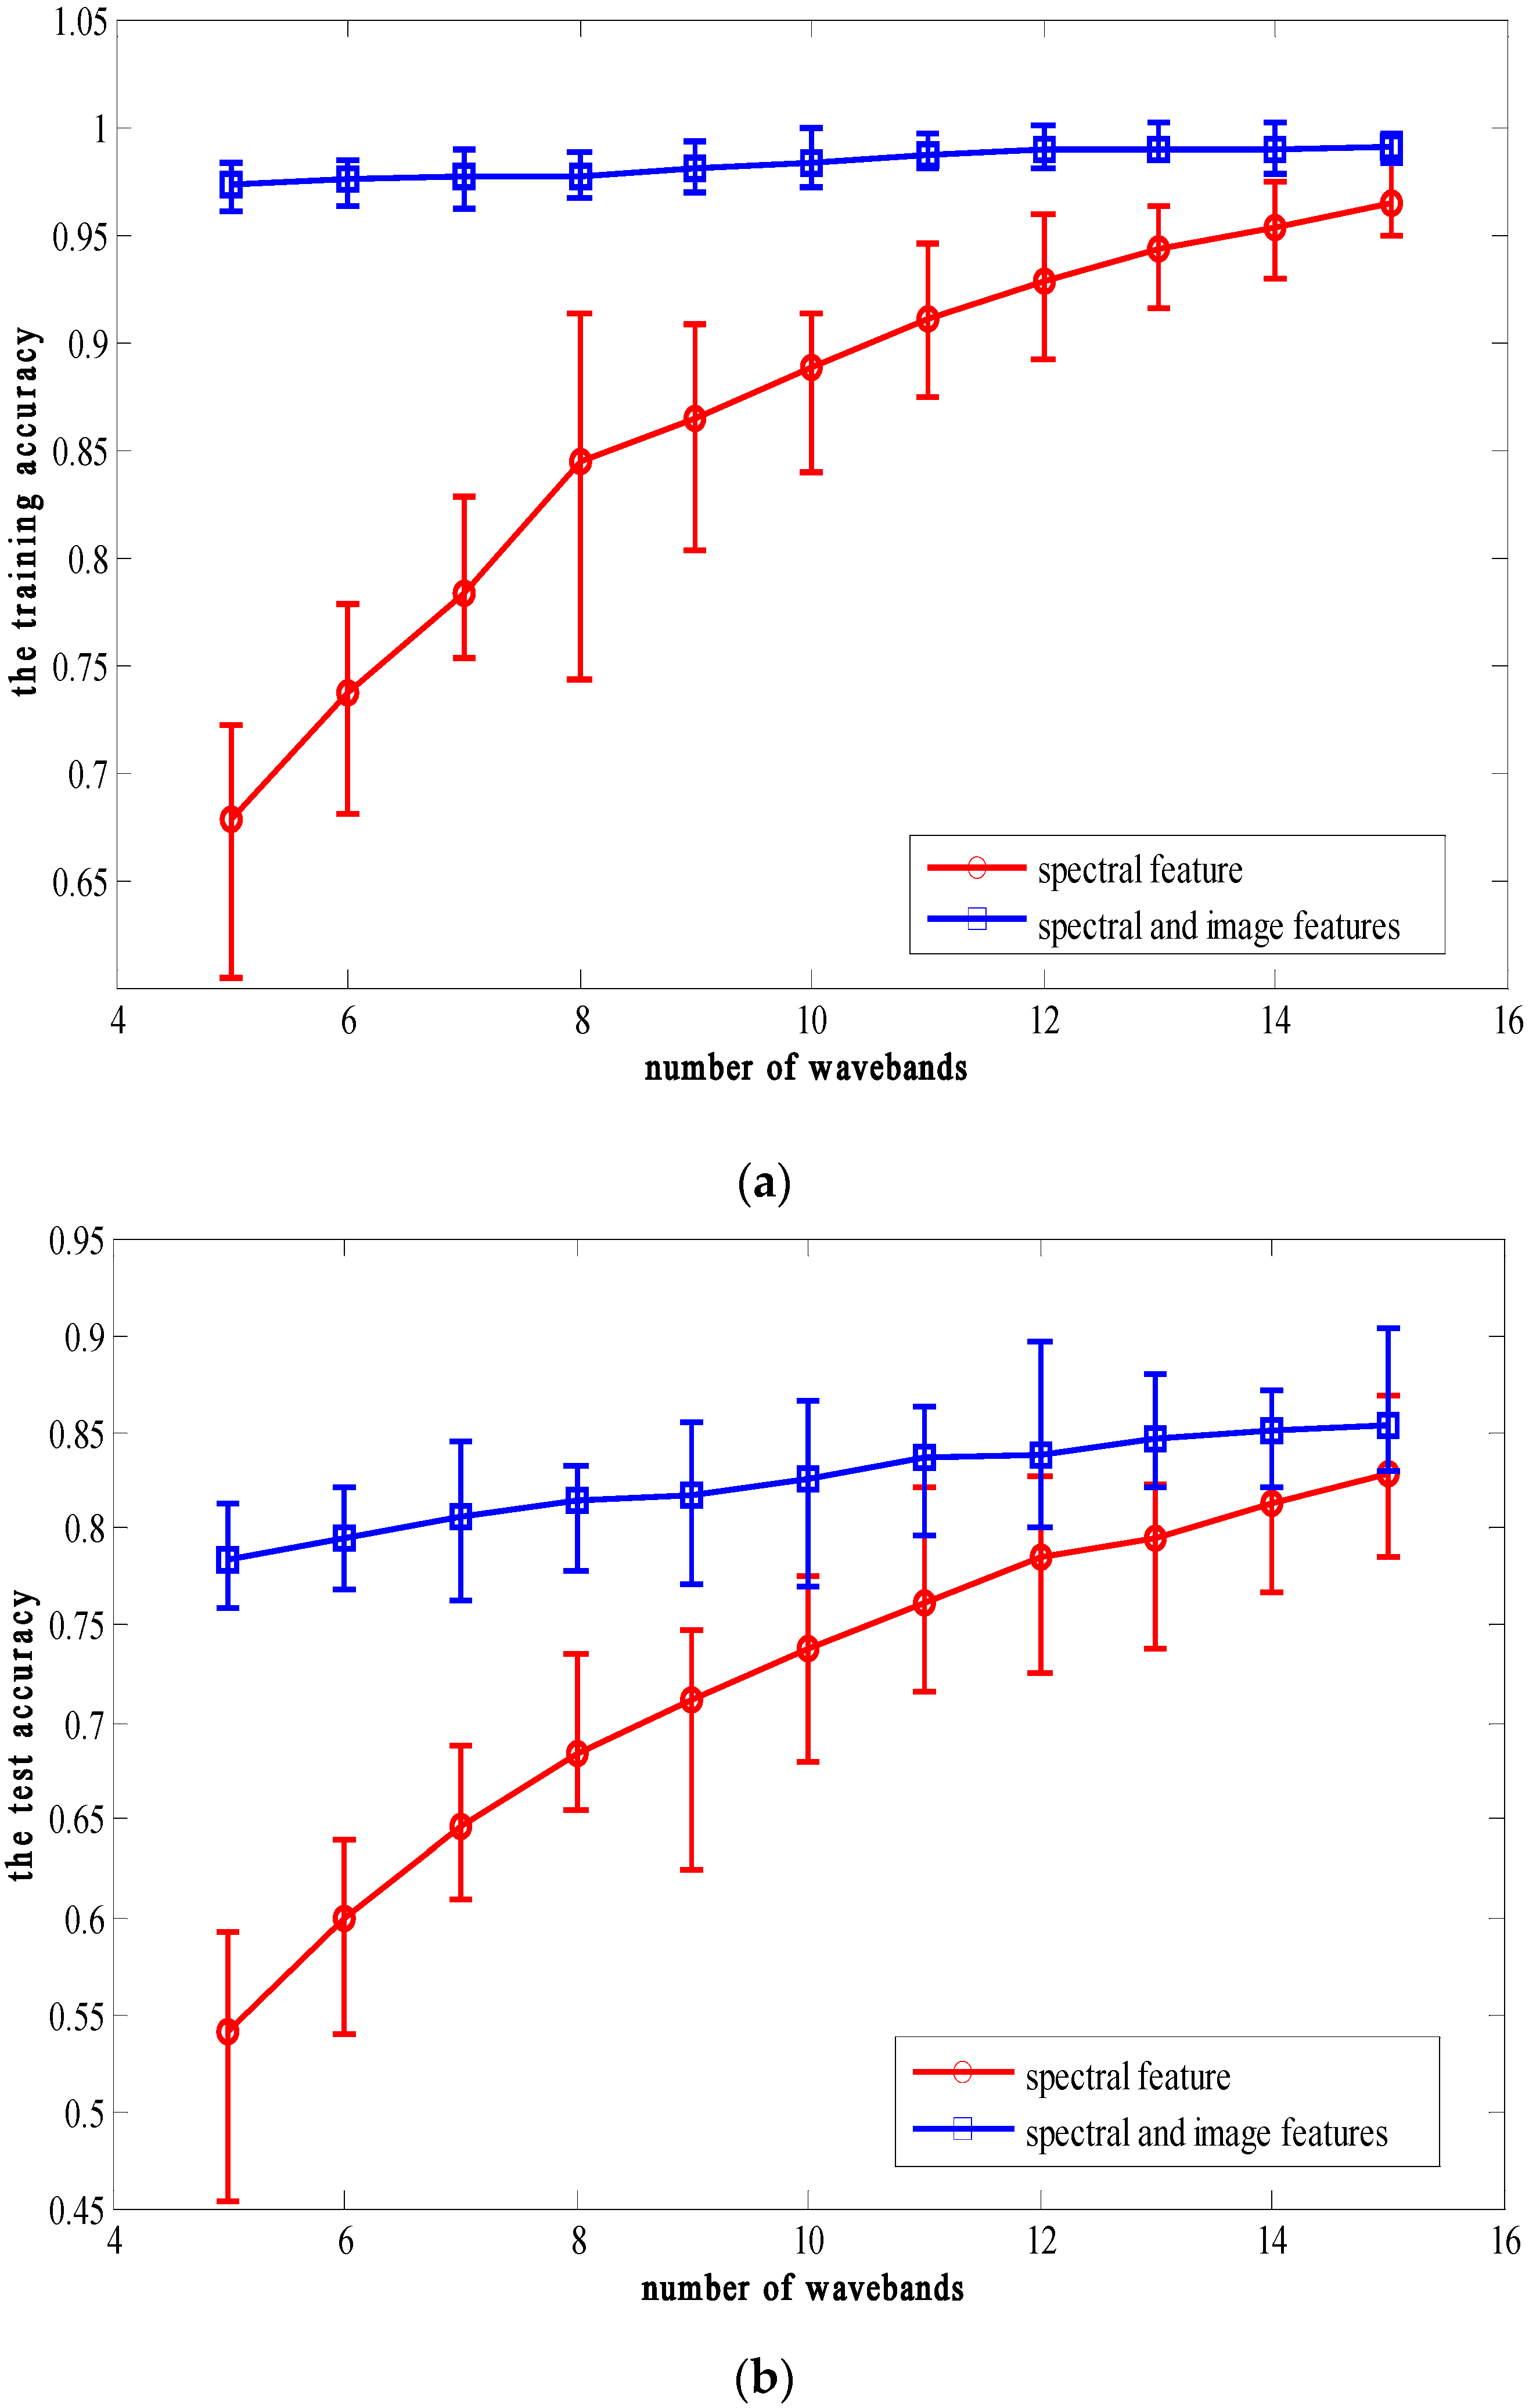
3.2. Classification Results Using the Integration of Spectral and Image Features Based on the Optimal Wavelengths

Figure 4a,b summarize the performance of models developed using the spectral features and the integration of spectral and image features for 10 random runs. The average training and test accuracies of the model using the spectral features are highly correlated with the number of selected optimal wavelengths, and the average accuracies increase significantly with the increase in the number of selected wavelengths. When the number of selected wavelengths varies between 5 and 15, the average classification accuracies of the model using the spectral features are between 68% and 94% for the training set and between 54% and 78% for the test set. For the model using the integration of the spectral features and image features, the effect of wavelength number on classification accuracy is less than that of the model using the spectral features. The model using the integration of the spectral features and image features achieves above 97% of the average training accuracy and between 75% and 85% of the average test accuracy under different wavelength numbers (varying between 5 and 15). The classification accuracies using the integration of the spectral and image features are always better than those using spectral features alone. This result further proves that the integration of the spectral and image features extracted from hyperspectral images can improve the classification accuracy of seeds reported by Wang et al. [15]. Moreover, for the same number of optimal wavelengths, the variation of accuracies of the model using the integration of the spectral and image features is smaller than that of the model using the spectral features in 10 runs. Therefore, the model using the integration of the spectral and image features is more stable than that using the spectral features in the classification accuracy.
To consider comprehensively the speed of data acquisition and processing as well as classification accuracy, the number of optimal wavelengths was set to 11 in this study. The optimal wavelengths selected by SPA were not exactly the same for the 10 random runs. However, several wavelengths, such as 550.7, 555.8, 610.0, 640.9, 669.2, and 743.9 nm, or their adjacent wavelengths were repeatedly selected by SPA. The 11 optimal wavelengths selected by SPA for one random run are shown in Figure 5. The most selected wavelengths for maize seed classification were located in the region of 500–750 nm, and they mainly reflected the absorption of starch and oil contained in seed [16].

3.3. Classification Results Using the Integration of Spectral and Image Features Combined with the Feature Transformation/Reduction Method

After the 11 optimal wavelengths were selected by SPA, a total of 159 features, including 11 spectral, 55 first-order statistics (5 × 11), 88 second-order statistics (8 × 11), and 5 morphologic features, were finally obtained. When these 159 features were used as the input of the LS–SVM, the classifier had the risk of classification accuracy reduction resulting from the dimension disaster caused by feature redundancy and noise contained in the features. Therefore, PCA and MDS were used to achieve feature transformation and eliminate feature redundancy. The 60 principal components obtained by PCA or MDS were employed for developing the LS–SVM classification model. The classification results for the two feature transformation/reduction methods are presented in Table 1. The LS–SVM models using PCA achieved 99.87% and 92.65% average classification accuracies for the training set and test set, respectively, while the LS–SVM model using MDS obtained 99.85% average training accuracy and 92.19% average test accuracy. The test accuracies for both PCA and MDS were significantly better than that of the non-transformed/reduced model with 83.68% although their average training accuracies were almost the same. The non-transformed/reduced model yielded above 90% test accuracy for 4 varieties (Gumang178, Jizaojinxiangnuo, Yudan998, and Zhendan958), between 80% and 90% for 7 varieties (BNA07, Jinnuowang, Jinsaitian, Jingketian195, Lianyu16, Nongda108, and Sida205), and between 70% and 80% for 6 varieties (SNN12, Bositian8, Huayu11, Wannuo11, Xiangtiannianyumi, and Zhongnongdatian413). The model using PCA achieved between 80% and 90% test accuracy for 3 varieties (Bositian8, Jingketian195, and Sida205) and above 90% for the remaining 14 varieties. The model using MDS obtained between 80% and 90% test accuracy for 4 varieties (Bositian8, Jingketian195, Sida205, and Zhongnongdatian413) and above 90% for the other varieties. The model using PCA and MDS significantly improved the classification accuracies for 12 varieties, with improvements of 7.43%–26.09% and 6.09%–27.38% over those of the non-transformed/reduced model.

4. Conclusions

In this study, the classification model using the integration of spectral and image features combined with feature transformation/reduction was employed for maize seed classification based on hyperspectral imaging. The classification results showed that the integration of the spectral and image features combined with feature transformation/reduction can provide much useful information for seed classification and reduce the occurrence of a dimension disaster. The LS–SVM model using the integration of spectral and image features extracted from 11 optimal wavelengths selected by SPA combined with feature transformation/reduction achieved more than 92% classification results for the test set. This percentage was significantly better than the 83.68% obtained when using the integration of spectral and image features alone. This procedure provides a possible way to apply the multispectral imaging system to classify seeds varieties with high accuracy.

Acknowledgments

The authors gratefully acknowledge the financial support from the National Natural Science Foundation of China (Grant No. 61271384, 61275155), the 111 Project (B12018), and QingLan Project.

Author Contributions

Min Huang, Chujie He and Qibing Zhu conceived and designed the experiments; Min Huang performed the experiments; Qibing Zhu and Jianwei Qin analyzed the data; Min Huang and Chujie He wrote the paper. All authors collaborated on the interpretation of the results and on the preparation of the manuscript.

Conflicts of Interest

The authors declare no conflict of interest.

References

  1. Tenaillon, M.I.; Charcosset, A. A European perspective on maize history. C. R. Biol. 2011, 334, 221–228. [Google Scholar] [CrossRef] [PubMed]
  2. Liu, L.; Wang, Y. Brief analysis of maize seed purity electrophoresis identification. Seed World 2000, 1, 21. [Google Scholar]
  3. Zhu, D.; Wang, C.; Pang, B.; Shan, F.; Wu, Q.; Zhao, C. Identification of wheat cultivars based on the hyperspectral image of single seed. J. Nanoelectron. Optoe. 2012, 7, 167–172. [Google Scholar] [CrossRef]
  4. Su, Q.; Wu, W.; Wang, H.; Wang, K.; An, D. Fast discrimination of varieties of corn based on near infrared spectra and biomimetic pattern recognition. Spectrosc. Spectr. Anal. 2009, 29, 2413–2416. [Google Scholar]
  5. Zhang, Y.; Zhang, L.; Bai, Q.; Chen, S. Nondestructive identification of different oil content maize kernels by near-infrared spectra. Spectrosc. Spectr. Anal. 2009, 29, 686–689. [Google Scholar]
  6. Dana, W.; Ivo, W. Computer image analysis of seed shape and seed color for flax cultivar description. Comput. Electron. Agr. 2008, 61, 126–135. [Google Scholar] [CrossRef]
  7. Khatchatourian, O.; Padilha, F.R.R. Soybean varieties recognition through the digital image processing using artificial neural network. Eng. Agric. 2008, 28, 759–769. [Google Scholar]
  8. Hadzli, H.; Fairul, N.O.; Syed, A.M.J.; Muhammad, A.H.; Hajar, M.S. An Intelligent Classification Model for Rubber Seed Clones Based on Shape Features through Imaging Techniques. In Proceeding of the International Conference on Intelligent Systems, Modelling and Simulation, Liverpool, UK, 27–29 January 2010.
  9. Wang, Y.; Liu, X.; Su, Q.; Wang, C. Maize seeds varieties identification based on multi-object feature extraction and optimized neural network. Trans. CSAE 2010, 26, 199–204. [Google Scholar]
  10. Lu, R.; Park, B. Hyperspectral Imaging Technology in Food and Agriculture; Springer, Food Engineering Series: New York, NY, USA, 2015. [Google Scholar]
  11. Mahesh, S.; Manickavasagan, A.; Jayas, D.S.; Paliwal, J.; White, N.D.G. Feasibility of near-infrared hyperspectral imaging to differentiate Canadian wheat classes. Biosyst. Eng. 2008, 101, 50–57. [Google Scholar] [CrossRef]
  12. Serranti, S.; Cesare, D.; Marini, F.; Bonifazi, G. Classification of oat and groat kernels using NIR hyperspectral imaging. Talanta 2013, 103, 276–284. [Google Scholar] [CrossRef] [PubMed]
  13. Zhu, Q.; Feng, Z.; Huang, M.; Zhu, X. Maize seed identification using hyperspectral imaging and SVDD algorithm. Spectrosc. Spectr. Anal. 2013, 33, 517–521. [Google Scholar]
  14. Huang, M.; Tang, J.; Yang, B.; Zhu, Q. Classification of maize seeds of different years based on hyperspectral imaging and model updating. Comput. Electron. Agric. 2016, 122, 139–145. [Google Scholar] [CrossRef]
  15. Wang, L.; Sun, D.; Pu, H.; Zhu, Z. Application of Hyperspectral Imaging to Discriminate the Variety of Maize Seeds. Food Anal. Methods 2016, 9, 225–234. [Google Scholar] [CrossRef]
  16. Yang, X.; Hong, H.; You, Z.; Cheng, F. Spectral and Image Integrated Analysis of Hyperspectral Data for Waxy Corn Seed Variety Classification. Sensors 2015, 15, 15578–15594. [Google Scholar] [CrossRef] [PubMed]
  17. Gerrit, P.; Gerie, W.A.M.; van der Heijden, L.C.; Paul, K.; Ian, T.Y. Calibration and characterization of imaging spectrographs. J. Near Infrared Spec. 2003, 11, 193–210. [Google Scholar]
  18. Sezgin, M.; Sankur, B. Survey over image thresholding techniques and quantitative performance evaluation. J. Electron. Imaging 2004, 13, 146–165. [Google Scholar]
  19. Araújo, M.C.U.; Saldanha, T.C.B.; Galvão, R.K.H.; Yoneyama, T.; Chame, H.C.; Visani, V. The successive projections algorithm for variable selection in spectroscopic multicomponent analysis. Chemometr. Intell. Lab. Syst. 2001, 57, 65–73. [Google Scholar] [CrossRef]
  20. Galvão, R.K.H.; Araujo, M.C.U.; José, G.E.; Pontes, M.J.C.; Silva, E.C.; Saldanha, T.C.B. A method for calibration and validation subset partitioning. Talanta 2005, 67, 736–740. [Google Scholar] [CrossRef] [PubMed]
  21. Galvao, R.K.H.; Araujo, M.C.U.; Fragoso, W.D.; Silva, E.C.; Jose, G.E.; Soares, S.F.C.; Paiva, H.M. A variable elimination method to improve the parsimony of MLR models using the successive projections algorithm. Chemometr. Intell. Lab. Syst. 2008, 92, 83–91. [Google Scholar] [CrossRef]
  22. Battiti, R. Using mutual information for selecting features in supervised neural net learning. ITNN 1994, 5, 537–550. [Google Scholar] [CrossRef] [PubMed]
  23. Peng, H.; Long, F.; Ding, C. Feature selection based on mutual information: Criteria of max-dependency, max-relevance, and min-redundancy. ITPAM 2005, 27, 1226–1238. [Google Scholar]
  24. Paliwal, J.; Visen, N.; Jayas, D. Evaluation of neural network architectures for cereal grain classification using morphological features. J. Agric. Eng. Res. 2001, 79, 361–370. [Google Scholar] [CrossRef]
  25. Liu, Z.; Cheng, F.; Ying, Y.; Rao, X. Identification of rice seed varieties using neural network. J. Zhejiang Univ. Sci. B. 2005, 6, 1095–1100. [Google Scholar] [CrossRef] [PubMed]
  26. Mery, D.; Pedreschi, F.; Soto, A. Automated design of a computer vision system for visual food quality evaluation. Food. Bioprocess. Tech. 2012, 6, 2093–2108. [Google Scholar] [CrossRef]
  27. Hotelling, H. Analysis of a complex of statistical variables into principal components. J. Educ. Psychol. 1933, 24, 417–441. [Google Scholar] [CrossRef]
  28. Cox, T.; Cox, M. Multidimensional scaling; Chapman and Hall: London, UK, 1994. [Google Scholar]
  29. Vapnik, V.N. Statistical Learning Theory; John Wiley and Sons: Hoboken, NJ, USA, 1998. [Google Scholar]
  30. Suykens, J.A.K.; Brabanter, J.D.; Lukas, L.; Vandewalle, J. Weighted least squares support vector machines: Robustness and sparse approximation. Neurocomputing 2002, 48, 85–105. [Google Scholar] [CrossRef]
  31. Wu, D.; He, Y.; Feng, S. Short-wave near-infrared spectroscopy analysis of major compounds in milk powder and wavelength assignment. Anal. Chim. Acta 2008, 610, 232–242. [Google Scholar] [CrossRef] [PubMed]
  32. Drochioiu, G.; Ciobanu, C.I.; Bancila, S.; Ion, L.; Petre, B.A.; Andries, C.; Gradinaru, R.V.; Murariu, M. Ultrasound-based protein determination in maize seeds. Ultrason. Sonochem. 2016, 29, 93–103. [Google Scholar] [CrossRef] [PubMed]
Figure 1. The appearance of maize seeds of 17 varieties. (1. BNA07, 2. SNN12, 3. Bositian8, 4. Gumang178, 5. Huayu11, 6. Jizaojinxiangnuo, 7. Jinnuowang, 8. Jinsaitian, 9. Jingketian195, 10. Lianyu16, 11. Nongda108, 12. Sida205, 13. Wannuo11, 14. Xiangtiannianyumi, 15. Yudan998, 16. Zhendan958 and 17. Zhongnongdatian413).
Applsci 06 00183 g001
Figure 2. Image segmentation procedure and feature extraction. (a) representative spectral hypercube with 233 band images of maize seeds within the wavelength region of 400–1000 nm; (b) raw hyperspectral image at 782.6 nm used for segmentation of the maize seeds; (c) image after filtering and enhancement; (d) image after threshold segmentation; (e) the obtained mask is applied to segment the true regions of maize seeds from the 233 wavebands in the hypercube; and (f) extraction of the average reflectance spectra from region of interest (ROI) images.
Applsci 06 00183 g002
Figure 3. Mean reflectance spectra for the 17 varieties of maize seeds within the wavelength range of 400–1000 nm.
Applsci 06 00183 g003
Figure 4. (a) The training accuracies of model developed only using the spectral feature and model developed using integration of the spectral and image features; (b) The test accuracies of model developed only using the spectral feature and model developed using the integration of the spectral and image features.
Applsci 06 00183 g004
Figure 5. The 11 optimal wavebands selected by the successive projections algorithm (SPA) for one random run.
Applsci 06 00183 g005
Table 1. The classification results using integration of the spectral and image features extracted from the 11 optimal wavebands combined with principle component analysis (PCA) and multidimensional scaling (MDS).
VarietyThe Training AccuracyThe Test Accuracy
NonePCAMDSNonePCAMDS
BNA0799.06%99.84%100%87.82%95.00%94.69%
SNN1297.97%99.84%99.69%76.88%91.54%92.19%
Bositian898.28%100%100%74.38%86.56%85.00%
Gumang178100%100%100%95.32%97.82%98.44%
Huayu1199.38%100%100%77.81%94.07%95.63%
Jizaojinxiangnuo100%100%100%91.57%95.94%95.00%
Jinnuowang96.88%100%100%86.25%94.07%94.69%
Jinsaitian98.13%99.53%99.53%81.25%92.50%89.38%
Jingketian19597.97%99.69%99.53%84.06%83.75%84.38%
Lianyu1697.50%99.69%99.84%83.44%94.69%93.44%
Nongda10898.13%99.69%99.68%85.32%94.07%94.69%
Sida20598.75%100%100%85.00%85.32%85.63%
Wannuo1197.50%100%99.84%78.75%91.25%90.32%
Xiangtiannianyumi99.06%99.53%99.69%71.88%90.63%91.56%
Yudan99899.84%99.84%100%95.94%97.81%96.88%
Zhendan95899.06%100%100%92.50%99.38%98.13%
Zhongnongdatian41398.59%99.84%100%74.38%90.94%87.19%
Average98.69%99.85%99.87%83.68%92.65%92.19%

