Article

Deranged Dimensionality of Vestibular Re-Weighting in Multiple Chemical Sensitivity

1
Department of Clinical Sciences and Translational Medicine, University of Rome Tor Vergata, Rome 00133, Italy
2
Neuroscience Unit, Department of Systems Medicine, University of Rome Tor Vergata, Rome 00133, Italy
3
Department of Biology, University of Rome Tor Vergata, Rome 00133, Italy
4
Department of Experimental Medicine, “La Sapienza” University, Rome 00185, Italy
*
Author to whom correspondence should be addressed.
Appl. Sci. 2016, 6(11), 330; https://doi.org/10.3390/app6110330
Submission received: 22 August 2016 / Revised: 24 October 2016 / Accepted: 25 October 2016 / Published: 2 November 2016

Abstract

:
Background: Multiple chemical sensitivity (MCS) is a chronic multisystem condition characterized by low levels of multiple chemical susceptibility inducing a spectrum of central nervous system symptoms, including dizziness. Thus, considering (i) the overlapping psychogenic and organic burdens shared in MCS development and in vestibular disorders; (ii) the number of previous studies describing central processing impairment related to inner ear inflow in this syndrome; and (iii) the lack of literature with respect to clinical evidence of the presentation of MCS dizziness, the purpose of the present study was to highlight the possible hidden aspects of vestibular impairment by applying the recent contribution of implemented otoneurological testing, inferential statistic and principal component (PC) analysis in 18 MCS and 20 healthy subjects (HC); Methods: Both groups filled in a dizziness and environment exposure inventory and underwent the Rod and Disc and Rod and Frame Test, video Head Impulse Test (vHIT) and Static Posturography Test (SPT) with fast Fourier Transform (FFT). Between-group analysis of variance and PC analysis implemented on otoneurological variables were performed; Results: Defective vestibular processing was identified in 18 MCS patients (11 female and 7 male; mean age 49.5 ± 9.3 years) by finding a significant increase in SPT and FFT parameters and in Visual Dependency (VD) behaviour and a decrease in vHIT scores. Component correlation analysis in MCS showed a positive correlation of FFT parameters in PC1 and SPT parameters in PC2 with a negative correlation of vHIT and VD values in PC2. HC subjects demonstrated a positive correlation of VD and SPT parameters in PC1 and FFT parameters in PC2. Conclusion: Inferential and PC analysis provided the opportunity to disclose such possible hidden phenomena to (i) support that MCS physiopathological cascades could lead to a vestibular decay; and (ii) suggest rearrangement of the dimension of the variables as an aspect of near-optimal re-weighting, possibly underpinning the dizzy symptoms complained of by MCS patients.

Graphical Abstract

1. Introduction

Multiple chemical sensitivity (MCS) is a chronic polysymptomatic, multisystem condition characterized by subjective susceptibility to low levels of a wide spectrum of environmental compounds (such as petrol, perfume or pesticides) [1,2]. It constitutes a relatively common clinical diagnosis in western populations [2], considering that the prevalence of self-reported chemical sensitivity symptoms in population-based studies has been found to range from 9% to 33% [2]. Relapsing and remitting central nervous system (CNS) manifestations including difficulty concentrating, memory problems, fatigue, depression, daytime sleepiness, “spaciness” (derealisation), tension, irritability and dizziness are commonly referred to by the patients [2,3].
Major criteria to define the clinical spectrum of MCS were introduced by Cullen [4]; however, the discussion on definition and nomenclature reflects the fact that the aetiology of MCS is still unclear and a matter of debate [2,5]. The most frequently discussed aetiologies include neurogenic inflammation [6], classical conditioning [7] and biochemical disruptions [8]. According to the neural sensitization theory, MCS is attributed to a pathological hyper-reactivity of neurons in olfactory and limbic areas of the brain [9]. However, the altered CNS responses are hypothesized to be paralleled by increased anxiety, avoidance, anticipatory stress [9] and attention bias [6] to chemical exposure. According to these theories, several studies in the last few years have shown cerebral blood flow distribution abnormalities in patients with MCS, especially while processing odorous substances [10,11,12]. In particular, MCS sufferers have been seen to react peculiarly to sensory stimuli, with activation of brain areas connected with motivational, emotional and non-conscious processing of information, such as the amygdala and the hippocampus, encompassed in the limbic system [10,11,12,13,14], whose pathways are known to mediate CNS sensitization and their dysregulation contributes to abnormalities of behaviour and mood, endocrine, autonomic and immune function [15].
In turn, the same brain circuits seem to be pivotal in vestibular processing, given the fact that the limbic system—previously thought to be engaged in the physiopathological underpinning of this disorder [1]—receives neural input from the vestibular cortex, and therefore it could be involved in vestibular stream processing also below the level of awareness [16,17].
To screen populations for MCS correctly, Miller and Prihoda developed the environment exposure sensitivity inventory (EESI) and its quick form (QEESI), which are considered the most reliable tools for research on patients complaining of chemical sensitivity [18].
For instance, researchers have investigated the association between chemical sensitivity and other kinds of environmental intolerances, including noise and olfactory sensitivity [19]. This has been carried out principally by means of questionnaire surveys in clusters of healthy and affected subjects (i.e., teenage students, twins) and, although overlapping phenomena involving physiopathological aspects of MCS and vestibular processing are possible, any research on intolerance to chemicals and vestibular disorder had been devised previously.
Thus, due to (i) the overlapping psychogenic and organic burdens that, below the level of consciousness, are shared not only in MCS development but also in the vestibular disorders [1,10,11,12,13,15,16,17,20]; (ii) the number of previous studies describing central processing impairment related to inner ear inflow in this syndrome [21,22]; and (iii) the lack of literature on clinical evidence of the presentation of dizziness [2,3], the purpose of the present exploratory study was to highlight the possible MCS hidden clinical/subclinical aspects of vestibular impairment by inferential and principal component (PC) analysis applied on the contribution of recently implemented otoneurological testings. This, with the aim of disclosing possible implementations in diagnosing and monitoring undiscovered aspects underpinning the natural history of MCS, will possibly assist in suggesting future treatment choices in a clinical setting.

2. Experimental Section

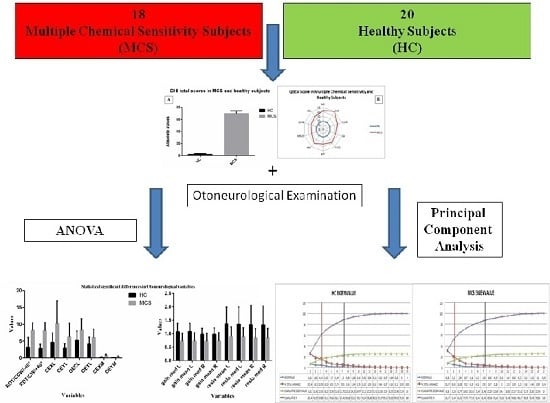
2.1. Participants And Study Design

Twenty-three consecutive MCS subjects were enrolled in the study. Diagnosis of MCS was achieved according to the US Consensus Criteria for MCS [23] and the revisions proposed by Lacour et al. [24].
We also enrolled 20 gender- and age-matched healthy subjects serving as the control group (HC).
By means of a thorough medical history, collected by experienced specialized medical personnel, both eligible MCS and HC subjects were required to report a negative anamnesis for malignancy, head trauma, neuropsychiatric disorders, metabolic, cardiovascular, endocrine, infectious and otoneurological diseases. The peripheral blood of MCS and HC was tested for the usual parameters and neurological as well as neuropsychiatric disturbances were excluded with the Mini Mental State Examination, Magnetic Resonance Imaging and DSM IV-TR General Help-Seeking Questionnaire. Finally, no patient was pregnant or breastfeeding and all subjects taking drugs possibly affecting vestibular functions were excluded.
The study adhered to the principles of the Declaration of Helsinki and all the participants provided written informed consent after receiving a detailed explanation of the study.

2.2. Otoneurological Testing

After a thorough visual, oculomotor, locomotor and otoneurological clinical examination (the latter including pure tone audiometry and impedance, binocular electrooculography analysis with positional manoeuvres, Head Shaking Test, clinical Head Impulse Test [cHIT] as well as limb coordination, gait observation and Romberg stance Test) performed by an experienced neurologist and otoneurologist, all MCS and HC subjects underwent:
- 
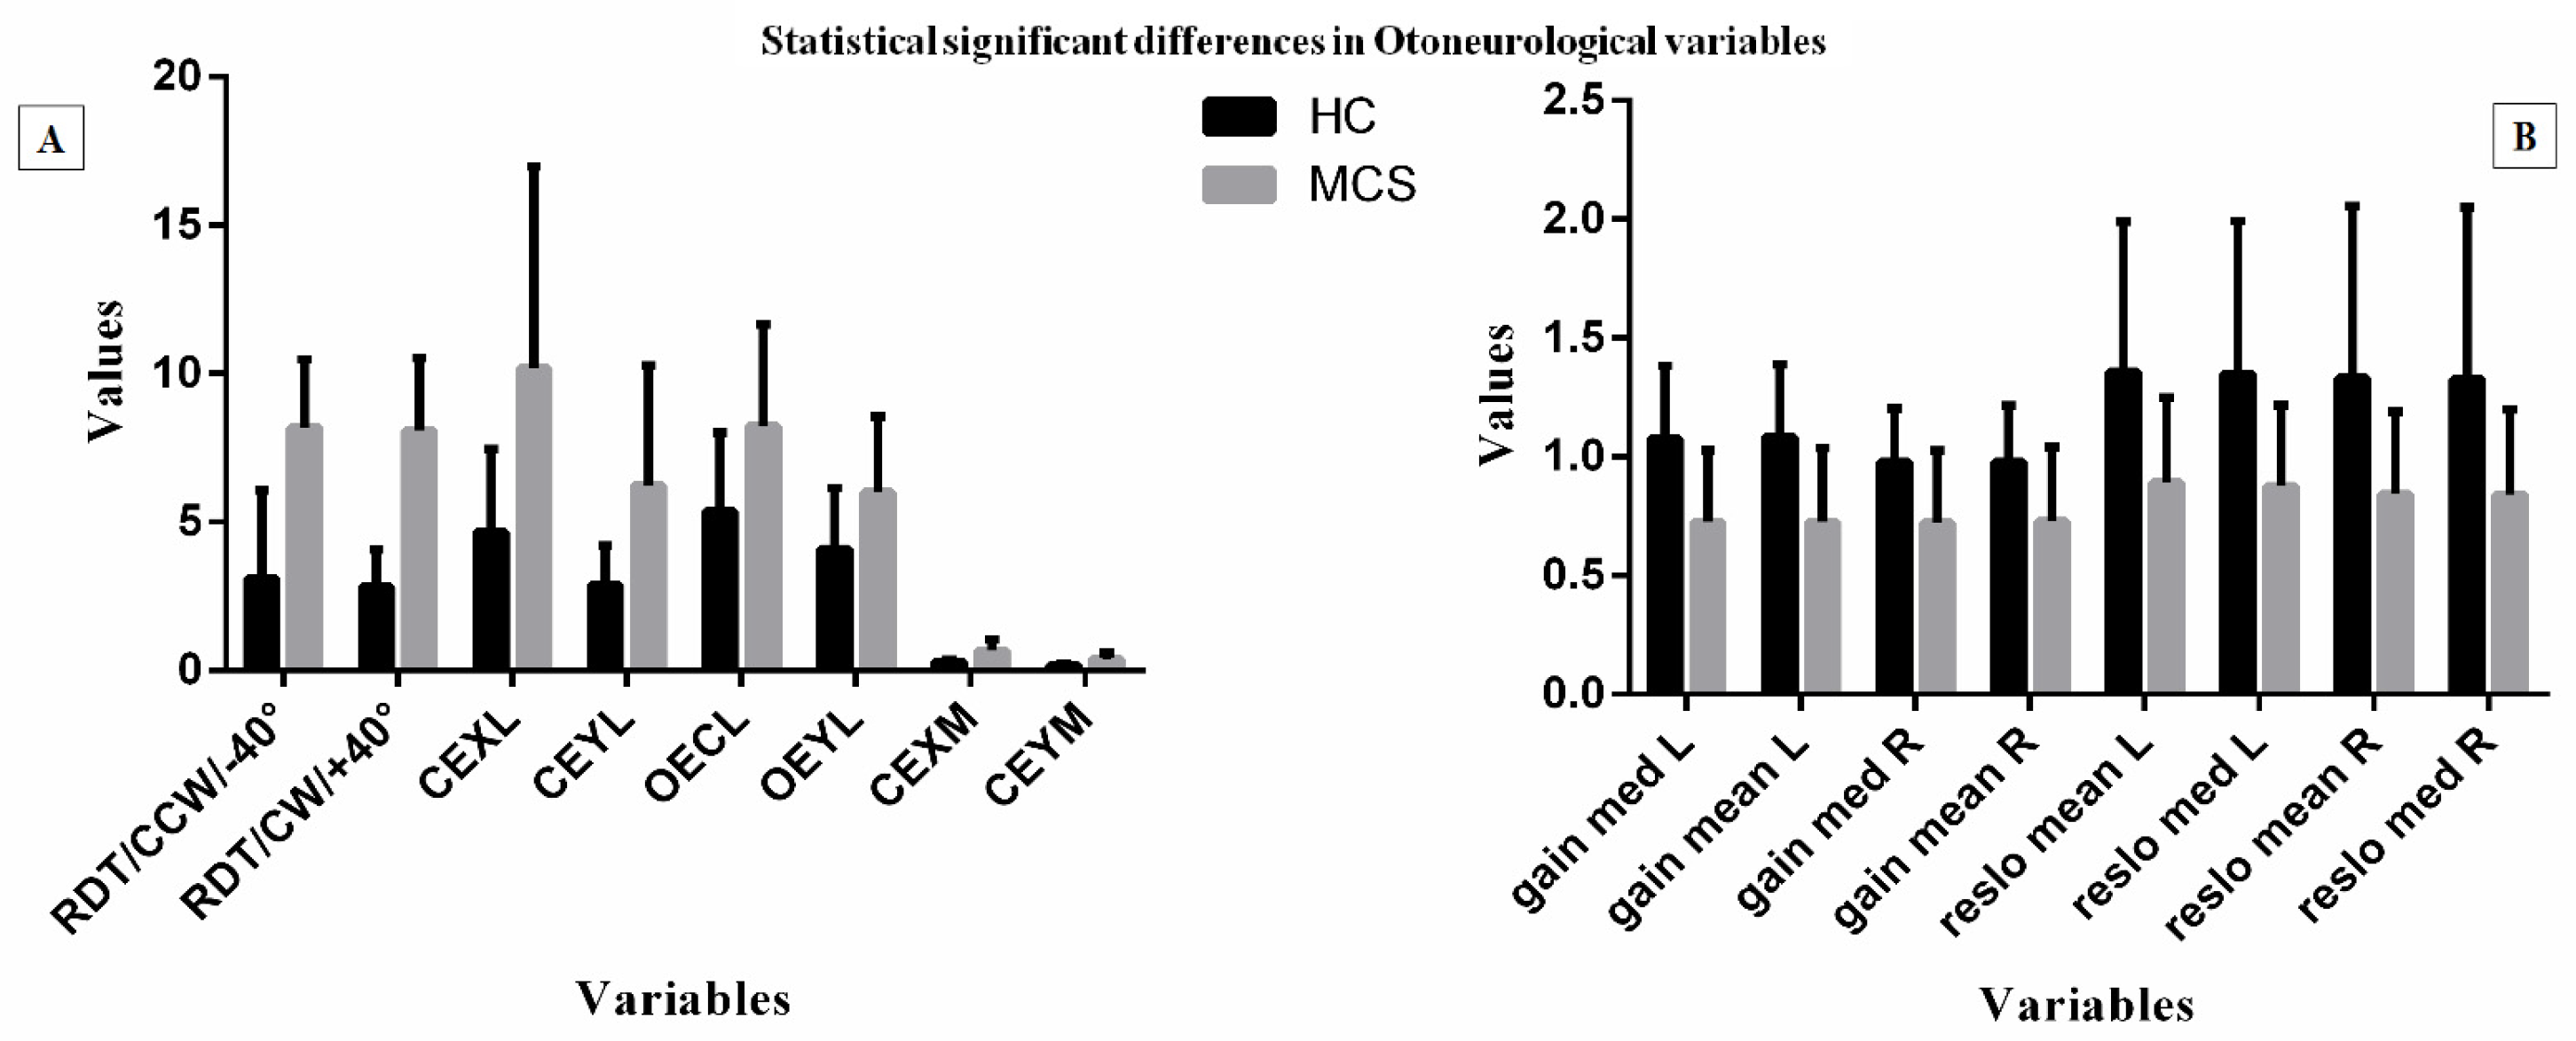
Rod and Disc Test (RDT): According to Cousins et al. [25] visual dependency (VD) was evaluated by means of the RDT software (http://www.imperial.ac.uk/medicine/dizzinessandvertigo) on a laptop computer in order to study visual vertical under kinetic visual stimulation [26,27]. Subjects were seated in front of the computer in a darkened room with their heads held against a viewing cone that blocked extraneous visual orientation cues. The diameter of the cone at the subjects’ eyes was 15 cm with a depth of field of 30 cm, subtending a viewing angle of 39°. The visual stimulus consisted of a luminous white 6 cm rod on a black background. The rod rotated 360° in either direction about its midpoint in the central 11° of the visual filed. Outside this central zone, the viewing screen was filled with a collage of 220 off-white dots, each 8 mm (1.5° of visual field) in diameter, randomly distributed on a black background. Subjects controlled the orientation of the rod with a roller mouse. They were instructed to align the rod to their perceived vertical (the subjective visual vertical) under three conditions. In the first test the collage of dots was stationary (N) while in the second and third the collage rotated at 30°/s clockwise (CW) or counter-clockwise (CCW), respectively. Subjects were tested four times per each condition, presenting the latter two conditions randomly after condition 1. During each trial the rod was initially set randomly at ±40° from vertical and the rod tilt per trial was recorded as the degrees’ difference between true vertical and the subjects’ final rod placement.
- 
Rod and Frame Test (RFT): According to Witkin and Asch [28], in order to study the subjects’ visual vertical tilts under static visual stimulation, a standard RFT square frame device described by Fiori et al. [29] was used. The frame was tilted 33° CW, CCW, or not tilted (0°, N); the rod 11° or 22°, CW or CCW. Thus, 12 randomly presented conditions were achieved, each containing three trials [30]. Errors were calculated as deviation from the gravitational vertical position of the rod.
- 
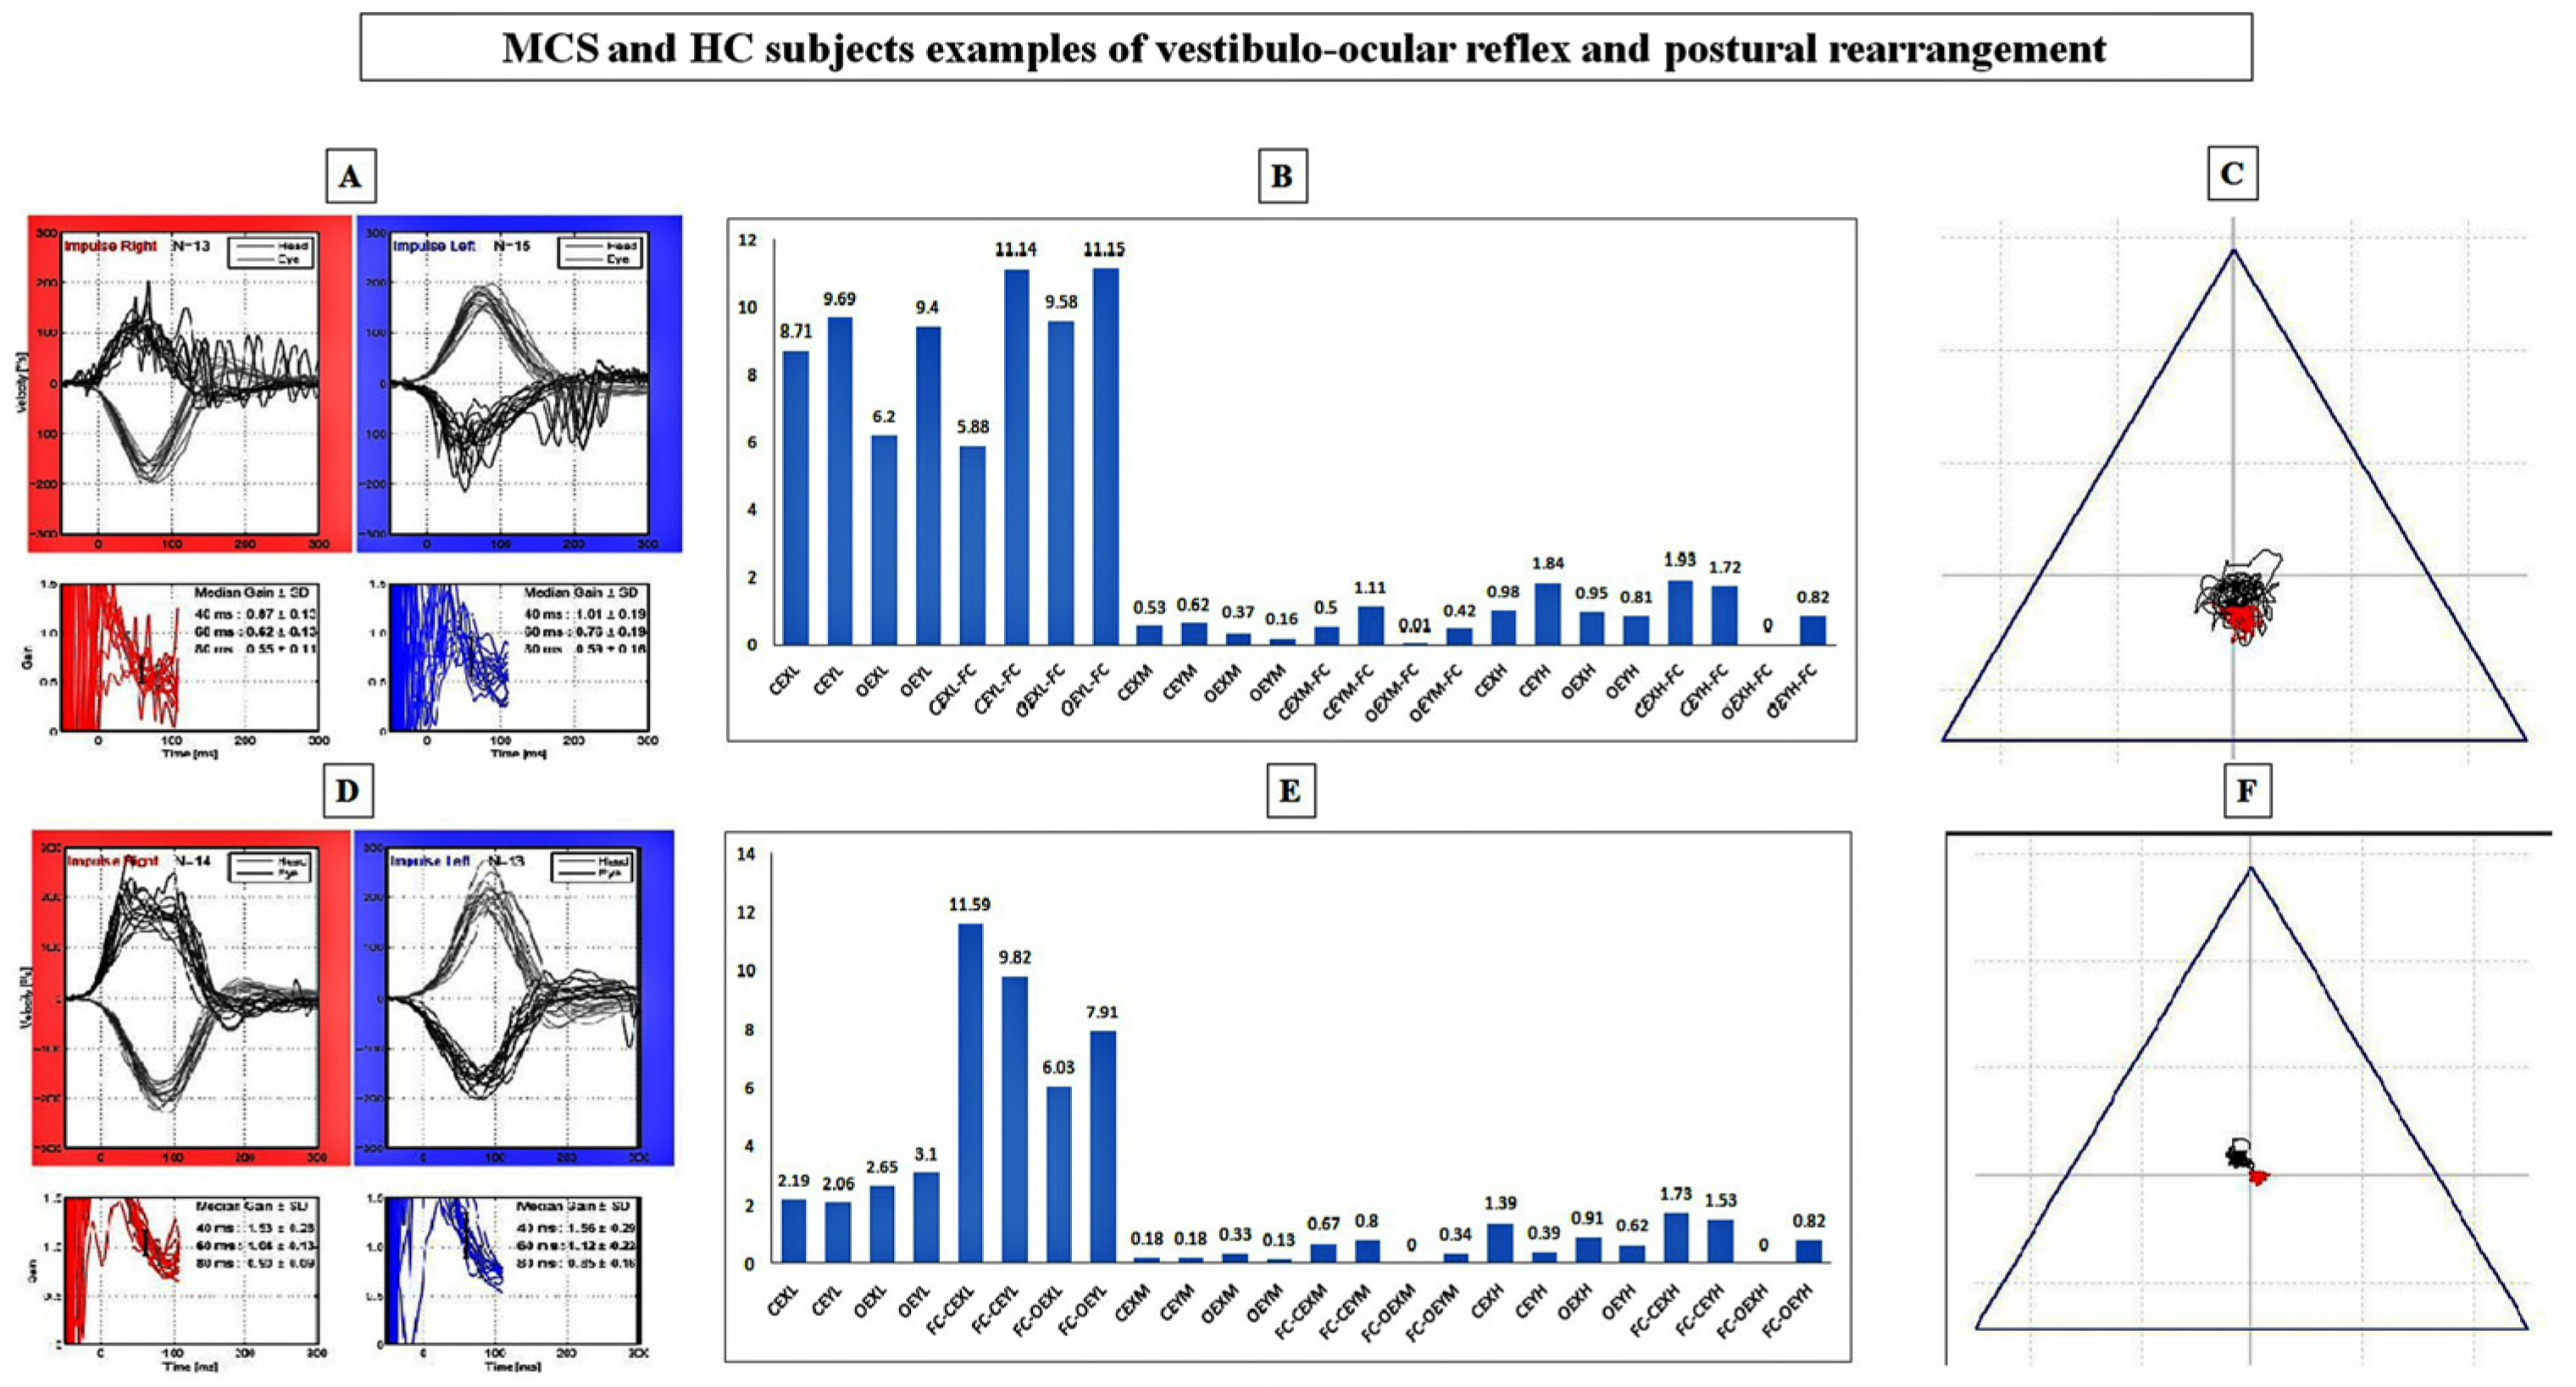
Video Head Impulse Testing (vHIT): For vestibulo-ocular reflex (VOR) gain measurements, the reliability of vHIT [31] (EyeSeeCamTM System [32]) and the technique proposed by Blodow et al. [33] were used to test the lateral semicircular canal. Thus, anomalies in vHIT outcomes were assessed in case of (1) abnormal gain with respect to the calculated normative data; and (2) the presence of refixation saccades. Amplitudes (°/s) and latencies (ms) of both pinpointed refixation and physiological saccades were computed at peak eye velocity (°/s). According to the manufacturer of the software (OtoAccess TM), both side gain mean and median (med) values recorded at 60 ms as well as regression slope (reslo) were calculated and extracted onto an .xls file. Artefacts possibly related to mask slippage and positioning, calibration, handedness of the operator, patients’ neck stiffness and setting of the laboratory, were controlled by means of a technique proposed by McGarvie et al. [34]. According to the technique proposed by the same group [34] to reach adequate numbers of head values for the lateral semi-circular canal, the operator delivered a range of velocities in a random order and direction to achieve at least 10 artefact-free impulses. By means of this technique, 50–60 impulses were delivered in each canal direction to ensure that the desired number of artefact-free responses was achieved.
- 
Static Posturography Testing (SPT): The previously instructed subjects maintained an upright position on a standardized platform for static posturography (EDM Euroclinic®) during a 60 s recording period per condition, defined as eyes closed (CE) or opened (OE) while standing on either the stiff platform (SP) or a 6 cm heightened AIREX® Balance-pad plus foam carpet (FC, AIREX AG, 25% compression resistance, 20 kPa; apparent density 55 kg/m3; tensile strength 260 kPa). The sampling frequency was set at 25 Hz [35,36] and the centre of pressure (CoP) was supervised during the test. Classic posturographic parameter evaluations involving the trace length (length), the surface of the ellipse of confidence (surf), and the mean velocity (avspe) of body sways with relative SD (stdspe) were performed, as well as the fast Fourier transform (FFT) elaboration of oscillations on both the X (right-left) and Y (forward-backwards) planes [35,36]. Time-domain oscillation signals (X and Y) were extracted by the original software manufacturer into .txt format and the FFT elaborations were gained through Matlab software. In order to obtain the FFT of X and Y oscillations, a core function (Appendix A) was implemented using as input the.txt file provided by the software manufacturer. A main script was written to acquire the FFT for each patient, related to four different conditions, by accessing to the above mentioned Matlab function. For each condition the script returned a file containing the normalized value of the FFT for X and Y oscillations. Spectral values (power spectra, PS) of body oscillations were quantified on an .xls file, for every frequency from 0.01 to 5.00 Hz [35,36]. According to previous experiences [35,36], the frequency spectrum was clustered into three groups: 0.01–0.70 Hz (low frequency interval); 0.70–1.00 Hz (middle frequency interval); 1.00–5.00 Hz (high frequency interval). Within each group, the spectral intensity was determined by adding the relative PS and the group mean PS (± SD) [35,36].

2.3. Validated Questionnaires (VQ)

In order to fulfil the exploratory approach of the study all MCS and HC subjects filled in the following forms before instrumental measurement:
(1)
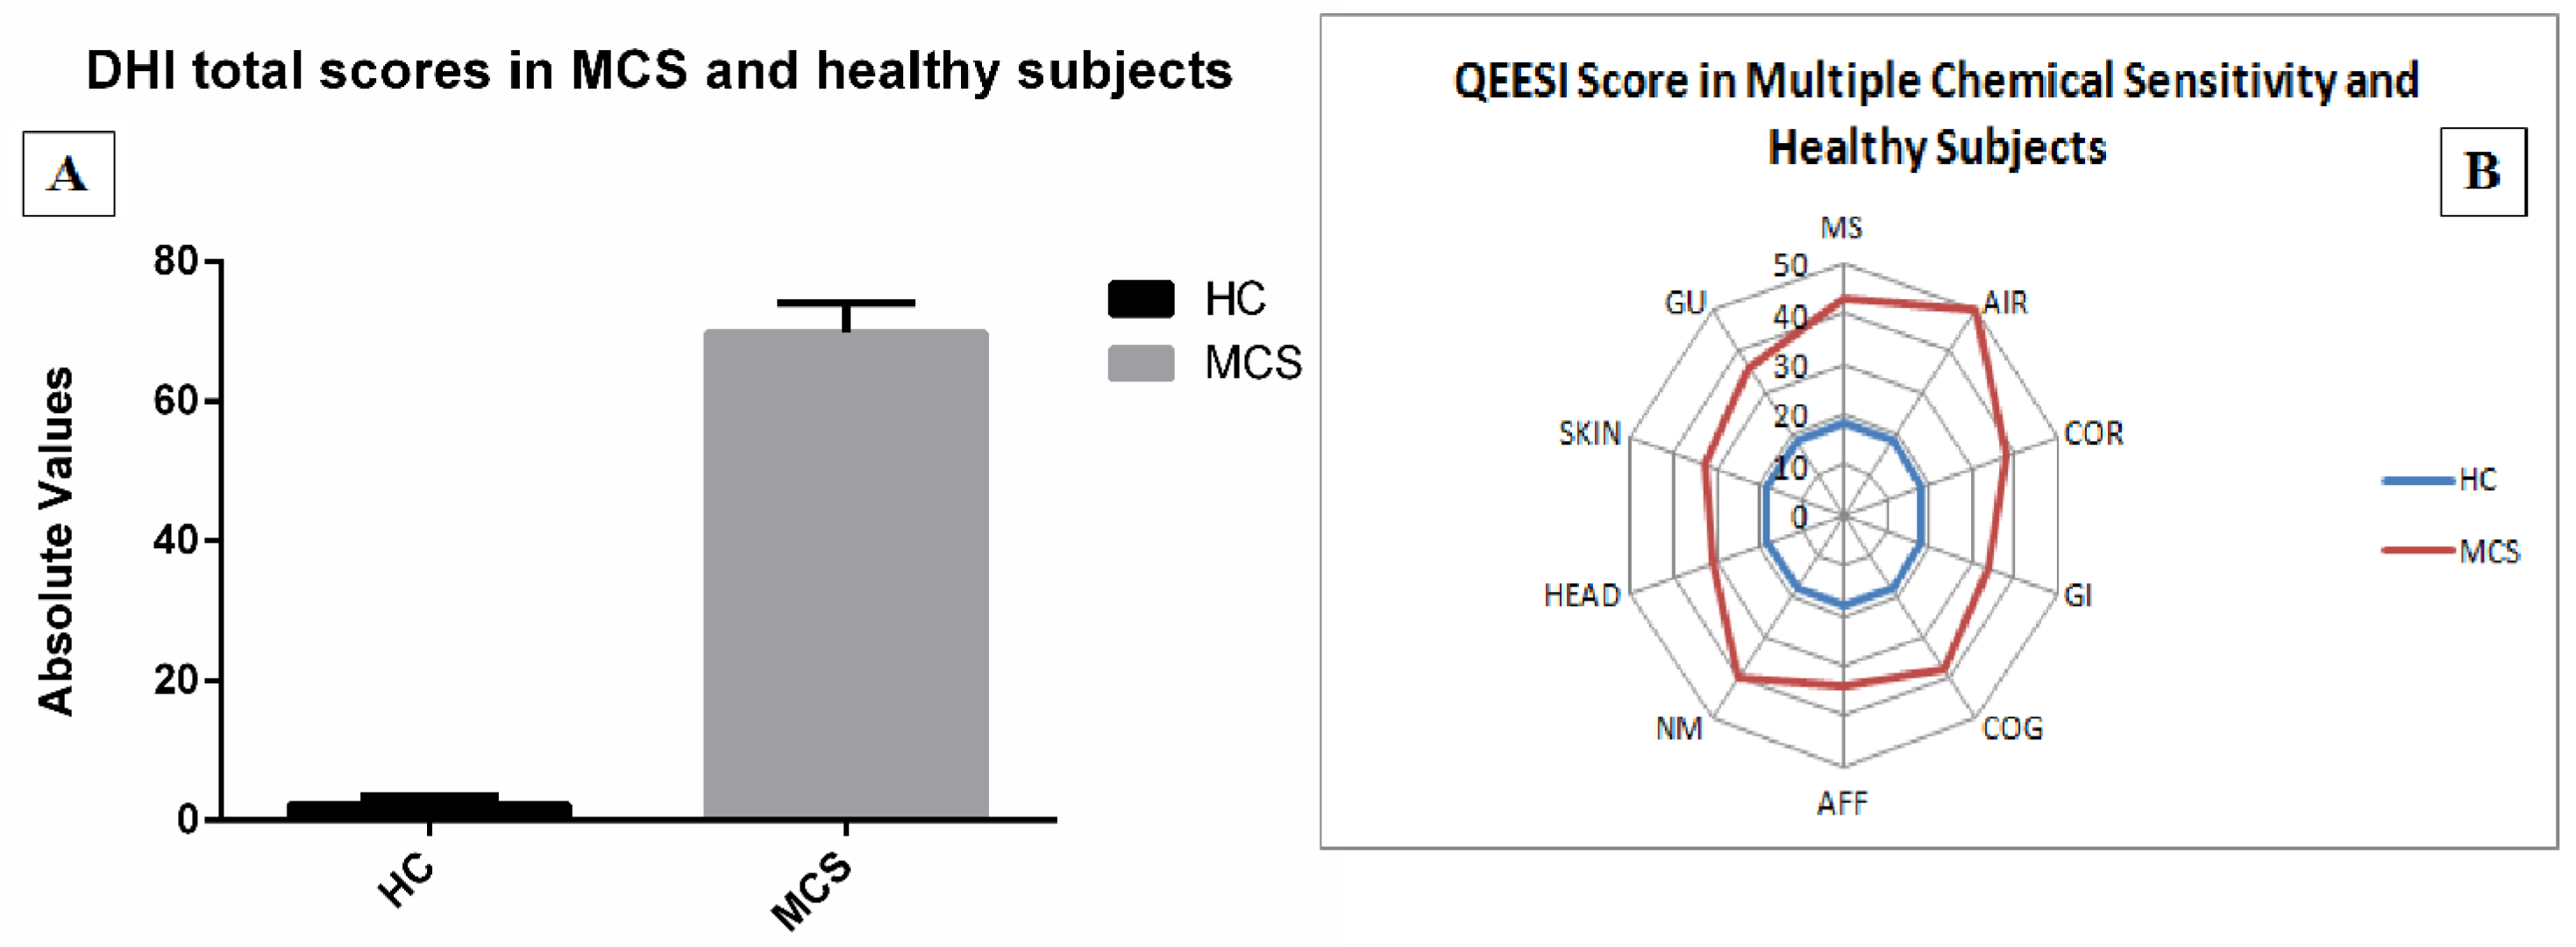
a modified version of the QEESI Symptom Severity scale [37] in which subjects scored from 1 (low) to 3 (severe) the intensity of head-related (HEAD), cognitive-related (COG), affective-related (AFF), neuromuscular-related (NM), musculoskeletal-related (MS), skin-related (SKIN), genitourinary-related (GU), gastrointestinal-related (GI), heart/chest-related (COR), airway or mucous membrane-related (AIR/MM) symptoms.
(2)
the Italian Dizziness Handicap Inventory (DHI), including 25 items aimed at assessing patients’ functional (nine questions), emotional (nine questions) and physical (seven questions) limitations [38] by means a multiple choice scheme: “yes” (4 points), “sometimes” (2 points) and “no” (0 points).

2.4. Data Handling and Statistical Analysis

In order to fulfil the exploratory approach of the study, in which a large number of variables were studied, the protocol data handling was conceived in a double-folded inferential and multivariate statistical analysis:
- Inferential Statistical Analysis
Mean and standard deviations (SDs) for all recorded variables and for QEESI and DHI subscale scores were calculated in both HC and MCS.
In order to assess that data were of Gaussian distribution, the D’Agostino K squared normality test was applied (where the null hypothesis is that the data are normally distributed).
A ‘between-groups’ analysis of variance (ANOVA) was performed for each VQ and otoneurological variable. Age and gender were handled as continuous and categorical predictors, respectively.
This study tested the null hypothesis (H0) that the two group measurements would not show any statistically significant difference. The significant cut-off level (α) was set at a p value of 0.01 and the Bonferroni correction for multiple comparisons was performed with post hoc tests of significant main effects. Thus, p levels associated with the difference between the two groups were considered as statistically significant if lower than 0.01.
Then, Spearman’s rank correlation was implemented between QEESI and DHI sub-items scores and significant variables and a Bonferroni correction for multiple comparisons was applied in order to avoid family-wise error, (STATISTICA 7 package for Windows).
- Principal Component Analysis
Regarding the multivariate analysis step of the study, Principal Component Analysis (PCA) with varimax rotation was performed to detect—with statistically significant otoneurological variables in both groups—hidden phenomena mainly through reducing the variables to find the most important ones, finding patterns in the data and classifying any combination of variables. The number of factors in principle was determined by a combination of the Kaiser/Guttman criterion (only factors with eigenvalues larger than 1 are incorporated in the model) and interpretability. Also by using scree plots, the eigenvalue was plotted against the component number, to evaluate if a factor was relevant or not. Finally, a component coefficient analysis was performed between variables and factors.

3. Results

3.1. Subjects

Of 23 MCS patients, 3 were using psychiatric medications, 1 referred positive anamnesis for alcohol addiction, and 1 received diagnosis of hypothyroidism, and they were excluded. Thus, 18 right-handed MCS patients (11 female and 7 male; mean age 49.5 ± 9.3 years) were included in the study. In turn, the HC group consisted of 20 right-handed healthy subjects (12 female and 8 male; mean age 48.6 ± 11.4 years). Socio-demographic and medical details of MCS included in the study after the clinical work-up are presented in Table 1.

3.2. Validated Questionnaires

Significant differences in results (p < 0.01, corrected) in DHI and QEESI scores in MCS and HC subjects are shown in Figure 1A,B, respectively.

3.3. Otoneurological Data

MCS and HC subjects did not show any clinical otoneurological abnormalities during examination.

3.4. Inferential Statistical Analysis

When comparing HC and MCS subjects, a significant ‘between-groups’ effect (p < 0.01, corrected) was found, highlighting statistically significant higher values in MCS patients in: (i) PS recorded on both X plane (X) and Y plane (Y) within low (L) and middle (M) frequency intervals recorded on SP and during CE and OE conditions (Figure 2A, Table 2); (ii) classic posturography parameters mainly in CE condition and on foam carpet (Table 2); and (iii) RDT measurements, in both CW and +40° and CCW and −40° conditions (Figure 2A, Table 2). Conversely, MCS subjects were found to be significantly impaired in VOR gain and reslo values, bilaterally (Figure 2B, Table 2). Mean, SDs and both significant and not significant effects for all variables measurements are shown in Table 2.
Within the vHIT results, analysed using the 36 ears of the 18 MCS patients, fifteen ears (41.6%) had both covert and overt saccade components, and only one overt or covert saccade was observed in the remaining twelve (33.3%) and nine (25%) ears, respectively. Head peak velocity of ten extracted measures per subject was 162°/s ± 11.
For illustrative purposes, Figure 3 depicts an example of a single MCS and HC subject’s patient changes in postural and VOR parameters.

3.5. Correlation Analysis
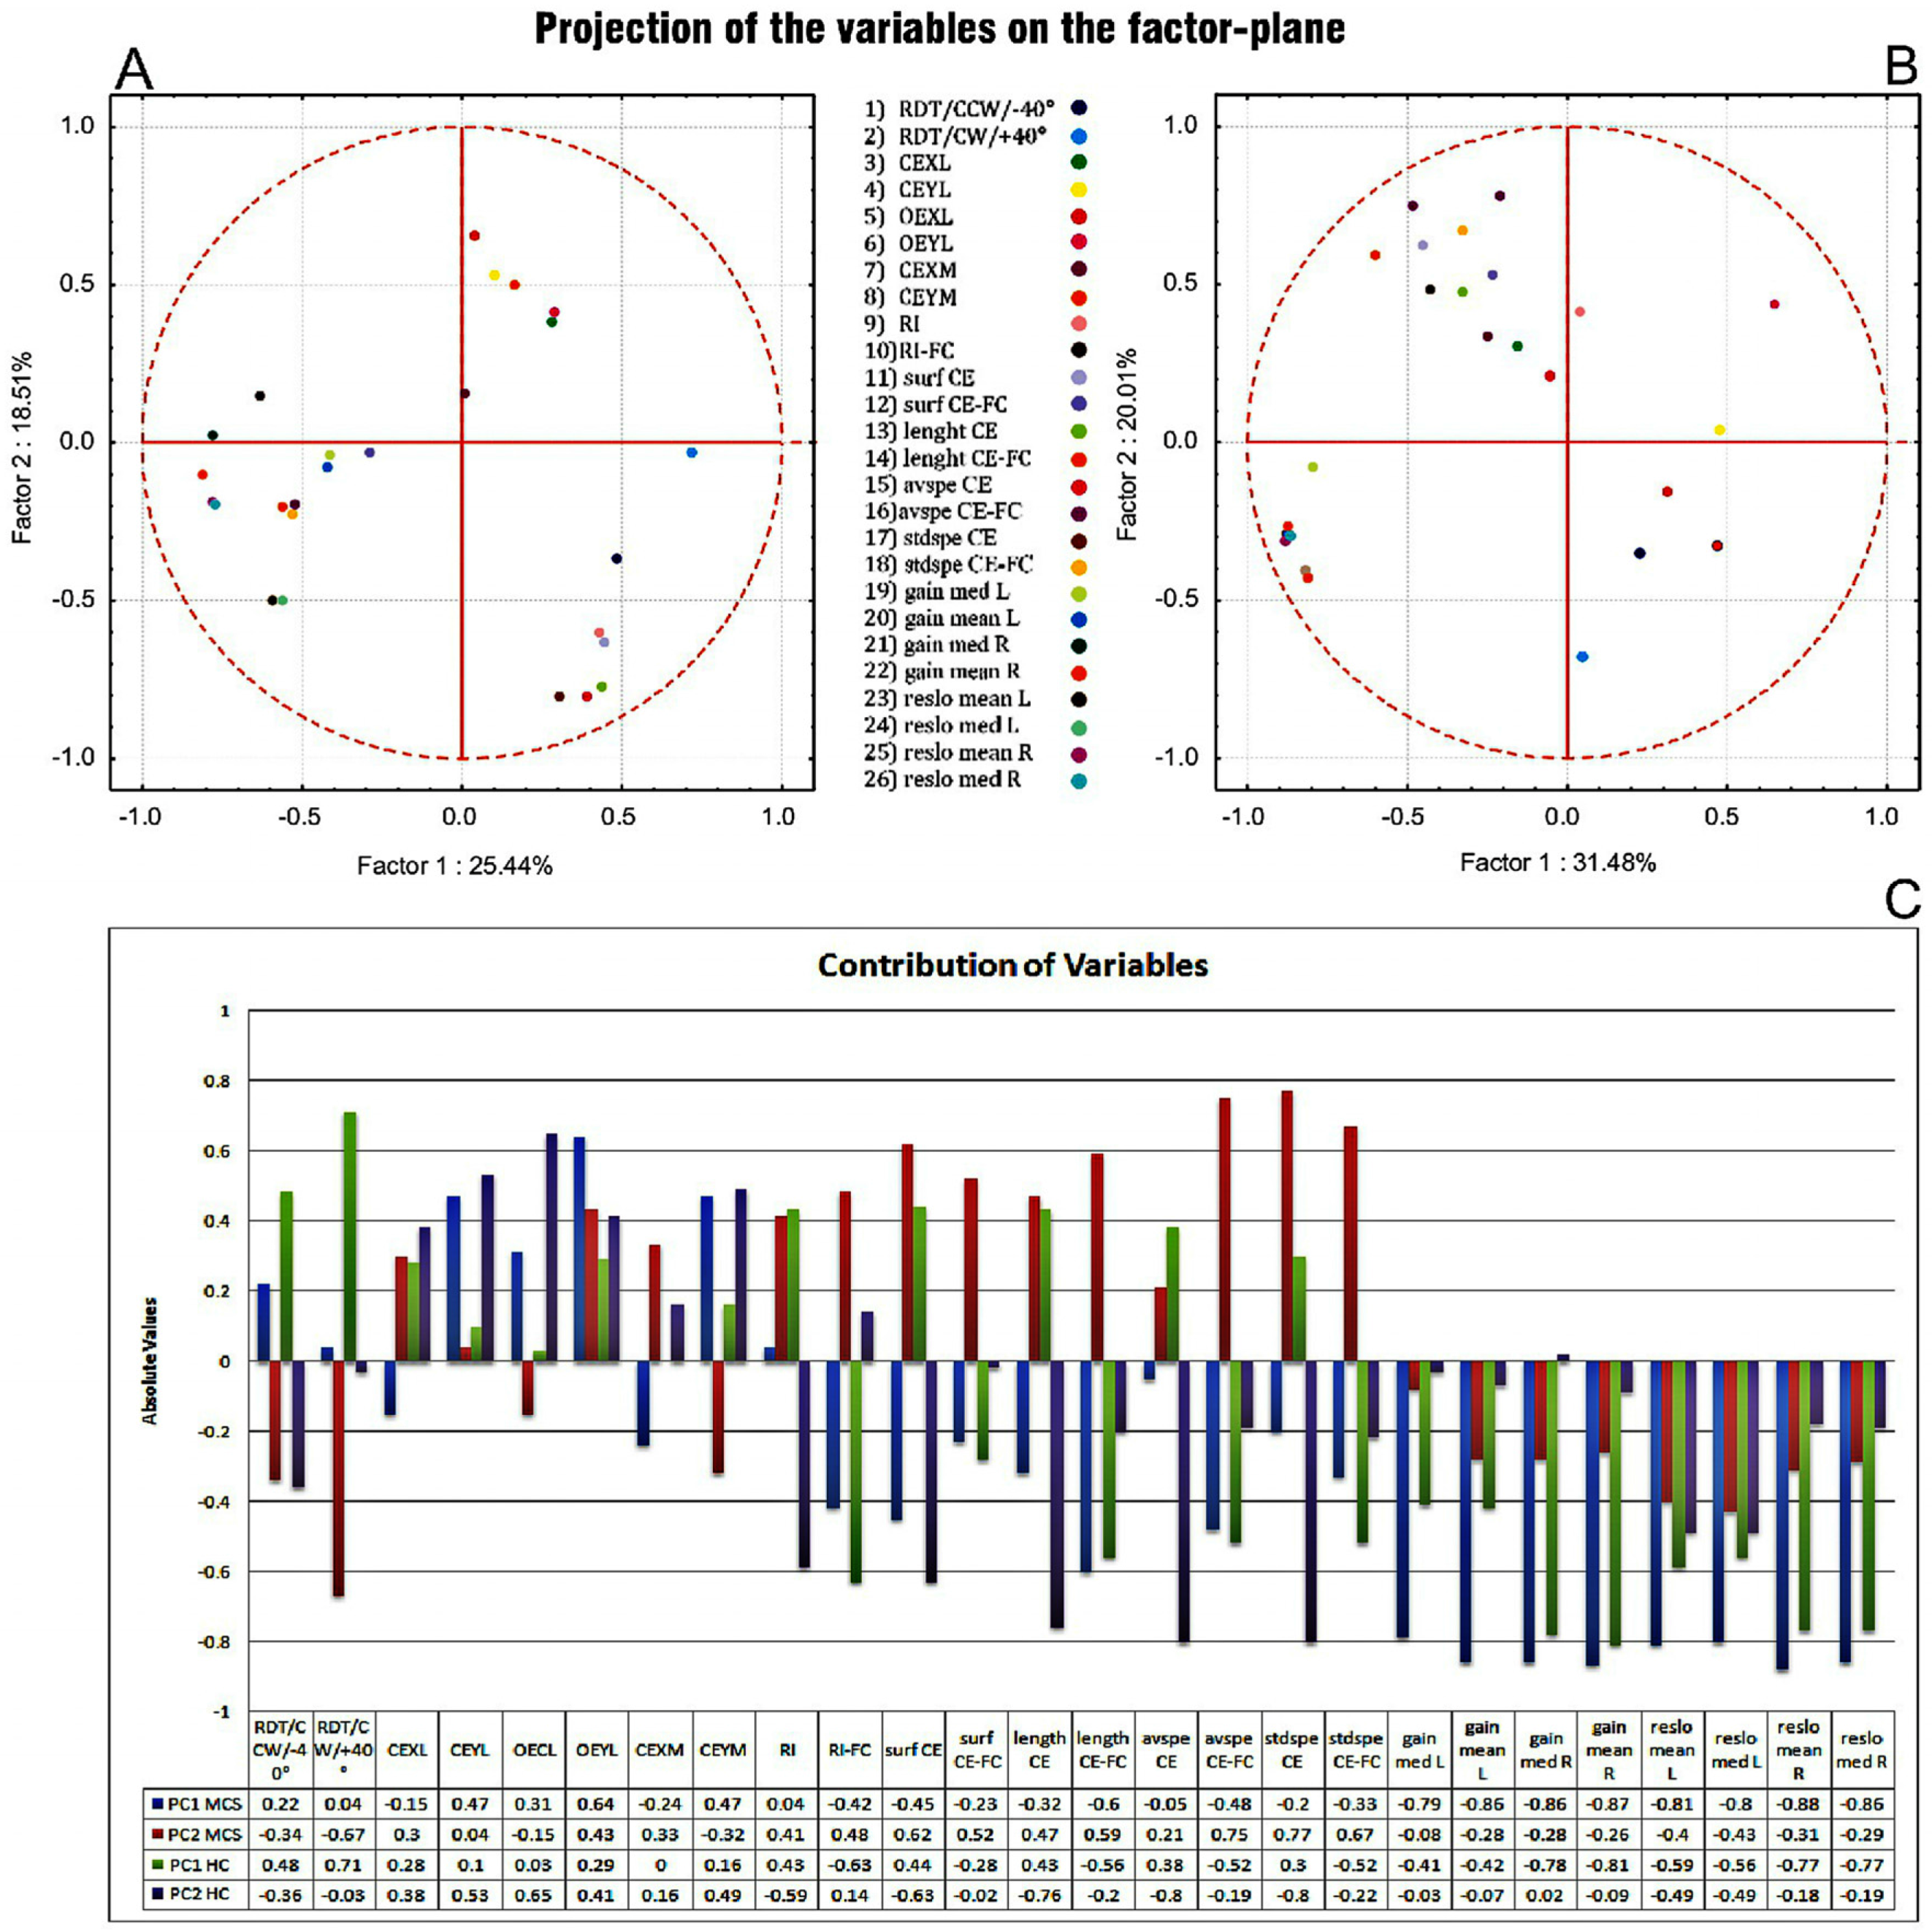
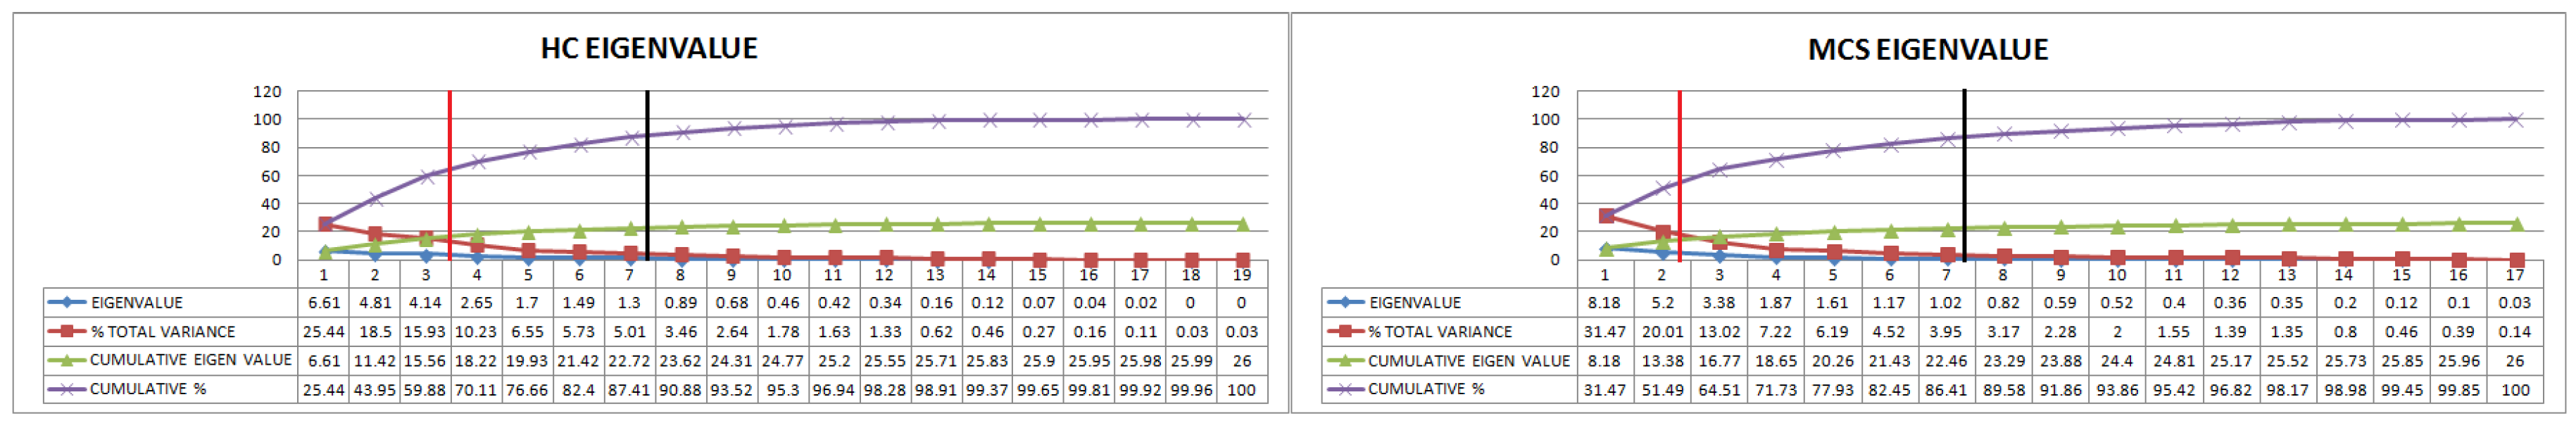
A negative correlation was found between QEESI total score and RI (r = −0.50, p < 0.01, corrected).

3.6. PCA

From the analysis of the values which measure the amount of variance due to each main component, 17 PCs were identified in MCS and 19 in HC (Figure 4). In order to simplify the interpretation of the PCs we used the varimax method and Kaiser/Guttman criterion. This indicated as significant the components with a coefficient higher than 1 [39], thus leaving only seven PCs for analysis in both groups. The optimal factorial solution is that with two extracted factors because they explained a maximal amount of variance. Proportion of variance expressed by the first factor in MCS and HC was 31.47% and 25.44%, respectively, and the second factor also expressed 20.01% in MCS and 18.5% HC.
Figure 5A showed PCA score plot of the first two components (PC1 vs. PC2), which explained 43.95% of the total variance in HC and Figure 4B showed PCA score plot of the first two components (PC1 vs. PC2), which explained 51.49% of the total variance in MCS.
Loading function (component correlation analysis) and PCA scree plots (Figure 5A–C) highlighted different dimensions and contributions of the variables when comparing MCS and HC groups.
In particular, despite a negative correlation of vHIT parameters among both groups PC1 and MCS PC2, within MCS and HC subjects PC1 was found to positively correlate with FFT and RDT and classical posturography parameters, respectively. In turn, classical posturography parameters and RDT parameters were found respectively to positively and negatively correlate with PC2 in MCS patients. FFT and classical posturography parameters were found respectively to positively and negatively correlate with the same component in HC (component coefficients shown in scree plots in Figure 5).

4. Discussion

Although the otoneurological examination was found to be negative, the first interesting finding in this study was the significant decrease in vHIT scores in MCS subjects (Figure 2B) in whom DHI highlighted a prevalence of dizziness-related symptoms (Figure 1A). In turn, a significant increase in classical posturography and FFT parameters as well as in VD behaviour was found in the same group (Figure 2A).
This syndrome has been classified by many authors as part of a wide group of emerging diseases—labelled idiopathic environmental intolerances (IEIs)—which are characterized by symptoms attributed to environmental agents [40]. For instance, many studies have tried to find an unifying pathophysiology for all IEIs, focusing on CNS reactions to environmental stimuli, with activation changes of the brain areas related to sensory processing and emotional responses [1,5,6,7,8,9,10,11,12,13,14,15,41,42]. Since environmental noise has been recognised as an important health quality stressor [43], relevant literature up to now has focused mainly on auditory symptoms [21,22] without highlighting possible vestibular and postural consequences.
In particular, no study protocol has found an impaired VOR function in MCS patients with vHIT. By providing a new dimension in vestibular evaluations [33], in this study the test permitted a quantitative assessment of the lateral semi-circular canal function and highlighted side and receptor specific information about the VOR [31,32,33], resulting in a bilateral reduction of both MCS gain and reslo (Figure 2B, Table 2). These aspects suggested that MCS patients, when compared with HC normative data, have a vestibular impairment (although not clinically evident by means of a cHIT). In line, FFT PS analysis and classical posturography parameters were demonstrated to be congruent with the above-mentioned vestibular damage in MCS. In fact, literature demonstrated body sways at the low frequency interval to be mainly under vestibular control [35,36,44] and patients with vestibular deficits (i.e., vestibular neuritis, Meniere’s disease) have consequently increased body sways at the low frequency interval as compared with normal subjects [35,44].
Furthermore, increased body sways within the middle interval and in classical posturography parameters especially during closed eye condition tend to confirm similar findings in previous studies, and result in a decreased ability to adapt to balance perturbations under complex conditions in certain disorders affected by a lack of vigilance [45,46,47,48,49]. It has previously been noted that the integration of information from the visual, vestibular and somatosensory receptors and motor coordination are processes requiring attention and vigilance [48], especially when information from other sensory systems is not reliable [50]. Considering the closeness between MCS and other related idiopathic disorders affected by functional postural impairment and attention and vigilance decrease (i.e., fibromyalgia, chronic fatigue syndrome) [45,51] it could be postulated that such phenomena may lead to slower or inappropriate sensory integration [48].
In relation to this, negative correlation found between RI values and QEESI total scores further strengthen these aspects, highlighting possible negative influences between higher values on the questionnaire tool used in the study and this kind of body sway parameter.
Moreover, MCS patients demonstrated an increase in VD parameters (Figure 2A, Table 2), the concept of which has been postulated by previous authors [28,52] observing that, in conflicting circumstances between sensory modalities involved in spatial orientation, some subjects depend mainly on visual input. These visual-dependent subjects are more likely to be bewildered by tilted or moving visual surroundings [28,52]. From a clinical perspective it has been noted that vestibular patients whose dizzy symptoms are unleashed by certain visual scenarios (i.e., visual vertigo) also demonstrate increased VD when evaluated with conventional approaches [27]. In agreement with this notion, an impaired vestibular modality in MCS patients would have led to an enhanced reliance on visual input, inducing subjects to upregulate this process and to increase VD by a sensory re-weighting [27,53,54].
To this end, the ability to adapt sensory–motor control to challenging circumstances by selection and weighting of alternative reference frames was postulated as one of the main aspects of postural control [55,56]. Moreover, theoretical models of multisensory combination based on neurophysiological [57], perceptual [58] and behavioural evidence [59] proposed that adaptation to environmental changes would rely on sensory re-weighting to optimize both the relevance of individual sensory inputs and the reliability of estimates [48]. This kind of phenomenon is thought to be determined by maximum likelihood estimation so that the conscious and non-conscious brain processing appears as a near-optimal Bayesian estimator of object properties [56,60]. Furthermore, recent findings have demonstrated disorders of vestibular function as characterized by complex perceptual, sensorimotor and behavioural deficits that exceed basic perceptions of head acceleration or motor responses, such as VOR or vestibulo-spinal reflexes [61,62].
In order to thoroughly study these aspects of perceptual complexity, PCA was usefully performed to reduce the information dimensionality from the vast data arrays and to minimize the loss of information, relying on the fact that most of the descriptors are inter-correlated and these correlations in some instances are high [63,64]. In accordance with these aspects, a rearrangement of the dimensions, clusters and contributions of the variables within PC1 and PC2 in MCS was found to be a conceivable model of re-weighting along vestibular sensory processing.
In particular, in Figure 5A–C varimax rotation highlighted that although vHIT and VD parameters were almost equally clustered in both groups, MCS patients showed a positive correlation of FFT parameters in PC1 and classical posturography parameters in PC2. Moreover, together with vHIT parameters, VD parameters were found to be negatively correlated within PC2. In turn, HC subjects demonstrated a positive correlation of VD and classical posturography parameters in PC1, FFT PS in PC2 and vHIT values in PC3.
Possible explanations for the rearranged model along vestibular processing and symptoms cohort referred to by MCS patients could be considered to reside within pathophysiological cascades, such as those involving limbic structures in the natural history of MCS [1,4,5,6,7,8,9,10,11,12,13,14,15]. According to these notions, repeated exposure to MCS inducing agents were found to provide in MCS subjects both time-dependent sensitization and kindling, especially within hippocampal and limbic areas [65]. In turn, recent advances have postulated that additional “higher” vestibular dysfunctional aspects could really result from an impaired integration of the vestibular network within these areas [62]. This integration comprises both the internal representation of the body scheme and the internal model of the surrounding space as well as multisensory motion perception, attention, spatial memory, and navigation [62,66].
In conclusion, although disorders of vestibular function integration remain to be completely elucidated, the present data would consider the MCS re-weighting process along bottom-up and top-down vestibular streams as possibly (i) related to MCS physiopathological cascades involving vestibular network at multiple levels; and (ii) underpinning the symptoms of dizziness referred to by the patients.
Thus, findings showed in this work could be considered as a first attempt at uncovering the literature gap among otoneurological consequences related to CNS hypersensitisation to environmental compounds. Considering the emerging prevalence of the disorder and the incidence of inner ear symptoms referred to by the patients, evaluation in otoneurological setting should increase in the future. In conclusion, this pilot study could be relevant in correctly screening, monitoring and clustering further clinical history data with the purpose of uncovering future therapeutic strategies useful in the improvement of otoneurological cohort symptoms.

5. Strengths and Limitations of the Study

Many uncertainties in the literature involving MCS otoneurological pathways could clearly be explained by different criteria for patient enrolment, different kinds of questionnaires employed in order to investigate symptom spectrums, distortion related to the general incidence of personality traits in control subjects, and many nuisance variables biasing the general research in MCS [22].
As in previous studies, we tried to reduce artefacts that could affect symptom spectrum outcomes by enrolling, clustering and studying—by means of validated questionnaires (such as QEESI and DHI)—only MCS patients with commonly accepted criteria who were regularly followed by the local centre for the diagnosis, treatment and prevention of MCS [22].
Moreover, we performed an ANOVA model aimed at studying outcomes by using a powerful between effect. Thus, we tried to reduce biases related to sex and age ratios, misdiagnosis of MCS, and possible outcome distortions related to the general incidence of personality and social disturbances in the general population [22]. On the other hand, a possible limitation of the study could be represented by the Bonferroni multiple correction applied as post hoc test to both ANOVA and Spearman’s correlation, possibly increasing the likelihood of type II statistical errors.

Author Contributions

Marco Alessandrini and Alessandro Micarelli conceived and designed the experiment; Alessandro Micarelli, Andrea Viziano and Marco Alessandrini performed the experiment; Alessandro Micarelli, Elisa Micarelli and Marco Alessandrini analysed the data; Ernesto Bruno and Giuseppe Genovesi contributed clinical data/materials/analysis tools; Alessandro Micarelli, Andrea Viziano and Marco Alessandrini wrote the paper.

Conflicts of Interest

The authors declare no conflict of interest.

Appendix A

Core function implemented in Matlab in order to obtain fast Fourier transform of X and Y oscillations. The symbol ‘%’ and ‘s’ represent a Matlab comment and X or Y oscillations, respectively:
  • L = length(s) % s vector of signal values
  • Fs = 25; % Sampling frequency
  • NFFT = 2^nextpow2(L); % Next power of 2 from length of s
  • f = Fs/2*linspace(0,1,NFFT/2 + 1);
  • S = fft(s,NFFT)/L; % FFT of a signal s
  • modS = 2*abs(S(1:NFFT/2 + 1));
  • ms = max(modS);
  • S_norm = modS/ms;

References

  1. Bell, I.R. Clinically relevant EEG studies and psychophysiological findings: Possible neural mechanisms for multiple chemical sensitivity. Toxicology 1996, 111, 101–117. [Google Scholar] [CrossRef]
  2. Alessandrini, M.; Micarelli, A.; Bruno, E.; Ottaviani, F.; Conetta, M.; Cormano, A.; Genovesi, G. Intranasal administration of hyaluronan as a further resource in olfactory performance in multiple chemical sensitivity syndrome. Int. J. Immunopathol. Pharmacol. 2013, 26, 1019–1025. [Google Scholar] [PubMed]
  3. Miller, C.S.; Mitzel, H.C. Chemical sensitivity attributed to pesticide exposure versus remodeling. Arch. Environ. Health 1995, 50, 119–129. [Google Scholar] [CrossRef] [PubMed]
  4. Cullen, M.R. The worker with multiple chemical sensitivities: An overview. Occup. Med. State Art Rev. 1987, 2, 655–661. [Google Scholar]
  5. Das-Munshi, J.; Rubin, G.J.; Wessely, S. Multiple chemical sensitivities: Review. Curr. Opin. Otolaryngol. Head Neck Surg. 2007, 15, 274–280. [Google Scholar] [CrossRef] [PubMed]
  6. Bascom, R.; Meggs, W.J.; Frampton, M.; Hudnell, K.; Killburn, K.; Kobal, G.; Medinsky, M.; Rea, W. Neurogenic inflammation: With additional discussion of central and perceptual integration of nonneurogenic inflammation. Environ. Health Perspect. 1997, 105, S531–537. [Google Scholar] [CrossRef]
  7. Winters, W.; Devriese, S.; Van-Diest, I.; Nemery, B.; Veulemans, H.; Eelen, P.; Van de Woestijne, K.; Van den Bergh, O. Media warnings about environmental pollution facilitate the acquisition of symptoms in response to chemical substances. Psychosom. Med. 2003, 65, 332–338. [Google Scholar] [CrossRef] [PubMed]
  8. Pall, M.L. Elevated nitric oxide/peroxynitrite theory of multiple chemical sensitivity: Central role of N-methyl-d-aspartate receptors in the sensitivity mechanism. Environ. Health Perspect. 2003, 111, 1461–1464. [Google Scholar] [CrossRef] [PubMed]
  9. Bell, I.R.; Miller, C.S.; Schwartz, G.E. An olfactory-limbic model of multiple chemical sensitivity syndrome: Possible relationships to kindling and affective spectrum disorders. Biol. Psychiatry 1992, 32, 218–242. [Google Scholar] [CrossRef]
  10. Chiaravalloti, A.; Pagani, M.; Micarelli, A.; Di Pietro, B.; Genovesi, G.; Alessandrini, M.; Schillaci, O. Cortical activity during olfactory stimulation in multiple chemical sensitivity: A (18)F-FDG PET/CT study. Eur. J. Nucl. Med. Mol. Imaging 2015, 42, 733–740. [Google Scholar] [CrossRef] [PubMed] [Green Version]
  11. Alessandrini, M.; Micarelli, A.; Chiaravalloti, A.; Bruno, E.; Danieli, R.; Pierantozzi, M.; Genovesi, G.; Öberg, J.; Pagani, M.; Schillaci, O. Involvement of Subcortical Brain Structures During Olfactory Stimulation in Multiple Chemical Sensitivity. Brain Topogr. 2016, 29, 243–252. [Google Scholar] [CrossRef] [PubMed] [Green Version]
  12. Hillert, L.; Musabasic, V.; Berglund, H.; Ciumas, C.; Savic, I. Odor processing in Multiple Chemical Sensitivity. Hum. Brain Mapp. 2007, 28, 172–182. [Google Scholar] [CrossRef] [PubMed]
  13. Azuma, K.; Uchiyama, I.; Takano, H.; Tanigawa, M.; Azuma, M.; Bamba, I.; Yoshikawa, T. Changes in Cerebral Blood Flow during Olfactory Stimulation in Patients with Multiple Chemical Sensitivity: A Multi-Channel Near-Infrared Spectroscopic Study. PLoS ONE 2013, 8, e80567. [Google Scholar] [CrossRef] [PubMed]
  14. Andersson, L.; Claeson, A.S.; Nyberg, L.; Stenberg, B.; Nordin, S. Brain responses to olfactory and trigeminal exposure in idiopathic environmental illness (IEI) attributed to smells—An fMRI study. J. Psychosom. Res. 2014, 77, 401–408. [Google Scholar] [CrossRef] [PubMed]
  15. Bell, I.R.; Baldwin, C.M.; Russek, L.G.; Schwartz, G.E.; Hardin, E.E. Early life stress, negative paternal relationships, and chemical intolerance in middle-aged women: Support for a neural sensitization model. J. Womens Health 1998, 7, 1135–1147. [Google Scholar] [CrossRef] [PubMed]
  16. Dieterich, M.; Brandt, T. Functional brain imaging of peripheral and central vestibular disorders. Brain 2008, 131, 2538–2552. [Google Scholar] [CrossRef] [PubMed]
  17. Alessandrini, M.; Pagani, M.; Napolitano, B.; Micarelli, A.; Candidi, M.; Bruno, E.; Chiaravalloti, A.; Di Pietro, B.; Schillaci, O. Early and phasic cortical metabolic changes in vestibular neuritis onset. PLoS ONE 2013, 8, e57596. [Google Scholar] [CrossRef] [PubMed] [Green Version]
  18. Miller, C.S.; Prihoda, T.J. The Environmental Exposure and Sensitivity Inventory (EESI): A standardized approach for measuring chemical intolerances for research and clinical applications. Toxicol. Ind. Health 1999, 15, 370–385. [Google Scholar] [CrossRef] [PubMed]
  19. Palmquist, E.; Claeson, A.S.; Neely, G.; Stenberg, B.; Nordin, S. Overlap in prevalence between various types of environmental intolerance. Int. J. Hyg. Environ. Health 2014, 217, 427–434. [Google Scholar] [CrossRef] [PubMed]
  20. Winder, C. Mechanisms of multiple chemical sensitivity. Toxicol. Lett. 2002, 128, 85–97. [Google Scholar] [CrossRef]
  21. Heinonen-Guzejev, M.; Koskenvuo, M.; Mussalo-Rauhamaa, H.; Vuorinen, H.S.; Heikkilä, K.; Kaprio, J. Noise sensitivity and multiple chemical sensitivity scales: Properties in a population based epidemiological study. Noise Health 2012, 14, 215–223. [Google Scholar] [CrossRef] [PubMed]
  22. Micarelli, A.; Viziano, A.; Genovesi, G.; Bruno, E.; Ottaviani, F.; Alessandrini, M. Lack of contralateral suppression in transient-evoked otoacoustic emissions in multiple chemical sensitivity: A clinical correlation study. Noise Health 2016, 18, 143–149. [Google Scholar] [PubMed]
  23. Bartha, L.; Baumzweiger, W.; Buscher, D.S.; Callender, T.; Dahl, K.A.; Davidoff, A.; Donnay, A.; Edelson, S.B.; Elson, B.D.; Elliott, E.; et al. Multiple chemical sensitivity: A 1999 consensus. Arch. Environ. Health 1999, 54, 147–149. [Google Scholar]
  24. Lacour, M.; Zunder, T.; Schmidtke, K.; Vaith, P.; Scheidt, C. Multiple chemical sensitivity syndrome (MCS)—Suggestions for an extension of the U.S. MCS-case definition. Int. J. Hyg. Environ. Health 2005, 208, 141–151. [Google Scholar] [CrossRef] [PubMed]
  25. Cousins, S.; Cutfield, N.J.; Kaski, D.; Palla, A.; Seemungal, B.M.; Golding, J.F.; Staab, J.P.; Bronstein, A.M. Visual dependency and dizziness after vestibular neuritis. PLoS ONE 2014, 9, e105426. [Google Scholar] [CrossRef] [PubMed]
  26. Dichgans, J.; Held, R.; Young, L.R.; Brandt, T. Moving visual scenes influence the apparent direction of gravity. Science 1972, 178, 1217–1219. [Google Scholar] [CrossRef] [PubMed]
  27. Guerraz, M.; Yardley, L.; Bertholon, P.; Pollak, L.; Rudge, P.; Gresty, M.A.; Bronstein, A.M. Visual vertigo: Symptom assessment, spatial orientation and postural control. Brain 2001, 124, 1646–1656. [Google Scholar] [CrossRef] [PubMed]
  28. Witkin, H.A.; Asch, S.E. Studies in space orientation: Further experiments on perception of the upright with displaced visual fields. J. Exp. Psychol. 1948, 38, 762–782. [Google Scholar] [CrossRef] [PubMed]
  29. Fiori, F.; David, N.; Aglioti, S.M. Processing of proprioceptive and vestibular body signals and self-transcendence in Ashtanga yoga practitioners. Front. Hum. Neurosci. 2014, 8, 734. [Google Scholar] [CrossRef] [PubMed]
  30. Takasaki, H.; Treleaven, J.; Johnston, V.; Jull, G. Minimum repetitions for stable measures of visual dependency using the dot version of the computer-based Rod-Frame test. Man. Ther. 2012, 17, 466–469. [Google Scholar] [CrossRef] [PubMed]
  31. MacDougall, H.G.; Weber, K.P.; McGarvie, L.A.; Halmagyi, G.M.; Curthoys, I.S. The video head impulse test: Diagnostic accuracy in peripheral vestibulopathy. Neurology 2009, 73, 1134–1141. [Google Scholar] [CrossRef] [PubMed]
  32. Schneider, E.; Villgrattner, T.; Vockeroth, J.; Bartl, K.; Kohlbecher, S.; Bardins, S.; Ulbrich, H.; Brandt, T. EyeSeeCam: An eye movement-driven head camera for the examination of natural visual exploration. Ann. N. Y. Acad. Sci. 2009, 1164, 461–467. [Google Scholar] [CrossRef] [PubMed]
  33. Blödow, A.; Pannasch, S.; Walther, L.E. Detection of isolated covert saccades with the video head impulse test in peripheral vestibular disorders. Auris Nasus Larynx 2013, 40, 348–351. [Google Scholar] [CrossRef] [PubMed]
  34. McGarvie, L.A.; MacDougall, H.G.; Halmagyi, G.M.; Burgess, A.M.; Weber, K.P.; Curthoys, I.S. The Video Head Impulse Test (vHIT) of Semicircular Canal Function—Age-Dependent Normative Values of VOR Gain in Healthy Subjects. Front. Neurol. 2015, 6, 154. [Google Scholar] [CrossRef] [PubMed]
  35. Alessandrini, M.; D’Erme, G.; Bruno, E.; Napolitano, B.; Magrini, A. Vestibular compensation: Analysis of postural re-arrangement as a control index for unilateral vestibular deficit. Neuroreport 2003, 14, 1075–1079. [Google Scholar] [CrossRef] [PubMed]
  36. Alessandrini, M.; Lanciani, R.; Bruno, E.; Napolitano, B.; Di Girolamo, S. Posturography frequency analysis of sound-evoked body sway in normal subjects. Eur. Arch. Otorhinolaryngol. 2006, 263, 248–252. [Google Scholar] [CrossRef] [PubMed]
  37. Schnakenberg, E.; Fabig, K.R.; Stanulla, M.; Strobl, N.; Lustig, M.; Fabig, N.; Schloot, W. A cross-sectional study of self-reported chemical-related sensitivity is associated with gene variants of drug-metabolizing enzymes. Environ. Health 2007, 6, 6. [Google Scholar] [CrossRef] [PubMed]
  38. Nola, G.; Mostardini, C.; Salvi, C.; Ercolani, A.P.; Ralli, G. Validity of Italian adaptation of the Dizziness Handicap Inventory (DHI) and evaluation of the quality of life in patients with acute dizziness. Acta Otorhinolaryngol. Ital. 2010, 30, 190–197. [Google Scholar] [PubMed]
  39. Ţărmure, V.; Almăşan, O.C.; Buhăţel, D.; Ilea, A.; Jiman, P.; Iancu, M.; Pop, A. Importance of Lateral Cephalogram in Treating Class III. In Proceedings of the International Conference on Advancements of Medicine and Health Care through Technology, Cluj-Napoca, Romania, 5—7 June 2014; Vlad, S., Ciupa, R.V., Eds.; Springer: New York, NY, USA, 2014; pp. 23–26. [Google Scholar]
  40. Nordin, S.; Palmquist, E.; Claeson, A.; Stenberg, B. The environmental hypersensitivity symptom inventory: Metric properties and normative data from a population-based study. Arch. Public Health 2013, 71, 18. [Google Scholar] [CrossRef] [PubMed]
  41. Bell, I.R. White paper. Neuropsychiatric aspects of sensitivity to low level chemicals: A neural sensitization model. Toxicol. Ind. Health 1994, 10, 277–312. [Google Scholar] [PubMed]
  42. Miedema, H.M.; Vos, H. Noise sensitivity and reactions to noise and other environmental conditions. J. Acoust. Soc. Am. 2003, 113, 1492–1504. [Google Scholar] [CrossRef] [PubMed]
  43. Stansfeld, S.A. Noise, noise sensitivity and psychiatric disorder: Epidemiological and psychophysiological studies. Psychol. Med. Monogr. Suppl. 1992, 22, 1–44. [Google Scholar] [CrossRef] [PubMed]
  44. Nakagawa, H.; Ohashi, N.; Watanabe, Y.; Mizukoshi, K. The contribution of proprioception to posture control in normal subjects. Acta Oto-Laryngol. Suppl. 1993, 504, 112–116. [Google Scholar] [CrossRef]
  45. Jones, K.D.; King, L.A.; Mist, S.D.; Bennett, R.M.; Horak, F.B. Postural control deficits in people with fibromyalgia: A pilot study. Arthritis Res. Ther. 2011, 13, R127. [Google Scholar] [CrossRef] [PubMed]
  46. Avni, N.; Avni, I.; Barenboim, E.; Azaria, B.; Zadok, D.; Kohen-Raz, R.; Morad, Y. Brief posturographic test as an indicator of fatigue. Psychiatry Clin. Neurosci. 2006, 60, 340–346. [Google Scholar] [CrossRef] [PubMed]
  47. Karita, K.; Nakao, M.; Nishikitani, M.; Iwata, T.; Murata, K.; Yano, E. Effect of overtime work and insufficient sleep on postural sway in information-technology workers. J. Occup. Health 2006, 48, 65–68. [Google Scholar] [CrossRef] [PubMed]
  48. Beraneck, M.; Idoux, E. Reconsidering the role of neuronal intrinsic properties and neuromodulation in vestibular homeostasis. Front. Neurol. 2012, 3, 25. [Google Scholar] [CrossRef] [PubMed]
  49. Morad, Y.; Azaria, B.; Avni, I.; Barkana, Y.; Zadok, D.; Kohen-Raz, R.; Barenboim, E. Posturography as an indicator of fatigue due to sleep deprivation. Aviat. Space Environ. Med. 2007, 78, 859–863. [Google Scholar] [PubMed]
  50. Redfern, M.S.; Jennings, J.R.; Martin, C.; Furman, J.M. Attention influences sensory integration for postural control in older adults. Gait Posture 2001, 14, 211–216. [Google Scholar] [CrossRef]
  51. Lavergne, M.R.; Cole, D.C.; Kerr, K.; Marshall, L.M. Functional impairment in chronic fatigue syndrome, fibromyalgia, and multiple chemical sensitivity. Can. Fam. Physician 2010, 56, e57–e65. [Google Scholar] [PubMed]
  52. Witkin, H.A. The perception of the upright. Sci. Am. 1959, 200, 51–56. [Google Scholar] [CrossRef] [PubMed]
  53. Bronstein, A.M. Visual vertigo syndrome: Clinical and posturography findings. J. Neurol. Neurosurg. Psychiatry 1995, 59, 472–476. [Google Scholar] [CrossRef] [PubMed]
  54. Agarwal, K.; Bronstein, A.M.; Faldon, M.E.; Mandalà, M.; Murray, K.; Silove, Y. Visual dependence and BPPV. J. Neurol. 2012, 259, 1117–1124. [Google Scholar] [CrossRef] [PubMed]
  55. McGuire, L.M.; Sabes, P.N. Sensory transformations and the use of multiple reference frames for reach planning. Nat. Neurosci. 2009, 12, 1056–1061. [Google Scholar] [CrossRef] [PubMed]
  56. Isableu, B.; Ohlmann, T.; Cremieux, J.; Vuillerme, N.; Amblard, B.; Gresty, M.A. Individual differences in the ability to identify, select and use appropriate frames of reference for perceptuo-motor control. Neuroscience 2010, 169, 1199–1215. [Google Scholar] [CrossRef] [PubMed]
  57. Brandt, T.; Bartenstein, P.; Janek, A.; Dieterich, M. Reciprocal inhibitory visual-vestibular interaction. Visual motion stimulation deactivates the parieto-insular vestibular cortex. Brain 1998, 121, 1749–1758. [Google Scholar] [CrossRef] [PubMed]
  58. Ernst, M.O.; Bulthoff, H.H. Merging the senses into a robust percept. Trends. Cogn. Sci. 2004, 8, 162–169. [Google Scholar] [CrossRef] [PubMed]
  59. Oie, K.S.; Kiemel, T.; Jeka, J.J. Multisensory fusion: Simultaneous re-weighting of vision and touch for the control of human posture. Brain Res. Cogn. Brain Res. 2002, 14, 164–176. [Google Scholar] [CrossRef]
  60. Ernst, M.O.; Banks, M.S. Humans integrate visual and haptic information in a statistically optimal fashion. Nature 2002, 415, 429–433. [Google Scholar] [CrossRef] [PubMed]
  61. Seemungal, B.M. The cognitive neurology of the vestibular system. Curr. Opin. Neurol. 2014, 27, 125–132. [Google Scholar] [CrossRef] [PubMed]
  62. Brandt, T.; Strupp, M.; Dieterich, M. Towards a concept of disorders of “higher vestibular function”. Front. Integr. Neurosci. 2014, 8, 47. [Google Scholar] [CrossRef] [PubMed]
  63. Brodziak-Dopierała, B.; Kwapuliński, J.; Kowol, J.; Sobczyk, K.; Gajda, Z. The Application of Principal Component Analysis to Interpretation of Occurrence of Metals in the Femur Head. Polish J. Environ. Stud. 2010, 1, 49–58. [Google Scholar]
  64. Bajorath, J. Selected Concepts and Investigations in Compound Classification, Molecular Descriptor Analysis and Virtual Screening. J. Chem. Inf. Comput. Sci. 2001, 41, 233–245. [Google Scholar] [CrossRef] [PubMed]
  65. Thomas, J.G. A critical analysis of multiple chemical sensitivities. Med. Hypotheses 1998, 50, 303–311. [Google Scholar] [CrossRef]
  66. Karnath, H.O.; Dieterich, M. Spatial neglect—A vestibular disorder? Brain 2006, 129, 293–305. [Google Scholar] [CrossRef] [PubMed]
Figure 1. In (A) histograms highlighting dizziness handicap inventory (DHI) total scores in Multiple Chemical Sensitivity (MCS) and healthy subjects (HC); In (B) star diagram showing MCS and HC quick environment exposure sensitivity inventory (QEESI) sub-items results in head-related (HEAD), cognitive-related (COG), affective-related (AFF), neuromuscular-related (NM), musculoskeletal-related (MS), skin-related (SKIN), genitourinary-related (GU), gastrointestinal-related (GI), heart/chest-related (COR), airway or mucous membrane-related (AIR/MM) symptoms.
Applsci 06 00330 g001
Figure 2. This represents all statistical significant differences in Visual Dependency scores, and spectral values of body oscillations (A) and video Head Impulse Test measurements (B) when comparing Multiple Chemical Sensitivity (MCS) and healthy subjects (HC). Acronyms represent tags for Rod and Disc test, RDT (counter-clockwise, CCW; clockwise, CW), spectral values of body oscillations on X plane (X) and Y plane (Y) within low (L) and middle (M) frequency intervals recorded on stiff platform and during closed (CE) and opened eyes (OE) conditions and for vestibulo-ocular reflex (VOR) gain and regression slope, reslo; L, left; R, right; med, median.
Applsci 06 00330 g002
Figure 3. An example of a single MCS and HC subject respectively represented in (A) and (D) for video Head Impulse Test trace and results; in (B) and (E) for fast Fourier transform results; in (C) and (F) for X-Y plane plot. CE, closed eyes; OE, open eyes; X, spectral values of body oscillations on X plane; Y, spectral values of body oscillations on Y plane; L, low frequency interval; M, middle frequency interval; H, high frequency interval; FC, foam carpet; MCS, multiple chemical sensitivity; HC, healthy subject.
Applsci 06 00330 g003
Figure 4. Scree plot depicting HC (on the left) and MCS (on the right) eigenvalues, percentage of total variance, cumulative eigenvalues and cumulative percentage of total variance. Vertical black rod indicates numbers of principal components resulting from Kaiser/Guttman criterion and vertical red rod indicates number of principal components needed to overcome 50% of total variance.
Applsci 06 00330 g004
Figure 5. Component coefficient analysis showing variables projection on the factor plane (Factor 1 × Factor 2) in HC (A) and MCS (B) subjects and contribution of variables (C) in both groups subjects within PC1 and PC2. RDT, Rod and Disc test; CCW, counter-clockwise; CW, clockwise, CE, closed eyes; X, spectral values of body oscillations on X plane; Y, spectral values of body oscillations on Y plane; L, low frequency interval, M, middle frequency interval; surf, surface of the ellipse of confidence; avspe, mean velocity of body sways; stdspe, standard deviation of velocity of body sways; RI, Romberg index; FC, foam carpet; med, median; reslo, regression slope; L, left; R, right. In the centre of the figure, (A) and (B) legend colours; in bottom-left, legend colour of (C).
Applsci 06 00330 g005
Table 1. Socio-demographic and medical details of total and included MCS patients after clinical work-up. MCS, Multiple Chemical Sensitivity.
Socio-demographical VariablesTotal MCSReason of Exclusion, Number, GenderIncluded MCS
Number23See below18
Gender14 female, 9 maleSee below11 female, 7 male
Age50.3 ± 8.9 years-49.5 ± 9.3 years
EmploymentCosmetologist (n = 4)psychiatric medications (n = 1, female)Cosmetologist (n = 3)
Hairdresser (n = 5)-Hairdresser (n = 5)
Teacher (n = 3)hypothyroidism (n = 1, female)Teacher (n = 2)
Nurse (n = 3)psychiatric medications (n = 1, female)Nurse (n = 2)
Ex-soldier (n = 3)alcohol addiction (n = 1, male)Ex-soldier (n = 2)
Obstetrician (n = 2)-Obstetrician (n = 2)
Taxi driver (n = 2)psychiatric medications (n = 1, male)Taxi driver (n = 1)
University Professor (n = 1)-University Professor (n = 1)
“-“ = none.
Table 2. Otoneurological scores in MCS and HC subjects.
VariablesMCSHC VariablesMCSHC
MeanSDMeanSDp ValueMeanSDMeanSDp Value
Rod and Disc TestFast Fourier Transform
RDT/N/+402.392.051.631.82p > 0.01Low Freqeuncy Interval
RDT/CCW/−408.182.293.111.95p < 0.01CEXL10.176.84.682.77p < 0.01
RDT/CW/+408.092.432.831.24p < 0.01CEYL6.244.022.891.3p < 0.01
RDT/N/−405.37.672.051.89p > 0.01OEXL8.233.415.352.65p < 0.01
RDT/CCW/+404.062.43.764.04p > 0.01OEYL62.564.082.06p < 0.01
RDT/CW/−404.61.933.582.42p > 0.01CEXL-FC8.282.189.671.9p > 0.01
Rod and Frame TestCEYL-FC8.242.557.511.79p > 0.01
RFT/CW/+111.6083330.7932161.61250.43766p > 0.01OEXL-FC7.213.996.872.54p > 0.01
RFT/CCW/+112.2388890.7771662.130.706437p > 0.01OEYL-FC6.142.835.132.22p > 0.01
RFT/CW/−111.7583330.8959471.580.88055p > 0.01Middle Frequency Interval
RFT/CCW/−112.1833330.569832.14750.609459p > 0.01CEXM0.670.370.280.07p < 0.01
RFT/CW/+221.5361110.8759541.49250.739537p > 0.01CEYM0.390.190.170.05p < 0.01
RFT/CCW/+222.3194440.5182382.22250.713309p > 0.01OEXM0.340.030.30.09p > 0.01
RFT/CW/−222.0194440.5003352.11250.783695p > 0.01OEYM0.230.050.20.06p > 0.01
RFT/CCW/−221.5805560.759091.4350.675336p > 0.01CEXM-FC0.840.291.020.5p > 0.01
RFT/N/+111.8833330.5823381.91750.681962p > 0.01CEYM-FC0.710.380.60.26p > 0.01
RFT/N/−112.1250.536672.150.585797p > 0.01OEXM-FC0.0100.010p > 0.01
RFT/N/+221.8277780.683681.9050.657927p > 0.01OEYM-FC0.270.090.290.09p > 0.01
RFT/N/−222.1194440.8391422.02550.608324p > 0.01High Frequency Interval
Classic Posturography ParametersCEXH1.240.171.090.28p > 0.01
RI241.2977.61168.7387.85p < 0.01CEYH1.040.291.050.26p > 0.01
RI-FC348.46101.2251.55135.66p < 0.01OEXH0.960.321.010.28p > 0.01
surf OE407.25124.89414.06212.59p > 0.01OEYH0.720.130.770.13p > 0.01
surf CE939.71312.53656.25369.4p < 0.01CEXH-FC1.650.191.610.25p > 0.01
surf OE-FC831.72243.34740452.75p > 0.01CEYH-FC1.570.251.630.2p > 0.01
surf CE-FC2769.06750.031565.61782.82p < 0.01OEXH-FC0000p > 0.01
length OE552.94103.76512.8598.4p > 0.01OEYH-FC0.750.260.720.17p > 0.01
length CE986.93310.77739.17150.98p < 0.01Video Head Impulse Test
length OE-FC822.41285.98722182.44p > 0.01gain med L0.720.31.070.3p < 0.01
length CE-FC2237.64675.931694.96642.48p < 0.01gain mean L0.720.311.080.3p < 0.01
avspe OE9.111.158.551.63p > 0.01gain med R0.720.30.970.22p < 0.01
avspe CE18.68412.072.73p < 0.01gain mean R0.720.310.970.23p < 0.01
avspe OE-FC13.042.9412.75.56p > 0.01reslo mean L0.890.351.350.63p < 0.01
avspe CE-FC38.1213.6327.7111.28p < 0.01reslo med L0.870.341.340.64p < 0.01
stdspe OE5.470.965.031.14p > 0.01reslo mean R0.840.341.330.72p < 0.01
stdspe CE10.683.247.612.09p < 0.01reslo med R0.840.351.320.72p < 0.01
stdspe OE-FC9.923.238.063.24p > 0.01
stdspe CE-FC25.356.8318.187.46p < 0.01
RDT, Rod and Disc test; RFT, Rod and Frame Test; CCW, counter-clockwise; CW, clockwise; N, neutral condition; CE, closed eyes; OE, opened eyes; X, spectral values of body oscillations on X plane; Y, spectral values of body oscillations on Y plane; L, low frequency interval; M, middle frequency interval; H, high frequency interval; surf, surface of the ellipse of confidence; avspe, mean velocity of body sways; stdspe, standard deviation of velocity of body sways; RI, Romberg index; FC, foam carpet; med, median; reslo, regression slope; L, left; R, right; SD, standard deviation; MCS, multiple chemical sensitivity; HC, healthy subjects. Significant results are reported in bold character.

