Abstract
This work focused on the intensification of extraction process of glycyrrhizic acid (GA) from Glycyrrhiza uralensis using ultrasound-assisted extraction (UAE) method. Various process parameters such as ultrasonic power, ultrasonic frequency, extraction temperature, and extraction time which affect the extraction yield were optimized. The results showed that all process parameters had exhibited significant influences on the GA extraction. The highest GA yield of 217.7 mg/g was obtained at optimized parameters of 125 W, 55 kHz, 25 °C, and 10 min. Furthermore, the extraction kinetics model of this process was also investigated based on Fick’s first law available in the literature. Kinetic parameters such as equilibrium concentration (Ce) and integrated influence coefficient (λ) for different ultrasonic powers, ultrasonic frequencies, and extraction temperatures were predicted. Model validations were done successfully with the average of relative deviation between 0.96% and 4.36% by plotting experimental and predicted values of concentration of GA in extract. This indicated that the developed extraction model could reflect the effectiveness of the extraction of GA from Glycyrrhiza uralensis and therefore serve as the guide for comprehending other UAE process.
1. Introduction
It has been reported that glycyrrhizic acid (GA) is a major active constituent in the traditional medicines called Glycyrrhizia uralensis, which has been used as a medicinal herb in worldwide [1]. Glycyrrhizic acid has been recognized as exhibiting many important pharmacological activities such as antiviral, anticancer, anti-HIV, antiulcer, anti-inflammatory, antioxidant [2,3], and so on. Besides medicinal usage as an ingredient in pharmaceutical preparations, glycyrrhizic acid is also used extensively as a sweetener or functional additive in food, tobacco, and confectionery products all over the world [4,5].
In recent years, glycyrrhizic acid is generally extracted from various natural plants by several extraction techniques such as supercritical CO2 extraction [6], aqueous two phase extraction [7], solvent extraction [5,8], third-phase extraction [9], microwave-assisted extraction [10], ultrasound-assisted extraction [11], and so on. Among the different existing techniques, UAE has been widely recognized as a safe, effective, inexpensive, and environment-friendly technology. When it is applied in the solid-liquid extraction process, it has been proven to be capable of reducing the consumption of solvent, shortening the extraction time, and improving extraction yields [12,13,14,15]. This is mainly attributed to the ultrasonic cavitation, which can generate cavitation bubbles in liquid medium and result in macro-turbulence, high-velocity flow, and perturbation in micro-particles of the biomass [16]. The collapse of these bubbles can facilitate the disruption of cell wall and allow the penetration of solvent into raw materials, thus increasing the contact surface area of solid particle and enhancing mass transfer across cell membrane [17]. Moreover, the conventional extraction methods for extraction of glycyrrhizic acid from Glycyrrhiza uralensis suffer from various disadvantages such as more extraction time, large solvent requirement, higher extraction temperature, and lower yield. Thus, ultrasound will be applied for the extraction of glycyrrhizic acid in this work.
In order to better predict the UAE process and also understand the effects of various extraction factors on the extraction process, it is very important for use a mathematical tool to model the extraction mechanism and determine the kinetic parameters. In recent years, Charpe and Rathod [11] have investigated the kinetic model for the extraction of glycyrrhizic acid based on the second order rate equation, in which they established the kinetic model of the temperature and solvent to solute ratio. However, the establishment of a kinetic model for ultrasonic power and ultrasonic frequency had not been studied. In fact, ultrasonic power and ultrasonic frequency are two important process parameters for the extraction of glycyrrhizic acid. Yang, et al. [18] reported that the extraction efficiency of glycyrrhizic acid increased dramatically with the increase of ultrasonic power from 50 to 200 W. Charpe and Rathod presented that there was a higher glycyrrhizic acid yield at ultrasonic frequency of 25 kHz. A similar result was reported in previous literatures [19]. Therefore, the optimization of extraction process using ultrasound and its establishment of kinetic model for ultrasonic power and ultrasonic frequency is worthy of further study.
The objective of this work is to investigate the effects of process parameters on the extraction of glycyrrhizic acid from Glycyrrhiza uralensis and to obtain optimum process parameters which will give higher yields compared to conventional extraction methods. The second objective is to understand the kinetics and to develop the extraction model for this extraction process under optimum process parameters to predict equilibrium concentration and integrated influence coefficient.
2. Materials and Methods
2.1. Plant Materials
The samples of licorice root (Glycyrrhiza uralensis Fisch.) were purchased from a local herbal medicine market in Wuxi, Jiangsu province, China. The authenticity of the plant species was established by Professor Shouquan Lin (Institute of Medicinal Plants, Chinese Academy Medical Sciences). The dried samples were cut along the root into round slices about 3 mm thick and 5–10 mm in diameter using a blade mixer. After that, the ground samples were sealed and stored in a dry and dark place until use. The content of GA in the sample is 3.72 wt.% based on HPLC analysis.
2.2. Reagents
Ammonia (25% NH3, chemical reagent), acetonitrile (reagent for high performance liquid chromatography), glacial acetic acid (analytical reagent), ethanol (analytical reagent), and glycyrrhizic ammoniate were all purchased from the Tianjin Chemical Factory, Tianjin, China.
2.3. Apparatus
Ultrasound-assisted extraction has been carried out in an ultrasonic bath system (KQ-250DE, Kunshan Ultrasound Co. Ltd., Suzhou, China) of internal dimensions 300 mm × 240 mm × 150 mm with multi-frequency. The nominal output power and frequency of the ultrasound generator can be adjusted from 0 to 250 W and from 20 to 100 kHz, respectively. Extraction temperature was controlled by the water temperature in the ultrasonic bath, which can be circulated and regulated at constant desired temperatures using a heating/cooling temperature controlling circulator included in the extraction apparatus. Moreover, time can also be set to a desired value by a digital timer.
2.4. Ultrasound-Assisted Extraction
For all following extraction experiments, according to a previous report [20], the solvent used was composed with 1% ammonia + 60% ethanol + 39% water. The extraction was carried out in a 500 mL Erlenmeyer flask kept in an ultrasound bath. Firstly, an aforementioned ground sample of 5.0 g was mixed with 150 mL of mixed solution to produce the solvent/solid ratios of 30 mL/g in the flask. In order to avoid the loss of solvent, the flask was covered with lid before it was kept to ultrasound bath. After sealing, the sample beakers were immersed into the ultrasound bath for irradiation and fixed well in the same position during sonication. At the end of experiment, the filtrates were centrifuged for 10 min at 12,000 rpm and ordinary temperature, and the supernatant was taken out and was filtered through a 0.45 μm filter. Finally, the samples were stored in a dark site at a low temperature until the analysis of glycyrrhizic acid composition.
2.5. Single Factor Experimental Design
In the experiments, the effects of three process parameters, including ultrasonic power, ultrasonic frequency, and extraction temperature on the glycyrrhizic acid yield were investigated by single factor experiments. Firstly, sonication was carried out at 25 °C, and frequency of 55 kHz under five different levels of ultrasonic powers (12.5, 50, 75, 100, and 125 W) to study the effect of ultrasonic power. Secondly, the effect of ultrasonic frequency on the extraction yield of glycyrrhizic acid was performed at 25 °C, and ultrasound power of 125 W with different frequencies (20, 30, 40, 55, and 90 kHz). Finally, the effect of extraction temperature on the extraction yield of glycyrrhizic acid was carried out at an ultrasonic frequency of 55 kHz and power of 125 W with different extraction temperatures (20, 25, 35, 60, and 70 °C). The extraction process was repeated three times for each experiment.
2.6. Modeling Theoretical
To develop the extraction model for the UAE process of glycyrrhizic acid, the Fick’s diffusion Equation for the behavior of solid-liquid extraction from cellular tissue was described on the basis of the reported studies [21,22,23,24]. The solution of this equation for an infinite slab can be written as [25,26,27]:
where D is the diffusion coefficient (m2/s), r is the solid particle radius (m), mi is the non-zero positive roots of the equation: , where , V is the total solution volume (m3), and is the solution volume of penetrating the solid particles (m3). Ct is the total solute concentration at time t during the extraction process (g/L), Ce is the equilibrium solute concentration in the liquid extract (g/L), and C0 is the initial solute concentration at t = 0 (g/L).
Equation (1) can be reduced to the first term of the series solution because only the first term is significant in a short period [26,28]. Consequently, it can be written as:
Suppose that the initial solute concentration C0 is 0 at t = 0, substituting it into Equation (2), thus, the value of the expression is determined as 1. Substituting it into Equation (2) and rearranging it, the Ct can be written simply as an Equation (3):
In the ultrasonic extraction process, the diffusion coefficient D is generally affected by the process parameters, including ultrasonic power, frequency, and extraction temperature. In general, ultrasound irradiation can induce eddying effects such as acoustic streaming, acoustic radiation force, and acoustic cavitation, which have been proven to be a significant effect on the extraction process and therefore influence the extraction efficiency or yield. Therefore, ultrasonic power, frequency, and extraction temperature are the main factors for the extraction at other fixed conditions.
In order to simplify the analysis process, let . λ is the integrated influence coefficient (s−1), which is a function about the process parameters (P, f and T) [29]. So the extraction model Equation (3) under ultrasound irradiation can be written as:
When using a nature logarithm function to process both sides of Equation (4), a linear relationship below is achieved:
When is plotted versus t, the λ can be determined experimentally by the slope, and Ce also can be determined from its intercept. It was assumed that the extraction model could be employed as the analysis of the influences of process parameters (P, f, and T). Thus, the Ce and λ have relations with those parameters and are fitted by functional models by using the software: Origin Pro 7.5SR1 (V 7.5776, Origin Lab Corporation, Northampton, MA, USA).
2.7. HPLC Analyses
The glycyrrhizic acid in the extract samples were determined by using HPLC. HPLC analyses were carried out on an Agilent Model 1100 high performance liquid chromatography (Agilent Co., Ltd., Qbiogene, CA, USA) which consists of an auto sampler, a degasser, a quaternary pump, and a DAD detector. Before analysis, the extracts obtained from UAE method were centrifuged at 12,000 rpm for 10 min to remove the fine suspensions on a MIKRO 22R frozen centrifuge (Hettich, Tutlingen, Germany). Separation was achieved on a Kromasil KR100-5 C18 column of dimensions 150 mm × 4.6 mm. The column was eluted by a mobile phase which consists of a binary mixture of 3% CH3CN and CH3COOH-H2O (41:59, v/v). The eluent was monitored by a DAD with the displayed wavelength set at 254 nm. The flow rate was constant at 1 mL/min. The total time of the chromatographic separation and the retention time of glycyrrhizic acid were 20 min and 10.5 min, respectively. The extraction yield of glycyrrhizic acid can be calculated using Equation (6).
where amount of glycyrrhizic acid represents the average mass of three subsequent sample determinations, sample weight represents the average weight from three samples before extraction.
2.8. Statistical Analysis
Each extraction procedure was replicated three times. The significance of the differences of quercetin and rutin was calculated using a one-way ANOVA procedure. Duncan’s multiple range tests were applied for the determination of significant differences among treatments at p-values < 0.05. The results of HPLC analysis were expressed as the mean value ± the standard deviation.
3. Results and Discussion
3.1. Effect of Process Parameters
3.1.1. Effect of Ultrasonic Power
The evolution of extraction yields of glycyrrhizic acid from Glycyrrhiza uralensis with different ultrasonic powers at different extraction times were shown in Figure 1. As can be seen, the extraction yields of glycyrrhizic acid under different ultrasonic powers firstly increased rapidly with extraction time, and then a slight increase was observed. Finally, they all reached their equilibrium. The results indicated that the glycyrrhizic acid yield was closely related to the extraction time. For different ultrasonic powers of 20, 50, 75, 100, and 125 W, the glycyrrhizic acid yields were 161.2, 174.9, 192.7, 198.5, and 204.6 mg/g after reaching the stabilization at corresponding extraction times of 22, 20, 16, 13, and 10 min, respectively. Also, the glycyrrhizic acid yield increased gradually along with the increase of the ultrasonic power. As expected, the results showed that the increasing ultrasonic power significantly reduced the extraction time and obtained the highest extraction yield. It might be mainly attributed to the reason that an increase in ultrasonic power can provide more intense acoustic cavitation, which can markedly influence the acoustic amplitude and the dynamics of cavitation bubbles [30,31], and further can affect the extraction efficiency. As a result, the increase of ultrasonic power is beneficial to shorten the extraction time and to enhance the extraction yield. Similar results were obtained in the studies of ultrasound-assisted extractions of rutin from Euonymus alatus Sieb and tartary buckwheat milling fractions, in which the increase of output ultrasonic power enhanced the extraction yields [32]. These results were reasonable because increased ultrasonic power could improve the extraction mechanical and cavitation effects of ultrasound [33].
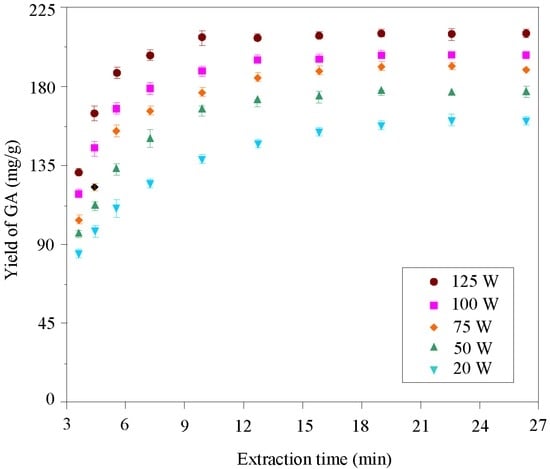
Figure 1.
Evolution of extraction yields of glycyrrhizic acid with different ultrasonic powers at an extraction temperature of 25 °C and ultrasonic frequency of 20 kHz.
An increase in the ultrasonic power was proven to help to shorten the extraction time and prominently improve the glycyrrhizic acid yield even though the energy consumption needed to be considered. Consequently, the maximum value of ultrasonic power of 125 W was used for the following tests.
3.1.2. Effect of Ultrasonic Frequency
The effect of ultrasonic frequency on the glycyrrhizic acid yield at different extraction times was illustrated in Figure 2. Similar to the effect of ultrasonic power on the extraction yield, the glycyrrhizic acid yield increased rapidly in the first 3 min and then showed a slow increase from 7 to 16 min before reaching equilibrium. Moreover, the glycyrrhizic acid yield significantly increased along with the increase of the ultrasonic frequency from 20 kHz to 55 kHz. After reaching equilibrium, the glycyrrhizic acid yield at 20 kHz was 133.8 mg/g while the corresponding yields increased to 217.7 mg/g at 55 kHz. It was noteworthy that a further increase in the ultrasonic frequency to 90 kHz, however, the glycyrrhizic acid yield did not increase, but slightly decreased. The results suggested that the frequency of 55 kHz was an optimal ultrasonic frequency for the extraction of glycyrrhizic acid. Similarly, our previous studies [34,35] also reported that the highest extraction yield was obtained at an optimal ultrasonic frequency during the extraction of rutin from Sophora japonica and hesperidin from tangerine peels. These results were mainly attributed to the resonance mechanism of cavitation bubbles generated by ultrasound. Actually, in the UAE process, not all bubbles can cause significant cavitation effects. Only when the ultrasonic frequency is equal to the resonance frequency of cavitation bubbles, the greatest coupling of the ultrasonic energy will occur, which is favorable for cell to swell and enlarge the surface area of the cell wall. The increased area and sound swelling can improve the rate of mass transfer, which further leads to a reduction in the extraction time and increase in the extraction yield [36]. Therefore, the recommended ultrasonic frequency was 55 kHz in the rest of experiments.
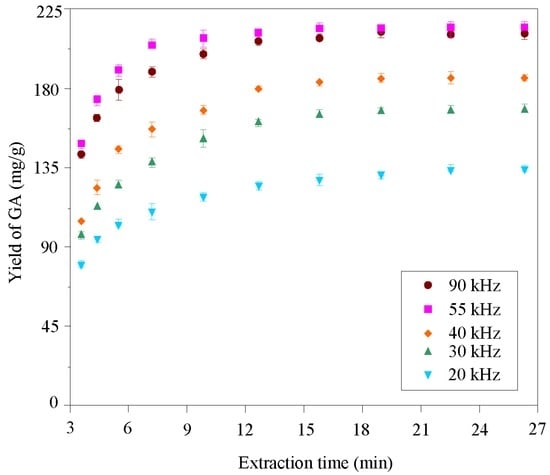
Figure 2.
Evolution of extraction yields of glycyrrhizic acid with different ultrasonic frequencies at an extraction temperature of 25 °C and ultrasonic power of 125 W.
3.1.3. Effect of Extraction Temperature
Figure 3 showed the total extraction yield of glycyrrhizic acid from Glycyrrhiza uralensis under different extraction temperatures and extraction time. The extraction temperatures had markedly effected on the total glycyrrhizic acid yield. As can be seen from Figure 3, with an increase in the extraction temperatures from 20 °C to 25 °C the glycyrrhizic acid yield was rapidly increased from 133.6 mg/g to nearly 160.0 mg/g. However, a further increase in the extraction temperature to 60 °C only increased by 13.5 mg/g. This result showed a low efficiency of extraction temperatures between 25 °C and 60 °C, which not only did not significantly increase the glycyrrhizic acid yield but was also power-consuming. As expected, after the extraction temperature of 60 °C, the glycyrrhizic acid yield rapidly increased as the extraction temperature increased once again. The possible reason for this is that the rising of high extraction temperature can accelerate the swelling and softening of the samples, which is favorable for increasing the solubility of extracted elements and decreasing the viscosity of the solvent [37]. As a result, the mass transfer of glycyrrhizic acid from sample particles was improved when the extraction temperature was increased to a high level. These results indicated that the high extraction temperature in an appropriate range could facilitate the extraction of raw materials under ultrasound irradiation. By considering the convenience and cost of the operation, the recommended temperature was 25 °C.
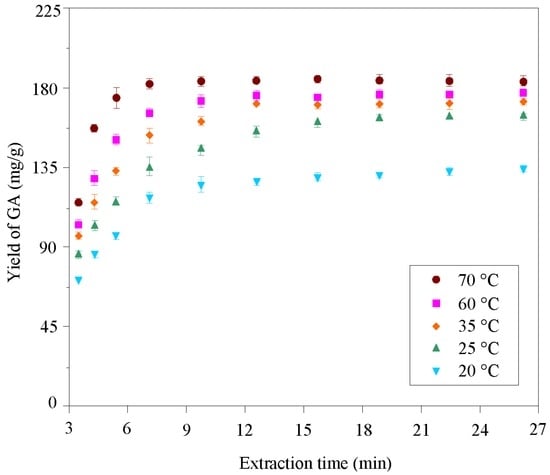
Figure 3.
Evolution of extraction yields of glycyrrhizic acid with different extraction temperatures at ultrasonic frequency of 20 kHz and ultrasonic power of 125 W.
Based on the present results, when other extraction conditions were constant, the three process parameters—i.e., ultrasonic power, frequency, and extraction temperature—played an important role in the extraction of glycyrrhizic acid from Glycyrrhiza uralensis in most cases of ultrasound treatment. Therefore, it was necessary to study the extraction model for the extraction of glycyrrhizic acid under the three key process parameters.
3.2. Extraction Model for The Extraction Process of Glycyrrhizic Acid
For ultrasonic power, the relationship of against time was shown in Figure 4 which presented a good linear relationship. The values of kinetic parameters (Ce, λ) for different ultrasonic powers from the logarithm of were obtained and listed in Table 1. As can be seen, these kinetic parameters increased with the increase of ultrasonic power as expected in accordance with the experimental analysis results.
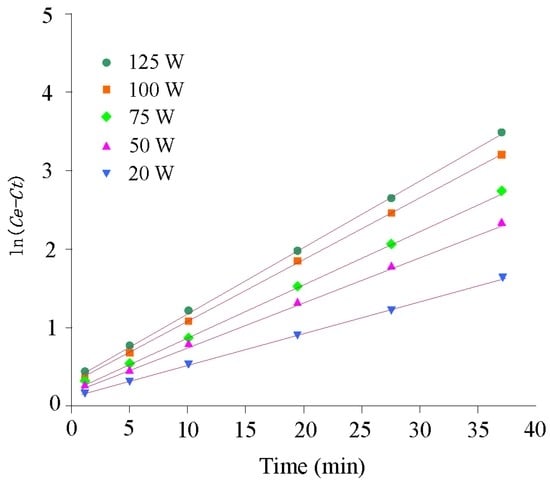
Figure 4.
The relationship of against extraction time (t) under different ultrasonic powers

Table 1.
Parameters of Kinetic model of glycyrrhizic acid from Glycyrrhiza uralensis with different ultrasonic powers.
Because these kinetic parameters were extremely dependent on ultrasonic powers, the Ce and λ values for different P values were successfully fitted by linear and second-order polynomial functions due to the high values of correlation coefficient (R2). The functions were plotted in Figure 5 and expressed as follows:
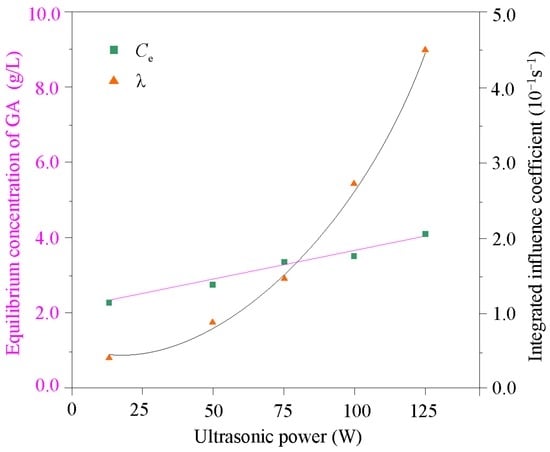
Figure 5.
The equilibrium concentration (Ce) of glycyrrhizic acid, and integrated influence coefficient (λ) with different ultrasonic powers.
Substituting Equations (7) and (8) into Equation (4), the total bufadienolides concentration Ct,p as a function of P therefore could be obtained. Their relationship was expressed as:
This power extraction model (i.e., Equation (9)) could be employed to predict the extraction of glycyrrhizic acid from Glycyrrhiza uralensis at a given ultrasonic frequency of 55 kHz and extraction temperature of 25 °C with a solvent/solid ratio of 30 (mL/g).
For ultrasonic frequency, the relationship of against time was shown in Figure 6 which also presented a good linear relationship. The values of kinetic parameters (Ce, λ) for different ultrasonic frequencies from the logarithm of were obtained and listed in Table 2.
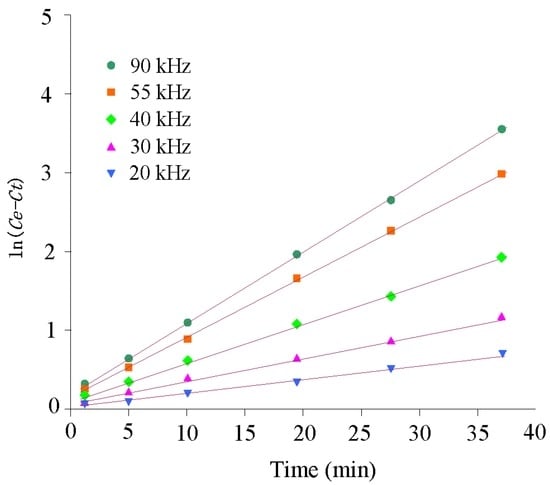
Figure 6.
The relationship of against extraction time (t) under different ultrasonic frequencies.
Table 2.
Parameters of kinetic model of glycyrrhizic acid from Glycyrrhiza uralensis with different ultrasonic frequencies.
As can be seen, the extraction at a frequency of 70 kHz displayed the highest λ value compared to those at 20, 30, 40, and 55 kHz. For the Ce, however, the highest Ce value was obtained at 55 kHz instead of 90 kHz. The result was in agreement with the results in Section 3.1.2. Based on the model assumption, these kinetic parameters (Ce, λ) were expressed by the variance of ultrasonic frequency (f). Therefore, the relationships among Ce, λ, and f were nonlinearly fitted with three-order polynomial, and second-order polynomial functions, respectively. The two functions were plotted in Figure 7 and expressed as follows:
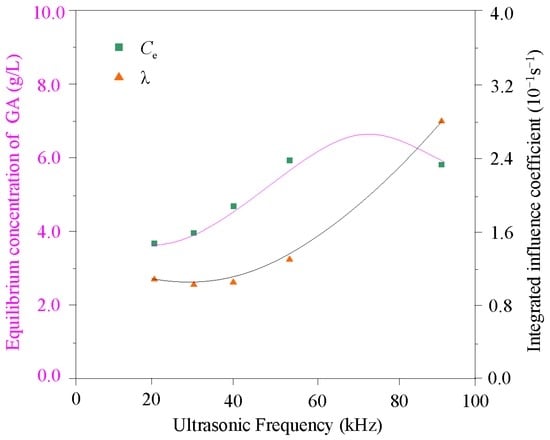
Figure 7.
The equilibrium concentration (Ce) of glycyrrhizic acid, and integrated influence coefficient (λ) with different ultrasonic frequencies.
Substituting the Ce,f and λf into Equation (4), the relationship was described as:
This ultrasonic frequency extraction model (i.e., Equation (12)) could be employed to predict the glycyrrhizic acid extraction process at a given ultrasonic power of 125 W and extraction temperature of 25 °C with a solvent/solid ratio of 30 (mL/g).
For extraction temperature, the relationship of against time was shown in Figure 8. It can be seen that presented a good linear relationship. The values of kinetic parameters (Ce, λ) for different extraction temperatures from the logarithm of Figure 8 were obtained and listed in Table 3.
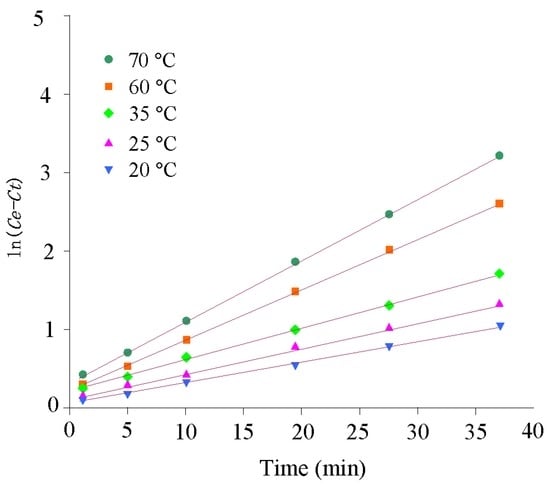
Figure 8.
The relationship of against extraction time (t) under different extraction temperatures.
Table 3.
Parameters of kinetic model of glycyrrhizic acid from Glycyrrhiza uralensis with different extraction temperatures.
As can been seen, both values of Ce and λ increased as the extraction temperature increased. The highest Ce and λ values were all achieved at a temperature of 70 °C, followed by those at 60, 35, 25, and 20 °C. This result was similar to the previous report [38], which was consistent with the fact that a significant increase of extraction temperature could cause the increase of diffusivity [39,40]. The relationships among Ce, λ, and T were fitted well by two second-order polynomial functions because of the high values of R2. The functions were plotted in Figure 9 and written as:
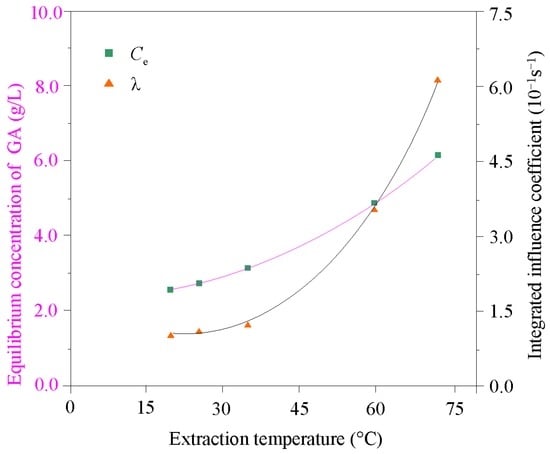
Figure 9.
The equilibrium concentration (Ce) of glycyrrhizic acid, and integrated influence coefficient (λ) with different extraction temperatures.
Substituting the Ce,T and λT into Equation (4), the relationship was obtained as:
This temperature extraction model (i.e., Equation (15)) could be employed to predict the glycyrrhizic acid extraction process at a given ultrasonic power of 125 W and frequency of 55 kHz with a solvent/solid ratio of 30 (mL/g).
3.3. Verification of Model
Validity of those three extraction models—i.e., Equations (9), (12) and (15)—have been evaluated by comparing with the experimental data. In order to verify the accuracy of the proposed extraction models, further several experiments were carried out at different process parameters. In these experiments, to ensure accuracy of the experimental results, each experiment was repeated three times and the average values were used. Table 4 listed the relative deviation (RD) between predictive values and experimental values. It could be seen that the average of RD showed a low range from 0.96% to 4.36%. The maximum values of relative deviation of ultrasonic power, ultrasonic frequency, and extraction temperature were 7.98%, 8.21%, and 8.74%, respectively.
Table 4.
The relative deviation between predictive values and experimental values.
Additionally, Figure 10 depicted the experimental and model prediction of glycyrrhizic acid concentration. In all the considered cases, as can be seen, there was a good agreement between the experimental data and simulated trends. These satisfactory fits indicated that the developed extraction model could be used for better describing and predicting the ultrasonic extraction process of glycyrrhizic acid from Glycyrrhiza uralensis.
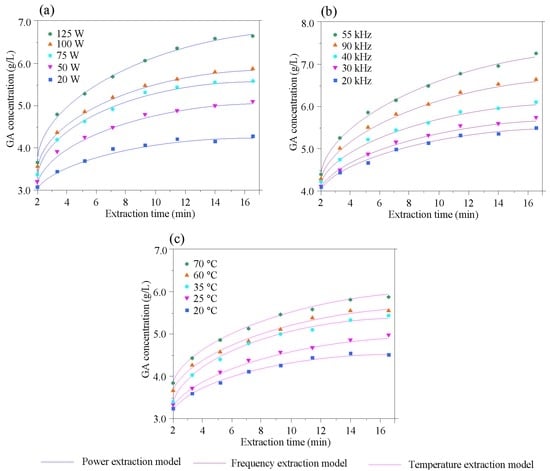
Figure 10.
Comparison between prediction values of extraction models and experimental values for the extraction glycyrrhizic acid: (a) power extraction model at f = 55 kHz, T = 25 °C; (b) frequency extraction model at P = 125 W, T = 25 °C; (c) temperature extraction model at P = 125 W, f = 55 kHz.
4. Conclusions
In the present work, extraction experiments were performed under ultrasonic irradiation in order to study the process parameters on the extraction of glycyrrhizic acid from Glycyrrhiza uralensis. It has been found that glycyrrhizic acid yield increased with increased ultrasonic power, extraction temperature, and ultrasonic frequency. However, the yield decreased at the ultrasonic frequency from 55 kHz to 90 kHz was found. The results indicated ultrasonic power and extraction temperature have a very positive effect on the glycyrrhizic acid yield, while ultrasonic frequency beyond 55 kHz has a negative impact. The optimal extraction conditions were as: ultrasonic power of 125 W, ultrasonic frequency of 55 kHz, and extraction temperature of 25 °C, which has given the highest yield of glycyrrhizic acid. To better describe and predict the UAE processes, the extraction model with different process parameters was developed on the basis of Fick’s diffusion Equation. Close agreement with between predictive values and experimental data to the average of RD from 0.96% to 4.36% was achieved, which indicated that the developed model gave satisfactory quality of data fit and could be used to better optimize the UAE process of glycyrrhizic acid from Glycyrrhiza uralensis.
Acknowledgments
The authors wish to thank the Natural Science Foundation of China (309716899), the Natural Science Foundation of Fujian Province of China (2015J01661), and the Program of Introducing Talents of Discipline for Universities (B12018) for the support of this study.
Author Contributions
Baida Qu and Jianqing Liao proposed the idea for this research work; Jianqing Liao conceived and designed the experiments; Nan Zheng performed the experiments; Jianqing Liao wrote the paper.
Conflicts of Interest
The authors declare no conflict of interest.
References
- Li, D.Q.; Wang, X.H.; Xia, L.P. Advancement of the clinical pharmacological research and application of licorice. China Pharm. 2000, 9, 55–56. [Google Scholar]
- Hu, J.F.; Shen, F.J. A survey of the studies on chemical constituents of Glycyrrhiza. Nat. Prod. Res. Dev. 1996, 8, 77–91. [Google Scholar]
- Zhou, Y.; Wang, M.K.; Liao, X.; Zhu, X.M.; Peng, S.L.; Ding, L.S. Rapid identification of compounds in Glycyrrhiza uralensis by liquid chromatography/Tandem mass spectrometry. Chin. J. Anal. Chem. 2004, 32, 174–178. [Google Scholar]
- Zhang, J.; Yao, J.; Ding, L. Advancement of research on the utilization of Glycyrrhiza. Grassl. Turf. 2000, 2, 12–17. [Google Scholar]
- Kersemans, M.; Martens, A.; Degrieck, J.; van den Abeele, K.; Delrue, S.; Pyl, L.; van Paepegem, W. The ultrasonic polar scan for composite characterization and damage assessment: Past, present and future. Appl. Sci. 2016, 6, 58. [Google Scholar] [CrossRef]
- Kim, H.S.; Lee, S.Y.; Kim, B.Y.; Lee, E.K.; Ryu, J.H.; Lim, G.B. Effect of modifier on supercritical CO2 extraction of glycyrrhizin from licorice and the morphology of licorice tissue after extraction. Biotechnol. Bioprocess Eng. 2004, 9, 447–453. [Google Scholar] [CrossRef]
- Tan, T.W.; Huo, Q.; Ling, Q. Purification of glycyrrhizin from Glycyrrhiza uralensis Fisch with ethanol/phosphate aqueous two phase system. Biotechnol. Lett. 2002, 24, 1417–1420. [Google Scholar]
- Niu, G.G.; Xie, Y.C.; Lou, J.F.; Liu, H.Z. Isolation and purification of glycyrrhizic acid with solvent extraction. Sep. Purif. Technol. 2005, 44, 189–196. [Google Scholar] [CrossRef]
- Shen, S.; Chang, Z.; Liu, J.; Sun, X.; Hu, X.; Liu, H. Separation of glycyrrhizic acid and liquiritin from Glycyrrhiza uralensis Fisch extract by three-liquid-phase extraction systems. Sep. Purif. Technol. 2007, 53, 216–223. [Google Scholar] [CrossRef]
- Sun, C.; Xie, Y.; Liu, H. Microwave-assisted micellar extraction and glycyrrhizic acid and liquiritin in licorice. Chin. J. Chem. Eng. 2007, 15, 474–477. [Google Scholar] [CrossRef]
- Charpe, T.W.; Rathod, V.K. Extraction of glycyrrhizic acid from licorice root using ultrasound: Process intensification studies. Chem. Eng. Process. 2012, 54, 37–41. [Google Scholar] [CrossRef]
- Díaz, A.; Casas, M.T.; Puiggalí, J. Dispersion of functionalized silica micro-and nanoparticles into poly(nonamethyleneazelate) by ultrasonic micro-molding. Appl. Sci. 2015, 5, 1252–1271. [Google Scholar] [CrossRef]
- Zhao, L.; Fu, Y.; Chen, C.; Yang, W.; Hu, Q. Ultrasonic-assisted extraction and chromatography separation of polysaccharides from the base of flammulinavelutipes stipe. Sep. Sci. Technol. 2015, 50, 824–832. [Google Scholar] [CrossRef]
- Qiu, L.; Shao, Z.; Wang, W.; Wang, F.; Wang, J.; Wang, D.; Wang, Y. Enhanced Cyclability of C/Lithium iron phosphate cathodes with a novel water-soluble lithium-ion binder. Electrochim. Acta 2014, 145, 11–18. [Google Scholar] [CrossRef]
- Liao, J.; Zheng, N.; Qu, B. An improved ultrasonic-assisted extraction method by optimizing the ultrasonic frequency for enhancing the extraction efficiency of lycopene from tomatoes. Food Anal. Methods 2016, 9, 2288–2298. [Google Scholar] [CrossRef]
- Zhang, H.; Zhang, L.; Hu, X.; Zhou, Y.; Ding, C.; Yang, R.; Li, D. Optimization of ultrasound-assisted extraction of artemisinin from Artemisia annua L. by response surface methodology. Sep. Sci. Technol. 2014, 49, 673–681. [Google Scholar] [CrossRef]
- Li, D.J.; Song, J.F.; Xu, A.Q.; Liu, C.Q. Optimization of the ultrasound-assisted synthesis of lutein disuccinate using uniform design. Ultrason. Sonochem. 2014, 21, 98–103. [Google Scholar] [CrossRef] [PubMed]
- Yang, L.; Li, L.L.; Liu, T.T.; Zu, Y.G.; Yang, F.J.; Zhao, C.J.; Zhang, Z.H. Development of sample preparation method for isoliquiritigenin, liquiritin, and glycyrrhizic acid analysis in licorice by ionic liquids-ultrasound based extraction and high-performance liquid chromatography detection. Food Chem. 2013, 138, 173–179. [Google Scholar] [CrossRef] [PubMed]
- Gupta, S.; Sharma, R.; Pandotra, P.; Jaglan, S.; Gupta, A.P. Chromolithic method development, validation and system suitability analysis of ultra-sound assisted extraction of glycyrrhizic acid and glycyrrhetinic acid from Glycyrrhiza glabra. Nat. Prod. Commun. 2012, 7, 991–994. [Google Scholar] [PubMed]
- Pan, X.; Liu, H.; Jia, G.; Shu, Y.Y. Microwave-assisted extraction of glycyrrhizic acid from licorice root. Biochem. Eng. J. 2000, 5, 173–177. [Google Scholar] [CrossRef]
- Vorobiev, E.; Lebovka, N. Pulsed-electric-fields-induced effects in plant tissues: Fundamental aspects and perspectives of applications. In Electrotechnologies for Extraction from Food Plants and Biomaterials; Springer: New York, NY, USA, 2009; pp. 233–246. [Google Scholar]
- Van der Poel, P.; Schiweck, H.; Schwartz, T. Sugar Technology Beet and Cane Sugar Manufacture, Beet Sugar Development Foundation; Verlag Dr Albert Bartens KG: Denver, CO, USA, 1998; pp. 103–145. [Google Scholar]
- Jemai, A.B.; Vorobiev, E. Effect ofmoderate electric field pulses on the diffusion coefficient of soluble substance from apple slices. Int. J. Food Sci. Technol. 2002, 37, 73–86. [Google Scholar] [CrossRef]
- Wu, J.C.S.; Lee, E.H. Ultrafiltration of soybean oil/hexane extract by porous ceramic membranes. J. Membr. Sci. 1999, 154, 251–259. [Google Scholar]
- Pordesimo, H.; Li, L.; Weiss, J. High intensity ultrasound-assisted extraction of oil from soybeans. Food Res. Int. 2004, 37, 731–738. [Google Scholar]
- Schwartzberg, H.G.; Chao, R.Y. Solute diffusivities in leaching processes. Food Technol. 1982, 36, 73–86. [Google Scholar]
- Crank, J. The Mathematics of Diffusion, 2nd ed.; Clarendon Press: Oxford, UK, 1975; pp. 456–467. [Google Scholar]
- Schwartzberg, H.G. Mathematical analysis of solubilization kinetics and diffusion in foods. J. Food Sci. 1975, 40, 211–213. [Google Scholar] [CrossRef]
- González-Centeno, M.R.; Knoerzer, K.; Sabarez, H.; Simal, S.; Rosselló, C.; Femenia, A. Effect of acoustic frequency and power density on the aqueous ultrasonic-assisted extraction of grape pomace (Vitisvinifera L.)—A response surface approach. Ultrason. Sonochem. 2014, 21, 2176–2184. [Google Scholar] [CrossRef] [PubMed]
- Dai, L.; Yue, L.; Ouyang, W.; Wang, Z. A kinetic model for ultrasound-assisted extraction of geniposide from gardenia jasminoides. Sep. Sci. Technol. 2015, 50, 1518–1522. [Google Scholar] [CrossRef]
- Merouani, S.; Hamdaoui, O.; Rezgui, Y.; Guemini, M. Effects of ultrasound frequency and acoustic amplitude on the size of sonochemically active bubbles-Theoretical study. Ultrason. Sonochem. 2013, 20, 815–819. [Google Scholar] [CrossRef] [PubMed]
- Chemat, F.; Fabiano-Tixier, A.S.; Vian, M.A.; Allaf, T.; Vorobiev, E. Solvent-free extraction of food and natural products. TrAC Trends Anal.Chem. 2015, 71, 157–168. [Google Scholar] [CrossRef]
- Hasegawa, H. Phase-sensitive 2D motion estimators using frequency spectra of ultrasonic echoes. Appl. Sci. 2016, 6, 195. [Google Scholar] [CrossRef]
- Liao, J.; Qu, B.; Liu, D.; Zheng, N. New method to enhance the extraction yield of rutin from Sophora japonica using a novel ultrasonic extraction system by determining optimum ultrasonic frequency. Ultrason. Sonochem. 2015, 27, 110–116. [Google Scholar] [CrossRef] [PubMed]
- Liao, J.; Qu, B.; Xu, B. A novel on-line ultrasonic extraction system for determination of the optimal ultrasonic frequency for plant material. Anal. Methods 2015, 7, 336–341. [Google Scholar] [CrossRef]
- Carail, M.; Fabiano-Tixier, A.S.; Meullemiestre, A.; Chemat, F.; Caris-Veyrat, C. Effects of high power ultrasound on all-E-β-carotene, newly formed compounds analysis by ultra-high-performance liquid chromatography—Tandem mass spectrometry. Ultrason. Sonochem. 2015, 26, 200–209. [Google Scholar] [CrossRef] [PubMed]
- Tao, Y.; Sun, D.W. Enhancement of food processes by ultrasound: A review. Crit. Rev. Food Sci. Nutr. 2015, 55, 70–594. [Google Scholar] [CrossRef] [PubMed]
- Qu, W.; Pan, Z.; Ma, H. Extraction modeling and activities of antioxidants from pomegranate marc. J. Food Eng. 2010, 99, 16–23. [Google Scholar] [CrossRef]
- Şahin, S.; İlbay, Z.; Kırbaşlar, Ş.İ. Study on optimum extraction conditions for olive leaf extracts rich in polyphenol and flavonoid. Sep. Sci. Technol. 2015, 50, 1181–1189. [Google Scholar] [CrossRef]
- Cacace, J.E.; Mazza, G. Mass transfer process during extraction of phenolic compounds from milled berries. J. Food Eng. 2003, 59, 379–389. [Google Scholar] [CrossRef]
© 2016 by the authors; licensee MDPI, Basel, Switzerland. This article is an open access article distributed under the terms and conditions of the Creative Commons Attribution (CC-BY) license (http://creativecommons.org/licenses/by/4.0/).