Article

Bio-Inspired PVDF-Based, Mouse Whisker Mimicking, Tactile Sensor

by
Mohsin Islam Tiwana
1,
Moazzam Islam Tiwana
2,*,
Stephen James Redmond
3,
Nigel Hamilton Lovell
3 and
Javaid Iqbal
1
1
Department of Mechatronics Engineering, National University of Sciences and Technology, H-12, Islamabad 44000, Pakistan
2
Department of Electrical Engineering, COMSATS Institute of Information Technology, Islamabad 44000, Pakistan
3
Graduate School of Biomedical Engineering, University of New South Wales, Sydney 2052, NSW, Australia
*
Author to whom correspondence should be addressed.
Appl. Sci. 2016, 6(10), 297; https://doi.org/10.3390/app6100297
Submission received: 24 August 2016 / Revised: 25 September 2016 / Accepted: 29 September 2016 / Published: 13 October 2016

Abstract

:
The design and fabrication of a Polyvinylidene fluoride (PVDF) based, mouse (or rodent) whisker mimicking, tactile sensor is presented. Unlike previous designs reported in the literature, this sensor mimics the mouse whisker not only mechanically, but it also makes macro movements just like a real mouse whisker in a natural environment. We have developed a mathematical model and performed finite element analysis using COMSOL, in order to optimise the whisker to have the same natural frequency as that of a biological whisker. Similarly, we have developed a control system that enables the whisker mimicking sensor to vibrate at variable frequencies and conducted practical experiments to validate the response of the sensor. The natural frequency of the whisker can be designed anywhere between 35 and 110 Hz, the same as a biological whisker, by choosing different materials and physical dimensions. The control system of this sensor enables the whisker to vibrate between 5 and 236 Hz.

1. Introduction

Humans, vertebrate animals and robots use sensory inputs to interact with their environment [1,2]. Tactile sensation is an important sensory input because it helps vertebrate animals and robots to better understand their surrounding environment, enabling them to intelligently interact with it [3,4]. For example, the time duration between the moment a cat’s whiskers touch an object and then identify it as a mouse to the moment the cat grasps its nape is about one-tenth of a second, even if the cat is blindfolded [4]. While vertebrate animals have biological tactile sensors, humanoid robots, unlike vertebrate animals, lack the ability to either replicate autonomous goal-directed movements or extract salient information from complex environments [5]. Psychophysical studies have shown that the ability of trained rodents to discriminate between fine textures, using their whiskers, is comparable to that of humans using their fingers tips [6].
This research aims to develop better tactile sensor systems to overcome limitations of other modes of sensing. For a detailed review of the current state-of-the-art in tactile sensor design, refer to [7]. We have chosen biological whiskers as our benchmark example. These rodents are known to have the ability to distinguish between different surfaces having different textures and shapes, using their whiskers [8,9,10,11,12]. Hence, whisker-based somatosensory systems appear to be well-suited for acquiring complex sensory information quickly and reliably [13]. Rodents and vertebrate animals sense by moving their whiskers rhythmically across the target surfaces to obtain tactile stimuli from the environment [5,9,14]. This rhythmic movement is reported to have a frequency ranging between 5 and 11 Hz [6,10,15,16,17]. However, the newer studies have shown that the frequency range is between 5 and 25 Hz [10,18,19,20], and is called ‘whisking’. Whisking excites several hundred primary afferent fibers, which innervate mechanoreceptors on each whisker shaft [21]. These signals, traveling via sensory nerve afferents, then reach the brain [8], as shown in Figure 1. The fundamental frequencies depend on the whisker length, ranging from 35 Hz for long whiskers to 110 Hz for short whiskers [9].
Table 1 summarizes the state of the art related to the handful of whisker mimicking inspired tactile sensor designs reported in the literature. Gopal and Hartman developed four whiskers made of Nickel Titanium (Nitinol) [5]. Each of the whiskers was mounted in a set of screws, with two opposing strain gauges to measure the movement of the whiskers. The set of screws were then mounted on a bar attached to a motor. A similar approach was adapted by Kim and Moller [22]. Their design consisted of 0.5 mm steel shafts coupled with Hall–Effect sensors to sense movement. These whiskers were mounted on a Koala platform and were moved using a DC (direct current) motor. Other groups used real mouse whiskers coupled with capacitor microphones [23,24,25]. These studies showed that such systems are useful for texture discrimination. However, all of these proposed designs had limitations due to bulky construction, lower frequency response due to transduction methods and their inability to give precise macro-motions due to use of DC motors for whisker motion. The ability to give macro motions is important, as previous studies have shown that in anesthetised rodents, whisker movement over surfaces results in a high frequency micro-motion superimposed on the macro-motion of whisking [8]. In this paper, we present the modeling, design, fabrication, and testing of a bio-inspired, mouse whisker mimicking tactile sensor that aims to overcome these limitations. A microcontroller-based control system has been implemented. This not only enables the vibration frequency of the whisker shaft to be controlled but also enables it to perform a desired vibratory frequency ‘sweep’.

2. Methods

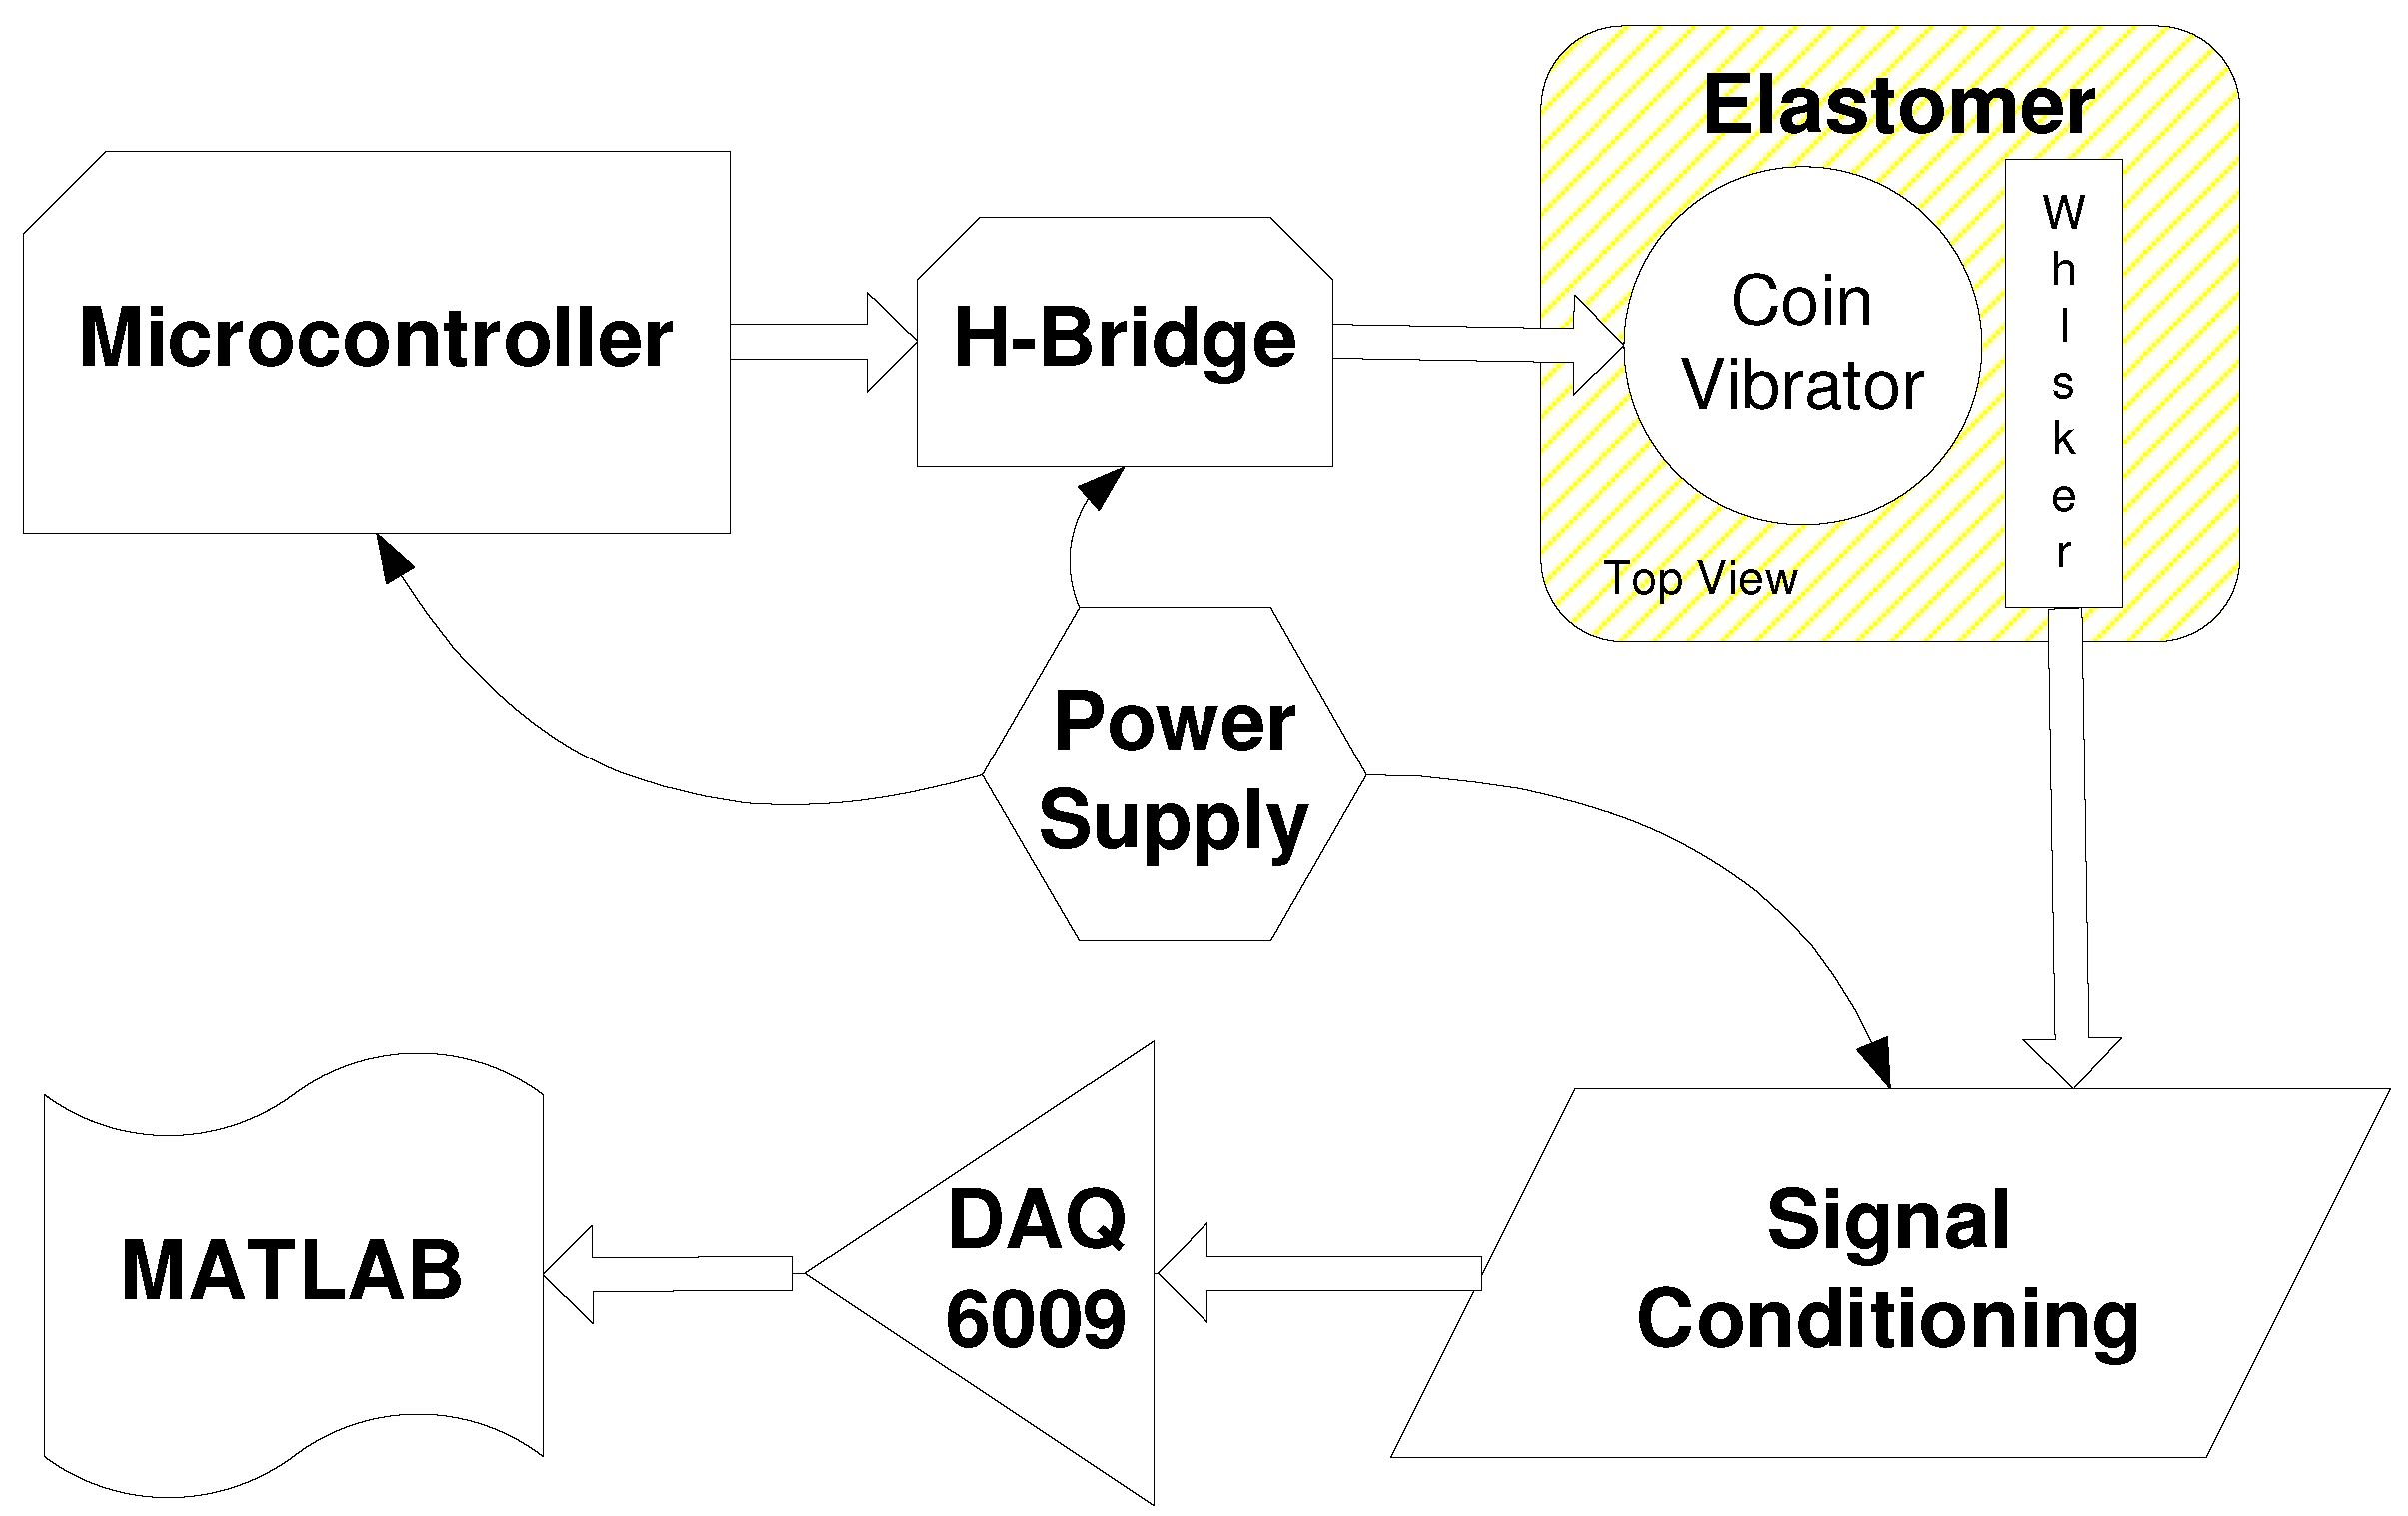
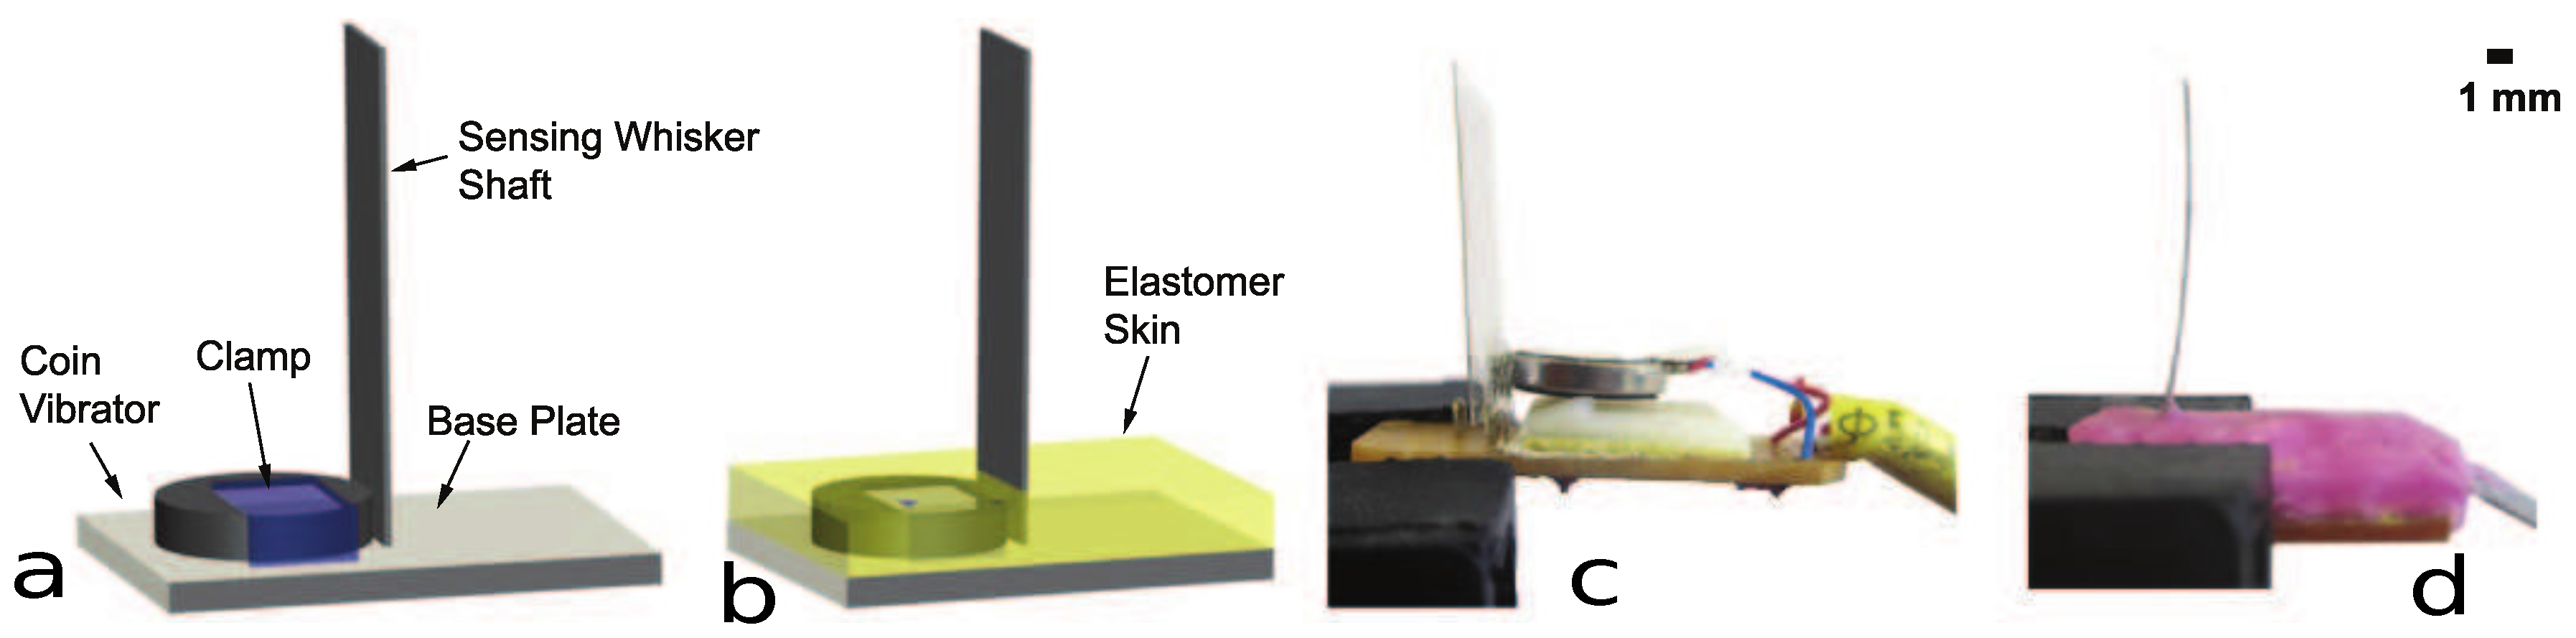
2.1. Design and Sensor Fabrication

The sensor consists of a sensing whisker shaft, a coin vibrator, printed circuit board, an L-shaped clamp, and an elastomer skin. The system level block diagram is shown in Figure 2. The whisker dimensions and material are as important as changing the dimensions of the whisker changes the fundamental frequency. Since the fundamental frequency range of natural whiskers is between 35 Hz and 110 Hz [9], it is important that the artificial whisker’s fundamental frequency lies in the same range. Using the analytical and FEM (Finite Element Model) 3D methods described in the later sections gave us the ability to determine the dimensions, material and bonding of the whisker to achieve this goal.
Any material that has a high frequency response, and is miniature in physical size, is an ideal candidate for sensing applications. For these reasons, besides many other advantages [31,32,33], the PVDF film was chosen as the sensing material. One of the major advantages of using PVDF is that the whisker shaft structure is formed using PVDF film, and since the shaft itself is a sensing element, it eliminates the need for additional sensing elements at the base of the whisker, as reported in most previous designs, reflected in Table 1. This also leads to an overall, more compact sensing unit.
A 0.2 mm thick PVDF film (Measurement Specialties, Hampton, VI, USA) was cut to make a 17 mm long and 3.75 mm wide shaft. Since PVDF can be damaged if subjected to high temperatures, two metallic electrodes (with height equivalent to the elastomer skin) were crimped to the base of the shaft. These electrodes were then soldered onto a printed circuit board (PCB). A coin vibrator that can vibrate up to 200 Hz was then clamped down on the PCB (1.6 mm FR-4) with the help of a plastic (Acrylonitrile–Butadiene–Styrene) L-shaped clamp, as shown in Figure 3. Since natural whiskers whisk in a frequency range from 5 to 25 Hz [10,18,19,20], the 200 Hz vibrator was deemed sufficient for the task. A secondary small piece of PVDF was pasted on to the vibrator. Signals from the secondary PVDF was used to give feedback to the controller to cater for variations in the frequency of the vibrator. A shielded cable, with a Molex (Lisle, IL, USA) connector on the other end, was soldered onto the PCB. This integrated the sensor PCB with the main system PCB as shown in Figure 3. Finally, a 1.5 mm thick polydimethylsiloxane (PDMS)-based silicone elastomer with a Shore A hardness of 20 (Pinkysil, Barnes, Australia) was used to encapsulate the coin vibrator and the base of the PVDF based whisker shaft.

Operation Principle

Piezoelectric materials have the property of generating charge/proportional voltage, once force or pressure is applied to them. Polyvinylidene fluoride (PVDF) is widely used in tactile sensing applications due to its piezoelectric nature and characteristics such as flexibility, workability and chemical stability, which are superior when compared to other piezoelectric materials [34].
Consider the whisker having a length L, the Young’s modulus of material along longitudinal axis E and moment of inertia of whisker cross-section I. The deflection of whisker v, upon application of lateral force F to the tip of the whisker, which can be given by [35].
v = F L 3 3 E I .
The coin vibrator vibrates the PVDF whisker shaft, therefore generating a time-varying voltage. As this shaft contacts the surface of any object, the modulation of the shaft changes. This change in modulation contains information regarding the type of surface in contact.

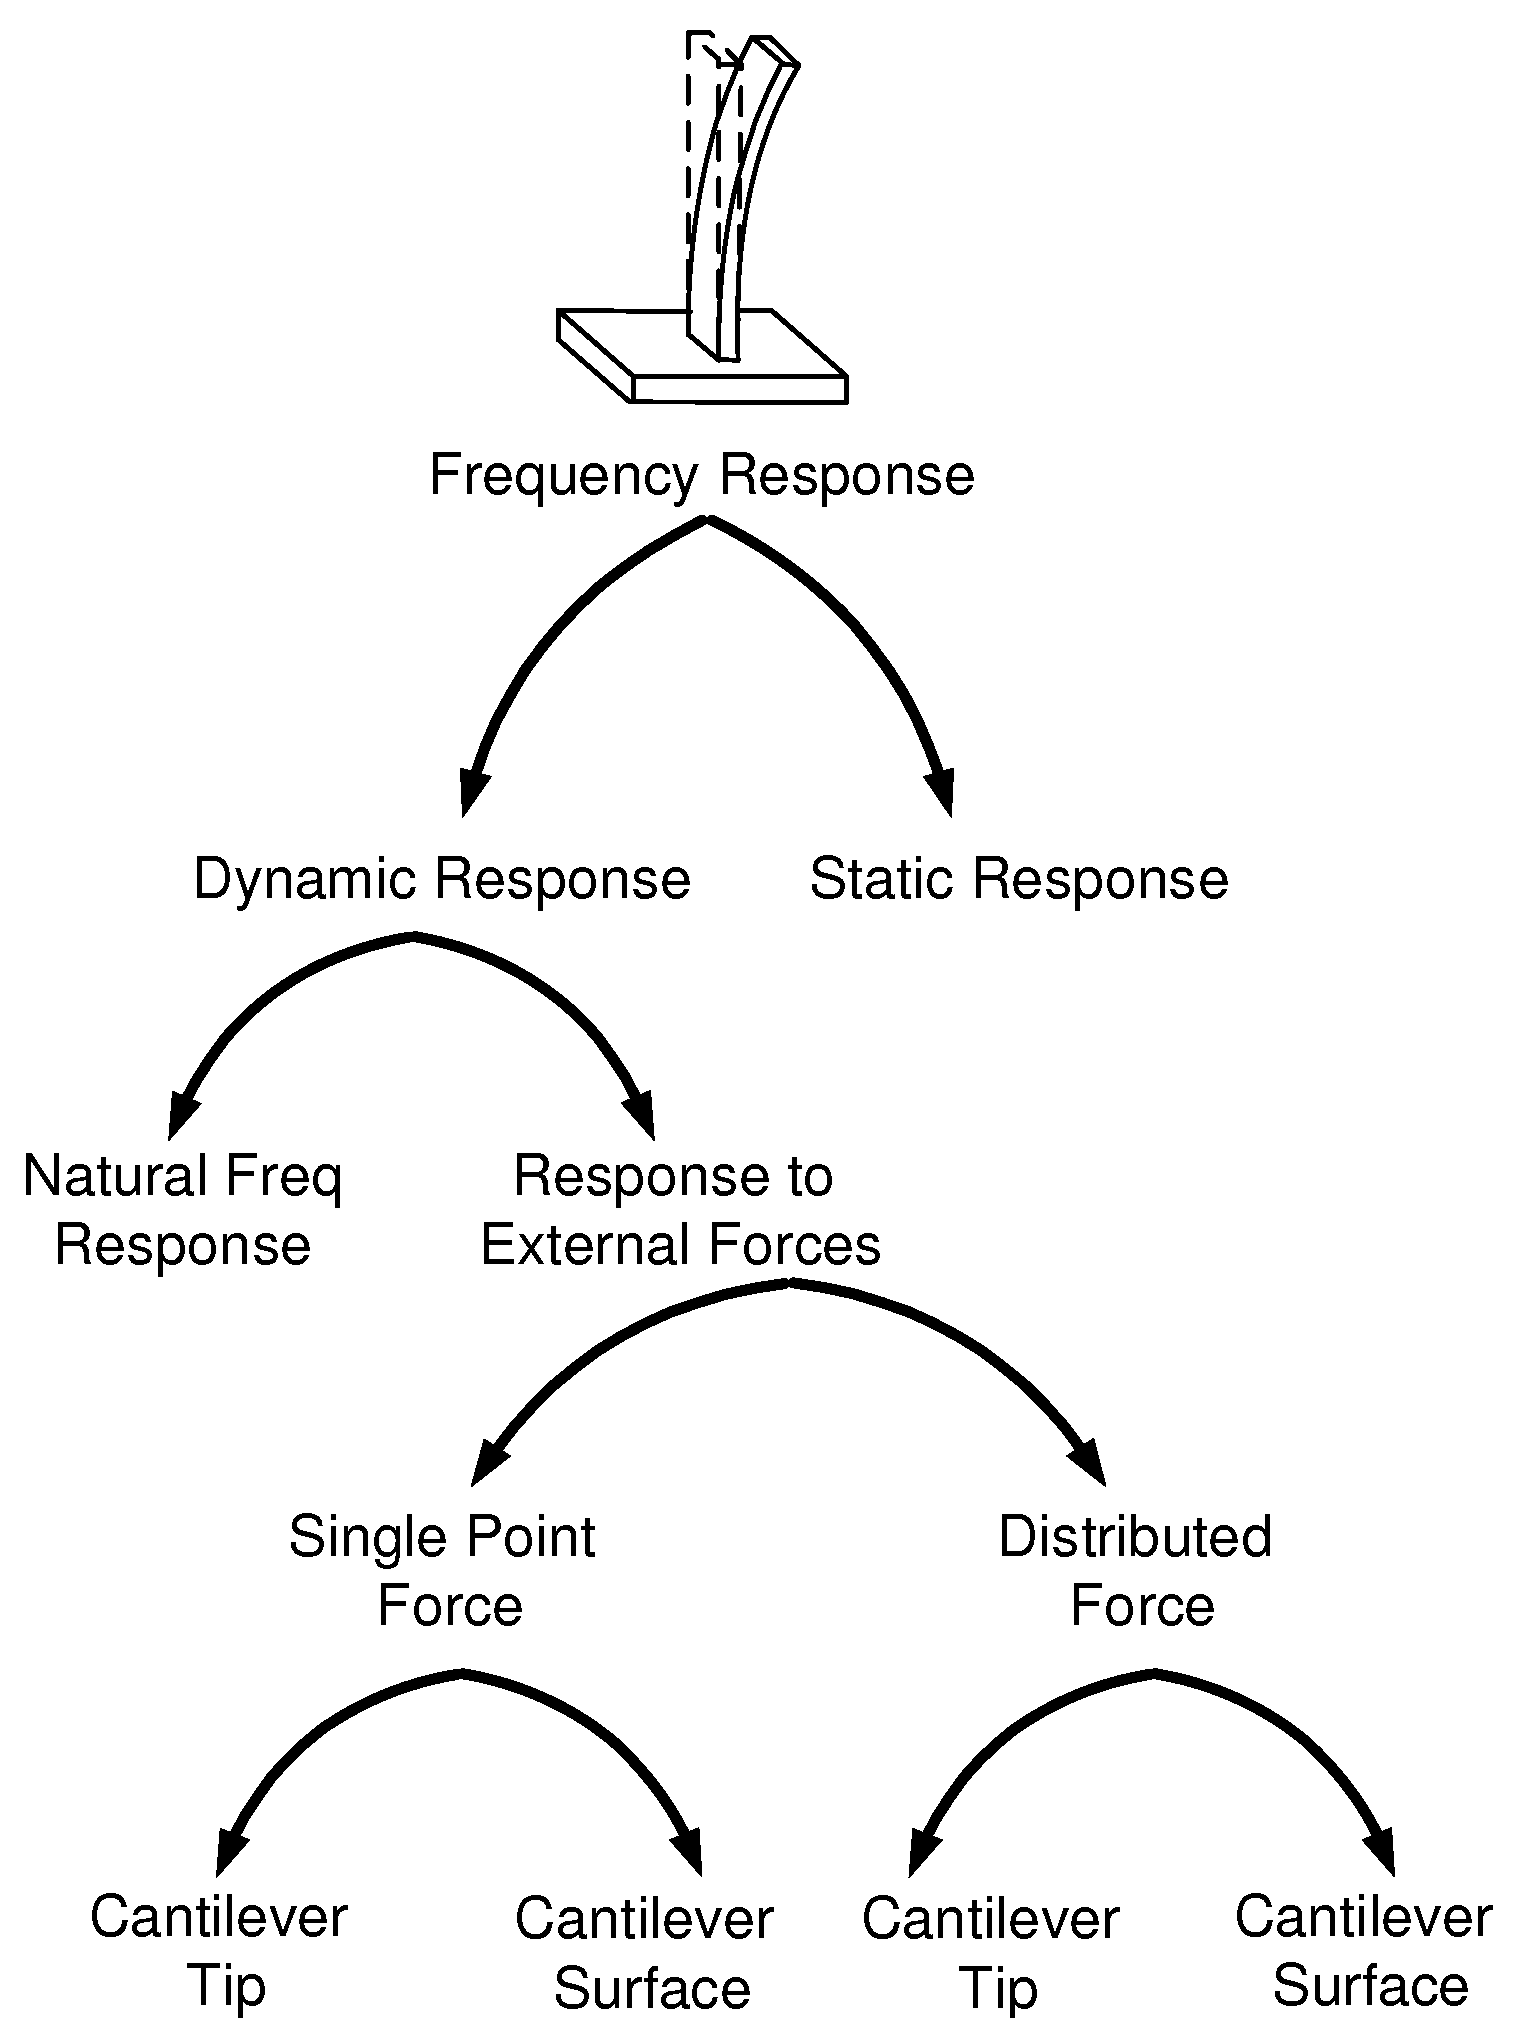
2.2. Sensor Modeling

In the case of sensors having a cantilever as the sensing terminal, it is critical that the cantilever has a high natural frequency due to the following reasons:
  • Systems with low natural frequencies tend to have lower accuracy due to residual vibration after disturbance [36]. A sensor with higher natural frequency will come to its zero state quicker after the disturbance is removed, hence resulting in more accurate sensing.
  • If an external disturbance has a varying force amplitude but with frequency equal to the natural frequency of the sensor’s sensing element, the sensor’s sensing element will vibrate with larger amplitude. This phenomenon is also known as resonance [37].
Although not completely established, several studies suggest that since rodent whiskers vary in length, each whisker is tuned to a different resonant frequency. This gradient of varying resonant frequencies is utilised by the rodent’s brain to establish the texture and roughness of the sensed surface [38,39,40,41]. A study has shown that the fundamental frequency range in rodents varies from 35 Hz for long whiskers to 110 Hz for short whiskers [9].
In order to mimic a biological whisker shaft, it is important to have a model from which the frequency response of the whisker can be analysed. In order to establish such a model, three different approaches have been explored i.e., analytical, transfer function based and a finite element model using COMSOL. The benefits of this multi-pronged analytical approach are:
  • To have the first resonant frequency between 35 Hz and 110 Hz;
  • Damping and loading force effects can be analysed;
  • The results of models should be in agreement and also match experimental data;
  • Effects that whisker shaft length can be determined for any required frequency;
  • Effect of whisker material on frequency response can be analysed.

2.2.1. Analytical Model

In order to mathematically evaluate the frequency response of the sensor, the natural frequency response of the sensing terminal is critical. However, the sensing terminal is cantilever-shaped, hence the eigenfrequency of the structure can be estimated using Euler beam theory. For a non-rotating case, the fundamental frequency is given by
w n = E I ρ A a n 2 L = E 12 ρ , w L 2 a n 2
or
F n = a n 2 2 π E I m L 4 ,
where w o is the angular frequency of the fundamental mode of the beam, m is the mass of whisker shaft, ρ is the density of beam material, A is the cross-sectional area of the beam, w is the width of the beam, and a n = 1.875, 4.694, 7.855, 10.996, 14.137 and 17.278 for the first six natural frequencies.

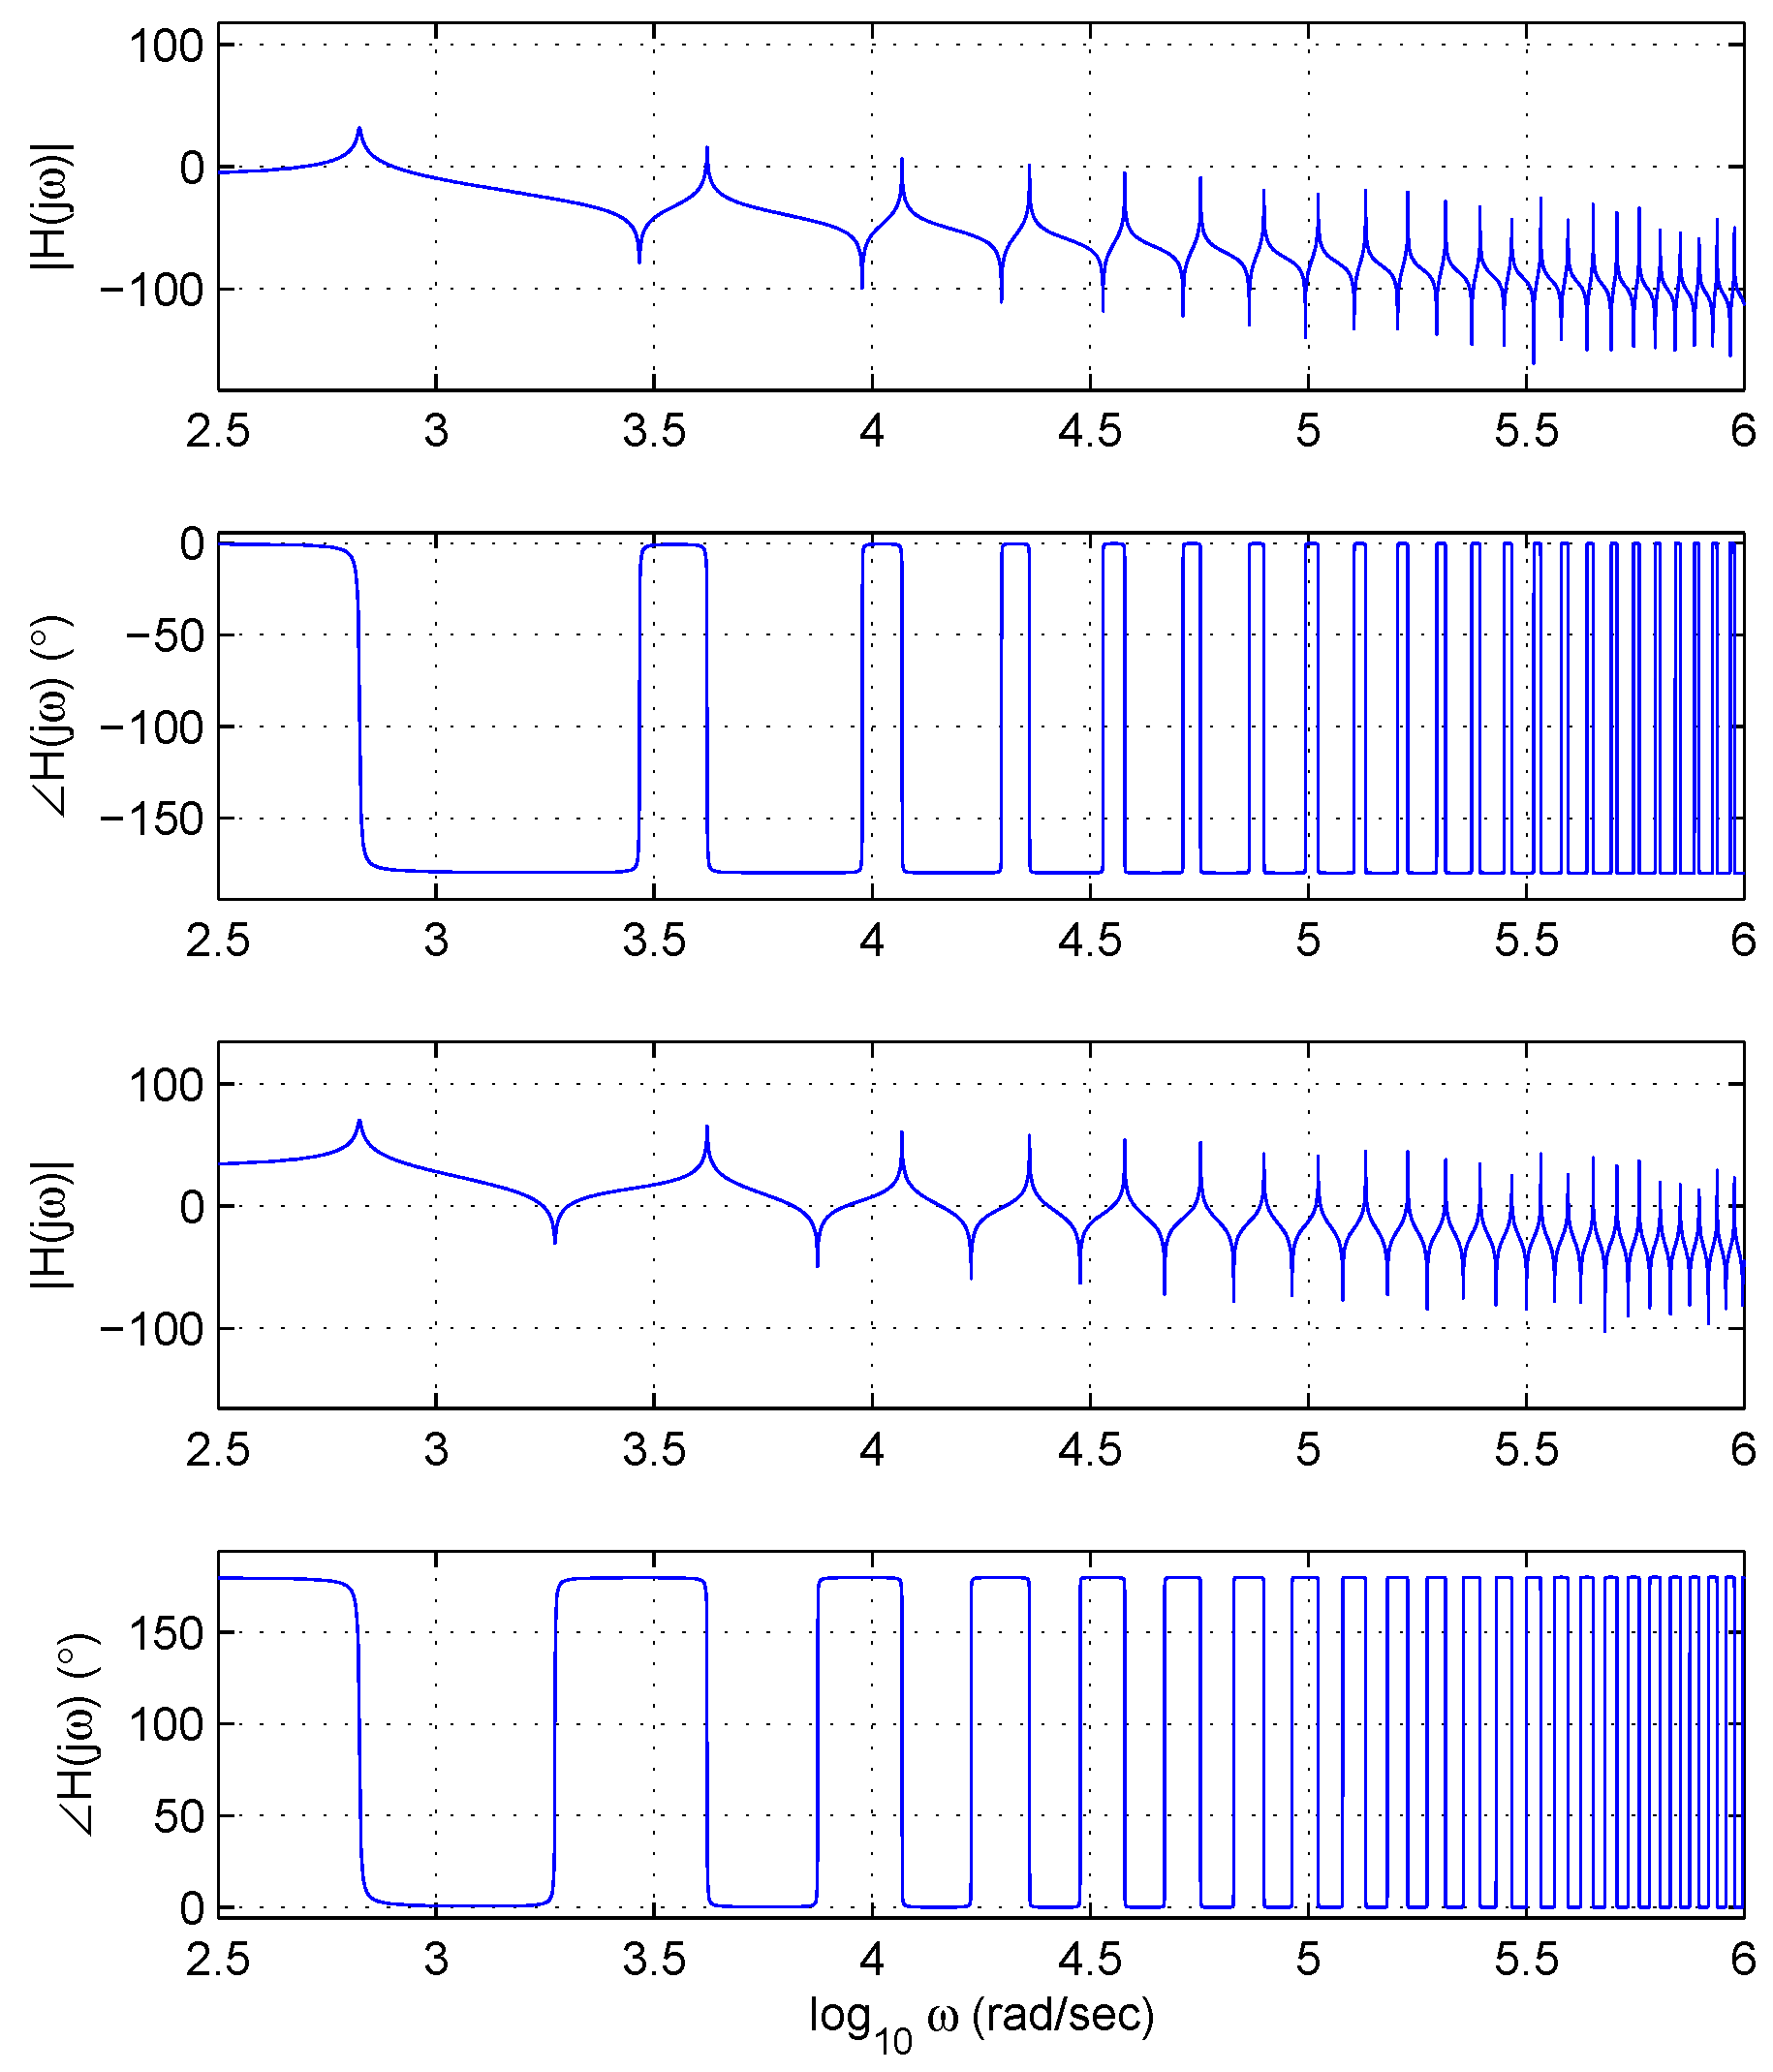
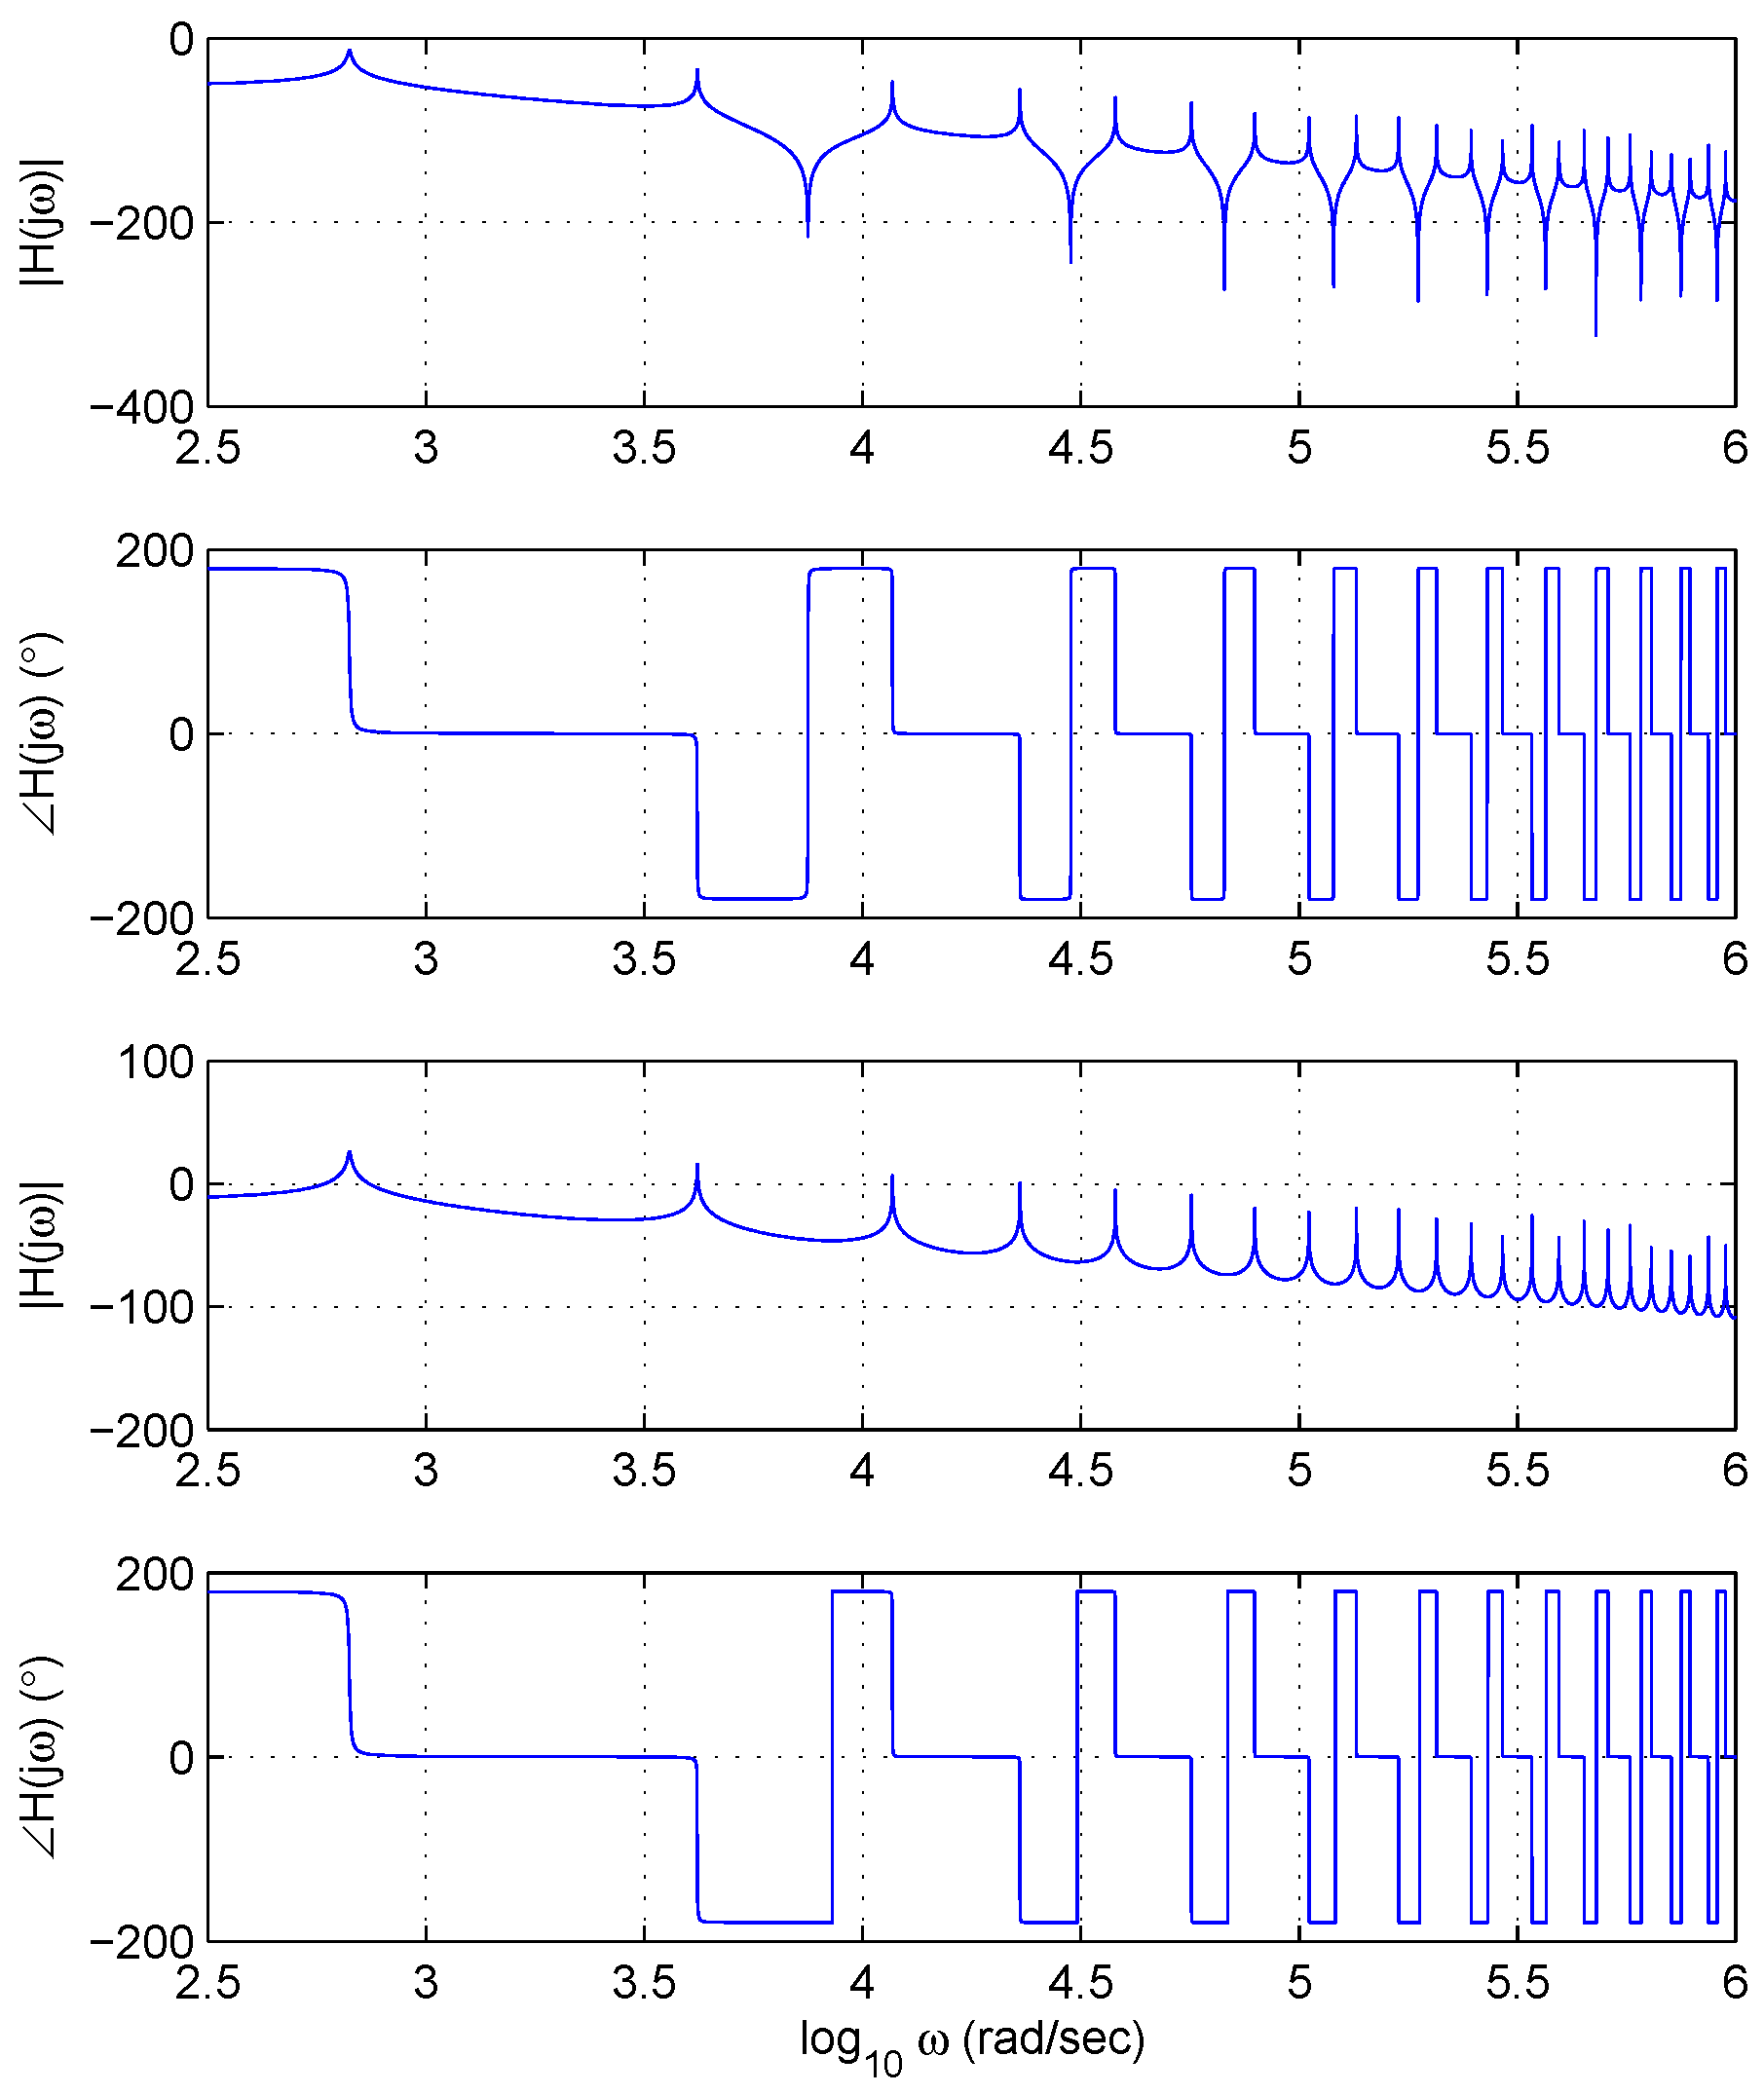
2.2.2. Transfer Function Based Analytical Model
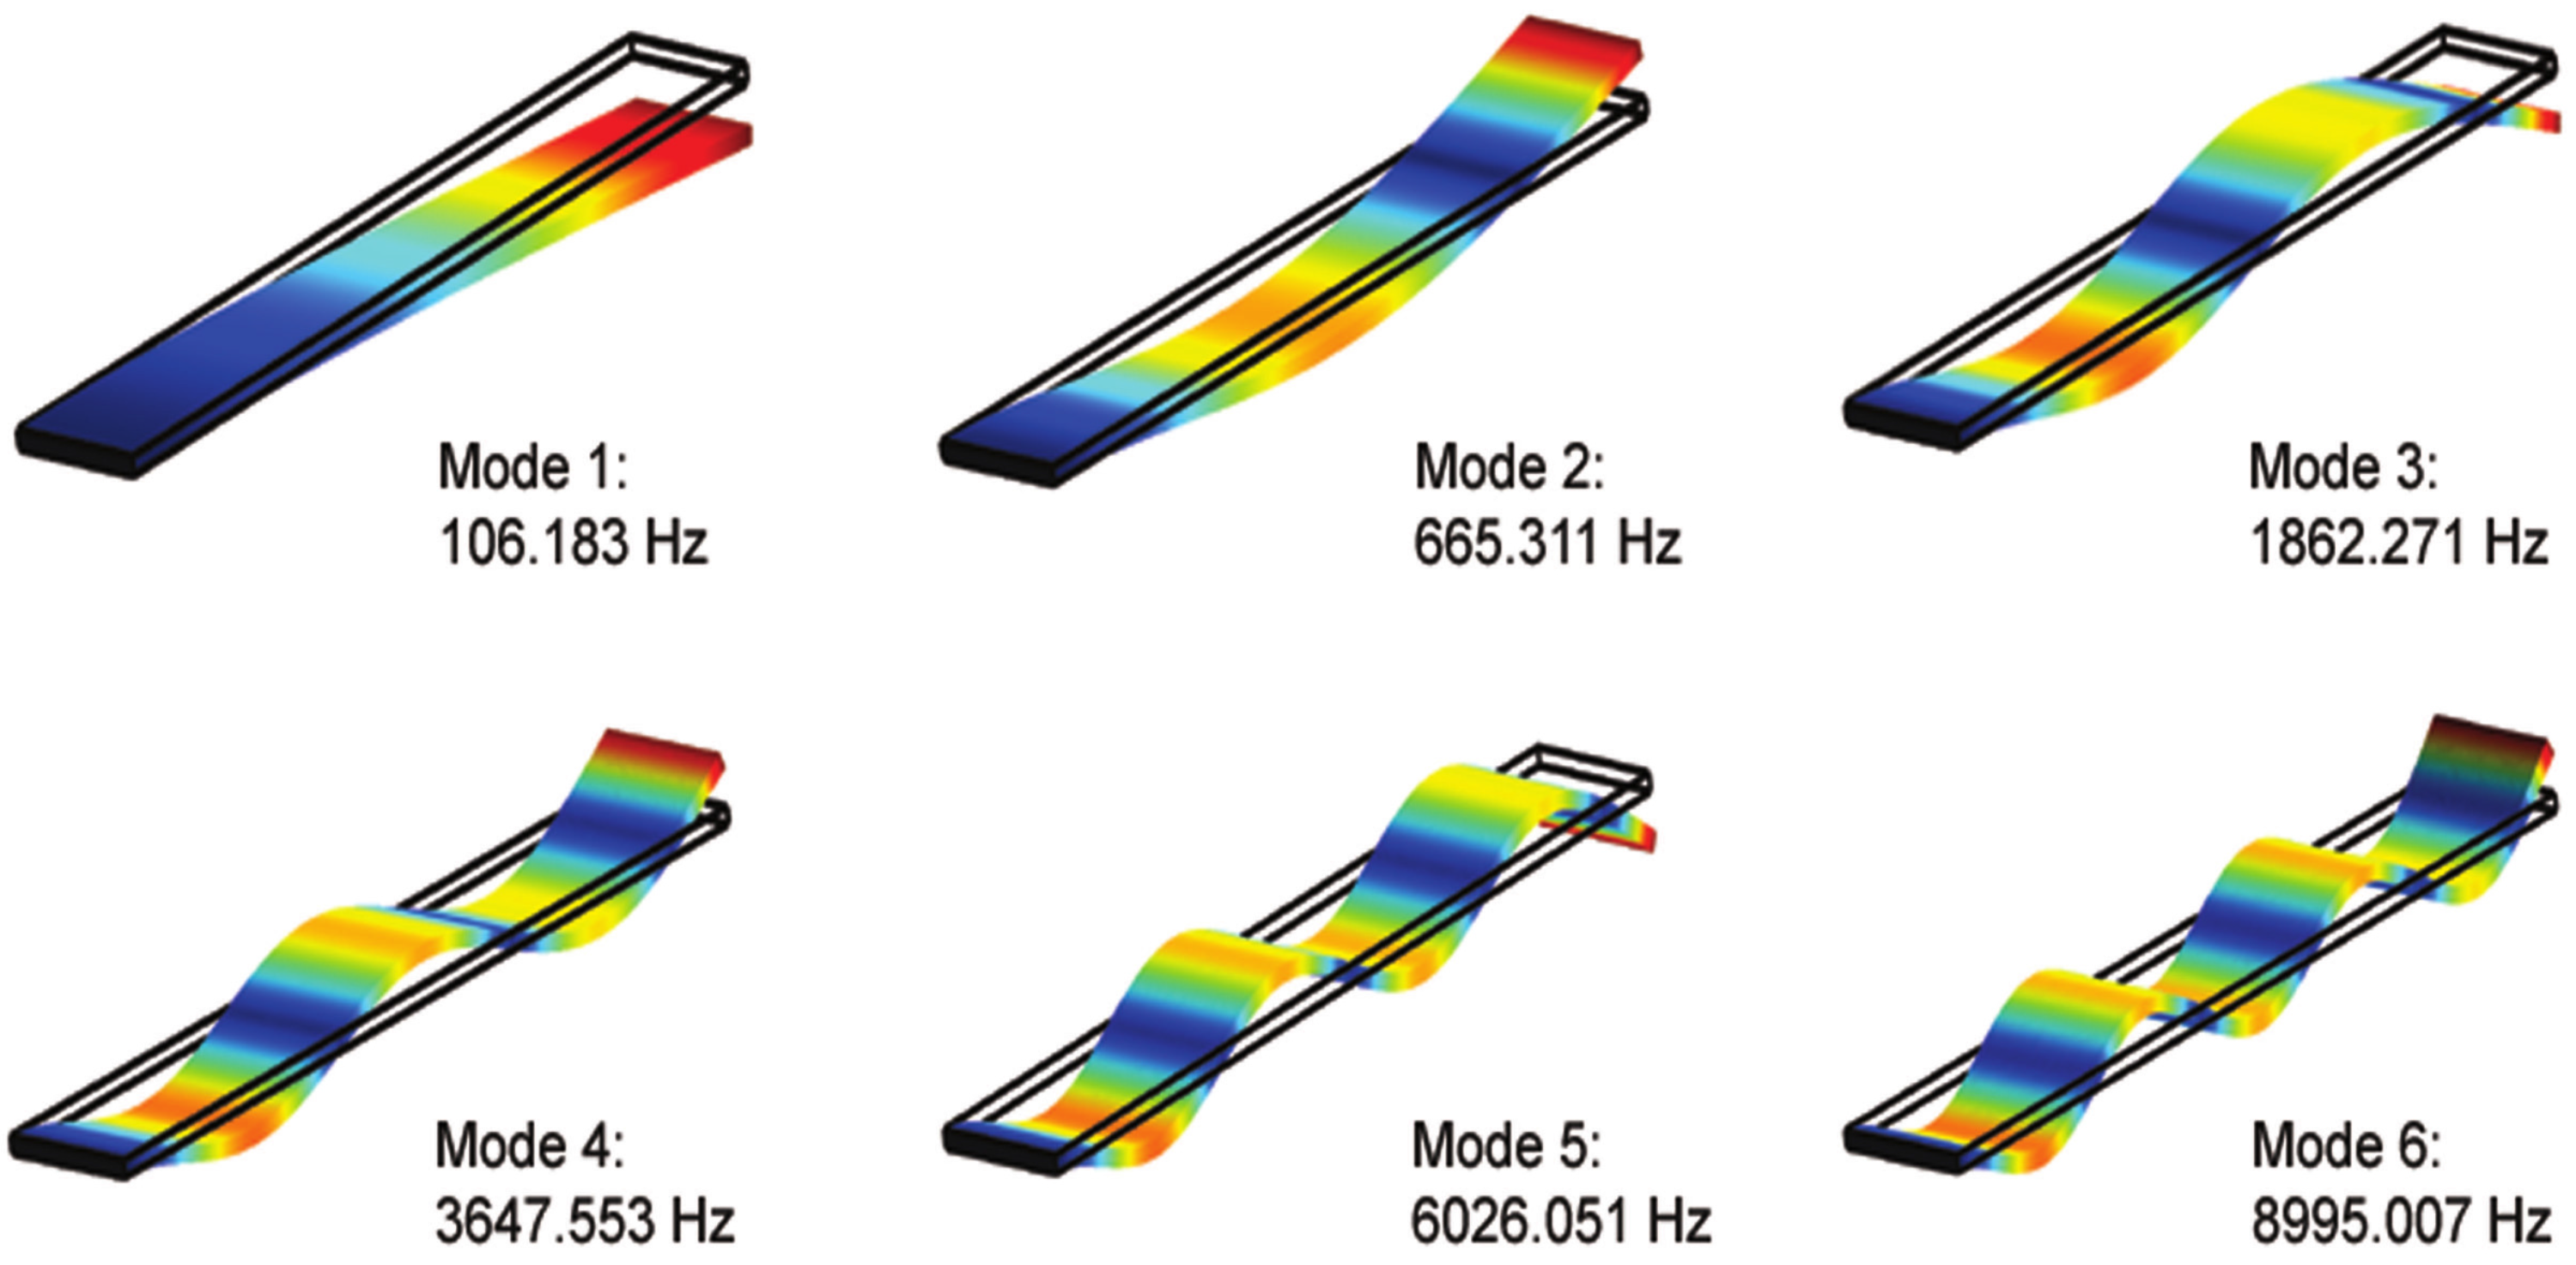
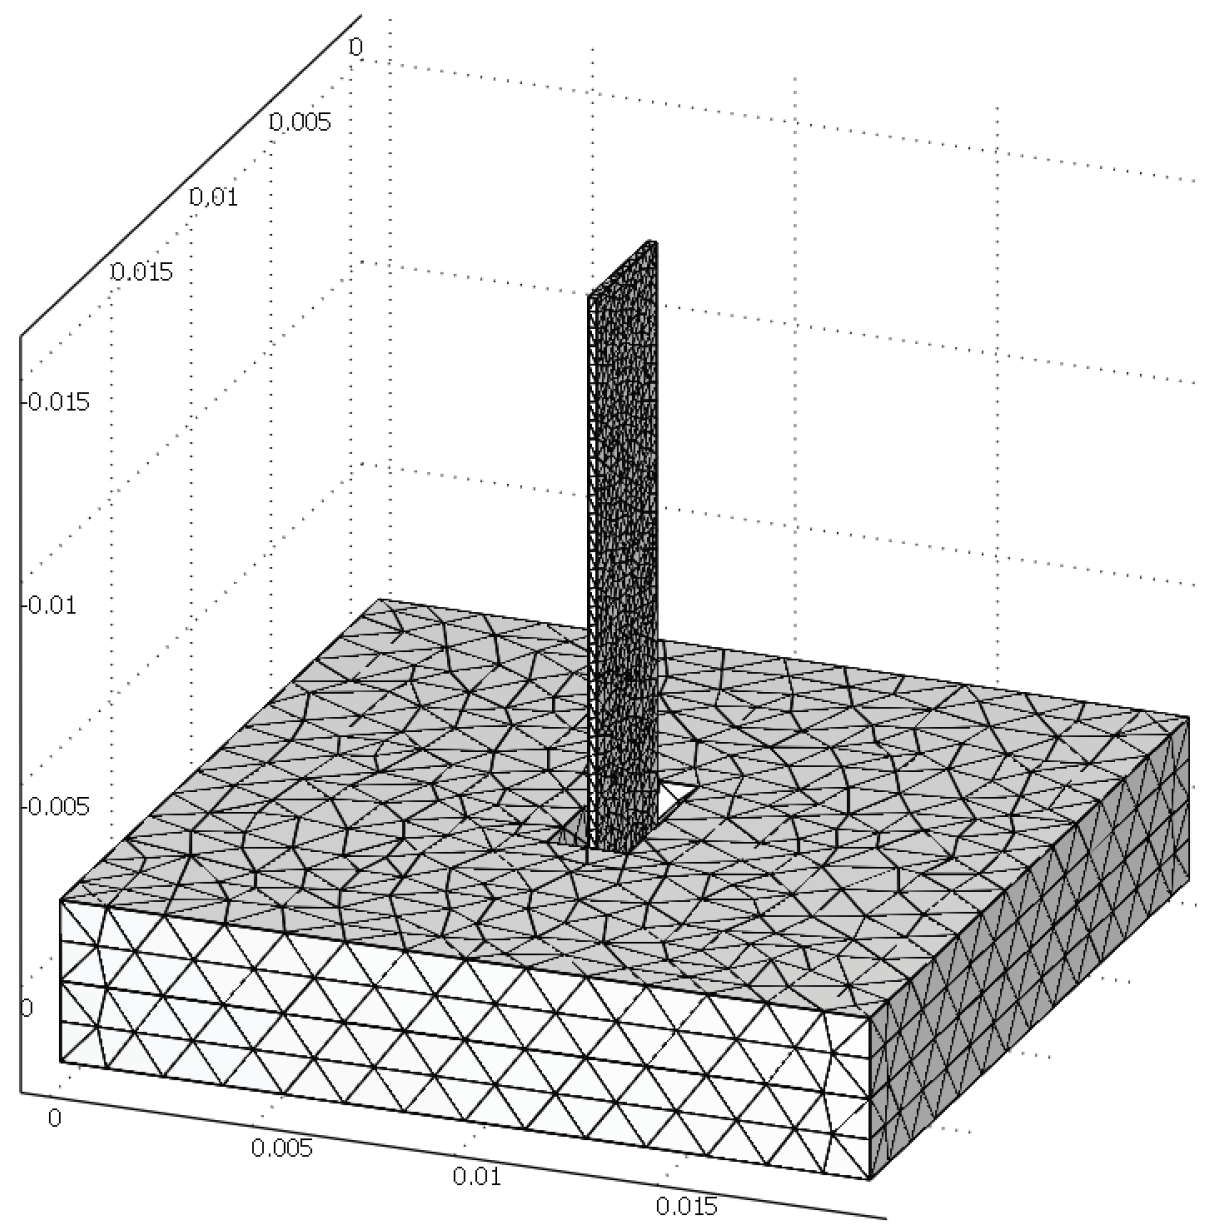
The model shown in Equation (3) is limited because it does not cater for damping effects, type of bond, shear deformation and axial effects. Similarly, we cannot determine if there is any resonance frequency between the desired ranges. These limitations can be overcome by utilising the transfer function of the cantilever based whisker shaft.
While analysing the frequency response of the sensor, it is important to understand the loading of the sensing whisker shaft. The beam can be loaded in four possible ways, as shown in Figure 4.
  • A point force applied at the tip of the whisker. The transfer function for this case can be expressed as [42,43]:
    G 11 ( L , s ) = sinh ( 2 λ L ) sin ( 2 λ L ) E I λ 3 D ( s ) ,
    where
    D ( s ) = 2 [ 2 + cos ( 2 λ L ) + cosh ( 2 λ L ) ] ,
    and
    λ ( s ) = c s + m s 2 4 E I 4 ,
    where c denotes the damping factor and s is the (complex) Laplace variable.
  • Point force applied at the slope of the whisker. The transfer function for this case can be expressed as [42,43]:
    G 12 ( L , s ) = cosh ( 2 λ L ) cos ( 2 λ L ) E I λ 2 D ( s ) .
  • Distributed force applied per unit length to the tip of the whisker. The transfer function for this case can be expressed as [42,43]:
    G 11 ( L , s ) = 1 E I λ 4 [ cosh ( λ L ) cos ( λ L ) ] 2 D ( s ) .
  • Distributed force applied to the slope of the whisker. The transfer function for this case can be expressed as [42,43]:
    G 11 ( L , s ) = 2 cosh ( λ L ) sin ( λ L ) cos ( λ L ) sinh ( λ L ) E I λ 3 D ( s ) .

2.2.3. FEM 3D Model

A more sophisticated model of the system was developed in COMSOL Multiphysics for 3D finite-element analysis. The fundamental eigenfrequency analysis was done using structural mechanics, dynamics and vibration modules. Keeping the analytical results in mind, a parametric analysis was performed to determine the mesh size. A fine mesh was generated with 18,141 degrees of freedom, 1048 mesh points and 2097 tetrahedral elements. The minimum element quality was set to 0.31, as shown in Figure 5. The model was created with a Lagrange-Quadratic element type. The computations employed second-order polynomials, which was a good tradeoff between memory and accuracy of results. Finer meshes did not have a significant effect on the results. The simulation was done to calculate the eigenfrequencies for the first six modes.

3. Results

With the mathematical model and transfer function based analytical model, it is possible to calculate the occurrence of resonances and anti-resonances on the sensory whisker, amid different loading conditions, as shown in Figure 6 and Figure 7.
The results of finite element modeling of the sensory whisker shaft have been verified using mathematical and transfer function based models. A small relative error can be seen in Table 2 because the COMSOL based finite element analysis takes into account factors such as bonding between the sensor shaft and the base, changes in geometry as it bends, damping and temperature, which are not accounted for in the analytical model. The COMSOL model also gives the ability to analyse the shape of the whisker at different modes as shown in Figure 8. Using the model, the natural frequency of the whisker can be chosen anywhere between 35 and 110 Hz, by choosing different materials and physical dimensions. The transfer function based model remains important because the COMSOL model does not give anti-resonances, which are given by transfer function based models as shown in Table 3.
With the control system developed for this sensor, the whisking frequency can be varied as desired and vibratory frequency sweeps can be performed between 5 and 236 Hz with acceptable deviation in output as shown in Figure 9 and Figure 10. The minimum standard deviation in sensor output, in terms of frequency is 0.6494 Hz at 200 Hz, while minimum standard deviation in terms of voltage amplitude of sensor output is 0.0012 V at 200 Hz, as shown in Figure 9. The maximum standard deviation in sensor output between 5 and 236 Hz is 6.4127 Hz at 5 Hz, while maximum standard deviation in terms of voltage amplitude of sensor output is 0.0229 V at 5 Hz, as shown in Figure 10.

4. Discussion

4.1. Advantages

As discussed earlier, unlike the previously reported designs, this design employs a PVDF-based sensing element, which is not only smaller in size, but the whisker itself acts as the sensor. Hence, this makes it much more practical and ergonomic in use. Since the whisker can vibrate like a real biological whisker, we do not need a mechanism to move the whole unit in which this sensor is mounted, which is a major advantage over some of the previously reported designs [5,22,23,24,25].
Previous studies suggest that as rodents whisk, their whiskers move synchronously across the surfaces [44]. With this particular design, since we have a single stimulation unit, a number of whiskers can be stimulated synchronically from the same vibrator. This overcomes issues of developing sophisticated algorithms to synchronise the response of individual whiskers.
In rodents, the length of the shafts change symmetrically across different arcs on the rodent snout [45]. Hence, the longer shafts resonate at lower frequencies while smaller shafts resonate at higher frequencies [46]. The advantage of our analytical, transfer function and FEM 3D model is that the length of individual shafts can be determined based on materials available and desired frequency.
Due to the use of PVDF, the sensor has a high frequency bandwidth—a natural characteristic of PVDF, unlike resistive, capacitive or load cell-based designs [31].
Normally, PVDF-based sensors suffer from inherent drift in their output [31,47,48]. The sinusoidal output of the sensor overcomes this limitation, as we can subtract minimum amplitude peak value from maximum amplitude peak value to remove the drift.
When a load is applied to the end of a beam, the beam is deflected in a curvature, assuming the beam undergoes small deflections within its linearly elastic region, and has uniform cross-section. The mesh size affects the deflection curvature. A small difference in mathematical and simulation results suggests that the material properties and mesh size in the simulation model affect the frequency response of the beam. The analytical and simulation results can be further fine-tuned by variation of mesh size, material properties, temperature and bonding between cantilever and base.
Beyond tactile sensing, this work can be useful in a number of other areas. Applications such as determination of adhesion of cantilever beams [49], determination of characteristics of beam-shaped micro-oscillators [50], monitoring of an atomic force microscope cantilever with a compact disk pickup [51], detection of biological particles in real time possess [52], various cantilever transducers for chemical and biological sensors [53], study of flow fields created by a vibrating cantilever plates [54,55], etc. rely on the study of cantilever shapes. The ability to know resonant and anti-resonant frequencies, as discussed in this paper, might prove useful.

4.2. Limitations

A small standard deviation is observed in the output of the sensor as discussed previously. This might affect the ability of this sensor to discriminate very fine textures. Further testing is required to quantify this limitation.
The sensor employs a single sensing element or whisker shaft. Hence, the sensor needs to be arrayed with different lengths of whisker shafts to better mimic the biological arrangement. Previous studies have also shown that the greater the number of sensing whiskers, the finer texture discrimination that can be done [23,24].

5. Conclusions and Future Work

Various neuropsychological theories as to how rodents discriminate textures are already reported in the literature [38,39,40,41,56,57]. Future work aims to employ the sensor in texture discrimination tasks in light of the said neuropsychological theories. This will give us a better insight into advantages and disadvantages of this particular approach and a comparative analysis of these neuropsychological theories.
Previous research has shown that, as the number of whisker shafts increase, the accuracy of texture discrimination also improves. In fact, according to research conducted by Lottem and Azouz, increasing whisker shafts from two to three led to 80%–90% increase in maximal available classification [8]. Hence, the sensor will be arrayed and its effect quantified.
At this time, the design is not biocompatible. The whisker can be covered in a biocompatible elastomer skin, but this would also change its mechanical properties such as frequency response and resonant frequencies. Future research will aim to overcome these limitations.

Acknowledgments

This research was supported in part by an Australian Research Council Thinking Systems Grant.

Author Contributions

Mohsin Islam Tiwana did the paper reasearch work under the supervision of Nigel Hamilton Lovell and Stephen James Redmond. While Moazzam Islam Tiwana and Javaid Iqbal worked on the writing, formatting and revisions of the paper.

Conflicts of Interest

The authors declare no conflict of interest. The funding sponsors had no role in the design of the study; in the collection, analyses, or interpretation of data; in the writing of the manuscript, and in the decision to publish the results.

References

  1. Assaf, T.; Wilson, E.D.; Anderson, S.; Dean, P.; Porrill, J.; Pearson, M.J. Visual-tactile sensory map calibration of a biomimetic whiskered robot. In Proceedings of the 2016 IEEE International Conference on Robotics and Automation (ICRA), Stockholm, Sweden, 16–21 May 2016; pp. 967–972.
  2. Ahissar, E.; Shinde, N.; Haidarliu, S. Systems neuroscience of touch. In Scholarpedia of Touch; Springer: Berlin, Germany, 2016; pp. 401–405. [Google Scholar]
  3. Gordon, G. Models of tactile perception and development. In Scholarpedia of Touch; Springer: Berlin, Germany, 2016; pp. 797–808. [Google Scholar]
  4. Leyhausen, P. Cat Behavior; Garland: New York, NY, USA, 1979. [Google Scholar]
  5. Gopal, V.; Hartmann, M. Using hardware models to quantify sensory data acquisition across the rat vibrissal array. Bioinspir. Biomim. 2007, 2, S135–S145. [Google Scholar] [CrossRef] [PubMed]
  6. Welker, W. Analysis of sniffing of the albino rat. Behaviour 1964, 22, 223–244. [Google Scholar] [CrossRef]
  7. Tiwana, M.I.; Redmond, S.J.; Lovell, N.H. A review of tactile sensing technologies with applications in biomedical engineering. Sens. Actuators A Phys. 2012, 179, 17–31. [Google Scholar] [CrossRef]
  8. Lottem, E.; Azouz, R. Dynamic translation of surface coarseness into whisker vibrations. J. Neurophysiol. 2008, 100, 2852–2865. [Google Scholar] [CrossRef] [PubMed]
  9. Wolfe, J.; Hill, D.; Pahlavan, S.; Drew, P.; Kleinfeld, D.; Feldman, D. Texture coding in the rat whisker system: Slip-stick versus differential resonance. PLoS Biol. 2008, 6. [Google Scholar] [CrossRef] [PubMed]
  10. Carvell, G.; Simons, D. Biometric analyses of vibrissal tactile discrimination in the rat. J. Neurosci. 1990, 10, 2638–2648. [Google Scholar] [PubMed]
  11. Harvey, A.; Roberto Bermejo, H.; Philip Zeigler, M. Discriminative whisking in the head-fixed rat: Optoelectronic monitoring during tactile detection and discrimination tasks. Somatosens. Mot. Res. 2001, 18, 211–222. [Google Scholar] [PubMed]
  12. Albarracín, A.; Farfán, F.; Felice, C.; Décima, E. Texture discrimination and multi-unit recording in the rat vibrissal nerve. BMC Neurosci. 2006, 7. [Google Scholar] [CrossRef] [PubMed]
  13. Diamond, M.; von Heimendahl, M.; Knutsen, P.; Kleinfeld, D.; Ahissar, E. ‘Where’ and ‘what’ in the whisker sensorimotor system. Nat. Rev. Neurosci. 2008, 9, 601–612. [Google Scholar] [CrossRef] [PubMed]
  14. Durig, F.; Albarracin, A.L.; Farfan, F.D.; Felice, C.J. Design and construction of a photoresistive sensor for monitoring the rat vibrissal displacement. J. Neurosci. Methods 2009, 180, 71–76. [Google Scholar] [CrossRef] [PubMed]
  15. Wineski, L. Facial morphology and vibrissal movement in the golden hamster. J. Morphol. 1985, 183, 199–217. [Google Scholar] [CrossRef] [PubMed]
  16. Semba, K.; Komisaruk, B. Neural substrates of two different rhythmical vibrissal movements in the rat. Neuroscience 1984, 12, 761–774. [Google Scholar] [CrossRef]
  17. Bermejo, R.; Houben, D.; Zeigler, H. Optoelectronic monitoring of individual whisker movements in rats. J. Neurosci. Methods 1998, 83, 89–96. [Google Scholar] [CrossRef]
  18. Berg, R.; Kleinfeld, D. Rhythmic whisking by rat: retraction as well as protraction of the vibrissae is under active muscular control. J. Neurophysiol. 2003, 89, 104–117. [Google Scholar] [CrossRef] [PubMed]
  19. Bermejo, R.; Vyas, A.; Zeigler, H. Topography of rodent whisking–I. Two-dimensional monitoring of whisker movements. Somatosens. Mot. Res. 2002, 19, 341–346. [Google Scholar] [CrossRef] [PubMed]
  20. Sachdev, R.; Sellien, H.; Ebner, F. Temporal organization of multi-whisker contact in rats. Somatosens. Mot. Res. 2001, 18, 91–100. [Google Scholar] [PubMed]
  21. Ebara, S.; Kumamoto, K.; Matsuura, T.; Mazurkiewicz, J.; Rice, F. Similarities and differences in the innervation of mystacial vibrissal follicle-sinus complexes in the rat and cat: a confocal microscopic study. J. Comp. Neurol. 2002, 449, 103–119. [Google Scholar] [CrossRef] [PubMed]
  22. Kim, D.; Moller, R. Biomimetic whiskers for shape recognition. Robot. Auton. Syst. 2007, 55, 229–243. [Google Scholar] [CrossRef]
  23. Fend, M.; Bovet, S.; Yokoi, H.; Pfeifer, R. An active artificial whisker array for texture discrimination. In Proceedings of the IEEE/RSJ International Conference on Intelligent Robots and Systems (IROS 2003), Las Vegas, NV, USA, 27–31 October 2003; Volume 2, pp. 1044–1049.
  24. Fend, M. Whisker-based texture discrimination on a mobile robot. In Advances in Artificial Life; Springer: Berlin, Germany, 2005; pp. 302–311. [Google Scholar]
  25. Lungarella, M.; Hafner, V.; Pfeifer, R.; Yokoi, H. An artificial whisker sensor for robotics. In Proceedings of the IEEE/RSJ International Conference on Intelligent Robots and Systems, Lausanne, Switzerland, 30 September–4 October 2002; Volume 3, pp. 2931–2936.
  26. Yokoi, H.; Fend, M.; Pfeifer, R. Development of a whisker sensor system and simulation of active whisking for agent navigation. In Proceedings of the IEEE/RSJ International Conference on Intelligent Robots and Systems (IROS 2004), Sendai, Japan, 28 September–2 October 2004; Volume 1, pp. 607–612.
  27. Wijaya, J.; Russell, R. Object exploration using whisker sensors. In Proceedings of the Australasian Conference on Robotics and Automation, Auckland, New Zealand, 27–29 November 2002.
  28. Bertetto, A.; Ruggiu, M. Low cost resistive based touch sensor. Mech. Res. Commun. 2003, 30, 101–107. [Google Scholar] [CrossRef]
  29. Schultz, A.; Solomon, J.; Peshkin, M.; Hartmann, M. Multifunctional whisker arrays for distance detection, terrain mapping, and object feature extraction. In Proceedings of the 2005 IEEE International Conference on Robotics and Automation (ICRA 2005), Barcelona, Spain, 18–22 April 2005; pp. 2588–2593.
  30. Muraoka, S. Environmental recognition using artificial active antenna system with quartz resonator force sensor. Measurement 2005, 37, 157–165. [Google Scholar] [CrossRef]
  31. Rossi, D. Artificial tactile sensing and haptic perception. Meas. Sci. Technol. 1991, 2, 1003–1016. [Google Scholar] [CrossRef]
  32. Kepler, R.; Anderson, R. Piezoelectricity and pyroelectricity in polyvinylidene fluoride. J. Appl. Phys. 1978, 49, 4490–4494. [Google Scholar] [CrossRef]
  33. Purvis, C.; Taylor, P. Piezoelectricity and pyroelectricity in polyvinylidene fluoride: Influence of the lattice structure. J. Appl. Phys. 1983, 54, 1021–1028. [Google Scholar] [CrossRef]
  34. Flanagan, J.; Wing, A. Modulation of grip force with load force during point-to-point arm movements. Exp. Brain Res. 1993, 95, 131–143. [Google Scholar] [CrossRef] [PubMed]
  35. Timoshenko, S.; Young, D. Elements of Strength of Materials; Van Nostrand: Princeton, NJ, USA, 1968. [Google Scholar]
  36. Nwokah, O.; Hurmuzlu, Y. The Mechanical Systems Design Handbook: Modeling, Measurement, and Control; CRC Press: Boca Raton, FL, USA, 2001. [Google Scholar]
  37. Beatty, M. Principles of Engineering Mechanics; Springer: Berlin, Germany, 2006. [Google Scholar]
  38. Kleinfeld, D.; Ahissar, E.; Diamond, M. Active sensation: Insights from the rodent vibrissa sensorimotor system. Curr. Opin. Neurobiol. 2006, 16, 435–444. [Google Scholar] [CrossRef] [PubMed]
  39. Mehta, S.; Kleinfeld, D. Frisking the Whiskers: Patterned Sensory Input in the Rat Vibrissa System. Neuron 2004, 41, 181–184. [Google Scholar] [CrossRef]
  40. Moore, C.; Andermann, M. The Vibrissa Resonance Hypothesis; CRC Press: Boca Raton, FL, USA, 2005; pp. 21–60. [Google Scholar]
  41. Andermann, M.; Ritt, J.; Neimark, M.; Moore, C. Neural Correlates of Vibrissa Resonance: Band-Pass and Somatotopic Representation of High-Frequency Stimuli. Neuron 2004, 42, 451–463. [Google Scholar] [CrossRef]
  42. Rubio-Sierra, F.J.; Vázquez, R.; Stark, R.W. Transfer function analysis of the micro cantilever used in atomic force microscopy. IEEE Trans. Nanotechnol. 2006, 5, 692–699. [Google Scholar] [CrossRef]
  43. Vázquez, R.; Javier Rubio-Sierra, F.; Stark, R.W. Multimodal analysis of force spectroscopy based on a transfer function study of micro-cantilevers. Nanotechnology 2007, 18, 185504–185511. [Google Scholar] [CrossRef]
  44. Sachdev, R.; Sato, T.; Ebner, F. Divergent movement of adjacent whiskers. J. Neurophysiol. 2002, 87, 1440–1448. [Google Scholar] [PubMed]
  45. Brecht, M.; Preilowski, B.; Merzenich, M. Functional architecture of the mystacial vibrissae. Behav. Brain Res. 1997, 84, 81–97. [Google Scholar] [CrossRef]
  46. Neimark, M.; Andermann, M.; Hopfield, J.; Moore, C. Vibrissa resonance as a transduction mechanism for tactile encoding. J. Neurosci. 2003, 23, 6499–6509. [Google Scholar] [PubMed]
  47. Barsky, M.; Linder, D.; Claus, R. Robot Gripper Control System Using PVDF Piezoelectric Sensors. U.S. Patent 4,792,715, 20 December 1988. [Google Scholar]
  48. Dahiya, R.S.; Valle, M. Tactile Sensing for Robotic Applications. In Sensors: Focus on Tactile Force and Stress Sensors; Rocha, J.G., Lanceros-Mendez, S., Eds.; InTech Open Access: Vienna, Australia, 2008. [Google Scholar]
  49. De Boer, M.; Michalske, T. Accurate method for determining adhesion of cantilever beams. J. Appl. Phys. 1999, 86, 817. [Google Scholar] [CrossRef]
  50. Hosaka, H.; Itao, K.; Kuroda, S. Damping characteristics of beam-shaped micro-oscillators. Sens. Actuators A Phys. 1995, 49, 87–95. [Google Scholar] [CrossRef]
  51. Quercioli, F.; Tiribilli, B.; Ascoli, C.; Baschieri, P.; Frediani, C. Monitoring of an atomic force microscope cantilever with a compact disk pickup. Rev. Sci. Instrum. 1999, 70, 3620. [Google Scholar] [CrossRef]
  52. Leahy, S.; Lai, Y. A cantilever biosensor exploiting electrokinetic capture to detect Escherichia coli in real time. Sens. Actuators B Chem. 2017, 238, 292–297. [Google Scholar] [CrossRef]
  53. Lavrik, N.; Sepaniak, M.; Datskos, P. Cantilever transducers as a platform for chemical and biological sensors. Rev. Sci. Instrum. 2004, 75, 2229. [Google Scholar] [CrossRef]
  54. DiZinno, N.; Vradis, G. Transient Laminar Cross-Flow over a Rigid Cantilever Plate. In Proceedings of the 54th AIAA Aerospace Sciences Meeting, San Diego, CA, USA, 4–8 January 2016; p. 0330.
  55. Kim, Y.H.; Wereley, S.T.; Chun, C.H. Phase-resolved flow field produced by a vibrating cantilever plate between two endplates. Phys. Fluids 2004, 16, 145–162. [Google Scholar] [CrossRef]
  56. Schwarz, C. The Slip Hypothesis: Tactile Perception and its Neuronal Bases. Trends Neurosci. 2016, 39, 449–462. [Google Scholar] [CrossRef] [PubMed]
  57. Hipp, J.; Arabzadeh, E.; Zorzin, E.; Conradt, J.; Kayser, C.; Diamond, M.; Konig, P. Texture signals in whisker vibrations. J. Neurophysiol. 2006, 95, 1792–1799. [Google Scholar] [CrossRef] [PubMed]
Figure 1. Rodents and vertebrate animals sense the environment by moving or whisking their whiskers rhythmically across nearby surfaces. Whisking excites several hundred primary afferent fibers which innervate mechanoreceptors on each whisker shaft [21]. These signals then reach the brain traveling via sensory nerve afferents [2,8].
Applsci 06 00297 g001
Figure 2. The block diagram of the overall system. The microcontroller adds the ability of controlling the oscillation frequency of the coin vibrator, therefore giving the ability to mimic the natural whiskers.
Applsci 06 00297 g002
Figure 3. (a) the whisker unit without the elastomer skin. The PVDF (Polyvinylidene fluoride) sensing whisker shaft is soldered to the base plate with a very low temperature soldering iron. The coin vibrator is clamped down with the base plate, with one end just touching the whisker shaft; (b) the coin vibrator is covered with elastomer skin which improves the coupling between the vibrator and the whisker shaft; (c) fabricated sensor model1 without elastomer skin; and (d) fabricated sensor model 2 with an elastomer skin.
Applsci 06 00297 g003
Figure 4. The typical considerations while doing frequency response analysis of a cantilever beam-based sensor. The natural frequency of a cantilever beam changes depending on type of loading and boundary conditions.
Applsci 06 00297 g004
Figure 5. Finite element analysis was performed using COMSOL. Mesh was created with 2907 tetrahedral, 2090 boundary triangular elements, 1048 mesh points and 18,141 degrees of freedom. Finer mesh sizes were tested but no notable difference was seen in the results.
Applsci 06 00297 g005
Figure 6. Bode plot of the response of the whisker shaft subjected to a point force applied to the end of the beam. Both the outputs have resonances located at the same frequencies due to the same denominators in the transfer functions. At resonance frequencies, the phase decreases by 180 and is in phase, while at anti-resonance frequencies, the response is 180 out of phase.
Applsci 06 00297 g006
Figure 7. Bode plot of the response of the whisker shaft subjected to a distributed force. The first (top two panels) case has both resonances and anti-resonances, decreasing and increasing the phase response by 180 and 360 , respectively. The second case (bottom two panels) has only resonances. Sharp edges can be seen as phase changes from −180 to 180 .
Applsci 06 00297 g007
Figure 8. Shape of the whisker beam at the first six modes. Finite element analysis was performed using COMSOL. The first mode is at 106.183 Hz, which is within the fundamental frequency range from 35 Hz for long whiskers to 110 Hz for short whiskers [9]. More importantly, it shows the ability to choose any frequency with given materials, type of bonding and dimensions.
Applsci 06 00297 g008
Figure 9. Box plot of measured frequency versus excitation frequency of the fabricated sensor. The minimum standard deviation in sensor output, in terms of frequency is 0.649 Hz at 200 Hz.
Applsci 06 00297 g009
Figure 10. Box plot of voltage amplitude to the excitation frequency of the fabricated sensor. Minimum standard deviation in terms of voltage amplitude of sensor output is 0.0012 V at 200 Hz. Due to the coin-based stimulator, the sensor does not perform as well at lower frequency.
Applsci 06 00297 g010
Table 1. A summary of the previously reported whisker-inspired designs. It can be noted that none of these devices employed Polyvinylidene fluoride (PVDF) as a sensing element and lacked the ability to induce micro-motions in the sensory whiskers. These devices also did not mimic the frequency response of natural whiskers. Both of these limitations have been addressed in this research.
DeviceNo of Whisker ShaftsWhisker MaterialsTransduction PrincipleActuation Principle
Kim and Moller [22]Two sets of whisker arraysSteel beam 0.5 mm diameterHall effect magneticDC (direct current) motor driven
Koala platform
Fend et al. [23]Two arrays with four whisker shafts on eachNatural rat whiskerCapacitance, MicrophoneServo motor
Yokoi, Fend and Pfeifer [26]8 shaftsNatural rat whiskerCapacitance, MicrophoneServo motor
Gopal and Hartman [5]4 shaftsNickel titaniumResistance, strain gaugesDC motor
Wajiha and Russell [27]1 shaftSteel wire, 20 cm length, 1.6 mm diameterResistance, potentiometer basedMobile robot
Bertetto and Ruggiu [28]3 shaftsCopper whiskersResistance, rubber brick doped with graphiteNone
Schultz et al. [29]4 shaftsSet 1: Copper wire
Set 2: Flex sensor
Set 1: Resistive, strain gauge
Set 2: Resistive, flex sensors
5-bar linkage system driven by a motor
Shigenobu Muraoka [30]1 shaftCylindrical stainless steel rod, 6 mm in diameter and 150 mm in lengthFrequency shiftFour pairs of quartz resonators
Table 2. First six modes of vibration calculated using analytical model based on Equation (3) and 3D FEM (Finite Element Model) using the COMSOL package.
ModeAnalytical Model (Hz)FEM 3D (Hz)Relative Error (%)
1st Eigenfrequency106.164106.1830.017
2nd Eigenfrequency665.296665.3110.002
3rd Eigenfrequency1862.8941862.2710.033
4th Eigenfrequency3650.5553647.5530.082
5th Eigenfrequency6034.6156026.0510.141
6th Eigenfrequency9014.6968995.0070.218
Table 3. First six modes of vibration calculated using transfer functions as discussed in Section 2.2.3. Modes are listed in order of their occurrence.
ModeCase 1 (Hz)Case 2 (Hz)Case 3 (Hz)Case 4 (Hz)
1st Eigenfrequency106.125106.125106.125106.125
1st Antiresonance465.393297.728xx
2nd Eigenfrequency664.997664.997664.997664.997
2nd Antiresonance1509.4541190.7481190.748x
3rd Eigenfrequency1861.3161861.3161861.3161861.316
3rd Antiresonance3146.4442684.232xx
4th Eigenfrequency3654.4343654.4343654.4343654.434
4th Antiresonance5380.4684762.3374762.337x
5th Eigenfrequency6036.9856036.9856036.9856036.985
5th Antiresonance8219.0217444.235xx
6th Eigenfrequency9011.9789011.9789011.9789011.978
6th Antiresonance11,636.43910,735.44710,735.447x

