Review

The Application of Cryogenic Laser Physics to the Development of High Average Power Ultra-Short Pulse Lasers

1
Snake Creek Lasers, LLC, 26741 State Route 267, Friendsville, PA 18818, USA
2
Department of Chemistry, Clemson University, Clemson, SC 29634-0973, USA
*
Author to whom correspondence should be addressed.
Appl. Sci. 2016, 6(1), 23; https://doi.org/10.3390/app6010023
Submission received: 21 November 2015 / Revised: 30 December 2015 / Accepted: 5 January 2016 / Published: 20 January 2016
(This article belongs to the Special Issue Diode-Pumped, Ultra-Short Pulse Lasers)

Abstract

:
Ultrafast laser physics continues to advance at a rapid pace, driven primarily by the development of more powerful and sophisticated diode-pumping sources, the development of new laser materials, and new laser and amplification approaches such as optical parametric chirped-pulse amplification. The rapid development of high average power cryogenic laser sources seems likely to play a crucial role in realizing the long-sought goal of powerful ultrafast sources that offer concomitant high peak and average powers. In this paper, we review the optical, thermal, thermo-optic and laser parameters important to cryogenic laser technology, recently achieved laser and laser materials progress, the progression of cryogenic laser technology, discuss the importance of cryogenic laser technology in ultrafast laser science, and what advances are likely to be achieved in the near-future.

1. Introduction and History of Cryogenic Lasers

The history of the development of cryogenic lasers may roughly be divided into two distinct eras, which we refer to as the historical and the modern. The historical era covers the early use of cryogenic technology to effect the demonstration of new solid-state lasers, and was focused on the spectroscopic and lasing properties using flashlamp optical pumping, while in the modern era, the advent of diode optical pumping and the increased understanding of the physical properties of laser crystals has led to a comprehensive approach to the development of cryogenic lasers. The comprehensive approach embraces not just the spectroscopic and lasing properties, but includes all of the physical properties needed to successfully design and demonstrate advanced cryogenic laser devices. Such properties include mechanical, thermal, thermo-optic and optical properties such as the index of refraction as well as the crystal dispersion properties. Other defining features of the modern era are the maturation of open and closed cycle cryogenic cooling methods and the rapid development and availability of powerful diode laser sources for pumping solid-state lasers.
In 1991, the first demonstration of a liquid nitrogen (LN2) cooled diode-pumped Yb:YAG laser was reported by Lacovara et al. [1], and we rather arbitrarily define the year of publication of that paper as the start of the modern era, because it combined cryogenic-cooling with a diode-pumped Yb:YAG laser crystal. Some may argue or imply that the development of cryogenic lasers in the modern era is really nothing new, simply because cryogenically-cooled lasers were first demonstrated in the early years of the development of solid-state lasers and there exist a number of early cryogenic laser patents. Such arguments however ignore the reality that during the historical period all cryogenic lasers were flashlamp-pumped with concomitant large heat generation in the solid-state laser crystal, significantly reducing the effectiveness of cryogenic-cooling. In addition, the modern era has as its goal the demonstration of cryogenic laser technology whose average power scaling is well-understood and is firmly grounded in the detailed measured properties of a number of key laser host physical parameters. The long-sought goal of laser physicists, engineers, and designers to produce near diffraction-limited output lasers while operating at very high average powers and efficiency, and whose output parameters are invariant to average power, is now being realized. It is important to emphasize and acknowledge the countless individual contributors whom have made this goal a reality, spanning both the historical and modern periods of together almost seven decades. It is gratifying that the promise of cryogenic lasers, articulated in an article one decade ago [2] and another 8 years ago [3], is beginning to be realized. Yet it is also exciting to contemplate that we have only just begun to realize the vast potential of cryogenic lasers, and that could not be more true than in the nascent field of cryogenic ultrafast lasers.
This article discusses cryogenic laser technology, with a particular emphasis on the application of that technology to the development of ultrafast lasers. The intersection of cryogenic and ultrafast laser technologies will undoubtedly provide powerful new laser sources capable of producing extraordinary associative peak and average powers in the near future. We refer to these new lasers as HAPP (High Average and Peak Power) lasers.

1.1. The Historical Era

Good reviews of the use of cryogenic-cooling in the development of solid-state lasers have been presented by members of our group [2], the Massachusetts Institute of Technology (MIT) Lincoln Laboratory laser group [3], and by the laser group at Q-Peak [4]. Of particular note are the works of Keyes and Quist [5] whom used a GaAs diode laser to pump a U3+:CaF2 laser (the first diode-pumped laser), wherein both the diode laser and the laser crystal were cryogenically-cooled, the pioneering Ti:Al2O3 work of Moulton [6] which demonstrated increased power output using a liquid nitrogen cooled (at 77 K) crystal, an effect that was attributed to the increased Al2O3 thermal conductivity, and the development of a number of tunable laser materials by Moulton [7,8,9,10]. The pioneering work of Schulz and Henion [11] whom demonstrated 350 W of output power from a liquid-nitrogen cooled Ti:Al2O3 crystal, over 200 times what could be obtained at room temperature, is particularly noteworthy since those researchers were the first to our knowledge to carefully examine the crucial role materials properties such as thermal conductivity, thermal expansion coefficient, and the thermo-optic coefficient (dn/dT) play in substantially reducing thermal aberrations and stresses as temperature is lowered from room temperature to 77 K in sapphire. An evaluation of the data available at the time, summarized in Table I of [11], revealed that the thermal conductivity of Al2O3 increased from 0.33 to 10 W/(cm·K) as temperature was lowered from 300 K to 77 K, a greater than 30 times improvement. The thermo-optic coefficient decreased from 12.8 × 10⁻⁶/K at 300 K to 1.9 × 10⁻⁶/K, a factor of 6.7, while the thermal expansion coefficient decreased from 5 × 10⁻⁶/K at 300 K to 0.34 × 10⁻⁶/K at 77 K, a factor of 14.7. In cooling the Ti:Al2O3 laser to 77 K, the authors were able to demonstrate about a 200 times decrease in the thermo-optical refractive index changes. Other early references of note include the demonstration of a tunable phonon-terminated Ni2+:MgF2 laser by Johnson, Guggenheim, and Thomas [12] at Bell Telephone Laboratories in 1963, and the development of a compact liquid nitrogen cooled system that produced CW emission from Nd3+:YAG laser crystal as well as an ABC-YAG laser crystal [13]. In Europe, an early cryogenic Ho:YAG laser was demonstrated in 1975; an output of 50 W was achieved with liquid nitrogen cooling [14].
In addition to laser demonstrations, cryogenic cooling has previously been used in spectroscopic solid-state laser crystal investigations to help elucidate the physics, energy level structure, and determine energy level assignments, for many rare-earth and transition metal activator ions. The laser crystal books by Kaminskii [15,16] are particularly noteworthy, documenting many of the Stark level structures and energy assignments in use today at room temperature, 77 K, and in some cases down to liquid He temperature at about 4 K. Those publications are very useful resources that include historical spectroscopic and laser investigations from around the world, including many from Russia and former Soviet Republics whose many contributions were not fully acknowledged until after the dissolution of the Soviet Union in 1991.
Early cryogenic laser patents were issued in the United States to Bowness [17] for a liquid nitrogen cooled ruby laser, and to McMahon [18] for a cryogenically-cooled ruby laser. Other early cryogenic work in the United States was performed at Sanders Associates (now BAE Systems, Inc., Arlington, VA, USA), in Nashua, NH.

1.2. The Modern Era

The genesis of our cryogenic laser program was the publication of the Schulz and Henion paper in 1991 [11]. Starting in 1995, we investigated whether or not the favorable laser and thermal effects exhibited by Ti:Al2O3 might not be operative in other laser crystals as well, and in particular for the well-developed laser material Y3Al5O12. After a thorough literature search, we found enough high quality previously published thermal conductivity and thermal expansion coefficient data to begin to at first examine thermal and stress induced changes in undoped YAG, with a view towards understanding the detailed ramifications of lowering the temperature from room temperature to 77 K. That work led to the award and completion of a Phase I Small Business Innovation Research (SBIR) contract in 1997, with the Final Report published in 1998 [19]. Work completed prior to and during that contract led to three publications [20,21,22] during 1997 and 1998 in which the average power scaling behavior and the reduction of thermally-induced aberrations were thoroughly explored and quantified for the first time using a unified theoretical framework. In [20], we were the first group to use a finite element thermal and stress analysis code with continuously variable materials parameters (thermal conductivity, thermal expansion coefficient, and the elastic parameters Young’s modulus and Poisson’s ratio, as a function of temperature), to simulate the expected performance of solid-state YAG amplifiers at 77 K. The continuously variable thermal and elastic parameters were generated by good fits to the data existing at the time. Applying the theory to Nd:YAG and Yb:YAG lasers, we showed that the previous results obtained for Ti:Al2O3 lasers [11] could indeed be emulated using other oxide laser hosts such as YAG, and that very favorable, but non-linear, scaling to very high average powers could be obtained by operating YAG at 77 K. We also showed for the first time that when a continuously varying thermal conductivity is employed in the finite-element simulations, non-quadratic temperature profiles are obtained.
In addition to exploring the scaling properties of cryogenically-cooled YAG lasers, in [20] we also explored how thermally-induced aberrations vary with temperature, and showed that without taking the thermo-optic effect into account, approximately a factor of 10 improvement could take place by operating at 77 K, due to the deduction of the thermal profile by an increased thermal conductivity, and by the near elimination of stress-optic effects. We also lamented the apparent lack of thermo-optic (β = dn/dT) data for YAG and other optical materials as temperature is lowered from 300 to 77 K, but pointed out that the expected trend of β towards zero as temperature is lowered would further increase the reduction in thermo-optic effects in cryogenic lasers. The basic principles of low thermo-optic effects in the host YAG were correctly predicted in this article, confirming our previous conjecture that YAG and other oxide laser host crystals would behave very much like the oxide crystal Ti:Al2O3 demonstrated experimentally previously [11].
The publication of the first accurate YAG thermo-optic coefficients by Fan and Daneu in 1998 [23] enabled us to further extend our results to include β, and in the following papers in 1998 [21,22], we presented the first comprehensive theoretical description of the expected reduced thermal distortion at 77 K in YAG for rod amplifiers, and nonlinear thermal and stress effects in YAG slabs, as well as the scaling behavior. The results presented in [20,21,22] assumed an undoped host YAG thermal conductivity variation with temperature, and did not include a description of the reduction in thermal conductivity in certain materials as the lasing ion dopant density increases. This effect will be further explored later in this article. During 1998 Fan et al. [24] presented the first experimental confirmation, using a 940 nm diode-pumped Yb:YAG crystal, that cooling the Yb:YAG crystal to 77 K resulted in a large reduction in thermo-optic effects, as well as a CW power output of 40 W. Further confirmation of the large reduction in thermal effects, in Nd:YAG, was provided in 2004 by Glur et al. [25].
In 2005 we published an article further confirming the trends discussed in the aforementioned [2]. To provide confirmation that the same general behavior of the thermal conductivity, thermal expansion coefficient, and dn/dT could be expected in other crystals, we showed additional literature data. For the thermal conductivity, we showed data for LiF, MgO, Al2O3, C, YbAG, LuAG, and YAG, all of which displayed significant increases at temperatures were lowered to 77 K and below. As expected, the behavior of the thermal conductivities for undoped crystals is dominated by the specific heat Cv, which theoretically increases as approximately the inverse of the absolute temperature between 300 and 77 K. It is not surprising that fluoride and oxide hosts display the same general trend. For the thermal expansion data, we plotted data for seven different crystals, including the recently published data of the MIT Lincoln Lab group [23,26], all of which could be seen converging towards a value close to zero at low temperatures. For the thermo-optic coefficient dn/dT, we used the MIT data as well as literature data found for both axes of Al2O3, ZnSe, Ge, and Si. In all cases substantial decreases in dn/dT were found as temperature is lowered. These results showed conclusively that the same trends for the thermal conductivity, thermal expansion coefficient, and dn/dT were apparent across a wide sampling of crystals. In addition to examining critical laser materials parameters, our paper also presented for preliminary cryogenic absorption cross-section data for Yb:YAG, measured between 300 and 77 K, and later presented in a more detailed publication [27]. Previously, absorption coefficients for Yb:YAG at 300 and 77 K were presented in [24]. A significant finding of that work was that at 77 K the 940 nm pump band doubled in intensity and narrowed, but remained broad enough for pumping with conventional diode pump sources. For quasi-three-level Yb materials like Yb:YAG that display finite ground-state laser absorption at room temperature, cryogenic-cooling also results in 4-level performance at 77 K, reducing the pump density needed to achieve transparency from a significant value to almost zero. We point out here that the large increase in the stimulated-emission cross-section from a value of about 1.8 × 10⁻²⁰ cm2 at room temperature [1] to 1.1 × 10⁻¹⁹ cm2 at 80 K [3] by approximately a factor of 6 reduces the saturation fluence and intensity by the same factor, thus positively affecting the extraction and overall efficiencies that may be achieved. To achieve good amplifier extraction efficiency the incident amplifier fluence must take a value of at least 2 times the saturation fluence, and for Gaussian beams must be even higher [28]. A much smaller saturation fluence enhances the likelihood of being able to operate below the damage threshold fluence while at the same time achieving efficient extraction efficiency.
Also in 2005, an impressive paper that for the first time measured the detailed thermo-optic properties of a large sampling of laser crystals from 300 to 80 K (Y3Al5O12 (YAG), Lu3Al5O12 (LuAG), YAlO3 (YALO), LiYF4 (YLF), LiLuF4 (LuLF), BaY2F8 (BYF), KGd(WO4)2 (KGW), and KY(WO4)2 (KYW)) was published by the MIT Lincoln Laboratory group [29]. Measurements of the thermal diffusivity, specific heat at constant pressure, thermal conductivity, thermal expansion coefficient, optical path length thermo-optic coefficient, and the thermo-optic coefficient dn/dT were presented. This article also reported measurements of the thermal diffusivity and thermal conductivity for Yb doped samples of Y3Al5O12, YAlO3, and LiYF4 as well, and identified the doping density as an important parameter to consider in the design of cryogenic lasers. Further materials properties measurements by this group have appeared in subsequent publications. In [3], additional thermo-optic measurements are provided for ceramic and single-crystal YAG, GGG, GdVO4, and Y2O3. Spectroscopic data are also presented for Yb:YAG and Yb:YLF. A third publication [30] provides thermo-optic data for the sesquioxide ceramic laser materials Y2O3, Lu2O3, Sc2O3, as well as for YLF, YSO, GSAG, and YVO4.
The modern cryogenic laser period began with the publications of the first experimental cryogenic Yb:YAG laser [1], and a significantly performance-enhanced Ti:Al2O3 laser [11], both in 1991. Subsequent theoretical and experimental work in the years 1995–1998 confirmed that not only can enhanced laser properties be obtained by cryogenic-cooling, but that dramatic reductions in thermo-optic distortion and enhanced mechanical properties can be realized as well. Thermo-optic properties were not emphasized in the historical era, where the focus was mainly on laser physics, kinetics, and spectroscopy. Thus in our opinion, what is new is that that in the modern era, laser physicists, designers, and engineers have for the first time fully appreciated that the entire set of physical crystal properties (optical, laser kinetics, thermal, thermo-optic, and elastic) must be taken into account to effect successful laser outcomes. Appreciation of this reality has and will continue to drive the demonstration of much higher average power lasers, as well as HAPP lasers, in the future. The concurrent work of our group and that at the MIT Lincoln Laboratory has solved the longest standing problem in the development of solid-state lasers: the near-elimination of deleterious thermal effects. This point cannot be emphasized enough. The manipulation of the thermo-optic properties of solid-state laser hosts through the use of cryogenic-cooling has been proven capable of providing both high average power and near-vanishing thermally-induced aberrations. This results in output beams whose divergence and transverse beam size are virtually constant, without the use of any external beam correction. Beam-parameter independent lasers are highly desirable for harmonic generation, as well as for many other scientific, commercial, and military applications.
In addition to the development of other oxide lasers, and in particular the development of Yb based lasers, cryogenic-cooling has advanced the performance of Ti:Al2O3 ultrafast laser technology as well. Unlike Yb materials like Yb:YAG, Yb:LuAG, Yb:Lu2O3, Yb:YLF, and others which all have small quantum defects and thus minimal heat loads, for Ti:Al2O3 lasers, where optical-pumping usually takes place near 532 nm, the quantum defect for lasing near the peak of the gain profile near 790 nm is about 33%, a value > 3–5 times that of typical Yb based materials. The large heat load of Ti:Al2O3 however can be largely be mitigated by cooling the sapphire-based material to 77 K where the thermal conductivity is dramatically larger, and by the substantial reductions in the thermal expansion and thermo-optic coefficients [11]. The first use of a Ti:Al2O3 cryogenically-cooled amplifier was reported in [31]; the second-stage amplifier, pumped with 25 W of 527 nm power from doubled Nd:YLF lasers, was cooled to 125 K, resulting in an increase of the thermal focal length from 0.45 to 5.6 m, by a factor of about 125. This approach has been discussed and used by a number of researchers [32,33,34,35]. The use of cryogenic-cooling in ultrafast lasers will be further discussed later in this article.

2. Review of Cryogenic-Cooling Benefits

In this section we review the many benefits that accrue from the implementation of cryogenic-cooling in solid-state lasers. We begin by first examining in Section A. the origin of thermal aberrations in solid-state lasers, in B. the most important crystal thermal parameters: the thermal conductivity k, followed by the thermal expansion coefficient α, and the thermo-optic coefficient β = dn/dT. In C. we discuss crystal elastic parameters and in D. crystal spectroscopic, kinetic, optical, lasing, nonlinear, and dispersion parameters. We also discuss the motivations for the critical examination of the functional dependence of each parameter on absolute temperature.

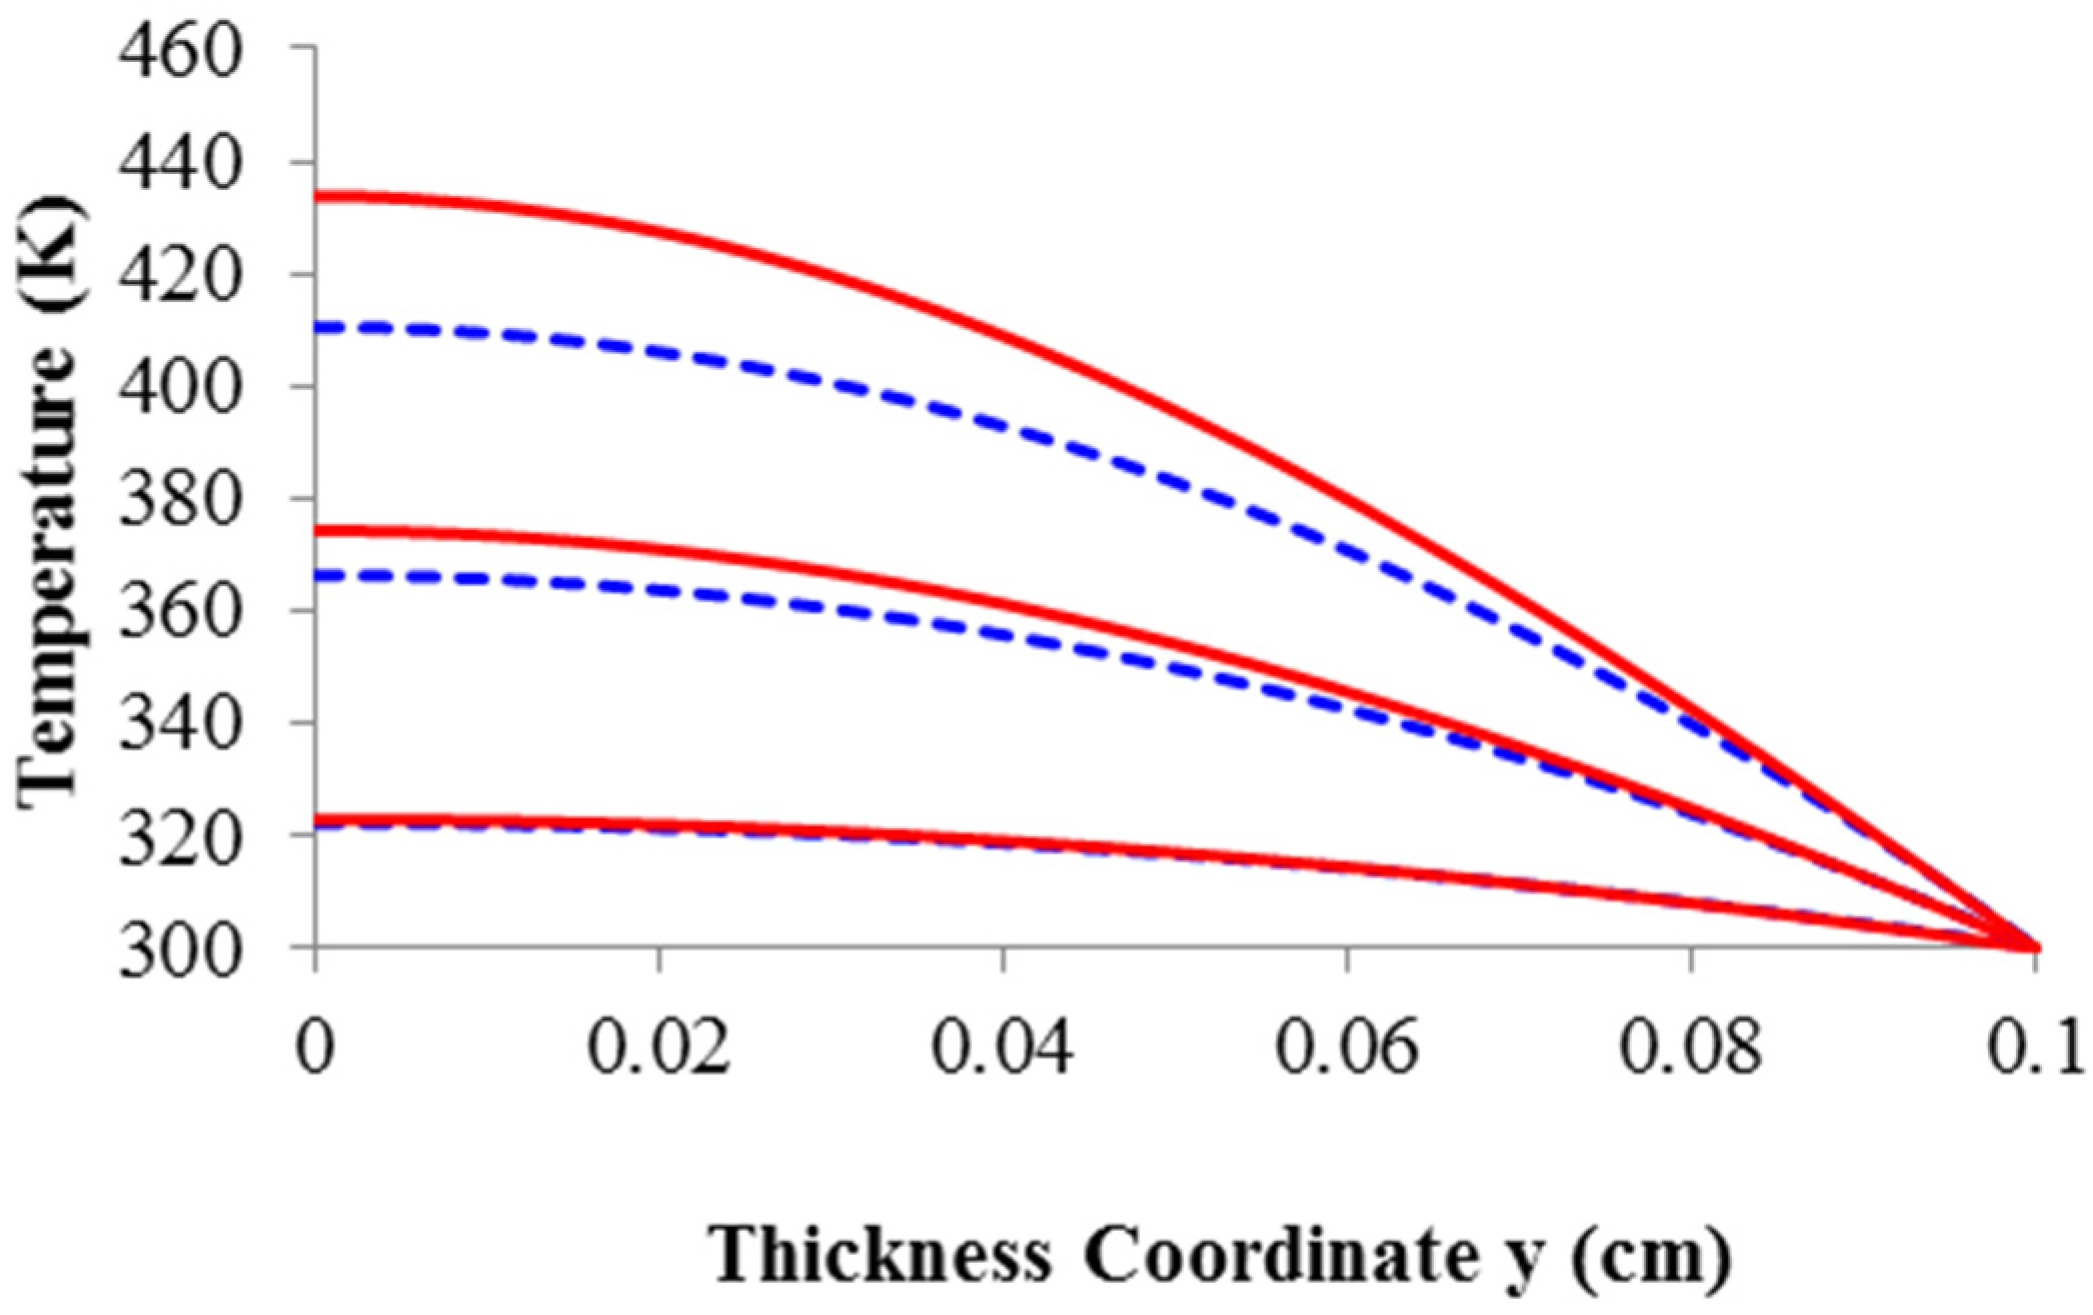
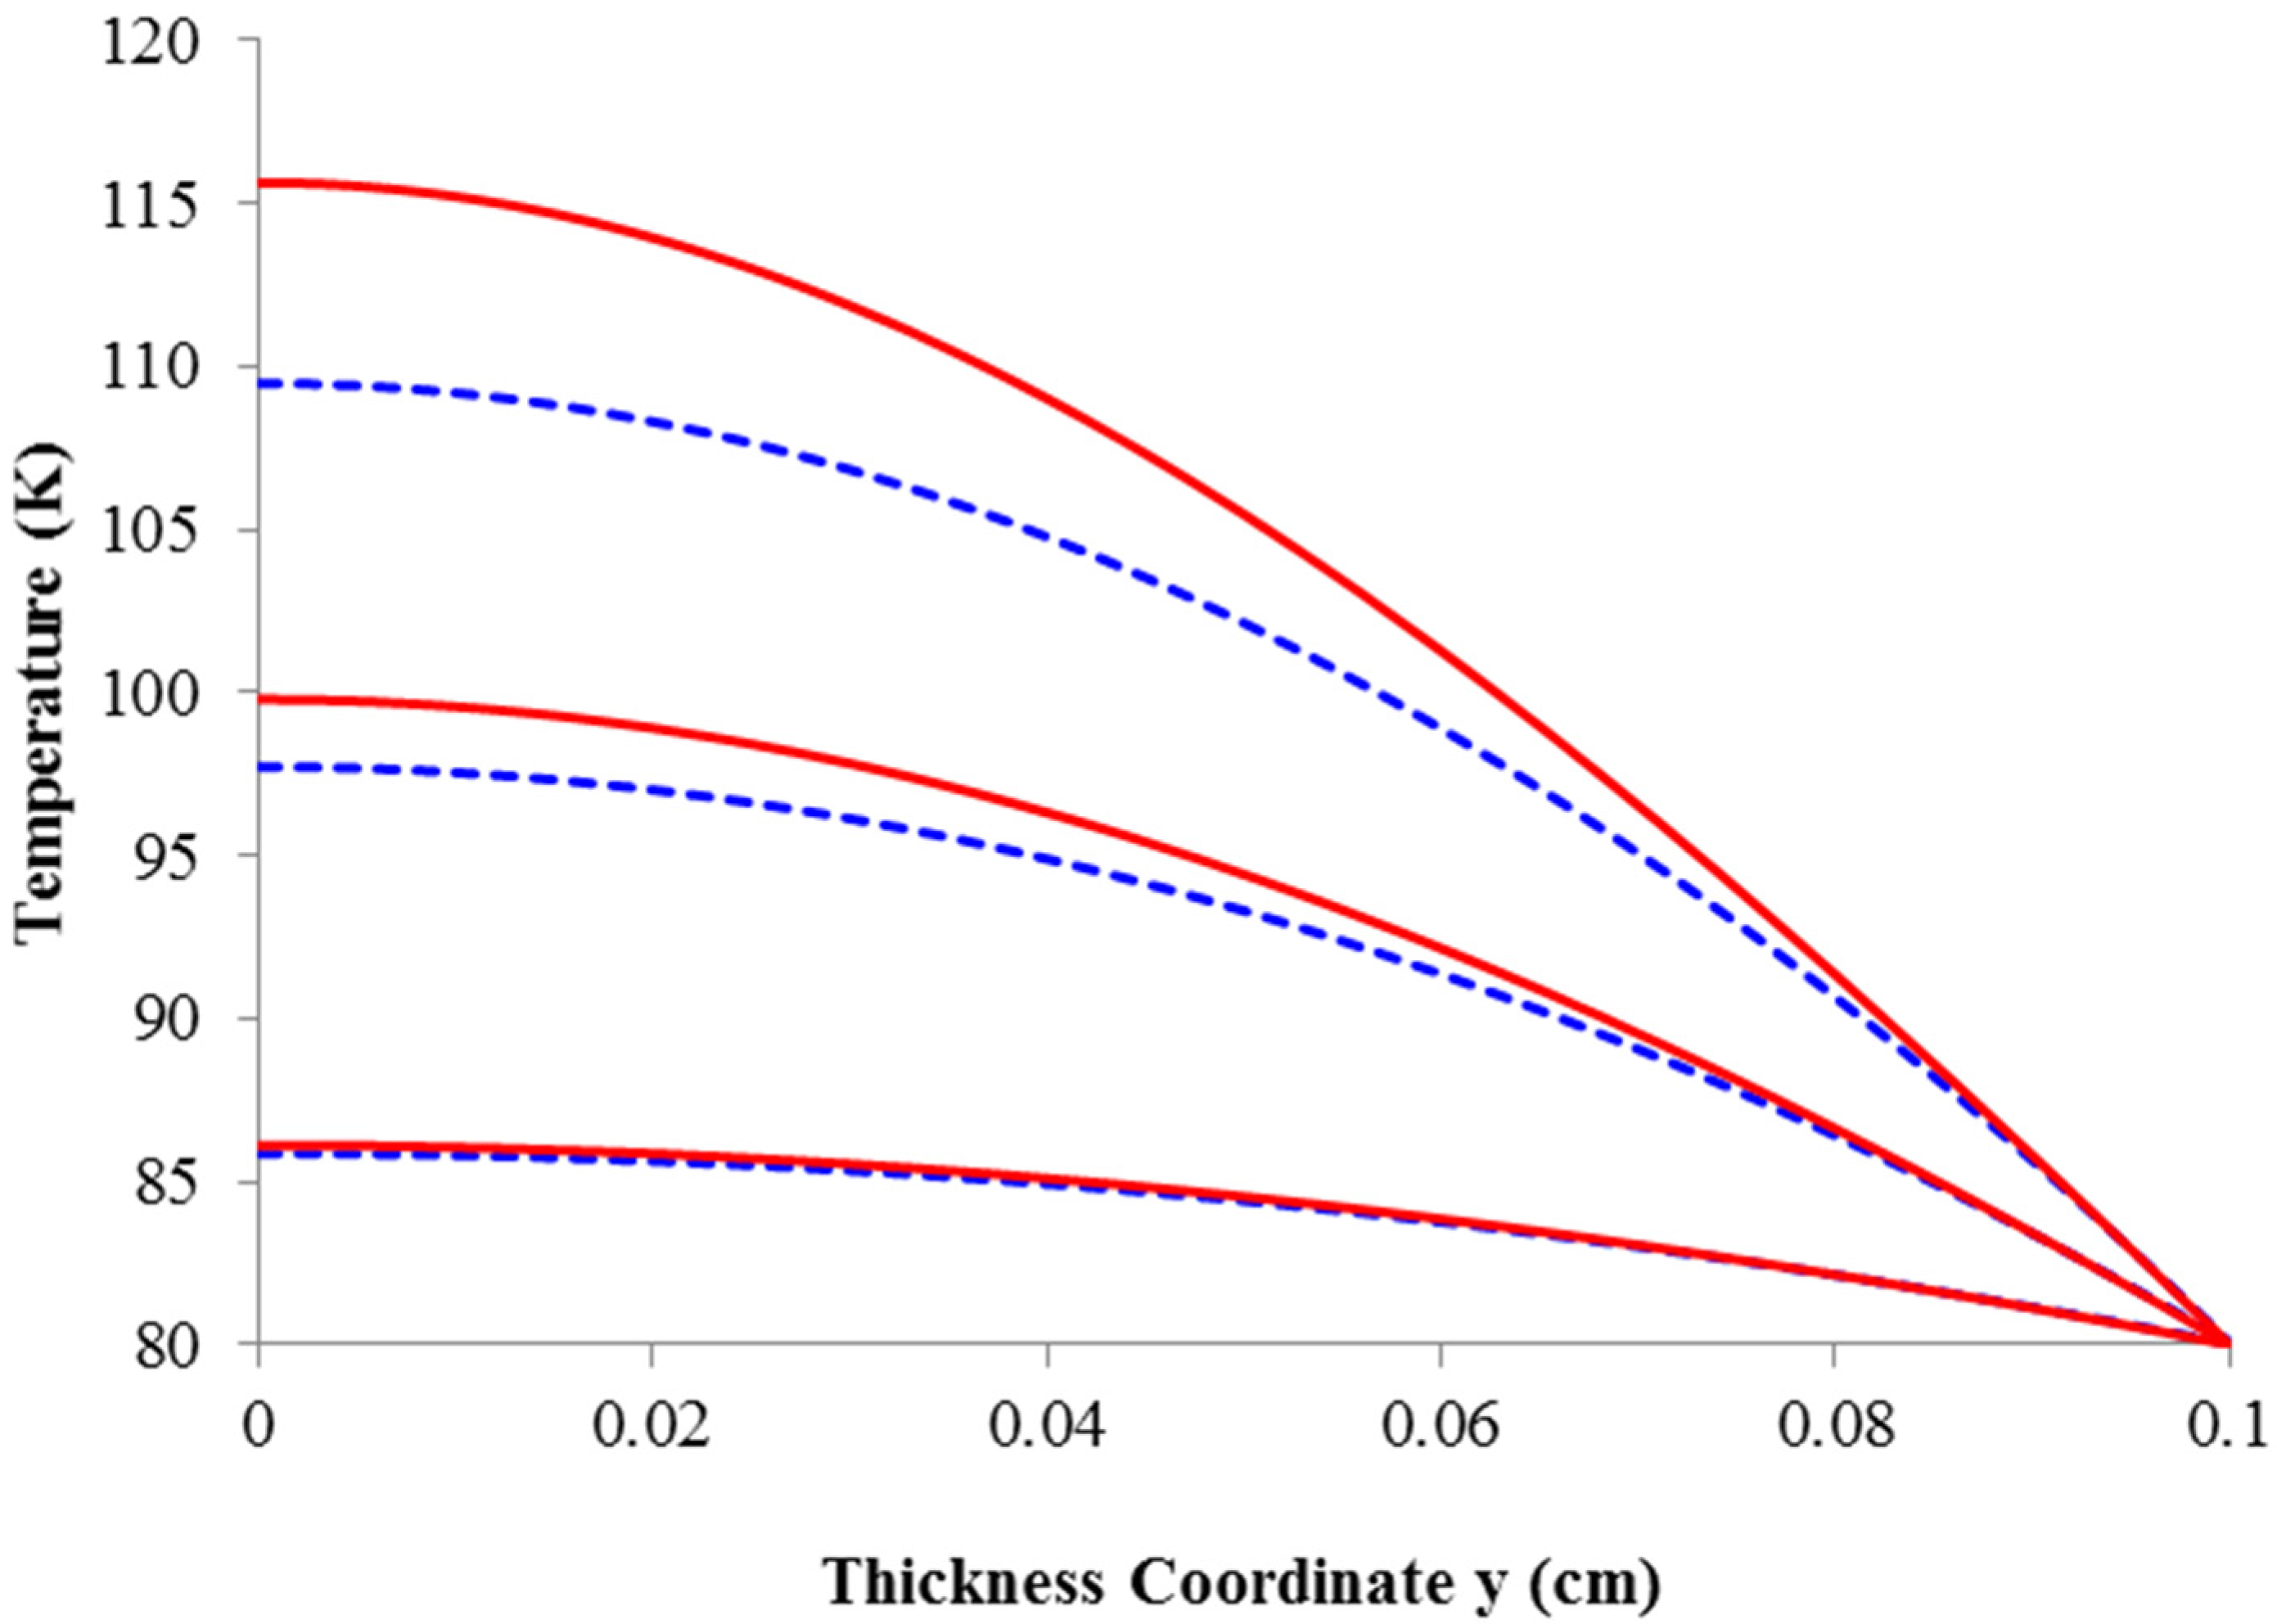
2.1. Thermal Aberrations in Solid-State Lasers

Crystalline solid-state lasers are optically-pumped devices. The first solid-state laser, demonstrated by Maiman [36], was a flashlamp-pumped ruby laser. Xe and Kr flashlamps and other similar sources, still in use today for some applications, were the pump source of choice for many decades of the twentieth century, and beginning in the 1980’s their dominance has been slowly eroded as narrow band diode pump sources of increasing power have become available. Diode laser technology has developed rapidly and today is the pumping source of choice for most applications, with only the specific cost (Monetary Unit/Watt) preventing its adoption in the highest power applications. Typical Xe flashlamps used in inertial confinement fusion (ICF) applications produced output irradiances with black-body temperatures near 9000 K or more, and with spectral outputs spanning the range of 150 to 1700 nm. Due to the finite number of Nd absorption bands and the continuous nature of the black-body radiation, the absorption efficiency was poor, with most of the Xe pump radiation being deposited in the pump chamber housing the lasing element, even for typical Nd:Glass compositions where the absorption bands were significantly wider than say Nd:YAG. For the absorbed light, ratios of inversion to heat density were typically only 1.5, hence for every joule of inversion energy produced, 0.67 joules of heat were generated as well. Nd lasers dominated the development landscape, and Yb based lasers were largely ignored due to their poor absorption efficiency. The low repetition rate of ICF laser systems may largely be attributed to the use of flashlamp pump sources. As of this writing, the conversion from flashlamp-pumping to diode-pumping is well under way and accelerating, and modern diode-pumped lasers, many based upon Yb crystalline materials, produce only about 80 mJ of heat energy per joule absorbed, a decrease when compared to Nd:Glass laser systems of a factor of over 8. The reduction in the amount of heat generated is greater than two orders of magnitude when the poor absorption of Xe flashlamp radiation is taken into account.
Thermal aberrations are produced in laser crystals by the production of heat, primarily from the optical-pumping process, by stimulated-emission, and by fluorescence. In some crystals, upconversion, two-photon absorption, non-unity quantum efficiencies, and other effects may also provide additional heating. The total index change Δ n T in an isotropic (anaxial) laser crystal due to temperature changes may be written as the sum of three terms:
Δ n T = Δ n β + Δ n α + Δ n S
where Δ n β is due to the thermo-optic coefficient β, Δ n α due to the thermal expansion coefficient, and Δ n S is produced by the stresses (or equivalently the strains) in the crystal. For a laser rod whose barrel is maintained at a constant temperature, the proportional optical phases Δ ϕ r , φ in the radial (r) and azimuthal (φ) directions due to thermal heating producing a temperature change ΔT can be written [21]
Δ ϕ r , ϕ = 2 π λ · Δ n r , ϕ L = 2 π λ · Δ n =   ( 2 π λ ) · ( Q 0 4   k ) [ [ β + 4 n 0 3 α · C 0 ] · r 0 2 [ β + 2 n 0 3   α   C r , φ ] · r 2 ] · L
In Equation (2), L is the crystal length, n0 the index of refraction, Q0 the uniform heat density, k the thermal conductivity, r0 the rod radius, and C0, Cr, and Cφ are photoelastic constants. It can be seen that the phase varies quadratically with the radius r. It is also clear that if α = β = 0, the phases Δ φ r , φ would be zero for all r, regardless of the value of Q0. Equation (2) results from the plane-strain approximation in which the aspect ratio of the rod (L/2r0) >> 1. In that approximation, physical changes in the optical pathlength are ignored. In real amplifiers, bulging of the rod faces occurs, an effect that is directly attributable to the thermal expansion coefficient. A similar equation can be derived for the plane stress case ((L/2r0) << 1), typical of active-mirror or thin disk amplifiers:
Δ ϕ r , φ = 2 π λ · Δ n r , ϕ L = 2 π λ · Δ n = ( 2 π λ ) = 2 π λ · Δ n · ( Q 0 4   k ) [ [ β + 4 n 0 3 α · C 0 ] · r 0 2 + [ ( n 0 1 ) α ( ν + 1 ) 2 n 0 3   α   C r , ϕ ] = 2 π λ · Δ n · r 2 ] · L
For the plane-stress case of Equation (3), by inspection again we see that if α = β = 0, the phases Δ ϕ r , φ are again zero.In rare cases, most notably for certain Nd:Glass laser compositions with negative values of β, and when stress-induced index changes can be ignored, one can achieve Δ n T = 0 . We can write Equation (1), ignoring the stress term, as
Δ n T = Δ n β + Δ n α = [ β + ( n 0 1 ) α ] Δ T  
Thus the index variation and resulting phase can be identically zero if
S = ( β + ( n 0 1 ) α ) = 0
This is the condition for athermal operation, and was first employed in connection with the development of Nd laser phosphate glasses for high-peak-power inertial confinement fusion laser systems to reduce thermal distortion [37].
For cryogenic-cooling, we employ a different strategy. While our goal is to achieve Δφ = 0, for most crystals finite values of α, β, ν, and E at 77 K allow us to simply approach that condition. As we will see in the following paragraphs, the most successful strategy to date is to reduce the thermal aberrations to residual levels by exploiting the favorable scaling of critical parameters by reducing the operating temperature to the cryogenic regime, which we define here as <150 K. There are a few crystalline cases in which condition Equation (5) can be approached or satisfied over some temperature range. For Nd:YLF lasers for example, it is well known that one can exploit the negative value of β using the a-axis (σ) transition at 1047 nm. More recent measurements [29] of β for the c and a axes of the uniaxial crystal YLF show that negative values of β for both axes persist even down to 100 K, allowing the condition Equation (5) to be approached across the entire temperature range for both axes, with Sπ = −1.88 × 10⁻⁶/K and Sσ = 1.81 × 10⁻⁶/K at 300 K. At 100 K, one finds that Sπ = −0.31 × 10⁻⁶/K and Sσ = 0.56 × 10⁻⁶/K, so condition Equation (5) is even more closely approached at 100 K. Another rare example is the closely related material LuLF, a uniaxial crystal which also possesses the property that β is negative for the c and a axes [29], however as temperature is lowered both axes become increasingly negative down to about 170 K where β begins to increase, the opposite of YLF in which β increases as temperature is lowered. Calculations show that at a temperature near 250 K, Equation (5) can be satisfied identically. As we will see in the data we examine later in this article, for most crystals parameters k, β, and α scale favorably as temperature is lowered such that thermal aberrations nearly vanish.
For the case where the prime motivation is to eliminate or reduce aberrations to residual levels, we can define two figures-of-merit Γ as follows:
Γ T = k α   β   η h T
Γ S = k ( 1 ν ) α   E   η h T
Figure of merit Γ T addresses changes in the index of refraction due to temperature gradients, and Γ S the change in the index due to stress (or strain) effects. To reduce thermal aberrations, we wish to maximize the value of Γ T . This is achieved by maximizing the value of k to minimize the thermal gradients, minimizing the values of α and β, and by minimizing the amount of heat generated by minimizing the value of the total heat fraction η h T . The heat fraction is formally defined as the fraction of the absorbed light converted to heat. It includes contributions from the quantum defect, fluorescence, and stimulated-emission. Yb based materials are particularly attractive for producing low η h T values, due to the lack of concentration-quenching, excited-state absorption, and upconversion, processes that plague other laser materials like Nd:YAG or Nd:YVO4, and Nd:YLF for example. For Yb based laser materials such as Yb:YAG, we have published a detailed kinetics model [38] that allows the simple calculation of η h T . The model recognizes two distinct heating mechanisms, the first due to Boltzmann heating (or cooling), and the second due to the photon related processes of fluorescence and stimulated-emission. In general, the heat fraction for Yb:YAG is defined by the equation
η h T = Q h B + Q h P Q A = A + B η e x + C ( 1 η e x )
where Q A   is the total absorbed power density, Q h B the Boltzmann heat density, and Q h P the photon heat density. The quantities A, B, and C are constants and η e x is the laser extraction efficiency. The constants A, B, and C are associated with Boltzmann heating or cooling, stimulated-emission, and fluorescence respectively. For complete laser extraction only the first and second terms contribute, since the fluorescence is zero, whereas for no laser extraction the first and third terms contribute. In most cases the extraction efficiency is between those two limits, and Equation (8) allows the simple calculation of the total heat load when both stimulated-emission and fluorescence are operative.
Equation (7) is the figure of merit for considering stress effects only. It arises naturally from the consideration of the stresses generated in laser crystals due to thermal gradients. For a rod amplifier, using the plane-strain approximation [21], the stresses can be calculated from the well-known equations
σ r r = Q 0 16 M s ( r 2 r 0 2 )
σ φ φ = Q 0 16 M s ( 3 r 2 r 0 2 )
σ z z = Q 0 8 M s ( 2 r 2 r 0 2 )
and for a slab amplifier in the plane-strain approximation, from [22]
σ x x = σ z z = Q 0 2 M s ( 2 y 2 t 2 12 )
Equations (9)–(12) show that the obtained stress is proportional to the heat density and inversely proportional to M s , a quantity known as the materials parameter, and expressed as
M s = k ( 1 ν ) α E
The materials parameter is then a mixture of thermal and elastic constants. To reduce the stress one wants to maximize the value of M s , and that is the motivation for the use of the figure of merit Γ S . To minimize stress contributions to the change in the index of refraction, the appropriate strategy is to maximize k, minimize α, E, and η h T , and minimize the value of ν. While other similar figures of merit have been used [3], we prefer our approach where the contributing factors to the change in index of refraction from purely thermal effects and thermally-induced stress are clearly separated. If desired, however, after eliminating duplicate parameters (k and α in Equations (6) and (7)) we can write a simple overall multiplicative figure-of-merit Γ as
Γ = Γ T · Γ S k ( 1 ν ) α   E β η h = M S β · η h
Laser materials with the highest figure of merit therefore should have a large value for M S , and minimum values for β and η h .

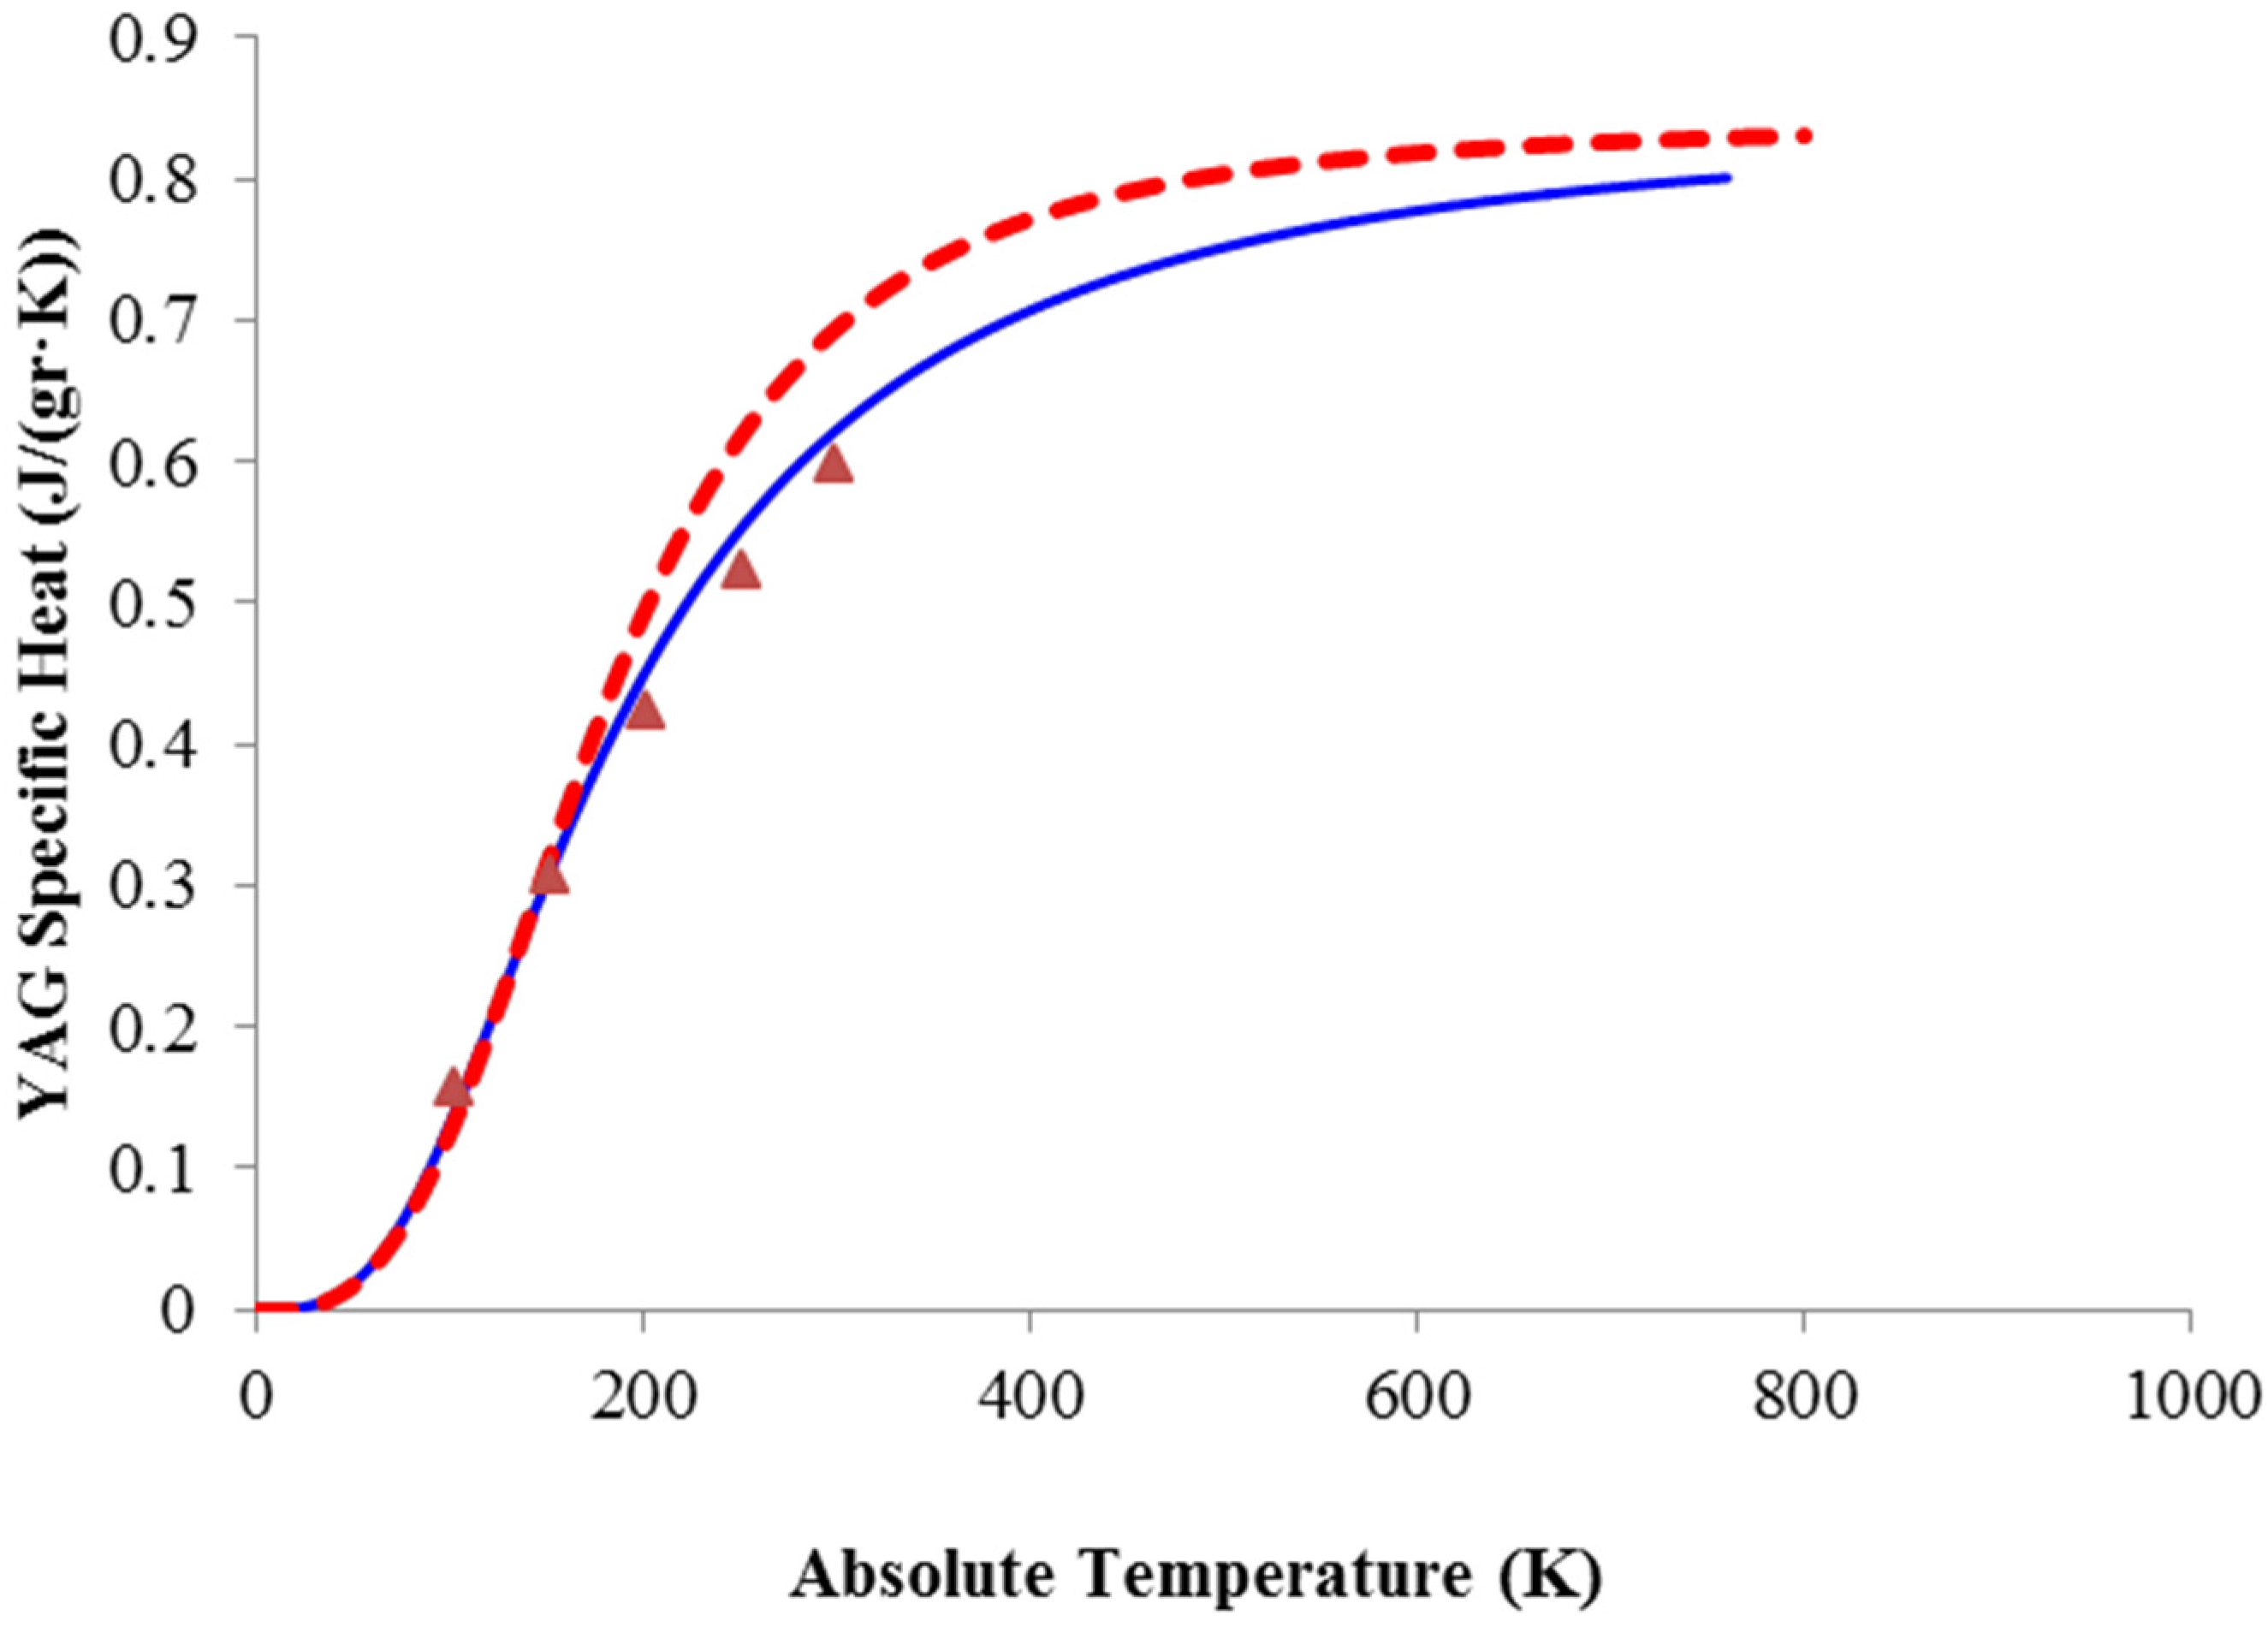
2.2. Thermal Parameters

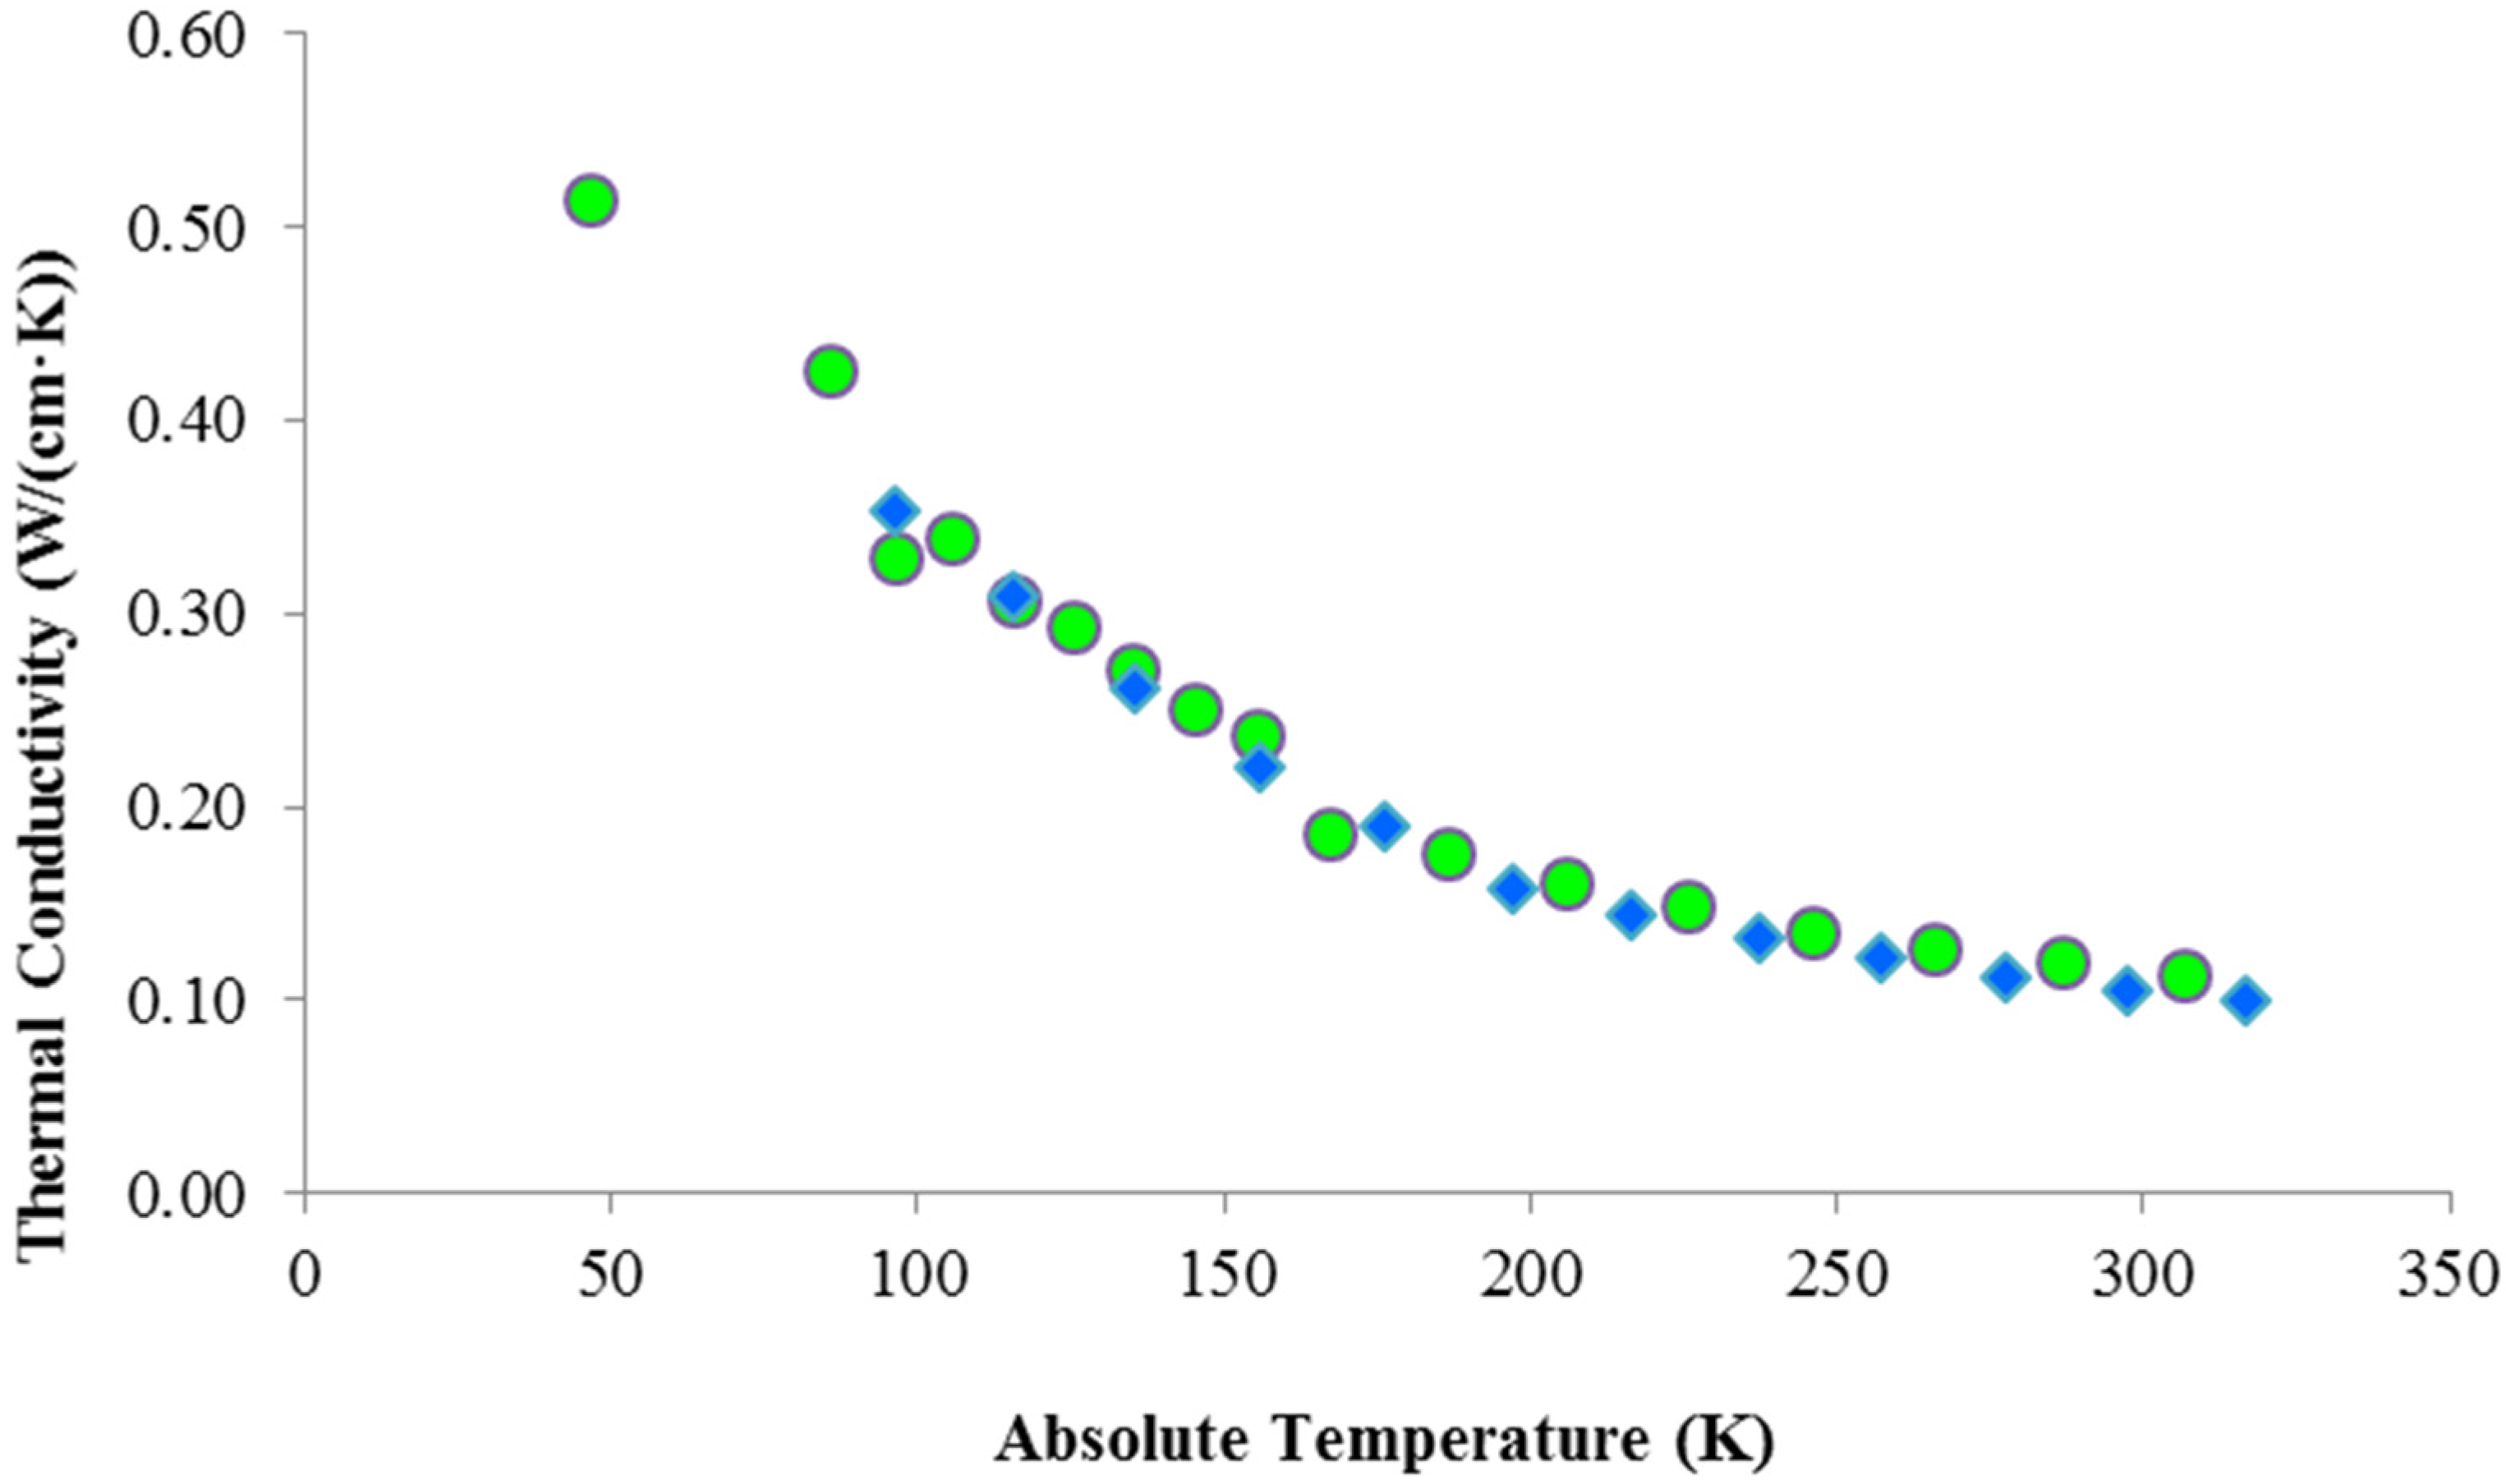
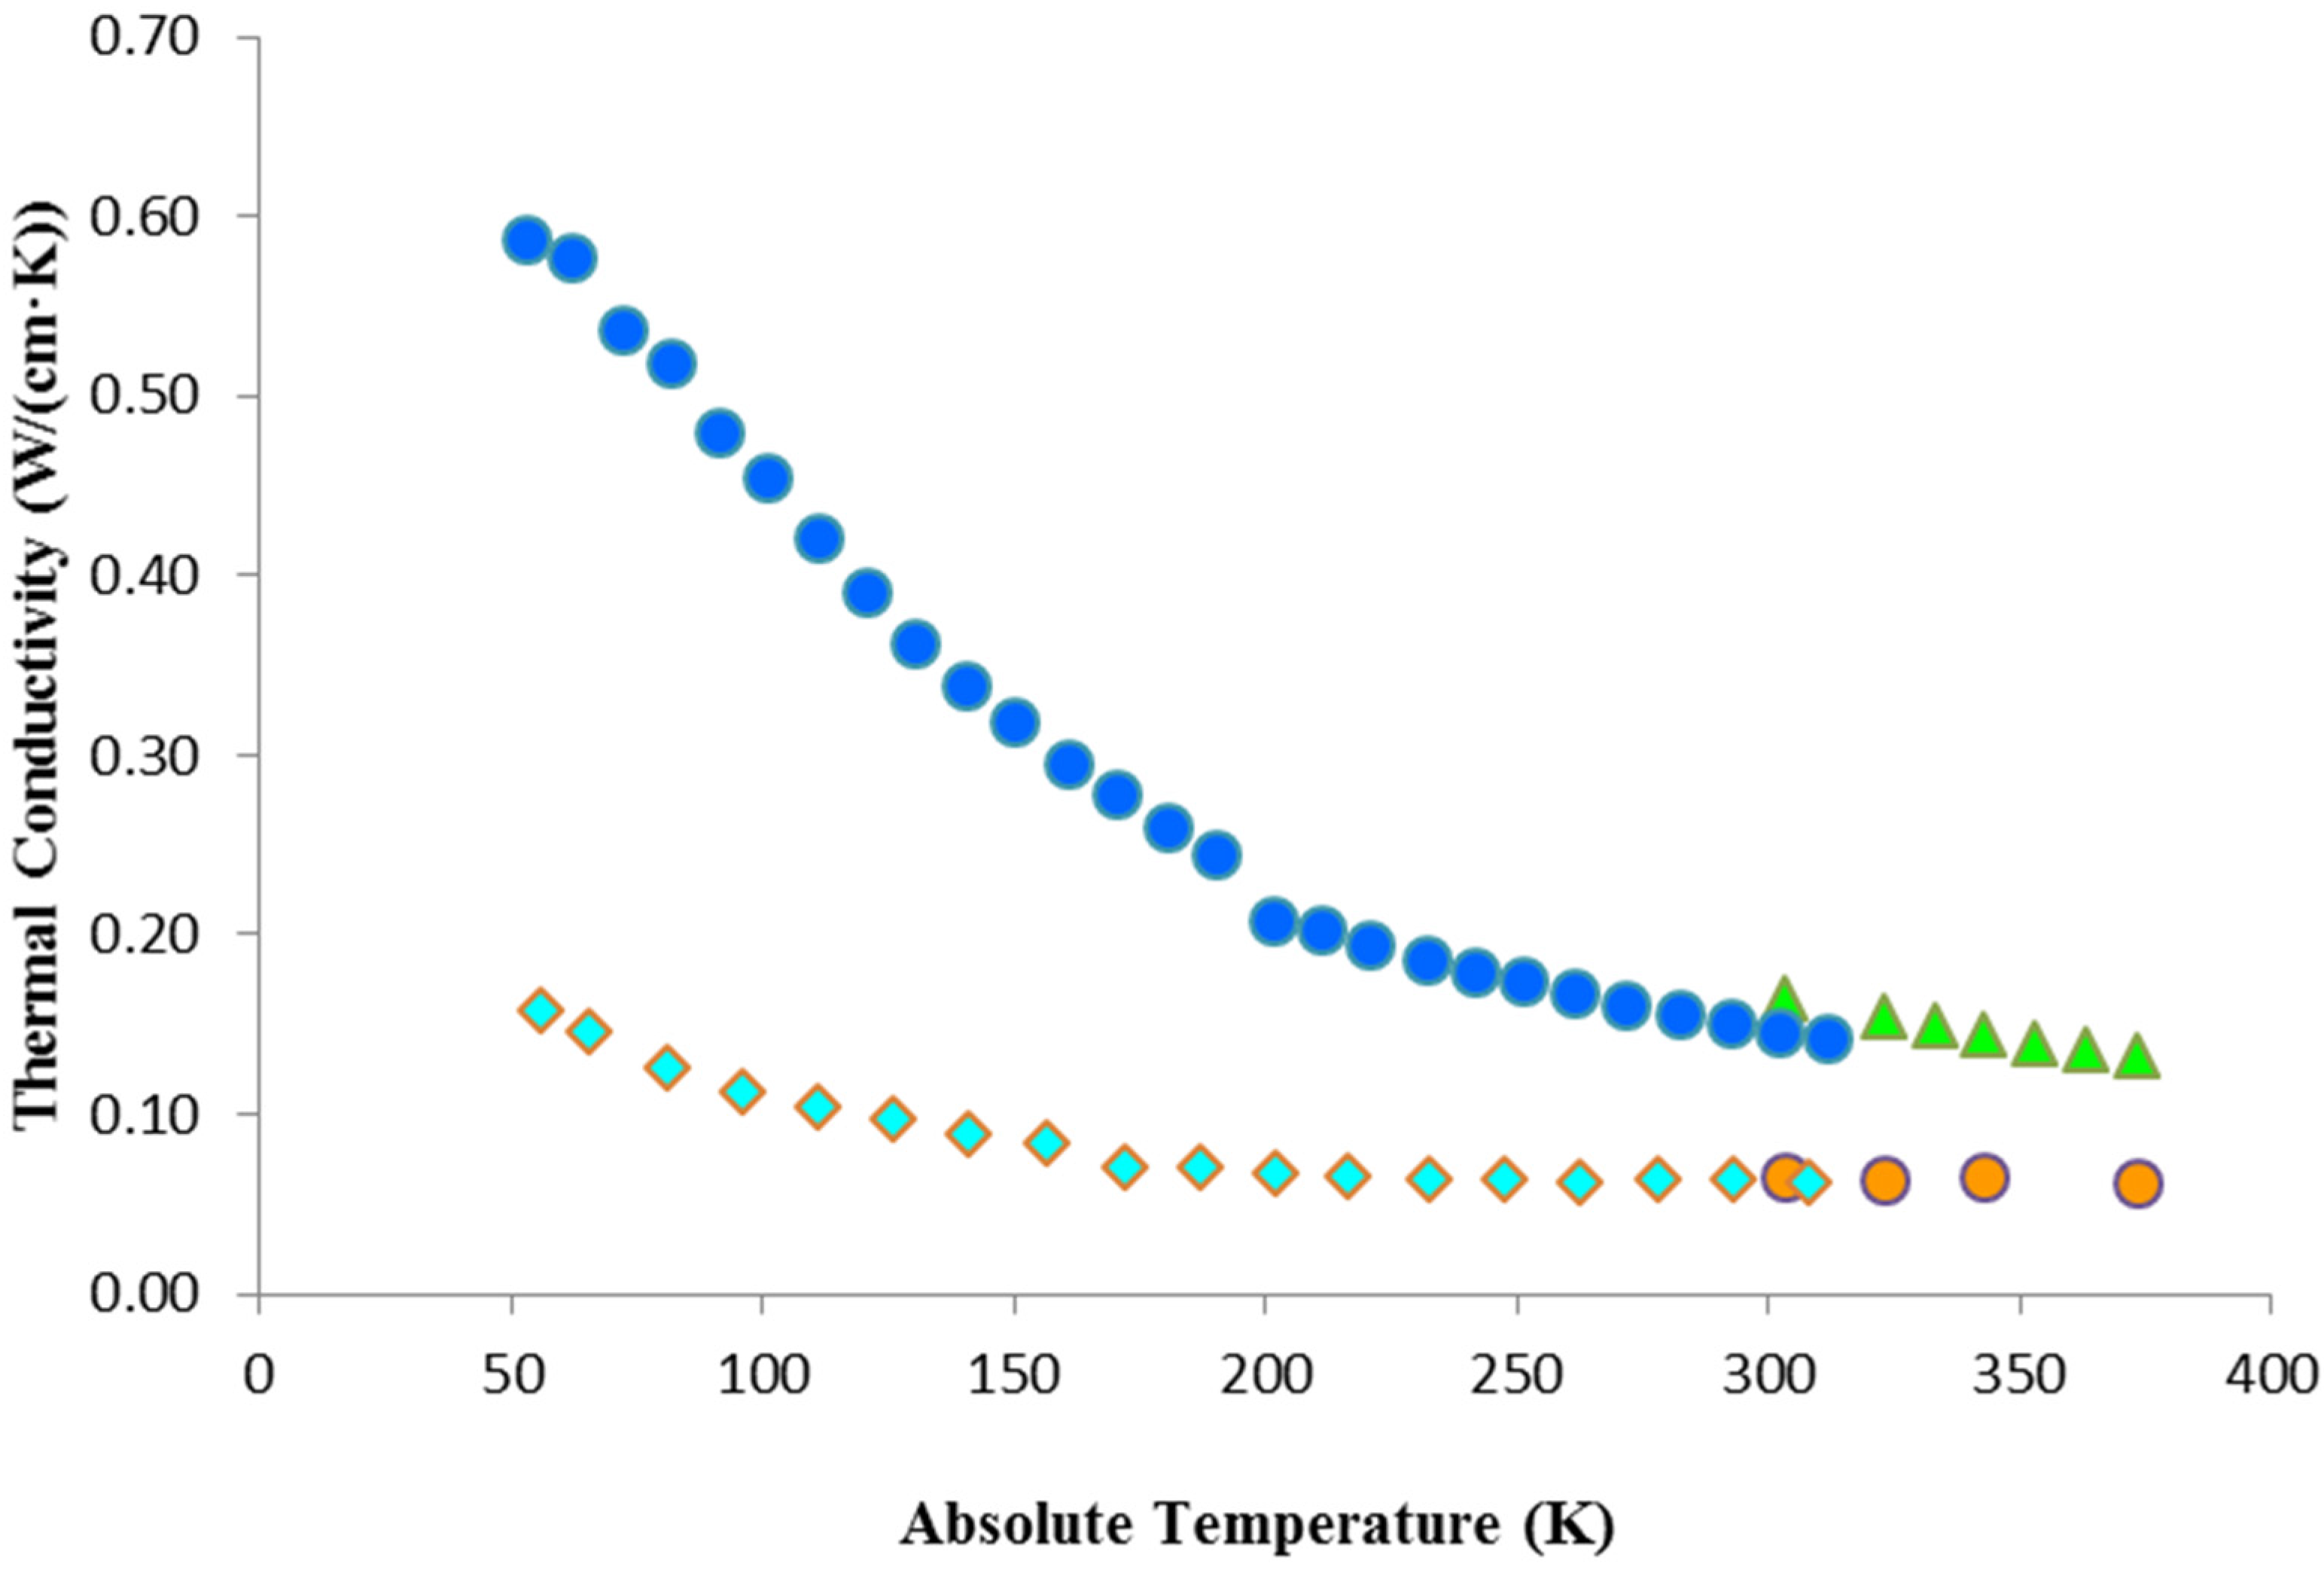
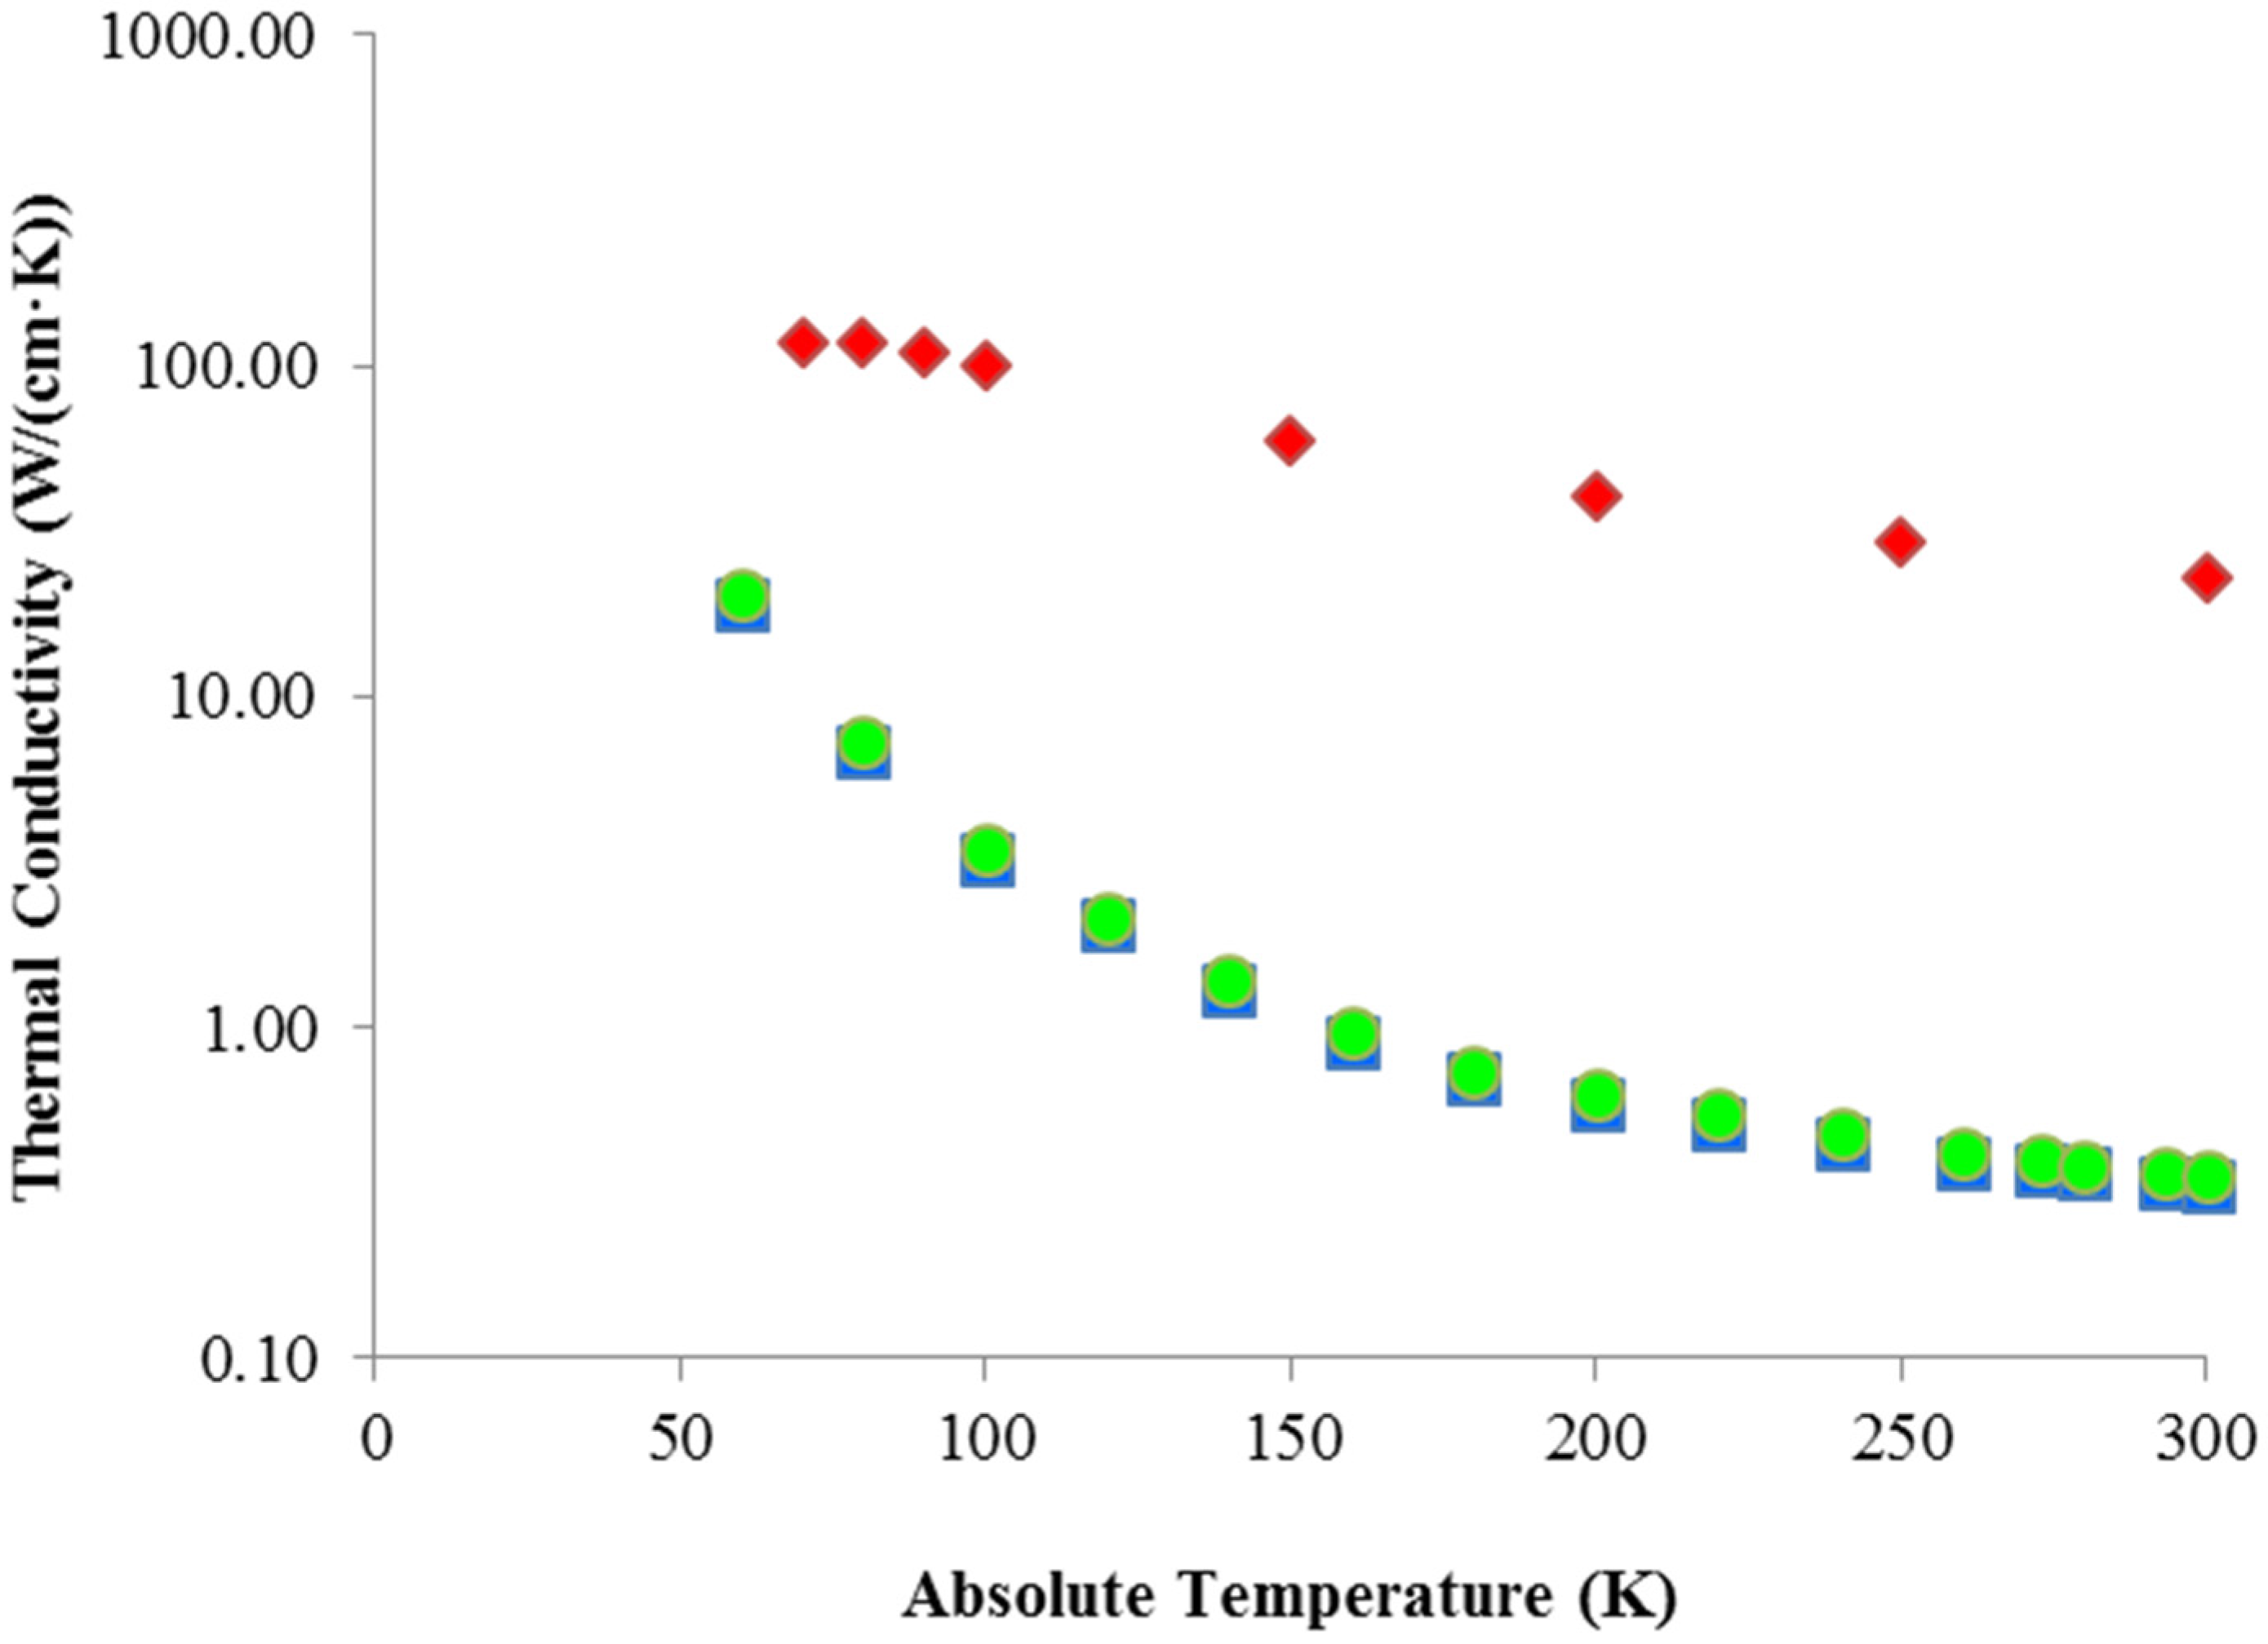
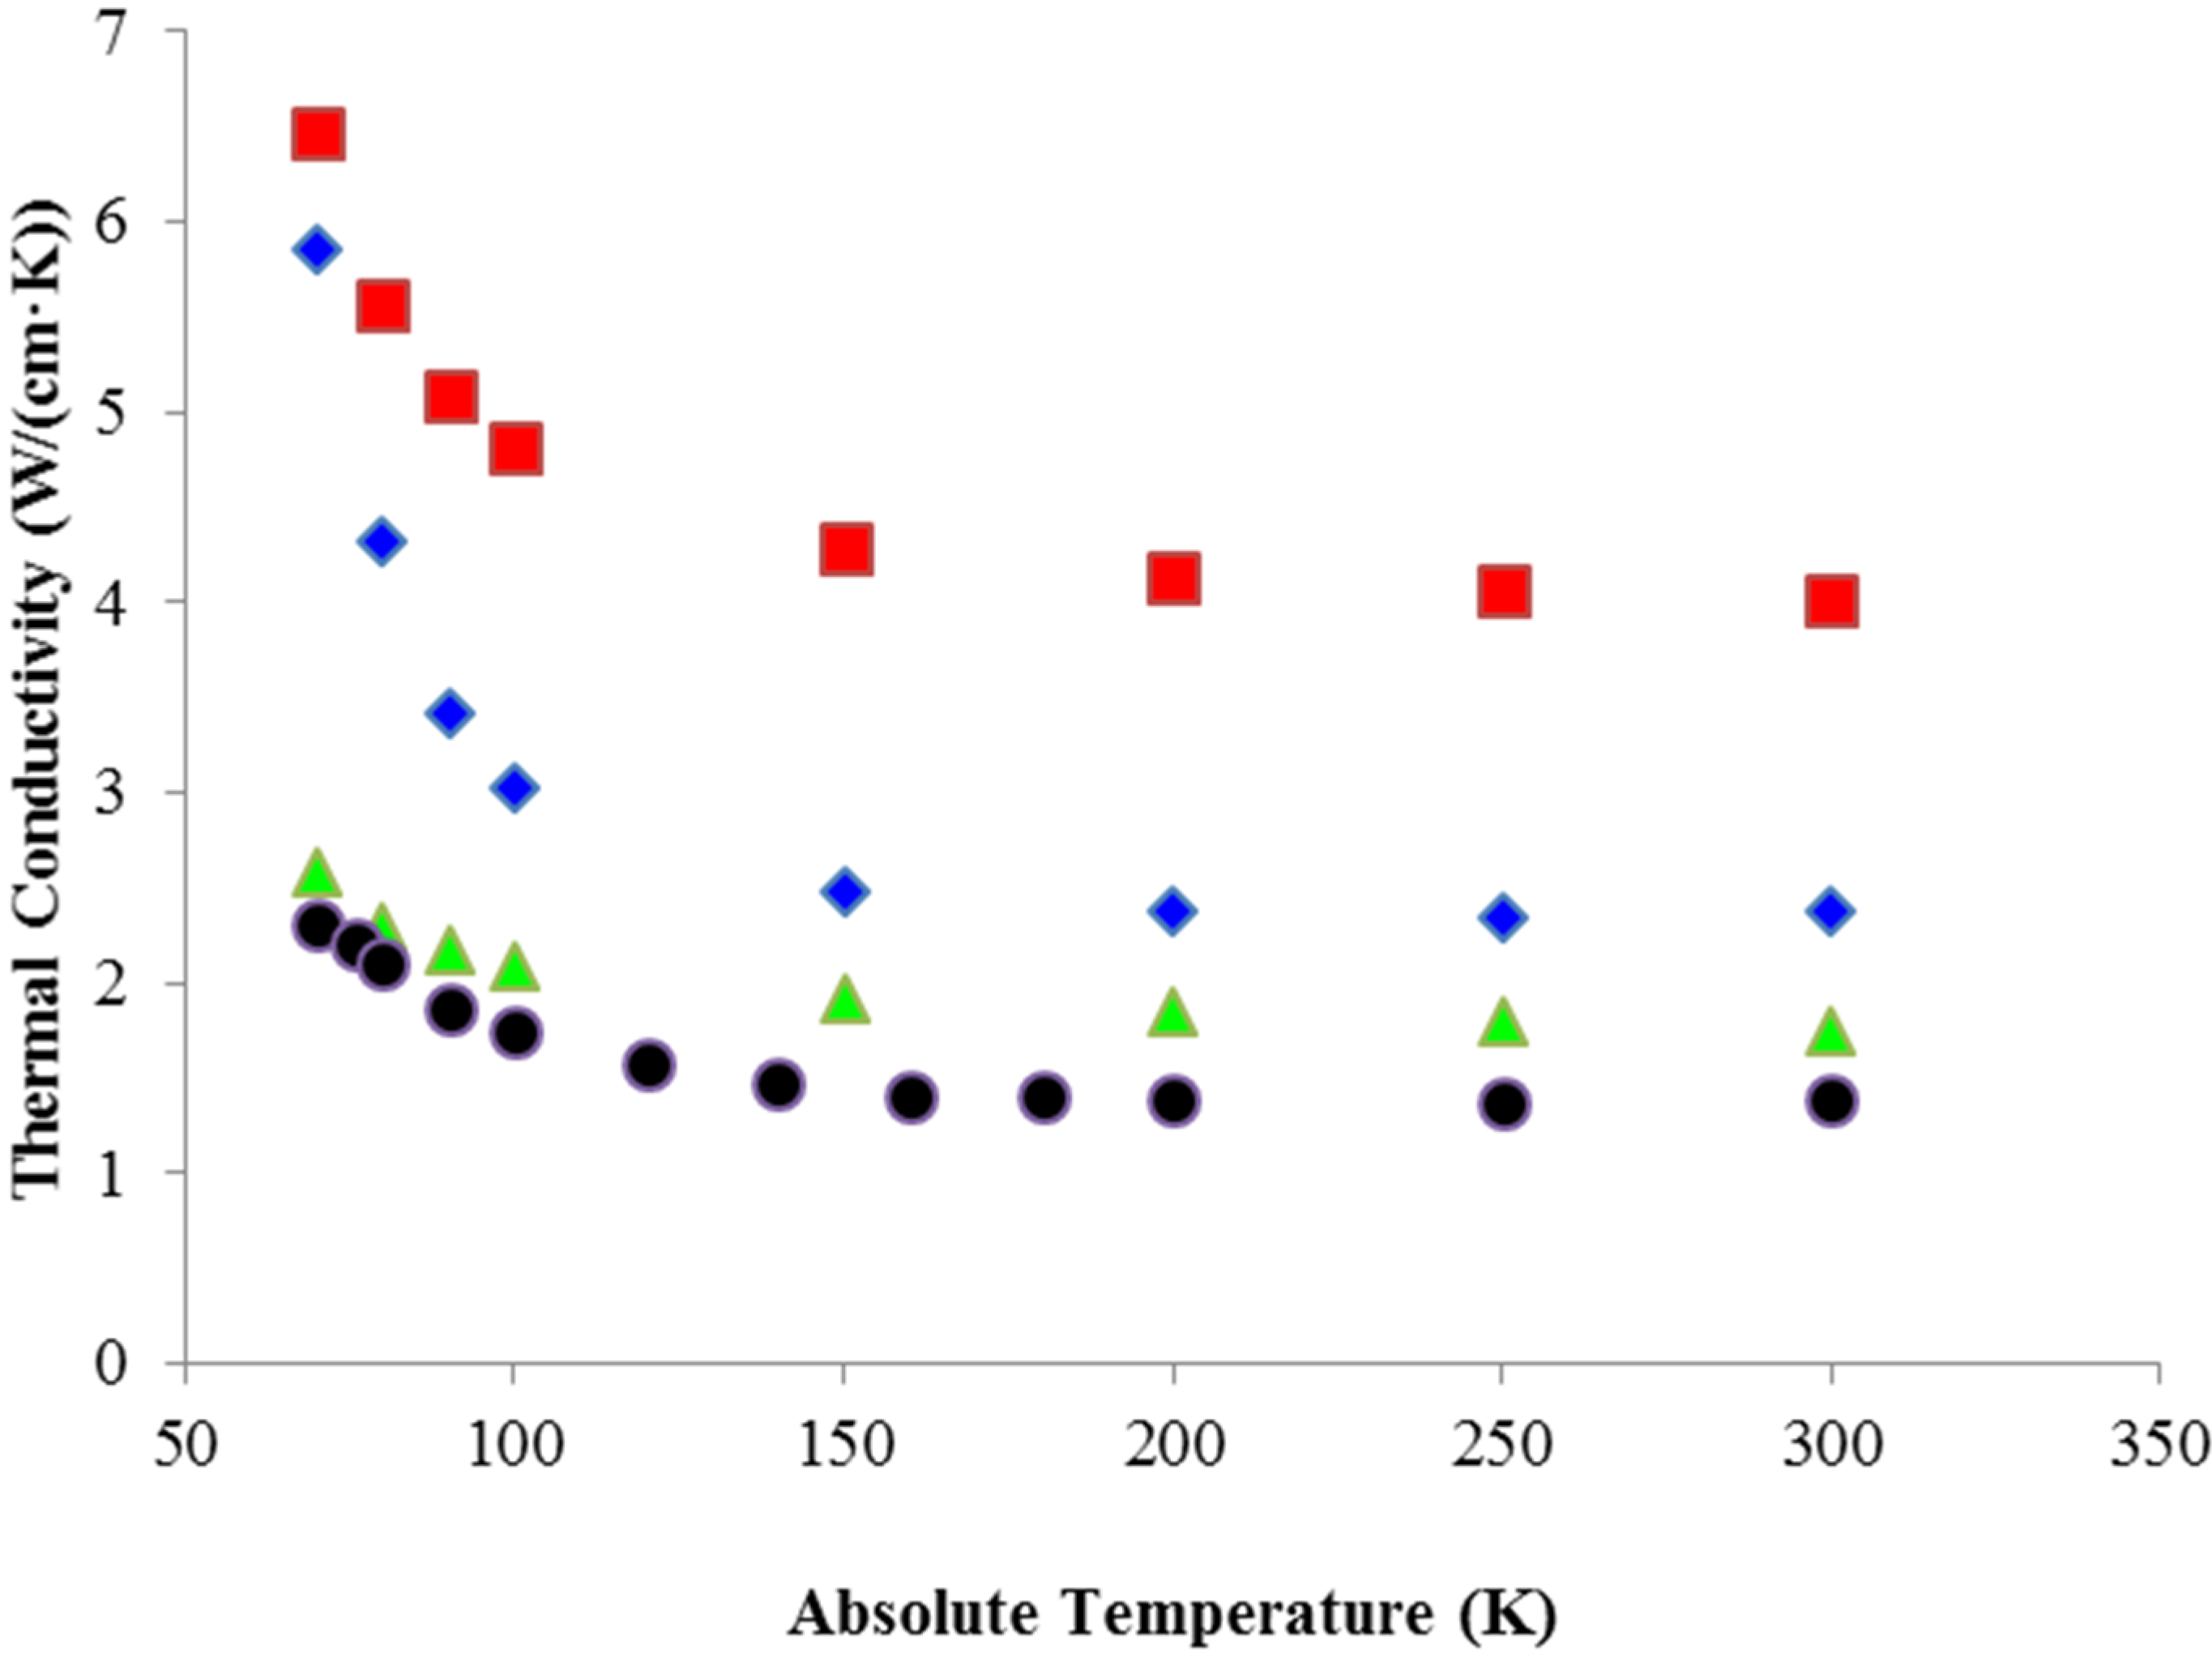
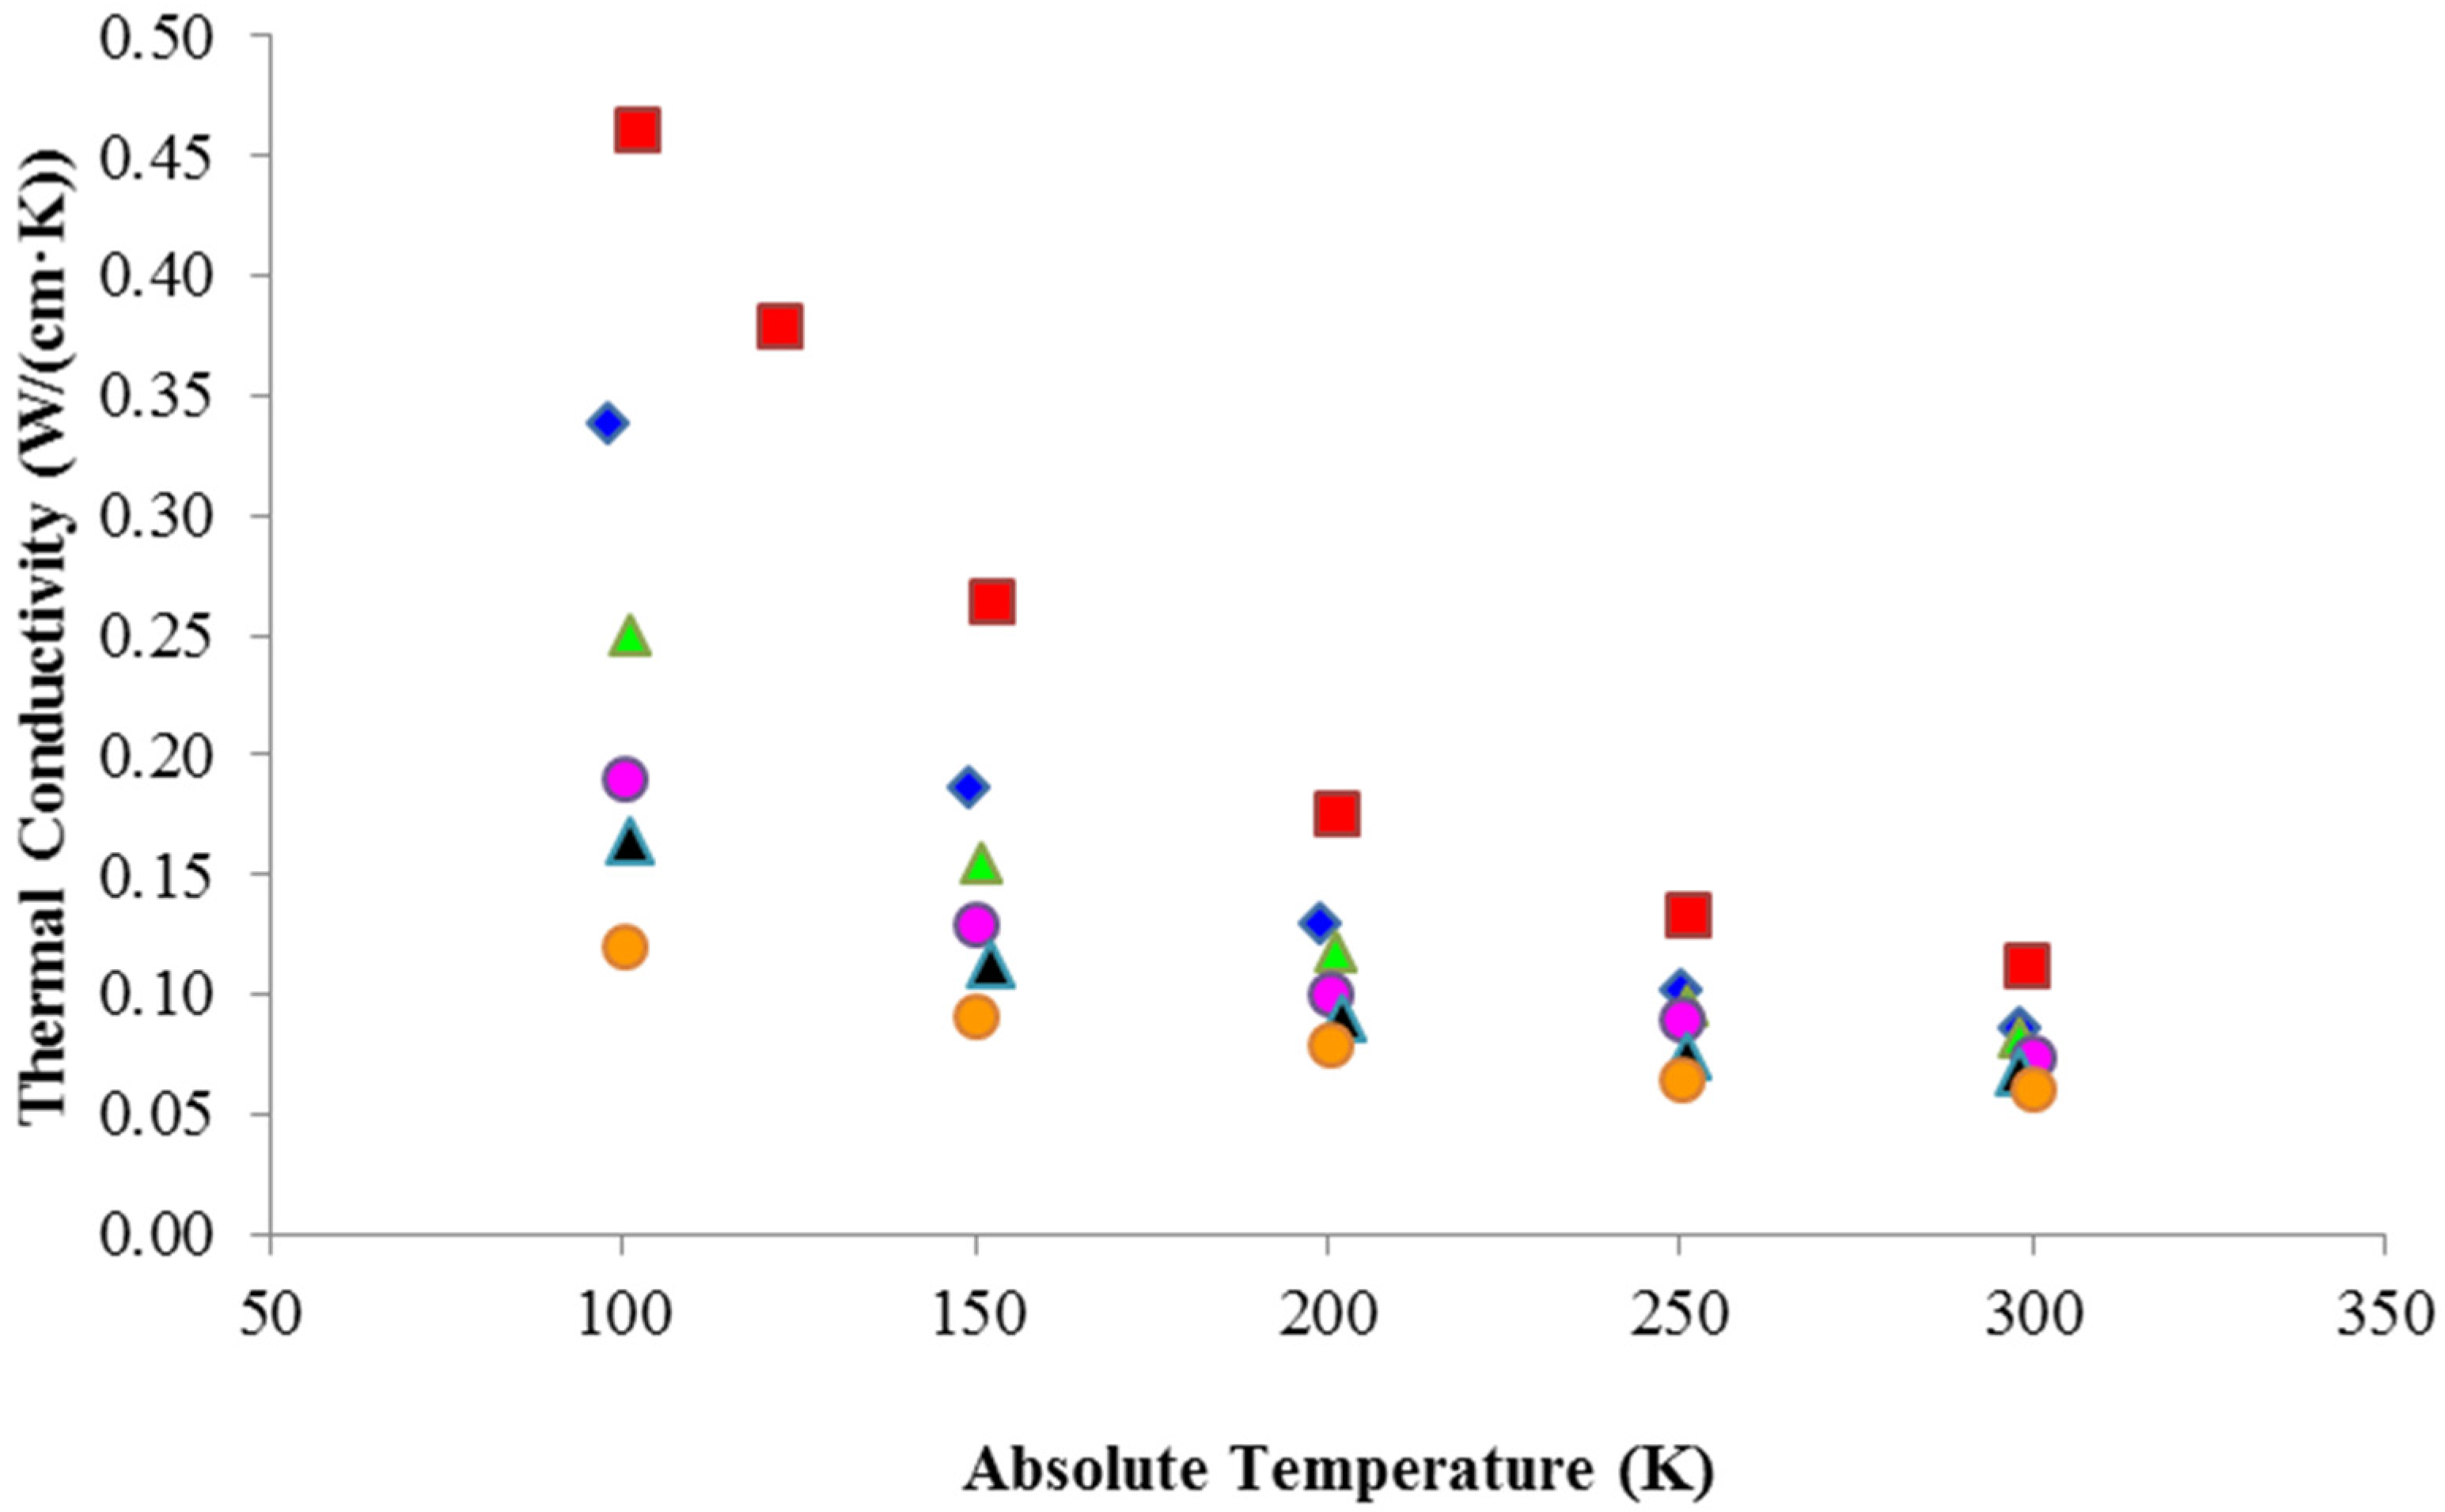
2.2.1. Thermal Conductivity

Thermal conductivity k is a very important laser design parameter, and understanding its’ dependence on temperature and dopant density is crucial to implementing cryogenic laser designs. We first examine the standard quadratic equation used for determining the CW temperature distribution in a rod or slab laser [21,22]. For a slab laser the temperature T(y) as a function of slab thickness is given by
T ( y ) = T 0 Q 0 y 2 2 k
The slab center temperature is T 0 , Q 0 is the (assumed uniform) heat power density, k the thermal conductivity, and y the distance from the slab center, where 0 ≤ y ≤ (t/2) and t is the slab thickness. Newton’s law of cooling is used as he boundary condition at y = ±t/2.To reduce the temperature differential between the center and the edge of the slab, important in reducing the thermal aberrations, we want to reduce or eliminate the thermal gradient given by
d T d y = Q 0 k y
From Equation (16) we see that reducing the thermal gradient is equivalent to reducing the ratio (Q0/k). Reducing the heat fraction in a laser material reduces Q0; the other way to reduce the gradient is to increase k. Both of these strategies are used in modern diode-pumped lasers; for diode-pumped Yb lasers in particular, heat fractions are much reduced when compared to older materials such as Nd:YAG, Nd:YLF, or Nd:YVO4. Here we recount how cryogenic-cooling has been used to obtain much larger k values. We can also see from Equation (16) that for flashlamp-pumped lasers where Q0 values can be an order of magnitude or two larger than the modest values obtained with diode-pumped lasers, thermal gradients are very much larger.
Thermal aberrations can be substantially reduced by using diode-pumping to reduce the heat fraction, and cryogenic-cooling to increase k. In Equation (15), the thermal conductivity is treated as a constant, independent of temperature or doping density. One can include the temperature dependence using a number of methods. We may write the CW heat equation for an infinite slab element as
d d y [ k ( T ) · d T d y ] = Q 0
As we will explore later in this article, theoretically the thermal conductivity varies approximately as (1/T) in the region of interest from room temperature to 77 K. We can write a simple relationship for the thermal conductivity dependence on T as
k ( T ) = k 0 · T A T
where k 0 is the thermal conductivity at ambient temperature TA = 300 K. Substituting in Equation (16) and integrating results in the analytical solution
T ( y ) = T 0 · Exp ( Q 0 y 2 2 k 0 T A )
This equation allows the computation of the temperature in any slab in which the thermal conductivity varies as (1/T). It should be noted that, as first reported in [20], the equation is then no longer quadratic. The derived equation satisfies the boundary condition that T(y = 0) = T0. For y = ±t/2, we find the edge temperature Te:
T e = T 0 · Exp ( Q 0 t 2 8 k 0 T A )
Equation (20) allows the calculation of the edge temperature, knowing T0. Often Te is fixed at room temperature by a temperature controlled water chiller, or by liquid nitrogen (LN2), and in that case Equation (20) may be used to calculate the slab center temperature T0. It should be noted that as expected, for small Q0, Equation (20) can be expanded in a Taylor series. Keeping only the first term, we find
T ( y ) = T 0 ( 1 Q 0 y 2 2 k 0 T A ) = lim ( T 0 / T A ) 1 T 0 Q 0 y 2 2 k 0 · [ T 0 T A ] = T 0 Q 0 y 2 2 k 0
or the equation reverts to the k = constant case. For any finite value of Q0, the temperature, and thus the thermal aberrations are not quadratic with y, and thus not correctable using a simple lens. From a practical standpoint, for lower values of Q0, this effect can be ignored.
Equation (19) may be differentiated, to find the temperature gradient
d T d y = [ T 0 T A ] · [ Q 0 k 0 ] y · E x p ( Q 0 y 2 2 k 0 T A )
Here we see that reducing the ratio (Q0/k0) is required in this case as well to reduce the thermal profile, except that in this more realistic case, the decrease in the thermal gradient is faster that in the standard case. Figure 1 shows calculation results from the standard Equations (15) and (19) derived here. Temperature as a function of the slab thickness coordinate y is shown for three cases of heat density, 500, 1500, and 2500 W/cm3, and for a slab edge temperature of 300 K. Note that we assume that Equation (18) is valid above room temperature as well. The same plot is shown in Figure 2 for an edge temperature of 80 K. The thermal conductivity is scaled according to Equation (18), and was assumed to be 0.112 W/(cm·K) at 300 K, and 0.424 W/(cm·K) at 80 K. The difference between the standard model and ours is small at 500 W/cm3 and below, whereas at the largest heat densities of 1500 and 2500 W/cm3, the difference strongly increases. For 300 K, the difference between the two models for 2500 W/cm3 amounts to 23.2 K; for 80 K the difference is 6.10 degrees. The fundamental reason for the temperature increase using our model is the decrease in the thermal conductivity that occurs as one moves towards the slab center where the temperature is maximum. This effect is ignored in the standard model. As the ambient or cooling temperature decreases to 80 K, the enhanced thermal conductivity for all temperatures reduces the difference between the two models.
We have solved the CW heat equation, ignoring the z-dependence, for rod elements as well, and find the following similar equation:
T ( r ) = T 0 · Exp ( Q 0 r 2 4 T A )
For cases in which the thermal conductivity does not vary as (1/T), but with a power of T (1/Tb) for example, we can still obtain an analytical solution, albeit a transcendental one. The solution for a slab with b > 1 is
T ( y ) = T 0 [ Q 0 ( b 1 ) y 2 2   k · T 0 1 b T A ] 1 1 b
whereas before T 0 is the temperature for y = 0, and T A is the ambient temperature. For y = t/2, we can find the edge temperaure Te, as
T e = T 0 [ Q 0 ( b 1 ) t 2 8 k · T 0 1 b T A ] 1 1 b
This equation is transcendental in T0, and may be solved numerically for any edge temperature for T0 after Q 0 , b, k, and TA are specified.
Figure 1. Temperature as a function of thickness coordinate y, for the standard model (blue) and the new model described here, for heat density values of 500, 1500, and 2500 W/cm3 (bottom to top) and an ambient cooling temperature of 300 K.
Applsci 06 00023 g001
Figure 2. Temperature as a function of thickness coordinate y, for the standard model (blue) and the new model described here, for heat density values of 500, 1500, and 2500 W/cm3 (bottom to top) and an ambient cooling temperature of 80 K.
Applsci 06 00023 g002

2.2.2. Thermal Conductivity Standard Debye Model

Using the kinetics theory of gases, applied to a phonon gas, and the Debye specific heat theory [39], the thermal conductivity k in its simplest form can be written as
k = 1 3 C v s   Λ =   1 3 C v s 2   τ
where C is the specific heat at constant volume, per unit volume. C is obtained from the relationship
C = C V   ρ
Here C V is the specific heat per unit volume per unit mass and ρ the mass density. Note that for dielectric crystals, the specific heats for constant volume and pressure are normally assumed to be equal ( C V = C P ) . vs is the mean phonon speed in the crystal, and Λ is the phonon mean-free path. vs can be calculated for any crystal using the sound speeds for the acoustic transverse and longitudinal waves, vt and vl respectively, and accounting for the fact that there are twice as many transverse as longitudinal waves, from
v s = [ 1 3 ( 2 v t 3 + 1 v l 3 ) ] 1 / 3
The transverse and longitudinal sound speeds may be calculate using the elastic coefficients, or equivalently for anaxial crystals, the bulk and shear moduli and the mass density. For YAG (Y3Al5O12) and YbAG (Yb3Al5O12), which we will discuss later in this paper, a recent publication [40] provides values for vt and vl, as well as for the bulk and shear moduli, Poisson’s ratio, Pugh’s ratio, and Young’s modulus.
τ is the phonon relaxation time, which for undoped crystals is the Umklapp relaxation time. In the Debye approximation, the total phonon energy can be expressed as
S ( ω ) = [ 9 n N A   ρ M ] · [ ħ ω D 3 ] · 0 ω D ω 3 [ e ħ ω k B T 1 ] d ω
n is the number of atoms in the crystal chemical formula, N A Avogadro’s number, M the molecular mass/mole, ħ Planck’s constant divided by 2π, ω D the Debye frequency, k B the Boltzmann constant, ω the angular phonon frequency, T is the absolute temperature and ρ the mass density. The derivative of Equation (29) with respect to temperature yields the specific heat per unit volume:
C = d S ( ω ) d T = [ 9 n N A ρ M ] · [ ħ 2 k B 2 ω D 3 T 2 ] · 0 ω D ω 4 e ħ ω k B T [ e ħ ω k B T 1 ] 2 d ω
The Debye frequency is related to the Debye temperature θ D through the relationship
θ D = ħ ω D k B
If we define the ratios x = ħ ω / k B T and x D = ħ ω D / k B T , divide by ρ, and paramaterize Equation (29), we find the standard Debye expression for the specific heat [39]:
C V = [ 9 n N A M ] · ( T θ D ) 3 · 0 x D x 4 e x [ e x 1 ] 2 d x
where x is integrated from 0 to x D .
There are two often-used limits to Equation (32). For large temperature values (T >> θ D ), the exponential function may be expanded in a Taylor series, with the result being the constant
C V = 3 n N A k B M
This result is known as the Dulong-Petit law. As an approximation to the Debye model, the following equation is often used for any T [41]:
C V = [ 9 n N A k B M ] · 1 1 + 5 4 π 4 ( θ D T ) 3  
If we take the limit as T → 0, we find the following equation
C V ( 12 π 4 5 ) · ( n N A k B M ) [ T θ D ] 3
This equation correctly predicts the T3 dependence of the specific heat for low temperatures, and is known as the Debye-T3 law.
In Figure 3, we show a plot of C V for the undoped laser material Y3Al5O12, as a function of temperature. We used Equation (32) for calculating C V using the Debye model, and the YAG Debye temperature of 760 K [29]. Also shown are published data for YAG [29], as well as the approximate results obtained using Equation (34). The Debye model matches the experimental data fairly well, while the approximate model over estimates the specific heat for temperatures starting at about 180 K.
Rather than Equation (26), an alternative approach to calculating the thermal conductivity was used by Klemens [42], whose model we will discuss in more detail in the next section of this paper. The following more sophisticated relationship for k can be employed:
k = 1 3 S ( ω ) v s 2 τ ( ω ) d ω
where S(ω) is defined by Equation (29), and vs and τ have been previously defined. The use of τ(ω) rather than the mean free path makes it simple to introduce phonon scattering from impurity atoms introduced into the crystal lattice, as we will review in the following section. If we take S(ω) in the high temperature limit, we find the following relationship:
S ( ω ) = 3 2 k B ω 2 π 2 v s 3  
where we have used the following expression for the Debye frequency:
ω D = 2 π [ 3 n N A ρ M ] 1 / 3 · v s
Inserting Equation (37) into Equation (36), and assuming that the phonon speed v s is a constant, we obtain
k = k B 2 π 2 v s · 0 ω D ω 2 τ ( ω ) d ω
This equation has been used by Klemens [42] to calculate k when scattering defects are doped into a crystal. It should be noted however that this equation is strictly valid only when T >> θ D . For most laser materials, and particularly in the temperature range of interest here, about 77–300 K, this condition is violated but nevertheless often used because it can provide analytical results.
Figure 3. Specific heat for the undoped laser material Y3Al5O12 as a function of temperature. Shown are the calculated values (solid blue line) using Equation (32), the values obtained with the specific heat approximation of Equation (34) (dashed red line), and the experimental data from [29].
Applsci 06 00023 g003

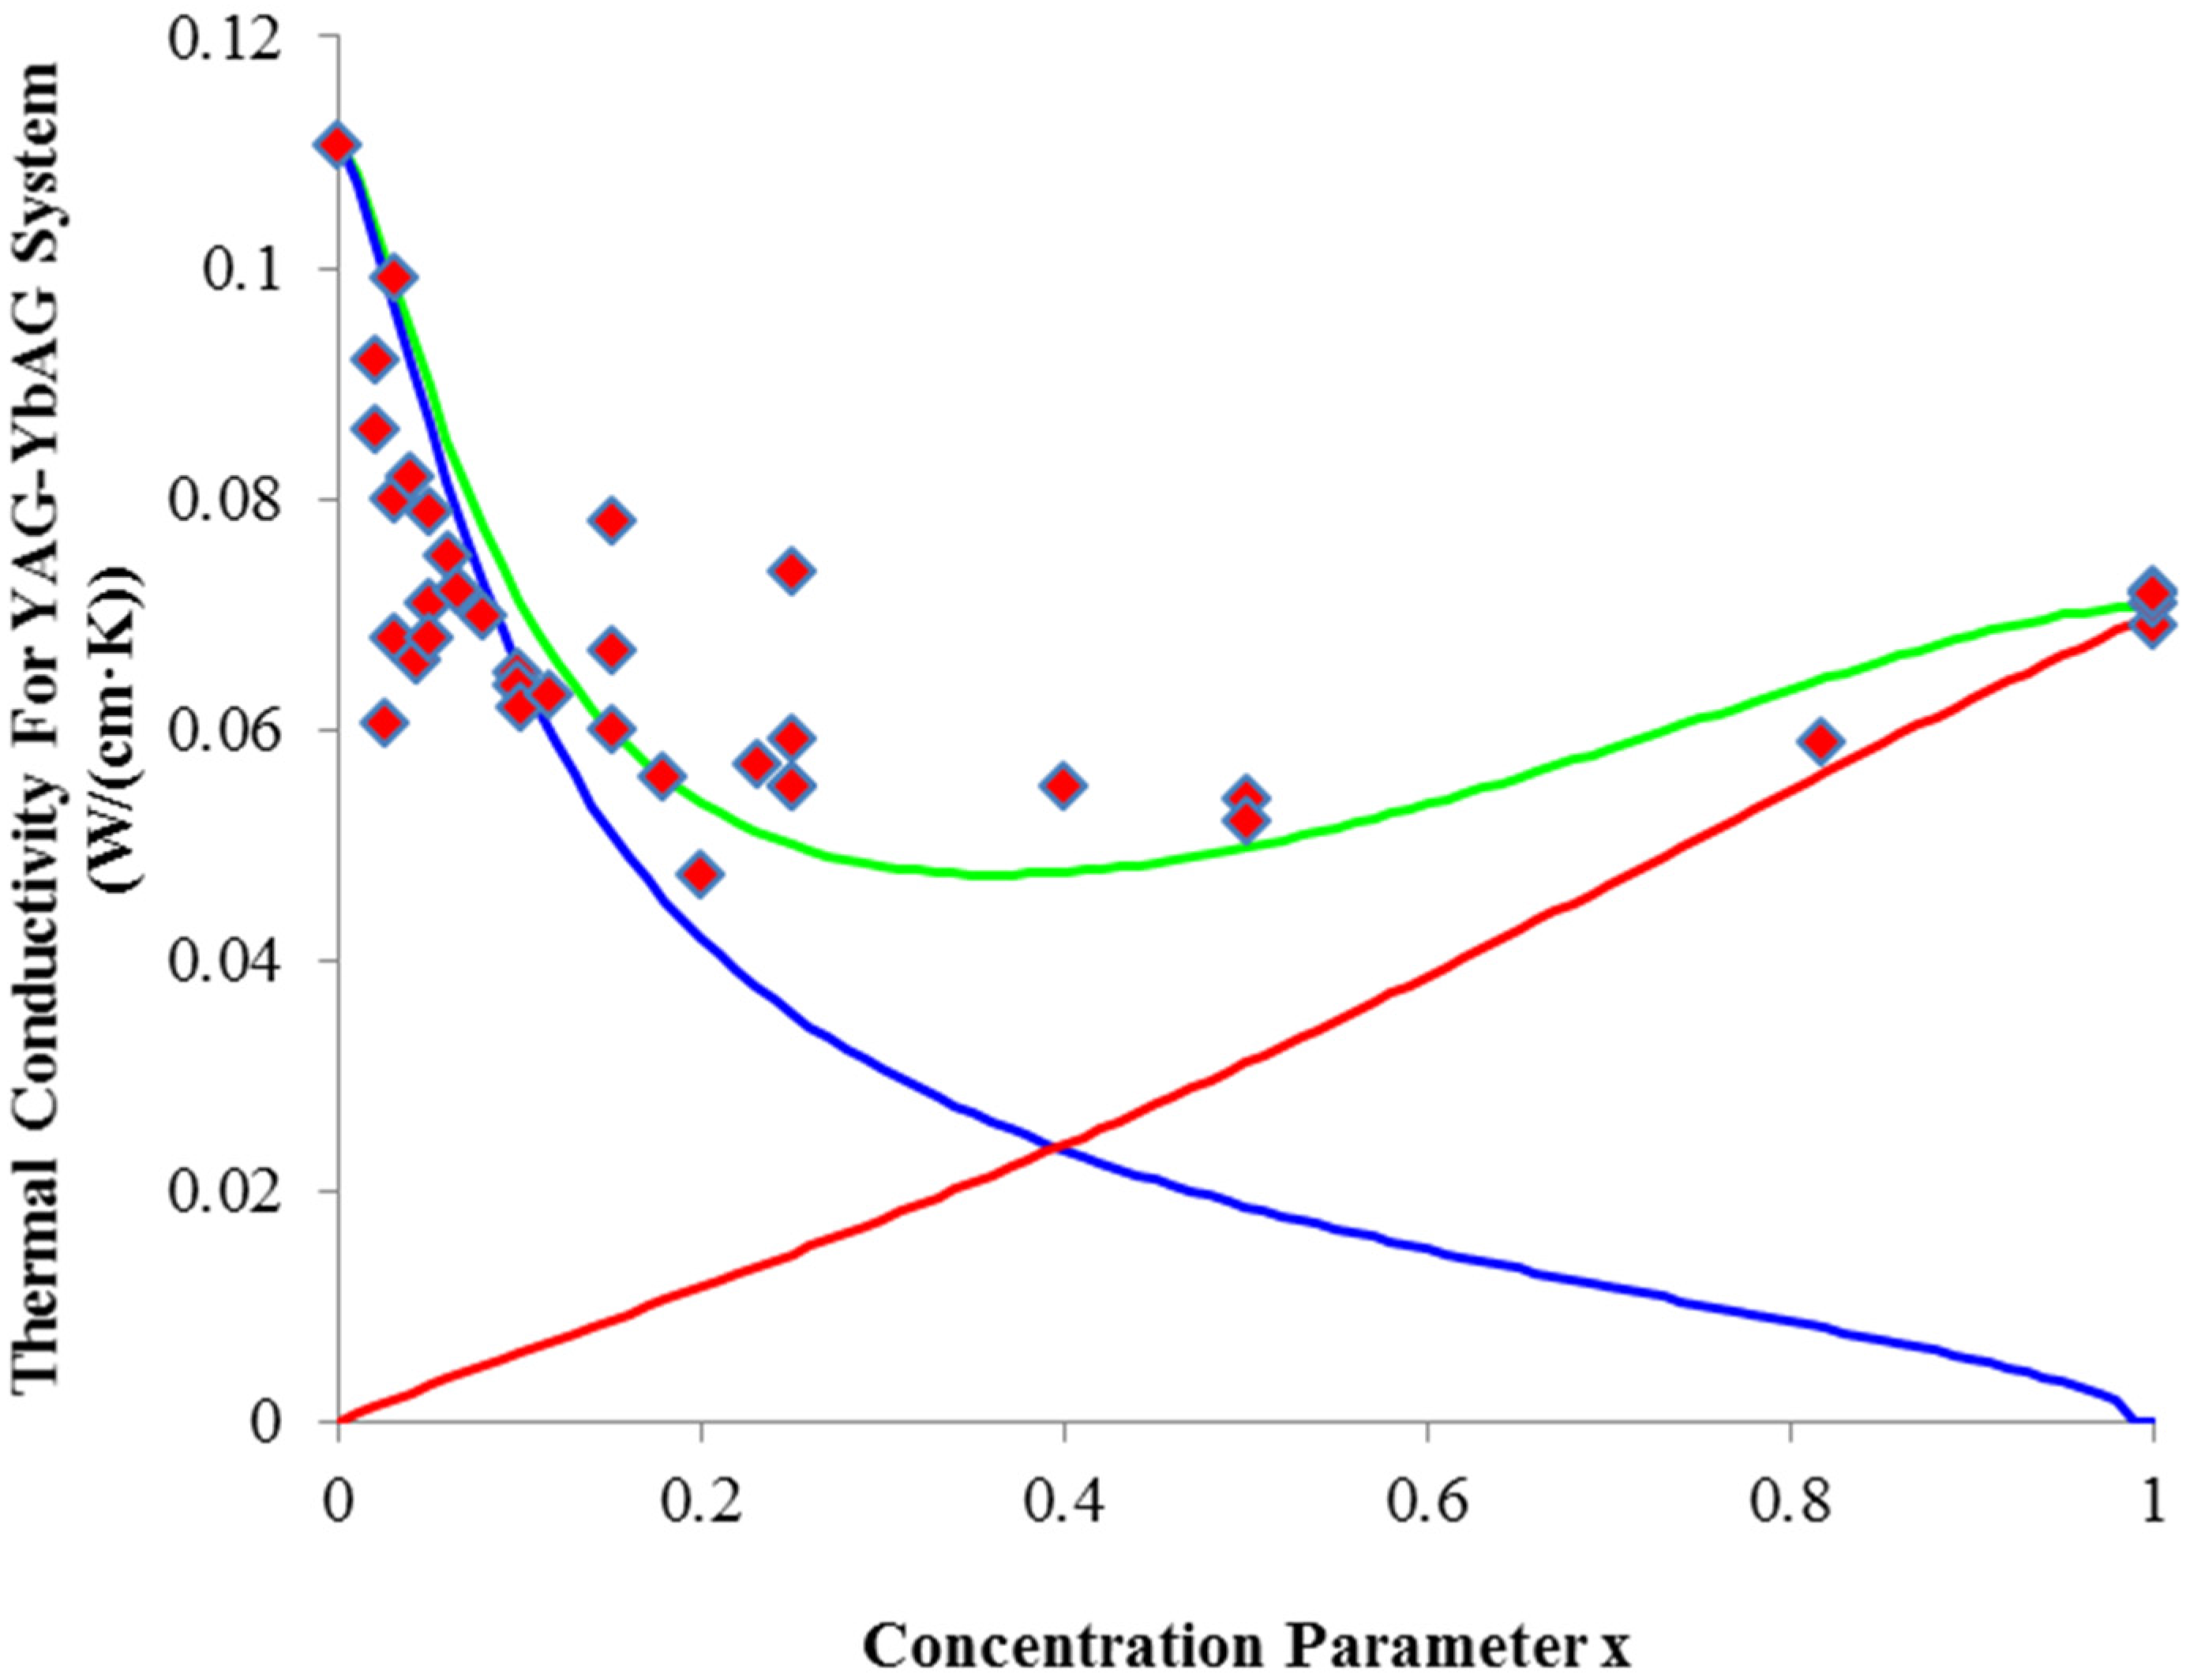
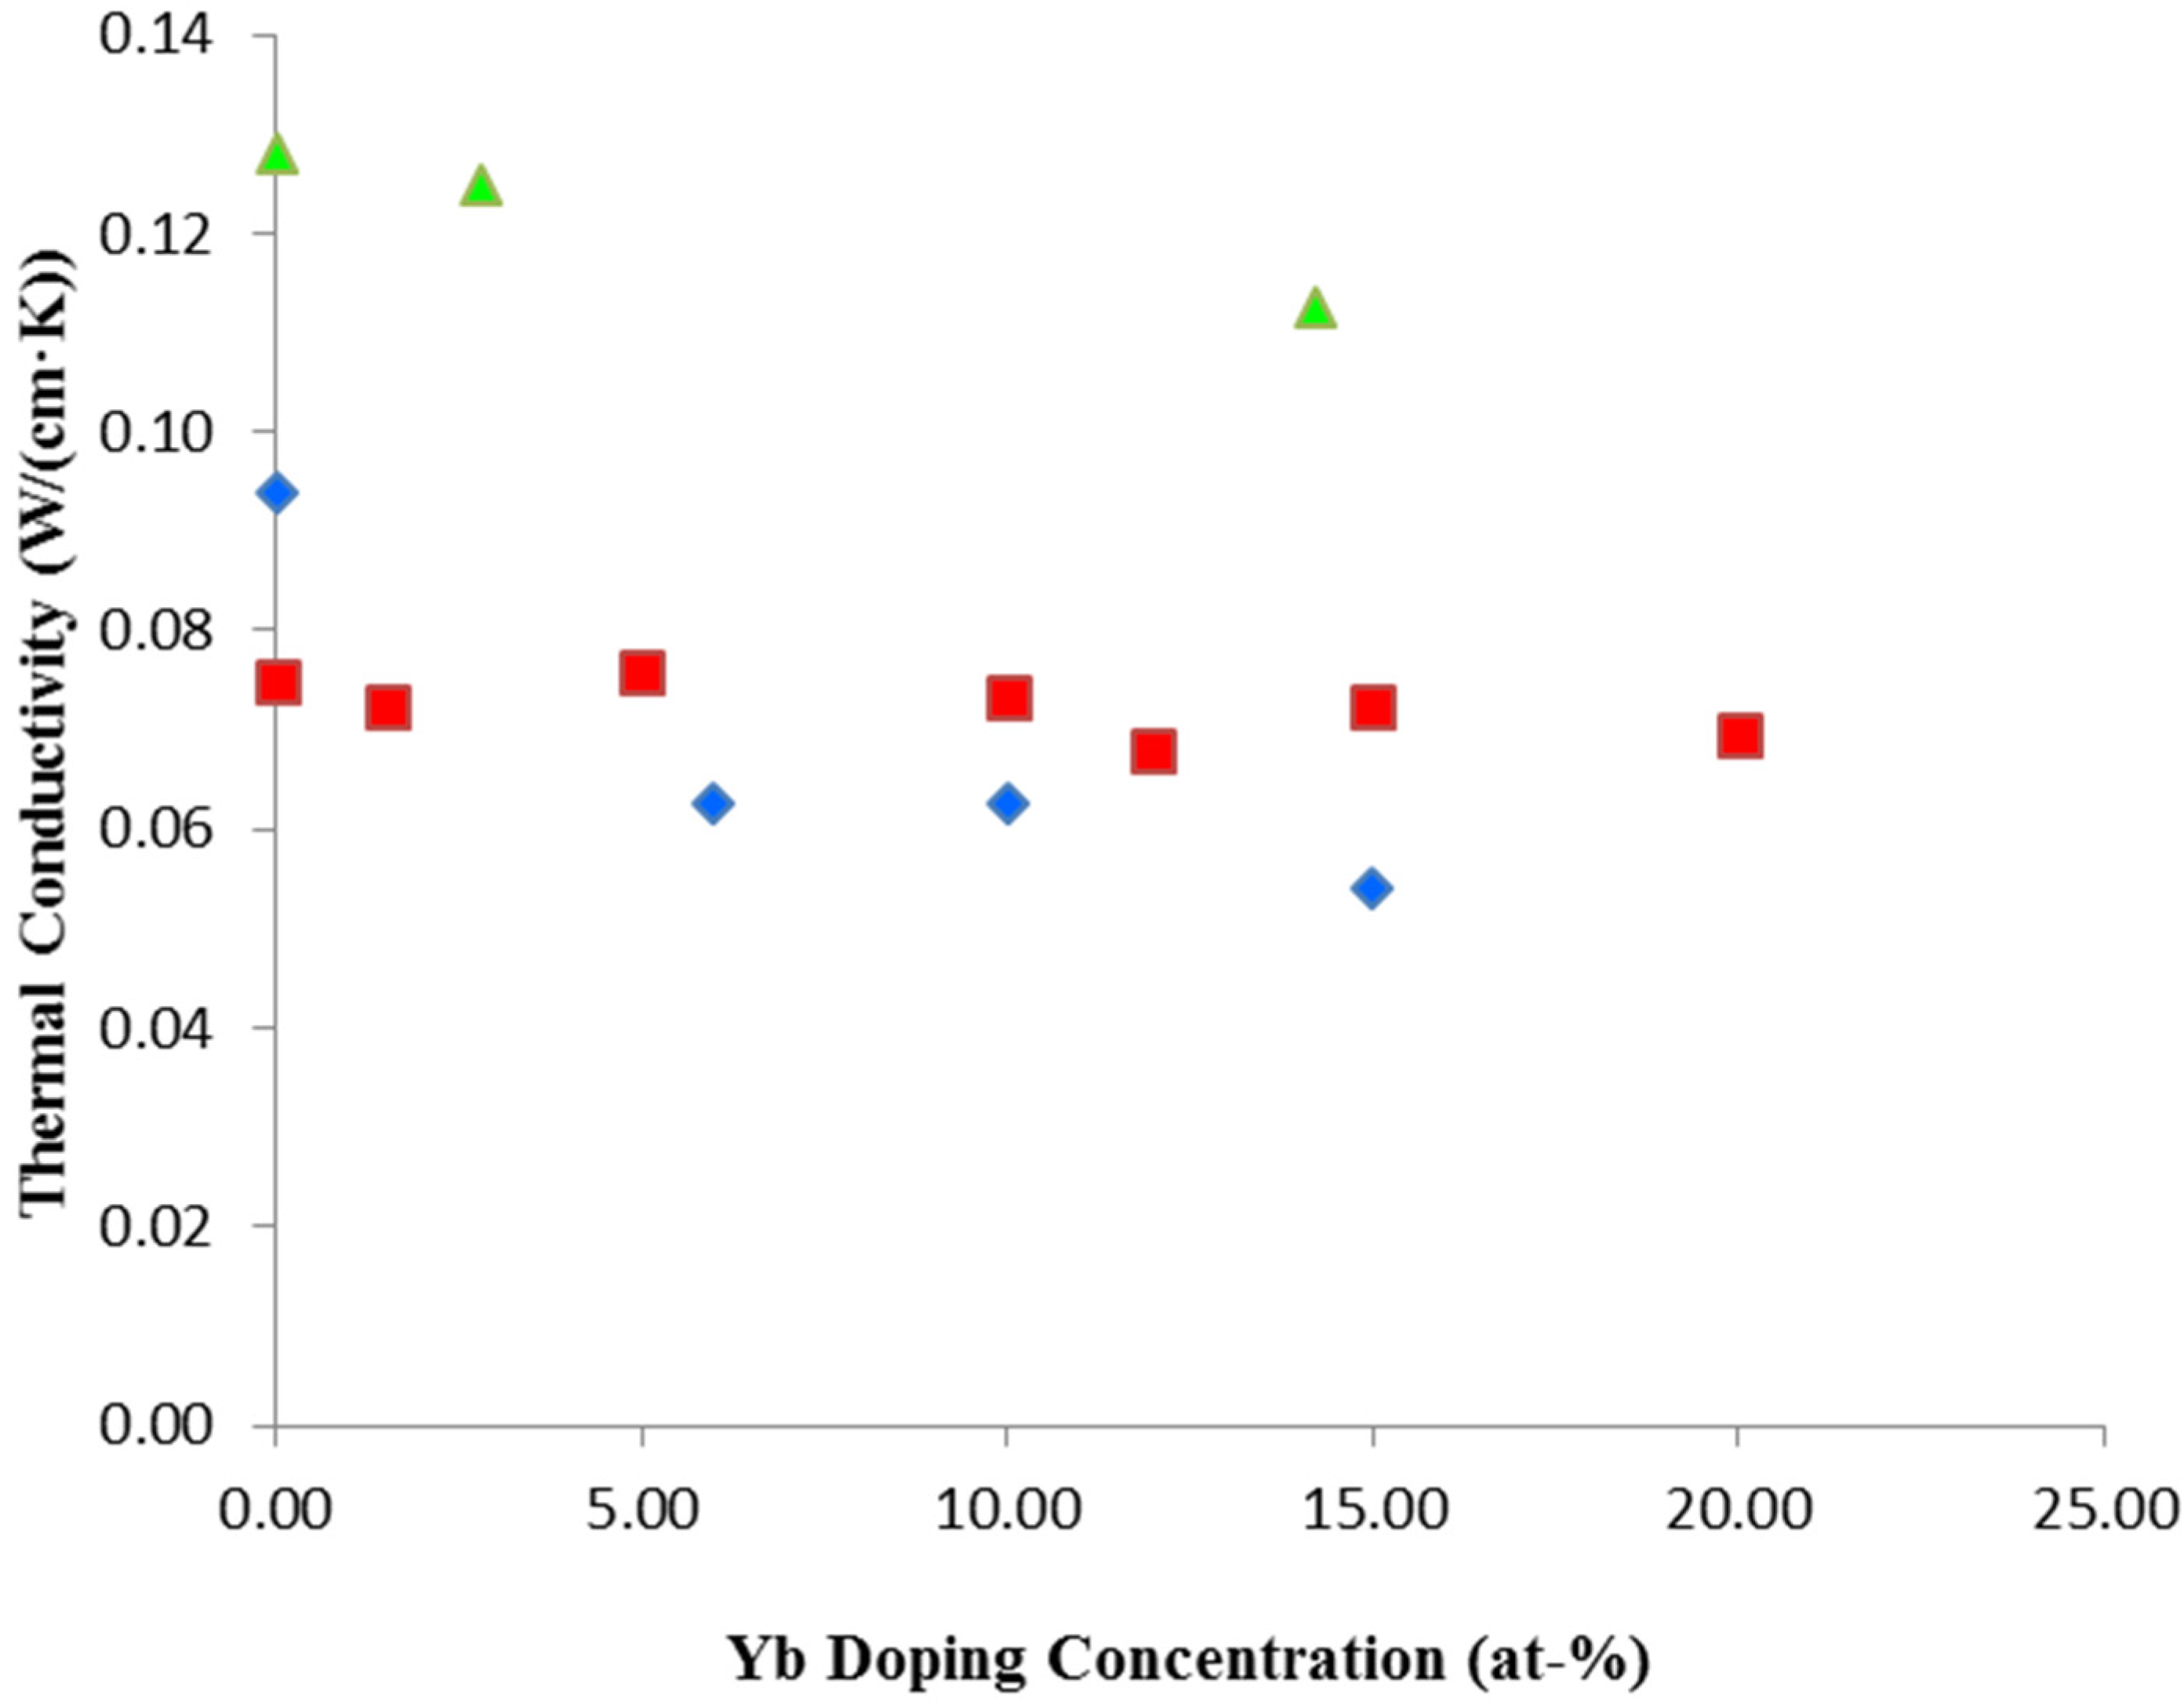
2.2.3. Thermal Conductivity: The Influence of Dopant Density

The thermal conductivity of doped laser materials is strongly affected by the presence of impurities, and in particular the doping density of lasing ions. Small quantities of dopant ions have a minimal effect on thermal conductivity, while ever increasing dopant densities degrade the thermal conductivity in an inverse relationship. This may be seen in Figure 4 wherein we display the thermal conductivity as a function of absolute temperature for the laser material YAG, for the undoped case, and for Yb concentrations of 2, 4, 10, 15, and 25 at. %. The 2, 4, and 15 Yb at. % values are obtained from [29], and the 10 and 25 at. % values are estimated from computer best fits to the data of [29] for each temperature. If we examine the data at 100 K for example, compared with the room temperature data at 300 K, we see that for the undoped sample the thermal conductivity value is 0.461 W/(cm·K), whereas the thermal conductivity for 10 at. % Yb is 0.190 W/(cm·K), and for 25 at. % Yb only 0.120 W/(cm·K). Thus at 100 K the drop in thermal conductivities amount to reductions of 0.41 and 0.26 respectively, when compared to the undoped value. The thermal conductivity at 300 K for the undoped case is 0.112 W/(cm·K), and 0.061 W/(cm·K) for the 25 at. % Yb doping case. Thus if we compare the undoped cases at 100 K and 300 K, we find the thermal conductivity larger by a factor of 4.1 at 100 K. For the 25 at. % Yb case however, if we compare the 100 K and the 300 K data, we see that the thermal conductivity rises by a factor of about 1.97 between 300 and 100 K, but also that the thermal conductivity at 300 K is smaller by a factor of about 0.545 when compared with the undoped case at 300 K. Most Yb:YAG lasers use Yb dopings between 2 and 10 at. %. For the 10 at. % Yb case, the thermal conductivity at 100 K is larger by a factor of about 2.57, a factor of 1.6 times smaller than the increase of 4.1 between 300 and 100 K for undoped YAG.
Figure 4. Thermal conductivity as a function of absolute temperature for undoped single-crystal Czochralski-grown YAG (red), and Yb:YAG with doping densities of 2 (blue), 4 (green), 10 (pink), 15 (black), and 25 (orange) at. %. The experimental data for the 2, 4 and 15 at. % values are taken from [29], while the 10 and 25 at. % values were determined from fits to the data of [29] for each temperature.
Applsci 06 00023 g004
It has long been known [42] that the mass of a dopant (donor) atom (Yb for example), replacing an acceptor atom (Y for example) in a crystal lattice results in a decrease in thermal conductivity, as illustrated in Figure 4. Recently, attempts have been made to further quantify the effect of donor-acceptor mismatch. It has been demonstrated experimentally, for example, that if the donor atom mass is well-matched to the acceptor ion, the decrease in thermal conductivity as doping density increases is minimized. A particularly good example of this is the crystal Yb:Lu2O3, where the mismatch between Yb and Lu is small. The data are shown in Figure 5, where k is displayed as a function of absolute temperature for undoped Lu2O3 and for 11 at. % Yb doping [43]. At 306 K, the difference between the undoped point and the two adjacent 11 at. % Yb-doped points amounts to an average of only 9.5%. In the region between 96 and 106 K, the doped and undoped k values are nearly indistinguishable. In Table 1, we show the acceptor minus the donor mass mis-match between 11 common dopants and 10 acceptor atoms. For the case of Yb:Lu2O3 for example the mass-mismatch between Lu and Yb is only 1.93 amu’s. The data of Figure 5 reflect the close match between Lu and Yb ions, and high thermal conductivity at 80 K is one of the reasons Yb:Lu2O3 has become a very desirable high-power laser material. Table 1 also shows that Lu is a very good match for Er and Tm, and that Ce, Pr, and Nd are very good matches to La. In addition to Lu2O3, two other sesquioxides, Sc2O3 and Y2O3, have been intensely investigated as newer laser materials. No donor results in a good match for Y. For Sc, the rare-earths are a very poor mass match, and this is also reflected in the experimental data. Yb has the worst mis-match, and Er, Tm, and Ho are also poor. The poor mismatches of these donor-acceptor ions are reflected in the experimental data as well, as shown in Figure 6 where thermal conductivity is shown as a function of absolute temperature [43,44]. Data are plotted for undoped hydrothermally-grown and Czochralski-grown undoped Sc2O3, for 2.9 and 9 at. % Yb doping and for 3 at. % Er doping. As expected from Table 1, there is a strong drop in k for Er and an even worse drop for Yb, for all temperatures. Another interesting comparison is Yb:YAG with Yb:LuAG. The mass mismatch for Yb and Y is about −84.13 amu. For Yb and Lu it is only 1.93 amu. Based on this comparison we would expect the mass scattering to be much smaller in Yb:LuAG than in Yb:YAG. We will see in Section 2.2.7 that as Yb doping increases, the falloff in thermal conductivity for Yb:LuAG is much smaller than for Yb:YAG.
Figure 5. Thermal conductivity as a function of absolute temperature for hydrothermally-grown single-crystal undoped Lu2O3 (green) and 11 at. % doped Yb:Lu2O3 (blue) [43].
Applsci 06 00023 g005
Figure 6. Thermal conductivity as a function of absolute temperature for the sesquioxide material Sc2O3, for undoped hydrothermal (blue) [43] and Czochralski (green) [44] grown single-crystals, 3 at. % Er doping (light blue) [44], and 2.8 at. % Yb doping (orange) [44].
Applsci 06 00023 g006
Table 1. Donor-Acceptor atomic numbers, weights, and weight differences for common dopants (donors) and acceptors.
DonorAt. NumberAcceptorLiMgAlKCaScYLaGdLu
At. Number3121319202139576471
At. Weight (amu)6.9424.3126.9839.1040.0844.9688.91139.91157.25174.97
Ti2247.87−44.8756.87−20.89−8.77−7.79−2.9141.0492.04109.38127.10
V2350.94−47.9459.94−23.96−11.84−10.86−5.9937.9688.96106.31124.03
Cr2452.00−49.0061.00−25.01−12.90−11.92−7.0436.9187.91105.25122.97
Co2758.93−55.9367.93−31.95−19.84−18.86−13.9829.9780.9798.32116.03
Ni2858.69−55.6967.69−31.71−19.60−18.62−13.7430.2181.2198.56116.27
Ce58140.12−137.12149.12−113.13101.02−100.04−95.16−51.21−0.2117.1434.85
Pr59140.91−137.91149.91−113.93101.81−100.83−95.95−52.00−1.0016.3434.06
Nd60144.24−141.24153.24−117.26105.14−104.16−99.28−55.33−4.3313.0130.73
Sm62150.36−147.36159.36−123.38111.26−110.28105.40−61.45−10.456.8924.61
Eu63151.97−148.97160.97−124.98112.87−111.89107.01−63.06−12.065.2823.00
Dy66162.50−159.50171.50−135.52123.40−122.42117.54−73.59−22.59−5.2512.47
Ho67164.93−161.93173.93−137.95125.83−124.85119.97−76.02−25.02−7.6810.04
Er68167.26−164.26176.26−140.28128.16−127.18122.30−78.35−27.35−10.017.71
Tm69168.93−165.93177.93−141.95129.84−128.86123.98−80.03−29.03−11.686.03
Yb70173.04−170.04182.04−146.06133.94−132.96128.08−84.13−33.13−15.791.93

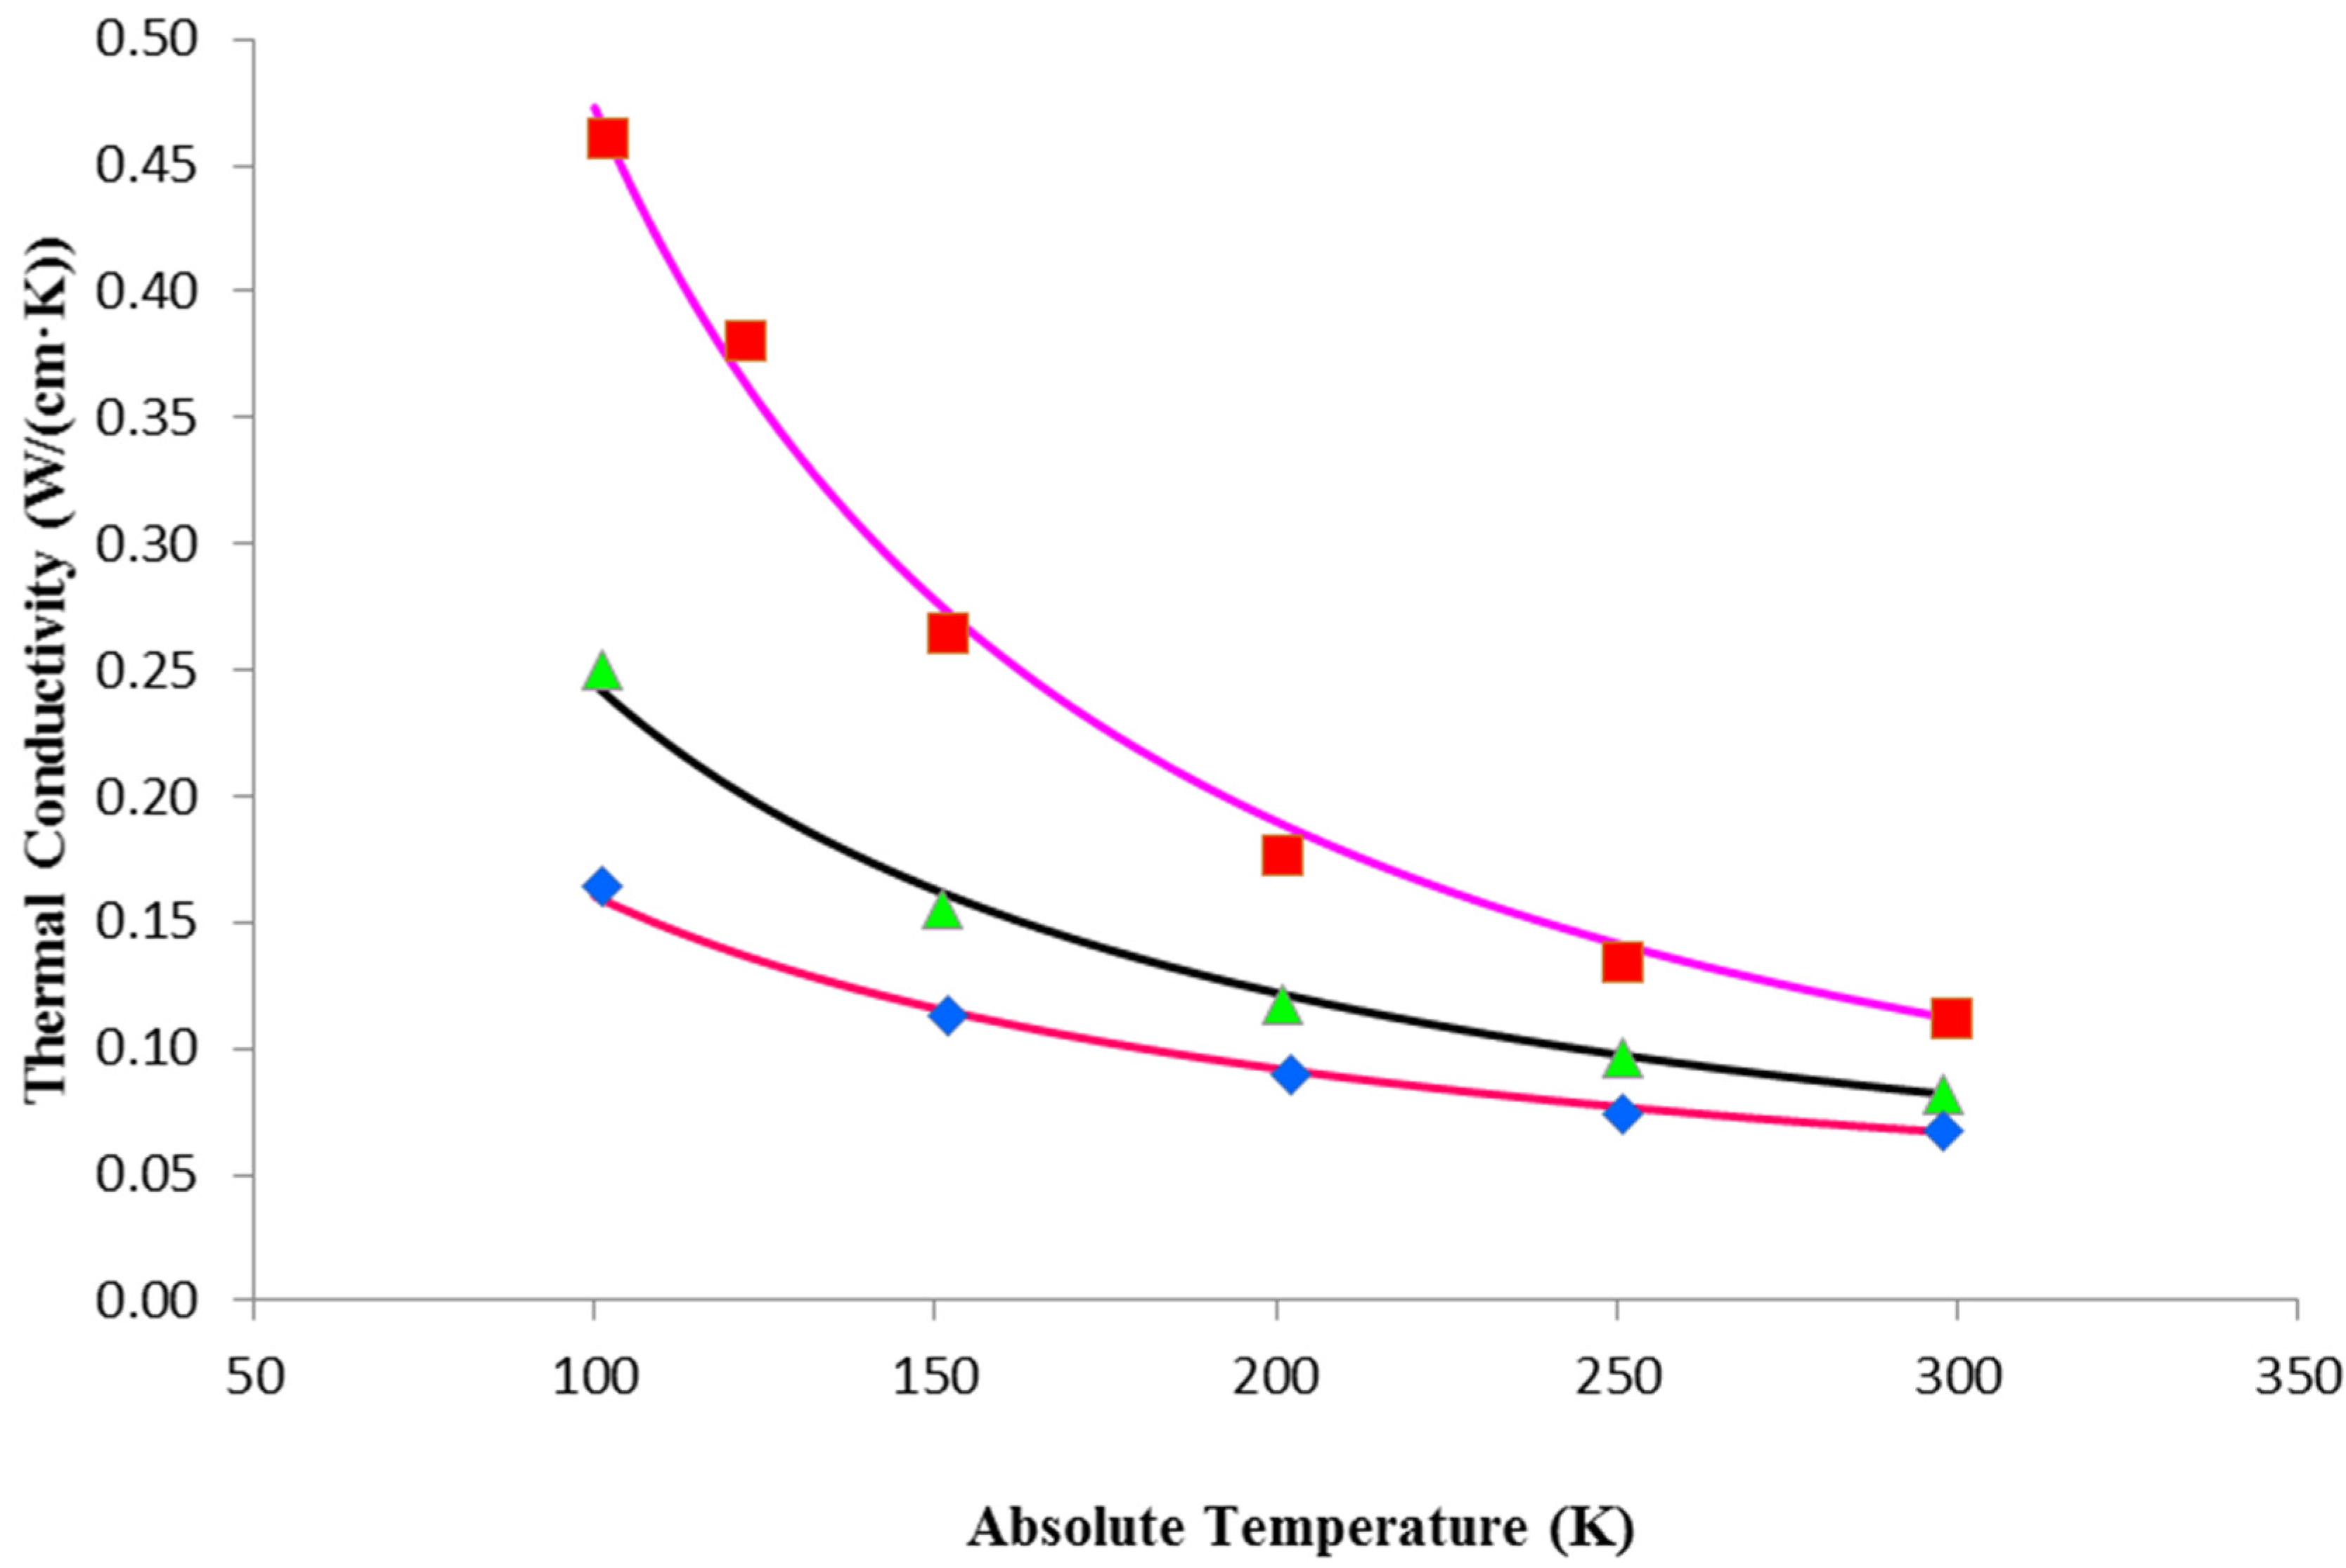
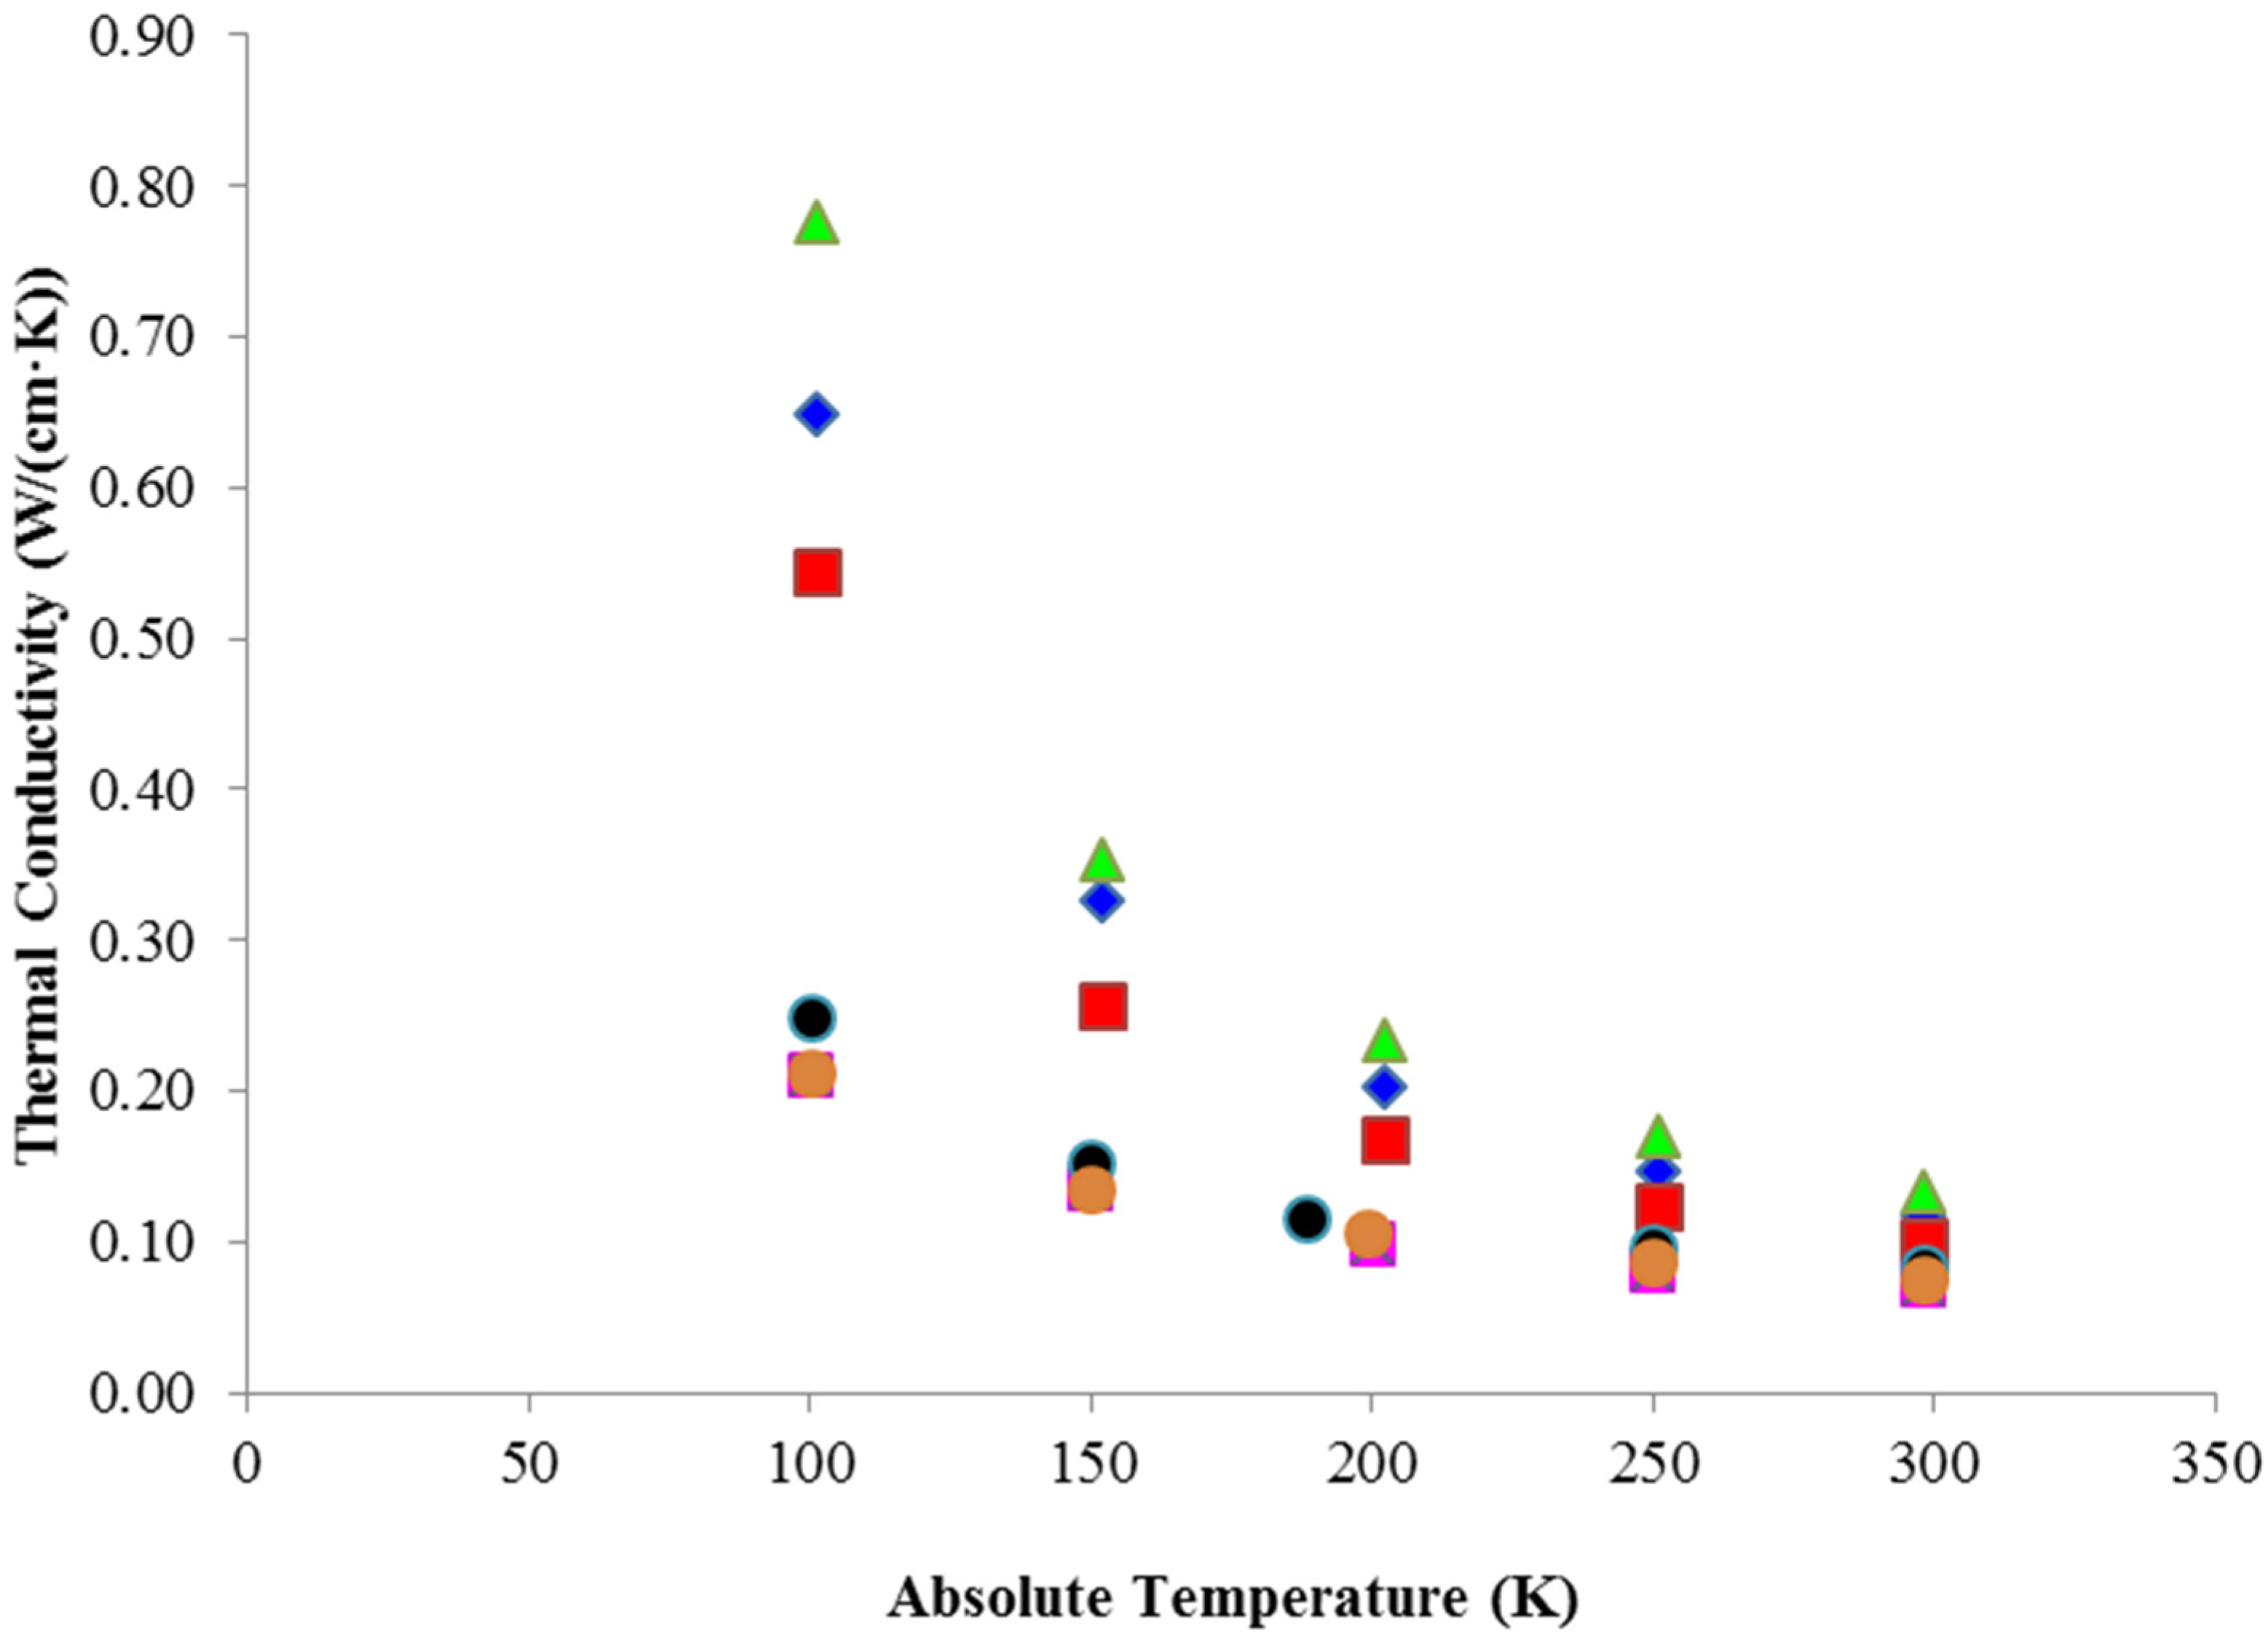
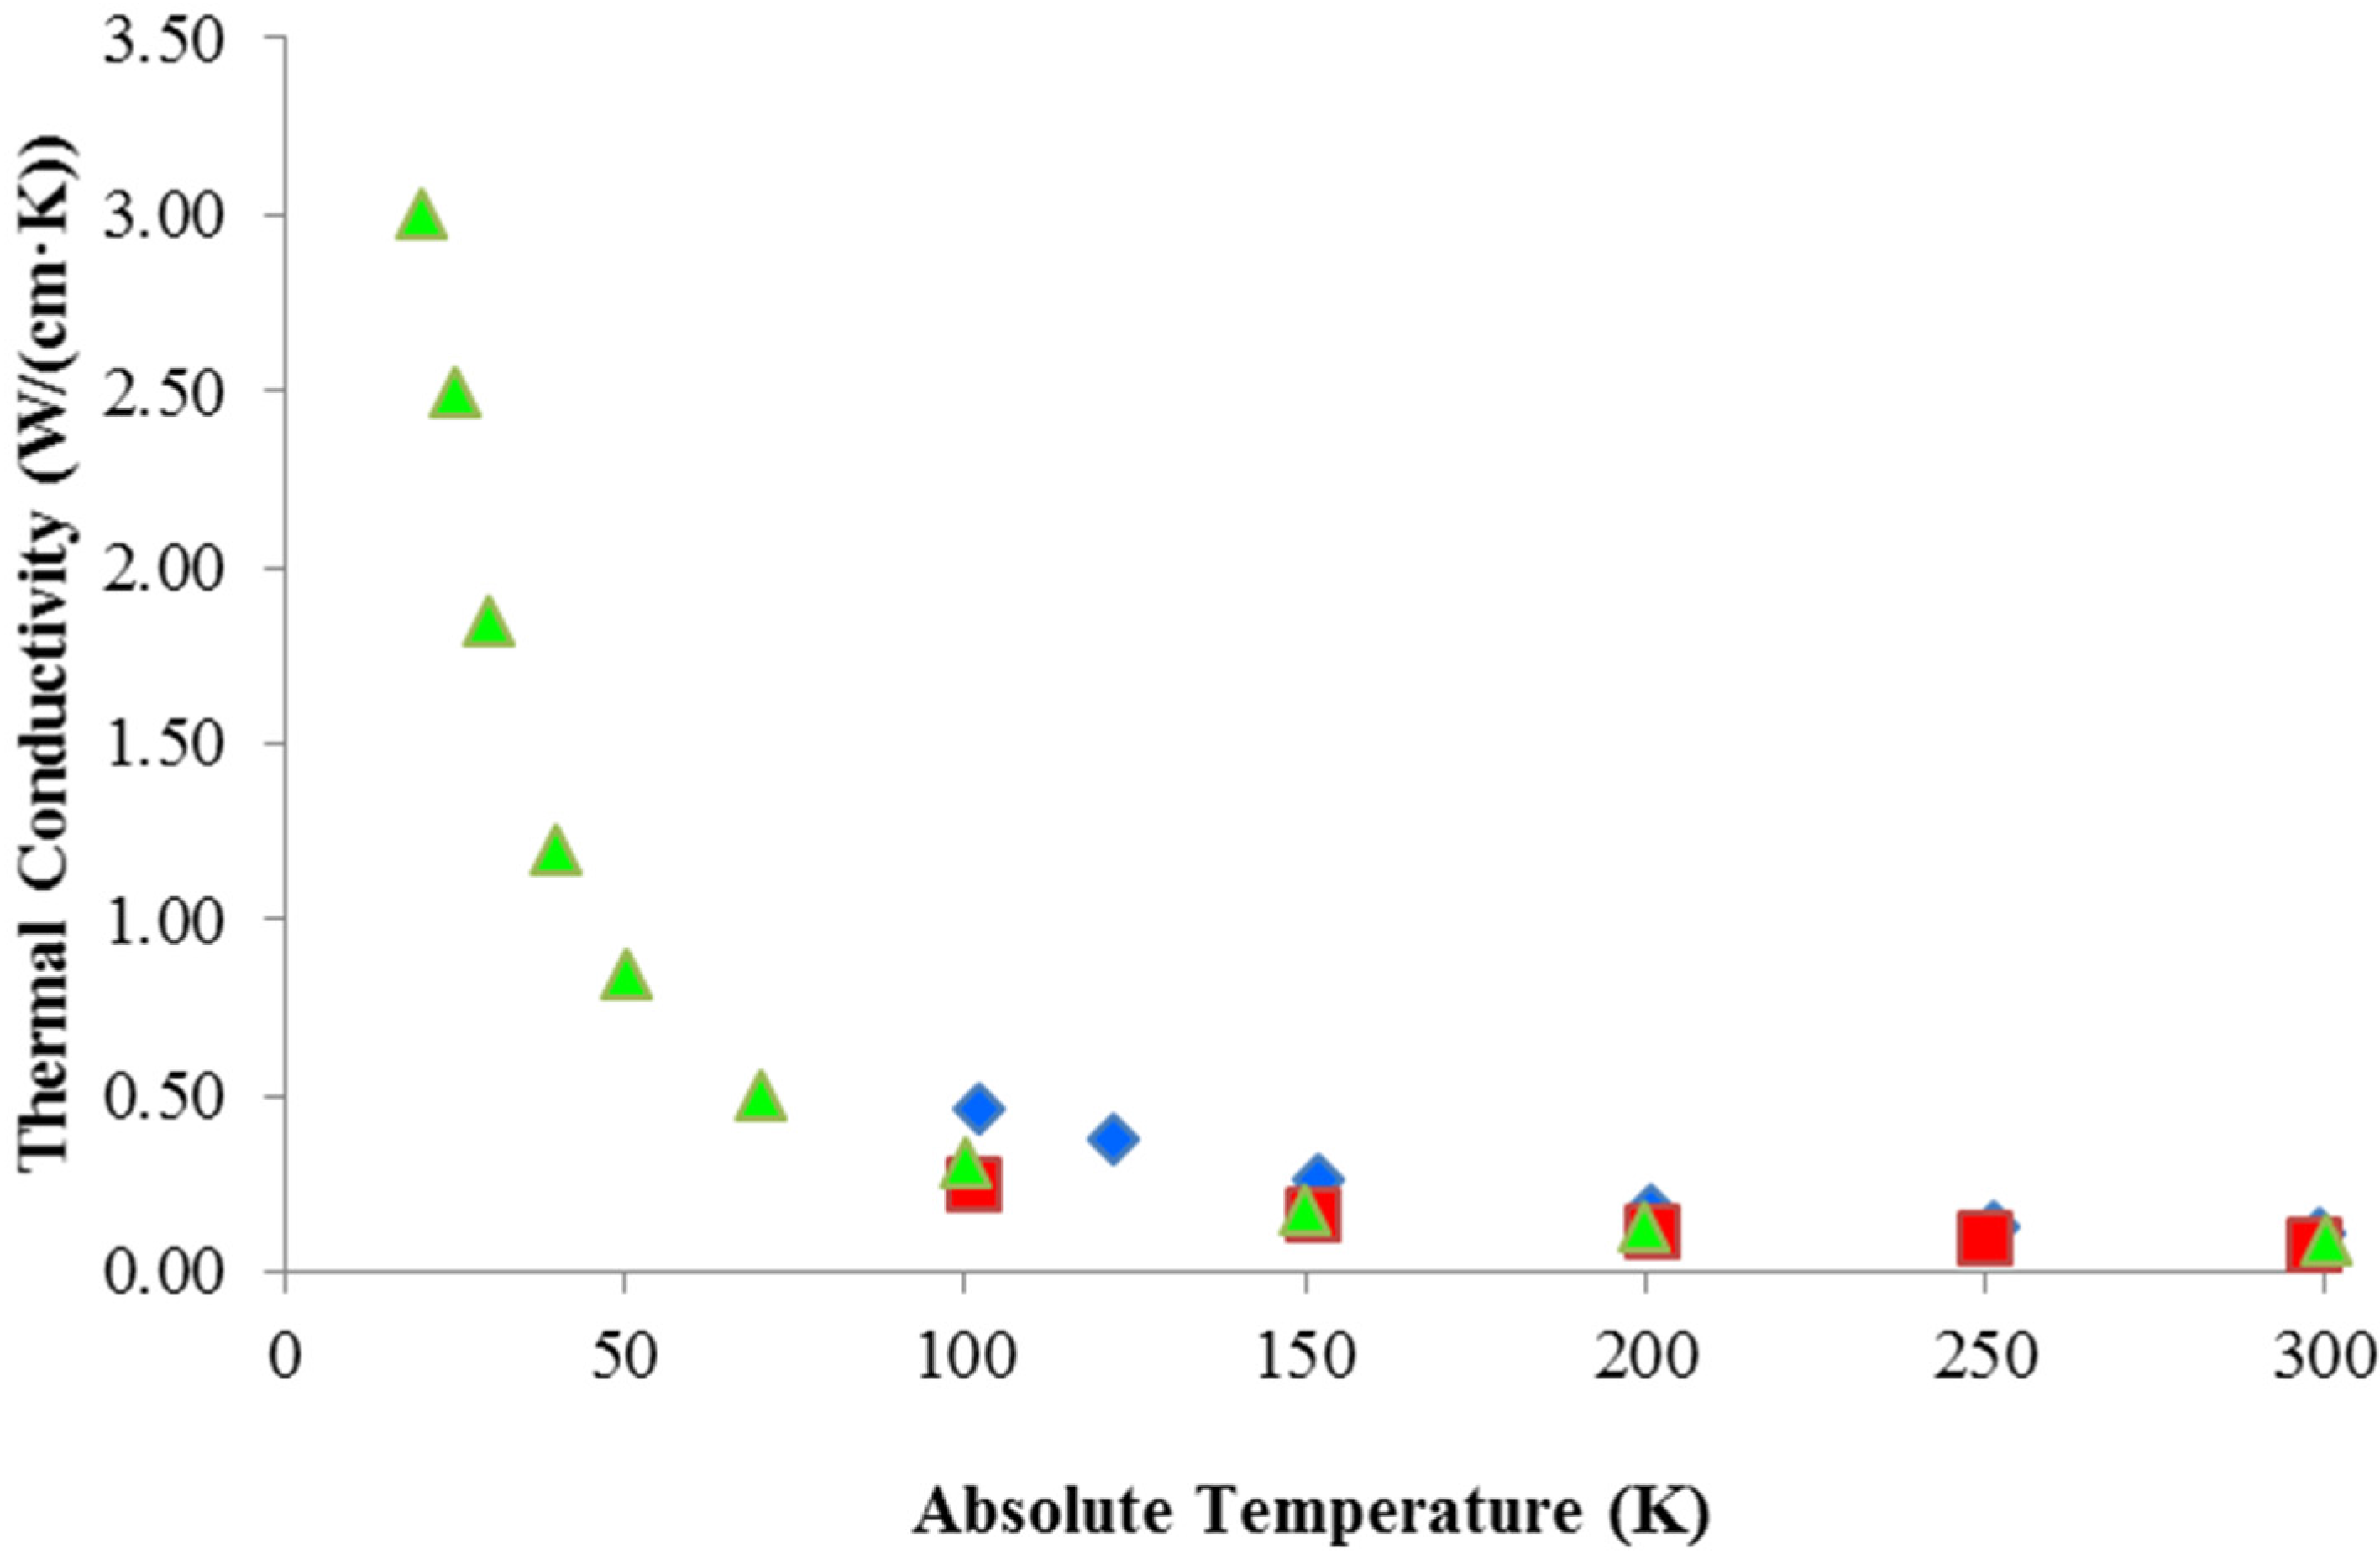
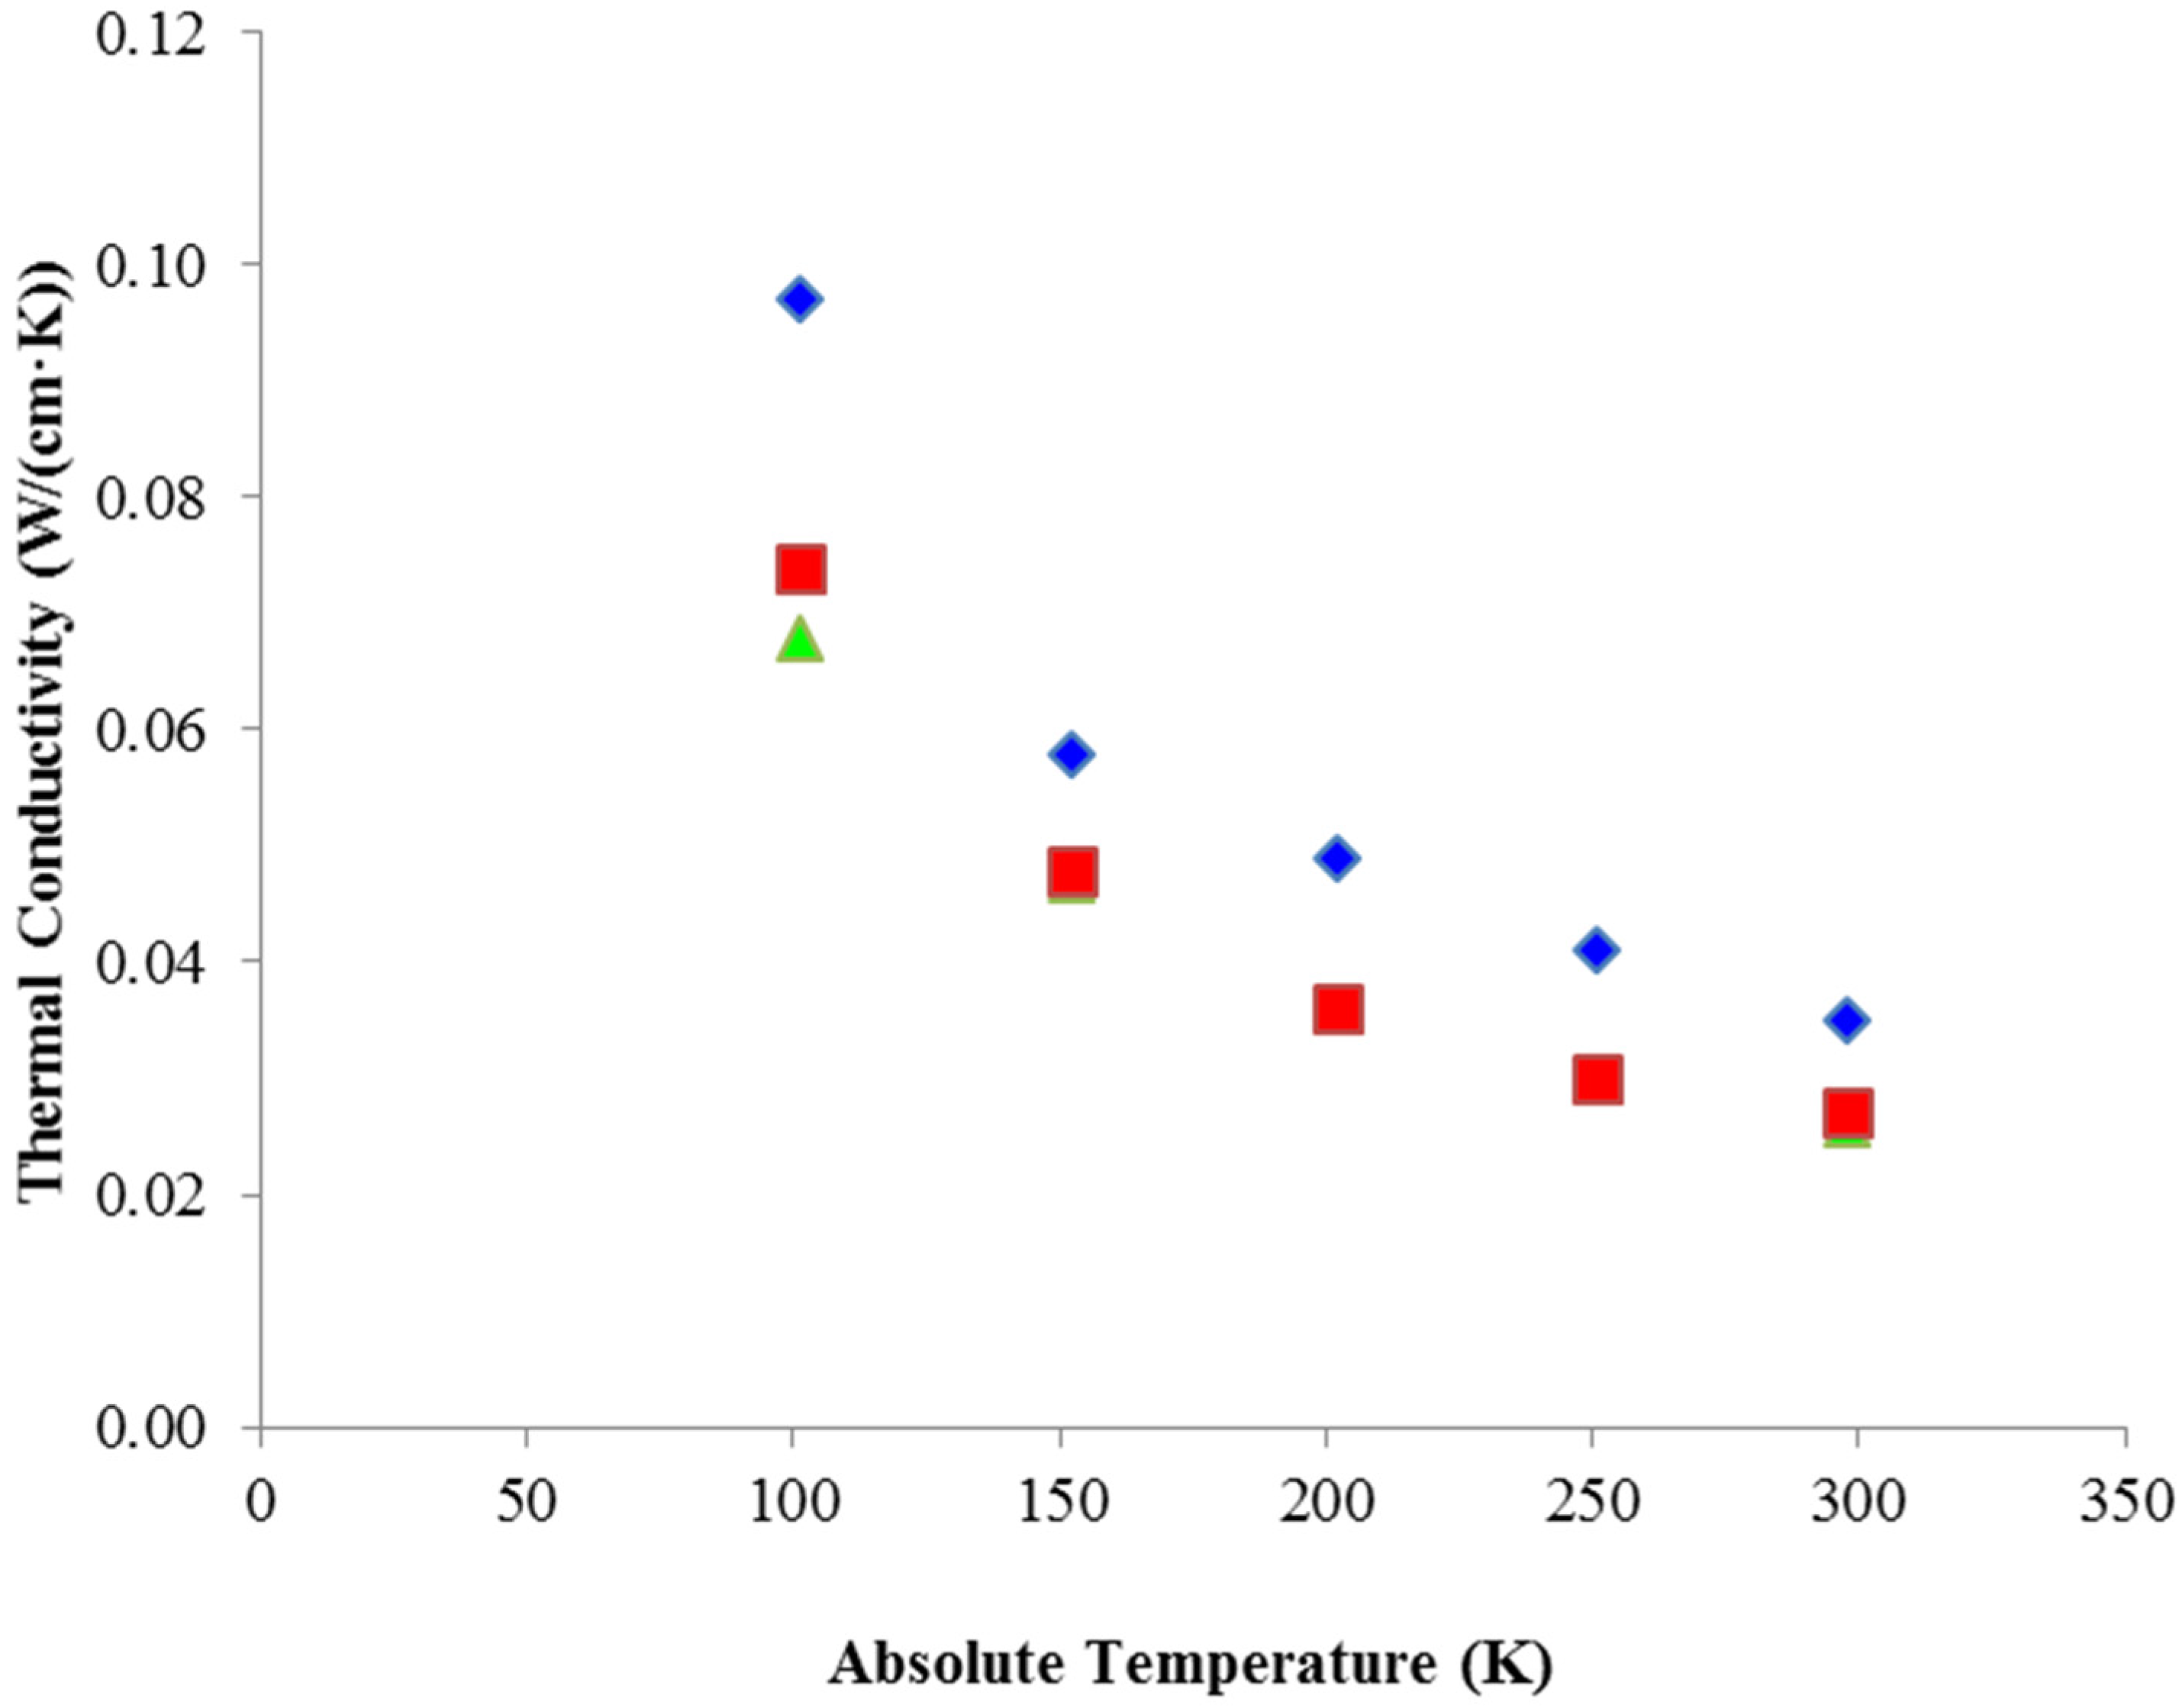
2.2.4. Thermal Conductivity Temperature Dependence

Many thermal conductivity models use the Debye high temperature limit of Equation (33). Since then Cv is independent of temperature, the phonon speed is nearly independent of temperature, and the mean free path is inversely proportional to the temperature T, we find that in the high temperature region
k 2 = k 1 · ( T 1 T 2 ) b
where k 2 is the new thermal conductivity at temperature T 2 relative to thermal conductivity k 1 at temperature T1, and b = 1. This scaling rule is true only for T >> θ D . To test the validity of this rule, we have tried fitting Equation (40) to the undoped and 4 at. % and 15 at. % Yb data of [29]. The results are shown in Figure 7. For undoped YAG we have found that the best fit to the data is b = 1.315, a significant departure from Equation (40) with b = 1. For the 4 at. % Yb data, however, we find b = 1, and for the 15 at. % Yb data, b = 0.8. It is clear from this data that the exponent b in Equation (38) is significantly different than 1, a likely consequence of modeling data in the temperature range of about 100–300 K, whilst using a model that is strictly valid for T >> θ D . The decreased exponent for the doped cases, with b decreasing as doping is increased, is very likely due to the change in the Debye temperature as doping increases. Similar results may be obtained by using an exponential rather than Equation (40) to fit the data.
Figure 7. Thermal conductivity of undoped YAG (red), 4.0 (green) and 15.0 (blue) at. % Yb-doped YAG as a function of absolute temperature. Data are from [29]; also shown are fits to the data showing that the undoped case scales as b = 1.315 (pink), the 4.0 at. % Yb case (black) scales as b = 1, and the 15 at. % Yb case (orange) scales as b = 0.8.
Applsci 06 00023 g007

2.2.5. Modeling Thermal Conductivity

A number of models have been developed to describe the variation in thermal conductivity as dopant concentration increases. One of the most successful is due to Klemens [42]. Other contributions were made by Slack and Oliver [45] and Holland [46]. A similar model was discussed in [47]. We follow the treatment of Klemens [42], who defines two relaxation times τ U and τ D as
1 τ U = B ω 2   ,   1 τ D = A ω 4
The relaxation time τ U is associated with Umklapp anharmonic three-phonon scattering, while τ D is the relaxation time for acoustic phonon scattering from dopants or impurities. The equation for τ D is analagous to the Rayleigh scattering of optical photons, which has the same frequency dependence. The quantity A is a constant that depends on the mass difference between donor and acceptor ions, the unit cell volume, and the phonon speed. A can formally be written
A = a 3 4 π v s 3 · δ
In Equation (42), a is the unit cell lattice parameter, v s the speed of sound in the crystal, and δ is the mass-mismatch variance, given by
δ = i x i [ M i M M ] 2
and M is
M = i x i M i
The quantity x i is the concentration parameter of the donor atoms, and satisfies the inequality 0 x i 1 . B in Equation (39) is a constant that is proportional to the temperature. For Umklapp and dopant scattering together, the effective phonon relaxation time τ e is calculated using Matthiessen’s rule:
1 τ e = 1 τ U + 1 τ D
Substituting in Equation (39), and using Equation (41), we find
k = k B 2 π 2 v s · 0 ω D ω 2 1 τ U + 1 τ D d ω = k B 2 π 2 v s · 0 ω D ω 2 B ω 2 + A ω 4 d ω
We can define a characteristic frequency ω 0 using the condition τ U ( ω 0 ) = τ D ( ω 0 ) where the impurity scattering time constant is equal to the intrinsic Umklapp time constant. This condition can be expressed as, using Equation (41):
1 B ω 0 2 = 1 A ω 0 4
This may be re-arranged to yield
ω 0 = B A  
Equation (46) may be simplified to give
k = k B 2 π 2 v s B · 0 ω D 1 1 + ( A B ) ω 2 d ω
The integral is Equation (49) may be solved analytically, yielding
k = k B ω 0 2 π 2 v s B · t a n 1 ( ω D ω 0 )
We now define the intrinsic thermal conductivity k0 by setting A = 0 in Equation (47), and taking k = k0, the following results:
k 0 = k B ω D 2 π 2 v s B
Dividing Equation (50) by Equation (51), we obtain the result
k = k 0 · ( ω 0 ω D ) · t a n 1 ( ω D ω 0 )
By use of Equation (39) and with B being proportional to the temperature T, we can use Equation (48) to get
ω 0 = K T δ  
where K is a proportionality constant. We then define a constant ξ as
ξ = ω D K
so that ω 0 / ω D is expressed as
ω 0 ω D = 1 ξ T δ
Substituting Equation (55) into Equation (52) gives the final result:
k = k 0 · ( 1 ξ T δ ) · t a n 1 ( ξ δ T )
Knowing k 0 , T, and δ, we can now calculate the thermal conductivity using ξ as a fitting constant. Turning our attention to the binary laser crystal system YAG and YbAG, we can use Vegard’s Law for solid solution to write the intrinsic thermal conductivity as
k 0 = k 0 Y ( 1 x ) + k 0 Yb x
whereas before x is the concentration parameter for Yb, and k 0 Y and k 0 Yb are the zero-doping intrinsic thermal conductivities of YAG and YbAG respectively.
To obtain k as a function of Yb doping density, at any temperature, we then use the following relationship:
k = [ k 0 Y ( 1 x ) + k 0 Y b x ] · ( 1 ξ T δ ) · t a n 1 ( ξ δ T )
This model has been previously discussed in the Dissertations of Klopp and Fredrich-Thornton [48,49].
At a temperature of 300 K, and using the intrinsic thermal conductivities of YAG and YbAG, 0.111 W/(cm·K) and 0.070 W/(cm·K), we obtained the results shown in Figure 8, where the thermal conductivity is displayed as a function of x, using the value ξ = 100, that visually best fits the experimental data, obtained from the summary provided in [49]. To simplify the presentation, we averaged the many values of [49] for YAG (x = 0). Undoubtedly, a nonlinear least squares fit of Equation (56) to the experimental data would allow a more accurate determination of ξ, however, for reasons discussed in the next paragraph we have reservations as to the wisdom of such an undertaking.
Figure 8. Thermal conductivity calculated using the Klemens model [42] as a function of concentration parameter x for the binary solid solution YAG-YbAG. Data points are taken from the comprehensive summary found in [49].
Applsci 06 00023 g008
While this model qualitatively explains the concentration dependence of k, and of course because of Equation (57) duplicates the two end point thermal conductivities for YAG and LuAG, it is very likely that the appearance of accurately fitting the experimental data is illusory, because such a curve requires more than one constant to be theoretically duplicated. Another aspect of the Klemens model that is disquieting is that it treats the case where Y acoustic phonons are scattered as Yb ions are doped into the crystal, where the Yb concentration varies from 0%–100%, but ignores the reciprocal scattering of Yb ions from Y ions when Y is substituted into YbAG. Also, it is clear that beyond a Yb doping concentration of 50%, the crystal is predominantly YbAG rather than YAG. It should also be pointed out that YAG and YbAG have significantly different Debye temperatures of 760 and 575 K respectively [40]. Because of the interaction between the two crystal lattices, it is unlikely that a Vegard’s law linear relationship exists that can be used to estimate the values of the Debye temperature for x values in the range 0 < x < 1 . The Klemens model uses only a single Debye temperature to describe the entire range of dopings, and for simplicity makes the assumption that one is operating at the high temperature limit where T θ D , well beyond the region of interest for room temperature and cryogenic lasers. We will discuss progress towards an alternative model in the following section.

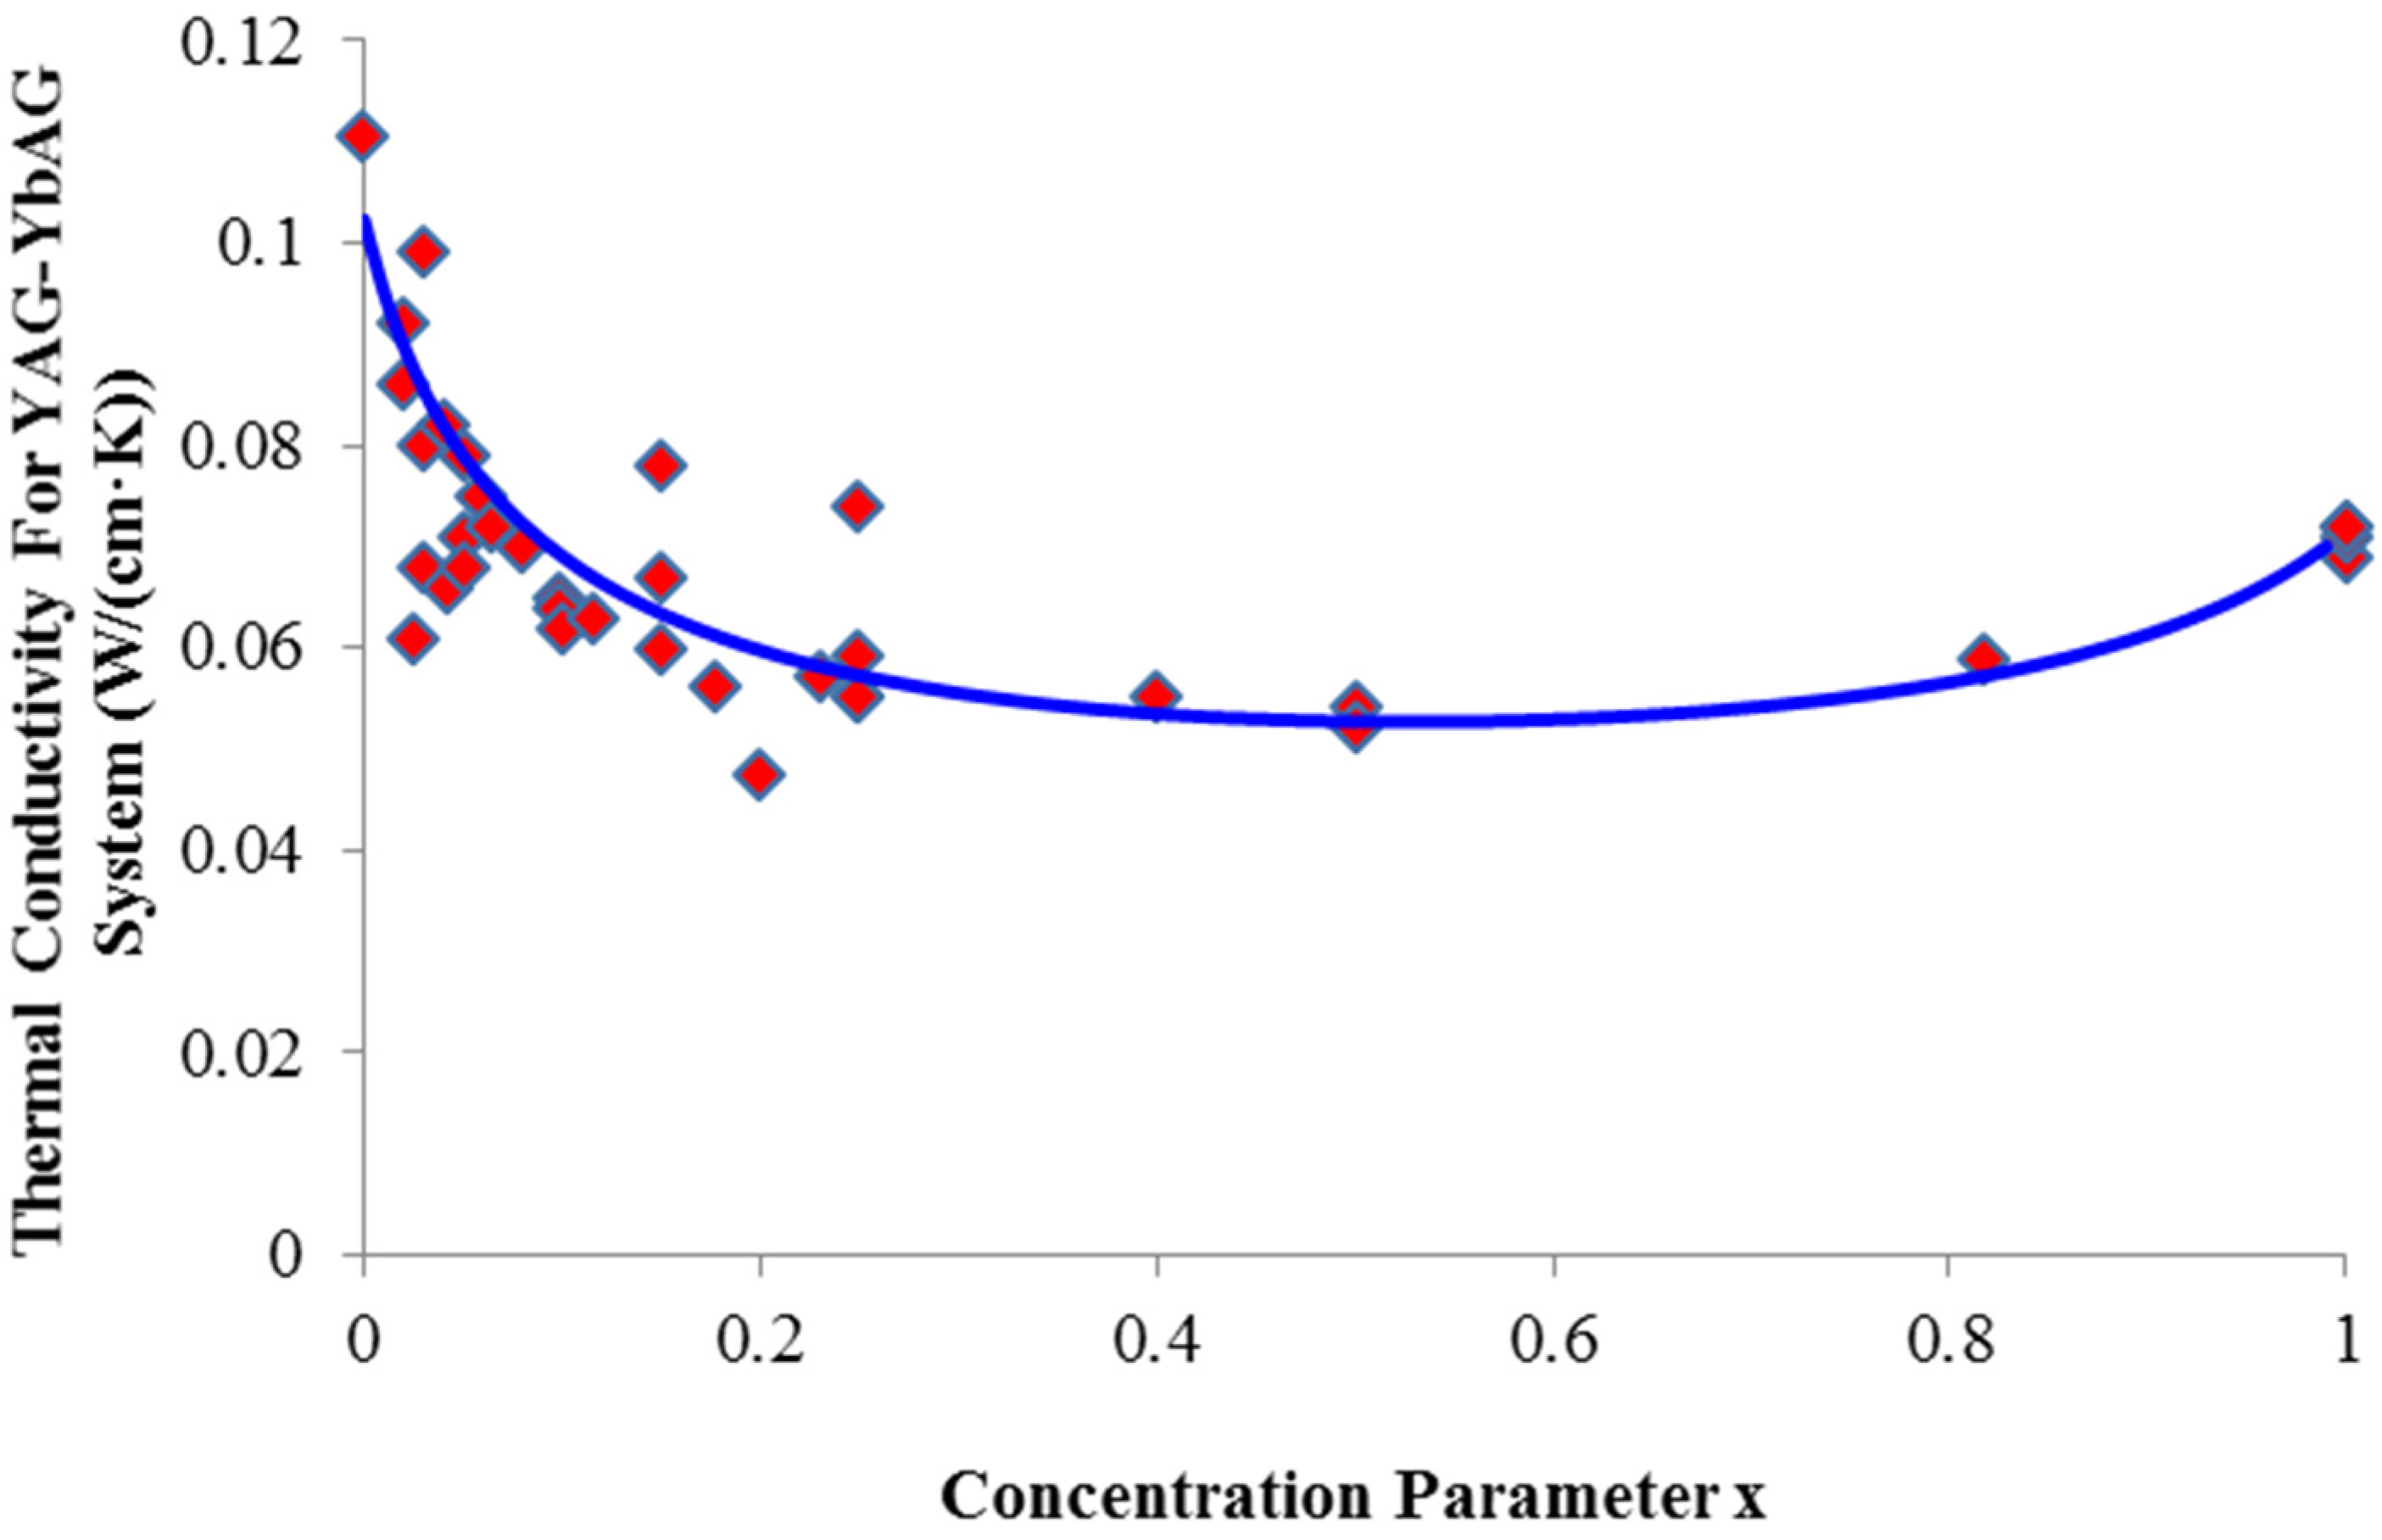
2.2.6. Extended Thermal Conductivity Model

Using the formalism shown in Section 2.2.5, we have developed an alternative model that splits the thermal conductivity into two components, kY(x) and kYb(x) whose properties are somewhat more physical, is symmetric with respect to the interchange of Y and Yb, and that has the reasonable boundary conditions that as x → 0, kYb(x) → 0, and for x → 1, kY(x) → 0. The thermal conductivity for any value of the doping parameter x can then be written as the equations
k = ( 1 x ) k Y + x k Yb
and
k ( x ) = ( 1 x ) · ( k o Y ξ Y ) · T δ Y · tan 1 ( ξ Y · δ Y T ) + x · ( k o Y b ξ Y b ) · T δ Y b · tan 1 ( ξ Y b · δ Y b T )
These equations satisfy the aforementioned boundary conditions, are symmetric upon the interchange of Y and Yb, and are physically reasonable since now a crystal may be viewed as a solid solution of two separate scattering materials rather than a single crystal with impurity doping added, and there are now two constants ξ Y and ξ Y b that may be adjusted to fit the experimental data. The quantities k oY and k oYb are the experimental values of the thermal conductivity of YAG and YbAG. The mass scattering terms δ Y and δ Y b are now given by the expressions
δ Y = ( 1 x ) · [ ( M Y M ) M ] 2 ;   δ Y b = x · [ ( M Y b M ) M ] 2
where M is given by Equation (44), and M Y and M Yb are the atomic masses of Y and Yb respectively.
In Figure 9, we shown a fit to the experimental data summarized in [49]. The thermal conductivity k Y goes to 0 for x = 1 and for x = 0, k Yb   = 0, as expected. The minimum appears to be closer to x = 0.35 than to x = 0.5 as found in the previous plot, Figure 8, but without a better more consistent data set, it is difficult to ascertain exactly where it is with any accuracy. The position of the minimum is determined by how quickly the thermal conductivities decrease as a function of x. The equality of the two thermal conductivities occurs at x = 0.4.
Figure 9. Thermal conductivities k Y (blue), k Yb   (red), and k (green) calculated using our model as a function of concentration parameter x for the binary solid solution YAG-YbAG. Data points are taken from the comprehensive summary found in [49]. Constants used in this plot are ξ Y = 300 and ξ Yb   = 50.
Applsci 06 00023 g009
This new model seems to offer more flexibility with regard to fitting experimental data, however we view this as only a first step in developing a more comprehensive model that can be used to predict in advance the thermal conductivities of arbitrary laser crystals. Because the Klemens model that we started with is only valid for T >> θ D , a reasonable next step is to combine the approach described here with Equation (36), and to solve for the thermal conductivity without approximation, using numerical methods.

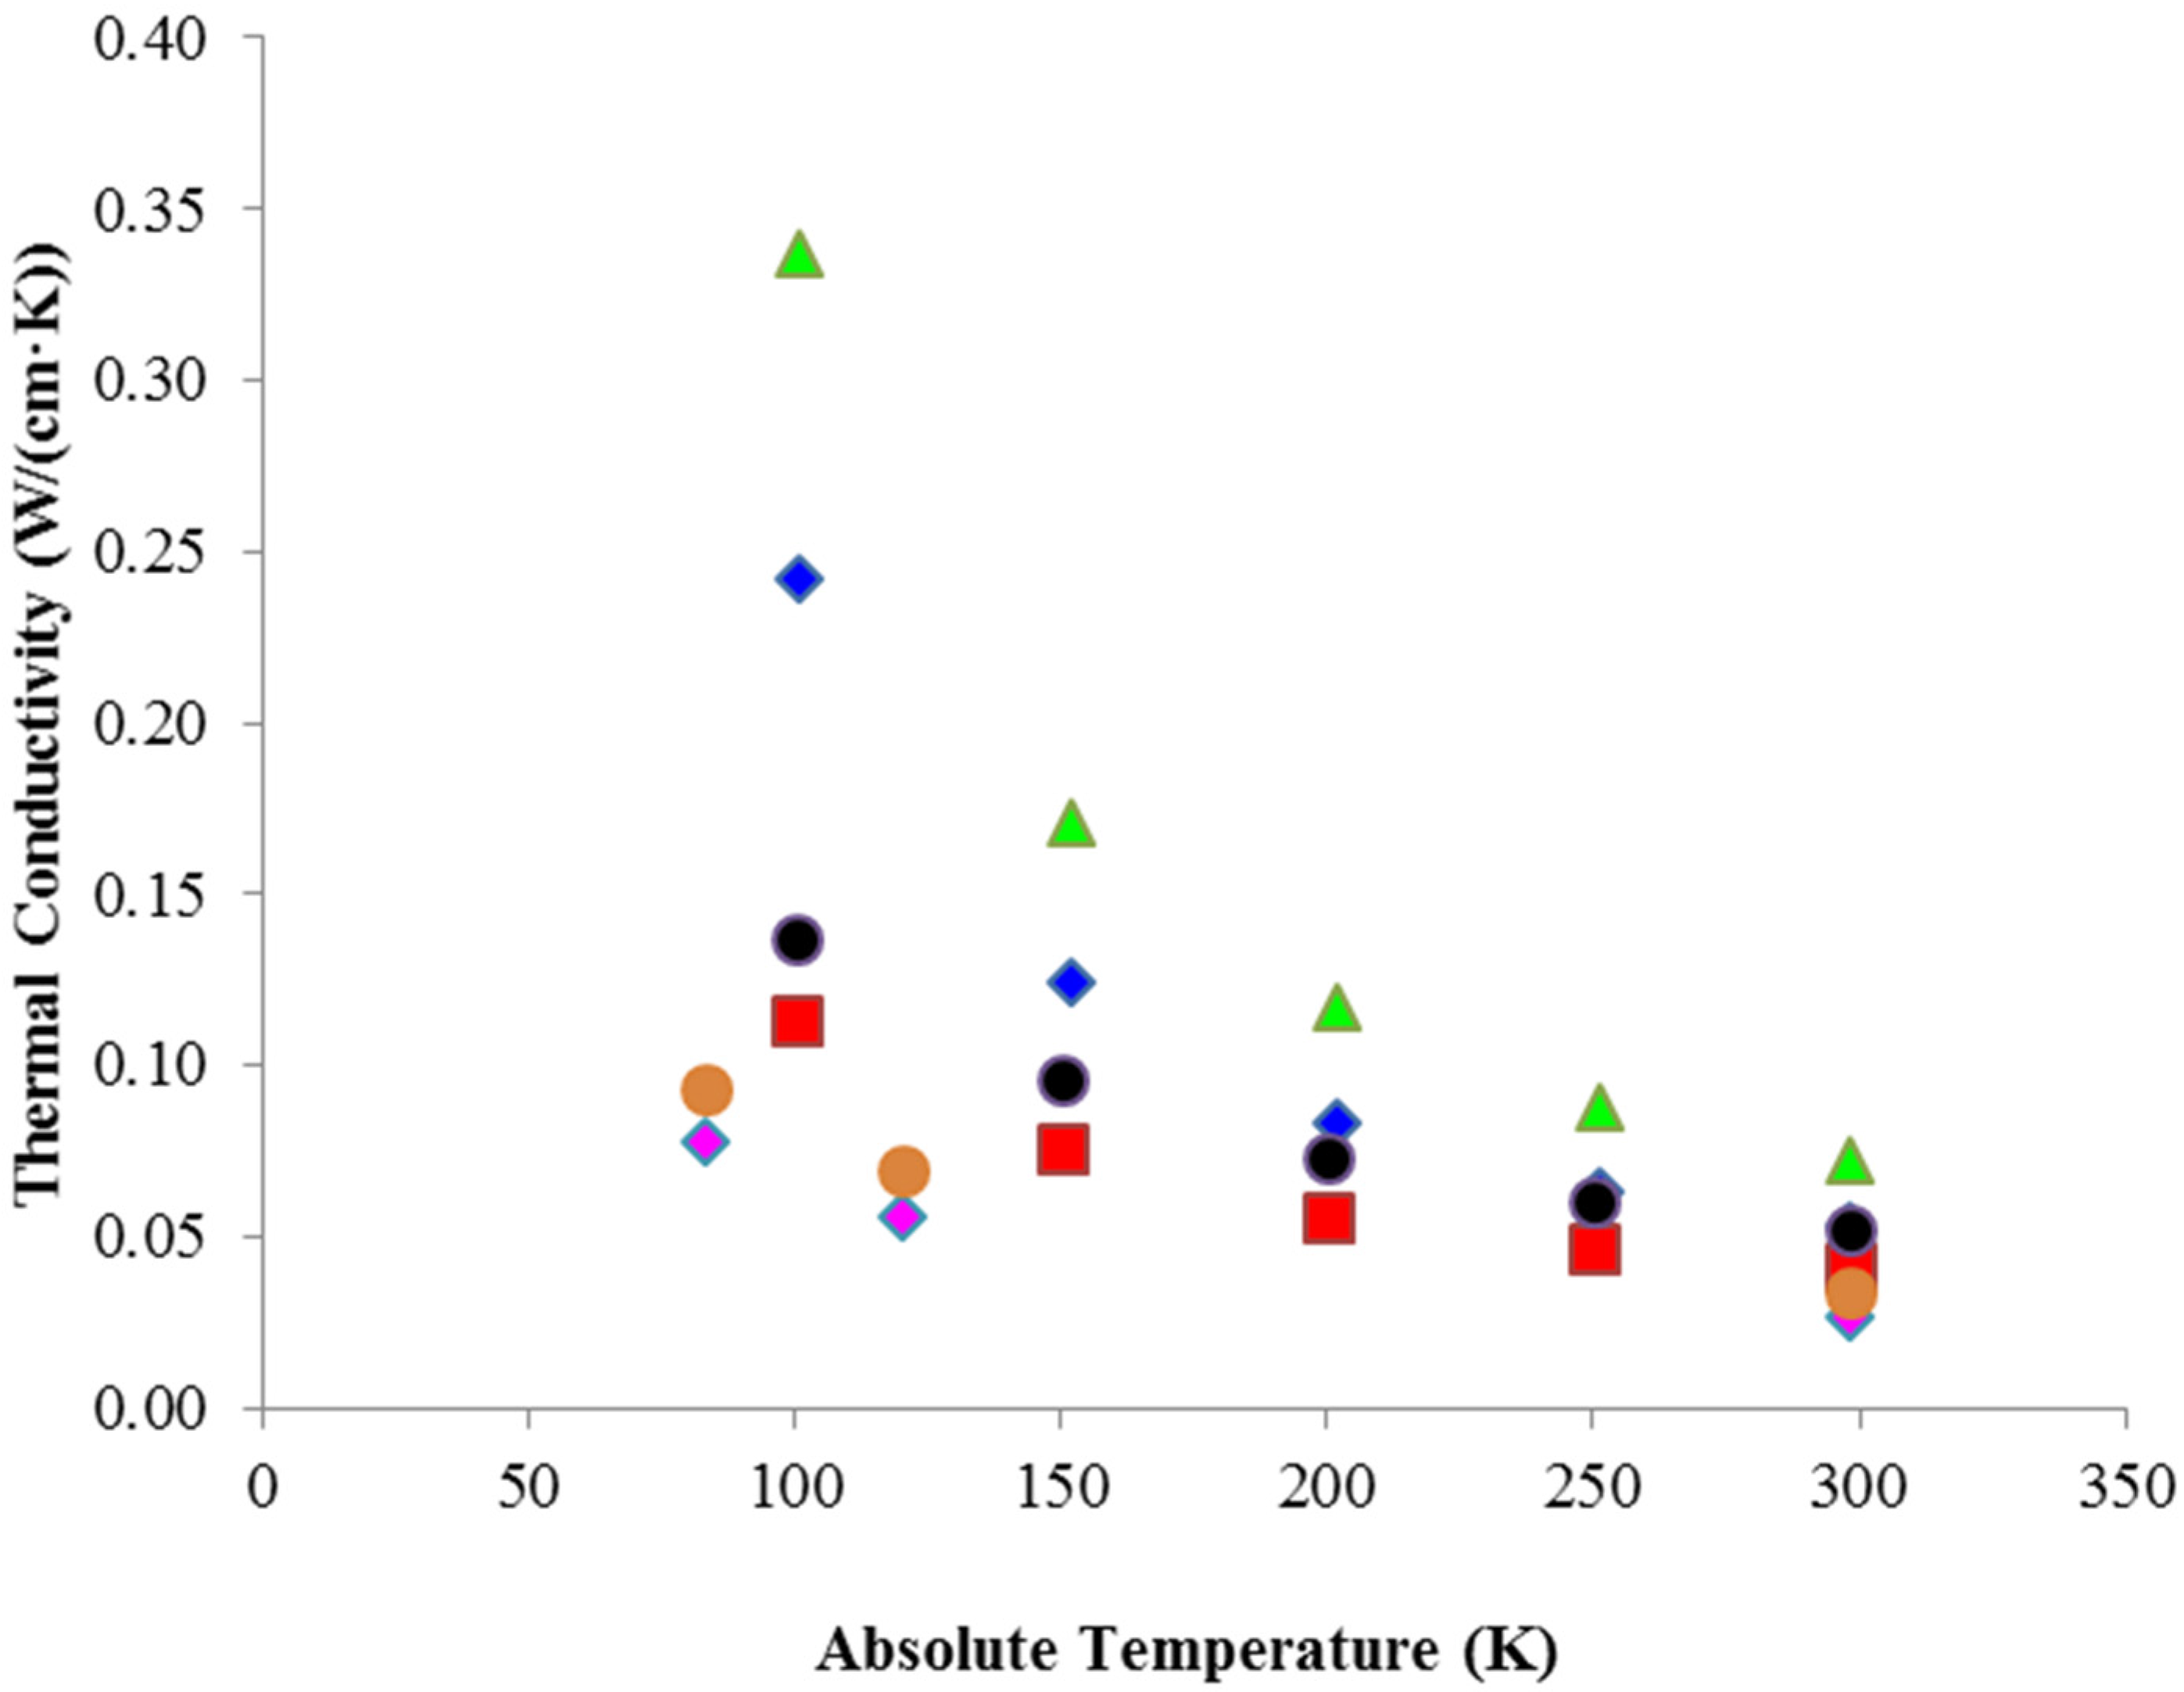
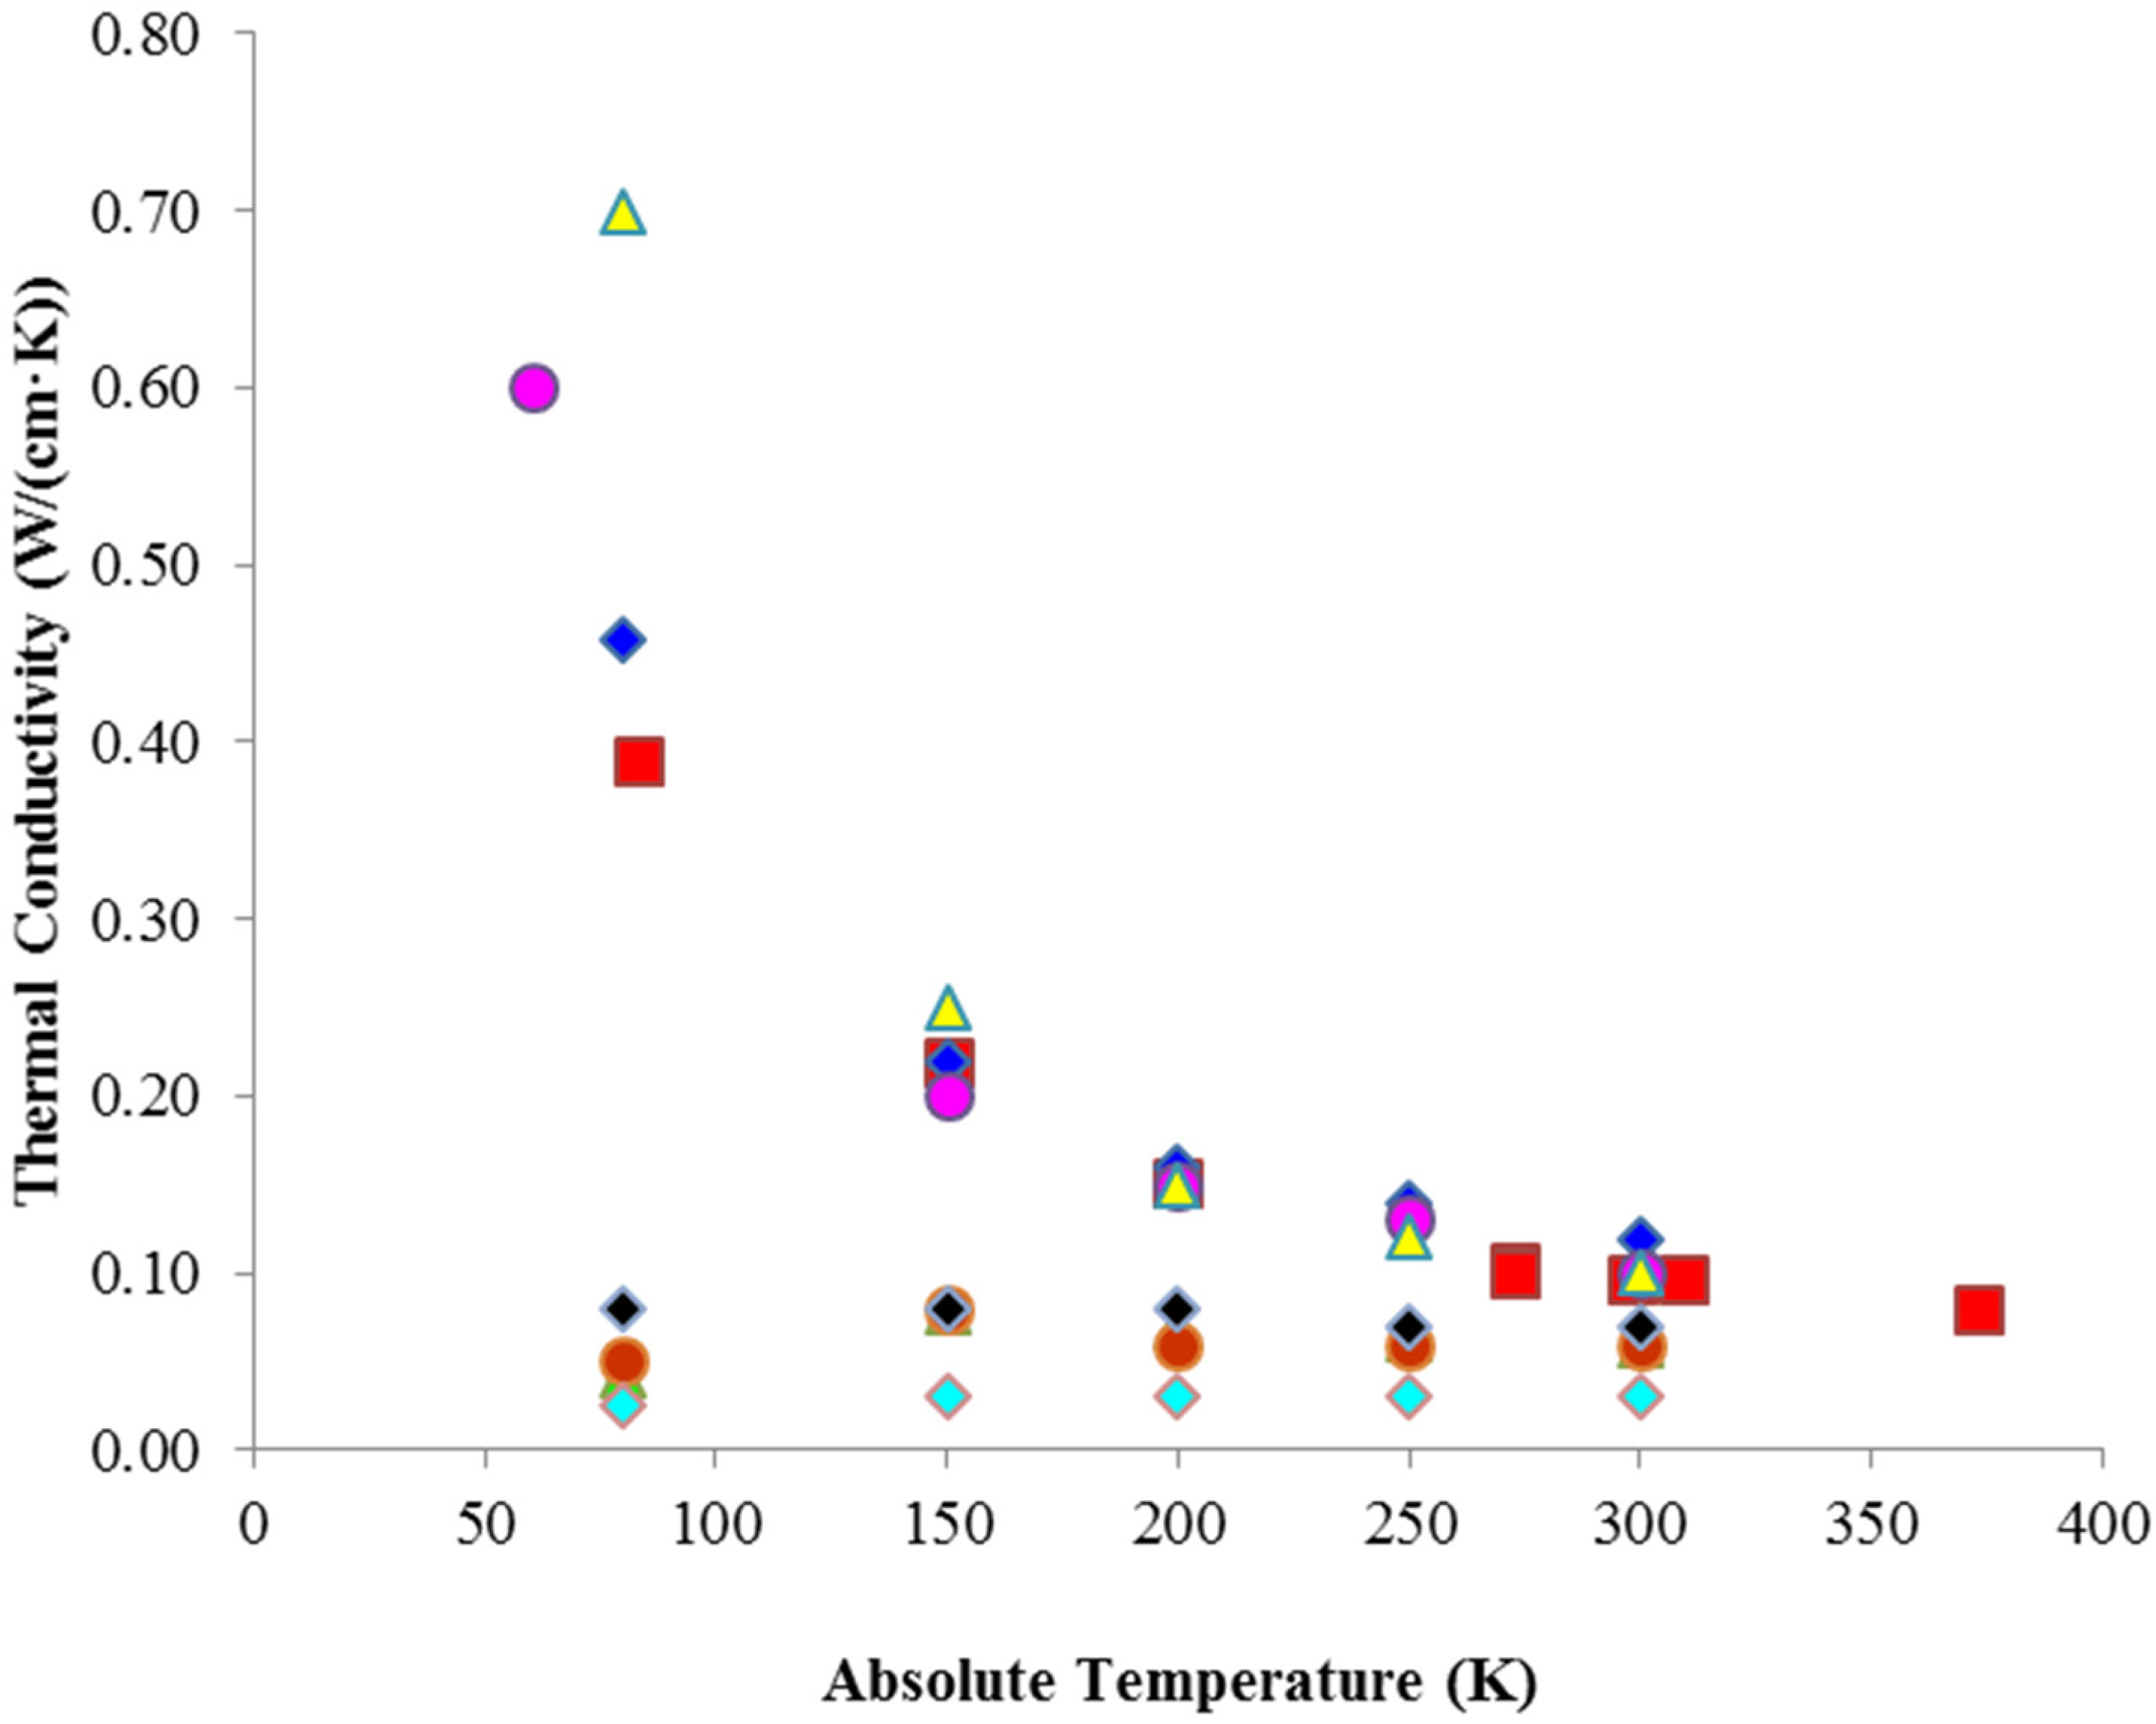
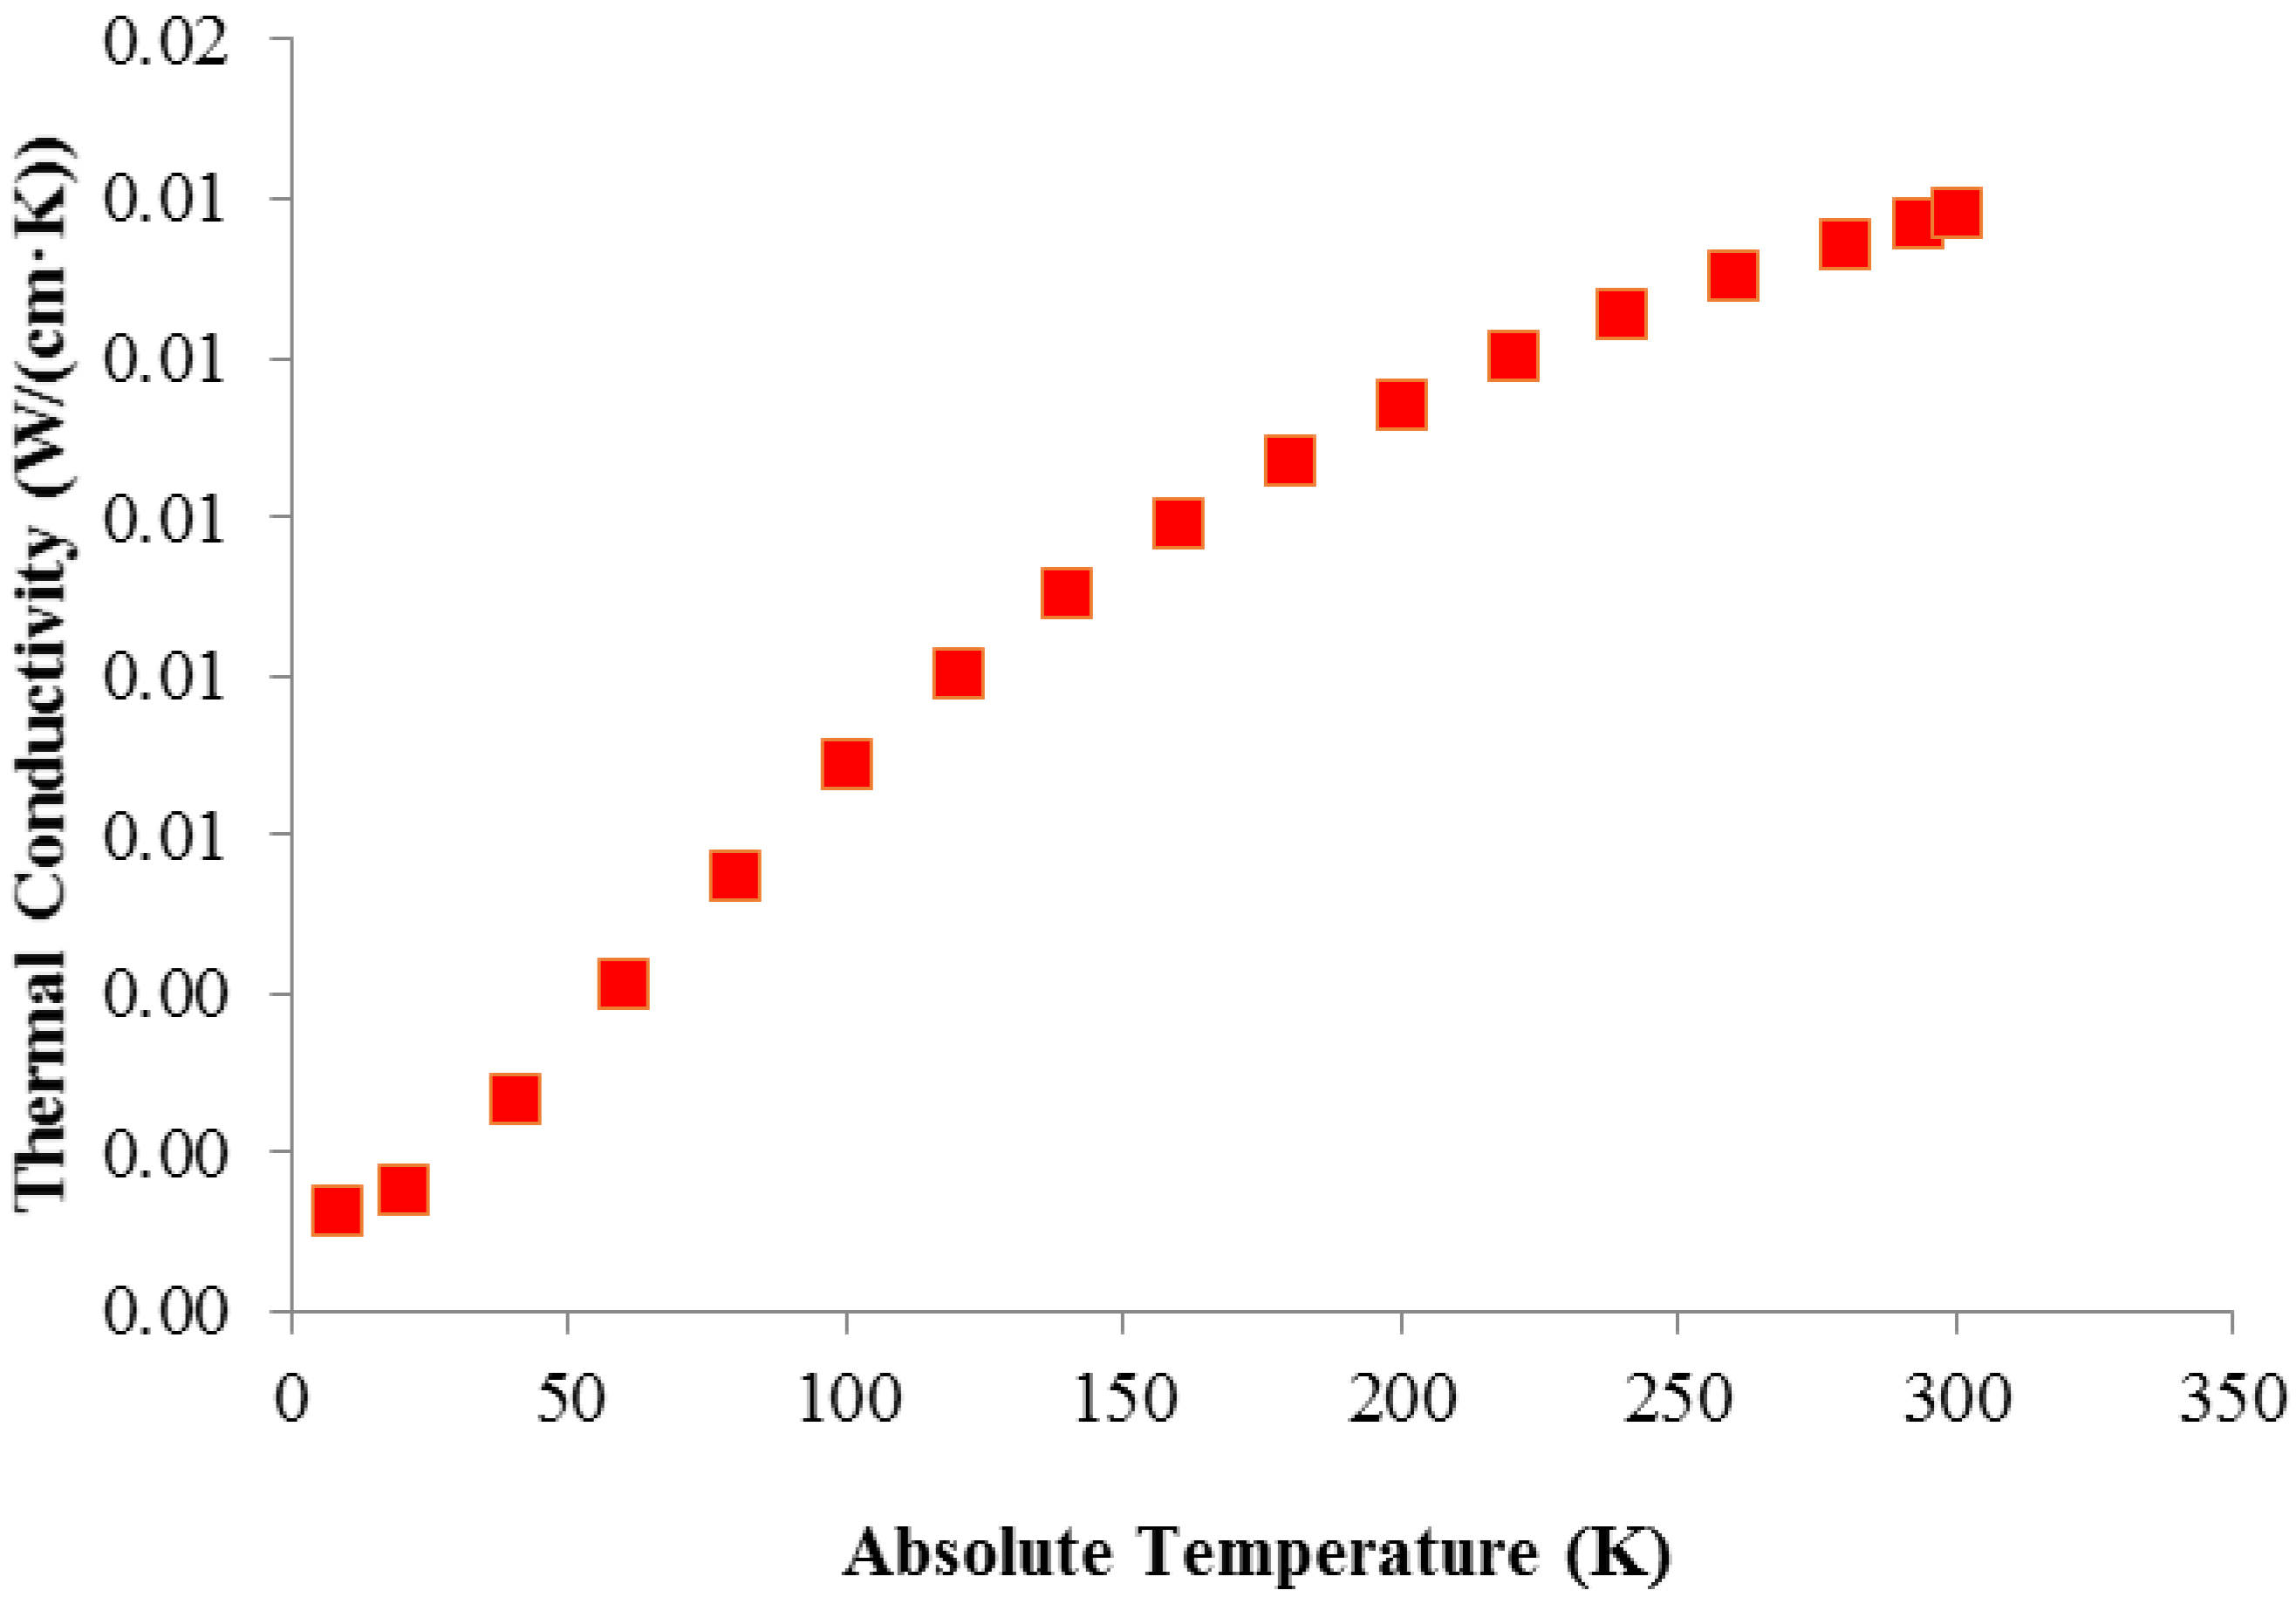
2.2.7. Other Reported Thermal Conductivity Measurements Including Commonly Used Ancillary Materials

Since our 2005 paper [2], the measurement of thermal conductivity values has accelerated, with most common laser materials being tabulated. In this section, we show plots of most of the data reported in the literature for single-crystal growth. Measurements for ceramic laser materials have not been included due to their well-known dependence on pore size. We showed previously (Figure 4) the thermal conductivity of YAG and Yb-doped YAG as a function of temperature and doping density (Figure 4), and for a number of undoped and Yb-doped sesquioxide laser materials (Figure 5 and Figure 6). Here we show similar plots for many other laser materials. We start with the biaxial laser material YALO (YAlO3), where Figure 10 shows thermal conductivity as a function of absolute temperature for undoped and 5 at. % Yb doped cases. Measurements of k were performed for the a, b, and c crystal axes [29]. Due to the moderate mass mismatch between Yb and Y (Table 1), the k values for 5 at. % Yb doping are significantly less than the undoped values. Figure 11 shows k values for undoped YAG and LuAG [3,29,45], whilst Figure 12 plots the thermal conductivities of YAG and LuAG as a function of Yb doping density [50] and for undoped and Tm-doped Lu2O3 [51]. These data show that for less than about 4 at. % Yb Yb:YAG is superior while for greater than 4 at. % Yb:LuAG is the better choice. The small change in k for Yb:LuAG as doping density increases is due to the very small mass mismatch between Yb and Lu. Similarly, for Tm:Lu2O3, the mass mismatch between Tm and Lu is very small, and the thermal conductivity decreases very slowly with Tm concentration. Figure 13 plots k as a function of absolute temperature for the uniaxial laser material YLF, for undoped and 5 at. % and 25 at. % doped Yb cases [29,30]. The large drop in k for 5 and 25 at. % Yb dopings is a consequence of the moderate mass mismatch between Yb and Y. Figure 14 shows k for the recently developed undoped biaxial laser materials BYW, KGW, and KYW [29]. In Figure 15 we show the thermal conductivity of the important uniaxial ultrafast laser material CaF2, for undoped, 1 at. %, 3 at. % and 5 at. %, obtained from a number of sources [44,52,53,54]. It is important to point out that the very rapid drop in k for increased Yb doping density is partially due to the very large mass mismatch between Ca and Yb (see Table 1). According to [54], between about 1–3 at. % Yb doping, where k is almost flat from 100–300 K, larger dopings drive the crystal structure towards clustering and increasingly glasslike behavior, resulting in k values that decrease with decreasing temperature, rather than the increase in k which we have seen is almost a universal phenomenon with pure crystalline materials. This type of behavior is also displayed by laser glasses, and other important optical materials often used in ultrafast laser systems. One reviewer of this paper has pointed out that mass-mismatch may play the lesser role in this case. Figure 16 for example, shows the thermal conductivity of fused silica (SiO2) [55], an anaxial optical material, as a function of temperature. It displays a monotonic decrease in k as temperature is lowered, as expected due to a locally disordered crystal structure that severely limits the phonon mean free path. In Figure 17 the thermal conductivity values for the GdVO4 c and a axes, the YSO b-axis, and for GSAG are shown as a function of absolute temperature [3,30].
Figure 10. Thermal conductivity as a function of absolute temperature for the biaxial laser material YALO for undoped a (blue), b (red), and c (green) axes and 5 at. % Yb doped a (pink), b (black), and c (orange) axes [29].
Applsci 06 00023 g010
Figure 11. Thermal conductivity as a function of absolute temperature of the undoped anaxial laser materials LuAG (green) [45], YAG (blue) [3,29] and LuAG (red) [29].
Applsci 06 00023 g011
Figure 12. Thermal conductivity of the anaxial laser materials Yb:YAG (blue) [50], Yb:LuAG (red) [50], and Tm:Lu2O3 (green) as a function of Yb doping concentration at room temperature [51].
Applsci 06 00023 g012
Figure 13. Thermal conductivity as a function of absolute temperature of the uniaxial laser material YLF for undoped, a (blue) and c axes (green), 5 at. % doped, a (red) and c (black) axes, and 25 at. % doped a (pink) and c axes (orange) [29,30].
Applsci 06 00023 g013
Figure 14. Thermal conductivity as a function of absolute temperature for the undoped biaxial laser materials BYW (blue), KGW (green), and KYW (red) along the b-axes [29].
Applsci 06 00023 g014
Figure 15. Thermal conductivity as a function of absolute temperature of the anaxial laser material CaF2, for undoped (red [52], blue [53], pink [45], yellow [54]), 1 (black [54]), 3 (orange [53], light blue [54]) and 5 (green [54]) at. % doped Yb cases.
Applsci 06 00023 g015
Figure 16. Thermal conductivity as a function of absolute temperature for the anaxial optical material SiO2 [55].
Applsci 06 00023 g016
Figure 17. Thermal conductivity as a function of absolute temperature for the a (red [3]) and c (blue [3]) axes of the undoped uniaxial material GdVO4, the b-axis (green) of the biaxial material YSO [30], and the anaxial material GSAG (pink) [30].
Applsci 06 00023 g017
In cryogenic laser systems the thermal conductivity of optical materials and metals used to construct pump chambers can be very important. For convenience, in Figure 18 and Figure 19 we have plotted the thermal conductivities for the uniaxial optical material and laser material sapphire (Al2O3) and for anaxial Type II a diamond, and for elemental copper, titanium, molybdenum, and aluminum respectively, as a function of absolute temperature.
Figure 18. Thermal conductivity as a function of absolute temperature for the uniaxial optical material Al2O3 a (blue [55]) and c (green [56]) axes and for Type II a isotropic diamond (red) [56].
Applsci 06 00023 g018
Figure 19. Thermal conductivity as a function of absolute temperature for the elemental metals copper (red [56]), titanium (green [56]), molybdenum (black [57]), and aluminum (blue [56]).
Applsci 06 00023 g019

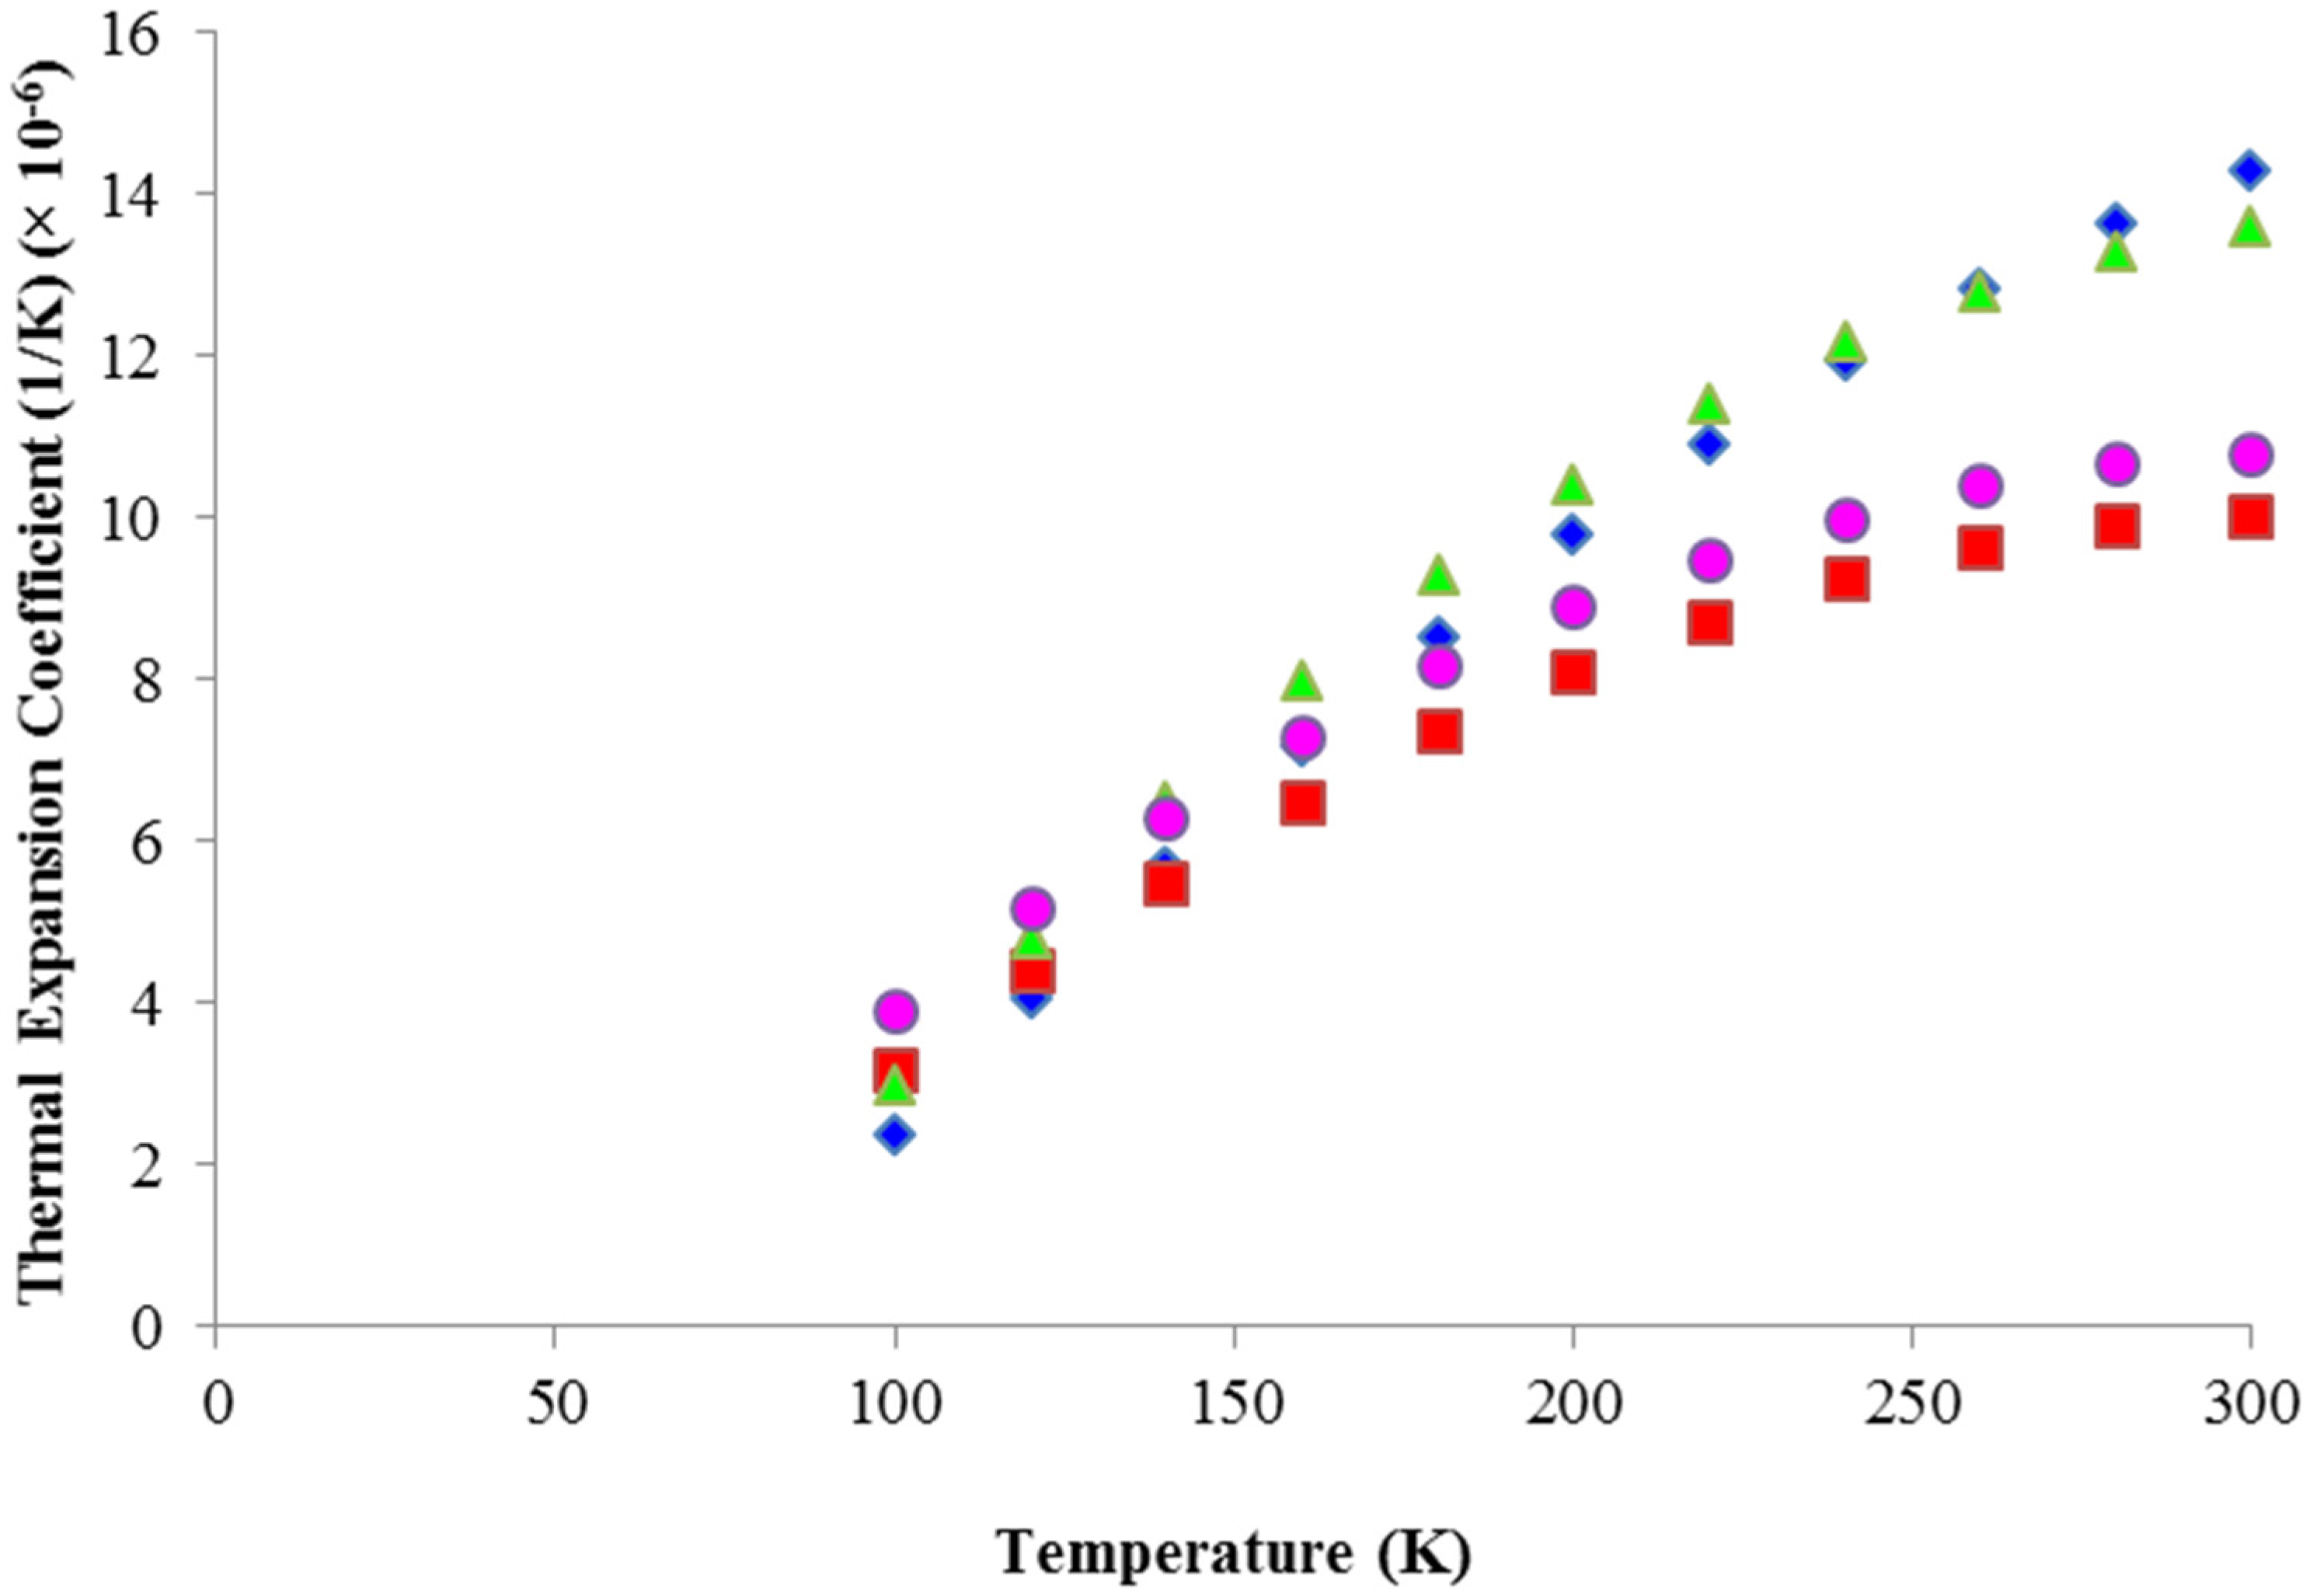
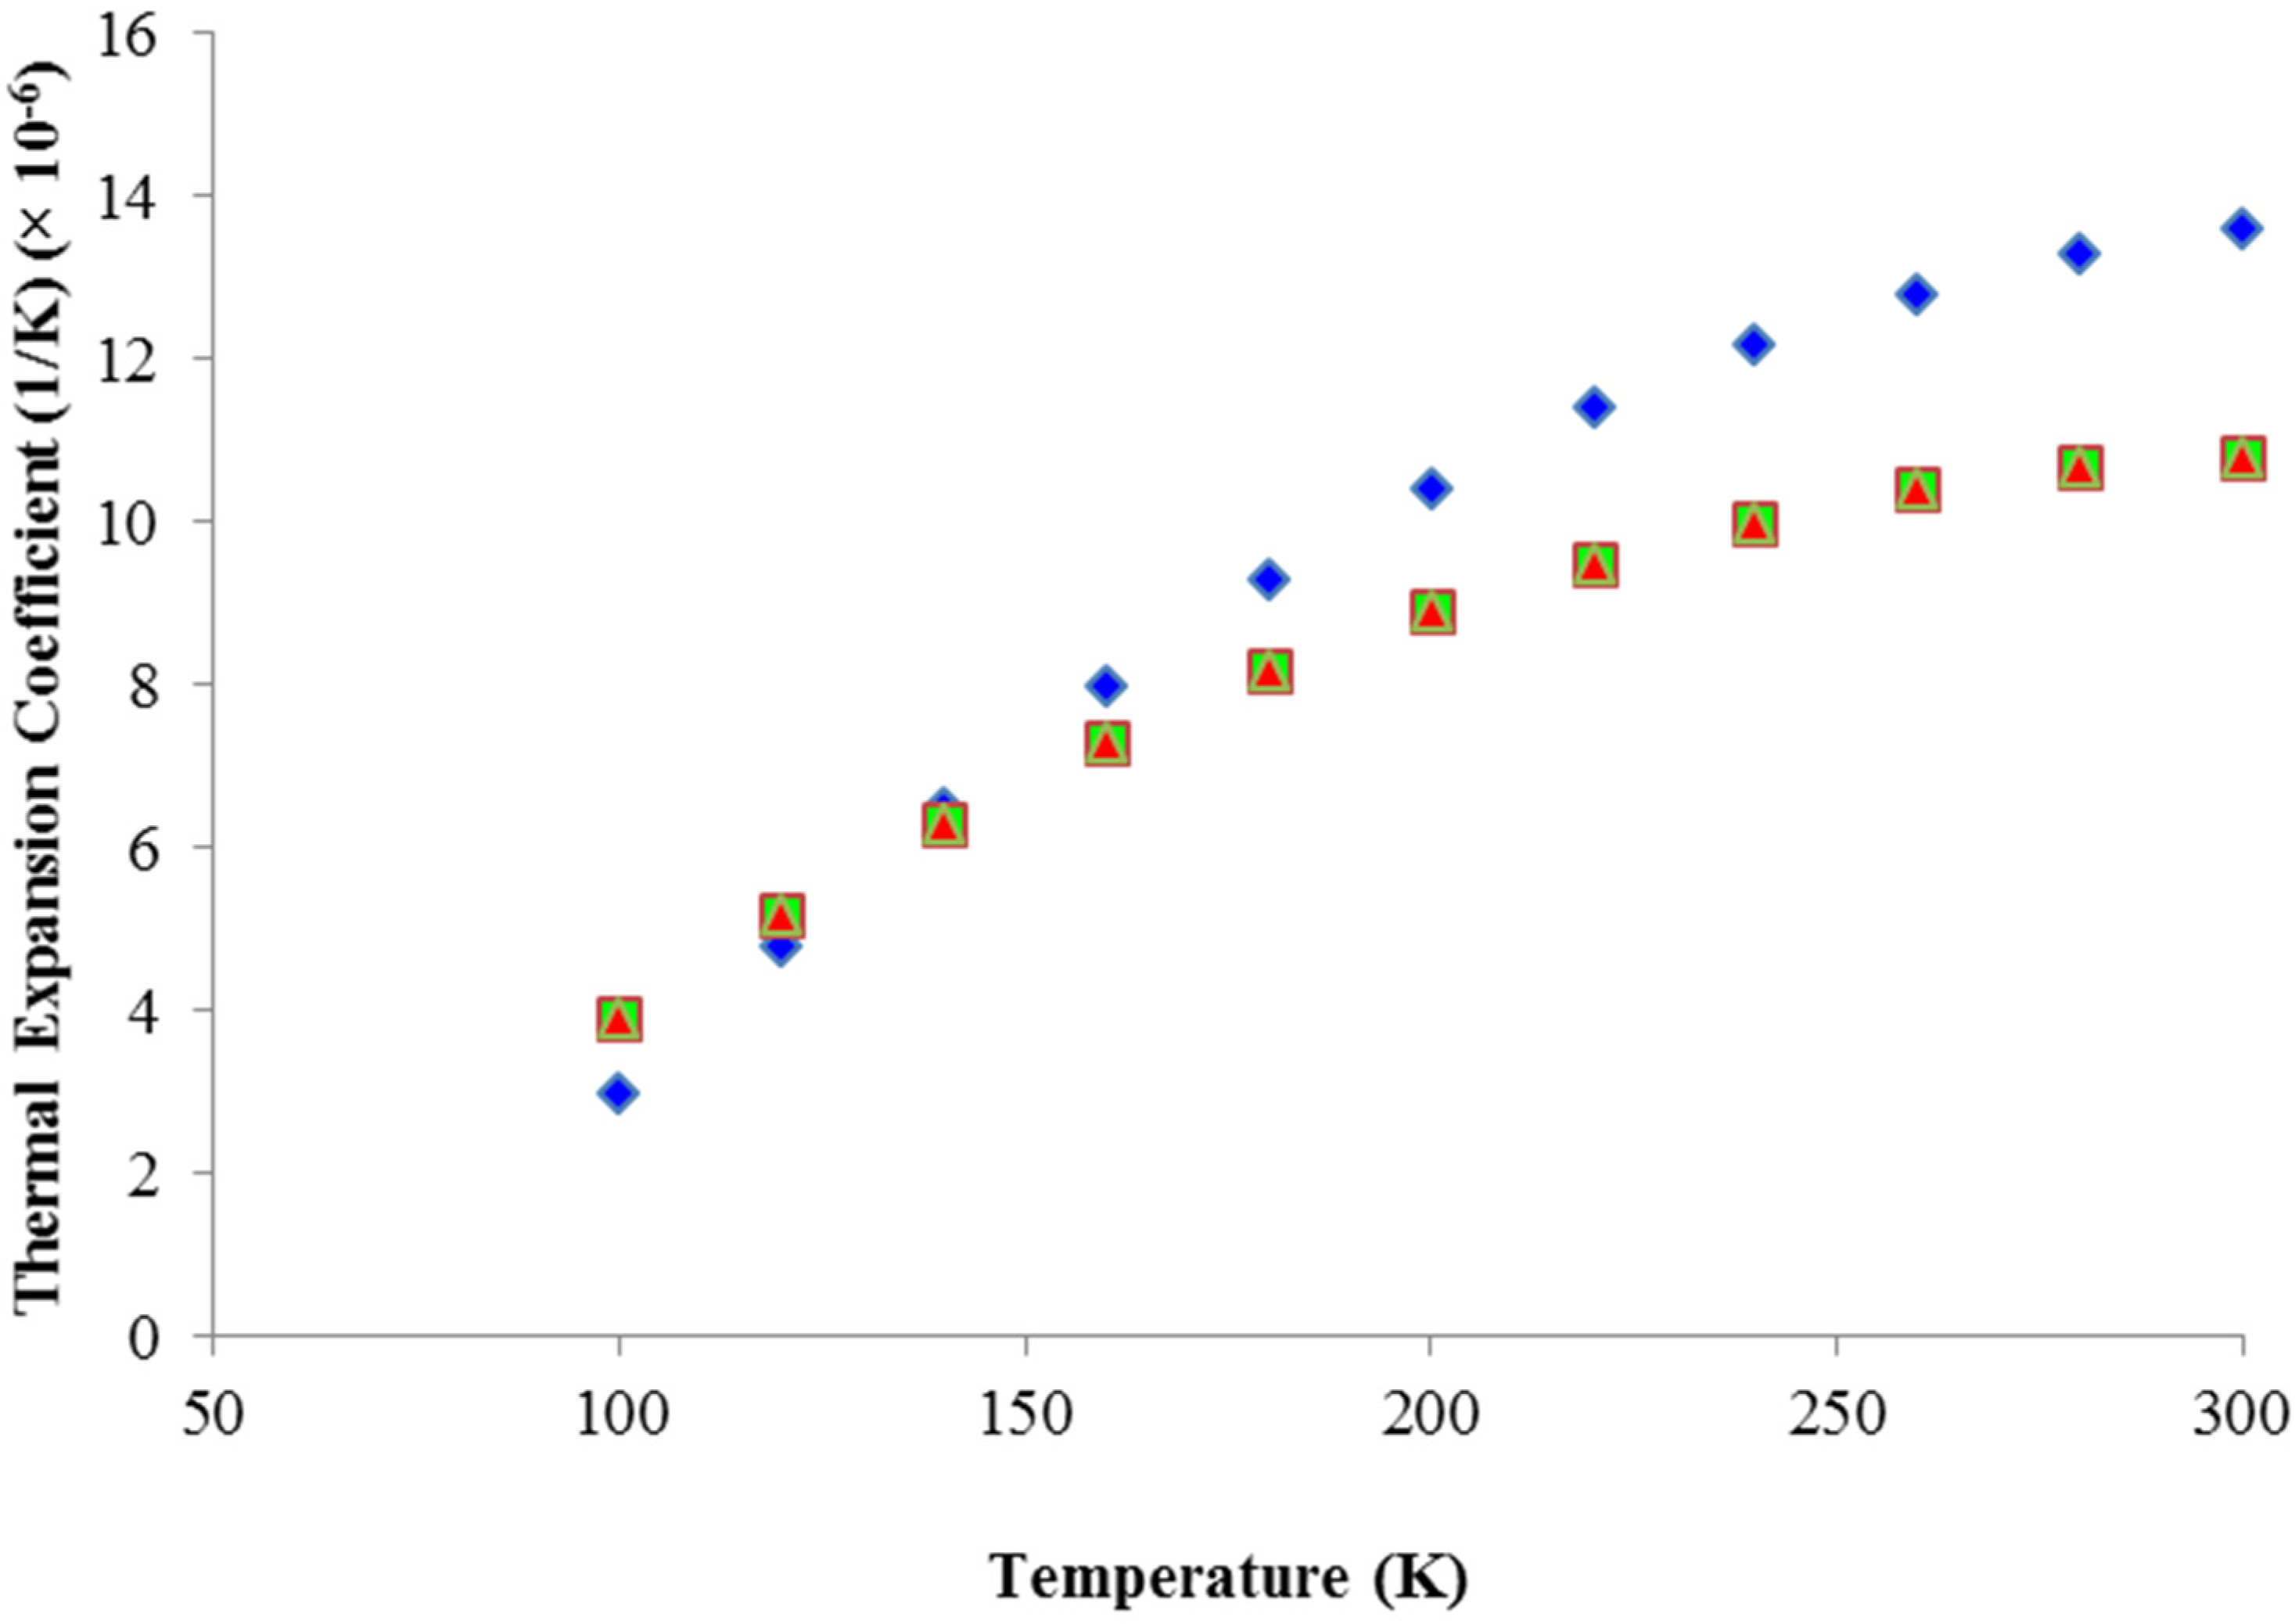
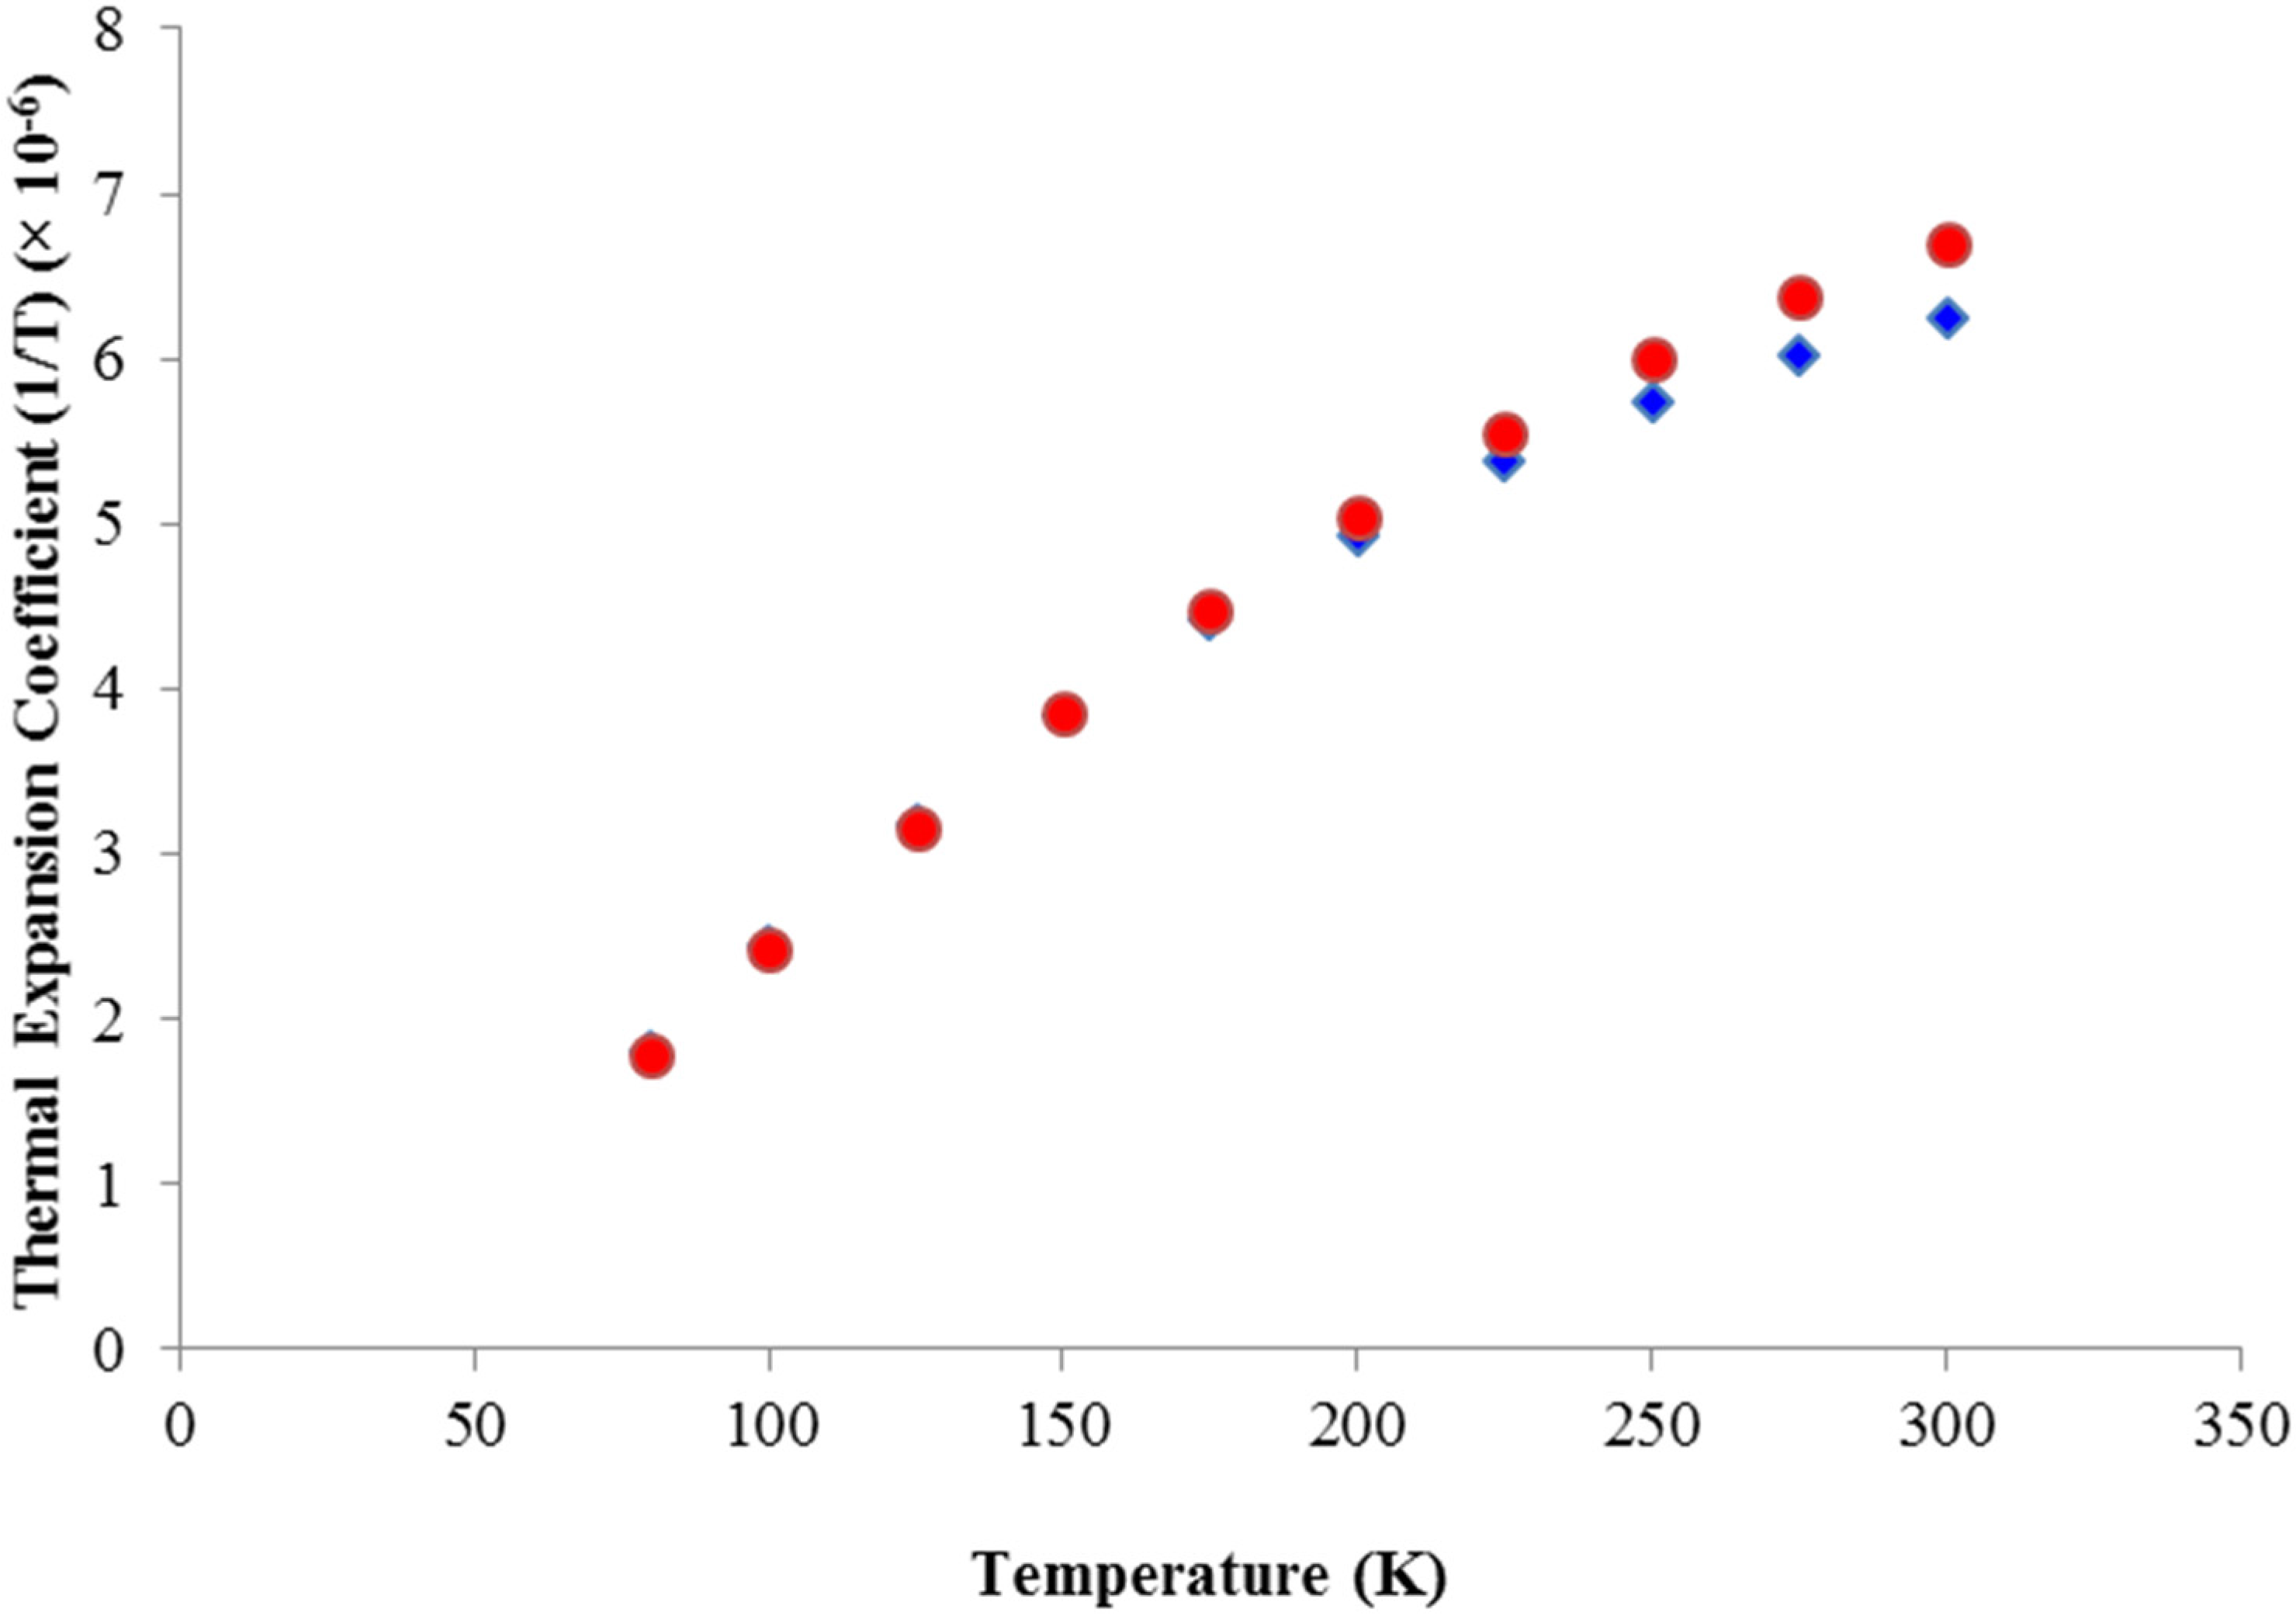
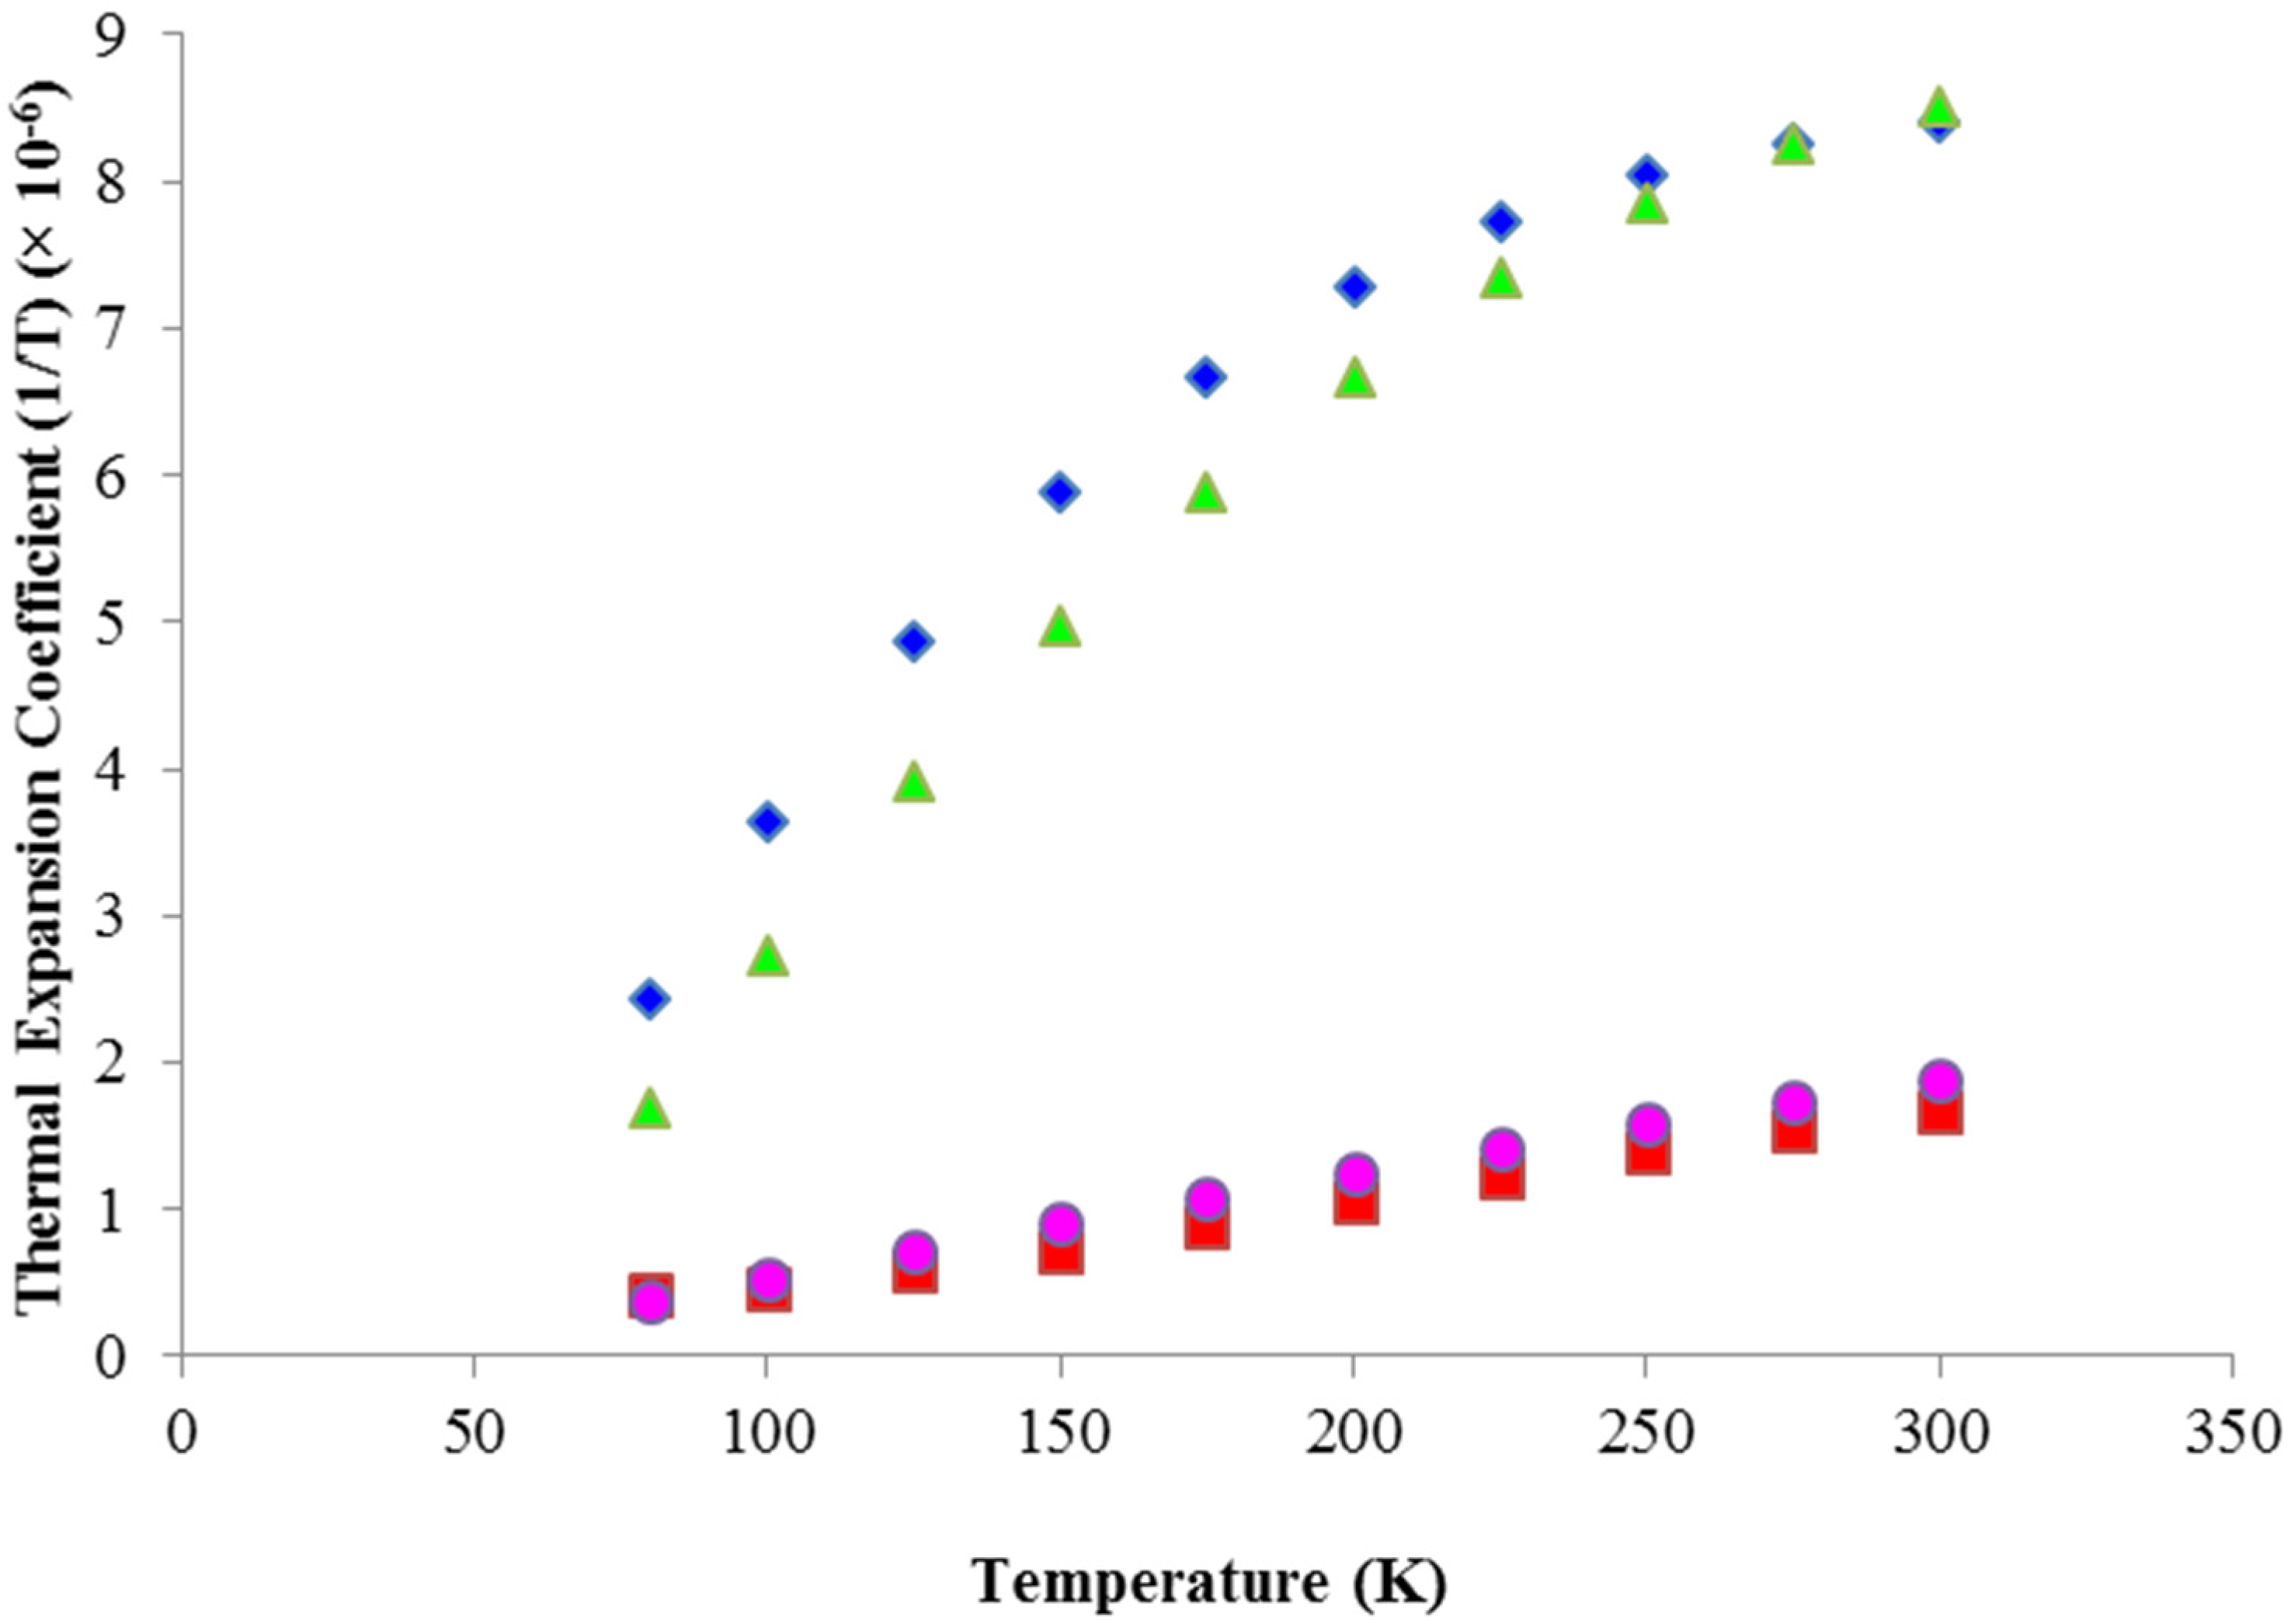
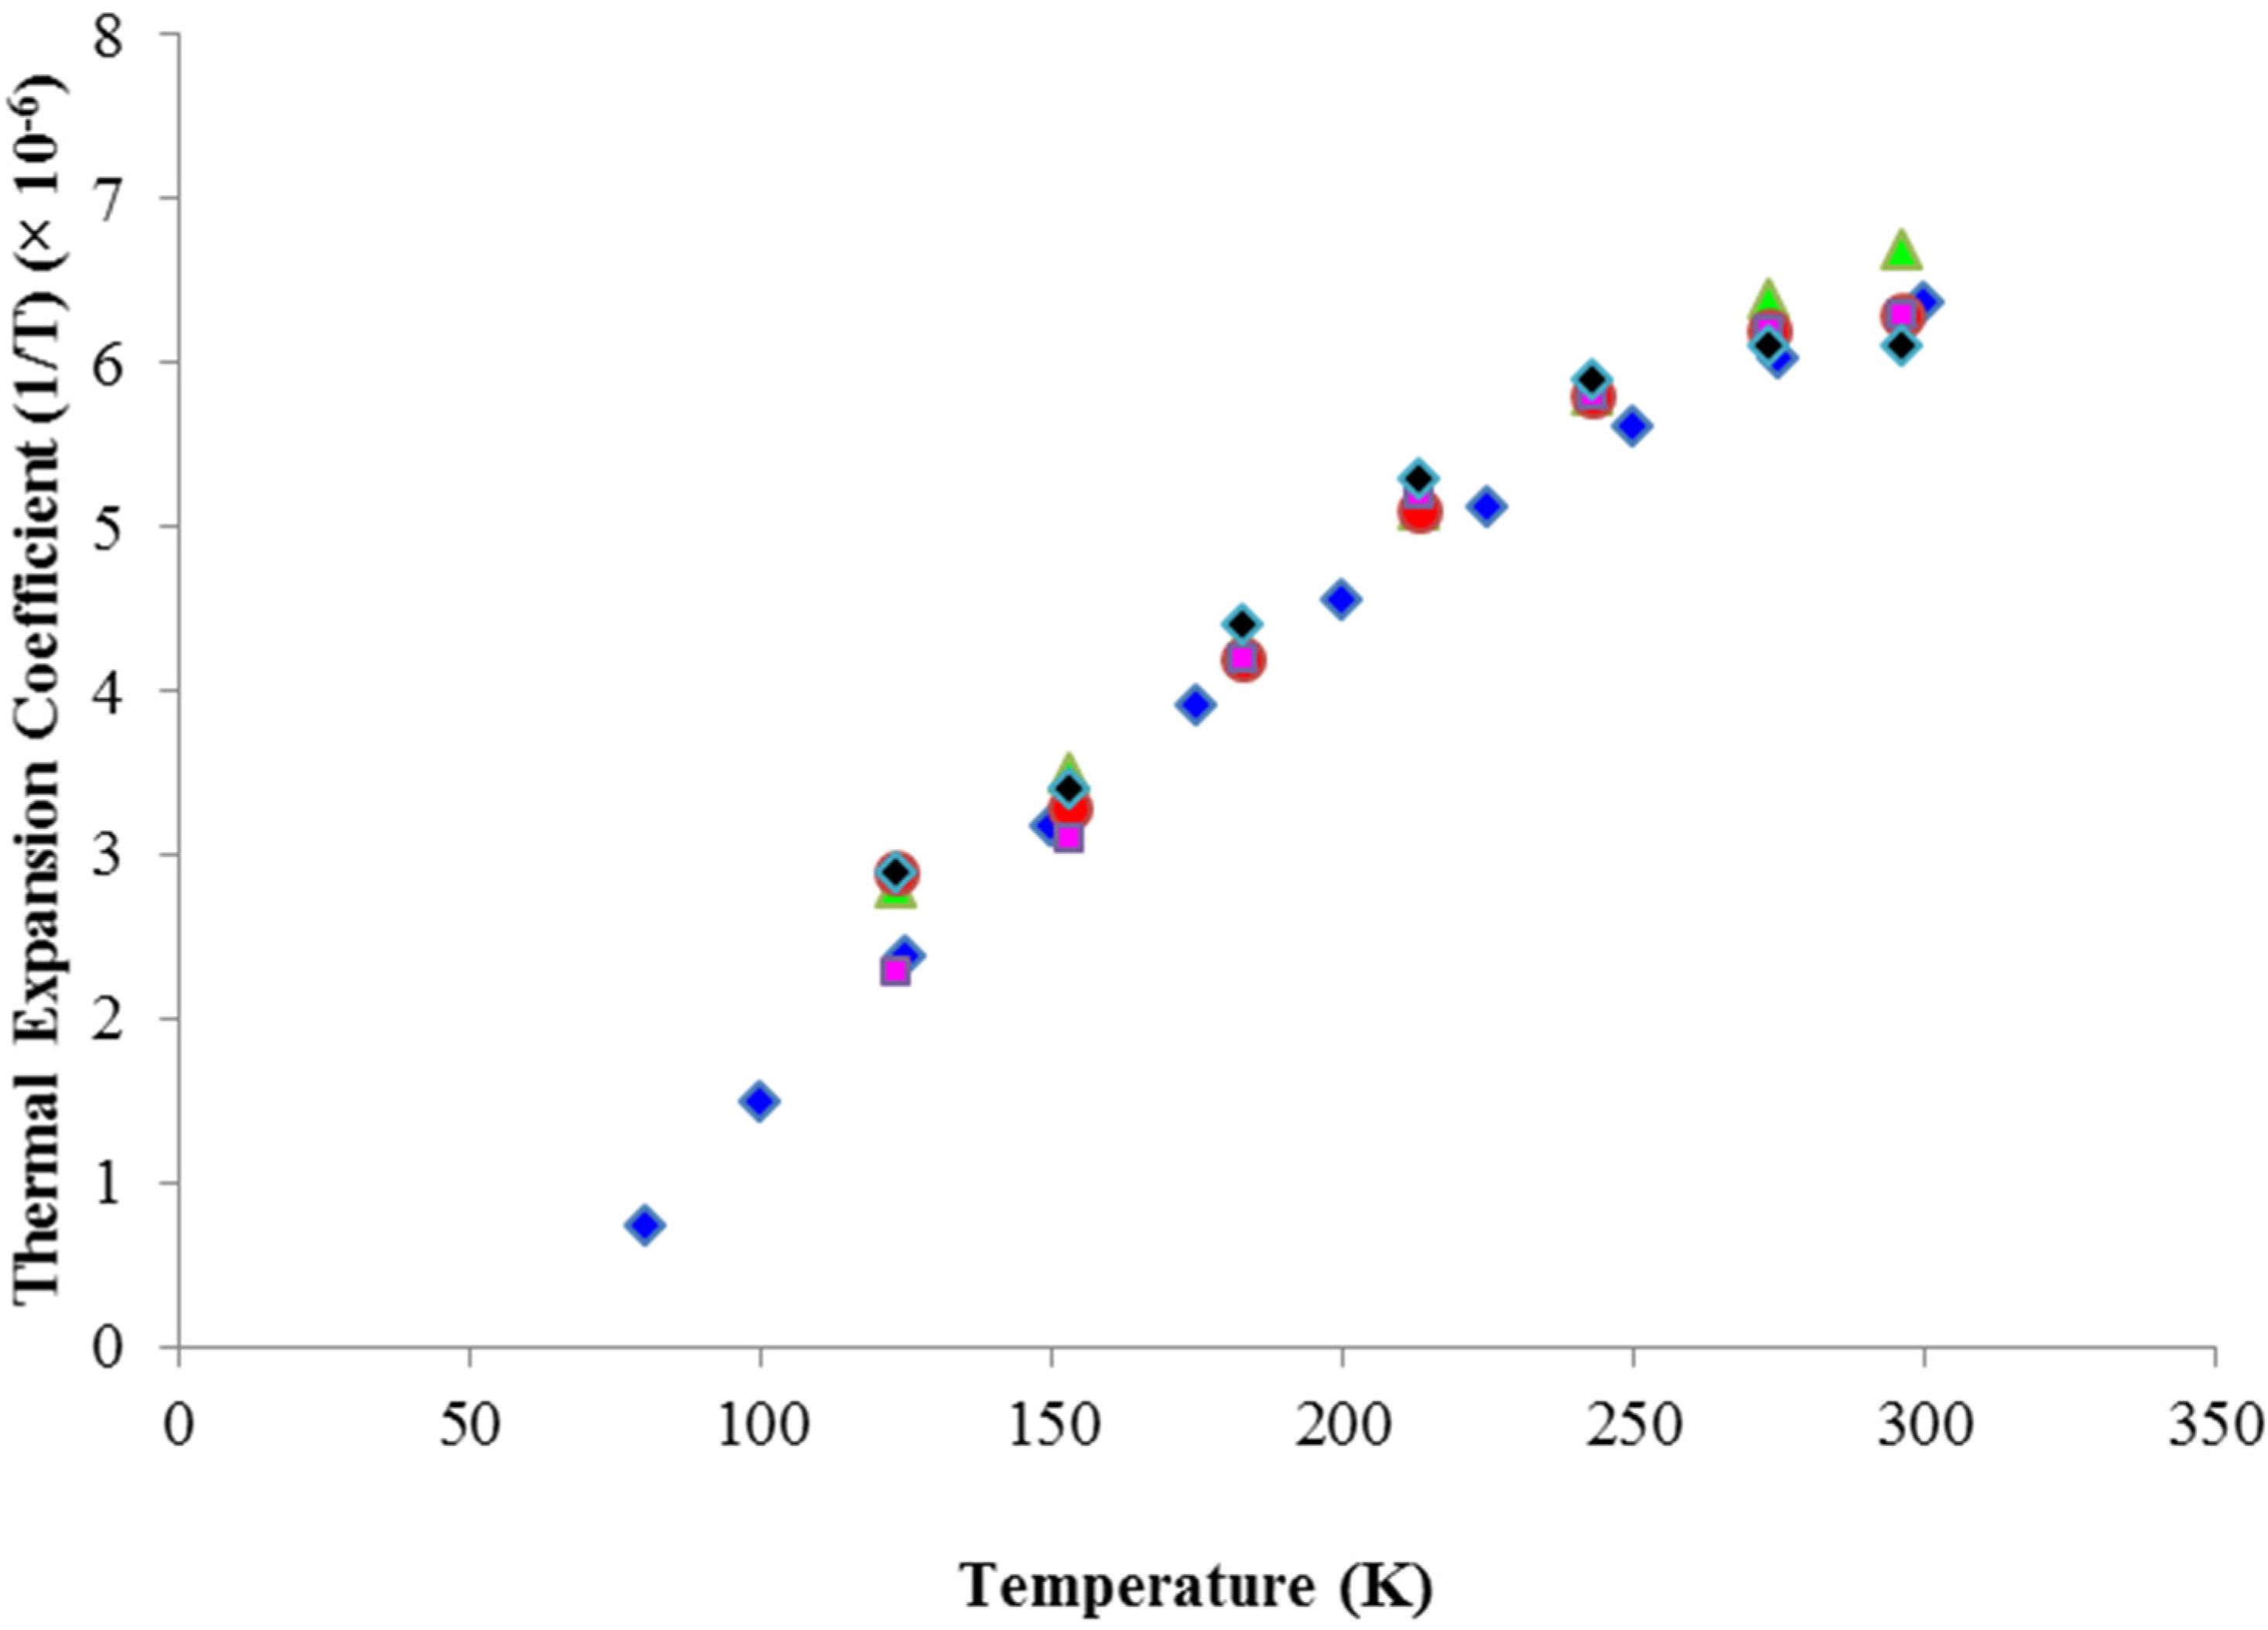
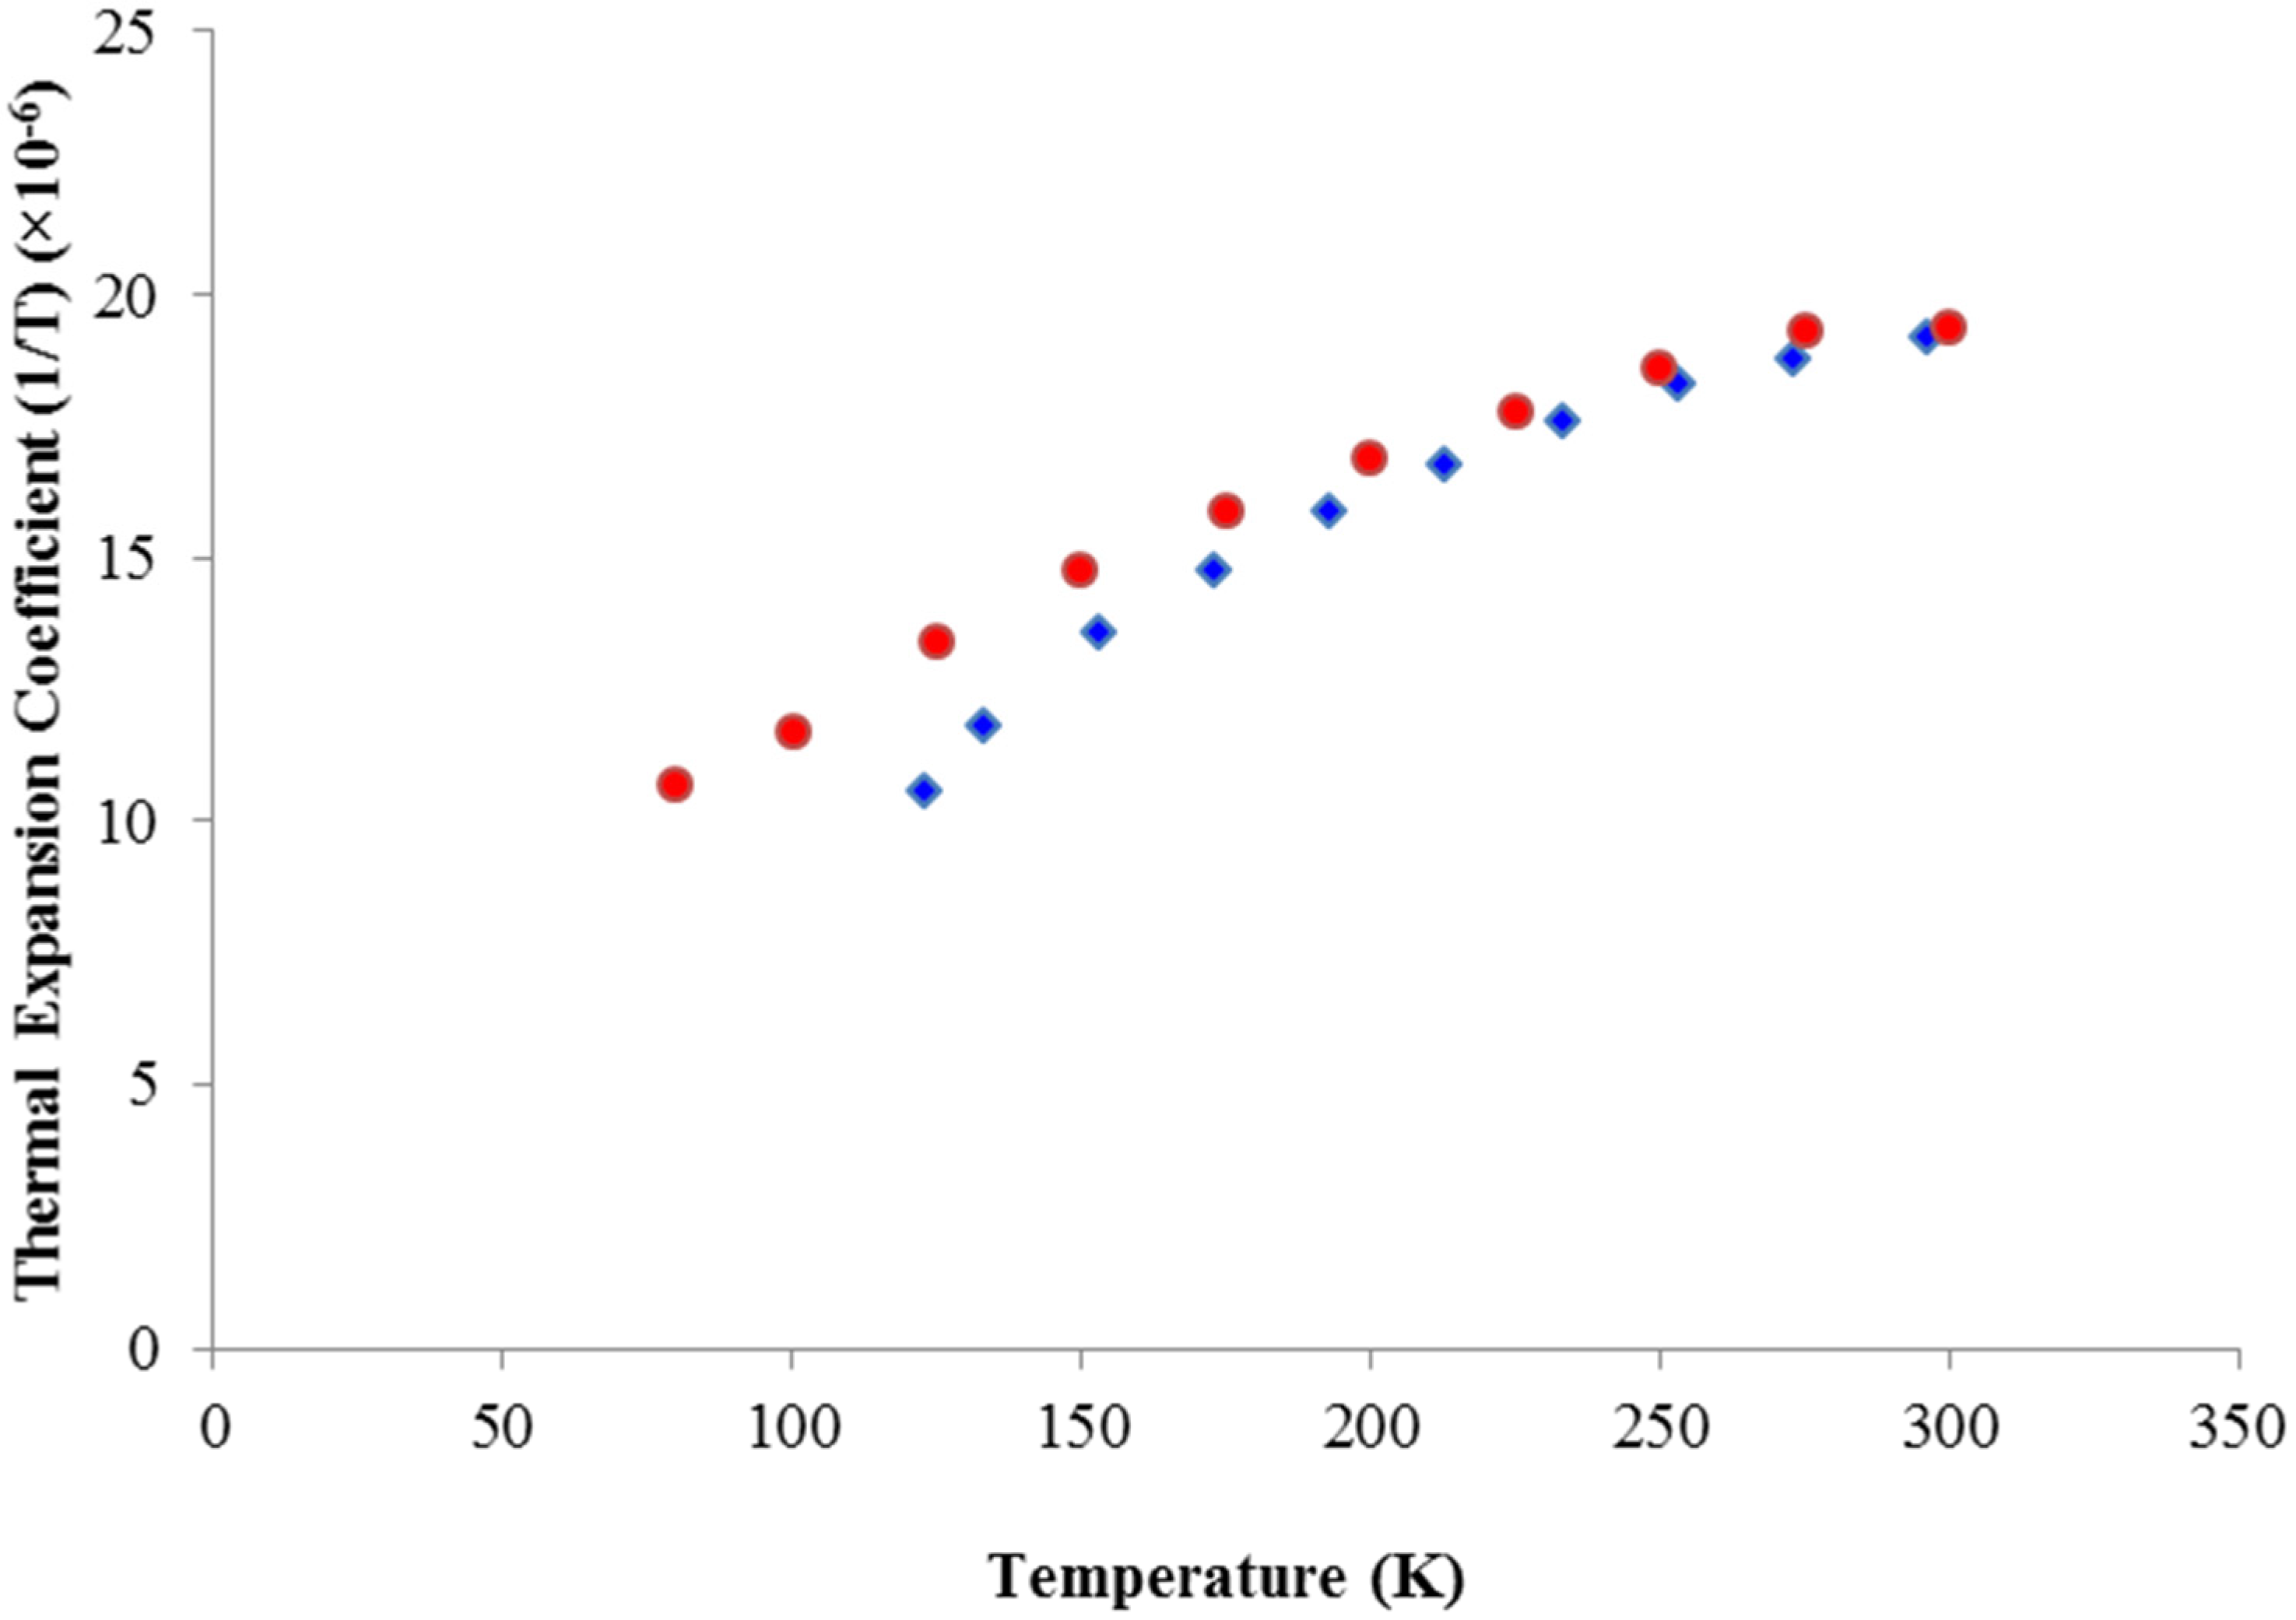
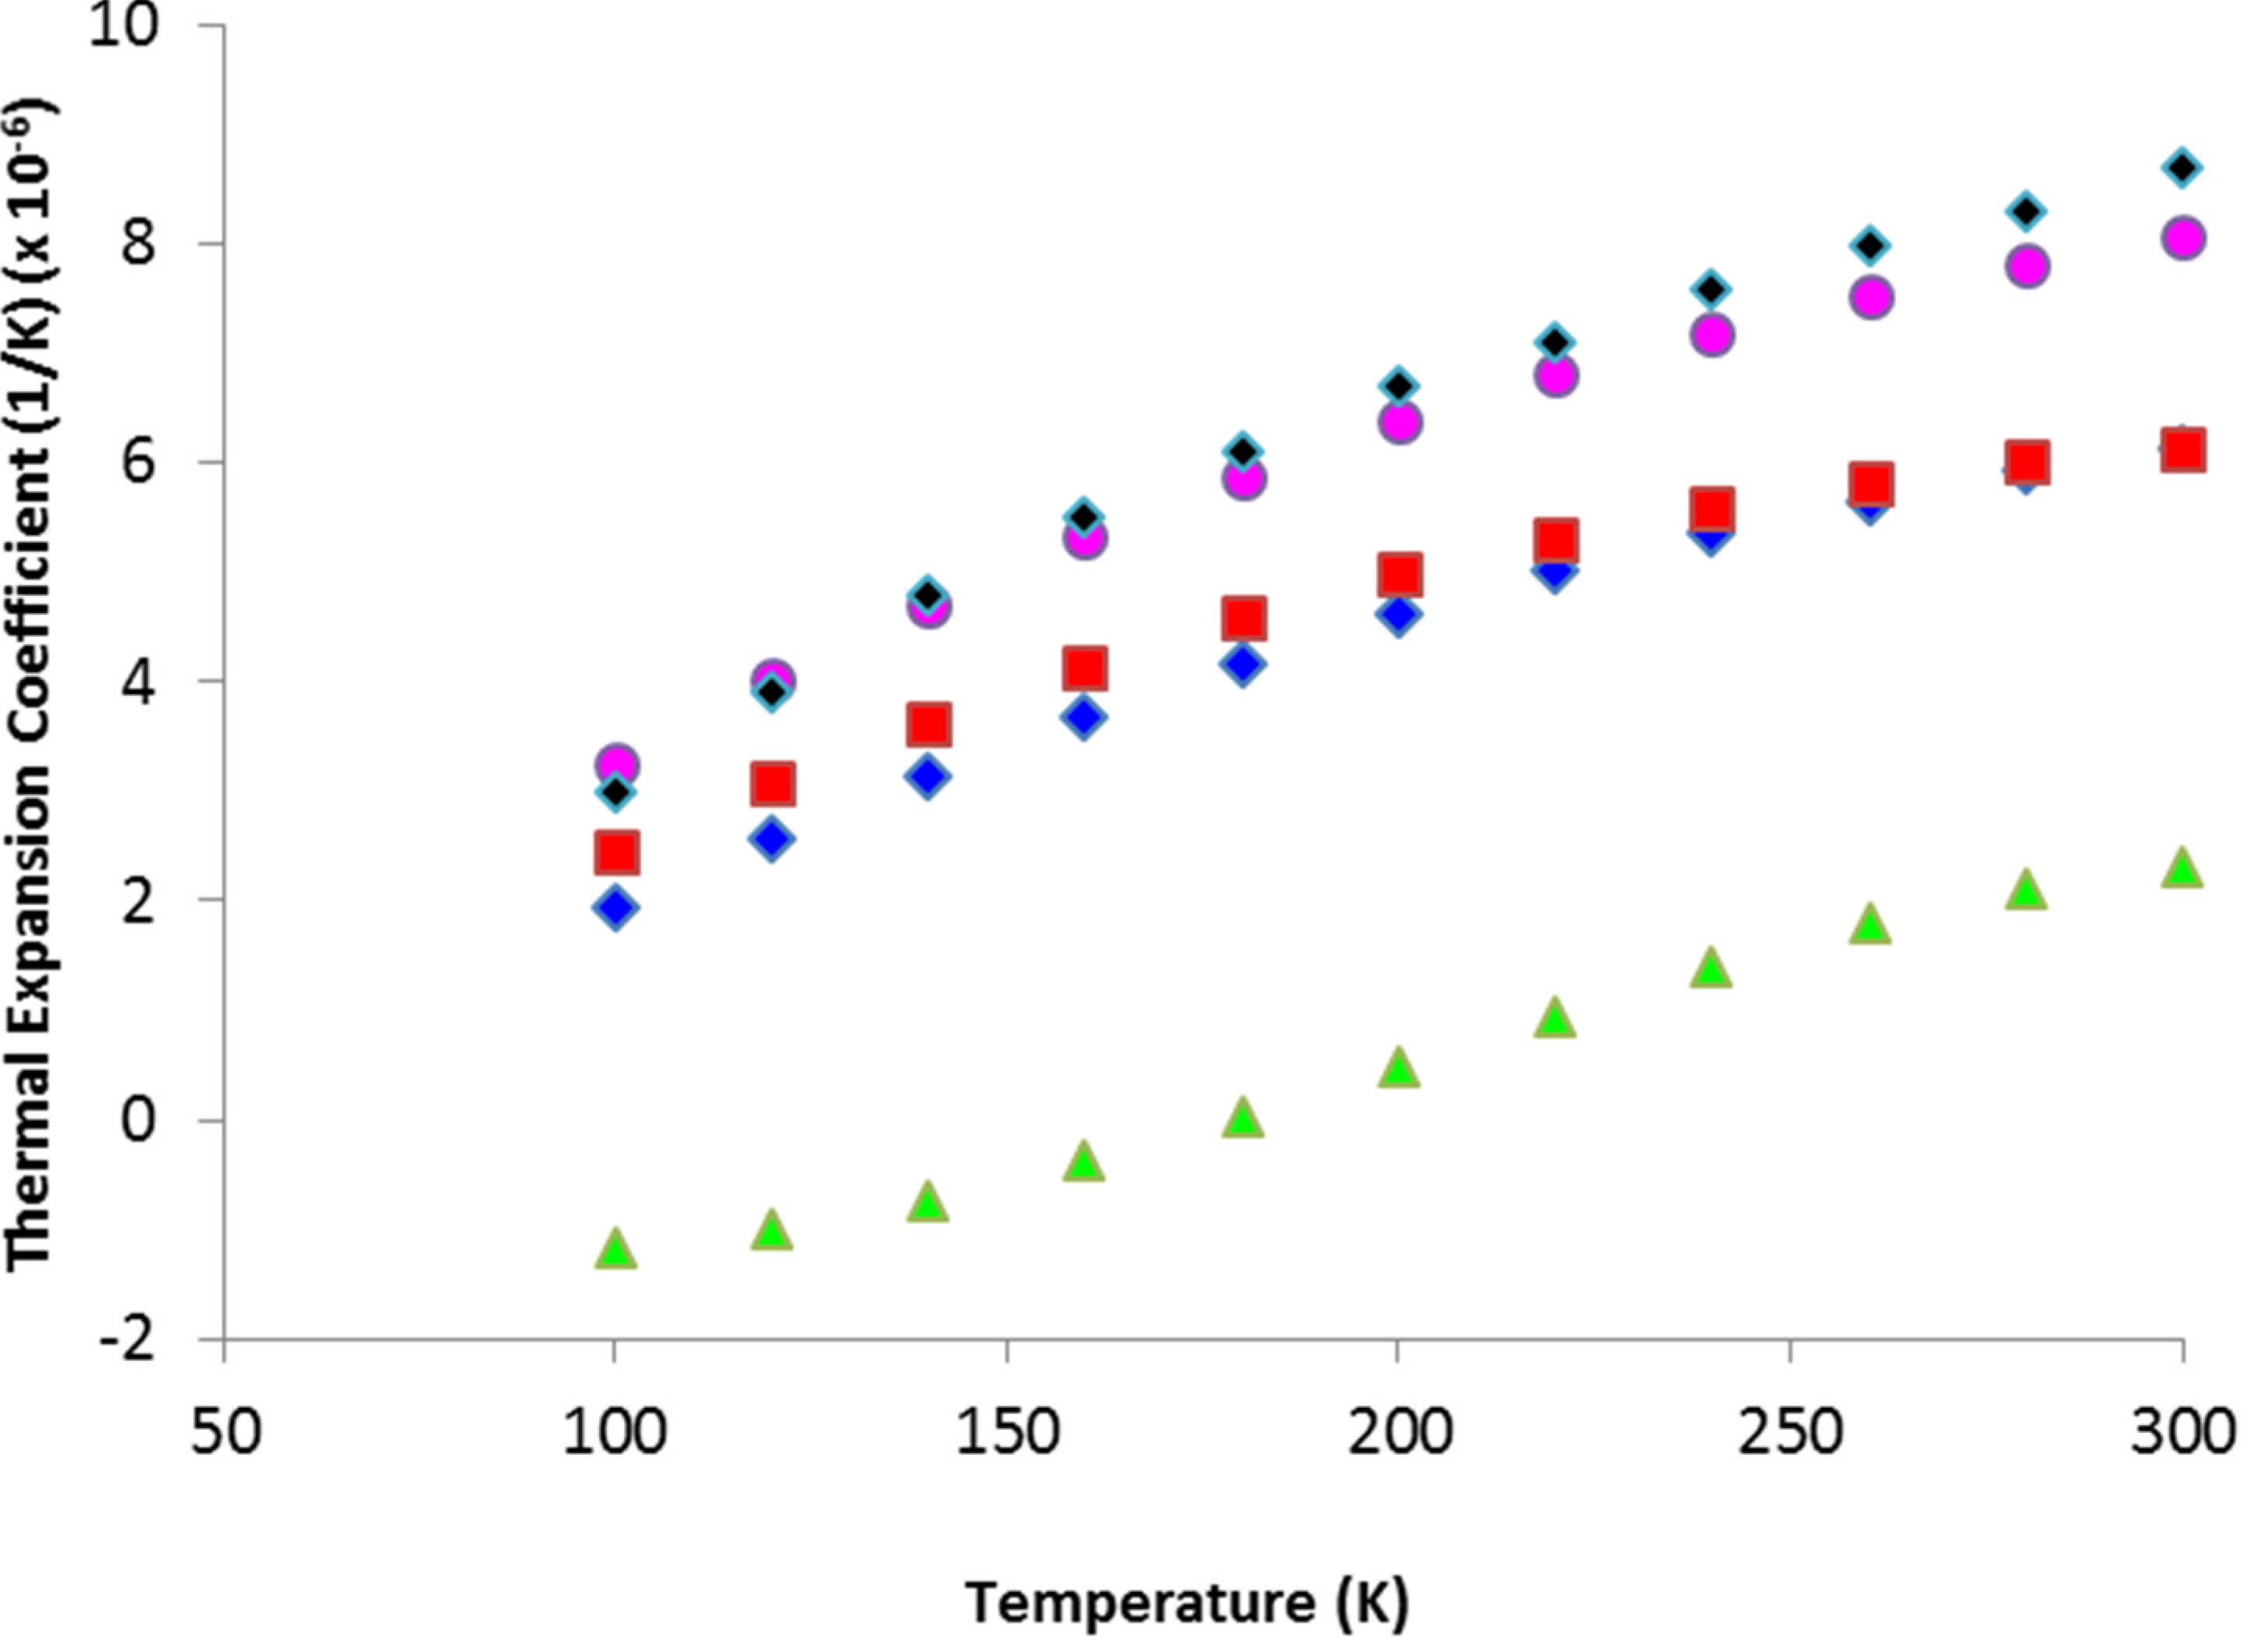
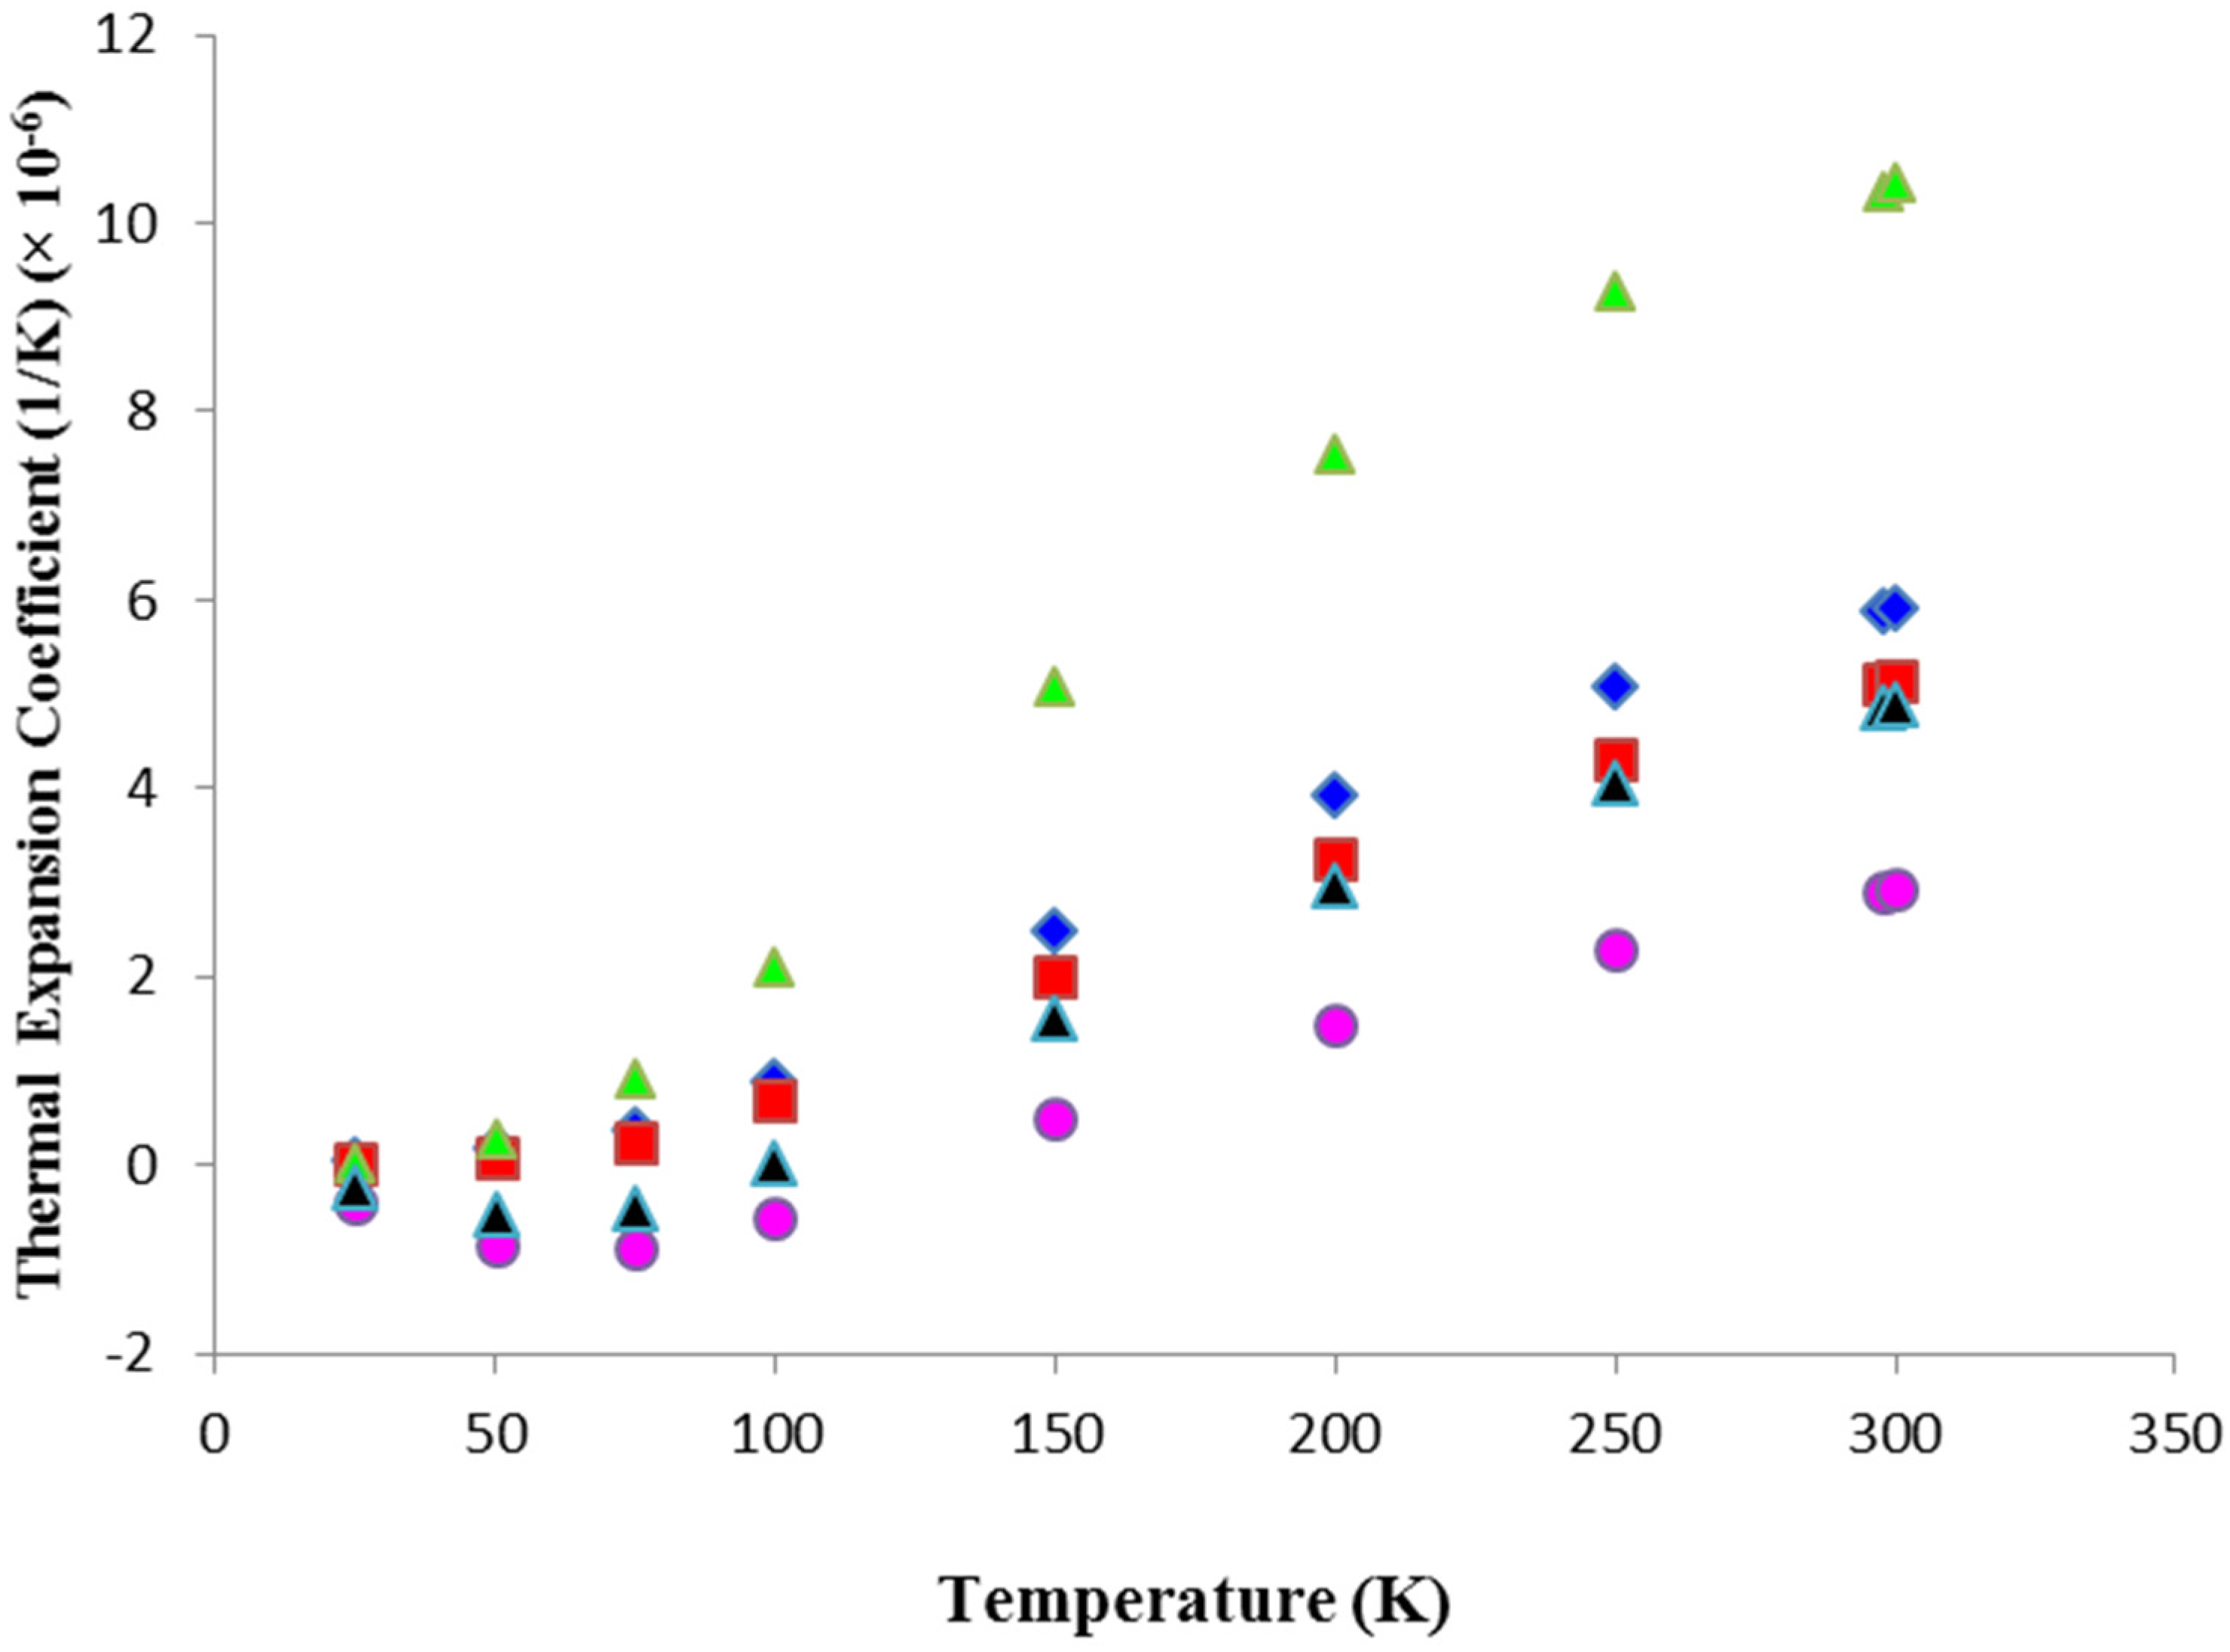
2.3. Thermal Expansion Coefficient

Thermal expansion of crystals can be understood by the realization that in the theory of lattice vibrations, thermal expansion only occurs when the potential energy of a classical harmonic oscillator is expanded to terms of higher order than two, since the quadratic dependence alone results in no net thermal expansion. For the thermodynamic volumetric thermal expansion coefficient α V ( T ) , it can be shown that the Grüneisen relationship applies to cubic or isotropic materials. This equation relates the Grüneisen constant γ G , the bulk isothermal elastic modulus BT and the crystal mass density ρ to the bulk thermal expansion coefficient according to
α V = ρ C V B T · γ G
For isotropic laser materials, the linear thermal expansion α ( T ) coefficient is related to the bulk thermal expansion coefficient through:
α V ( T ) = 3 · α ( T )
Using Equations (62) and (63), we can also write the following relationship for the linear thermal expansion coefficient:
α ( T ) = 1 3 K T ( T ) γ G ρ ( T ) C V ( T )
where we have used the relationship K T = 1/ B T . Finally we can also use the well-known relation for isotropic materials:
K T = E 2 ( 1 ν )
where E is Young’s modulus, and ν Poisson’s ratio, to arrive at
α ( T ) = 1 6 γ G ρ ( T ) C V ( T ) · E ( 1 ν )  
Because E, ν, and ρ are weak functions of T, α ( T ) is dominated by the strong functional dependence of C V ( T ) on T. This dependence can be seen in the thermal expansion coefficient data presented later in this section. Since theoretically Cv → 0 as T → 0, at absolute zero the thermal expansion coefficient is theoretically 0 also. While some data deviate from this simple rule, it is generally true that as temperature is lowered the thermal expansion coefficient decreases roughly with the temperature dependence of the specific heat. For simple cubic crystals like YAG, in the temperature range of interest in this paper, one may approximate the temperature dependence of C V using an exponential function:
C V ( T ) = C 0 exp ( ħ ω k B T )
C 0 is a proportionality constant equal to
C 0 = 1 6 γ G ρ E ( 1 ν )
This approach has been taken in [58], where very good fits to thermal expansion data for YAG were obtained by fitting the proportionality constant C 0 to ceramic and crystalline data.

Reported Thermal Expansion Coefficient Measurements

In Figure 20, Figure 21, Figure 22, Figure 23, Figure 24, Figure 25, Figure 26 and Figure 27 we display plots of thermo-optic coefficient as a function of absolute temperature for doped and undoped crystals. We have only included data sets available in the temperature region of interest in this paper, about 80–300 K, and have not included any single-point measurements, most of which are available at or near 300 K. Some data shown include ceramic laser materials since ceramic and single-crystal data are nearly indistinguishable. Except where discussed, all data shown are for undoped host laser materials, and we have used published fits to the thermal expansion data where available to generate the plots shown here, Figure 20 shows the thermal expansion coefficient as a function of absolute temperature over the range 100–300 K for the oxide laser materials YAG, LuAG, and YALO [29]. YAG and LuAG are both isotropic crystals whereas YALO is biaxial and therefore has three principal thermal expansion coefficients. In Figure 21 we show thermal expansion as a function of temperature for the fluoride materials YLF and LuLF [29], both uniaxial crystals with two principal axes each. Figure 22 shows thermal expansion data for the biaxial laser materials BYF, KYW, and KGW, along their b-axes [29]. Figure 23 displays thermal expansion data for the biaxial laser material YSO b-axis as well as for the isotropic material GSAG [30]. In Figure 24 data are shown for the uniaxial laser materials YVO4 and GdVO4 [3,30]. Thermal expansion coefficients as a function of absolute temperature for the undoped isotropic sesquioxide laser materials Sc2O3 [30] and Y2O3 [59], and the Yb-doped laser materials Yb:Y2O3 [59], Yb:Sc2O3 [59], and Yb:Lu2O3 [59] are shown in Figure 25. Figure 26 shows thermal expansion data for the isotropic laser material CaF2, for undoped and 10 at. % Yb doped crystals [59], while in Figure 27 we include some thermal expansion data for some other common laser and optical materials, uniaxial Al2O3, isotropic MgO, and uniaxial ZnO [60].
Figure 20. Thermal expansion coefficient as a function of absolute temperature for the isotropic laser materials YAG (blue) and LuAG (red) [29], and for the biaxial laser material YALO [29] along the a (green), b (pink), and c (black) axes. All data are for undoped crystals.
Applsci 06 00023 g020
Figure 21. Thermal expansion coefficient as a function of absolute temperature for the uniaxial laser materials YLF along the a (blue) and c (red) axes [29] and LuLF along the a (green) and c (pink) axes [29]. All data are for undoped crystals.
Applsci 06 00023 g021
Figure 22. Thermal expansion coefficient as a function of absolute temperature for the biaxial laser materials BYF (blue), KGW (green), and KYW (red) [29]. All data are reported for the b-axis and for undoped crystals.
Applsci 06 00023 g022
Figure 23. Thermal expansion coefficient as a function of absolute temperature for the biaxial laser material YSO (blue) [30] and the isotropic laser material GSAG (red) [30]. YSO data is reported for the b-axis, and all data are for undoped crystals.
Applsci 06 00023 g023
Figure 24. Thermal expansion coefficient as a function of absolute temperature for the uniaxial laser materials YVO4 [30] along the a (pink) and c (green) axes, and GdVO4 along the a (red) and c (blue) axes [3]. All data are for undoped crystals.
Applsci 06 00023 g024
Figure 25. Thermal expansion coefficient as a function of absolute temperature for the undoped isotropic sesquioxide laser materials Sc2O3 (blue) [30] and Y2O3 (red) [59], and the 10 at. % Yb-doped laser material Yb:Y2O3 (green) [59], the 1 at. % Yb-doped material Yb:Sc2O3 (pink) [59], and 1 at. % Yb-doped material Yb:Lu2O3 (black) [59].
Applsci 06 00023 g025
Figure 26. Thermal expansion coefficient as a function of absolute temperature for the isotropic laser material CaF2 (blue) and 10 at. % Yb-doped Yb:CaF2 (red) [59].
Applsci 06 00023 g026
Figure 27. Thermal expansion coefficient as a function of absolute temperature for the uniaxial laser materials Al2O3 along the a (red) and c axes (blue) [60], ZnO along the a (black) and c (pink) axes [60], and for the isotropic laser material MgO (green) [60].
Applsci 06 00023 g027
Most of the materials plotted in Figure 20, Figure 21, Figure 22, Figure 23, Figure 24, Figure 25, Figure 26 and Figure 27 are well behaved in the sense that thermal expansion values are positive and converge towards 0 as temperature is lowered, in agreement with our previous discussion regarding Equation (66). In a few cases, however, the thermal expansion can become negative at lower temperatures, as may be seen in the YALO a-axis data in Figure 20, and the ZnO a and b axes data in Figure 27. In [61] the Grüneisen parameters for YAG and YALO are discussed, and the negative thermal expansion coefficient modeled as an additive negative Grüneisen parameter.

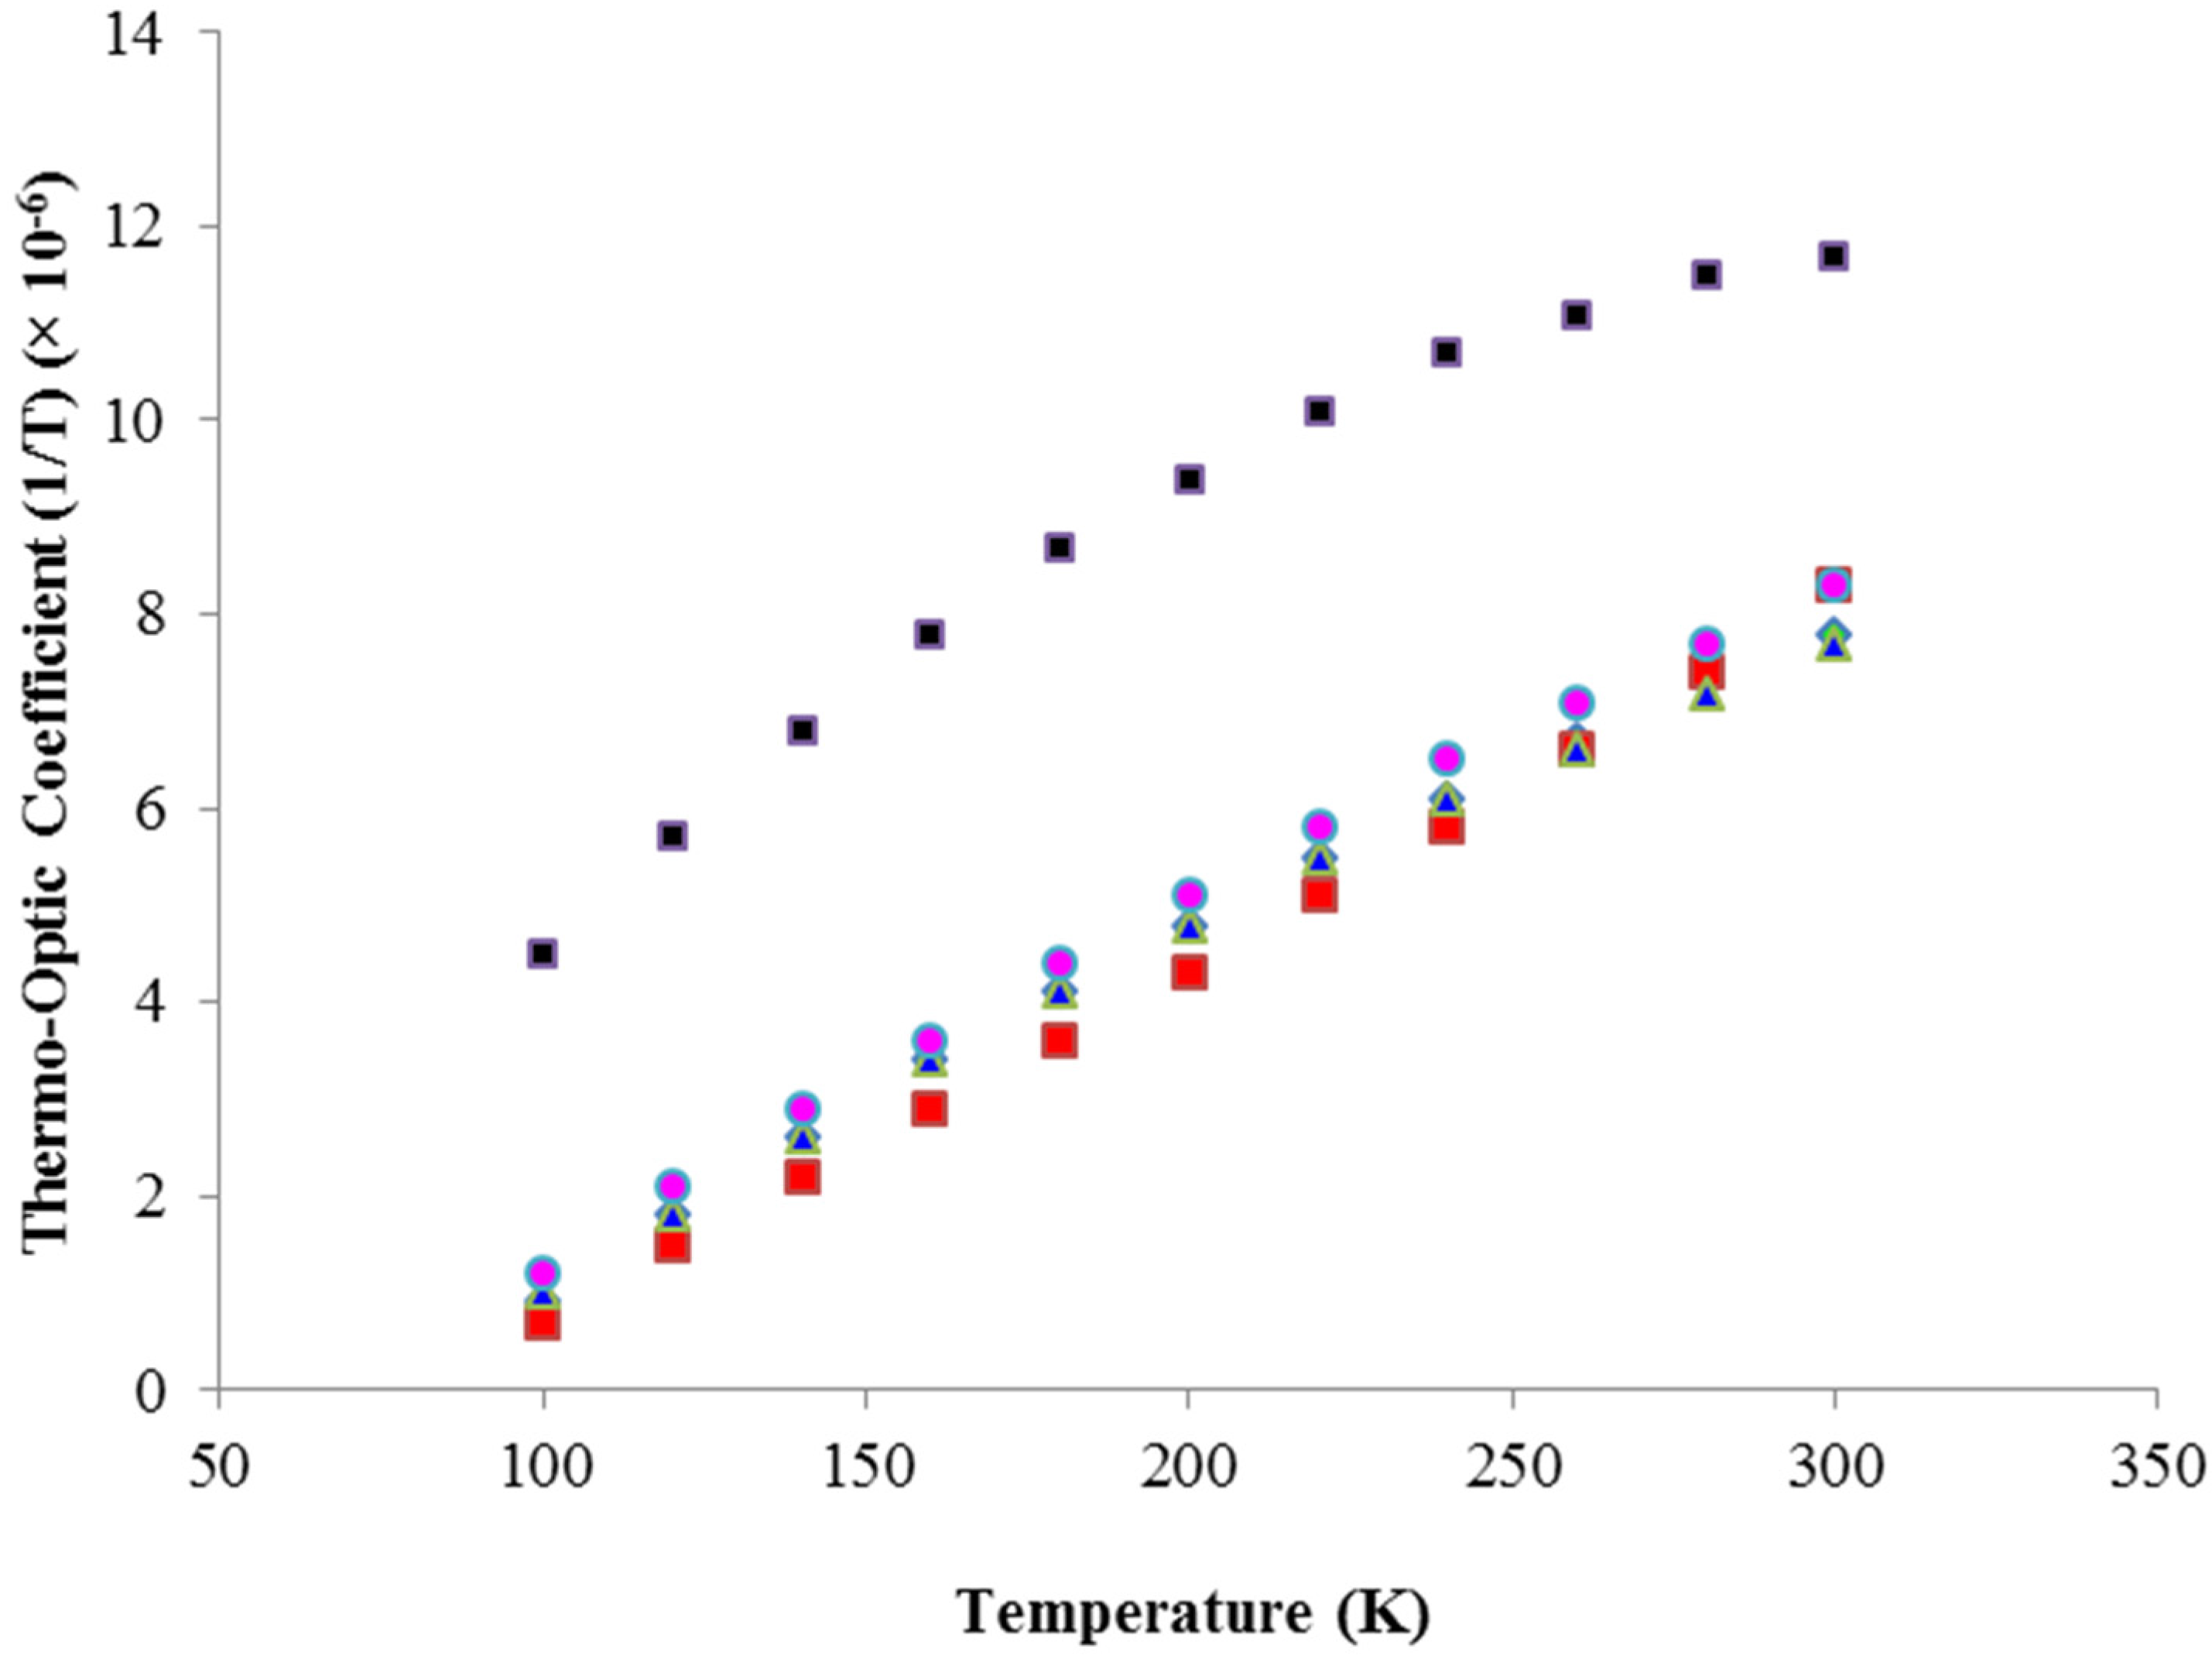
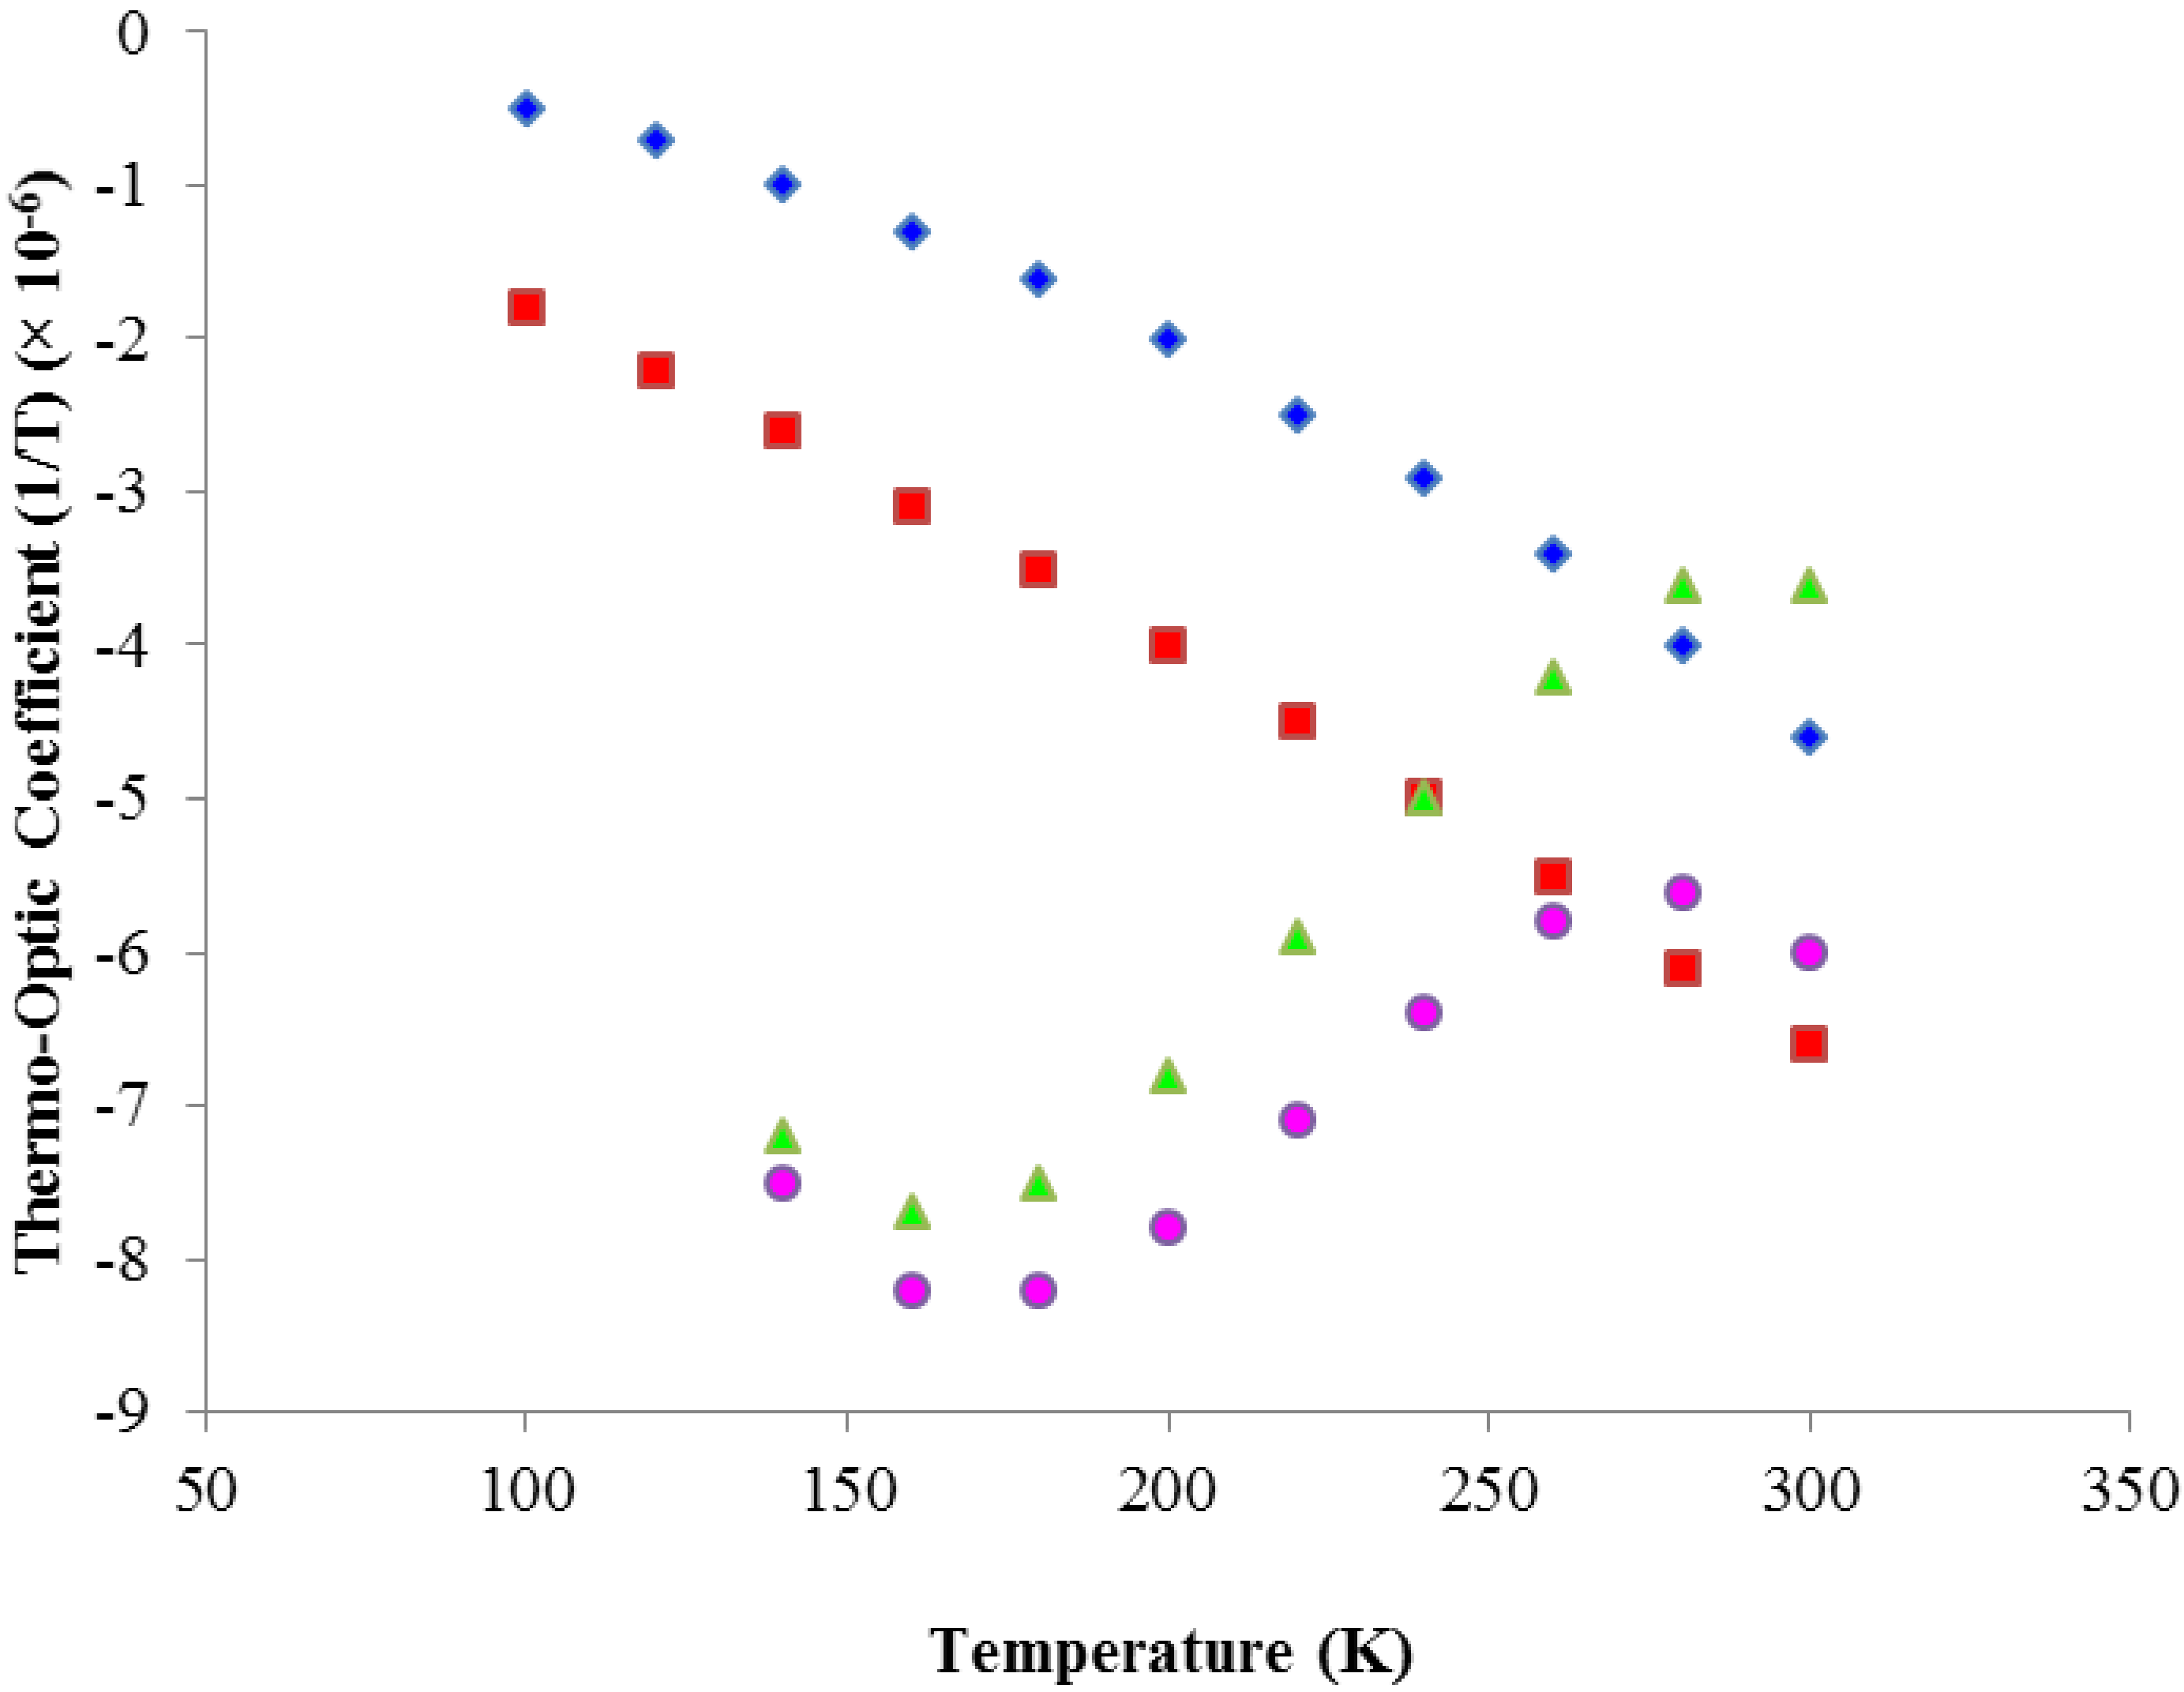
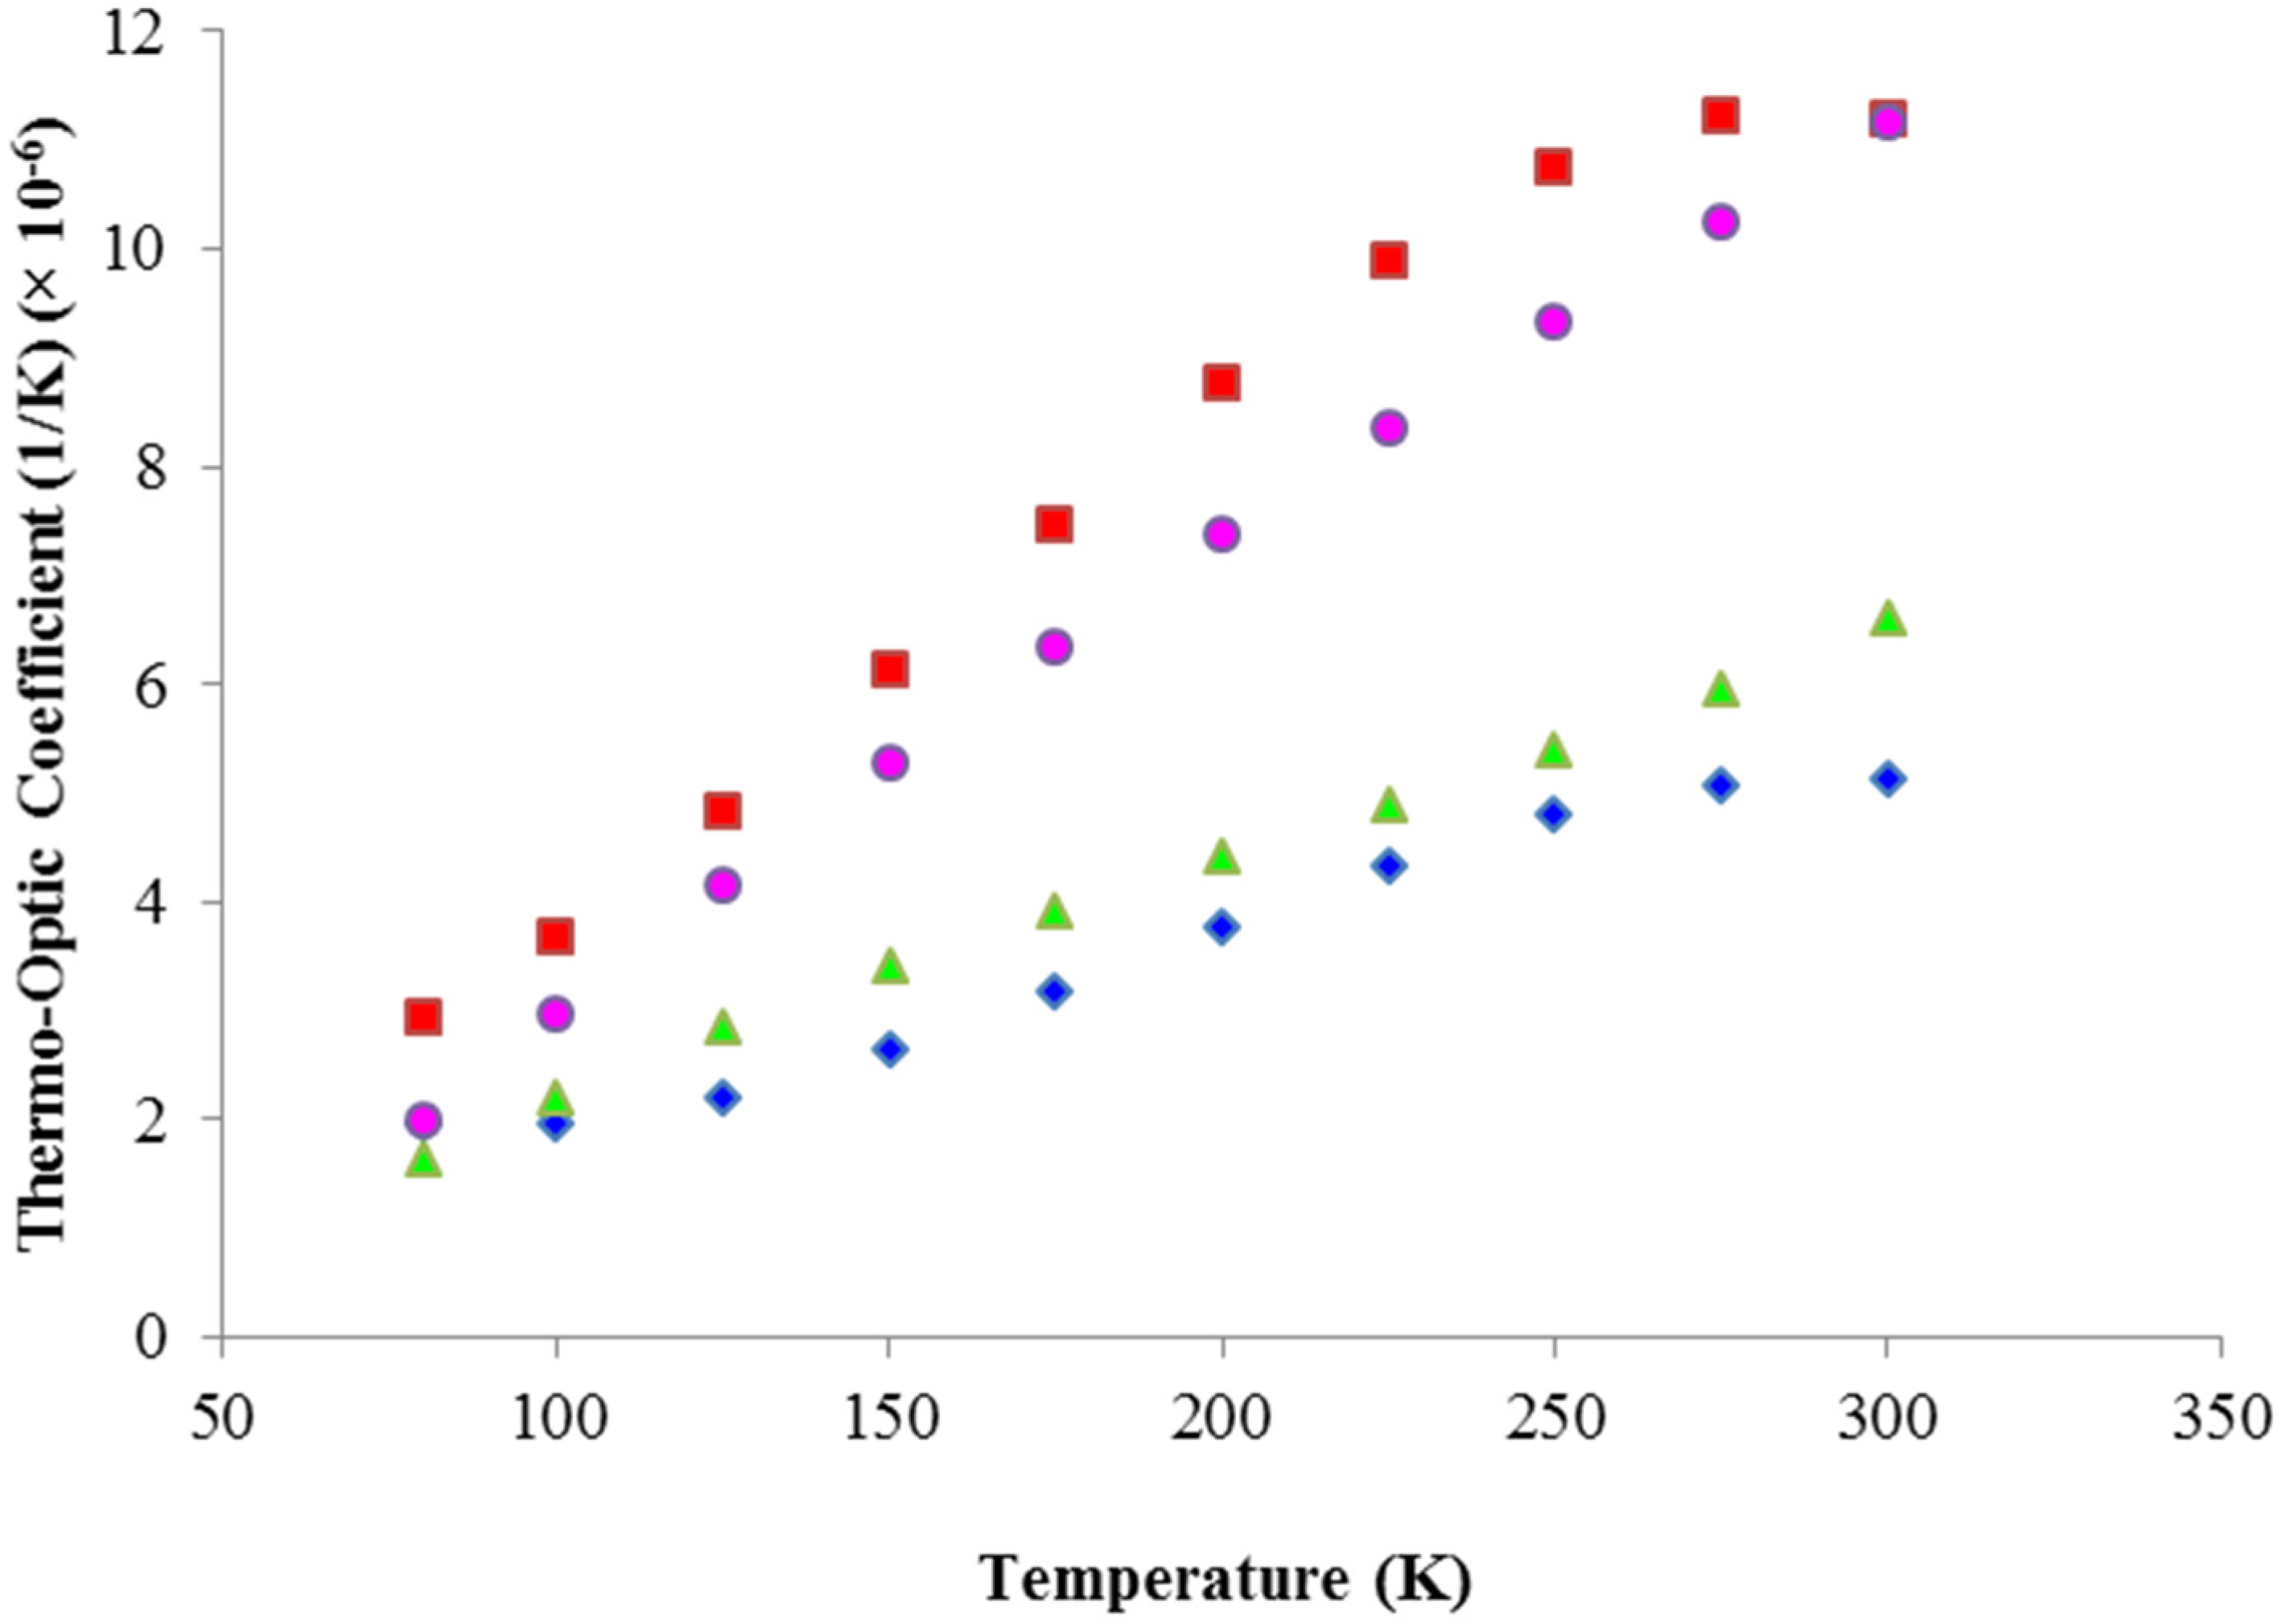
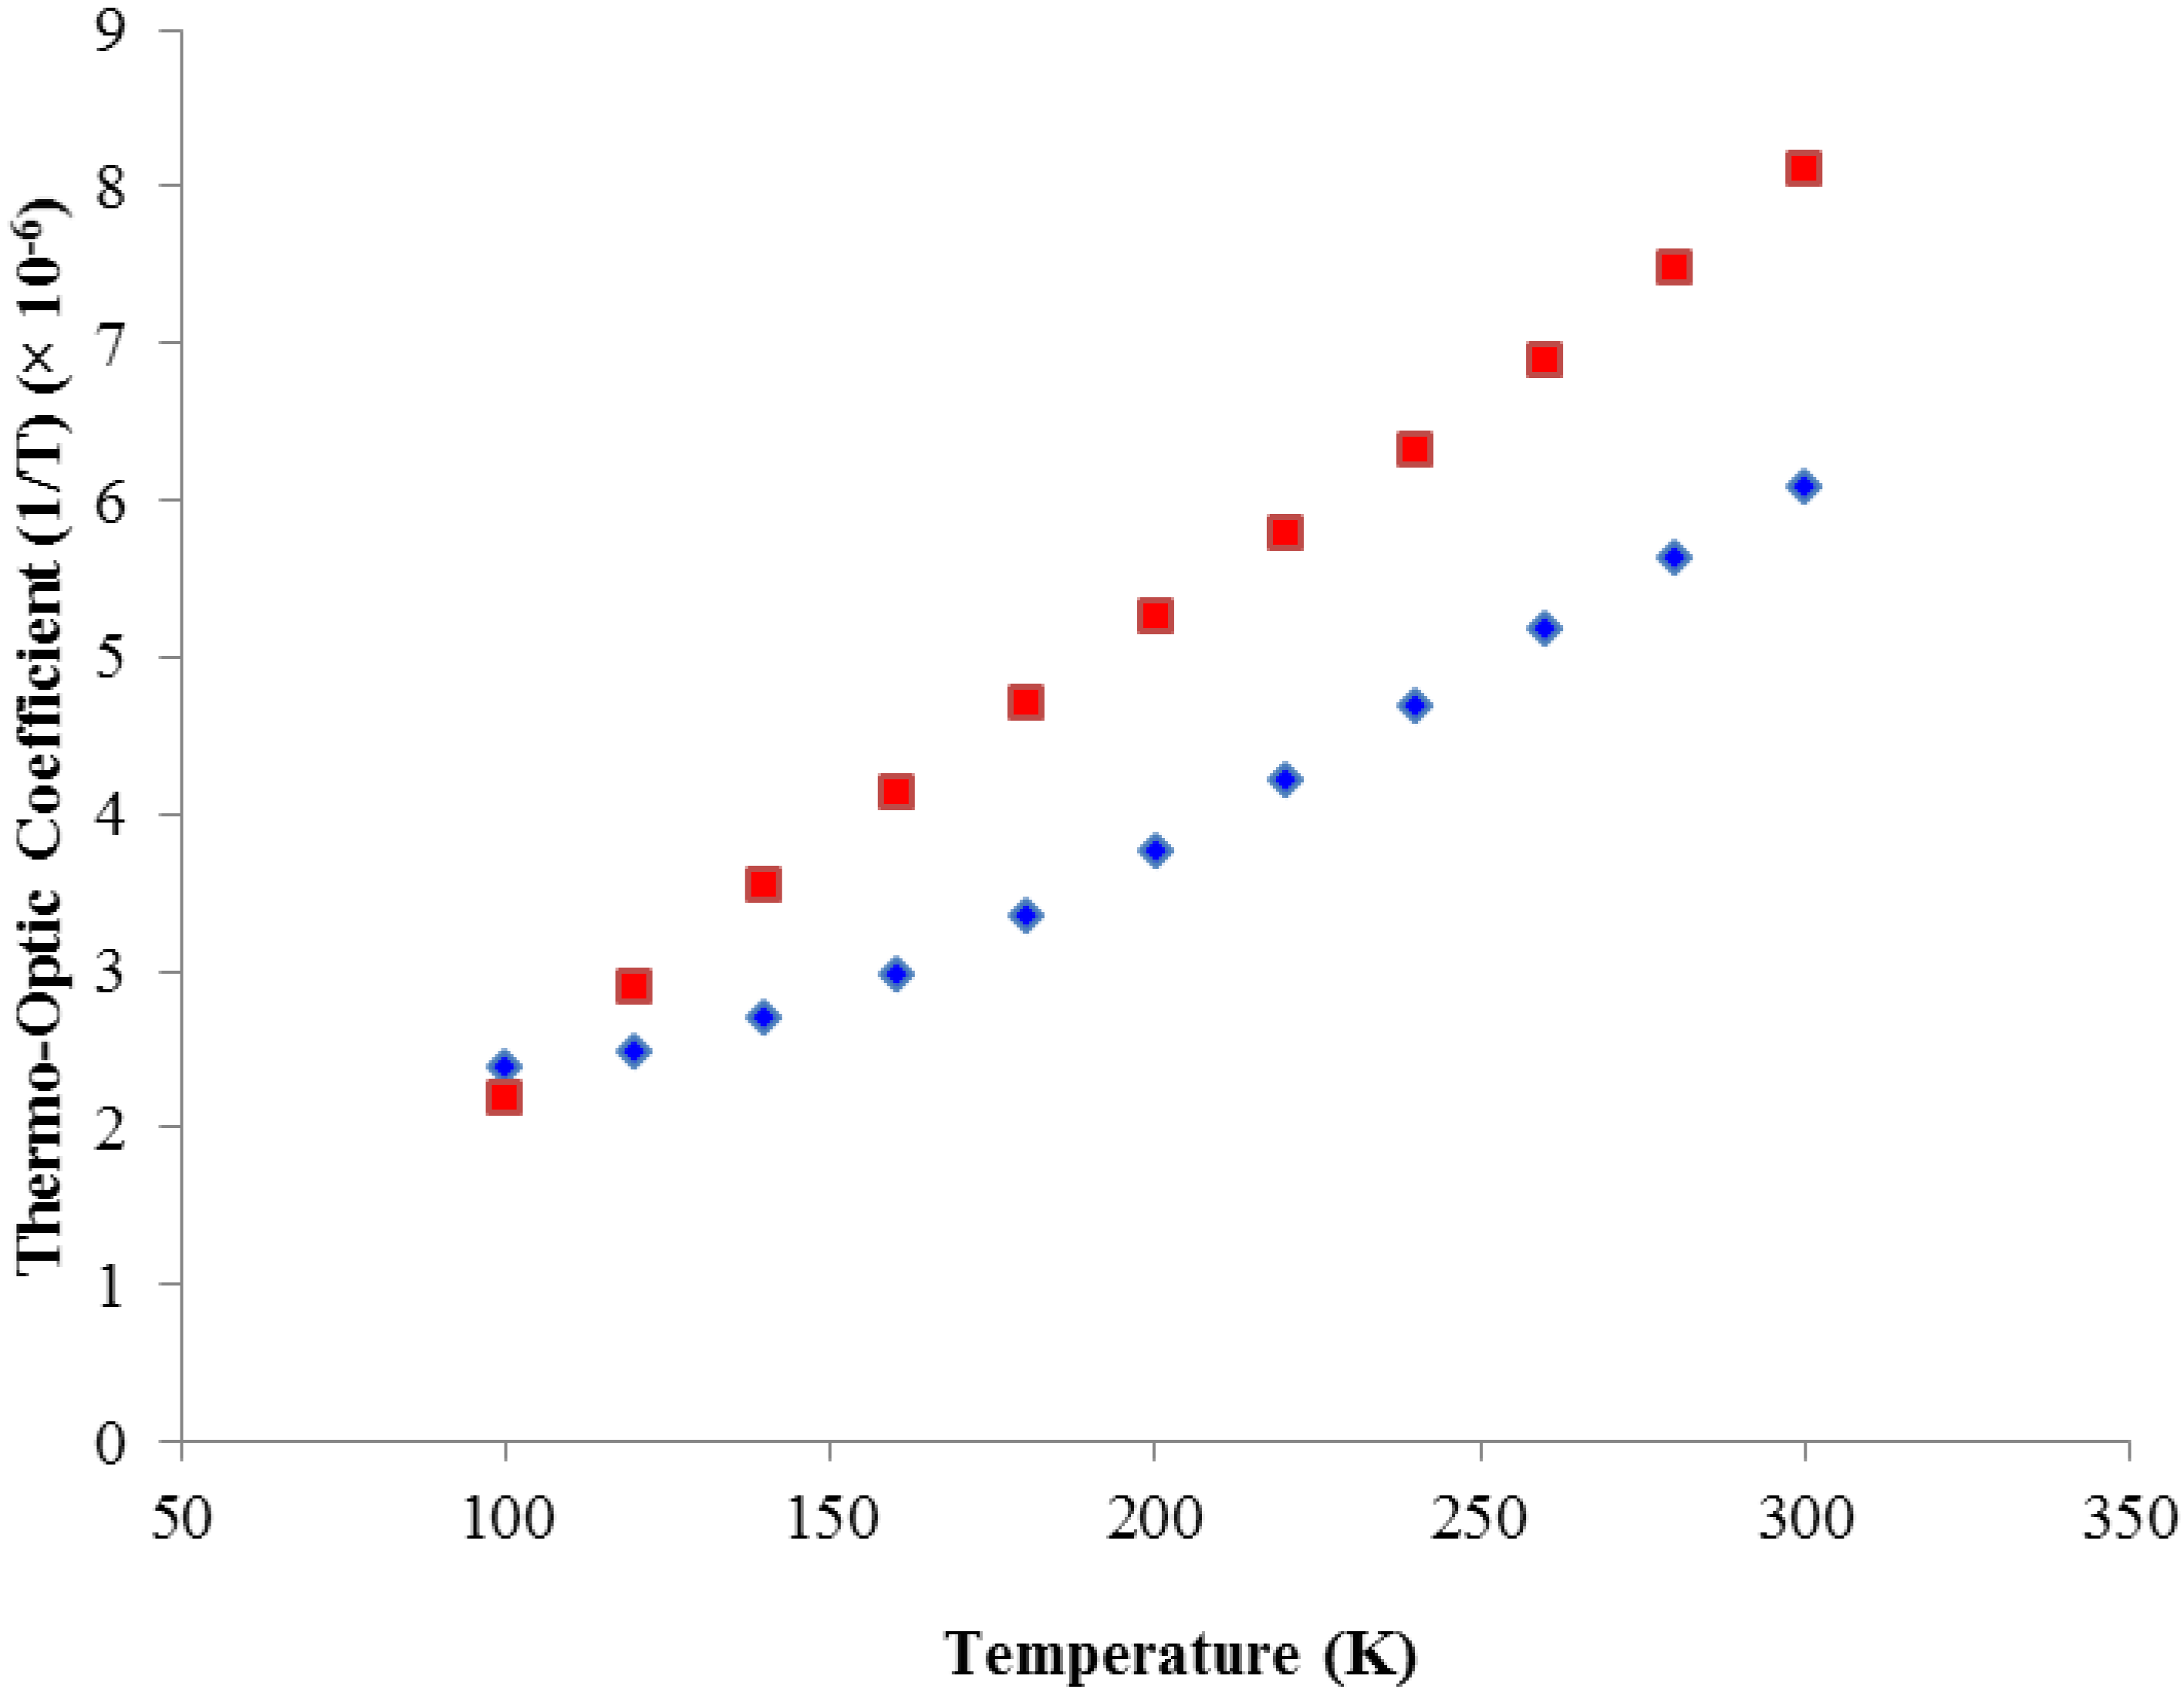
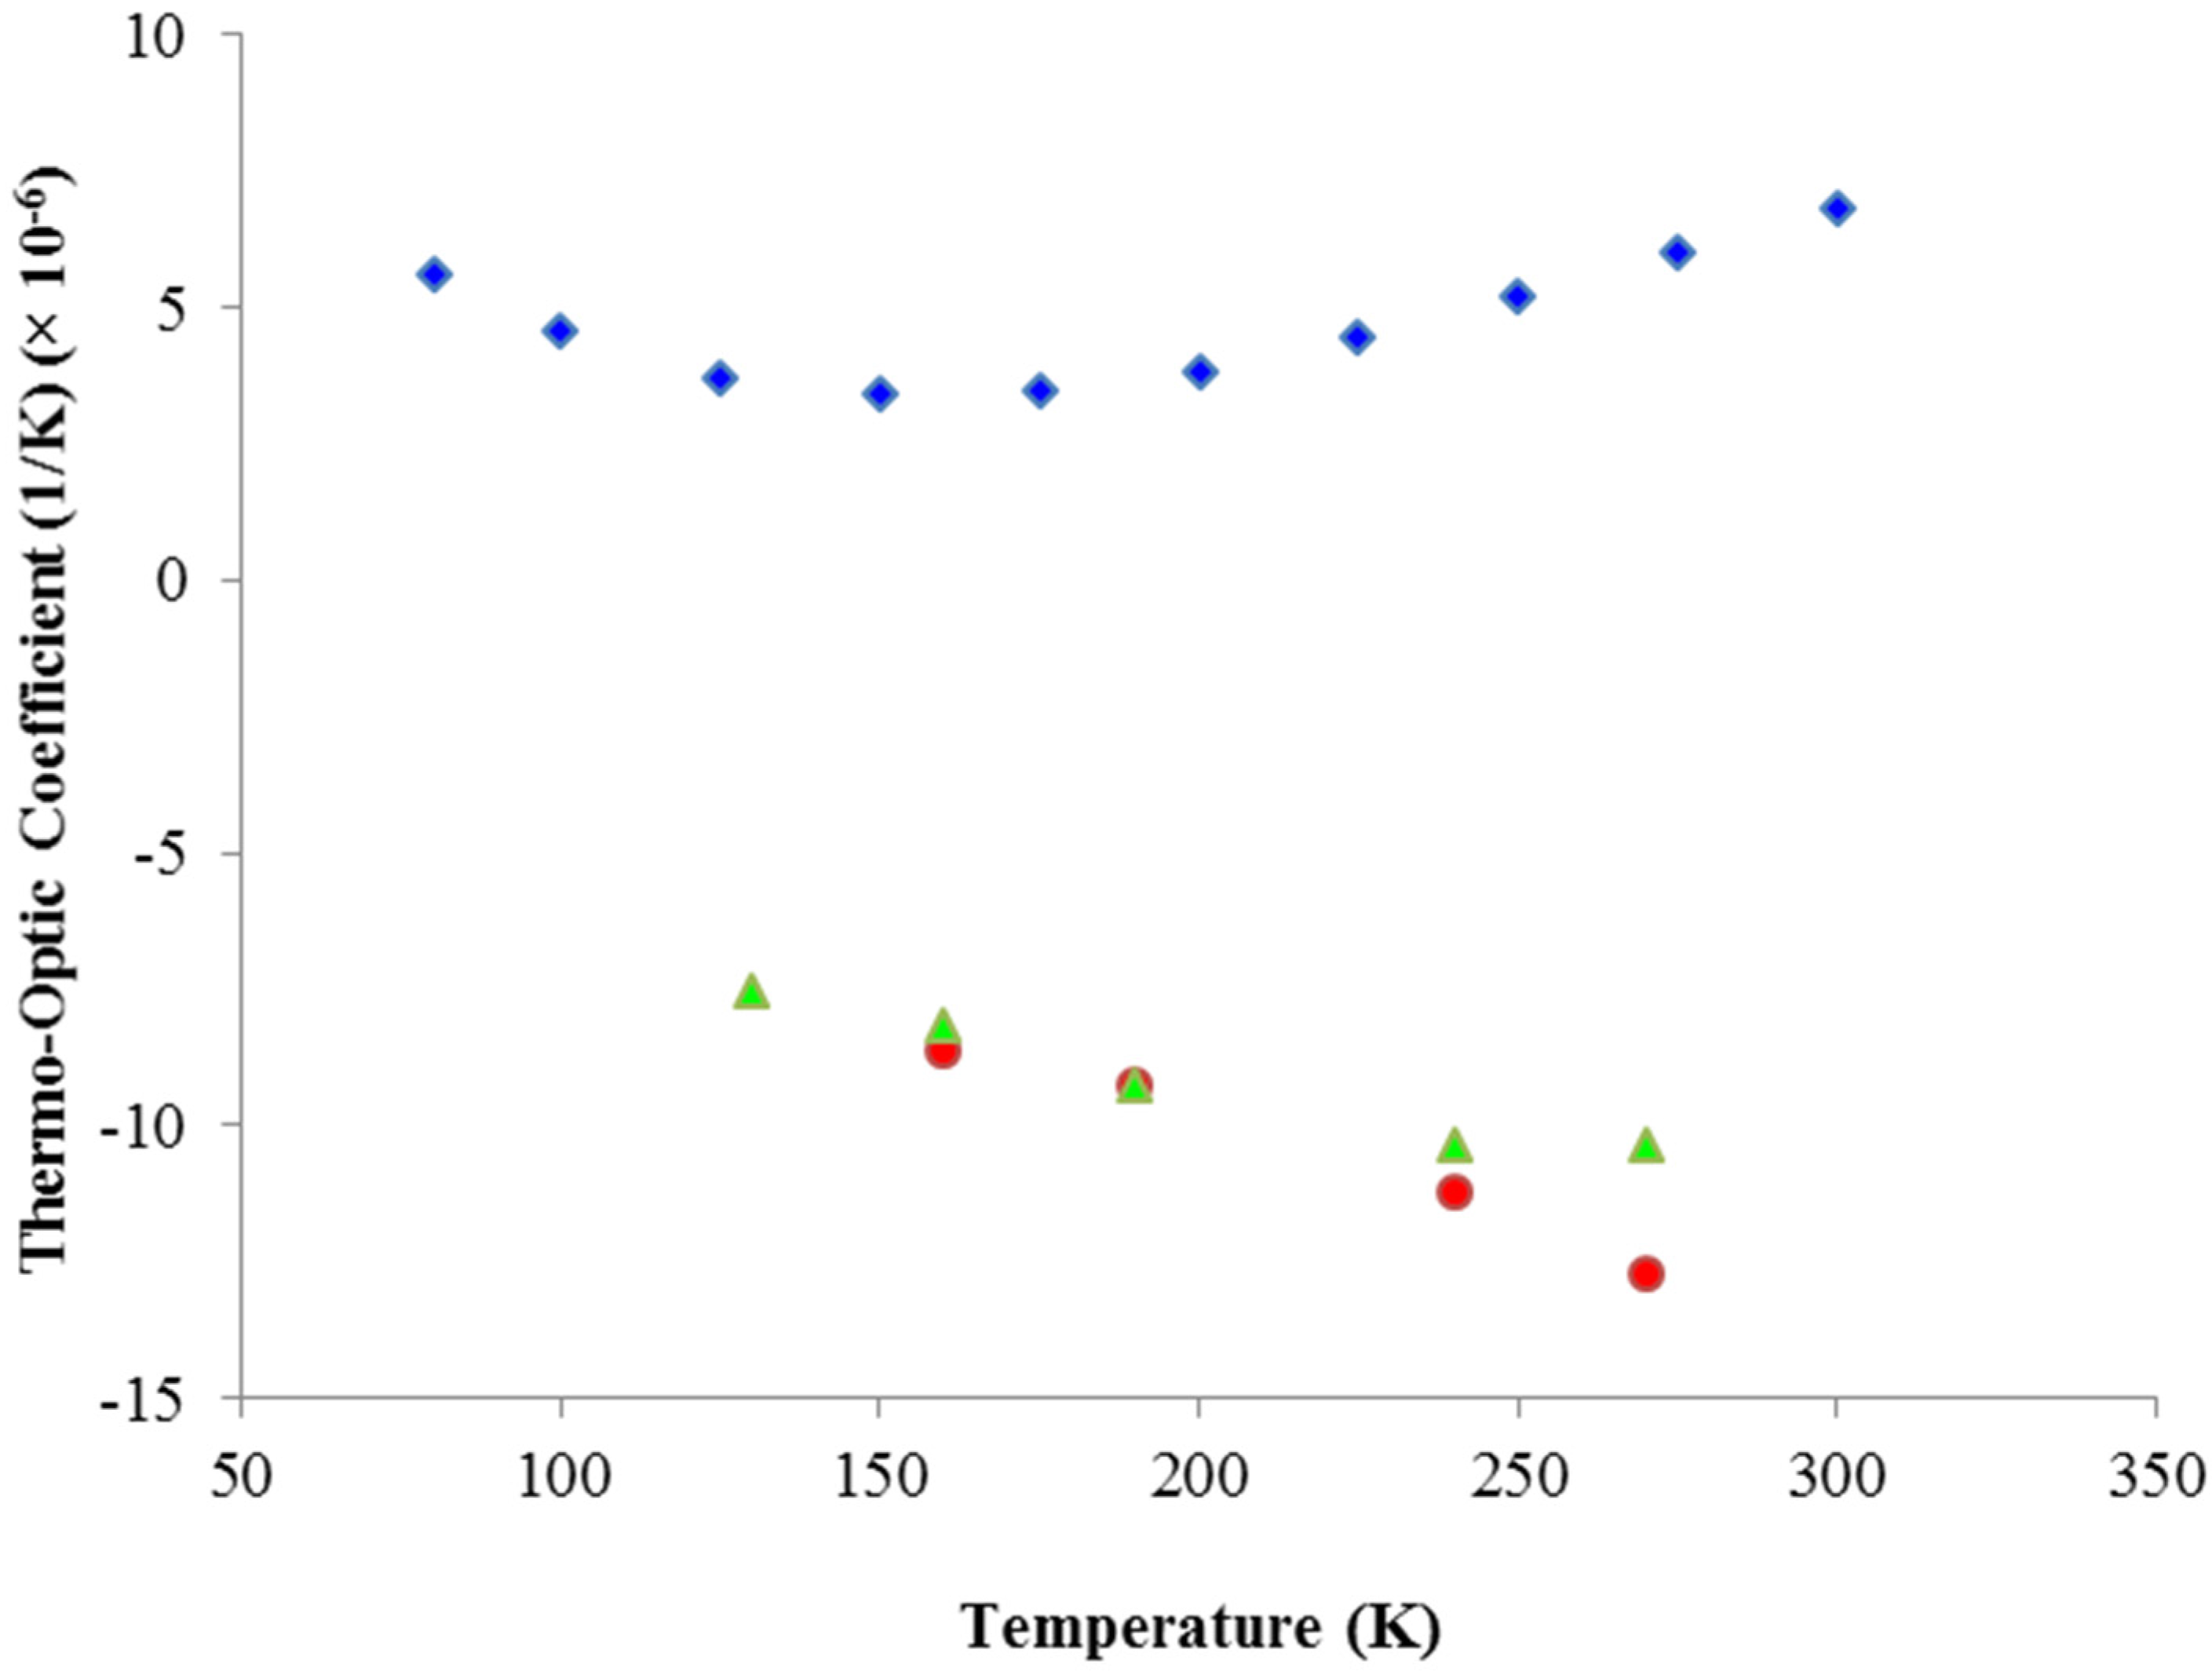
2.4. Thermo-Optic Coefficient Measurements

As with the thermal expansion data of the previous section of this paper, in this section we include only data where nearly complete data sets are available in most of the temperature range of 80–300 K, and ignore single temperature point data. Unlike our previous discussion of the thermal conductivity and thermal expansion coefficient, the theoretical foundation for the thermo-optic coefficient is not nearly as developed, and we refer the reader to previous publications [2,3,29] for more background information. In this section, we show in Figure 28, Figure 29, Figure 30, Figure 31 and Figure 32 the best data sets we were able to find in the literature, mostly generated at a wavelength of 1064 nm. Other data is available at 632.8 nm for example, and where 1064 nm data are unavailable, we will present that data here.
Figure 28 shows thermo-optic coefficient data for the oxide laser materials YAG, LuAG, and YALO, along their principal axes [29]. In Figure 29 we show the very interesting data for the thermo-optic coefficients of the fluoride laser materials YLF and LuLF [29]. The thermo-optic coefficients for both materials are negative across the entire temperature range of interest, for YLF in a monotonically decreasing way as temperature trends towards zero, and in a much more complicated way for LuLF. The negative value of dn/dT for YLF is often used to minimize thermal aberrations near room temperature by partially compensating for the positive thermal expansion coefficient. This method is obviously still helpful but of less utility as temperature is lowered for cryogenic laser operation. Figure 30 shows the thermo-optic coefficients for YVO4 and GdVO4 [3,30] along their principal axes, all of which remain positive in the temperature range of interest. The YSO b-axis remains positive as well [30], as shown in Figure 31, but for CaF2 the thermo-optic coefficient is negative for all temperatures, for both doped and undoped cases. The data for CaF2 were obtained for a wavelength of 632.8 nm [59], but are included here due to the lack of similar data near 1020 nm. For the sesquioxides, data are available only for Y2O3 and Sc2O3 [3,30] and shown in Figure 32. While single-point data near 1030 nm and 300 K and data collected at 632.8 nm are available over the temperature range of interest [59], we have not included that data here.
Figure 28. Thermo-optic coefficient as a function of absolute temperature for YAG (green) [29], LuAG (red) [29], and the three principal axes, a (blue), b (black), and c (pink) of YALO [29], measured at the wavelength of 1064 nm.
Applsci 06 00023 g028
Figure 29. Thermo-optic coefficient as a function of absolute temperature for YLF a (blue) and c (red) axes [29] and LuLF a (green) and c (pink) axes [29], measured at a wavelength of 1064 nm.
Applsci 06 00023 g029
Figure 30. Thermo-optic coefficient as a function of absolute temperature for YYO4 a (red) and c (Blue) axes [30] and GdVO4 a (pink) and c (green) axes [3], measured at a wavelength of 1064 nm.
Applsci 06 00023 g030
Figure 31. Thermo-optic coefficient as a function of absolute temperature for the YSO b-axis (blue) [30], undoped CaF2 (red) [59], and unspecified Yb-doped CaF2 (green) [59]. YSO was measured at a wavelength of 1064 nm and CaF2 measurements were at 632.5 nm.
Applsci 06 00023 g031
Figure 32. Thermo-optic coefficient as a function of absolute temperature for undoped Y2O3 (blue) [3] and Sc2O3 (red) [30], measured at a wavelength of 1064 nm.
Applsci 06 00023 g032

2.5. Elastic Parameters

The elastic parameters Young’s Modulus (E), Poisson’s ratio (ν), the bulk modulus B and the related moduli K and G have been investigated by a number of researchers. The most comprehensive study was published by Munro [62] who treated single crystal and ceramic materials with varying porosity, and whose data for single crystals we include in Table 2, which lists values for E0 (0 K) a, E(300 K), ν, and B. In [62], the Young’s modulus values were generated for a temperature of absolute zero, and the values at higher temperatures are determined using the relationship
E ( T ) = E 0 ( T = 0 ) · ( 1 a T )
where E is Young’s modulus at temperature T and a is a constant. The bulk moduli values B0 and B at 300 K in Table 2 are taken from [62] as well, with B(T) calculated from the relationship
B ( T ) = B 0 ( T = 0 ) · ( 1 b T )
Other values in Table 2 were obtained from [40,63]. The Poisson’s ratio values in Table 2 were either calculated at 300 K using the relationship
ν = 1 2 E 6 B
or taken from [40,63].
Table 2. Young’s modulus, bulk modulus, and Poisson’s ratio for selected laser materials.
Elastic Parameters E 0 ( 0   K ) (Gpa)a (10−4/K)E (300 K) (Gpa)B0 (0 K) (Gpa)b (×10−4/K)B (300 K) (Gpa)ν
Al2O33931.333772410.842350.23
CaF--110---0.30
Lu2O32041.031981610.241600.29
MgAl2O42781.982621871.971760.25
MgO3101.632951641.231580.19
Sc2O32291.222211480.981440.24
Y2O31761.371691471.931390.30
YAG--302---0.24
YbAG--257---0.25
LiYF4--77---0.33

2.6. Figures of Merit Comparison of Undoped Selected Laser Materials at 300 and 100 K

Table 3 shows a comparison between the same material at 300 and 100 K, and between different materials, by use of the figures of merit Γ T , Γ S , and Γ, for laser materials for which most or all of the needed parameters are available in the literature. Most values reported are within a few degrees of 100 or 300 K, and are listed for those values to simplify the presentation. For the heat fraction, here we assume for simplicity that the only contribution to the heat fraction is the quantum defect between the pump and lasing phonons, denoted as η h Q D . Data used in Table 3 were taken from the references associated to Figure 10, Figure 11, Figure 12, Figure 13, Figure 14, Figure 15, Figure 16, Figure 17, Figure 18, Figure 19, Figure 20, Figure 21, Figure 22, Figure 23, Figure 24, Figure 25, Figure 26, Figure 27, Figure 28, Figure 29, Figure 30, Figure 31 and Figure 32, as well as Table 2 and its references. It is important to note that the results shown are for undoped materials only.
Concentrating first on the thermal aberrations figure-of-merit Γ T , we see that for all materials considered, the figure of merit value is significantly larger at 100 K than at 300 K. This is a consequence of the increased values of k as temperature is lowered, and reduced values of α and β. The materials with the largest increase in Γ T between 300 and 100 K are YAG, YLF, YALO, Sc2O3, Y2O3, and Al2O3. These are the materials that will display the largest reductions in thermal aberrations. The material with the smallest increase in the figure-of-merit is CaF2. If this simple comparison, we ignore the fact that additional decreases in thermal aberrations may be achievable by balancing a negative value for β with the thermal expansion coefficient to achieve an athermal result as described in connection with Equation (5). YLF and CaF2 for example from benefit from that approach. It should also be appreciated that adding Yb doping density as an additional parameter, for example, will degrade the expected increases in Γ T , very significantly in some cases. As we have seen previously in this paper, Lu2O3 and LuAG have minor decreases in k as doping density increases, whereas for YAG and Sc2O3 the drop in thermal conductivity as doping density increases is severe. Perhaps the worst case is CaF2 where for 3 or 5 at. % Yb doping the thermal conductivity does not increase at any temperature (see Figure 15).
Table 3. Thermal Conductivity k, thermal expansion coefficient α, thermo-optic coefficient β, quantum defect heat fraction η h Q D , Poisson’s ratio ν, Young’s Modulus E, and calculated Figures of Merit Γ T , Γ S , and Γ for selected laser crystals at 100 and 300 K. Absolute values of negative parameter values were used to calculate figures-of-merit.
Crystalk
(W/(cm·K)
α (10−6)
(1/K)
β (10−6)
(1/K)
η h Q D νE (109)
(gr/cm2)
Γ T (1010)
(W·K)/cm
Γ S (10−5)
(W·cm)/gr
Γ
(W·cm)/gr
T
(K)
YAG0.1126.147.800.0860.243.0802.725.236.71300
0.4611.950.900.0860.243.080305.4467.83753.7100
LuAG0.0836.138.300.0860.252.8721.904.114.95300
0.2542.460.700.0860.252.872171.531.35447.86100
YLF-a0.05310.05−4.600.0450.330.7852.5510.0021.74300
0.2423.18−0.500.0450.330.785338.23144.34453.93100
YLF-c0.07214.31−6.600.0450.330.7851.699.5414.45300
0.3372.36−1.800.0450.330.785176.29270.811504.50100
YALO-a0.1172.327.700.0960.233.2206.8212.5616.31300
0.649−1.161.000.0960.233.220582.79139.361393.60100
YALO-b0.1008.0811.700.0960.233.2201.103.082.63300
0.5443.244.500.0960.233.220388.6641.8292.93100
YALO-c0.1338.708.300.0960.233.2201.923.814.59300
0.7763.001.200.0960.233.220224.5464.43536.92100
Lu2O30.1146.107.1 *0.0800.292.0193.298.2211.58300
0.3402.902.3 *0.0800.292.01963.7251.54224.09100
Sc2O30.1476.408.120.0880.242.2543.218.8010.84300
0.4550.752.200.0880.242.254313.36265.661207.55100
Y2O30.1306.306.080.0740.301.7234.5911.3318.64300
0.5200.902.400.0740.301.723325.33156.86653.58100
CaF20.08019.20−12.700.0910.301.1220.362.862.25300
0.39010.60−7.5 *0.0910.301.1225.3225.2223.79100
Al2O3-c0.3305.159.800.3350.233.8441.953.833.91300
5.1500.714.050.3350.233.844534.62433.721070.91100
Al2O3-a0.3605.9312.800.3350.233.8441.423.632.84300
3.4400.901.900.3350.233.844600.51228.551202.89100
(*)—Estimated Values.
For the stress figure-of-merit Γ S , the laser material with the largest increase in figure-of-merit between 300 and 100 K are YAG, YLF, YALO, and Al2O3. Recall that a large figure-of-merit here means that the stress values achieved are low. Materials with the lowest increase in Γ S are LuAG and CaF2. For the combined figure-of-merit Γ, the largest value is achieved with YLF, YALO, and Al2O3. Those are the materials that display the smallest thermal aberrations concurrent with low stress levels.
It is well-known [63], that the thermal rupture modulus Rm is defined by the equations
( P ex R γ L ) = 8 π ( M S σ f ) = 8 π · R m R
( P ex S γ L ) = 12 π ( M S σ f ) = 12 π · R m S
where Equation (72) applies to rod amplifiers and Equation (73) to slab amplifiers. P ex R and P ex S   are the maximum average powers, L the crystal length, M S the material parameter previously defined by Equation (13), σ f is the fracture stress, and R m R and R m S are the rupture moduli for rod and slab amplifiers respectively. The quantity γ is the ratio of heat to inversion density. The fracture stress is in most cases the stress achieved at the surface of the amplifier, because surfaces are well-known to have fracture stress values that are in most cases only a fraction of what can be achieved in the bulk. The presence of defects, inhomogeneities, debris, and cracks induced by polishing on surfaces reduce the fracture stress; in some cases such cracks and other irregularities can be removed by etching processes. As can be seen from Equations (72) and (73), the maximum extractable average power is achieved when the surface stress is equal to the fracture stress. Because the induced stress in a rod or slab crystal is in all cases inversely proportional to the material parameter M S , maximizing it will result in the minimum stresses for any given heat density Q 0 . Because the stress figure-of-merit Γ S is M S divided by the constant heat fraction, we see from Equations (72) and (73) that Γ S is then also a measure of the average power capability of any laser material. This is simply because maximizing M S results in minimum surface stress, and a small surface stress results in increased average power capability.
In any high average power laser solid-state there is always a tradeoff between wanting to achieve maximum average power whilst at the same time producing the best possible beam quality. These two conflicting requirements can be addressed in a global sense using figures-of-merit Γ T w 1 and Γ S w 2 with weighing factors ( 0 w i 1 ) that assign no importance (0) or highest importance (1) to the thermal or stress figures-of-merit.

2.7. Spectroscopic, Lasing, Linear and Nonlinear Optical Parameters

Ultrafast laser technology has for many decades been dominated by the laser material Ti:Al2O3, although other wide-bandwidth materials such as laser dyes, Nd:Glass, Yb:Glass, Cr:BeAl2O4 (Alexandrite), Cr:LiSAF, Cr:LiCAF, and Cr:Mg2SiO4 (Forsterite) have all played a significant role in the development of ultrafast sources. In the past two decades fiber laser ultrafast sources have come to the fore as well. In this paper, we are interested in exploring the development of ultrafast lasers with both high peak and high average power. The rapid development in the past 15 years of Yb-based ultrafast sources, and the further development of Ti:Al2O3 lasers both seem destined to fill the performance gap between previous ultrafast sources that demonstrated very high peak powers, but in general also very low average powers, and those that are required in the modern era. The almost concurrent development of cryogenic laser technology and the development of new Yb ultrafast sources heralds the development of a new generation of laser devices that will make possible exciting advancements in a number of scientific fields.

2.7.1. Spectroscopic and Lasing Parameters

Cryogenic cooling is not just limited to just mitigating thermal effects in solid-state laser media. Laser kinetics and spectroscopy, as well as many important laser parameters are enhanced as well. Of all the rare-earth and transition-metal lasing ions that have been investigated, Yb3+ is of particular interest. Because of the inefficiency of flashlamp pumping, the development of Yb lasers was delayed until the introduction of laser diode pump sources. Yb based lasers are free of the efficiency limiting processes of concentration quenching, excited-state absorption, and upconversion that plague many other solid-state lasers. Figure 33 shows a typical Yb energy level configuration, in this case for the newer laser material Yb:Lu2O3. Yb has only two manifolds, identified as the ground state manifold 2F7/2, and an 2F5/2 excited state manifold. Most Yb laser have laser transitions near 1029 nm ((1,1) to (0,3) transition), with some also lasing near 1080 nm ((1,1) to (0,4)) transition. The spectral absorption of Yb baser materials all display bands in the pump regions located near 940 nm, corresponding to the (0,1) to (1,2) transition, and the zero-phonon line absorption near 976 nm from the (0,1) to (1,1) transition.
Diode-pumping Yb:YAG near 940 nm can be accomplished using commercially available diode arrays and leads to a small heat fraction of about 9%, whilst pumping near 976 nm results in a very small heat fraction of < about 5%. Some laser materials like Yb:YAG have such narrow linewidths at 969 nm that they cannot be efficiently pumped at cryogenic temperatures [3]. The recent development of narrow-band Volume Bragg Grating (VBG) diode pump sources at 976 nm does however allow the pumping of the zero-phonon line for some laser materials at room temperature and broader band Yb materials at cryogenic temperatures. It is a significant advantage of Yb laser materials that they display heat fractions that are only a fraction of the more common Nd based materials, primarily because no concentration-quenching occurs, and upconversion is absent.
Figure 33. Energy level configuration for Yb:Lu2O3.
Applsci 06 00023 g033
Another compelling advantage of Yb based laser materials is that at cryogenic temperatures the finite Boltzmann population of the ground state (1,3) population is effectively eliminated, and thus the need to intensely pump the material at room temperature just to reach transparency is no longer necessary. We can write the pump power density ρ P needed to achieve transparency at 1029 nm as
ρ P = n d f 03 h ν P ( f 03 + f 11 ) · τ f
In Equation (74), n d is the total Yb ion density, ν P the frequency of a pump photon, τ f the upper level fluorescence lifetime, and f 03 and f 11 are the Boltzmann occupation factors for the lower laser terminal level, and for the upper laser level respectively (see Figure 33). This equation follows from the transparency condition
f 11 n U = f 03 n L
where n U and n L are the total population densities in the upper and lower manifolds respectively. Calculation shows that for Yb:YAG, for example, to pump 1.0 at. % Yb to transparency at room temperature requires a pump density of 1.72 kW/cm3 for 940 nm pumping. The 940 nm pump power needed to reach transparency at 77 K, however, is only 0.33 W/cm3 for 1.0 at. % Yb doping.
For Yb:YAG, the peak stimulated-emission coefficient σ e increases by close to a factor of 5 at 77 K while the long metastable lifetime of ~951 µs at room temperature is maintained at cryogenic temperatures as well. The laser saturation fluence J L S for Yb:YAG can be calculated from the equation
J L S = h ν L f 11 σ 11 03
Here, from Figure 33, σ 11 03 is the 11–03 laser transition stimulated-emission spectroscopic cross-section, and J L S is inversely proportional to it. For CW and pulsed operation, the saturation fluence then decreases by a factor of 5 as well, enhancing the power or energy extraction efficiencies in damage-limited operation. The saturation intensity, found by dividing Equation (76) by the upper level fluorescence lifetime, decreases by the same factor of 5 as well.
Clearly cryogenically cooling Yb based laser materials at temperatures <150 K leads to laser performance benefits that cannot be obtained for room temperature operation. Operating at 300 K and above, a significant fraction of the pump power is needed to just maintain unity gain, and the smaller stimulated-emission coefficients make damage-limited efficient laser extraction more difficult. CW cryogenic lasers have the potential to provide diffraction-limited output with distortion-free lasing elements and with a high wallplug efficiency (laser output average power divided by electrical input power to the diode arrays ,greater than 30% using a typical demonstrated optical-optical efficiency of 55% and a typical 55% efficiency for laser diode sources. As diode laser efficiencies continue to increase with time, perhaps to greater than 80%, and CW optical-optical efficiencies are improved to as high as 85%, Yb laser wallplug efficiencies may eventually exceed 70%. These efficiency estimates do not of course include any ancillary equipment need to operate the laser.
There are other benefits that accrue from cryogenic cooling. The absorption cross-section for Yb:YAG at the primary pump wavelength of 941 nm increases by over a factor of two. At 77 K, the doping density can be reduced by about the same factor to achieve the same absorption. Another important feature of the absorption spectrum at 77 K is that the absorption bandwidth around 941 nm narrows but still remains very broad. Similar absorption improvements are obtained in other Yb laser materials as well. This is important because the same diode arrays used to pump at room temperature will work well at 77 K. Lower density, less expensive diode pump sources can also be used at 77 K for some pumping configurations because a large pump power density is not needed to reach transparency. Another benefit is that the use of end-caps to suppress the strain-distortion at the ends of rod amplifiers can be in most cases be eliminated.

2.7.2. Linear and Nonlinear Optical Parameters

The use of cryogenic laser technology to enable the development of advanced laser systems that have both high peak and high average with excellent beam-quality is an approach that has now been proven. So far in this paper we have outlined the many reasons to seriously consider the cryogenic-cooling approach, and have reviewed many of the relevant materials parameters and their dependence on temperature. The path to high-average-power lasers is now well-mapped, however, with regard to ultrafast operation we have just begun to develop the technology because many of the relevant ultrafast parameters for low temperature operation are not known and the database of such properties is at present very limited. The design of ultrafast laser systems requires a detailed knowledge of both the nonlinear optical properties of laser crystals as well as other optical materials used in constructing such systems, and in addition demands a detailed knowledge of the dispersion properties as well. For ultrafast operation, a detailed knowledge of the linear and nonlinear indices of refraction are needed to accomplish competent designs. It is fortunate that for most of the laser materials discussed here, good Sellmeier equations are available in the literature, and are discussed later in this paper, but readers should appreciate that at the present time most reported measurements of the index of refraction and available Sellmeier equations are at or near room temperature. Sellmeier (or Cauchy or Laurent equations) are used to calculate the first, second, third, and fourth-order dispersion parameters needed to achieve dispersion compensation and balancing in ultrafast laser systems, and unfortunately relatively few measurements can be found at cryogenic temperatures. Similarly, the values of the nonlinear index of refraction n2 for various crystals and optical materials are well-known only at room temperature.
For ultrafast laser systems with pulsewidths down to the picosecond regime, nonlinear effects such as self-phase-modulation and self-focusing are the principal concerns, and dispersion effects can be mostly ignored. Below about 5–10 ps, however both nonlinear and dispersion effects must be taken into account to enable good ultrafast designs. Here we first consider just nonlinear effects, and the limitations they place on ultrafast system performance.

Nonlinear Effects in Ultrafast Lasers

Other than laser-induced optical damage, a subject that we shall discuss in Section 2.7.3, the major performance-limiting factor affecting ultrafast performance in solid-state laser systems is the existence of a finite nonlinear index of refraction n2. Much of the early work on inertial-confinement fusion involved the use of flashlamp-pumped laser glasses doped with Nd, driven by picosecond duration Nd:YLF mode-locked oscillators with typical FWHM pulse durations in the range 50–200 ps. When scaling such systems to ever larger energy/pulse and peak powers, it was discovered that whole-beam and small-scale self-focusing, caused by the nonlinear index, were the principal limiting factors, and managing and reducing such effects was a major design goal. Good summaries of the understanding and design tools used to design picosecond high-peak-power laser systems may be found in [37,64]; in addition a very good summary of the most important papers addressing the phenomena of self-focusing and the design and performance of such systems may be found in [65]. It should be pointed out that in those early systems dispersion management was not a significant design issue and CPA was just in its infancy.
For a laser pule traveling through a nonlinear medium, a finite nonlinear index leads to the temporal phenomena of self-phase-modulation, resulting in a temporally dependent phase modulation. Spatial phase modulation can lead to whole-beam and small-scale self-focusing [37,64]. In general the threshold for the formation of small-scale-self-focusing is significantly lower than that for whole-beam self-focusing. Small-scale self-focusing is caused by either phase or amplitude perturbations of a laser beam, due to dust particles, index inhomogeneities or inclusions. Such perturbations lead to localized self-focusing, resulting ultimately in self-trapped filaments that leave permanent “angel hair” tracks in the laser media. Another source of self-focused filaments is diffraction from hard apertures in the laser system, principally from the edges of laser amplifiers. If uncontrolled, small-scale-self-focusing can lead to a large fraction of the system output beam being lost to large-angle scattering in a halo surrounding the main laser beam. While we will not review in detail the methods for suppressing small-scale-self-focusing in this article, we mention that the imaging of apodized laser beams, the use of vacuum spatial filters, and relay-imaging throughout the entire laser system have been found to be effective tools [37]. Today, the use of the chirped-pulse-amplification (CPA) technique, invented at The Laboratory For Laser Energetics at the University of Rochester by Strickland and Mourou [66], in which ultrafast pulses are spectrally stretched to a much longer pulsewidth for amplification, and then re-compressed at the system output, can be used to largely avoid nonlinear effects as well as take advantage of a higher damage threshold obtained as pulsewidth increases. Calculating in advance the susceptibility of an ultrafast system to nonlinear and damage effects is an important part of ultrafast laser system design, and here we discuss the standard method for doing so.
To manage whole beam and small-scale self-focusing in high peak power laser ultrafast systems, a knowledge of the nonlinear index n2 and the corresponding nonlinear coefficient γ N is essential. A standard and often-used measure of the severity of nonlinear effects in laser systems is the B-integral [37,64], formally defined as
B ( r , z , t ) = Δ φ N L ( r , z , t ) = 2 π λ · γ N I ( r , z , t ) d z    
where B is in general a function of the beam radius r, propagation location z, and time t, I(r,z,t) is the radially, longitudinally, and temporally varying laser intensity, the wavelength λ, and z is the propagation length parameter. The B-integral is the nonlinear phase accumulation Δ φ N L ( r , z , t ) due to the nonlinear index n2, and in laser systems must be calculated for all optical and gain elements encountered by the propagating beam. It is customary to calculate the maximum value of the B-integral where the intensity I is maximum (t = 0). For spatially Gaussian beams, the B-integral value at the beam edge is typically very small, and only the on-axis value for r = 0 is normally specified. The same holds true for higher-order super-Gaussian beams where the intensity at the beam edge becomes insignificant. For any arbitrary spatial beam profile, is easy to use Equation (72) in a computer code and calculate the B-integral profile at any location in a laser amplifier or system. The nonlinear index can be calculated using the relationship [37,64]
n 2 = 12 π 2 n 0 2 c · χ ( 3 )
Here, χ ( 3 ) is the third-order susceptibility, and both n2 and χ ( 3 ) are expressed in electrostatic units (esu). The relationship between n2 and γ N is given by the simple formula [37,67]
γ N = ( 40 π c · 10 6 ) · ( n 2 n 0 ) = ( 4.19   10 3 ) · ( n 2 n 0 )
and γ N is expressed in (cm2/W). We note that in some contributions to the laser literature, n2 is often used to describe γ N , a confusing practice since they have distinctly different values and units.
Table 3 below shows reported values of n0, n 2 and γ N for a number of optical and laser materials of interest. All reported values are at or near room temperature. In some publications the value of n2 was measured, and in others γ N ; Equation (74) was used to provide missing values of either in Table 4.
Table 4. Reported room temperature values of the linear index, nonlinear index and nonlinear coefficient for a number of important laser crystals and optical materials. Also shown are the crystal type (SC-Single Crystal, GM-glassy material, or CER-Ceramic), the E-field orientation (Parallel to specified crystal axis, unspecified, and I-Isotropic), and the measurement wavelength.
Crystal TypeCrystalE Field OrientationWavelength (nm)n0n2 (esu) 10−13 γ N (cm2/W) 10−16Reference
SCAl2O3E||C10641.761.303.09[68]
SCAl2O3E||C5321.781.403.30[68]
SCAl2O3E||C3551.801.603.72[68]
SCAl2O3E||C2661.822.605.98[68]
SCAl2O3E||C6501.771.363.21[69]
SCAl2O3E||C7001.771.333.17[69]
SCAl2O3E||C7501.761.323.14[69]
SCAl2O3E||C8001.761.313.11[69]
SCAl2O3E||C8501.761.303.09[69]
SCAl2O3E||C9001.761.293.06[69]
SCAl2O3E||C9501.761.283.04[69]
SCAl2O3E||C10001.761.263.01[69]
SCAl2O3E||C10501.761.262.99[69]
SCAl2O3E||C11001.751.242.97[69]
SCLiSAFUnspecified8501.391.103.30[70]
SCLiCAFUnspecified8501.381.223.70[70]
SCLiSGAFUnspecified8501.391.103.30[70]
SCMg2SiO4Unspecified12401.640.782.00[70]
GMSiO2I10641.450.952.74[71]
GMSiO2I5271.461.053.00[71]
GMSiO2I3511.481.273.60[71]
GMBK-7I10641.521.464.00[68]
SCYAGI10641.822.515.78[72]
SCYAGI10641.822.706.21[73]
CERYAGI10641.822.495.73[72]
SCYALOE||C10641.913.337.30[52]
SCYLFUnoriented Measurement10641.46 (o) 1.48 (e)0.601.72[74]
SCLuAGI10642.145.5010.77[73]
SCY2O3I10641.785.3312.54[73]
CERY2O3I10641.785.7913.63[72]
CERSc2O3I10641.855.3212.05[72]
CERLu2O3I10641.833.969.06[72]
SCMgOI10641.741.613.88[73]
SCMgAl2O4I10641.721.503.65[73]
SCCaF2I10641.430.431.26[73]
SCYVO4E||C10802.258.0615.00[75]
SCYVO4E||A10801.968.8919.00[75]
SCYVO4Unoriented Measurement10642.06 (1)10.6221.60[76]
SCGdVO4Unoriented Measurement10642.08 (2)8.3416.80[76]
SCKGWE||Nm800–16001.999.5020.00[77]
SCKGWE||Np800–16002.037.2715.00[77]
SCKYWE||Nm10802.014.8010.00[75]
GasAirI40010.001280.00536[78]
GasAirI80010.000720.00301[78]
(1), (2): Measurements of γ N along c-axis and orthogonal b-axis found to be the same.
Al2O3, LiSAF, LiCAF, LiSGAF, Mg2SiO4, SiO2, YLF, MgO, MgAl2O4, and CaF2 all exhibit rather small nonlinear index values in the spectral region 800–1100 nm. YAG, YALO, and LuAG display somewhat larger values, while the sesquioxides Y2O3, Sc2O3, and Lu2O3 show a substantial increase, followed by the vanadates YVO4 and GdVO4 and the tungstates KGW and KYW which display the largest nonlinear index values. A much larger nonlinear index for many commonly mode-locked materials like YVO4, KGW, and KYW makes Kerr lens mode locking easier to achieve, but will provide challenges to suppress nonlinear effects in scaled up ultrafast systems consisting of multiple amplifiers. Minimizing B-integral contributions in ultrafast systems utilizing some of these newer materials will likely force designers to consider thin lasing elements such as thin-disk lasers for some applications, however, the thinner the lasing element the more troublesome the suppression of parasitics and amplified-spontaneous-emission, so undoubtedly tradeoffs will need to be made. Also, thin lasing elements have low gain as well, and require multi-passing of the element for good extraction, thus increasing the B-integral and negating any advantage.
The system B-integral, Bsys, obtained by adding up the nonlinear phase contributions from all the laser and optical elements encountered by a beam, is a useful measure of the susceptibility of a system to small-scale-self-focusing damage. In general, Bsys values of <1.5 radians are very safe, whereas values greater than about 2.5 are very concerning. While these observations are only generally true, minimizing the possibility of system damage due to nonlinear effects is very dependent on system cleanliness and the avoidance of diffraction effects.
In very short-pulse ultrafast CPA systems such as Ti:Al2O3, the generation of pulsewidths <20–30 fs requires that the accumulation of second, third, and fourth order dispersion phase in the amplifier portion of the system be compensated, a feat normally accomplished by the use of compressors that can be adjusted to cancel out second, third, and fourth order phase. In femtosecond laser systems the accumulation of nonlinear phase due the B-integral is also an important consideration, and Equation (77) is re-written
B ( r , z , t ) = Δ φ N L ( r , z , t ) = 2 π · ( 1 λ ) γ N I ( r , z , t ) d z    
reflecting the fact that temporal nonlinear phase Fourier maps into spectral phase. Because of the resulting nonlinear group delay, reducing the B-integral value to <1 has advantages in that the compensation of small amounts of nonlinear group delay in the compressor can be achieved.

Dispersion Effects in Ultrafast Lasers

The understanding of dispersion is a very important aspect of ultrafast laser technology, particularly for pulsewidths <about 10 ps, and into the fs and as regimes, and the successful management of dispersion is prerequisite to the success of ultrafast laser systems. Here, we review the description of dispersion and apply the formalism to the calculation of the first, second, third, and fourth-order dispersion for a number of important laser materials. We first consider the variation of the linear index of refraction with wavelength or frequency. If we consider an input pulse if field Ein(t) with spectrum Ain(ω) propagating through a dispersive dielectric crystal, the output pulse can be written as the Fourier relationship
E o u t ( t ) = ( 1 2 π ) · A i n ( ω ) e i ω t e i ψ ( ω ) d ω
ω is the angular frequency, and ψ ( ω ) is the spectral phase at frequency ω. Upon passage through a medium of length L, we can relate the spectral phase to the propagation constant of the medium β(ω), through
ψ ( ω ) = β ( ω ) · L
It is commonplace [70] to expand both ψ ( ω ) and β ( ω ) about a central frequency ω 0 using a Taylor series approach, resulting in
ψ ( ω ) = ψ ( ω 0 ) + ψ ω · ( ω ω 0 ) + 1 2 2 ψ ω 2 · ( ω ω 0 ) 2 + 1 6 3 ψ ω 3 · ( ω ω 0 ) 3 +
or,
ψ ( ω ) = ψ ( ω 0 ) + ψ 1 · ( ω ω 0 ) + 1 2 ψ 2 · ( ω ω 0 ) 2 + 1 6 ψ 3 · ( ω ω 0 ) 3 +
β(ω) is then given by
β ( ω ) = β ( ω 0 ) + β 1 · ( ω ω 0 ) + 1 2 β 2 · ( ω ω 0 ) 2 + 1 6 β 3 · ( ω ω 0 ) 3 +
and we write in general
ψ n = n ψ ω n   ,   β n = n β ω n
The derivatives are evaluated at ω = ω 0 , and we also have
ψ n =     β n · L
β(ω) can also be expressed as
β ( ω ) = ω   n ( ω ) c
where c is the speed of light. Using Equation (88) we can then calculate the dispersion parameters β i as
β 1 = d β d ω = n ( ω ) + ω d n d ω
β 2 = d 2 β d ω 2 = 2 d n d ω + ω d 2 n d ω 2
β 3 = d 3 β d ω 3 = 3 d 2 n d ω 2 + ω d 3 n d ω 3
β 3 = d 3 β d ω 3 = 4 d 3 n d ω 3 + ω d 4 n d ω 4
Most index of refraction dispersion equations are expressed in terms of wavelength, rather than angular frequency. The most common dispersion equation used is the Sellmeier equation, often written in its’ most general form as
n ( λ ) 2 = A 0 + i A i λ 2 ( λ 2 λ i 2 )  
Here n is the wavelength dependent index of refraction, and A 0 , A i and λ i are fitting constants. In many cases A 0 = 1 , and i is usually ≤ 4. Another equation often found in the literature is the Laurent series formula,
n ( λ ) 2 = A + B · λ 2 + i C i λ 2 i
where A, B, and C i are constants, and the index i takes the values 1, 2, 3, and 4. The Cauchy equation is also often used, which may be obtained by setting B = 0 in Equation (94). For the calculations reported below in this paper, the appropriate index equation was converted to angular frequency, resulting in the following frequency dependent Sellmeier equation:
n ( ω ) 2 = A 0 + i A i ω i 2 ( ω i 2 ω 2 )  
Table 5 shows calculated values of the index of refraction, the wavelength the values were calculated at, and the first, second, third, and fourth order dispersion coefficients. In addition, references are provided to allow interested readers to know what form of the index equation was used, as well as the values of the constants. We have included crystals and optical materials often used in ultrafast lasers, including Ti:Al2O3, Cr:LiSAF, Cr:LiCAF, and a number of Yb laser materials. Some entries in Table 5 have also served as a check on the calculational accuracy. For example, for BK-7 at 800 nm and fused silica (SiO2) at 800 nm, the calculated dispersion parameter values agree closely with previously published results [32]. For Ti:Al2O3, the dispersion parameters were calculated for a Sellmeier equation used for sapphire grown using the heat exchanger method (HEM) [79], and are similar to previously published results [32], but a one-to-one comparison cannot be made because the data and Sellmeier equations used in [32] were not revealed. The variation of the index of refraction with wavelength can also be slightly different depending upon the crystal growth method, and the corresponding Sellmeier equations will be somewhat different as well, and it is likely that such differences explain the variation between our calculations and [32]. We have included in Table 5 not only legacy materials like LiSAF, LiCAF, YAG, YALO, and YLF, but also the newer sesquioxide laser materials Y2O3, Sc2O3, and Lu2O3, and the tungstate materials KGW, KYW, and KYbW. One case deserves mentioning here: that of Cr:LiSAF. We found published values for the second (21.0 fs2/mm) and third-order (185.0 fs3/mm) dispersion coefficients for the e-axis [70] that do not agree well with our results, nor with those found elsewhere [80]. Values in [70] were calculated using the Sellmeier equations of [81]. We calculated β2 and β3 using both the Sellmeier equations of Peterson [81] and Payne [82]. While both Sellmeier equations differ substantially from the measured values, the data of Peterson [81] gave the worst agreement, so in Table 5 we show our calculated values (7.9 fs2/mm) and (15.7 fs3/mm) obtained using the Payne Sellmeier equation. It has been noted however [80], that even the Payne Sellmeier equations give results considerably different from the measured results. In addition, our results differ from the calculated results of [80], where the reported calculated values using the same Sellmeier equation are (9.7 fs2/mm) and (28.6 fs3/mm). While we have endeavored to calculate accurate values for the dispersion parameters reported in Table 5, and have checked and compared our results to other values found in the literature where available, readers should be aware that coding long and tedious Sellmeier, Cauchy, Laurent, and other equations and their derivatives up to the fourth order may lead to some inadvertent errors being present.
We conclude this section of the paper by again pointing out that all of the Sellmeier equations and calculated values for the dispersion parameters are for room-temperature operation. It is now well-known that the value of the index of refraction at room temperature are diminished at lower (cryogenic) temperatures by the thermo-optic coefficient dn/dT. Calculation shows that if the change in index of refraction for YAG for example by integrating the thermo-optic coefficient over the range 300 to 100 K, the index value at 300 K is affected in the third decimal place. For a variation of the index in the third decimal place, the Sellmeier equation will change as well, and thus will all of the dispersion parameters. The same conclusion may be reached for most other crystals as well. It is then important going forward to obtain measurements of the indices of refraction as a function of wavelength at cryogenic temperatures.
Table 5. Calculated room temperature values of the linear index and the first, second, third, and fourth order dispersion parameters for legacy and newer laser crystals of length 1 mm. Also shown are the operating laser wavelengths, as well as references to allow readers to know what Sellmeier or alternative index equation was used in the calculations.
CrystalWavelength (nm)n0β1 (fs/mm)β2 (fs2/mm)β3 (fs3/mm)β4 (fs4/mm)Reference
Al2O3-(e) (HEM)8001.75405928.149.948.3−30.0[79]
Al2O3-(o) (HEM)8001.76205960.642.248.7−36.7[79]
Al2O3-(e) (HEM)10301.74775912.411.981.3−127.6[79]
Al2O3-(o) (HEM)10301.75525946.77.087.9−146.4[79]
LiSAF-(e)8501.40544709.27.915.7−15.0[82]
LiSAF-(o)8501.40744720.09.528.4−1.2[82]
LiCAF-(e)7601.38904654.623.613.6−3.3[83]
LiCAF-(o)7601.38994659.523.113.7−3.9[83]
YAG10601.82436148.660.968.3−46.9[84]
YAG10301.81536121.766.666.7−41.6[84]
LuAG10601.82796136.574.645.77.3[85]
LuAG10301.82496151.864.466.1−39.3[85]
YALO-(a)10401.93416502.893.455.57.6[86]
YALO-(b)10401.92586473.290.353.57.2[86]
YALO-(c)10401.91406430.184.249.76.3[86]
YLF-(e)10201.47054927.621.724.2−18.7[87]
YLF-(o)10201.44834851.818.923.3−21.3[87]
YVO4-(e)10602.16615947.6341.1305.069.1[88]
YVO4-(o)10601.95796662.4191.7168.518.2[88]
KGW-(Np)10321.98296726.0165.8129.69.1[48]
KGW-(Nm)10272.01136828.7178.7139.512.6[48]
KGW-(Ng)10242.06257005.8216.0141.53.5[48]
KYW-(Np)10281.96906673.0184.4429.521.3[48]
KYW-(Nm)10282.00736814.0207.2495.126.0[48]
KYW-(Ng)10282.05146972.1223.8543.228.9[48]
KYbW-(Np)10401.99326772.2130.5106.2−29.9[48]
KYbW-(Nm)10262.03656897.3173.2421.556.3[48]
KYbW-(Ng)10242.07897074.3179.6307.720.9[48]
Y2O310301.88896386.6113.993.2−14.0[89]
Sc2O310301.96546659.2124.8108.6−30.4[89]
Lu2O310301.91025691.4126.1100.6−15.8[89]
CaF210301.42874784.118.420.2−14.7[52]
BK-7, N-BK-78001.51085088.844.632.0−10.0[52]
BK-7, N-BK-710301.50715070.225.144.7−49.8[52]
SF108001.71125836.7159.2102.933.4[90]
SF1010301.70305766.4108.197.3−15.7[90]
SF118001.76486036.4189.4124.148.3[52]
SF1110301.75535952.9128.9113.0−7.3[52]
N-SF148001.74295957.1176.4117.641.6[52]
N-SF1410301.73375879.7118.3110.2−17.7[52]
Crystal SiO2 (e)10301.52825189.30.498.8−193.5[91]
Crystal SiO2 (o)10301.53425162.825.846.2−53.6[91]
Crystal SiO2 (e)8001.53485200.638.150.4−43.9[91]
Crystal SiO2 (o)8001.53815181.945.832.1−12.0[91]
Fused Silica (SiO2)8001.45334890.536.127.3−11.0[92]
Fused Silica (SiO2)10301.45004875.719.040.4−49.8[92]

2.7.3. Optically-Induced Laser Damage

Perhaps the most important parameter in the design of any laser system is the laser-induced damage threshold (LIDT), the value of fluence, intensity, or average power that if exceeded, will result in irreversible damage to at least one (usually critical) optical or lasing element in the laser system. If the weakest component in a laser system has an LIDT that is a fraction of the laser saturation fluence, one cannot obtain a high overall system efficiency because for high extraction efficiency the input laser fluence must be at least equal to the saturation fluence, and in the case of Gaussian beams, many times the saturation fluence [28]. A small saturation fluence is obtained for laser materials with a large stimulated-emission cross-section (see Equation (76)). Because the LIDT has a laser pulsewidth dependence that results in picosecond pulses having a smaller damage threshold than nanosecond pulses, and femtosecond less than picosecond [93], it was a challenge in early ultrafast lasers to be able to scale laser output due to the limiting value of LIDT’s in the picosecond and particularly in the femtosecond regime. It was because of those damage limitations, as well as to avoid the type of nonlinear effects discussed in the aforementioned, that the technique of CPA was invented [66]. Using CPA, a short femtosecond pulse for example is stretched using diffraction gratings or other means, to the picosecond regime where damage thresholds are substantially larger, After stretching, the initial pulse is amplified in a following beam line of amplifiers where the larger pulsewidth allows nonlinear effects to be avoided or minimized, and where more efficient extraction can be obtained due to the larger damage threshold. After amplification, the stretched pulse is compressed, in many cases using a diffraction grating compressor, to restore the pulsewidth close to its’ initial value. Managing the accumulated dispersion, and compensating for it using certain types of compressor configurations determines how close to the initial pulse width the final compressed pulse comes.
The literature of LIDT’s is vast. Interested readers that have a need to thoroughly explore the field may consult the book by Wood [94], as well as the many publications of the Annual Boulder Damage Symposium (Boulder, CO, USA), a conference that celebrated its 45th year in 2013. The LIDT of laser and optical materials is a consequence of the many physical mechanisms connected with the high fields achievable with laser. When intense beams are transmitted through crystals or glasses, many nonlinear effects such as harmonic generation, self-focusing and self-phase modulation, nonlinear absorption, excited-state absorption, stimulated Brillouin or Raman scattering, and others may occur, and contribute to irreversible damage. In addition electron avalanches may occur in the laser in response to a strong E field, and plasmas may form on a surface or internally. High average power effects, that are now becoming more and more important, can be caused by absorption and melting of dielectric crystals or dielectric coatings, and can lead to distortion depolarization, and ultimately fracture of crystals or other optics. It is a general observation, supported by measurements, that the LIDT of surfaces are substantially smaller than bulk LIDT’s. LIDT’s are a strong function of the laser wavelength, with visible and UV LIDT’s much less than those obtained around 1000 nm [93,94]. The pulsewidth dependence of LIDT’s is rather simple in the nanosecond regime, varying as the pulsewidth to the ½ power [93,94], however for picosecond and femtosecond pulses the dependence is more complicated [95].
It is a shortcoming of the present state-of-the-art that high average power effects have received far less attention than high peak power effects. Now that we are witnessing the advent of laser systems that have concurrent high and peak average powers, much attention will be focused in the near future on determining the LIDT’s of laser crystals and optics under very extreme conditions. LIDT’s at low temperature are scarce and in most cases have not been measured. Recently a publication reported a reduced damage threshold at cryogenic temperatures relative to the room temperature value [96]. This in contrast to a number of publications that have reported increased damage thresholds at cryogenic temperatures [97,98,99]. Increased laser damage threshold measurement efforts at cryogenic temperatures are needed to further our understanding of the design of cryogenic laser devices and to increase our knowledge of the scaling of the damage threshold with temperature.

2.7.4. Spectral and Laser Properties of Traditional and New Laser Materials

The design and performance of ultrafast lasers is critically dependent upon the spectral and laser properties of the amplifier materials used. We have already, in the aforementioned, discussed the important nonlinear parameters and the dispersion parameters needed to optimize the performance of ultrafast lasers. Here, we review the spectral properties of a number of important laser materials, including a number of legacy ultrafast materials as well as some newer laser materials, all based upon the Yb3+ lasing ion. A more complete compilation of properties for most Yb based laser materials will be presented elsewhere [100]; here we show only Yb materials for which both room and cryogenic temperature data are available. Table 6 shows the laser material, the crystal classification (anaxial (A) and uniaxial (U)), the absorption span δ λ a b s (FWHM) and wavelength of peak absorption λ a b s P , the absorption bandwidth Δ λ abs (FWHM), peak absorption cross-section σ a b s P , the wavelength of the peak stimulated-emission cross-section λ e m P , the emission bandwidth Δ λ e m (FWHM), the value of the peak stimulated-emission cross-section σ e m P , the upper level (2F5/2) fluorescence lifetime τ F , the absolute temperature, and the references from whence the data were taken [3,6,30,101,102,103,104,105,106,107,108,109,110].
The three legacy laser materials shown, Ti:Al2O3, Cr:LiSAF, and Cr:LiCAF, are uniaxial and we show data for the cases E||c and E||a, and at room temperature. While Ti:Al2O3 is often cooled to near 77 K to reduce thermal aberrations [31,33,34,35], little data is available in the literature regarding the spectral properties at that temperature. For Cr:LiSAF and Cr:LiCAF, we were not able to find any cryogenic data available in the literature. The bandwidths for these materials indicate that for transform-limited Gaussian pulses, pulsewidths of as short as 4, 6, and 7 fs can be achieved, in the absence of gain-narrowing.
For the Yb materials Yb:CaF2, Yb:LuAG, Yb:YAG, and Yb:YLF, complete sets of spectral parameters are available at room temperature and near 77 K, and both are shown in Table 6. We have also included the recently developed sesquioxide laser materials Yb:Lu2O3, Yb:Sc2O3, and Yb:Y2O3, but complete data sets are available at present only at 300 K. The first Yb laser material to be investigated at cryogenic temperature was Yb:YAG [1], but the emission bandwidth is narrow and only capable of producing Gaussian transform-limited pulses of about 1 ps at 80 K, due to the narrower gain bandwidth [3]. The material Yb:LuAG, very similar to Yb:YAG, is capable of producing 1.4 ps pulses. The first Yb:YLF laser operated at cryogenic temperatures was reported in [109]. Yb:YLF is an interesting ultrafast cryogenic laser material, due to the wide emission bandwidths for both π and σ polarizations. For E||c and E||a at 300 K, the shortest transform-limited Gaussian pulsewidths that can be obtained are about 43 and 57 fs at 300 K, and 191 and 55 fs at 79 K. The material is robust and has relatively high thermal and stress figures of merit (Table 3). The first demonstration of combining two Yb laser materials together (Yb:YAG and Yb:GSAG) to broaden the gain bandwidth, produced recompressed shorter pulses of ~1.6 ps duration [110]. Not all of the spectral properties of Yb:GSAG are known, particularly at room temperature, but we have included the known properties in Table 6.
Table 6. Spectral properties of legacy and Yb-based ultrafast laser materials at room and cryogenic temperatures.
CrystalCrystal Type δ λ a b s ,   λ a b s P (FWHM) (nm) Δ λ a b s (FWHM) (nm) σ a b s P (cm2) (10−20) λ e m P (nm) Δ λ e m (FWHM) (nm) σ e m P (cm2) (10−20) τ F (µs)Temp (K)Refs
Ti3+:Al2O3U455–580120.06.45790225.03.03.2300[6,101]
493
E||c (π)
Peak
Ti3+:Al2O3U455–575122.02.79800236.01.53.2300[6,101]
E||a (σ)493
Peak
Cr3+:LiSAFU600–70397.75.4850192.04.867300[102]
E||c637
Peak
Cr3+:LiSAFU593–693102.32.6850171.41.667300[102]
E||a637
Peak
Cr3+:LiCAFU585–68085.82.95763127.01.3175300[102]
E||c647
Peak
Cr3+:LiCAFU580–68092.72.00763127.00.9175300[102]
E||a647
Peak
Yb3+:CaF2A915–97053.30.83103026.70.251900300[103]
97921.80.57
Yb3+:CaF2A915–97053.30.88103343.30.50190077[103]
9802.931.5799010.70.83
Yb3+:Lu2O3A930–95311.040.80103313.21.89820300[104]
9783.493.81107814.30.89[105]
Yb3+:LuAGA915–94530.00.9410303.42.50950295[104]
9702.751.01[106]
Yb3+:LuAGA915–94527.01.7310301.113.90950100[104]
9701.102.47[106]
Yb3+:Sc2O3A94226.20.87104113.41.44800300[107]
9752.44.40109510.70.33
Yb3+:Y2O3A9505.960.87103114.31.06850300[107]
9773.972.40107615.60.42
Yb3+:YAGA9692.8 (300)3.2810298.52.3951300[3,27]
94118.3 (300)1.22
Yb3+:YAGA9690.06 (80)37.010291.511.095175–80[3,27]
94112.6 (75)1.70
Yb3+:YLFU96010.01.1102036.00.82080300[3,108]
E||c (π)9928.00.4[109]
Yb3+:YLFU929–95325.00.3102027.00.72080300[3,108]
E||a (σ)9606.00.4[109]
97112.00.3
Yb3+:YLFU960< 16.810208.01.8199079[3,108]
E||c (π)971< 0.51.4[109]
Yb3+:YLFU930–95021.00.8102028.01.0199079[3,108]
E||a (σ)960<22.4[109]
971<12.8
Yb3+:GSAGA928–95022-----300[30,110]
946
Yb3+:GSAGA930–94717-10302.45.6-77[30,110]
943
Yb:CaF2 has come to the fore recently because of its broad emission bandwidth, resulting in <100 fs pulsewidths from a mode-locked laser recently [111]. From Table 6, we see that it has a wide emission bandwidth, particularly at 77 K. The Gaussian transform-limited pulsewidths expected are 59 fs and 37 fs at 300 and 77 K respectively. As we have seen previously in Section 2.6, however, this laser material has the lowest thermal and stress figures-of-merit (Table 3), potentially limiting its usefulness as a material for high average power ultrafast systems. As shown in Figure 15, even for modest Yb doping levels of a few at. %, the thermal conductivity of Yb:CaF2 can be less than the undoped value at 300 K at temperatures of both 300 and 80 K. As a consequence, the figures of merit are even worse for Yb-doped CaF2 crystals. Recall that the figures-of-merit shown in Table 3 are for undoped crystals only. An attractive feature of this material for systems applications is that it has a very low nonlinear index (Table 4), although such a low value makes Kerr-lens mode-locking much more difficult.
For the sesquioxide laser materials at room temperature, the expected Gaussian transform-limited pulsewidths are calculated to be 119, 119, and 109 fs for Yb:Lu2O3, Yb:Sc2O3, and Yb:Y2O3 respectively. All have relatively good thermal and stress figures-of-merit (Table 3).

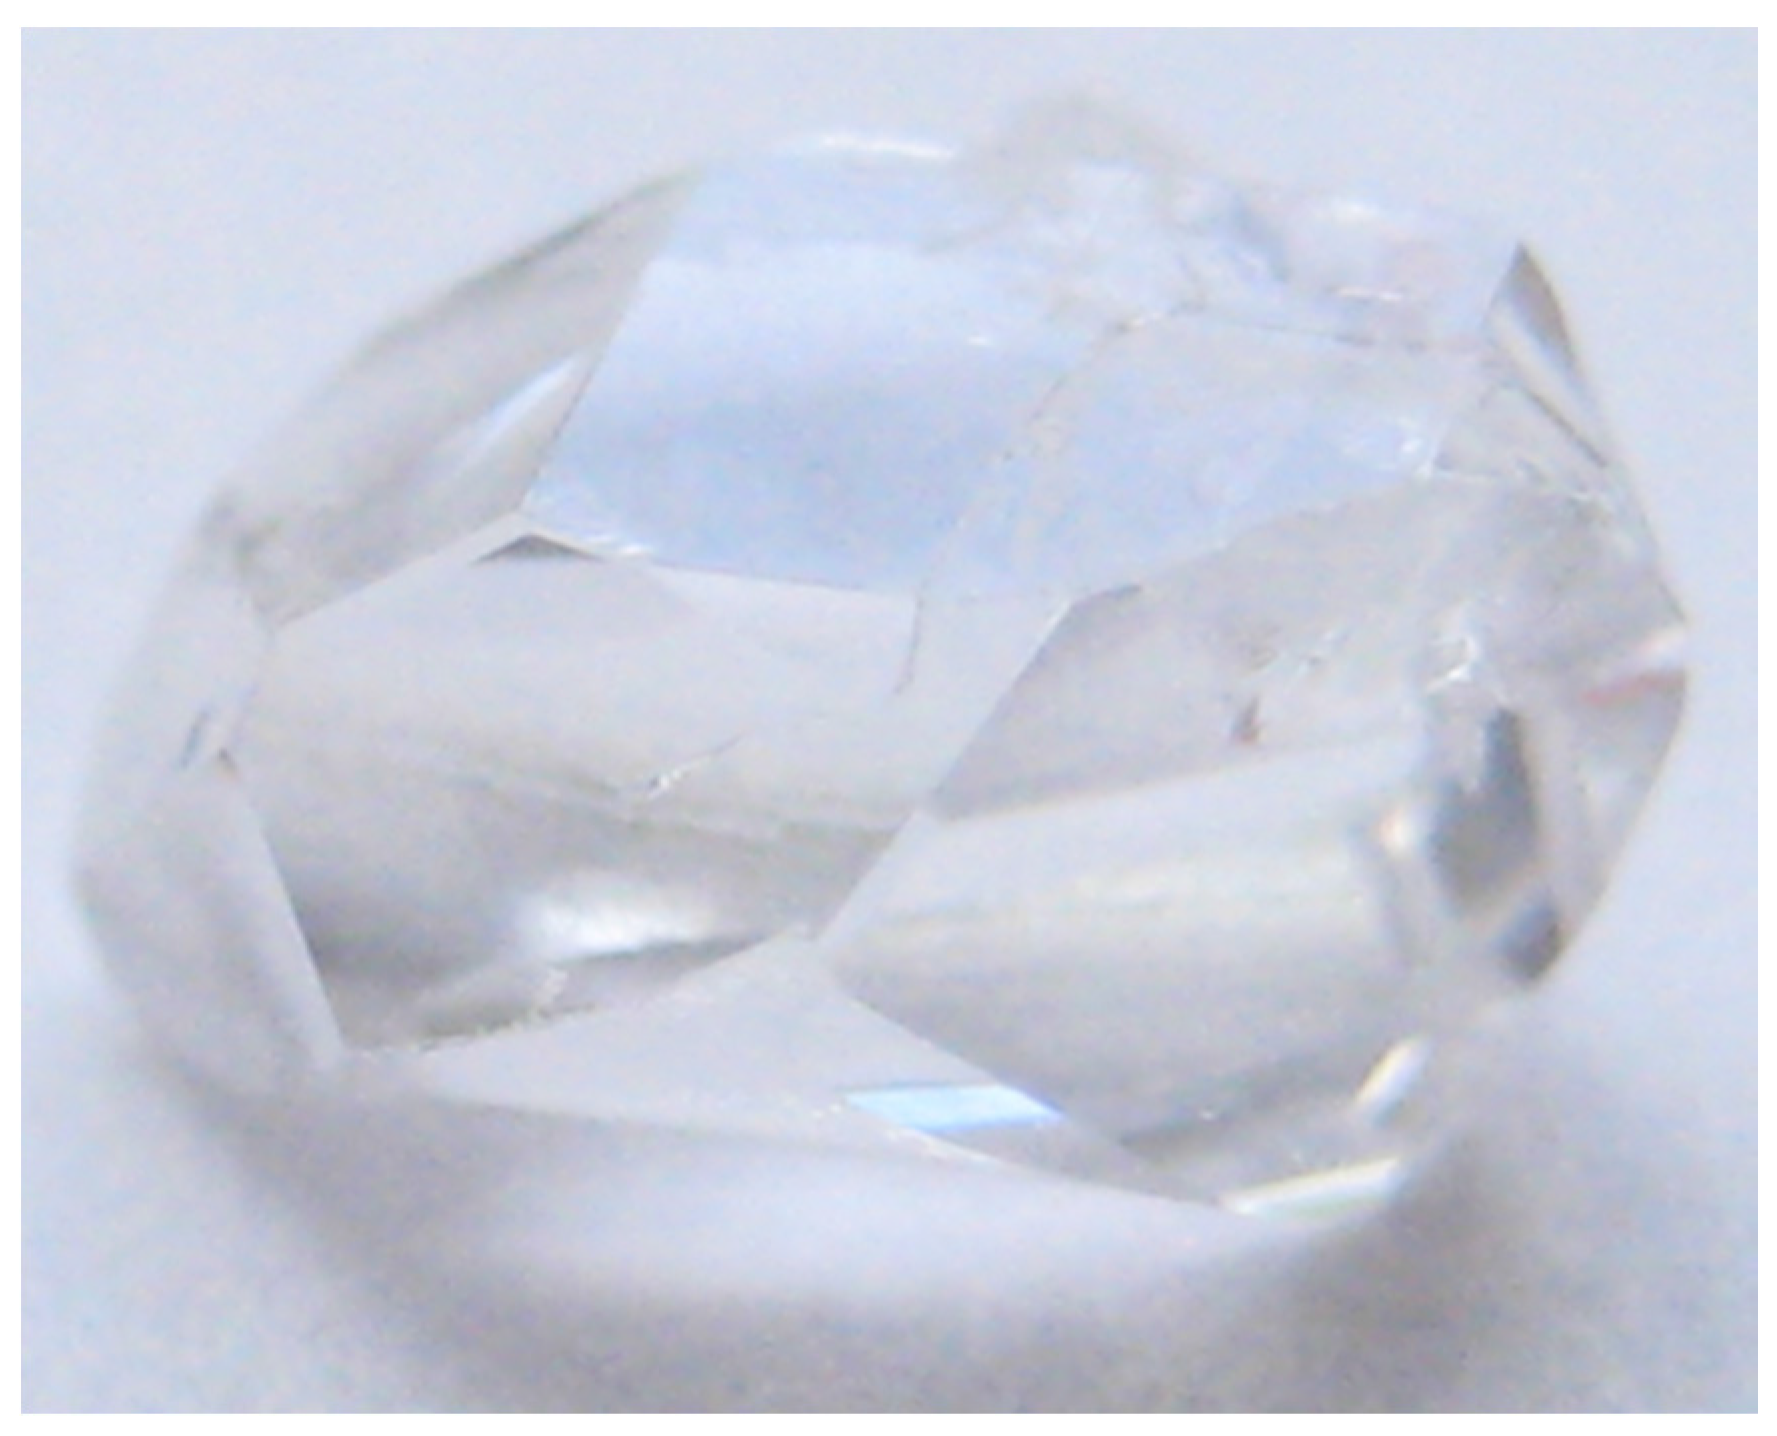
3. Hydrothermal Crystal Growth

In this section of our paper, we review the substantial progress we have made utilizing the hydrothermal method of crystal growth, and in particular in the growth of sesquioxide laser materials. Interested readers may also consult two recent publications by our group [104,112]. The rare earth sesquioxides, Sc2O3, Y2O3, and Lu2O3, have emerged as extremely attractive optical materials, particularly for their potential as high power laser materials. They all possess relatively high thermal conductivities, high thermal stability, suitably broad absorption bands, a wide transparency range, and a cubic crystal structure, all of which are very appealing characteristics for solid-state laser hosts. In particular, Lu2O3 appears especially promising since Lu3+ offers a close size and mass match to many of the lanthanide dopant ions of interest, allowing the crystals to support high doping levels with minimal sacrifice of thermal conductivity (see Figure 6). Several recent studies have confirmed the potential of lanthanide doped Lu2O3 as a versatile high power optical material [113,114]. As such they make very attractive targets for single crystal growth studies.
The high melting point of Lu2O3 (2450 °C) presents significant technical challenges to the growth of single crystals by classical melt-based methods. Few traditional approaches have gained traction, and recent efforts in Lu2O3 crystal growth have converged on a few techniques. The micro-pulling-down method has been used to grow single crystals a few millimeters in diameter with lanthanide doping targeted for laser applications [115]. The extreme crystal growth demands and promising materials characteristics of the sesquioxide systems prompted us to develop a unique hydrothermal approach to the growth of Sc2O3 and Lu2O3 [112]. Hydrothermal crystal growth of these materials can occur in a closed system at modest temperatures (550–650 °C), well below the melting point of the oxides using a supercritical aqueous hydroxide solution as a transport medium. Many refractory oxides are soluble under these conditions, and growth can occur either by spontaneous nucleation, or be deposited onto a seed crystal. The much lower temperature hydrothermal growth of Yb:Lu2O3 [112,116] and other sesquioxide materials results in the minimization of defects, impurities, crystal strain, color-centers, and inhomogeneities, all of which are important issues in melt-based growth methods. Comprehensive reviews of the hydrothermal growth process and its application to the development of new and promising laser crystals have recently been published [116,117,118]. In earlier work [104] we presented the first room temperature absorption cross-section data for hydrothermally-grown Yb:Lu2O3, as well as the emission cross-sections determined by the method of reciprocity. An image of a recently grown, faceted, large Yb:Lu2O3 crystal is shown in Figure 34.
Figure 34. Highly faceted, optically clear, as-grown Yb:Lu2O3 single crystal grown at 700 °C with a 30 degree thermal gradient. Crystal dimensions are 6 × 6 × 4 mm3.
Applsci 06 00023 g034

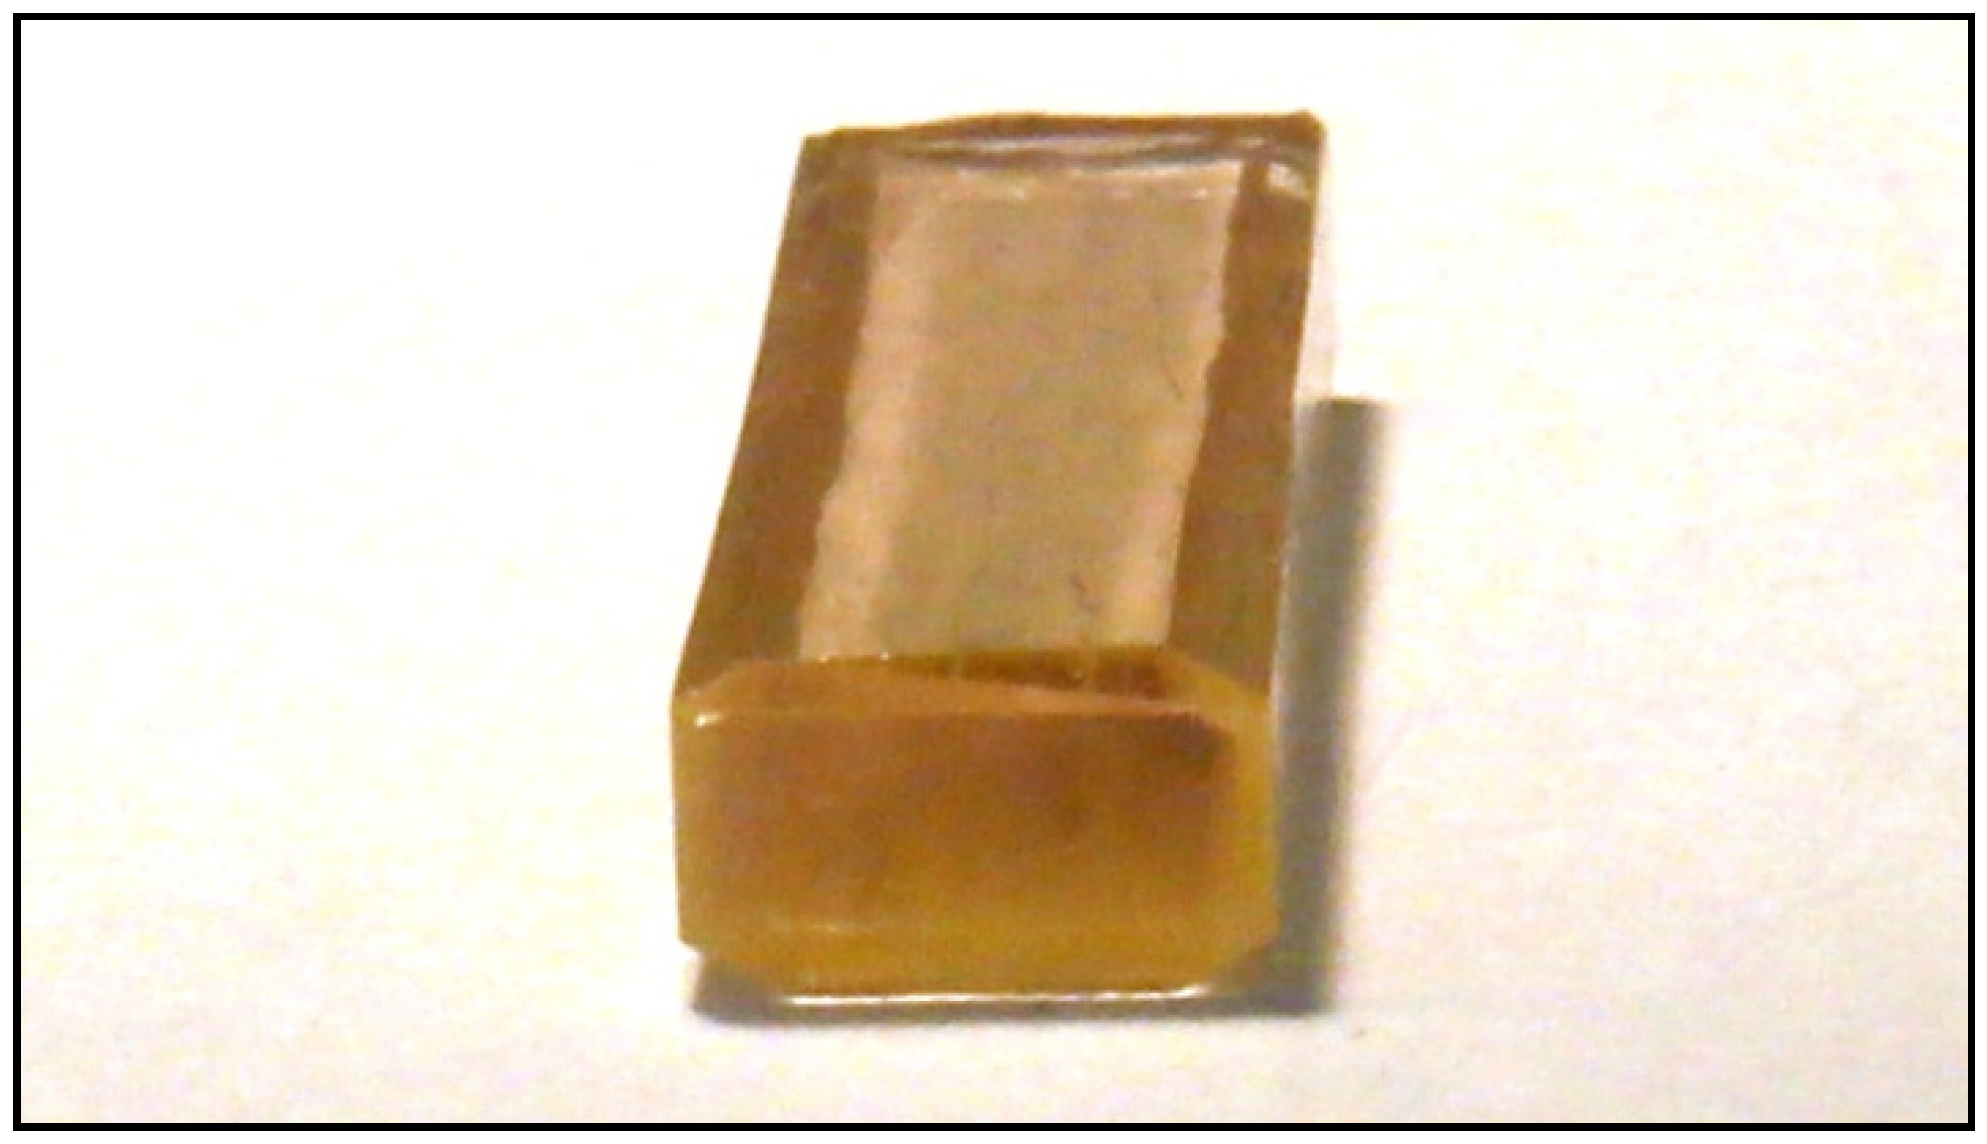
3.1. Recent Results For Sesquioxide Laser Materials

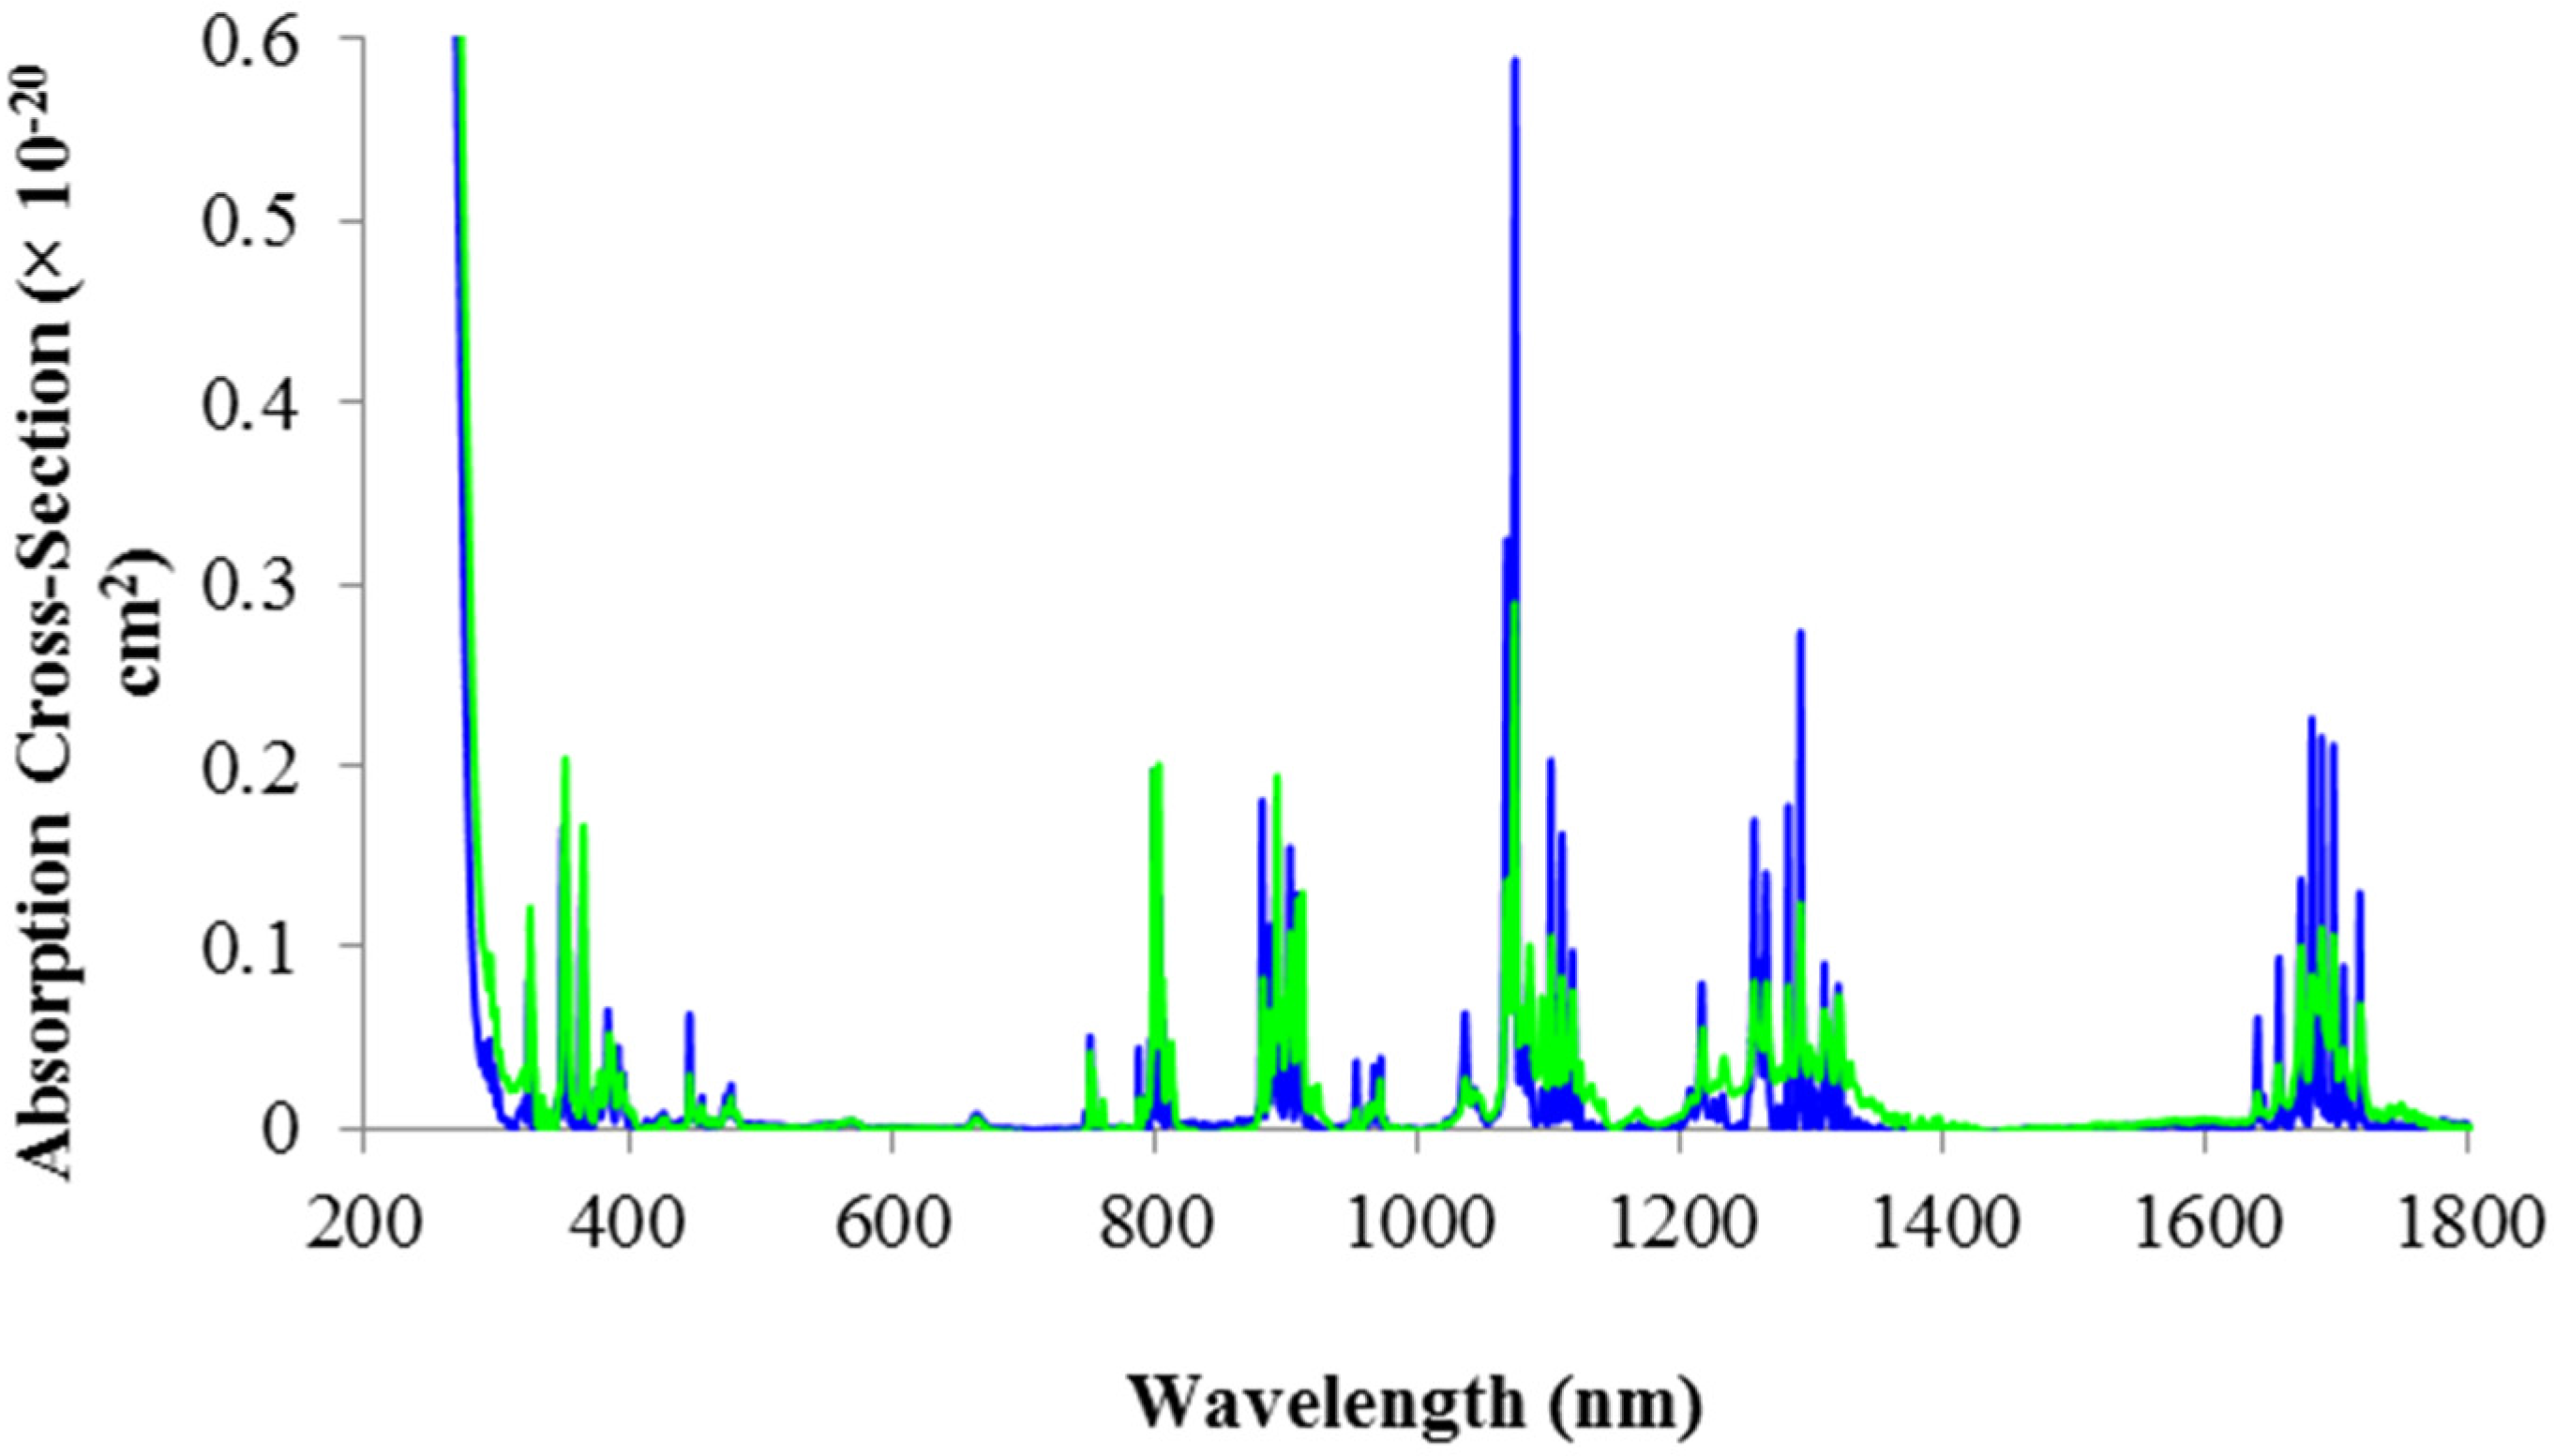
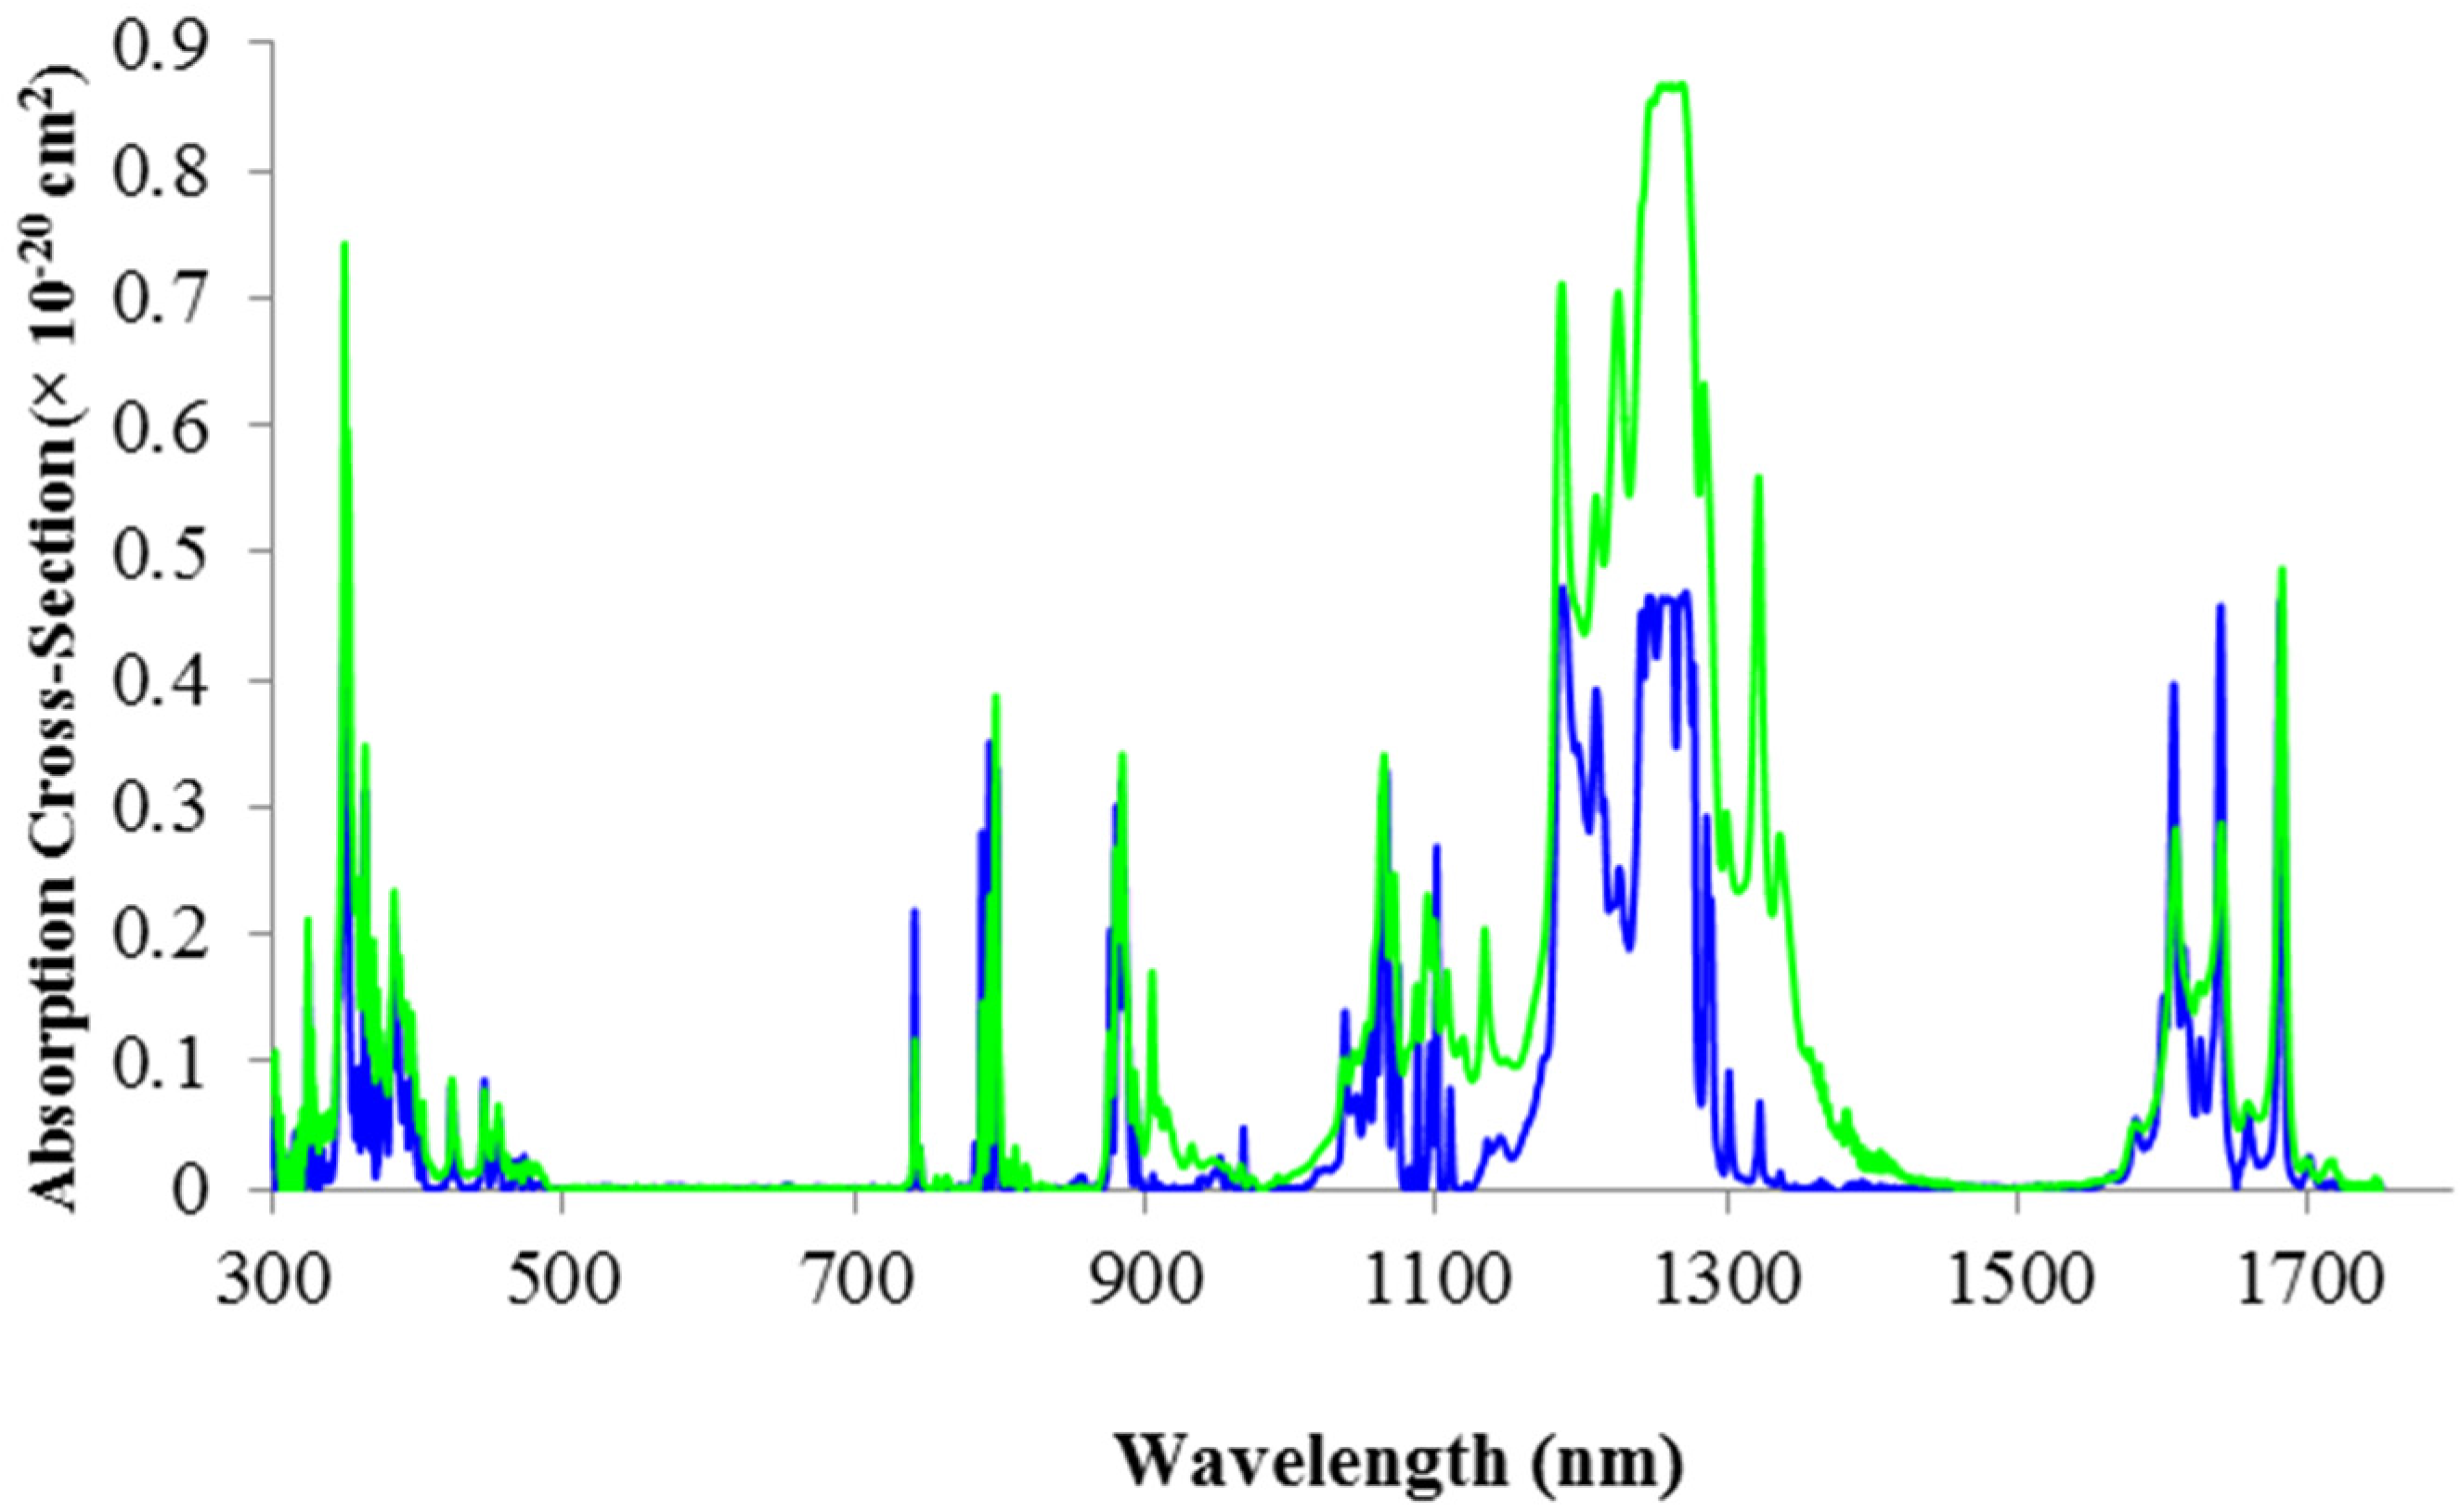
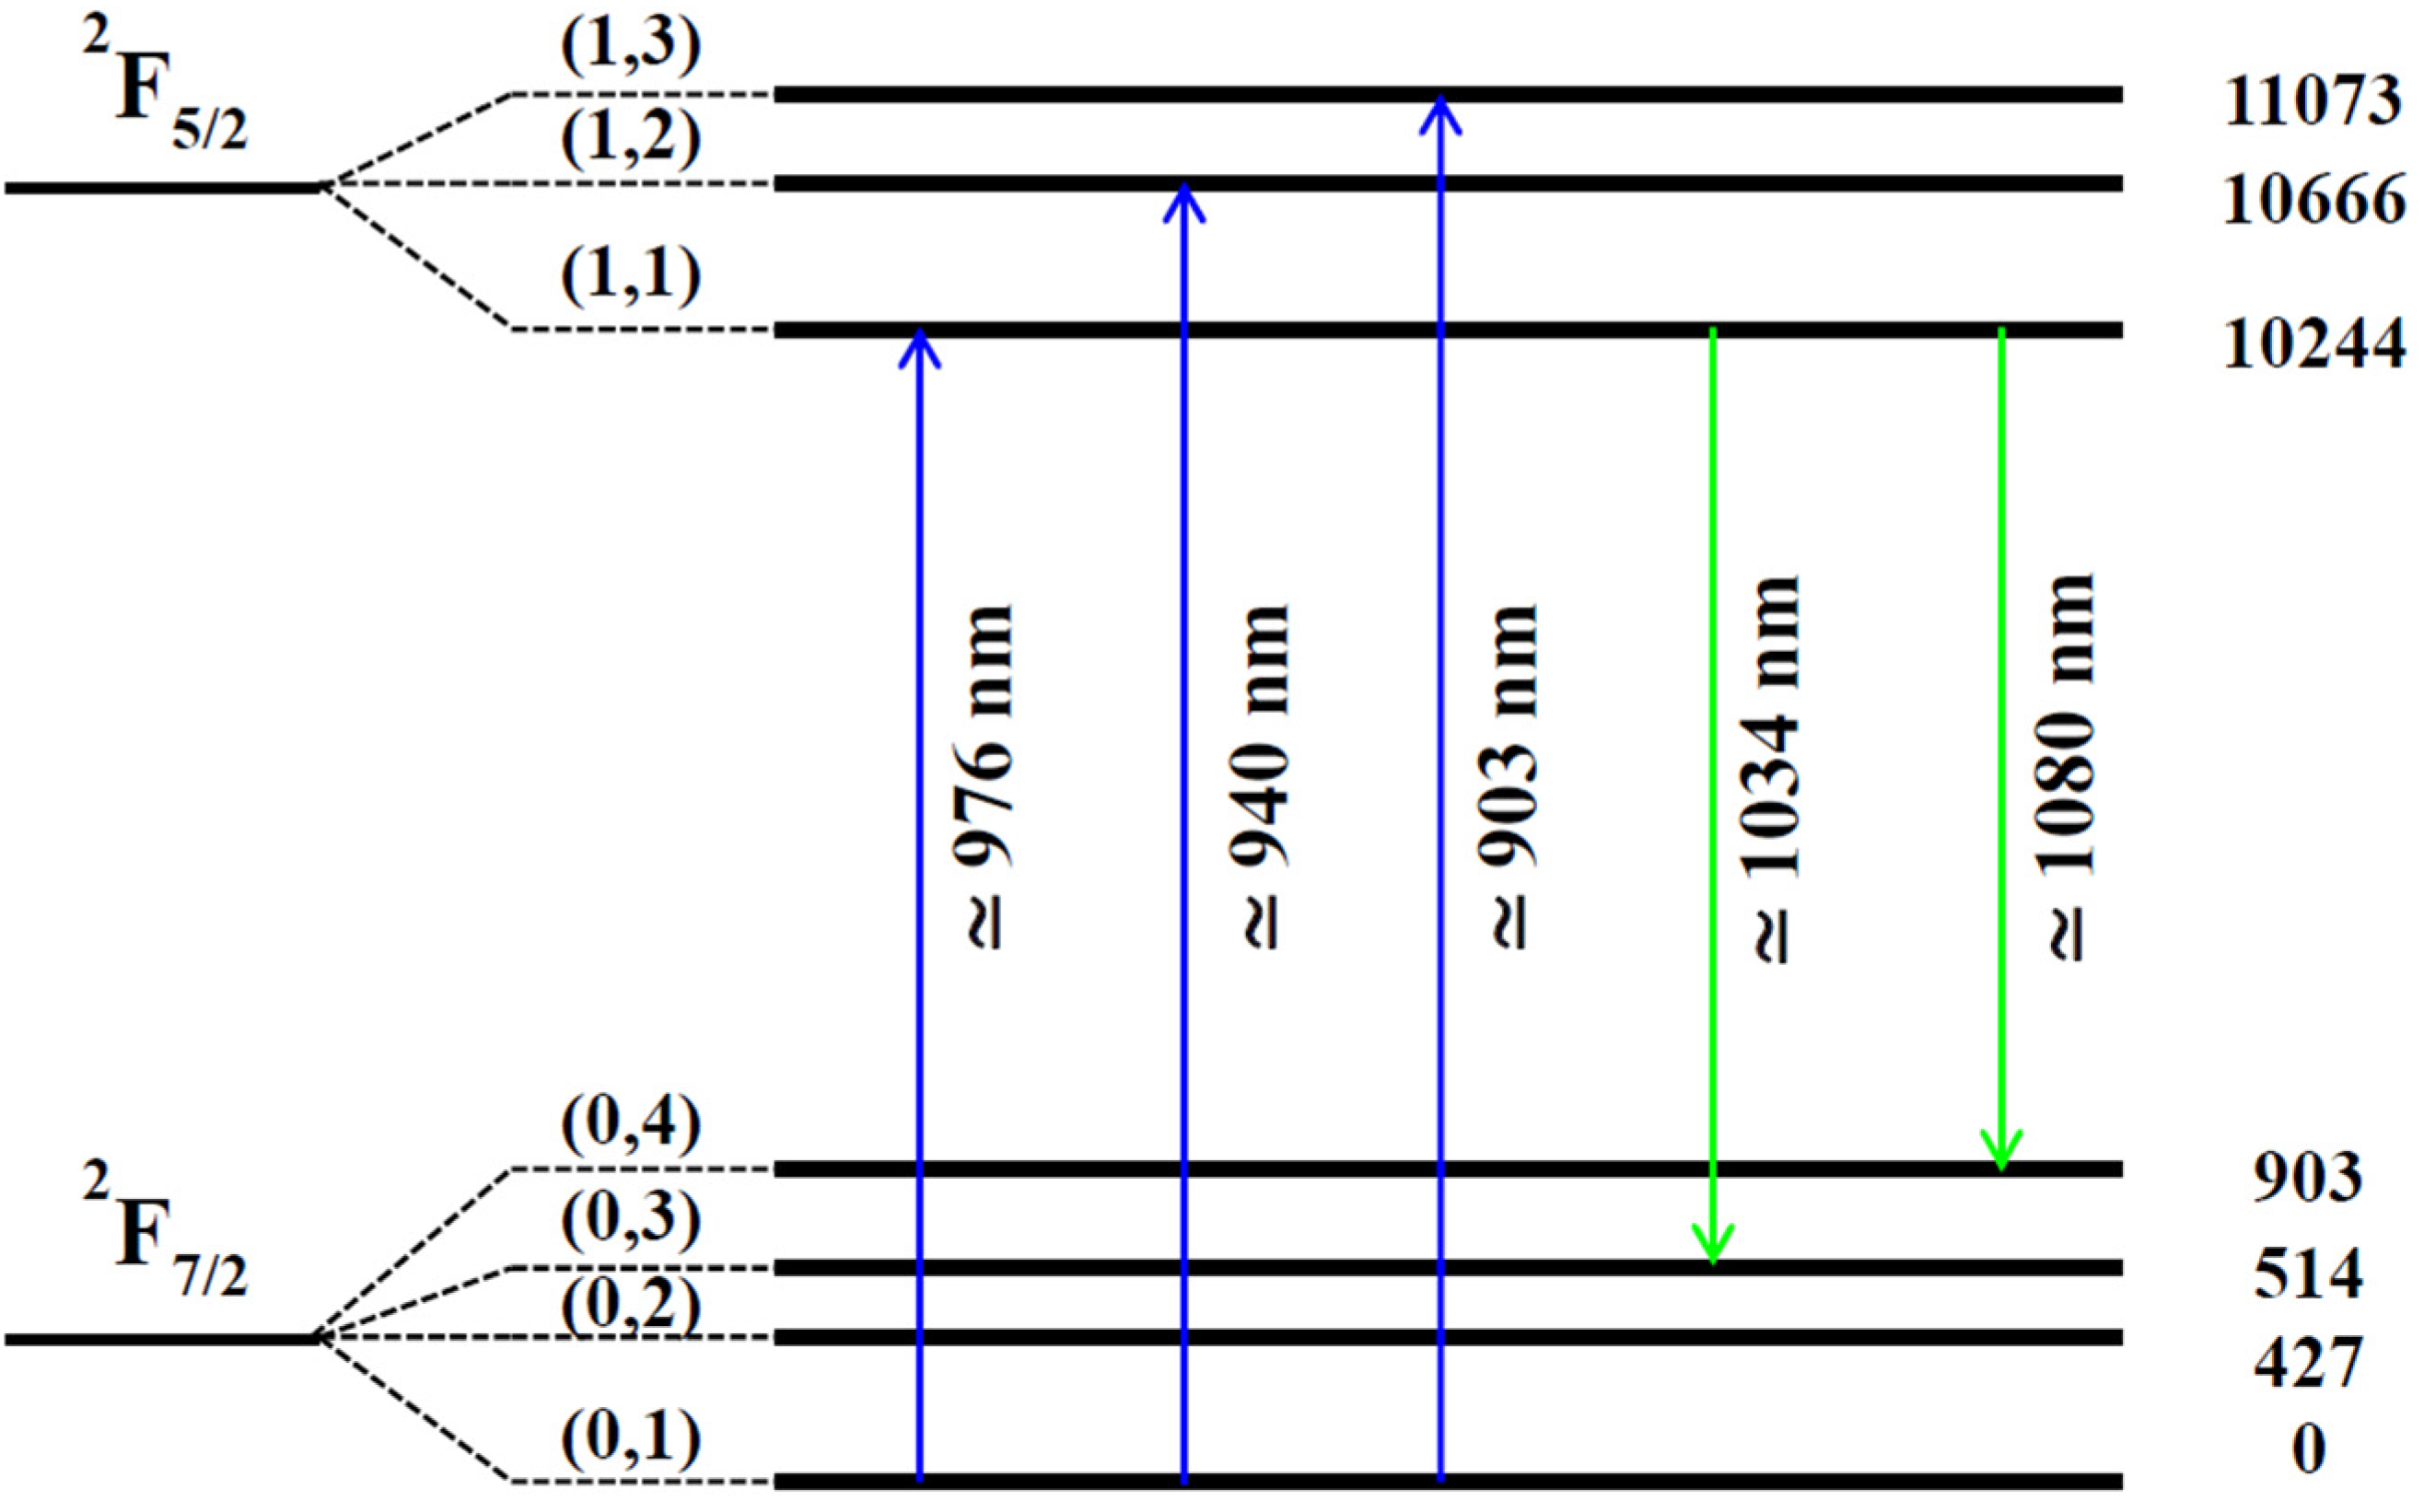
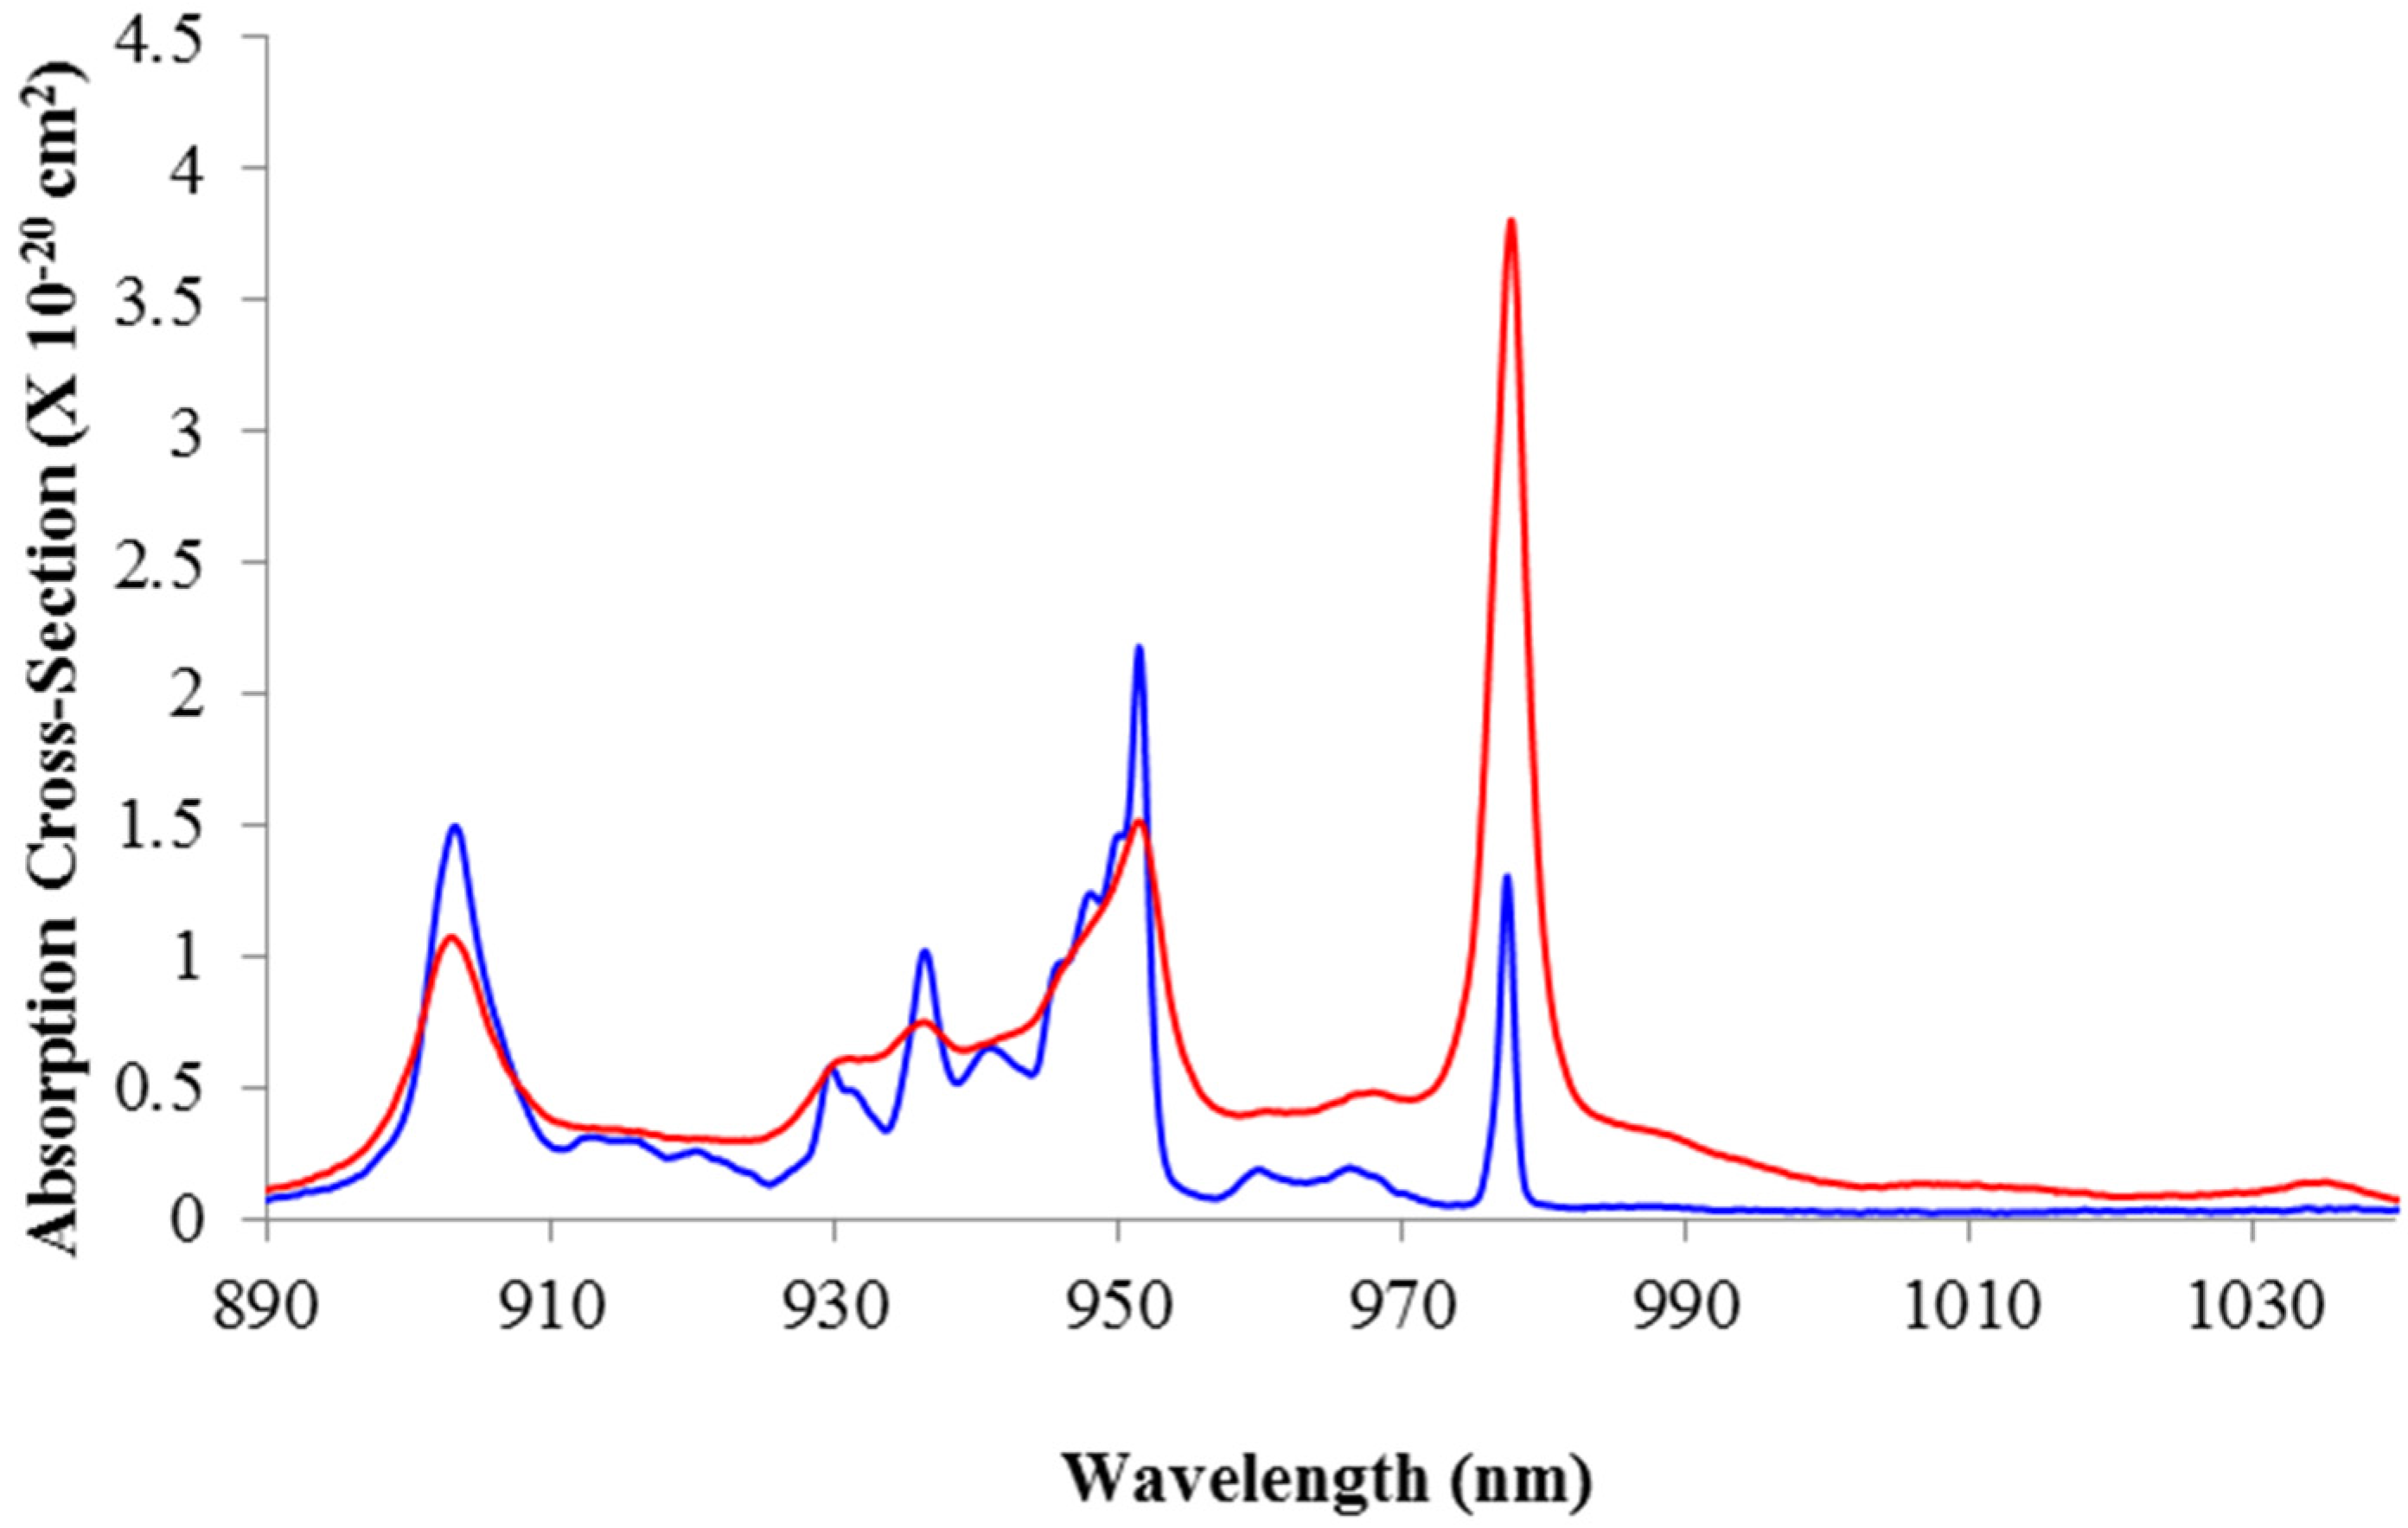
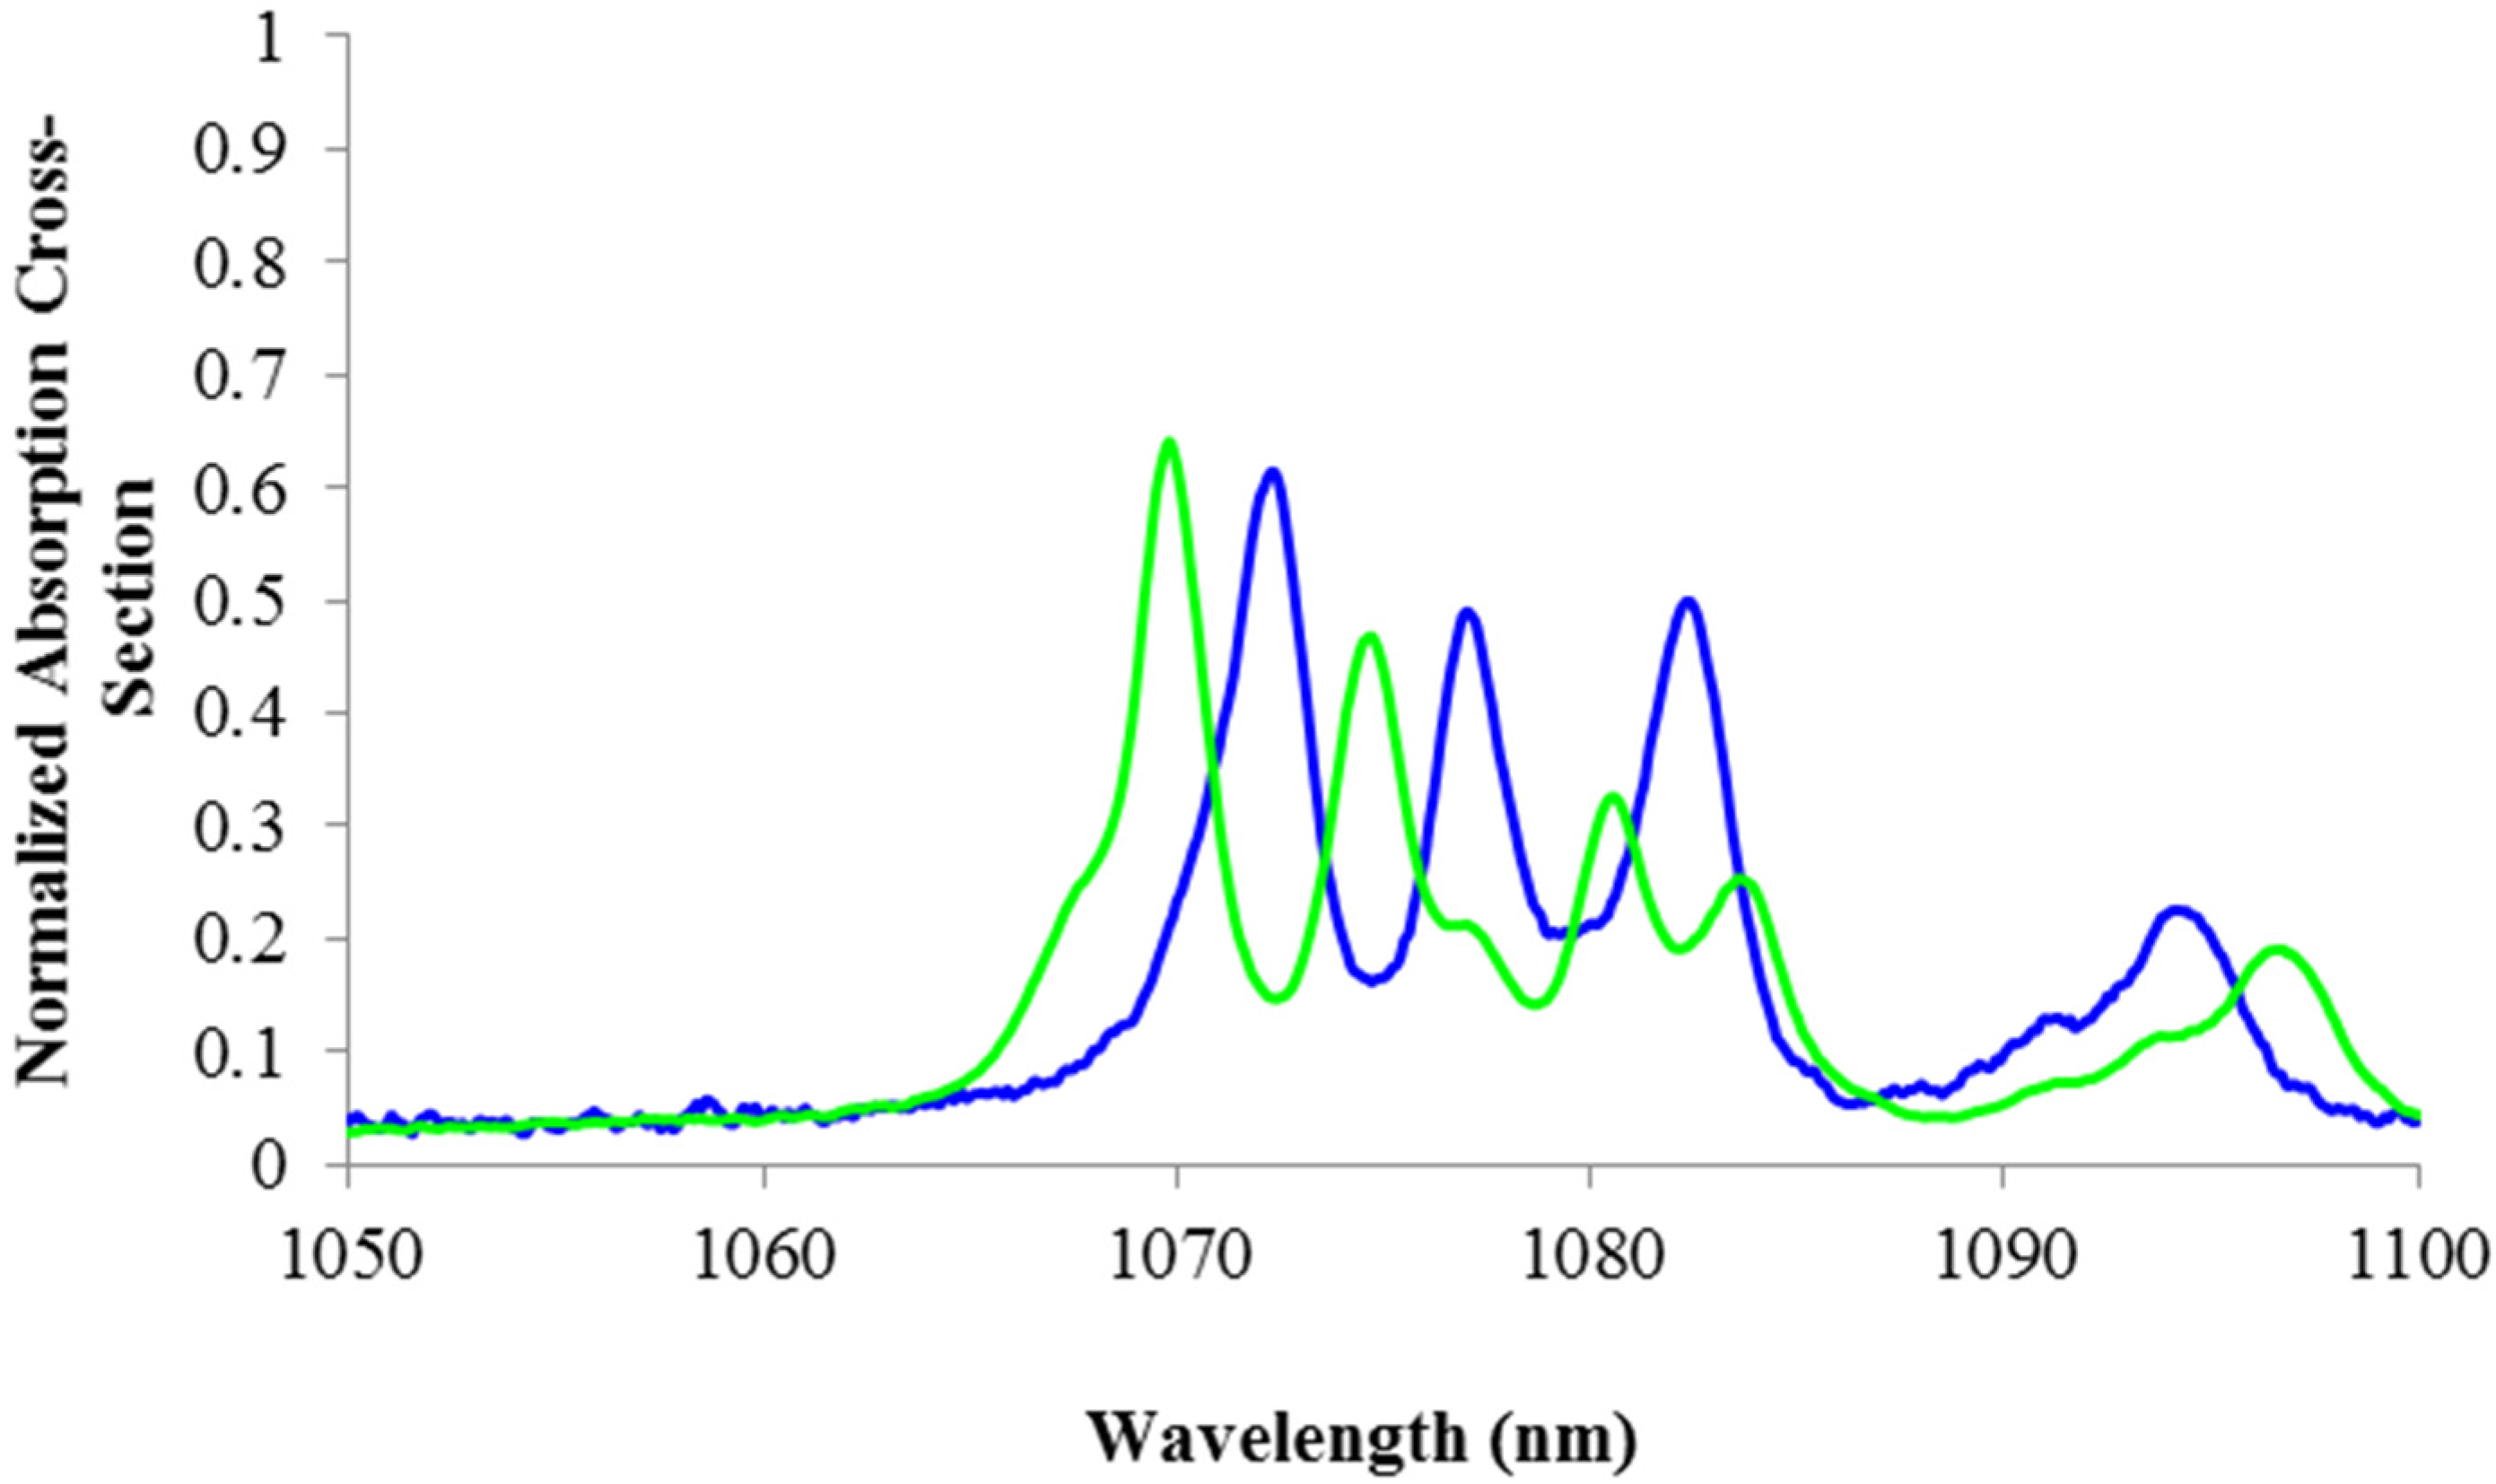
3.1.1. Yb:Lu2O3 Absorption Spectroscopy

Our group has recently obtained cryogenic absorption cross-section data for Yb:Lu2O3, with the results submitted for publication [119]. Figure 35 shows a portion of that data at 298 K and 80 K. These data were obtained with high spectral resolution down to 0.1 nm, and clearly show that the zero-phonon line is still not resolved at 80 K. While the absorption band around 900 nm is resolved at all temperatures, and we see the usual progression of increased cross-section values as temperature is lowered, the bands at 950 nm and 977 nm are not completely resolved, even at 0.1 nm resolution. Our analysis shows that the zero-phonon linewidth is <0.1 nm and likely below 0.05 nm. A similar situation has been found in Yb:YAG where the zero-phonon linewidth was initially measured to be <0.1 nm [27], and a later measurement yielded a value of 0.05 nm [3]. Due to the narrow linewidth, it is unlikely that the lower quantum defect associated with the 977 nm line can be obtained in practice, since the linewidth needed for efficient optical pumping is beyond even the capabilities of recently developed volume-Bragg-grating (VBG) narrowed diode laser sources. For the 950 nm band, however, there is an increased cross-section at 80 K, however, when higher-resolution measurements are available the increase will likely be larger than shown in Figure 35.
Figure 35. Absorption cross-section as a function of wavelength for a hydrothermally-grown Yb3+:Lu2O3 laser crystal at 80 K (blue) and 298 K (red).
Applsci 06 00023 g035

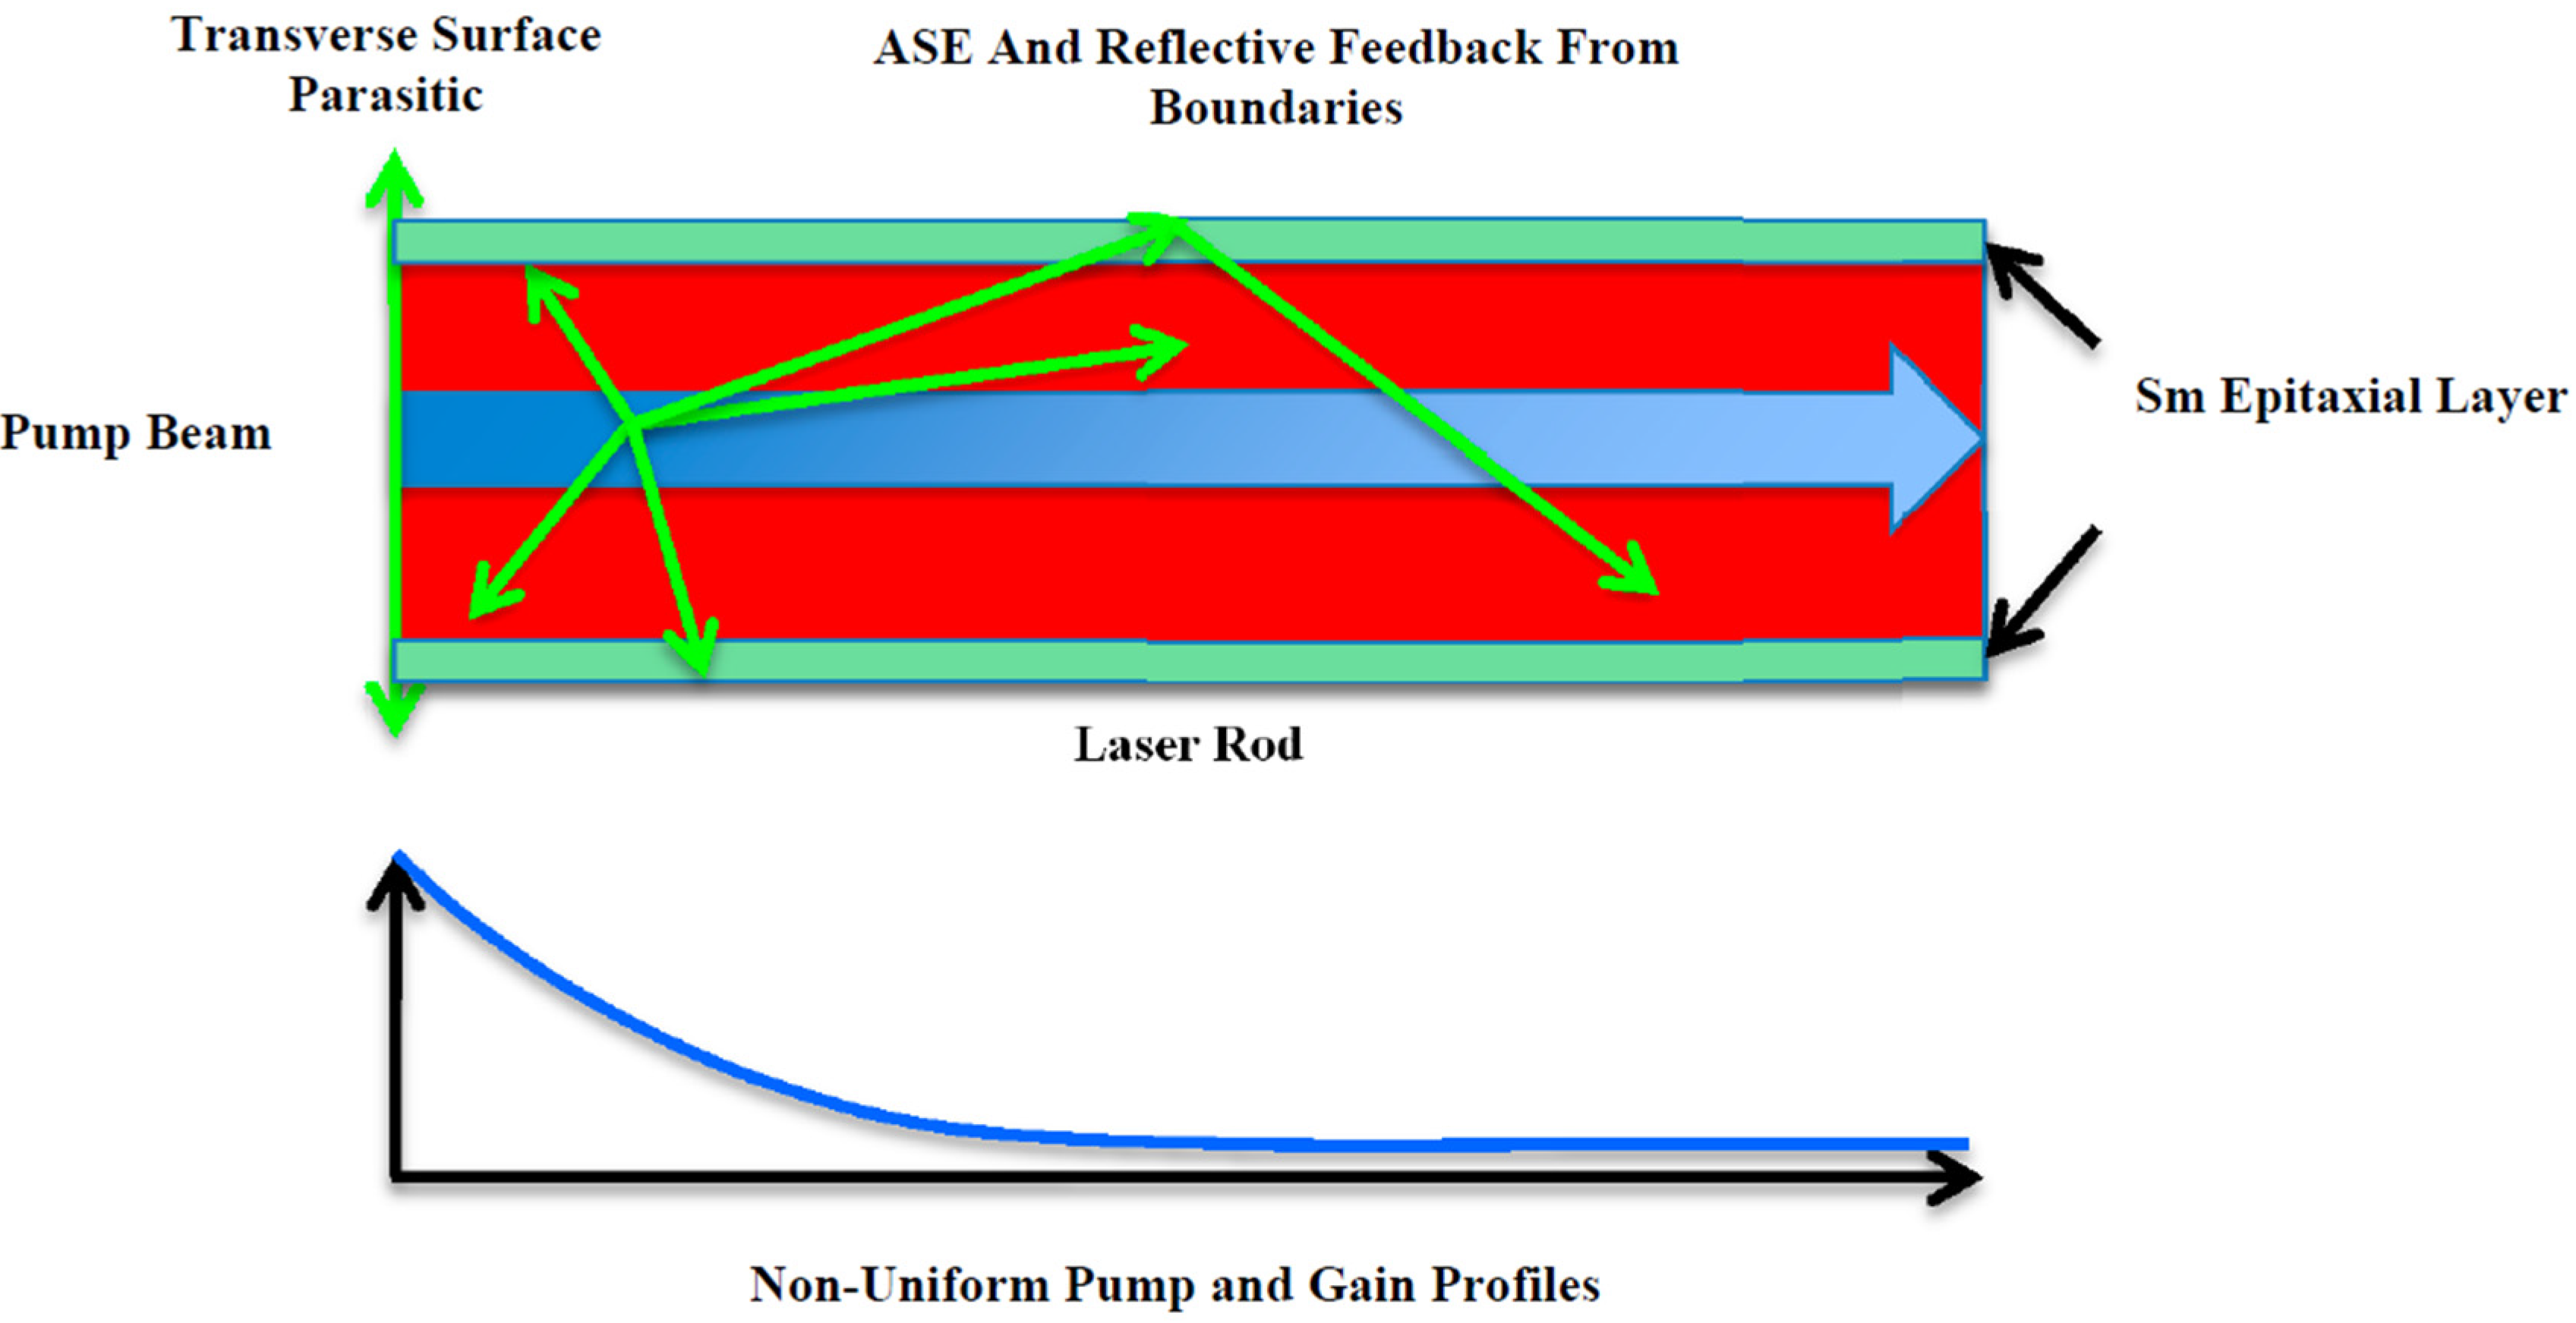
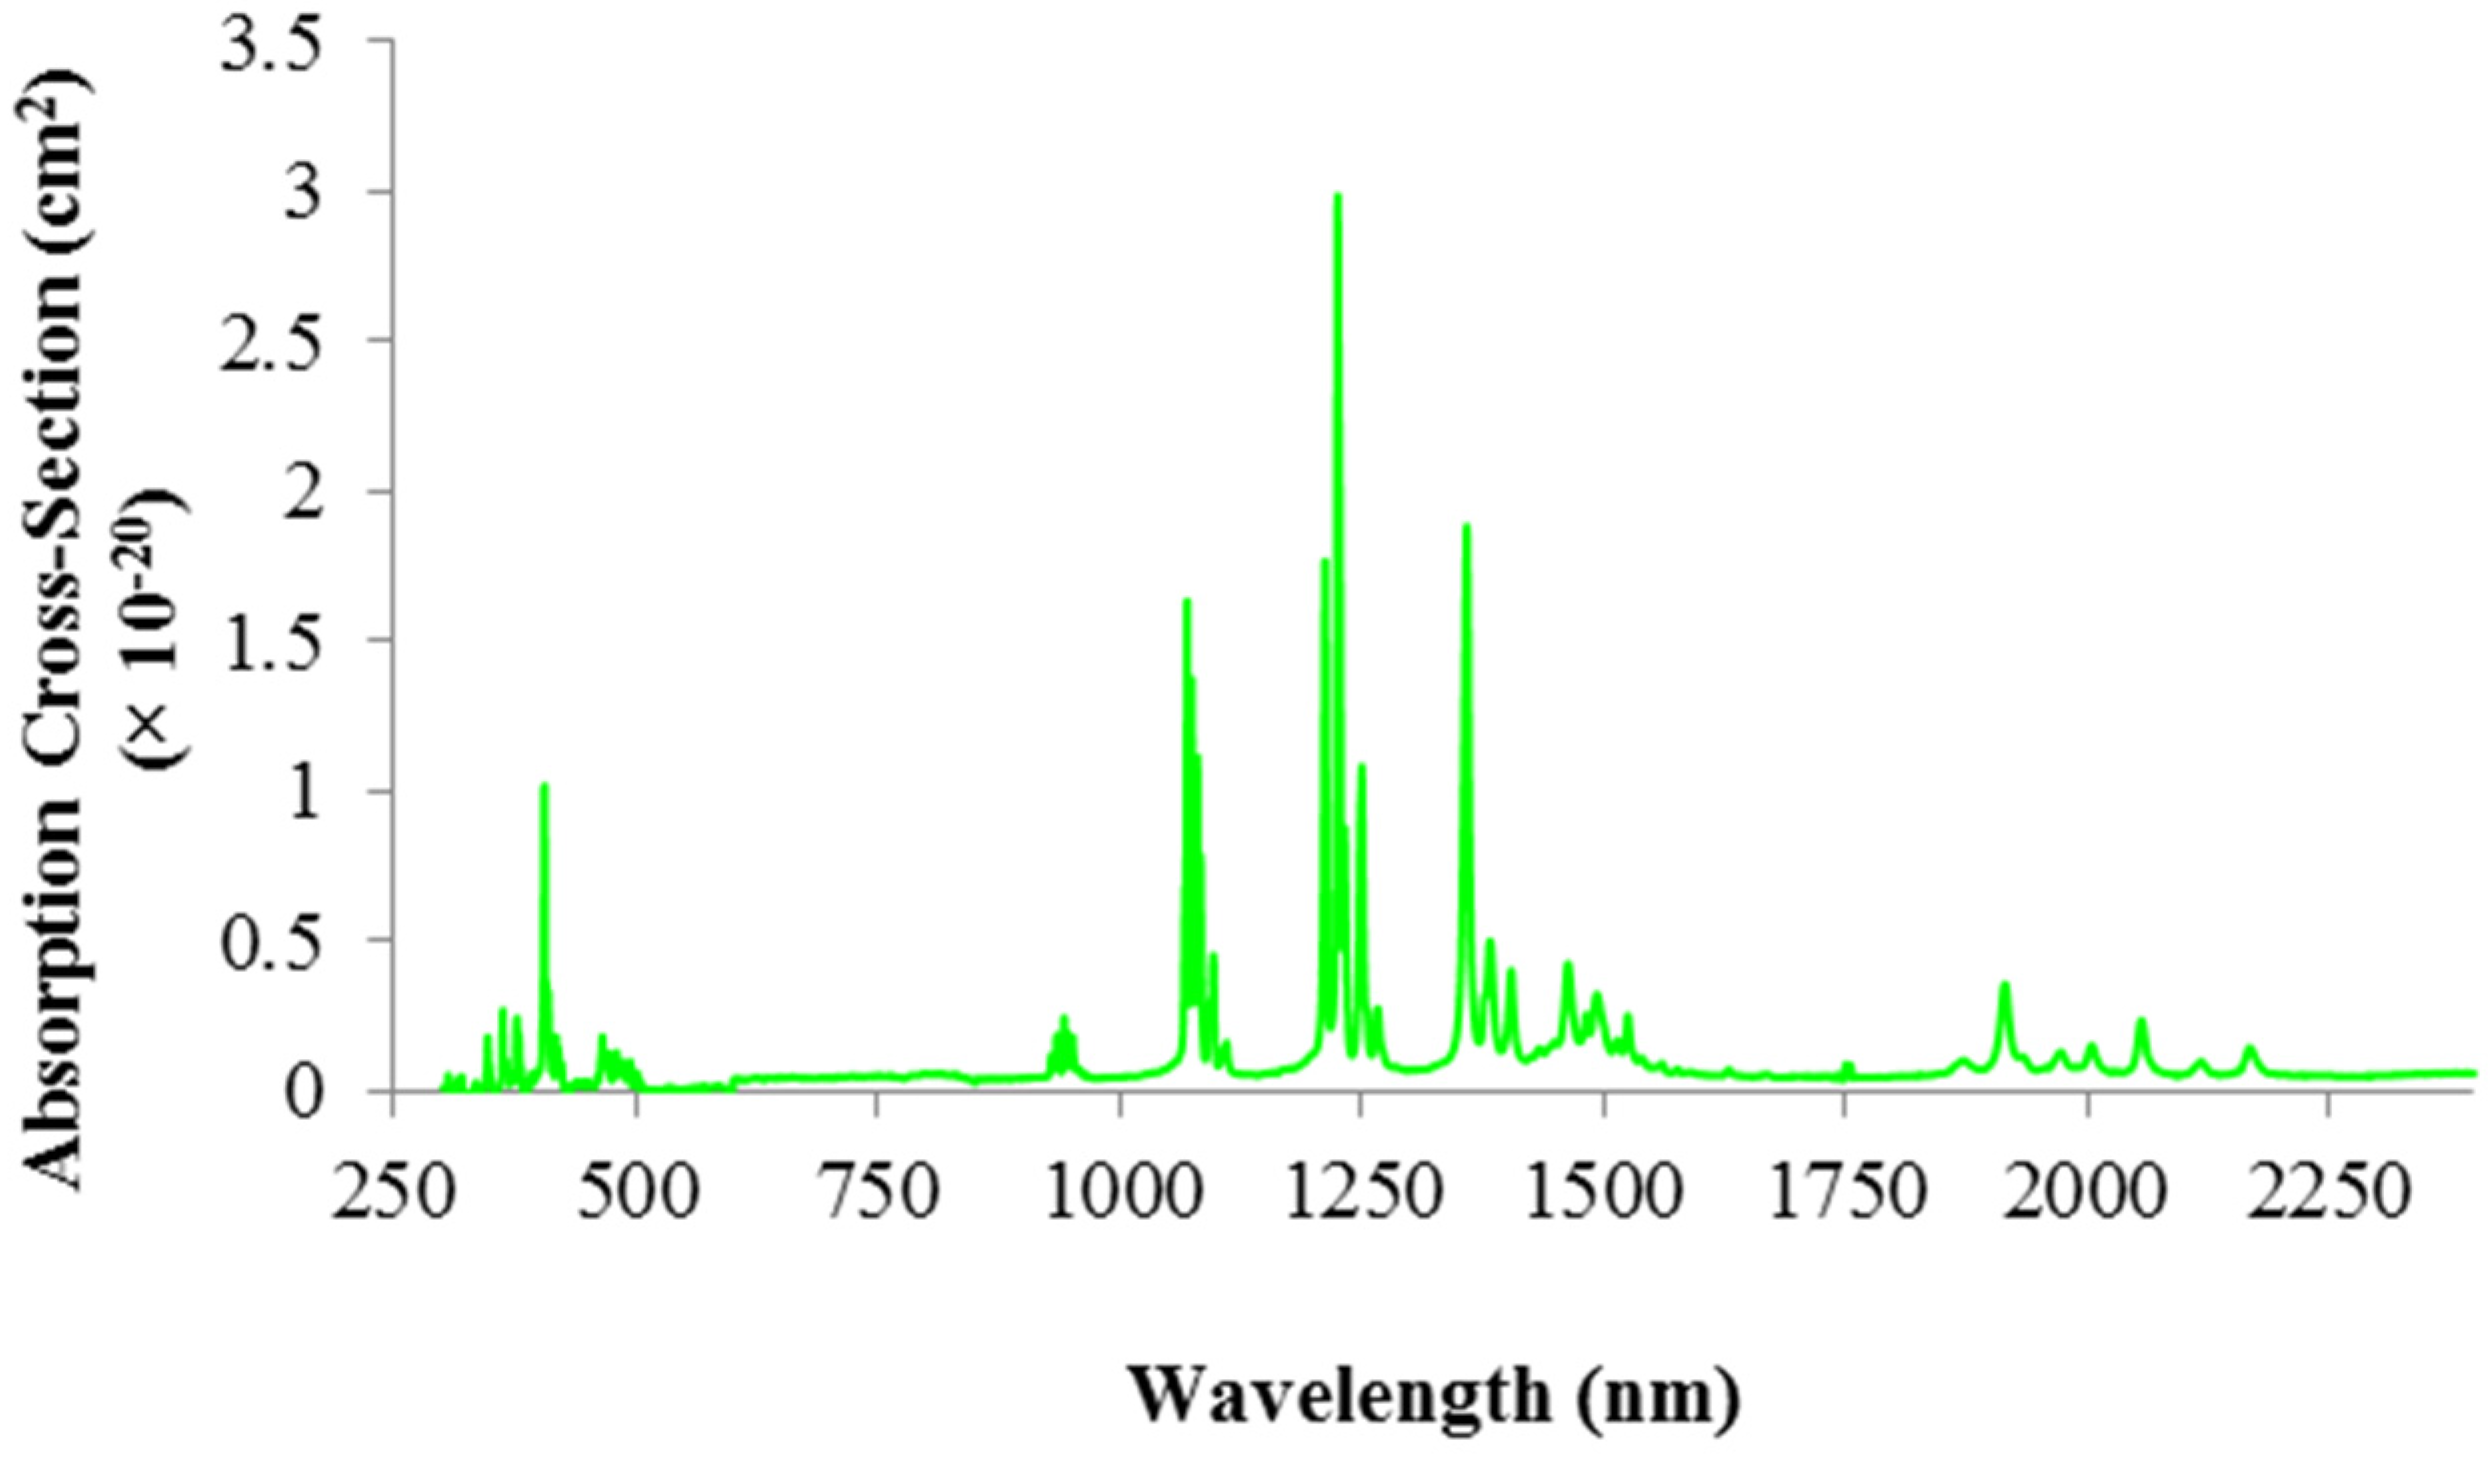
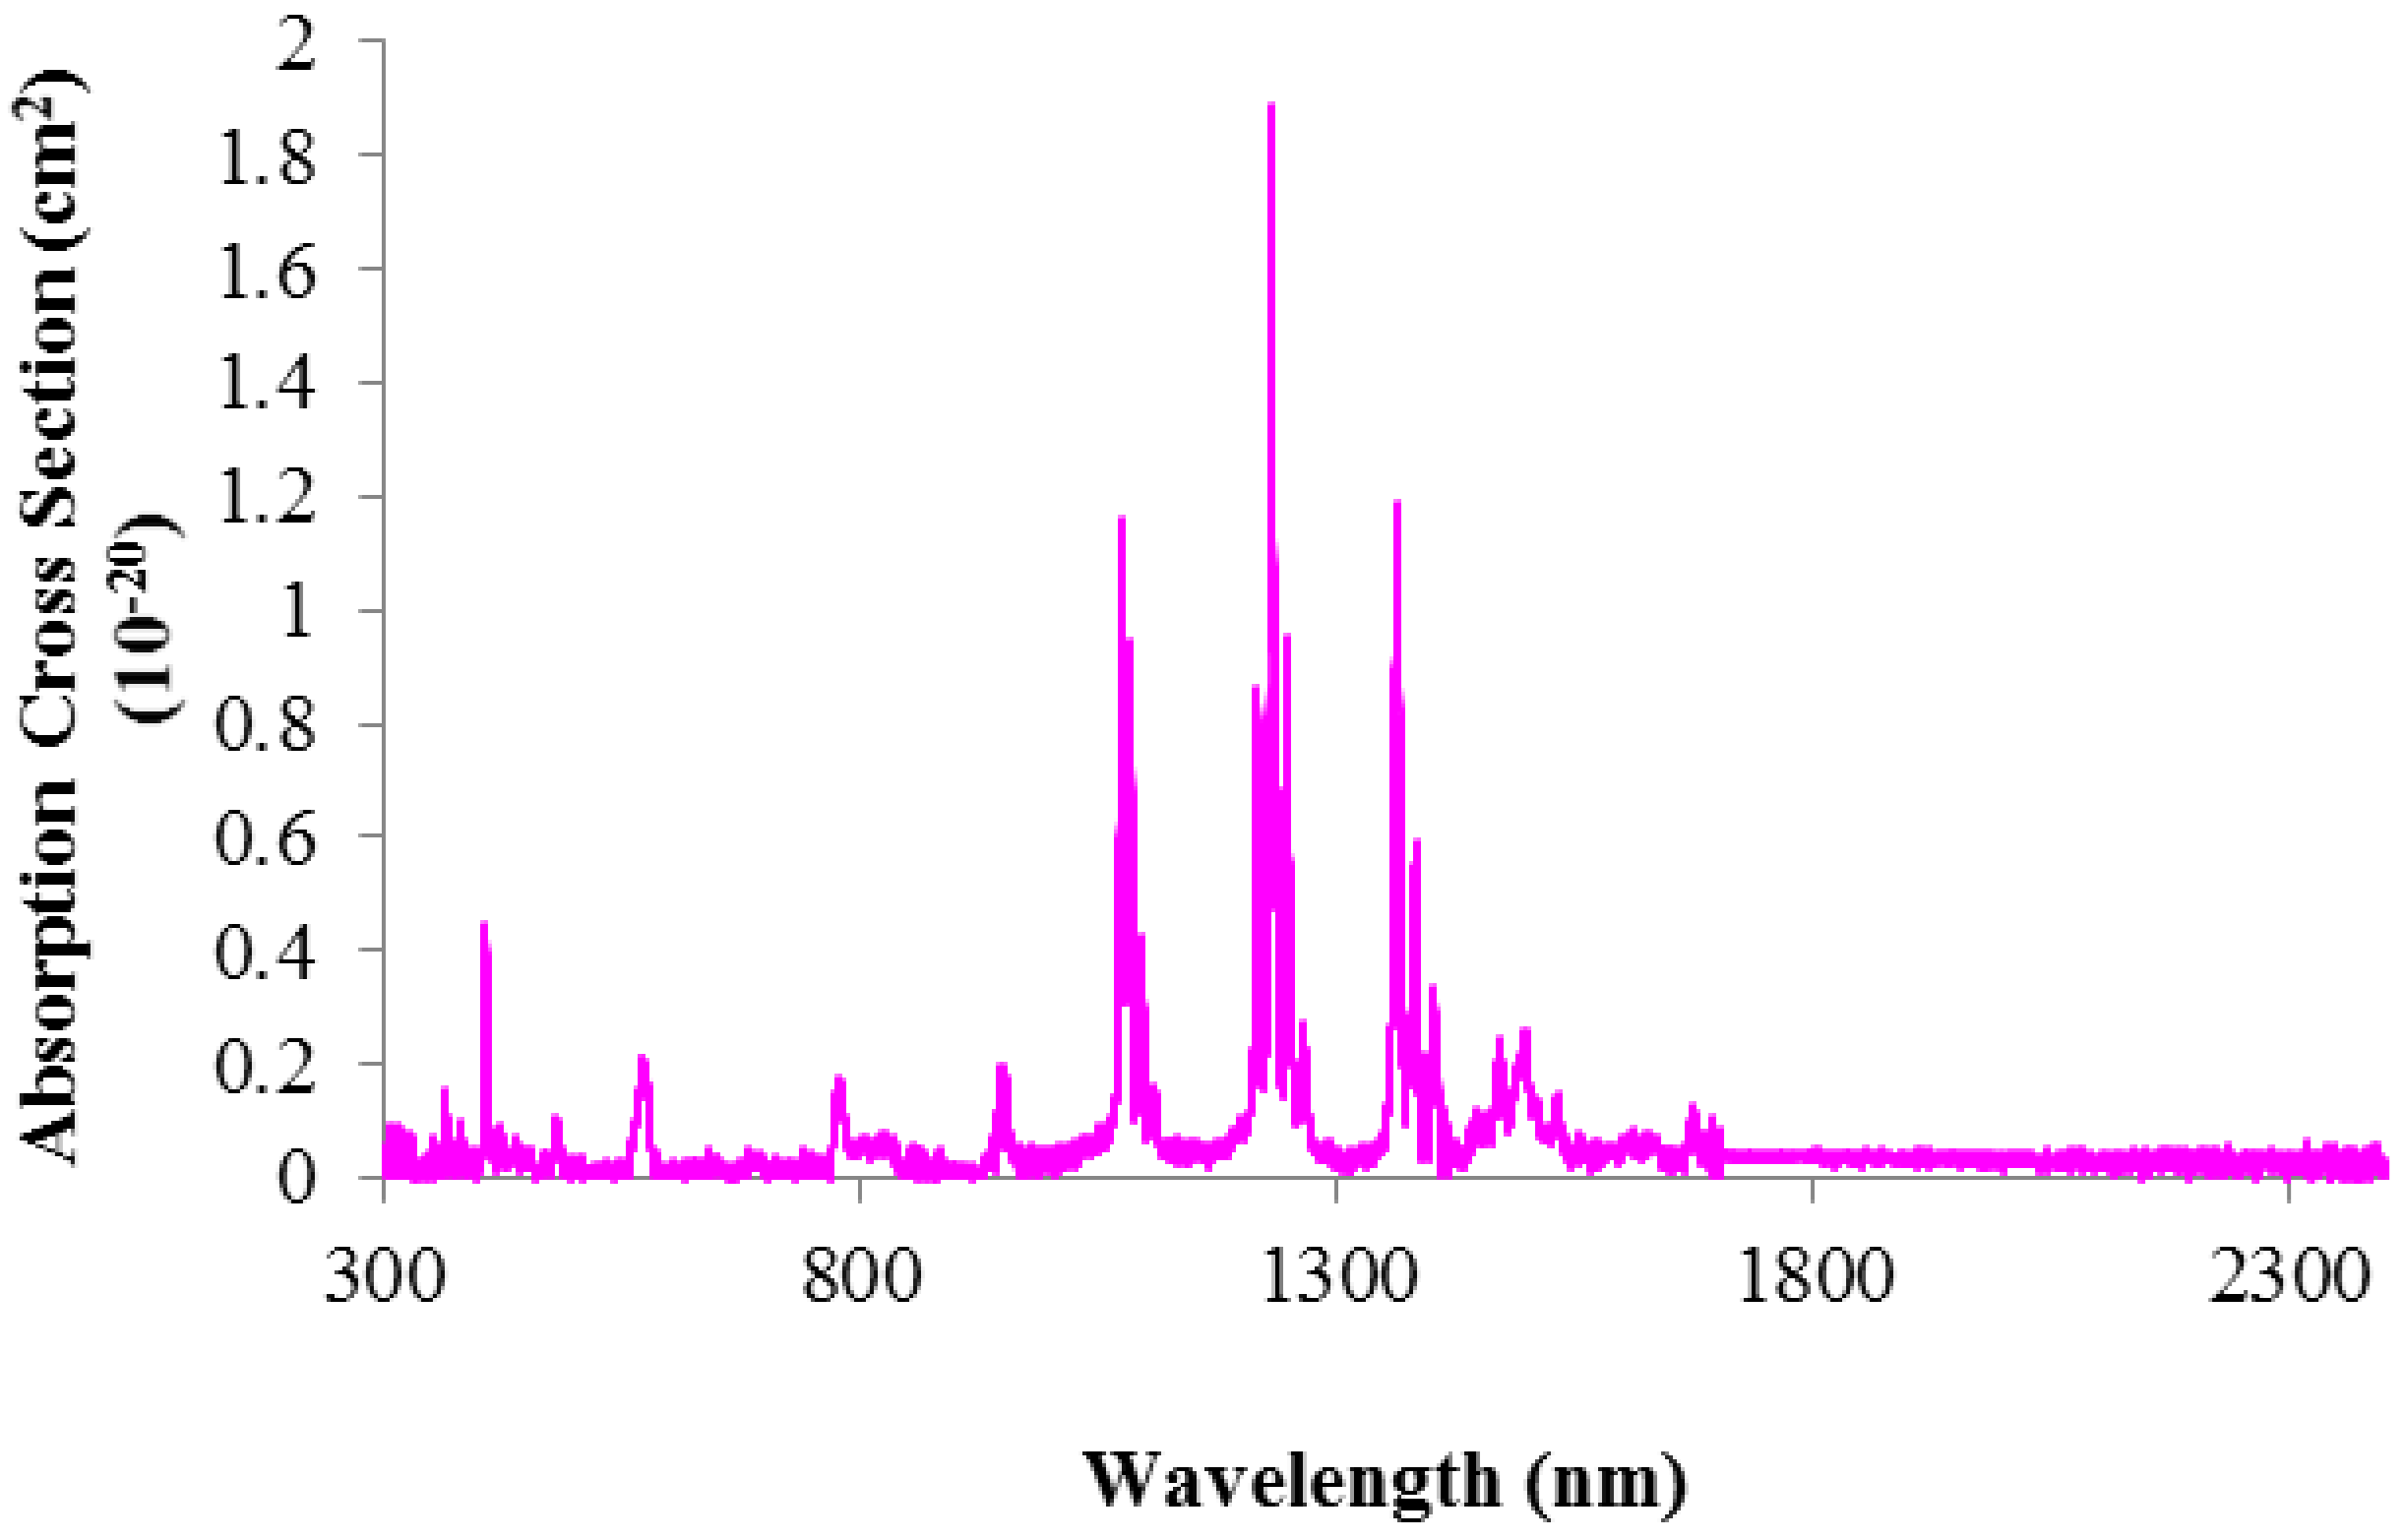
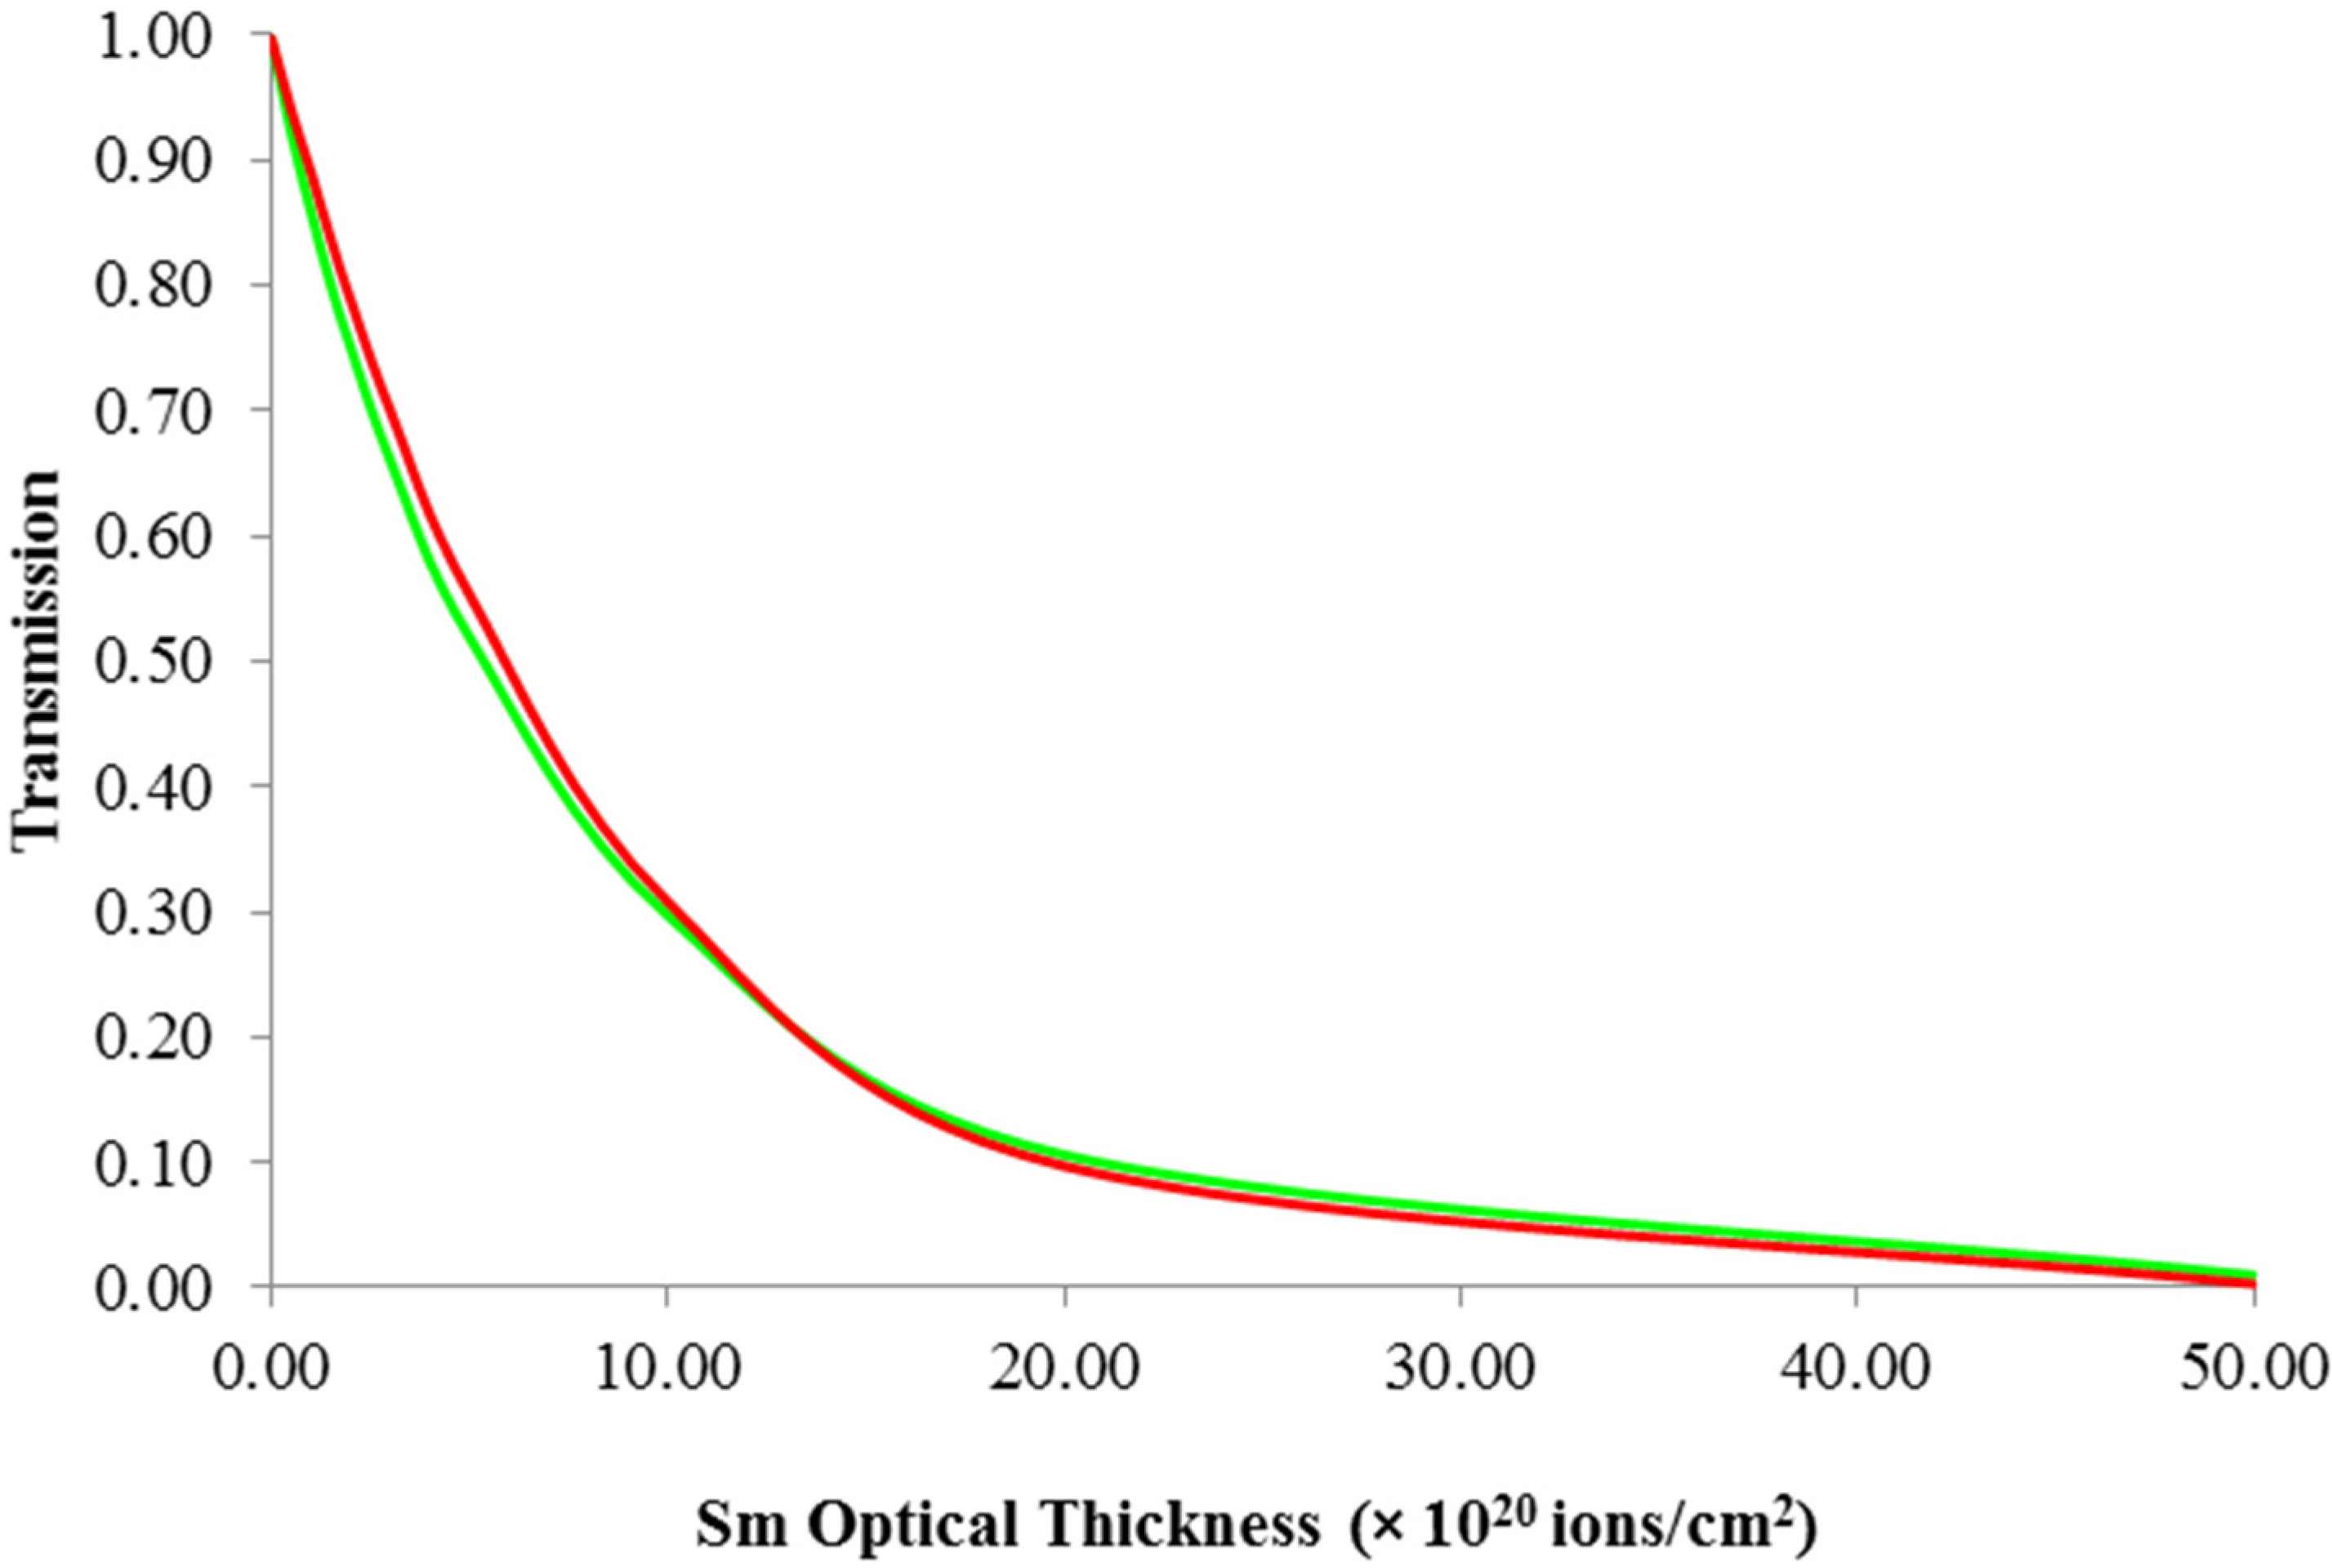
3.1.2. Sm:YAG and Sm:LuAG For The Suppression of Parasitic Oscillations and Amplified Spontaneous Emission

We have investigated the hydrothermal growth of both Sm:YAG and Sm:LuAG. Sm is a well-known 1064 nm absorber, and has been used as Sm:Glass and Sm:YAG for some time as a suppressor of parasitic oscillations and amplified spontaneous emission (ASE). Figure 36 shows a side view of a Nd:YAG laser rod with an external Sm:YAG cladding layer on the barrel. In the absence of the Sm:YAG coating, it is well-known that a polished barrel will result in the oscillation of transverse straight-across surface mode, ring modes, and longitudinal (bulk) parasitic oscillation modes that will clamp the laser gain. In some cases, a surface parasitic located at the pump beam entrance face will have the lowest threshold. To eliminate parasitics and minimize ASE, such rods usually have ground barrels. Grinding of course results in sub-surface fractures that limit the power handling capability of the rod. A highly-doped layer of Sm:YAG can be used to suppress the parasitics and minimize ASE losses.
Figure 36. Side view of an end-pumped laser rod or slab, showing the emitted fluorescence and absorption in Sm:YAG cladding layer. The non-uniform absorption gives rise to a possible surface parasitic at the pump beam entrance face where the transverse gain is largest.
Applsci 06 00023 g036
Our interest in these materials began in 2012 when we demonstrated, for the first time, that we could grow epitaxial-like layers of Sm:YAG on Nd:YAG substrates [120]. A more recent example of this is shown in Figure 37. A Nd-doped rectangular cm sized laser crystal was used, and a highly doped layer of Sm:YAG was successfully grown on all six external surfaces. After layer growth, the end faces of the crystal are ground to remove the Sm:YAG, and polished and dielectrically-coated to allow 1064.2 nm lasing. In practice, this type of layer may be grown on any Nd:YAG laser crystal, and can be used to suppress parasitics and ASE. Previously, other researchers have reported Sm:YAG clad ceramic Nd:YAG rods [121,122] and disks [123]. In our work, we are primarily interested in providing a method that can be use on commonly used Czochralski-grown single crystals, without using expensive methods like diffusion-bonding.
Figure 38 and Figure 39 show the absorption cross-sections as a function of wavelength for Sm:YAG and Sm:LuAG. We are particularly interested in the region near 1064 nm. To look at the potential of these materials as parasitics and ASE suppressors, we have compared the two materials in Figure 40, where we show the normalized cross-sections as a function of wavelength from 1050 to 1100 nm. The cross-section values for Sm:YAG and Sm:LuAG are nearly identical at 1064.2 (Nd:YAG) and 1064.4 nm (Nd:LuAG). Sm:YAG and Sm:LuAG, which may be grown as epitaxial layers on Nd:YAG, and Nd:LuAG, will then be effective parasitic and ASE absorbers for those materials.
Figure 37. Rectangular Nd:YAG crystal with hydrothermally-grown Sm:YAG layer for parasitics and amplified-spontaneous-emission suppression. After the growth of the layer, the Sm:YAG is removed from the end faces by polishing and the surfaces dielectric coated.
Applsci 06 00023 g037
Figure 38. Absorption cross-section as a function of wavelength for a hydrothermally-grown Sm3+:YAG crystal at 298 K.
Applsci 06 00023 g038
Figure 39. Absorption cross-section as a function of wavelength for a hydrothermally-grown Sm3+:LuAG crystal at 298 K.
Applsci 06 00023 g039
Figure 40. Normalized absorption cross-section as a function of wavelength in the region from 1050 to 1100 nm, for the Sm-doped materials Sm:YAG (green) and Sm:LuAG (blue).
Applsci 06 00023 g040
Figure 41 shows the transmission of 1064.2 nm fluorescence from Nd:YAG through a Sm:YAG doped layer as a function of optical thickness, defined here as the Sm doping density times the penetration depth. With 5 at. % Sm doping and a thickness of 3 mm, the optical thickness is about 1 × 10¹⁹/cm2). From Figure 41 we see that the transmission is about 0.85 for a single pass, and the absorption for normal incidence rays is about 15%. For a normal incidence reflection from the rod barrel, the reflection coefficient is 8.5%; a return ray makes two passes of the Sm layer, and the return intensity is only about 6%. By increasing the doping level even further, to 15 at. %, the one-way transmission if reduced to ~65%, so for a return normal incidence ray the intensity is only about 0.4%. Since many ring parasitics and bulk parasitics, however, have incident angles much larger than 90°, the absorption depth is much longer, and even relatively low doping levels can be effective in suppressing parasitics. The use of low doping levels does allow reflections from the barrel surface to be returned to the gain region of the rod and increase the ASE level, although if the barrel is in contact with water, the returned ASE is much less. We have successfully doped Sm into YAG with >15 at. % concentration.
Figure 41. Transmission of Nd:YAG 1064.2 fluorescence through a Sm:YAG layer, as a function of optical thickness (Sm doping density—Sm:YAG thickness product), for a Nd:YAG FWHM gain bandwidth of 1.1 nm, and assuming a Gaussian (red) or Lorentzian (green) gain spectral profile.
Applsci 06 00023 g041
An attractive feature of the Sm:YAG and Sm:LuAG spectra is that they have little absorption around 808 nm, the main pumping channel used for Nd:YAG. In that regard, for Nd:YAG and Nd:LuAG Sm:YAG and Sm:LuAG are superior to Cr4+:YAG which has substantial absorption at that wavelength and can be partially bleached by the pump diodes. That consideration is particularly important for transverse-pumping geometries.
For higher average power lasers, placing a Sm absorbing layer directly on the outside surface of a rod or other lasing crystal geometry may not be the optimum solution, because the absorption of high densities of heat in the Sm cladding later will result in complicated radially varying temperature profiles, leading to unwanted stresses in the doped lasing region. The best solution may be to grow an undoped buffer layer between the lasing and absorbing regions, as well as to have a Sm gradient layer whose doping is lowest next to the undoped region and highest at the edge. Hydrothermal growth is capable of producing such gradient doped layers [120].

3.1.3. Dy:YAG and Dy:Lu2O3 For The Suppression of Parasitic Oscillations and Amplified Spontaneous Emission

We are also investigating hydrothermally-grown Dy:YAG and Dy:Lu2O3 crystals with a view towards their use as potential parasitics and amplified-spontaneous-emission (ASE) absorbers. The measured absorption cross-section data are shown in Figure 42 and Figure 43 for Dy:YAG and Dy:Lu2O3 respectively. Dy:YAG is an interesting laser material that has received attention recently as a relatively rare example of a direct transition (4F9/26H13/2) in the yellow spectral region at 583 nm [124]. Previously, Sm3+, Co2+, Co3+, Cr3+, and Cr4+ in YAG have been evaluated as parasitic and ASE absorbers for ceramic laser materials at the Nd:YAG wavelength, 1064 nm [125]. Our interest is in developing parasitic and ASE absorbers that are effective at various Yb wavelengths around 1030 nm, and that are effective at room temperature and cryogenic temperatures. In particular, we are interested in absorbers that are effective and can be epitaxially-grown on the outside surfaces of Yb:YAG and Yb:Lu2O3 laser elements. For Dy:YAG, the absorption cross-sections at 1030 nm are rather small, 6 × 10⁻²³cm2 at 298 K, and 9 × 10⁻²³ cm2 at 80 K. Even for large Sm dopings, as a parasitics and ASE absorber this material seems marginal at best. In the case of Dy:Lu2O3, however, the results are more promising, with the absorption cross-sections at 1033 nm are 6 × 10⁻²² cm2 at 298 K, and 2 × 10⁻²² cm2 at 80 K. These cross-sections are roughly an order of magnitude lower than for Sm:YAG at 1064 nm, however, larger Sm doping densities can make this crystal useful at room and cryogenic temperatures. It is however likely that for Yb:YAG, either Cr4+:YAG or Co3+:YAG may be better choices since the absorption cross-sections in those materials, both of which may be epitaxially grown on Yb:YAG using the hydrothermal method, are much larger at 1029 nm. A similar conclusion may be reached if Cr4+ and Co3+ are doped into Lu2O3.
A feature of Figure 42 and Figure 43 worth noting is that the absorption cross-sections around 1300 nm are large, and Dy:YAG can be an effective suppressor of ASE from the 1319 and 1338 nm transitions in Nd:YAG. Similarly, Dy:Lu2O3 can suppress the 1359 nm transition in Nd:Lu2O3. At 946 nm, both Dy:YAG and Dy:Lu2O3 have marginal absorption.
Figure 42. Absorption cross-section as a function of wavelength for a hydrothermally-grown Dy3+:YAG crystal at 80 K (blue) and 298 K (green).
Applsci 06 00023 g042
Figure 43. Absorption cross-section as a function of wavelength for a hydrothermally-grown Dy3+:Lu2O3 crystal at 80 K (blue) and 298 K (green).
Applsci 06 00023 g043

4. Review and Status of Cryogenic Laser Technology

In the past ten years, enormous progress has been made in our fundamental understanding of cryogenic lasers. Our increased knowledge of the fundamental materials properties of laser crystals at cryogenic temperatures has enabled the demonstration of ever more powerful cryogenic laser sources. The already demonstrated compelling performance advantages of cryogenic lasers has led to the adoption of the technology by many researchers around the world, and have garnered attention in the commercial and military laser communities as well. While the acceptance of cryogenic lasers in commercial and military applications has been delayed, due in large part to the need for the acceptance of cryogens that add complexity and cost, the technology has now been fully embraced by the scientific community because of the many performance advantages that can be obtained, and the need for HAPP lasers with near-diffraction-limited beam quality.

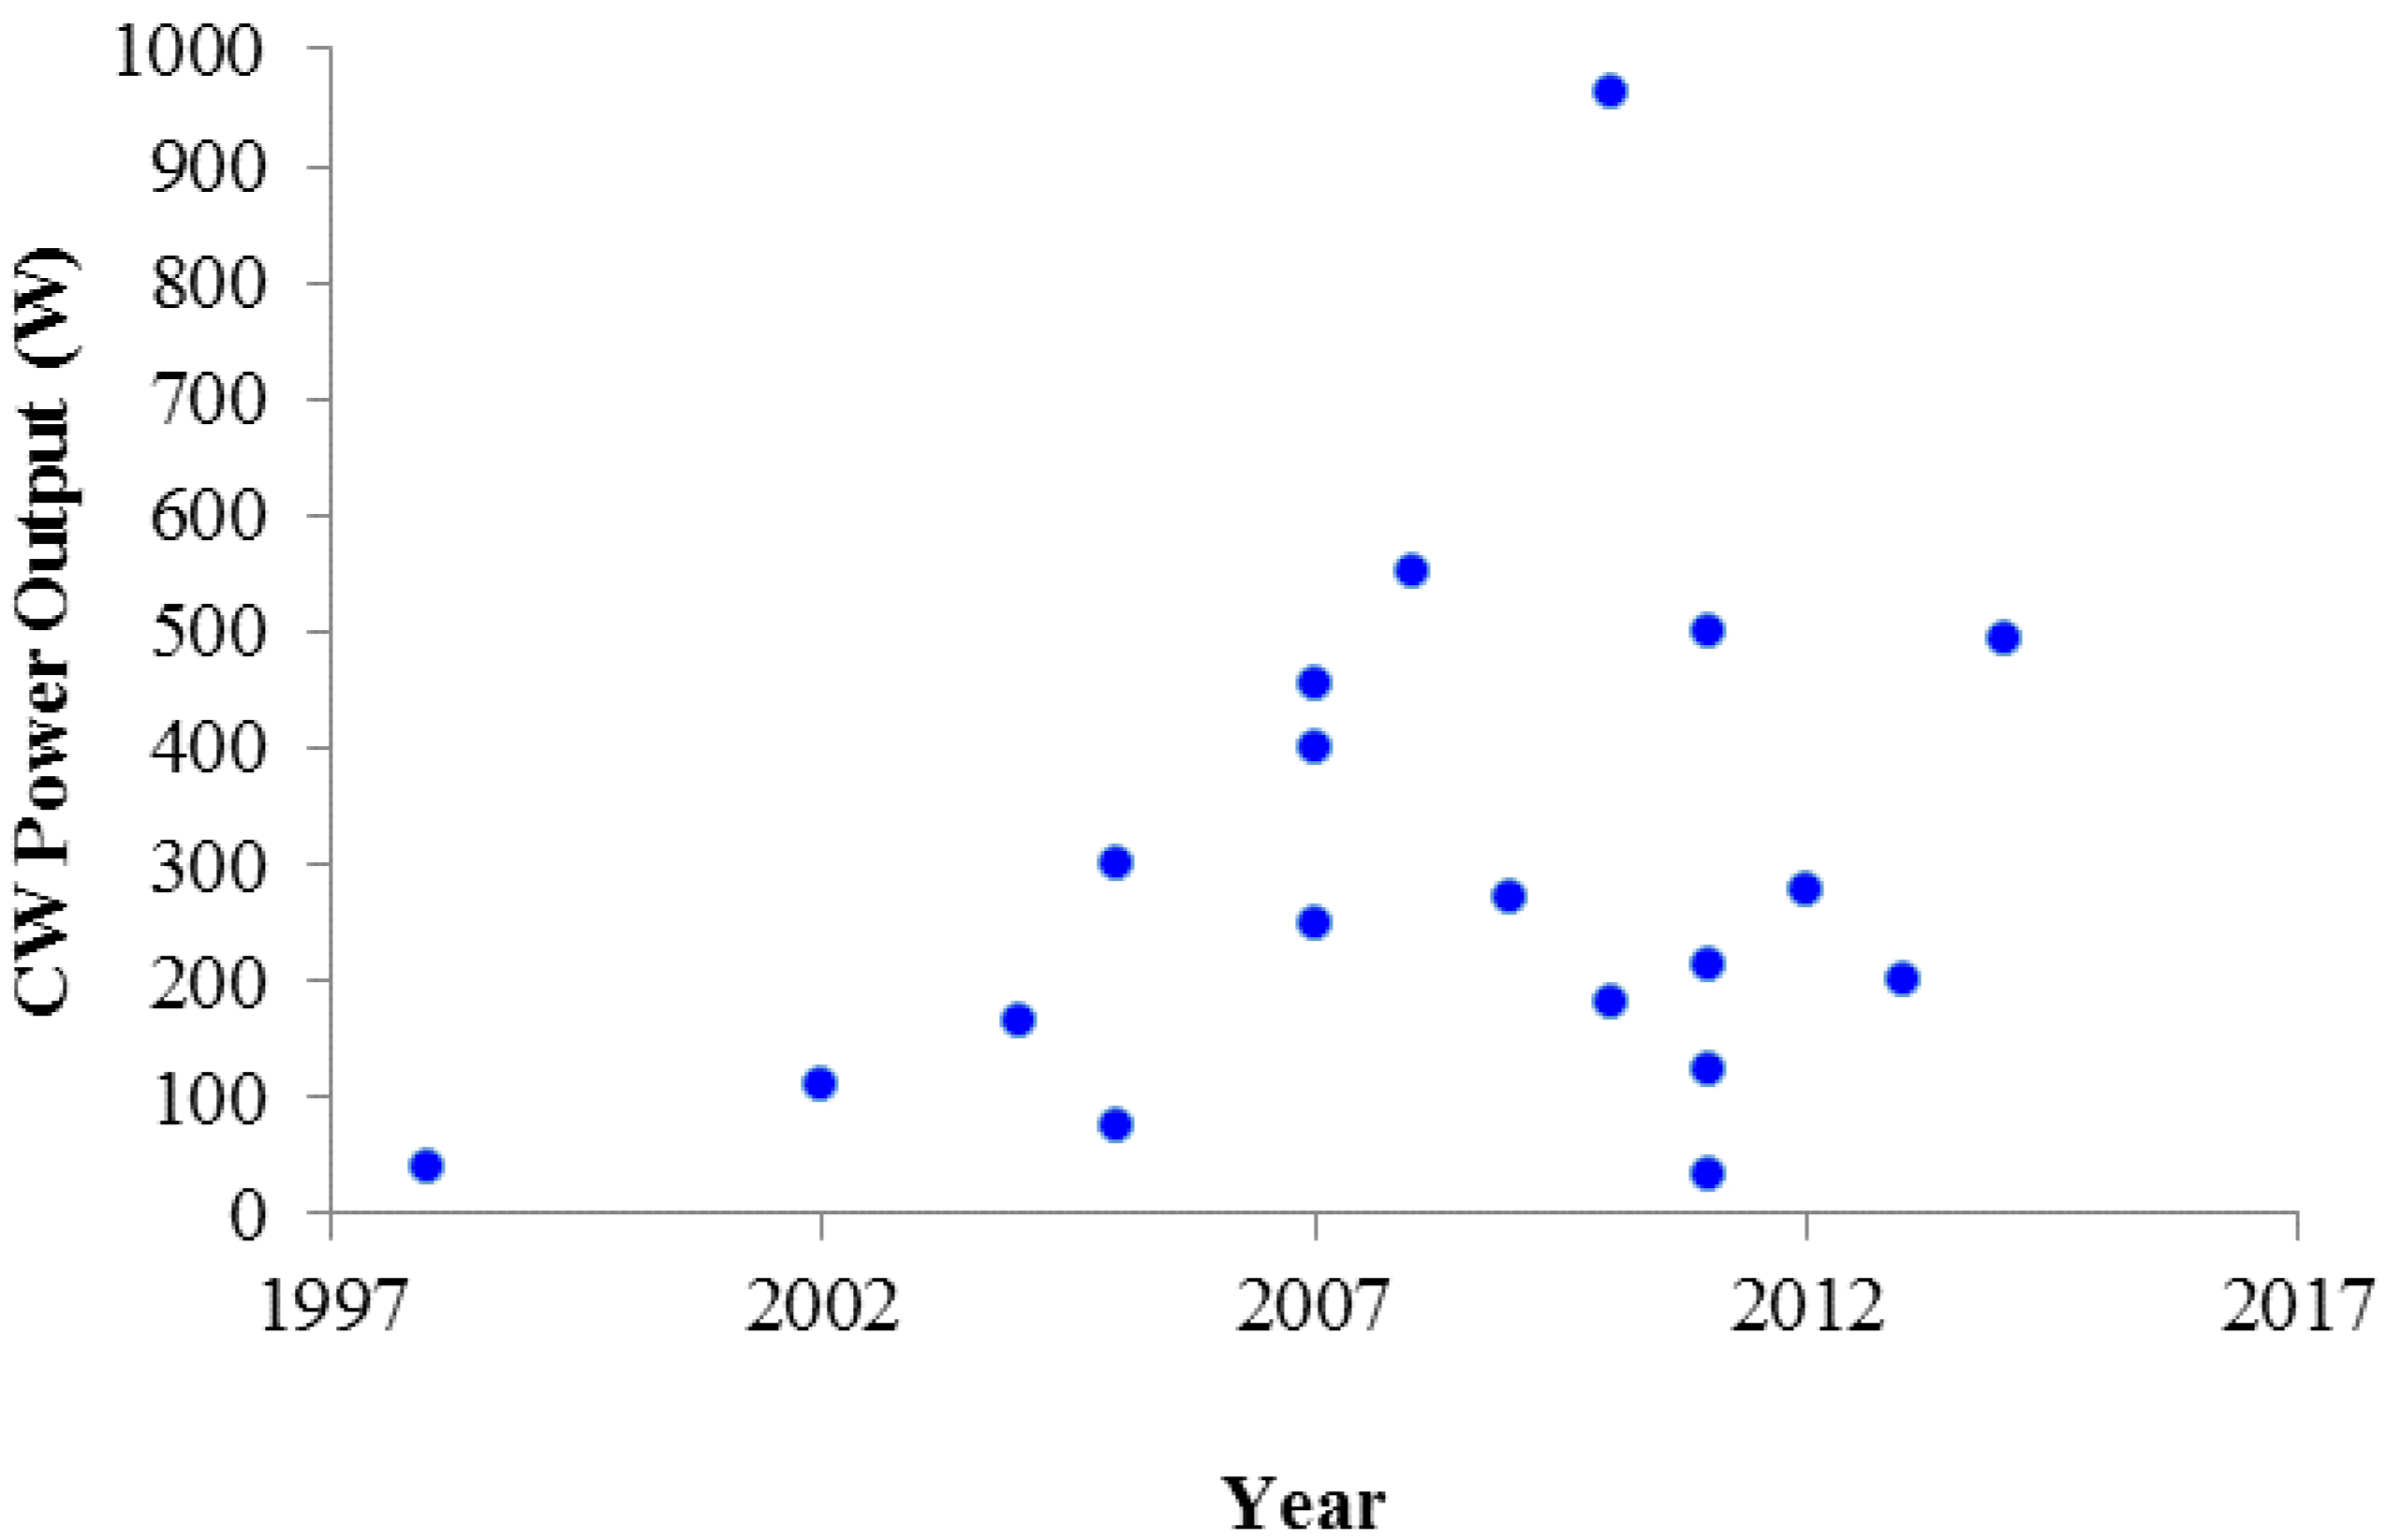
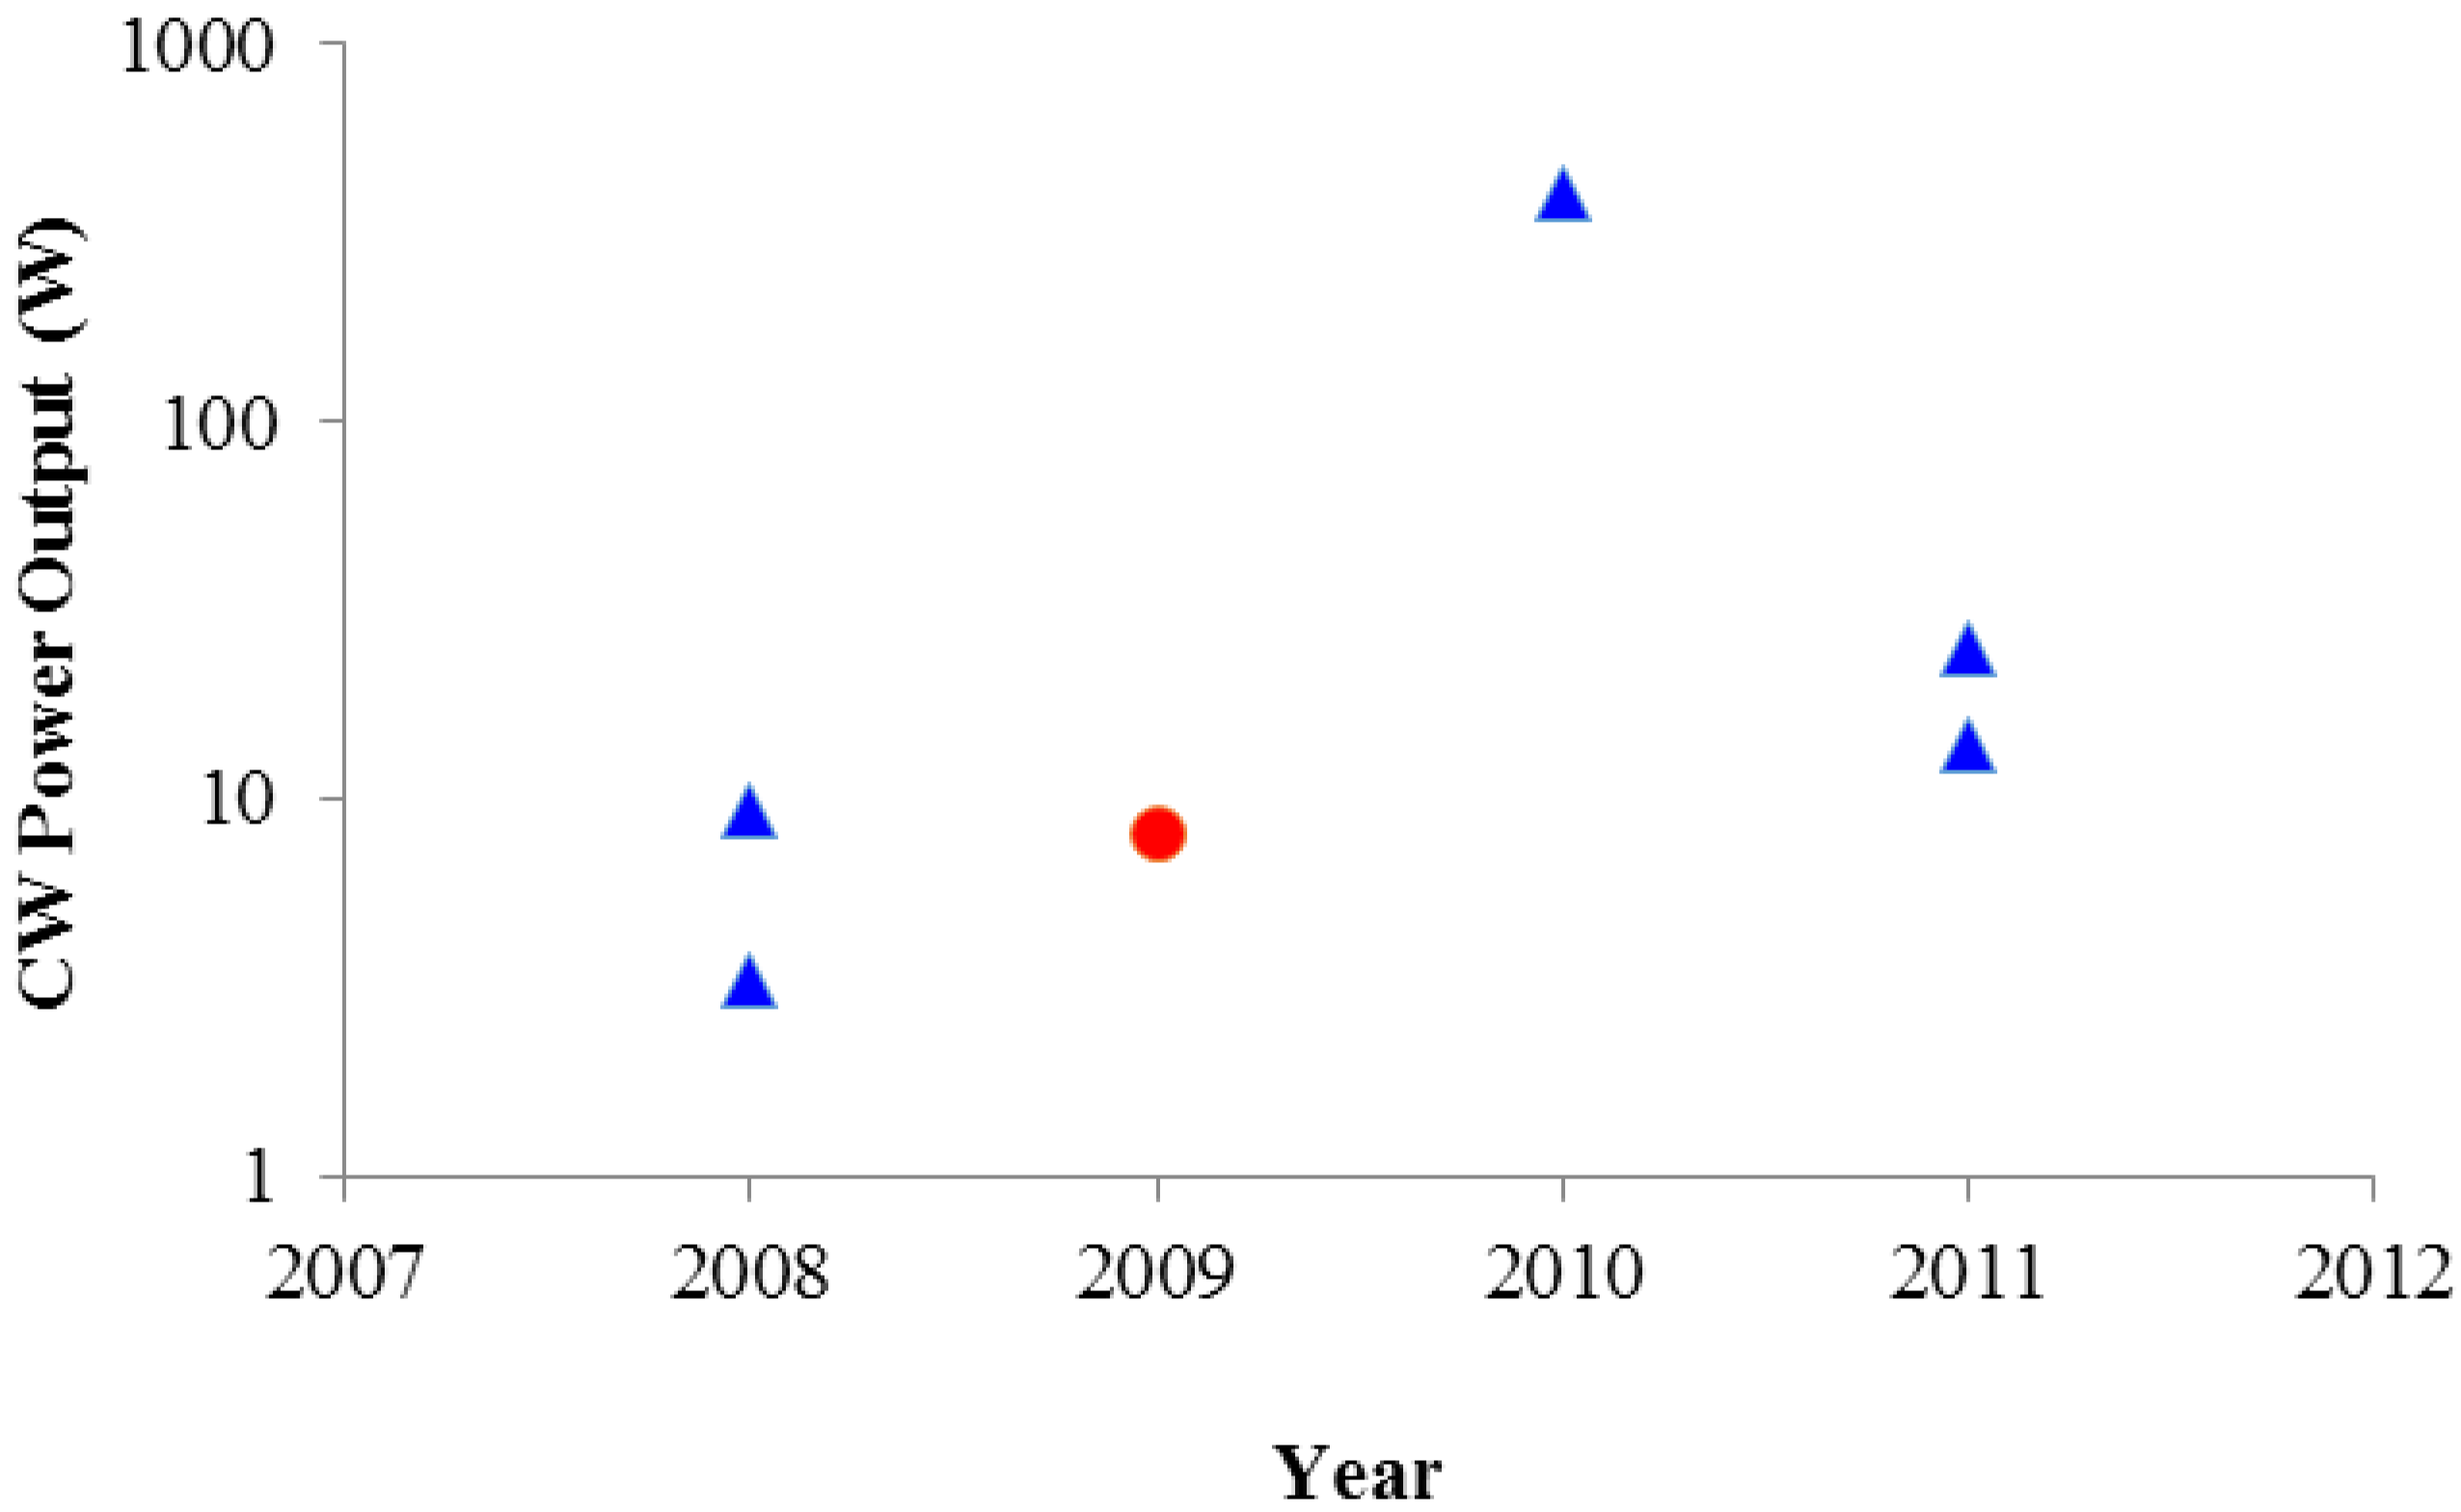
4.1. Cryogenic CW Lasers

In this section of the manuscript we will review the progress that has been made in the development of CW, nanosecond, picosecond, and femtosecond cryogenic laser sources in the modern era. We begin by first looking at the evolution of Yb:YAG, Yb:YLF, and Yb:CaF2 CW cryogenic lasers; Yb:YAG and Yb:YLF materials have been used for the highest power CW demonstrations to date. Figure 44 shows the CW output power obtained from Yb:YAG cryogenically-cooled lasers operating near 80 K. The corresponding data and references are shown in Table 7 [1,3,4,30,108,109,126,127,128,129,130,131,132,133,134,135,136,137,138,139]. The first CW Yb:YAG demonstration was by Lacovara [1], who reported 40 W output power. The earliest demonstration of CW power in excess of 100 W is attributed to [109], whom reported a cryogenic Yb:YLF laser with output power of 110 W. This was followed by two early high power CW Yb:YAG cryogenic laser demonstrations at 165 W [126] and 300 W [127] by the MIT cryogenic laser group. CW cryogenic Yb:YAG lasers with CW output power ≥400 W have been reported by a number of groups, including 455 W [3], 400 W [129], 550 W [130], 500 W [135], and 494 W [138]. The largest CW power for a Yb:YAG cryogenic laser reported to date, 963 W, was for a Yb:YAG cryogenic oscillator driven double-passed Yb:YAG preamplifier followed by a Yb:YAG power amplifier demonstrated by our group [132]. We include Yb:CaF2 here due to a recent high power demonstration with a quantum-defect of only 1.11% [134].
For Yb:YLF, the highest average power reported to date is 180 W by the MIT cryogenic laser group [108]. We note that almost all of the CW laser sources included in Figure 44 had near-diffraction-limited beam-quality with M2 values typically <1.3. The one exception is [129], which reported multi-transverse-mode operation.
Figure 44. CW output power at 1029 nm from demonstrated Yb:YAG and Yb:YLF cryogenic lasers in the years 1998–2015.
Applsci 06 00023 g044
Table 7. Reported Cryogenic CW Yb:YAG and Yb:YLF Demonstrations From 1998–2015.
YearCW Output Power (W)Laser MaterialReference
199840Yb:YAG[1]
2001110Yb:YLF[109]
2004165Yb:YAG[126]
2005300Yb:YAG[127]
200575Yb:YAG[128]
2007250Yb:YAG[129]
2007455Yb:YAG[3]
2007400Yb:YAG[4]
2008550Yb:YAG[130]
2009273Yb:YAG[131]
2010180Yb:YLF[108]
2010973Yb:YAG[132]
2011214Yb:YAG[133]
2011123Yb:YAG[30]
201133Yb:CaF2[134]
2011500Yb:YAG[135]
2012277Yb:YAG[136]
2013200Yb:YAG[137]
2014494Yb:YAG[138,139]

4.2. Other Cryogenic CW Lasers

4.2.1. Ho:YAG Cryogenic Lasers

Other cryogenic CW lasers have been developed recently as well. In [140], the authors describe a cryogenically-cooled CW Ho:YAG laser pumped by a Tm:Glass fiber laser with output at 1932 nm, producing 8 W of CW power output at ~2100 nm. In addition, still pumping at 1932 nm, the authors report 2.5 W of CW output power at 1976 nm, resulting in a very low quantum defect of 2.2%.

4.2.2. Er Cryogenic Lasers

A number of Er based cryogenic lasers have also been reported in the literature [141,142,143,144,145,146,147]. A group at the U.S. Army Research Laboratory has investigated Er:Y2O3 [141,142], Er:Sc2O3 [144], and Er:YAG [144,145] crystals operated at cryogenic temperatures as potential candidates as eye-safe lasers. In [144], a 1530 nm pumped Er:YAG crystal at 78 K was operated quasi-CW, producing 375 mJ energy/pulse at a 2 Hz repetition rate. The output wavelength was 1618 nm for temperatures <90 K, and 1645 nm for >110 K. Further results for Er:YAG were later reported in [145], where a careful and thorough study of the spectroscopic and lasing properties of the material are discussed. Over 25 W of quasi-CW output power was obtained. A 1525 nm pumped Er:Sc2O3 crystal was demonstrated to operate at 1558 nm, resulting in a very low quantum defect of only 1.5% [143]. The CW output power was 3.3 W. An Er:Y2O3 crystal diode-pumped with a 974 nm source was also demonstrated with output at 2710 nm and CW output of 14 W [142]. One higher average power demonstration has been discussed in the literature as well, at cryogenic temperatures. A 400 W Er:YAG cryogenic laser has been described [146] that produced 386 W of CW output power at 1645 nm, 420 W of quasi-CW power, and was also operated Q-switched. Most of the results described here were obtained in “proof-of-principle experiments”, using relatively recently developed InGaAsP/InP (1000–1650 nm) diode laser sources that are not as technologically or commercially as well-developed as InGaAs/GaAs and InGaAs/GaAs diode sources operating in the 720–850 nm and 900–1100 nm ranges respectively. As a consequence, beam-quality is seldom mentioned, and that the transverse mode distributions are multi-mode. As discussed in the aforementioned, most Yb:YAG cryogenic laser sources routinely produce M2 values of <1.3, and the transverse mode-structure is a single Gaussian mode. This is largely due to the availability of more advanced high-brightness diode sources.
Figure 45 shows CW and QCW power output against the year demonstrated. The data and references are summarized in Table 8. While undoubtedly higher CW power outputs will be reported in the future to address a number of commercial and military applications, at the present time most cryogenic laser research is centered on the development of high-average-power nanosecond, picosecond, and femtosecond laser sources.
Figure 45. CW and QCW output powers from Er (blue) and Ho:YAG (red) cryogenic lasers from 2008 through 2011.
Applsci 06 00023 g045
Table 8. Reported Cryogenic CW Er and Ho Demonstrations From 2005–2011.
YearCW Output Power (W)Laser MaterialReference
20089.3Er:Y2O3[141]
20083.3Er:Sc2O3[143]
20098Ho:YAG[140]
2010400Er:YAG[146]
201125Er:YAG[144]
201114Er:Y2O3[142]

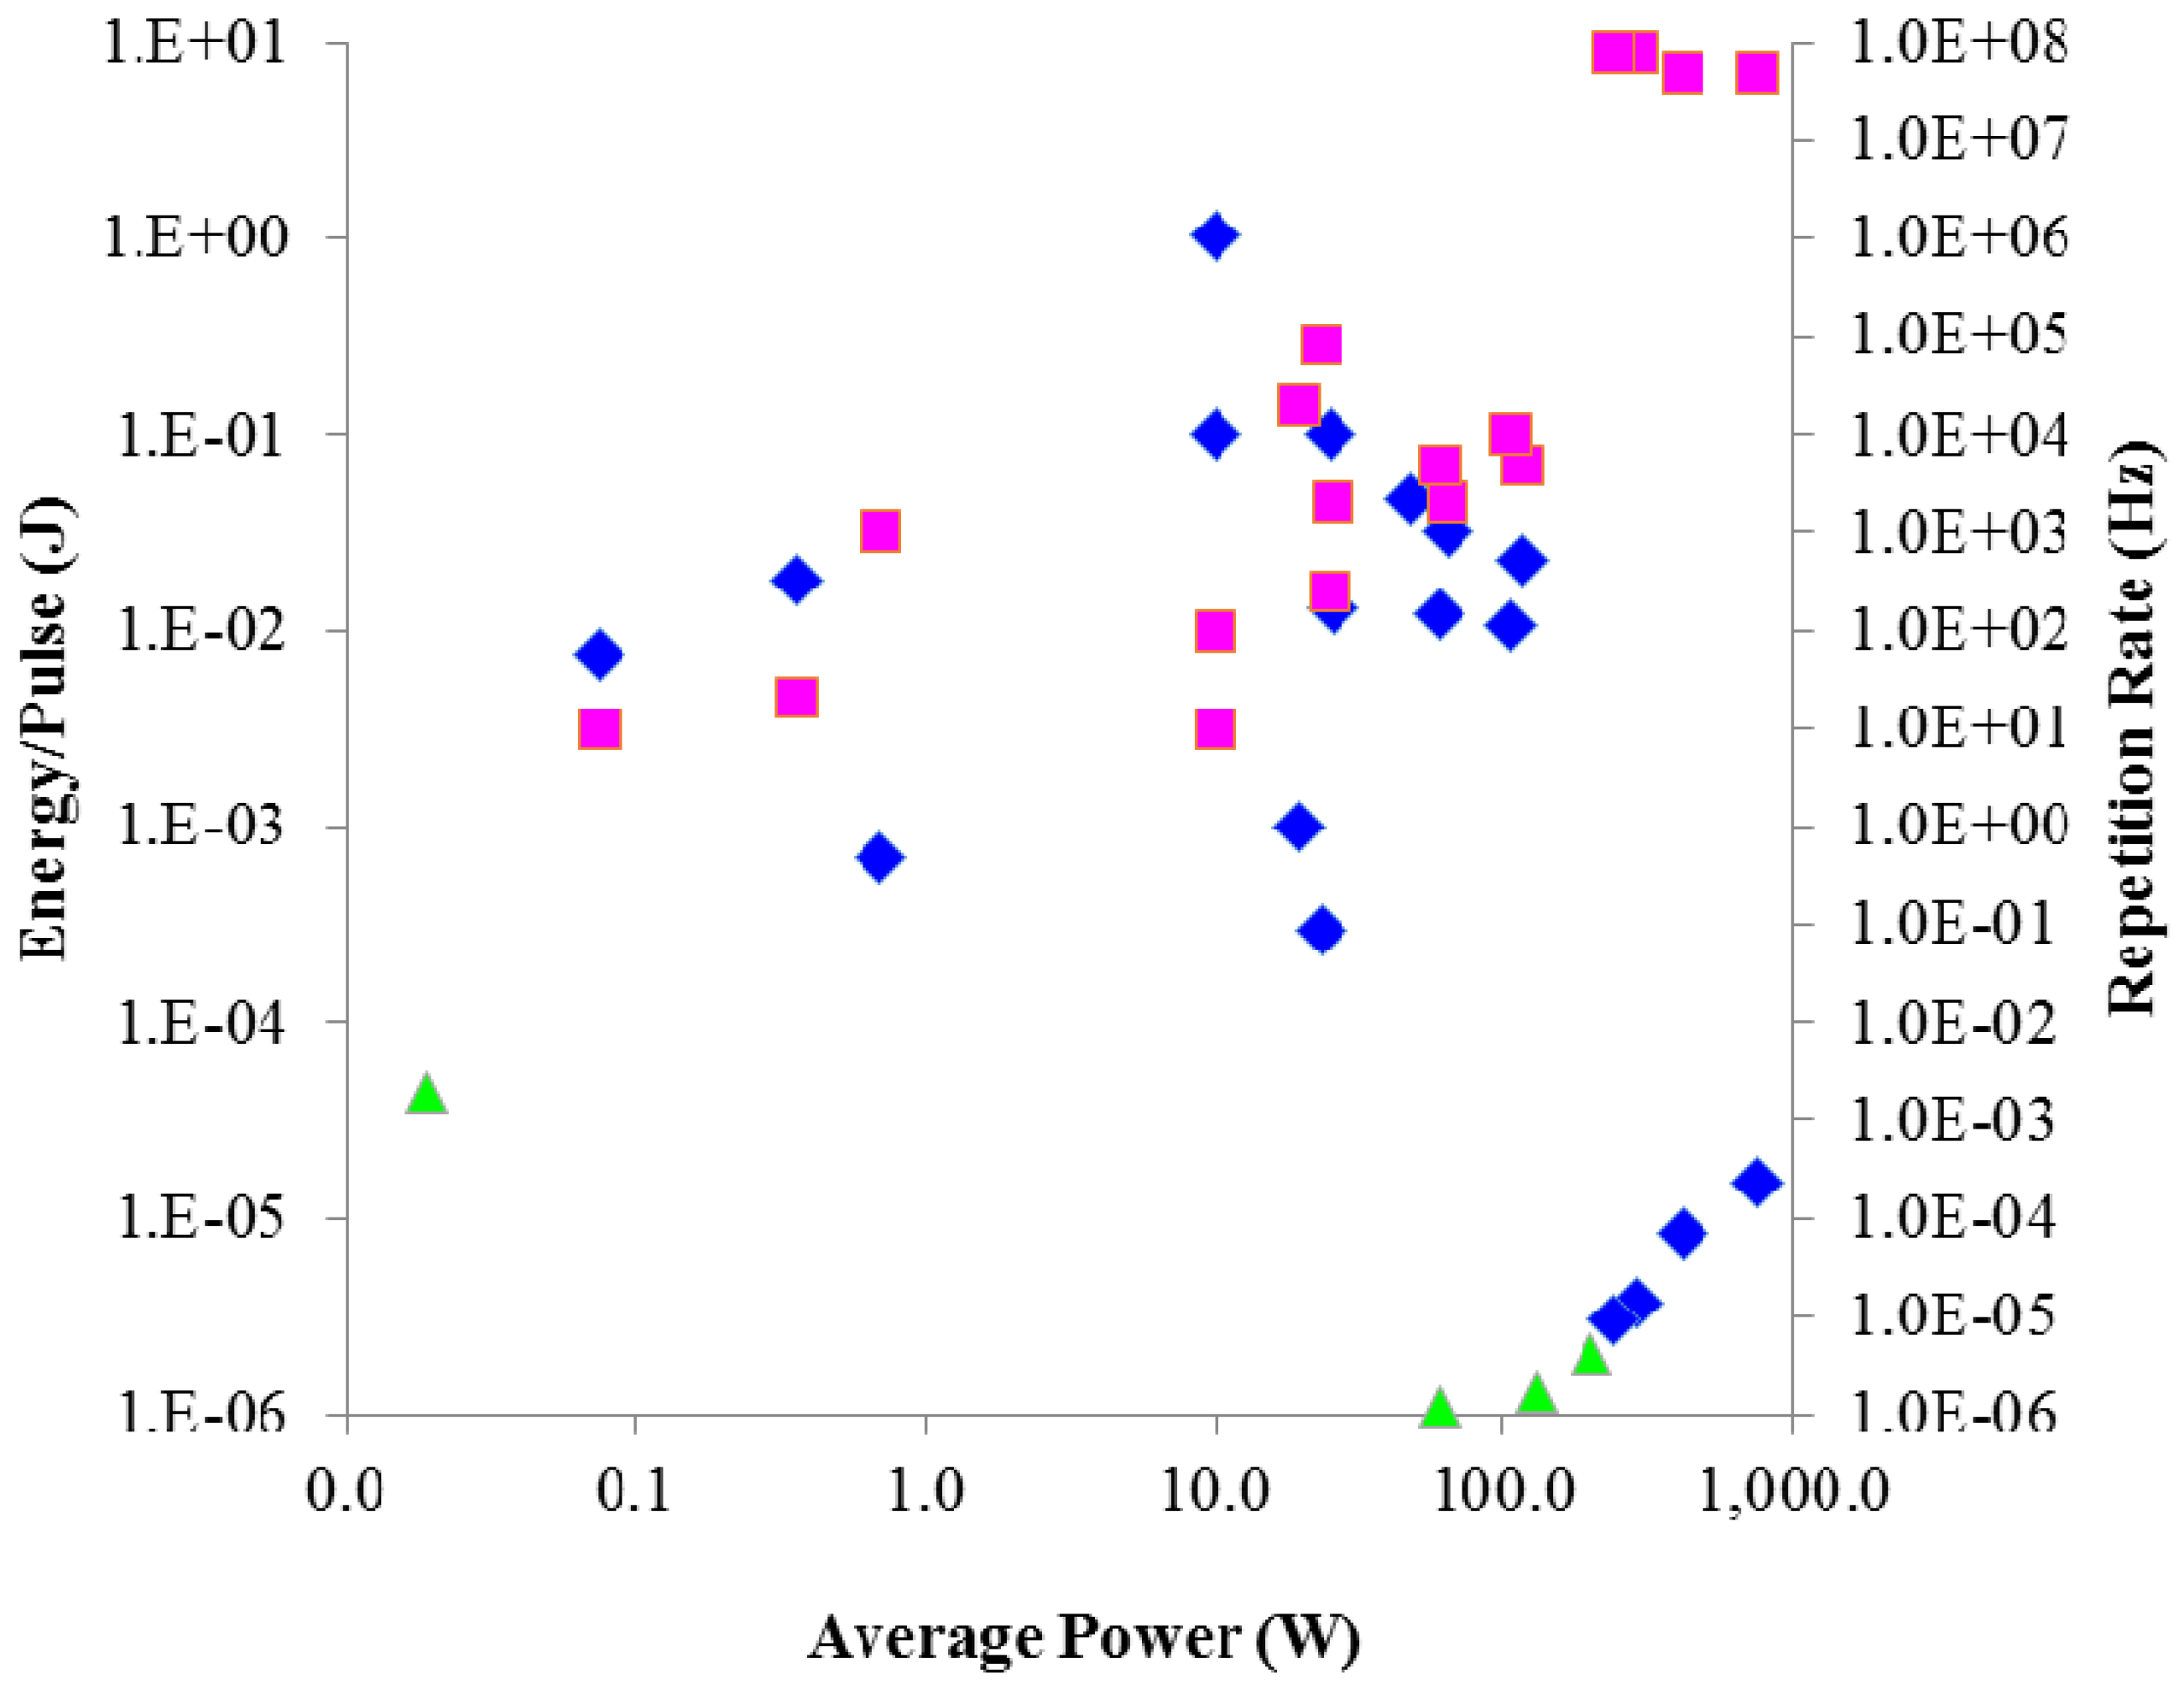
4.3. Cryogenic Nanosecond Lasers

In this section of the manuscript we review the performance of nanosecond cryogenic laser technology. Figure 46 displays the energy/pulse, repetition rate as a function of average power. Table 9 tabulates the corresponding date, energy/pulse, repetition rate, average power, pulsewidth, and reference [30,135,147,148,149,150,151,152,153]. A number of techniques are used to generate nanosecond pulses from cryogenic amplifiers, including acousto-optic or electro-optic Q-Switching, seeded regenerative amplifiers, and in some case regenerative amplifiers followed by one or more power amplifier stages. In [147], 6.5 mJ/pulse at 200 Hz and a 10 ns FWHM pulsewidth, 1.5 mJ at 1 kHz with a 10 ns pulsewidth, and 140 mJ at 100 Hz with a 10 ns pulsewidth were reported, respectively. For this system, a seed laser was used to drive a regenerative amplifier that in turn drove a 4-pass power amplifier. The highest average power produced was 14 W. An earlier paper [148] reported the demonstration of 4.6 mJ pulse energy at a 16 kHz repetition rate in an oscillator configuration that incorporated an acousto-optic Q-switch. The average power produced was 74 W and the pulsewidth 175 nm. Another lower average power cryogenic laser that produced 120 mJ/pulse at a 500 Hz repetition rate, 60 W of average power, and a 70 ns pulsewidth is reported in [149] where a cryogenic Yb:YAG oscillator was used to drive a power amplifier. The cryogenic laser group at MIT, the first to report average power >100 W, demonstrated a 114 W average power cryogenic oscillator [30,150] that produced 22.8 mJ/pulse at 5 kHz, and with a pulsewidth of 16 ns. The highest average power nanosecond cryogenic laser reported to date [135] produced 8.5 mJ pulses at a 40 kHz repetition rate for an average power of 340 W. The pulsewidth produced using an acousto-optic Q-switch was 75 ns.
Figure 46. Nanosecond output energy/pulse (blue) and repetition rate (pink) as a function of average power at 1029 nm from demonstrated Yb:YAG cryogenic lasers in the years 2005–2014.
Applsci 06 00023 g046
Table 9. Reported Cryogenic Q-Switched Yb:YAG Demonstrations From 2005–2011.
YearEnergy/Pulse (mJ)Repetition Rate (Hz)Average Power (W)Pulsewidth (ns)Reference
20054.616,00074175[148]
20106.5500011415[147]
20101.52001.310[147]
201014010001.510[153]
201022.8500011416[30,150]
20114.540,00034075[135]
20131205008070[149]
201310,100110.110[152]
201430501030.510[151]
Two high energy/pulse, low repetition rate cryogenic nanosecond lasers have been reported in the literature. The first [151] achieved 3.05 J/pulse at 10 Hz for an average power of 30.5 W and with a 10 ns pulsewidth, using a seeded regenerative amplifier followed by active-mirror pre-amplifier and power amplifier stages. The largest energy/pulse was demonstrated in connection with the DiPOLE (Diode-Pumped Optical Laser Experiment) project [152]; 10.1 J/pulse at a 1 Hz repetition rate was obtained with a 10 ns pulsewidth and producing 10.1 W of average power. The laser can also produce 6.4 J/pulse at 10 Hz repetition rate. This laser system is innovative in that it uses cryogenically cooled He gas to remove heat from a parallel array of Yb:YAG laser slabs in an arrangement very reminiscent of the Mercury laser project at Lawrence Livermore National Laboratory (LLNL) in the US, where the concept of using stacks of aerodynamically shaped slab holders originated [154]. While we have not specifically discussed the methods of cryogenic-cooling in this article, here we mention that the use of He at cryogenic temperatures to cool laser crystals is in its infancy. Another innovative way to cool laser disks and slabs has recently been published [155] that uses a static He layer that separates an active-mirror amplifier from a copper plate cooled to 77 K using liquid nitrogen. This technique can eliminate the soldering of laser disks to high thermal conductivity materials such as Cu or CuW, and substantially increases the lifetime of HR coatings on active-mirror disks that can be degraded from contact with liquid coolants such as water or liquid nitrogen.

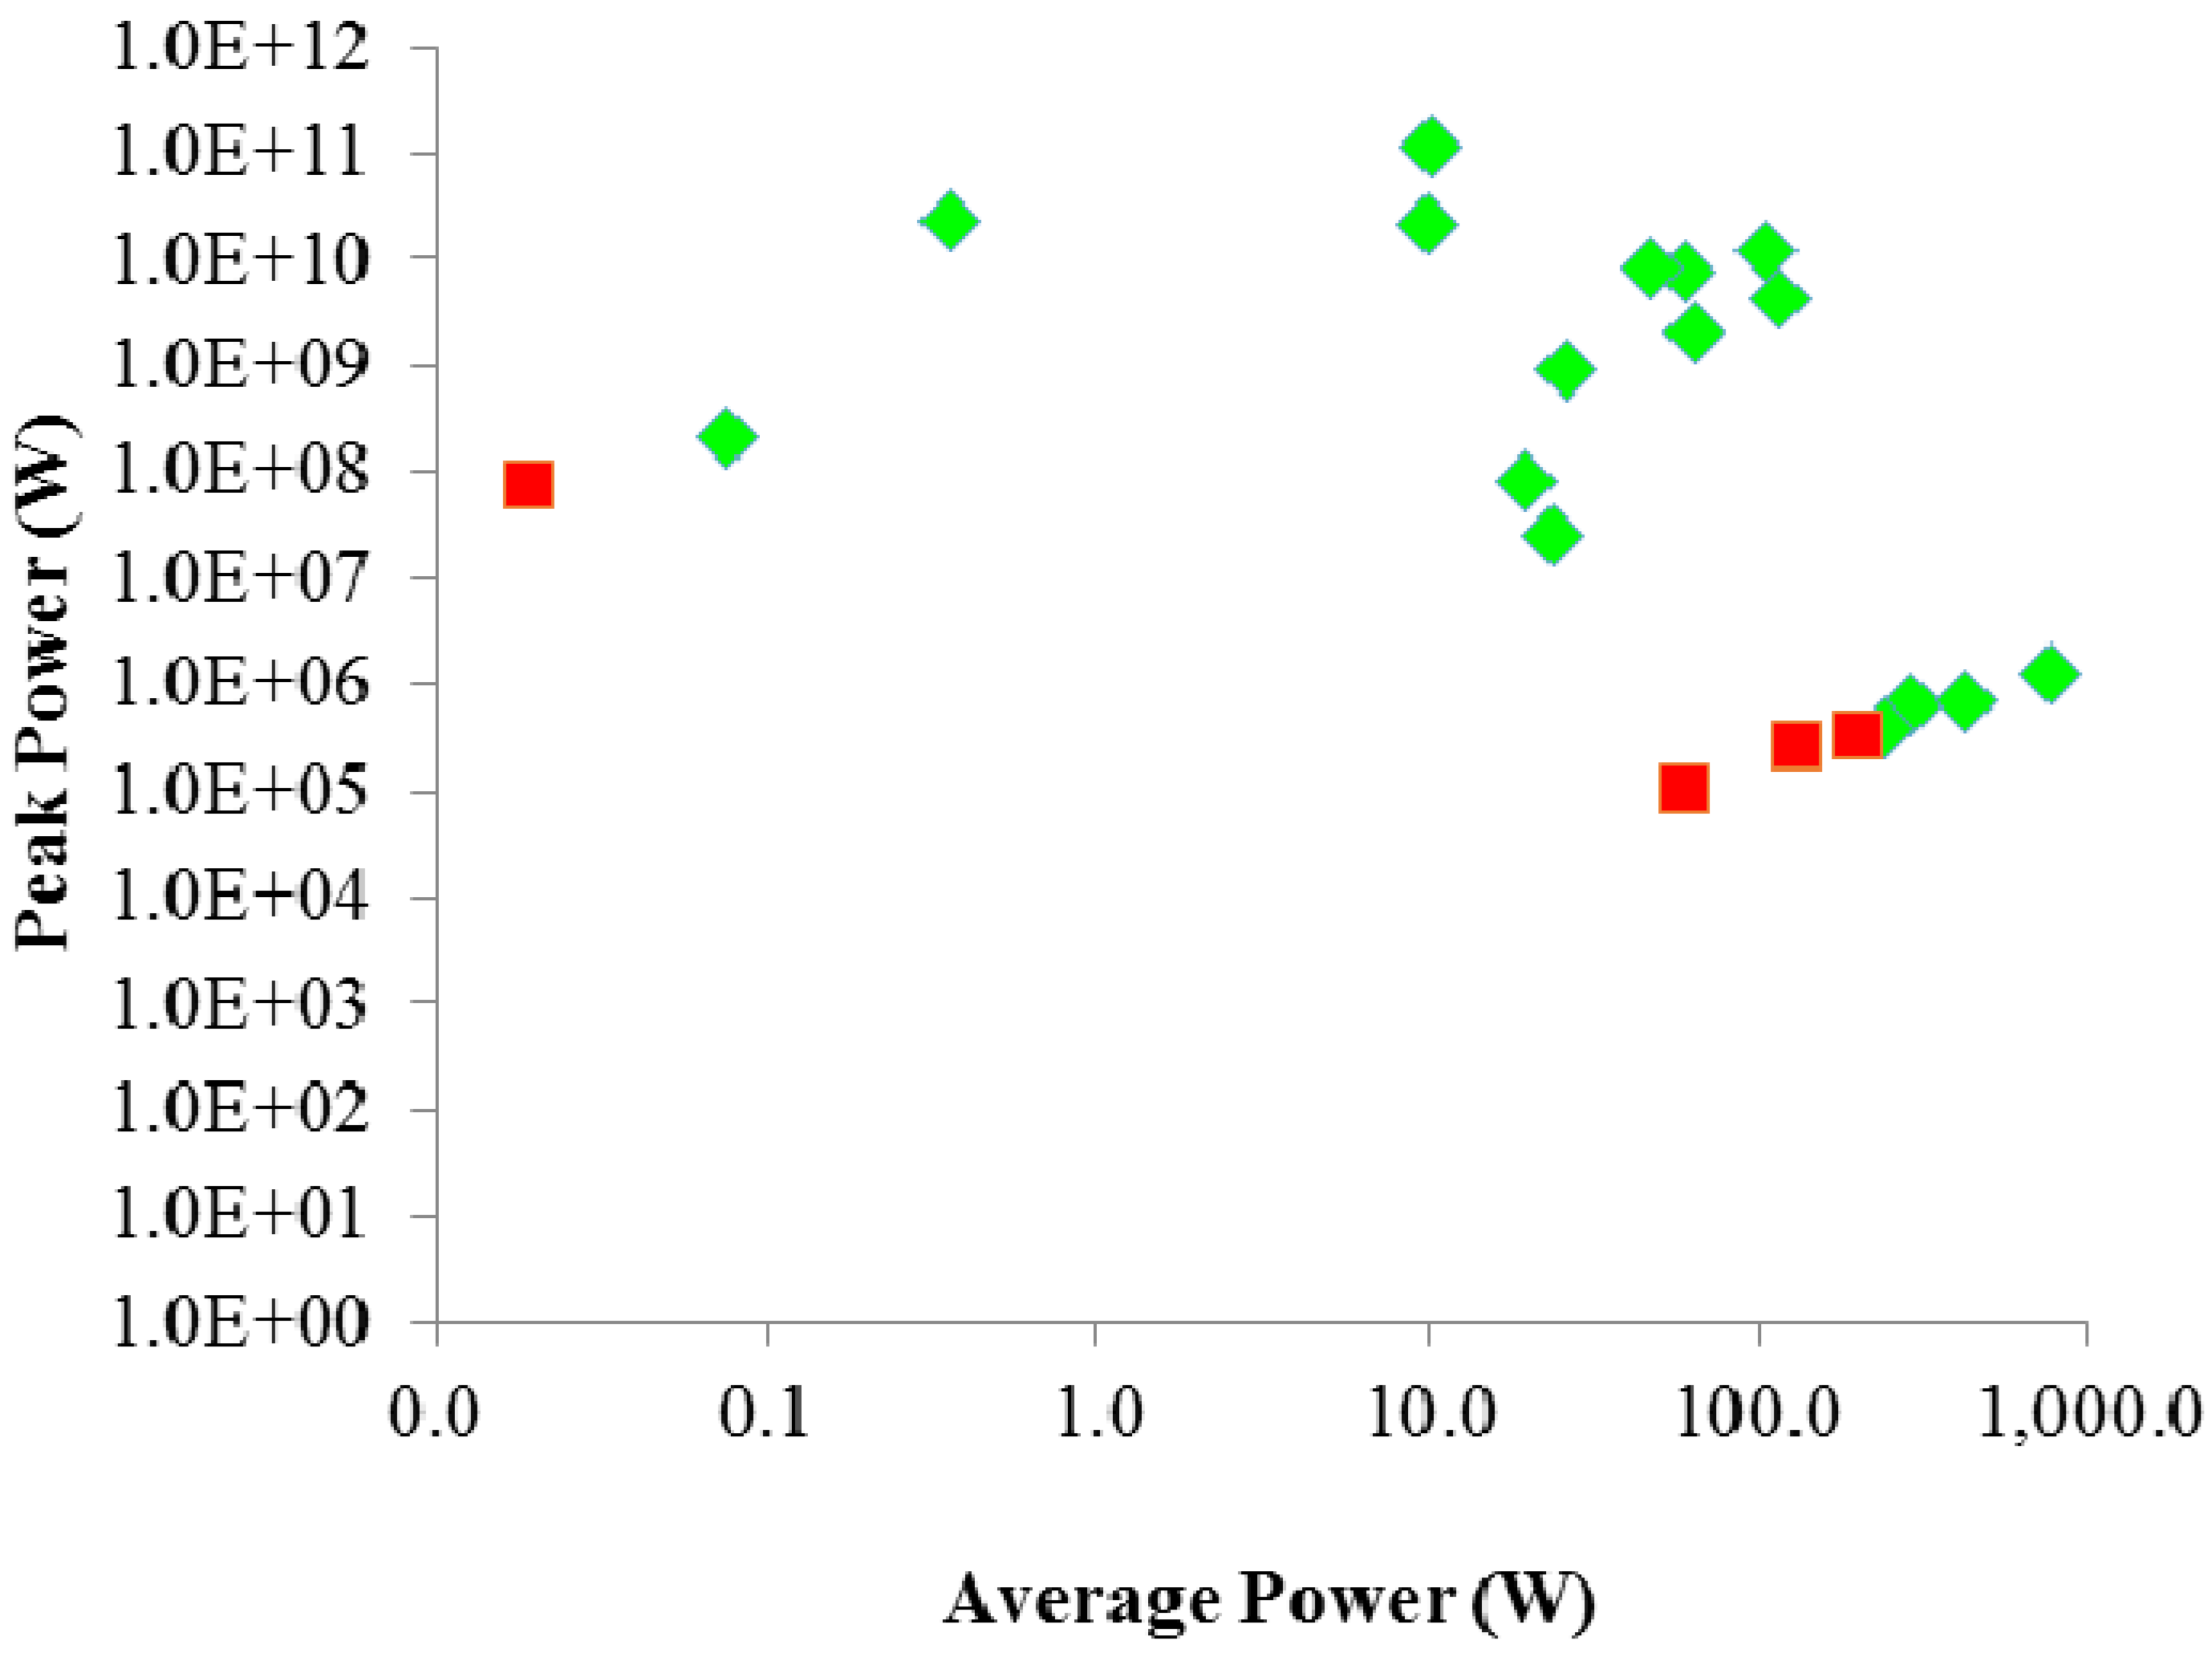
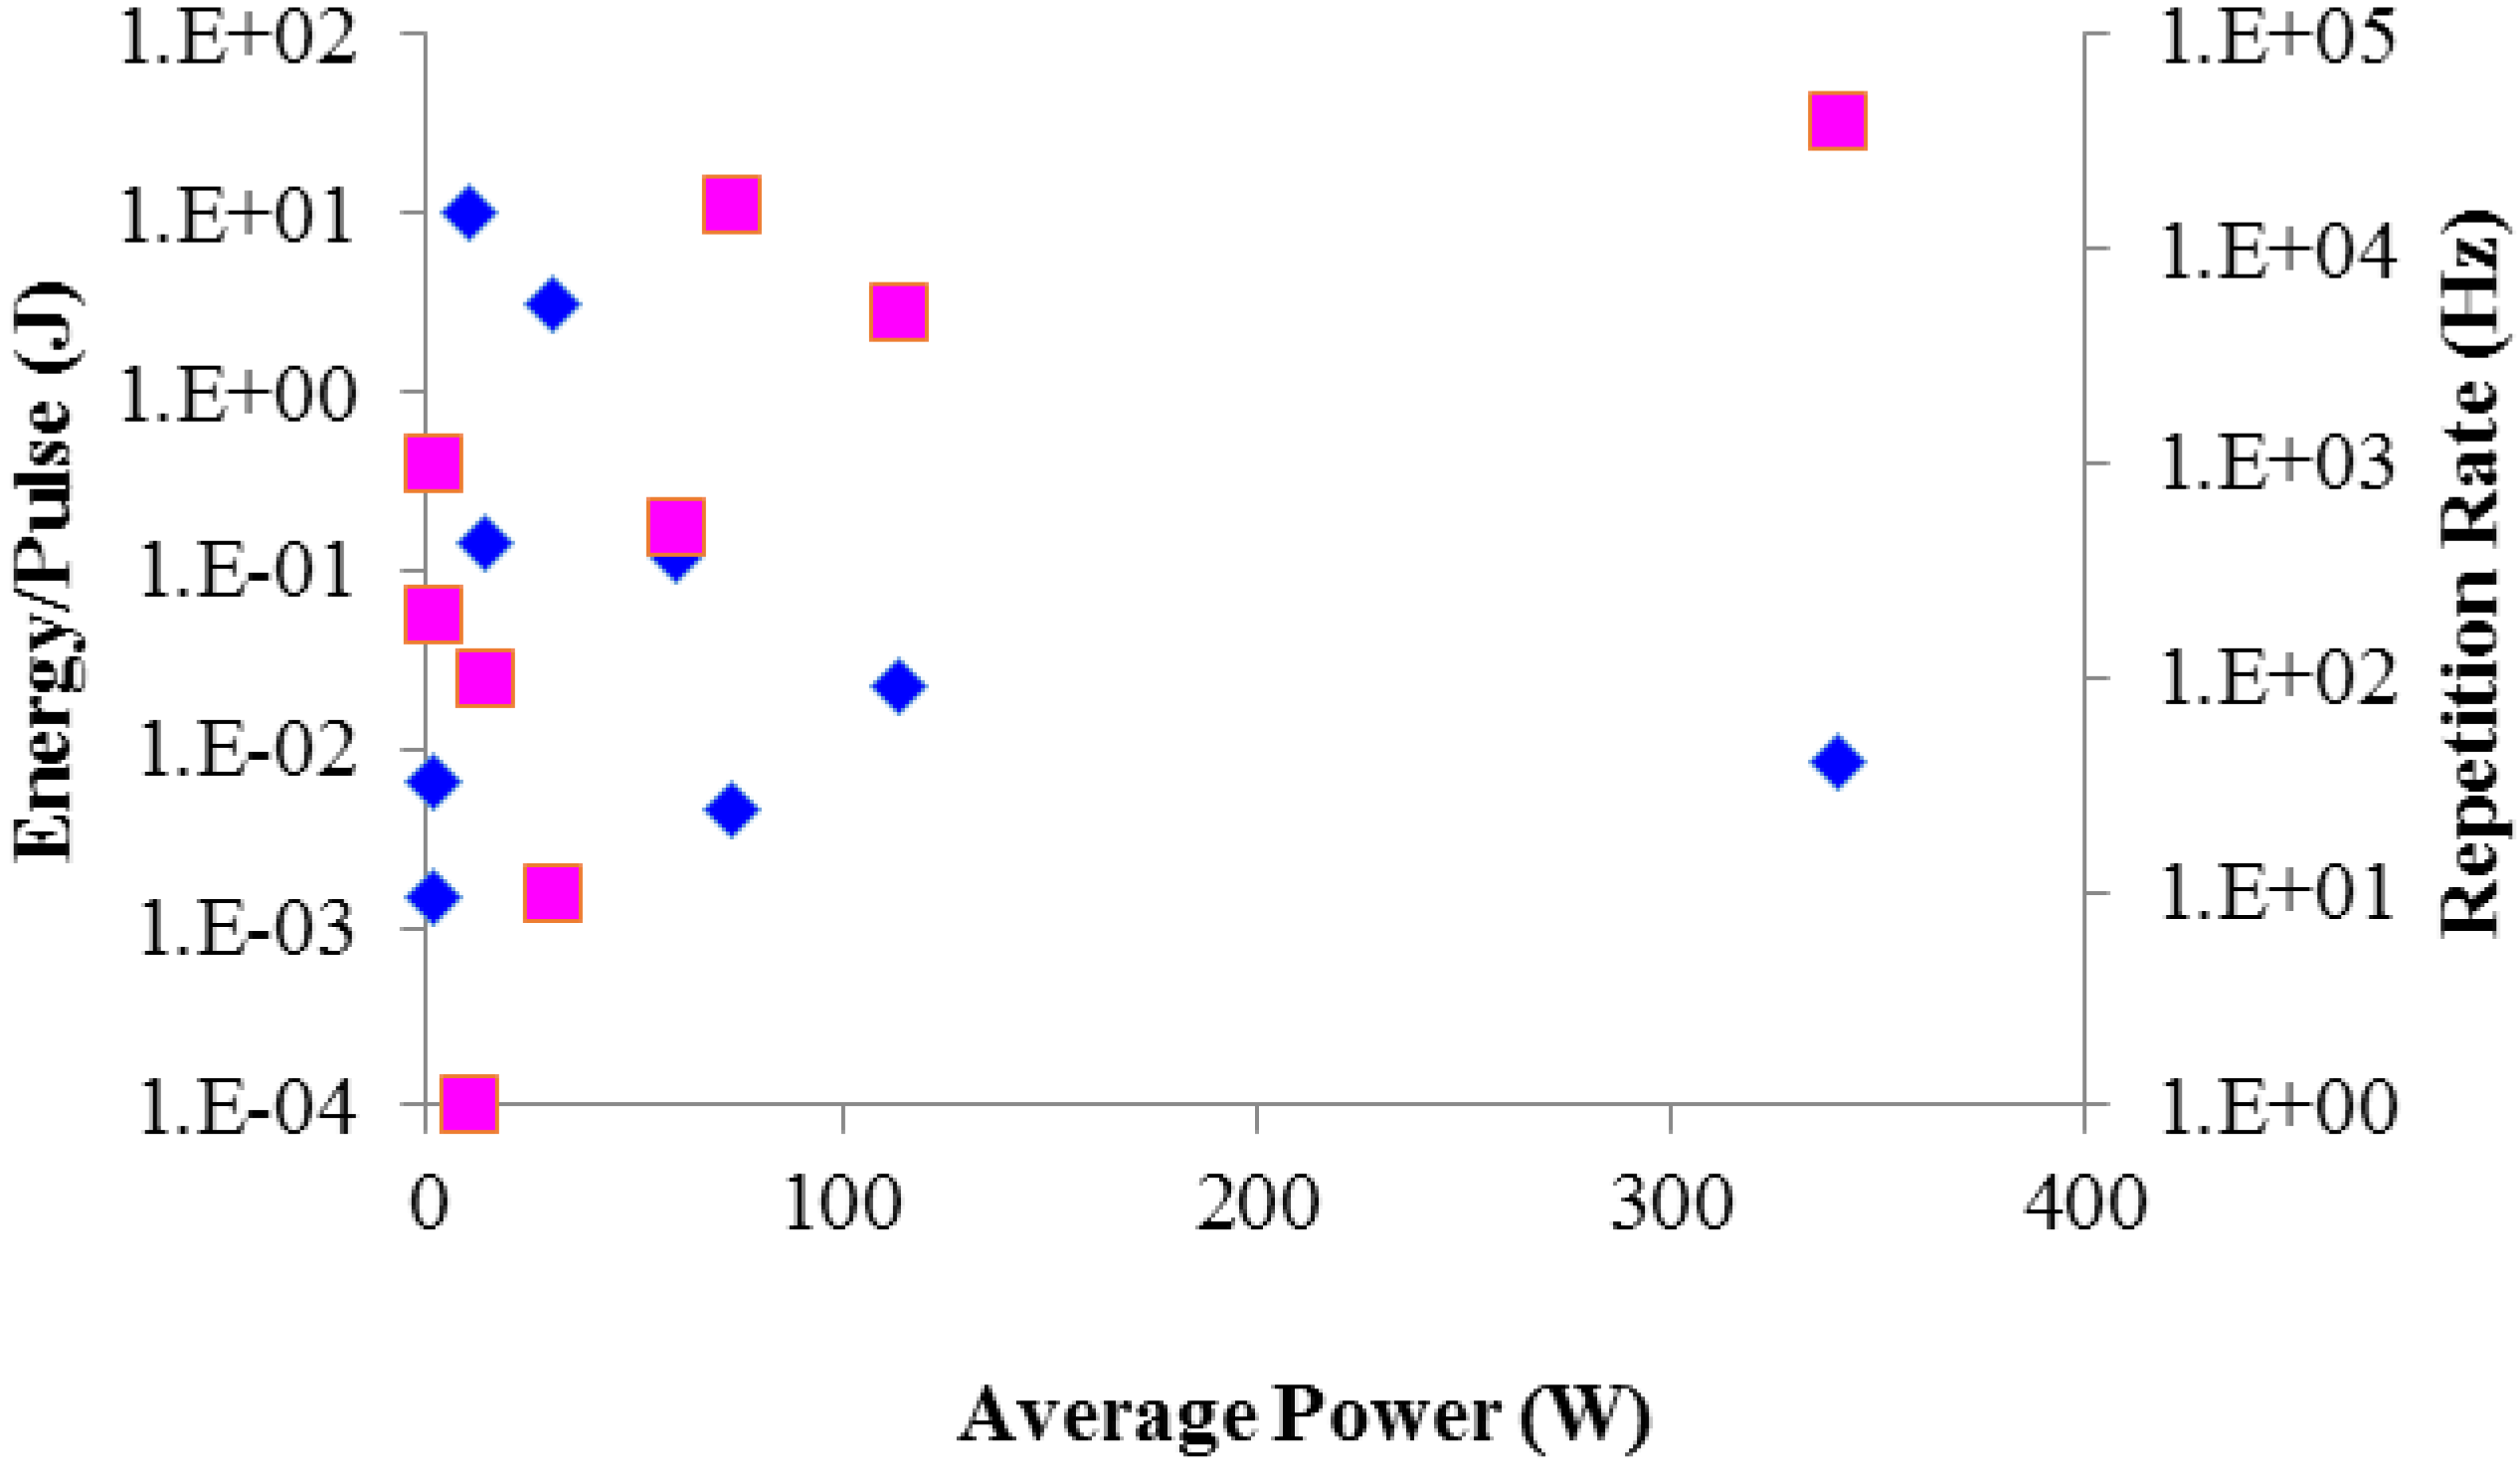
4.4. Cryogenic Ultrafast (Picosecond and Femtosecond) Lasers

In this final section of our paper, we discuss the application of cryogenic laser technology to enhancing the performance of ultrafast lasers operating in the picosecond and femtosecond regimes. Cryogenic cooling has been implemented to enhance the performance of Ti:Al2O3 in recent years [31,33,34,35], for example, and even commercial companies have begun to incorporate the technology. The enhancement of Ti:Al2O3 ultrafast systems at present incorporates closed cycle Gifford-McMahon or pulse tube coolers to reduce thermal focusing, usually in the pre-amplifier stage of a chirped-pulse-amplification (CPA) system. While the thermal properties of such systems are improved, dramatic improvements have not been demonstrated, partly because sapphire already has a large thermal conductivity at room temperature. State-of-the-art Ti:Al2O3 CPA systems have been limited in average power for quite some time to <100 W. Orders of magnitude increases in the average power capability of Ti:Al2O3 however may be achieved through the development of powerful new cryogenic pump lasers, providing kilowatt average power capability. Several current efforts to produce picosecond high average power cryogenic lasers at the 1 J/pulse level and greater at kHz repetition rates, discussed later in this section, provide validation to designs capable of producing high average power nanosecond cryogenic frequency-doubled green lasers with high efficiency, to be used as pump sources for high-average-power CPA Ti:Al2O3 lasers. At the present time green pump sources are typically limited to 10–30 Hz repetition rates, although lower peak power systems can operate at kHz repetition rates as well. To produce HAPP Ti:Al2O3 systems with high peak and average powers, however, it is likely that all Ti:Al2O3 amplifiers as well as their pump lasers will need to be cryogenically-cooled.
A second application for cryogenic laser technology for ultrafast lasers is to build strong joule-level pumps operating with kHz repetition rates, to drive optical parametric chirped-pulse-amplification (OPCPA) ultrafast systems, recently described as third-generation femtosecond technology [156]. Parametric amplification has garnered much attention recently because it generates only small amounts of heat and is capable of providing very broad gain bandwidths allowing the production of few-cycle systems. The development of borate based nonlinear crystals such as BBO and LBO, materials with high damage thresholds, has considerably aided the development of OPCPA femtosecond lasers. OPCPA has already produced femtosecond laser performance, and is presently limited by currently available pump sources. The need for better pump sources has been discussed in the literature [156,157], with near universal agreement that high average power pumps with very good beam-quality and pulse durations near ~1 ps and operating in the near-infrared regions are required. Near-infrared sources such as Yb operating near 1030 nm are expected to provide fundamental, second, and third harmonic pumping at high average power, and the recent intensive development of Yb based cryogenic laser sources seem well-positioned to address this need.
In Table 10, we show reported demonstrations of cryogenic Yb:YAG, Yb:YLF, and Yb:Y2O3 in the time period 2003 through 2015, and the output parameters that were achieved. We list, in order from left to right, the year, the crystal type, the pulse energy Ep, repetition rate ν r , average power Pav, the gain bandwith Δ λ C (from Table 6), laser operating wavelength λ L , the Gaussian transform-limited pulsewidth δ t T L , the seed bandwidth Δ λ S , the seed pulsewidth δ t T L S , the amplifier bandwidth Δ λ A , the amplifier expected pulsewidth δ t T L A , the measured output pulsewidth δ t M E A S , the peak power P P , and the corresponding reference [30,110,132,155,158,159,160,161,162,163,164,165,166,167,168,169]. Other acronyms found in the Table are BC (before-recompression), AC (after-recompression), R (cryogenic regenerative amplifier), SHG (second-harmonic-generation), UC for (not re-compressed), and E for estimated. We also use σ to denote use of the σ transition in Yb:YLF. The majority of demonstrations listed in Table 10 involve the use of multi-pass cryogenic Yb:YAG or Yb:YLF amplifiers to boost the peak and average powers of picosecond laser systems, with most systems targeted for use as pumps in OPCPA femtosecond lasers. Another application of interest is the generation of table-top X-ray lasers. We also show in Table 10 the frequency-doubled results, where applicable. Most of the reported cryogenic systems in Table 10 use the CPA technique to stretch seed pulses so as to obtain a higher damage threshold; in a few cases, direct amplification was used to avoid the losses and added complexity of CPA systems.
The Gaussian transform-limited pulsewidth δ t T L is calculated for cryogenic temperatures near 80 K, and uses the bandwidths taken from Table 6 as well as the operating wavelength of the specific laser system. The bandwidth of the seed laser, Δ λ S , is taken from the referenced paper where provided, and used to calculated the transform-limited output pulsewidth δ t S value supported by that bandwidth. For the cryogenic multi-pass or regenerative amplifier, the amplifier bandwidth Δ λ A measurement reported in the publication is stated, and again the transform-limited pulse duration δ t A supported by that value is calculated. We then show the reported pulsewidth measurement δ t M E A S , allowing one to ascertain, in the reported stretcher-compressor CPA systems, how closely the obtained pulsewidth after compression is to the transform-limited value. The transform-limited pulsewidth for Yb:YAG at 80 K is about 1.04 ps (bandwidth of about 1.5 nm at 80 K), a value that has not yet been closely approached. This is a consequence of gain-narrowing that takes place in multi-pass amplifiers, and particularly in regenerative amplifiers where many passes of the gain medium occur. Regenerative amplifiers can have bandwidths <0.2 nm, so the obtained output pulsewidths tend to be > about 8 ps. Imperfect compression stretches the pulses even further. A number of techniques have been used to reduce the effects of gain-narrowing and to provide a seed laser for the demonstrations listed in Table 10 with broadband pulses entering the regenerative amplifier. In order to obtain pulsewidths in the femtosecond regime, researchers have sought laser materials with a broader bandwidth at 80 K. One such material is Yb:YLF, which has a gain bandwidth of about 27 nm and is capable of producing ~100 fs pulses. Table 10 shows that sub-ps pulses have been produced by two groups [155,167]. Other materials such as Yb:GSAG [30] have been developed as well to drive obtained pulsewidths from Yb based lasers into the femtosecond regime. Yb:CaF2 has also been recently developed as a promising fs laser materials, due to a broad bandwidth that remains broad even at 80 K. At room temperature, a Yb:CaF2 laser is reported with a pulsewidth of 99 fs [111]. A cryogenic laser using the closely related material Yb:CaNaF2 laser has produced 173 fs pulses [170]. While we have not discussed a number of promising Yb based laser materials in this paper, choosing to concentrate here only on significant high average as well as peak power results at cryogenic temperatures, it is clear that Yb lasers are an active and vibrant research topic today, and that in the near future other newer laser materials will be used to advance the state-of-the-art.
Table 10. Reported Yb:YAG, Yb:YLF, and Yb:Y2O3 Cryogenic Picosecond and Femtosecond Demonstrations From 2003–2015.
YearCrystal TypeEp (mJ) ν r (Hz)Pav (W) Δ λ C (nm) Table 6 λ L (nm) δ t T L (ps) Δ λ S (nm) δ t T L S (ps) Δ λ A (nm) δ t T L A (ps) δ t M E A S (ps) P P   (W)Ref
2003Yb:YLF30 × 10−3 BC203.627.010170.097150.10150.3040.79511.64 × 109[155]
σ18 × 10−3 AC
2007Yb:YAG0.296 × 10−380 × 10224.01.510291.0381.4510.71.3311.711.725.6 × 106[158]
2007Yb:YAG0.99 × 10−320 × 10319.81.510291.0381.4510.71.3311.711.784.6 × 106[158]
2007Yb:YAG
SHG
8 × 10⁻³ BC10 × 1030.0751.510291.03817.00.0920.53.134.5217.5 × 106[159]
7.5 × 10⁻³ AC0.01951525.0
1.9 × 10⁻³
2008Yb:YAG3.7 × 10−678 × 1062871.510291.0380.43.890.35.25.50.67 × 106[160]
2009Yb:YAG3.1 × 10−678 × 1062401.510291.0380.43.890.35.28.00.39 × 106[161]
0.21.96.40.26 × 106
SHG1.8 × 10−6130515
2009Yb:YAG1.45 BC1010.21.510291.038----8.50.12 × 1012[162]
1.02 AC
2010Yb:YAG40 × 10−3 BC2 × 103801.510291.0380.246.490.1015.0-2.13 × 10⁹[163]
32 × 10−6 AC
2010Yb:YAG15.16 × 10−650 × 1067581.510291.0380.821.900.169.712.41.23 × 106[132]
SHG1.20 × 10−660515
11.80.10 × 106
2011Yb:YAG8.38 x10−650 × 1064191.510291.0380.821.900.169.712.40.68 × 106[164]
SHG4.02 x 10−6201515
12.40.32 × 106
2011Yb:YAG20 × 10−3 BC2 × 103201.510291.0380.702.220.246.514.20.915 × 109[165]
13 × 10−3 AC
2011Yb:YAG140 × 10−3 BC100101.510291.0380.552.830.354.454.820.83 × 109[166]
100 × 10−3 AC
2011Yb:YAG23 × 10−3 UC5 × 1031151.510301.0401.01.560.305.2-4.4 × 10⁹ (E)[30]
2011Yb:YAG+14.6 × 10⁻³ BC5 × 10360-1030-1.11.420.702.21.67.5 × 109[30]
Yb:GSAG12 × 10−3 AC
2012Yb:YLF10.6 × 10−310 × 10310627.010201.0382.400.652.200.710.86512.3 × 109[167]
σ
2014Yb:Y2O30.70 × 10−31 × 1030.7014.310310.109------[168]
(R)(UC)
2015Yb:YAG100 × 10−3 (UC)25025.01.510291.038------[169]
2015Yb:YAG721721.51030.51.0381.01.570.354.455.98.0 × 109[110]
Figure 47 shows a plot of the energy/pulse and repetition rate as a function of laser average power, using the values found in Table 10, for both fundamental and second-harmonic wavelengths. The energy/pulse varies from typically microjoules at the higher repetition rates (MHz) to large energy/pulse for low repetition rates. The largest energy/pulse obtained is about 1.02 J at a 10 Hz repetition rate [162]. For intermediate repetition rates in the kHz regime, some mJ of energy/pulse are obtained. The average power associated with low repetition rates and large energy/pulse tend to have average powers <20 W, while kHz repetition rates and intermediate mJ energies tend to be less than 110 W. The highest average powers tend to be associated with MHz repetition rates and lower (µJ) energies per pulse. The highest average power, 758 W, was obtained by our group, producing 15.2 µJ/pulse at a 50 MHz repetition rate [132]. The highest green ps average power obtained at cryogenic temperatures was also demonstrated by our group [164].
Figure 47. Yb:YAG, Yb:YLF, Yb:Y2O3, and Yb:YAG + Yb:GSAG compressed or direct energy/pulse at fundamental (blue) and second-harmonic (green) wavelengths, and repetition rate (pink), as a function of average power. Numerical values and references are taken from Table 10.
Applsci 06 00023 g047
Figure 48 shows the peak power obtained as a function of average power, again using data from Table 10. Fundamental and second-harmonic values are displayed. The highest peak powers are produced by YbYLF based devices and the lowest by high repetition rate, low energy/pulse lasers.
Finally, we mention that there are a number of higher energy/pulse high average power cryogenic laser demonstrations that are currently being developed. One group [139] at DESY has as its goal a 1 J/pulse, 1 kHz, 1 kW, few ps Yb:YAG cryogenic laser device that uses innovative an ASE suppressing thin disk, and utilizes 12-pass cryogenic amplifiers. This laser also employs the technique of imaging and vacuum spatial filtering to manage nonlinear effects and produce clean beam profiles, techniques that were pioneered is the earliest high-peak-power laser systems developed in connection with inertial confinement fusion [37]. We also mention the work of HiLASE [171,172], where large aperture high energy/pulse Yb:YAG cryogenically He gas cooled lasers are being developed. In [152] a 10 J/pulse, 10 Hz cryogenic amplifier is already developed, and a 100 J/pulse cryogenic amplifier is expected to be demonstrated in 2015, while in [173] a 1 J, 1 ps at 120 Hz system in development as part of the HiLASE program.
Figure 48. Yb:YAG, Yb:YLF, and Yb:YAG+Yb:GSAG compressed or direct peak power for fundamental (green) and second-harmonic (red) wavelengths, as a function of average power. Numerical values and references are taken from Table 10.
Applsci 06 00023 g048

5. Conclusions

In this paper, we have endeavored to summarize the history of cryogenic lasers, review the most important spectral, thermal, and thermo-optic properties, provide a summary of the measured parameters at cryogenic temperatures, and to provide a relatively up-to-date snapshot of the development of CW, nanosecond, picosecond, and femtosecond cryogenic laser development. Cryogenic laser development has accelerated in recent years, and we believe we have only just begun to understand all of the benefits the technology brings to the development of advanced sophisticated laser devices that address a large swath of scientific, military, and commercial applications. In various sections of this paper we have pointed out the critical need for measurements of key parameters, such as the nonlinear indices and damage thresholds at cryogenic temperatures, that can have a profound impact on the scaling of cryogenic laser devices. It is our hope that the cryogenic laser community will respond to this need in the near future. The development of HAPP lasers that have high peak and average powers while maintaining near-diffraction-limited beam characteristics, independent of average power, is now well-underway, and the promise, progress, and prospects of cryogenic lasers are very bright indeed.

Acknowledgments

The research discussed here was partially funded by the USA. National Science Foundation, under Grant # DMR-1410727.

Author Contributions

David C. Brown conceived of and wrote the manuscript, performed the numerical calculations, and designed the liquid nitrogen cryostat used for the reported absorption measurements. Sten Tornegård provided helpful guidance and discussions in preparing the manuscript as well as important references. Joseph Kolis, Colin McMillen, Cheryl Moore, Liurukawa Sanjeewa, and Christopher Hancock supervised growing the hydrothermal crystals, polished them, obtained the absorption spectroscopy, and built and tested the liquid nitrogen cryostat. Brown dedicates this paper to the memory of his very good friend, FarresP.Mattar, a brilliant polymath and wonderful human being who always understood the meaning of le joie de vivre.

Conflicts of Interest

The authors declare no conflict of interest.

References

  1. Lacovara, P.; Choi, H.K.; Wang, C.A.; Aggarwal, R.L.; Fan, T.Y. Room-temperature diode-pumped Yb:YAG laser. Opt. Lett. 1991, 16, 1089–1091. [Google Scholar] [CrossRef] [PubMed]
  2. Brown, D.C. The promise of cryogenic lasers. IEEE J. Sel. Top. Quantum Electron. 2005, 11, 587–599. [Google Scholar] [CrossRef]
  3. Fan, T.Y.; Ripin, D.J.; Aggarwal, R.L.; Ochoa, J.R.; Chann, B.; Tilleman, M.; Spitzberg, J. Cryogenic Yb3+-doped solid-state lasers, Invited Paper. IEEE J. Sel. Top. Quantum Electron. 2007, 13, 448–459. [Google Scholar] [CrossRef]
  4. Wall, K.F.; Moulton, P.F. High power operation of cryogenic Yb:YAG. In Proceedings of the SPIE, San Jose, CA, USA, 23 January 2007.
  5. Keyes, R.J.; Quist, T.M. Injection luminescent pumping of CaF2:U3+ with GaAs diode lasers. Appl. Phys. Lett. 1974, 4, 50–52. [Google Scholar] [CrossRef]
  6. Moulton, P.F. Spectroscopic and laser characteristics of Ti:Al2O3. J. Opt. Soc. Am. B 1986, 3, 125–133. [Google Scholar] [CrossRef]
  7. Moulton, P.F. Efficient cw optically pumped Ni:MgF2 laser. Opt. Lett. 1978, 3, 164–166. [Google Scholar] [CrossRef] [PubMed]
  8. Moulton, P.F. Broadly tunable cw operation of Ni:MgF2 and Co:MgF2 lasers. Appl. Phys. Lett. 1979, 35, 838–840. [Google Scholar] [CrossRef]
  9. Moulton, P.F. Pulse-pumped operation of divalent transition-metal lasers. IEEE J. Quantum Electron. 1982, 18, 1185–1188. [Google Scholar] [CrossRef]
  10. Moulton, P.F. An investigation of the Co:MgF2 system. IEEE J. Quantum Electron. 1985, 21, 1582–1595. [Google Scholar] [CrossRef]
  11. Schulz, P.A. Liquid-nitrogen-cooled Ti:Al2O3 laser. IEEE J. Quantum Electron. 1991, 27, 1039–1047. [Google Scholar] [CrossRef]
  12. Johnson, J.F.; Dietz, R.E.; Guggenheim, H.J. Optical maser oscillation from Ni2+ in MgF2 involving simultaneous emission of phonons. Phys. Rev. Lett. 1963, 11, 318–320. [Google Scholar] [CrossRef]
  13. Doehler, J.; Solin, S.A. A compact efficient liquid nitrogen system for cooling solid state lasers: Application to YAG:Nd3+ and ABC-YAG. Rev. Sci. Instr. 1972, 43, 1189–1193. [Google Scholar] [CrossRef]
  14. Beck, R.; Gürs, K. Ho laser with 50-W output and 6.5% slope efficiency. J. Appl. Phys. 1975, 48, 5224–5225. [Google Scholar] [CrossRef]
  15. Kaminskii, A.A. Laser Crystals; Springer-Verlag: Berlin, Germany; Heidelberg, Germany; New York, NY, USA, 1990. [Google Scholar]
  16. Kaminskii, A.A. Crystalline Lasers: Physical Processes and Operating Schemes; CRC Press: Boca Raton, FL, USA, 1996. [Google Scholar]
  17. Bowess, C. Liquid Nitrogen Cooled Ruby Laser. US Patent 3339150, 29 August 1967. [Google Scholar]
  18. McMahon, D.H. Cooling System for Laser Media. US Patent 3676798, 11 July 1972. [Google Scholar]
  19. Brown, D.C.; Nelson, R. Ultra-high-average-power diode-pumped Nd:YAG and Yb:YAG lasers. BMDO Phase I Small Business Innovation Research Contract # N00P14-97-P-2064 Final Report. 1998. [Google Scholar]
  20. Brown, D.C. Ultrahigh-average-power diode-pumped Nd:YAG and Yb:YAG lasers. IEEE J. Quantum Electron. 1997, 33, 863–873. [Google Scholar] [CrossRef]
  21. Brown, D.C. Nonlinear Thermal Distortion in YAG Rod Amplifiers. IEEE J. Quantum Electron. 1998, 33, 2383–2392. [Google Scholar] [CrossRef]
  22. Brown, D.C. Nonlinear Thermal and Stress Effects and Scaling Behavior of YAG Slab Amplifiers. IEEE J. Quantum Electron. 1998, 33, 2393–2402. [Google Scholar] [CrossRef]
  23. Fan, T.Y.; Daneu, J.J. Thermal coefficients of the optical path length and refractive index in YAG. Appl. Opt. 1998, 37, 1735–1637. [Google Scholar] [CrossRef]
  24. Fan, T.Y.; Crow, T.; Hoden, B. Cooled Yb:YAG for high power solid-state lasers. In Airborne Laser Advanced Technology (Proceedings of SPIE); SPIE Press: Bellingham, MA, USA, 1998; Volume 3381, pp. 200–215. [Google Scholar]
  25. Glur, H.; Lavi, R.; Grat, T. Reductions of thermally induced lenses in Nd; YAG with low temperatures. IEEE J. Quantum Electron. 2004, 40, 499–503. [Google Scholar] [CrossRef]
  26. Wynne, R.; Daneu, J.J.; Fan, T.Y. Thermal coefficients of the expansion and refractive index in YAG. Appl. Opt. 1999, 38, 3282–3284. [Google Scholar] [CrossRef] [PubMed]
  27. Brown, D.C.; Cone, R.L.; Sun, Y.; Equall, R.W. Yb:YAG absorption at ambient and cryogenic temperatures. IEEE J. Sel. Top. Quantum Electron. 2005, 11, 604–612. [Google Scholar] [CrossRef]
  28. Brown, D.C.; Bruno, T.M.; Vitali, V. Saturated Absorption Effects in CW-Pumped Solid-State Lasers. IEEE J. Quantum Electron. 2010, 40, 1717–1725. [Google Scholar] [CrossRef]
  29. Aggarwal, R.L.; Ripin, D.J.; Ochoa, J.R.; Fan, T.Y. Measurement of thermo-optic properties of Y3Al5O12, Lu3Al5O12, YAlO3, LiYF4, BaY2F8, KGd(WO4)2, and KY(WO4)2 laser crystals in the 80–300 K temperature range. J. Appl. Phys. 2005, 98, 1–14. [Google Scholar]
  30. Rand, D.; Miller, D.; Ripin, D.J.; Fan, T.Y. Cryogenic Yb3+-doped materials for pulsed solid-state laser applications. Opt. Mater. Express 2011, 1, 434–450. [Google Scholar] [CrossRef]
  31. Backus, S.; Durfee, C.G., III; Mourou, G.; Kapteyn, H.; Murnane, M.M. 0.2-TW laser system at 1 Hz. Opt. Lett. 1997, 22, 1256–1258. [Google Scholar] [CrossRef] [PubMed]
  32. Backus, S.; Durfee, C.G., III; Murnane, M.M.; Kapteyn, H. High power ultrafast lasers. Rev. Sci. Instrum. 1998, 69, 1207–1223. [Google Scholar] [CrossRef]
  33. Matsushima, I.; Yashiro, H.; Tomie, T. A 37% efficiency, kilohertz repetition rate cryogenically cooled Ti:Sapphire regenerative amplifier. Jpn. J. Appl. Phys. 2005, 25, L823–L826. [Google Scholar] [CrossRef]
  34. Dantan, A.; Laurat, J.; Ourjoumtsev, A.; Tualle-Brouri, R.; Grangier, P. Femtosecond Ti:Sapphire cryogenic amplifier with high gain and MHz repetition rate. Opt. Express 2007, 15, 8864–8870. [Google Scholar] [CrossRef] [PubMed]
  35. Planchon, T.A.; Amir, W.; Childress, C.; Squier, J.A.; Durfee, C.G. Measurement of pump-induced transient lensing in a cryogenically-cooled high average power Ti:Sapphire amplifier. Opt. Express 2008, 16, 18557–18564. [Google Scholar] [CrossRef] [PubMed]
  36. Maiman, T.H. Stimulated Optical Radiation in Ruby. Nature 1960, 187, 493–494. [Google Scholar] [CrossRef]
  37. Brown, D.C. High-Peak-Power Nd:Glass Laser Systems. In Springer Series in Optical Sciences; Springer-Verlag: Berlin, Germany; Heidelberg, Germany, 1981. [Google Scholar]
  38. Brown, D.C.; Vitali, V.A. Yb:YAG kinetics model including saturation and power conservation. IEEE J. Quantum Electron. 2011, 47, 3–12. [Google Scholar] [CrossRef]
  39. Kittel, C. Introduction to Solid-State Physics, 8th ed.; John Wiley and Sons, Inc.: Hoboken, NJ, USA, 2005. [Google Scholar]
  40. Zhou, Y.; Xiang, H.; Feng, Z. Theoretical investigation on mechanical and thermal properties of a promising thermal barrier material: Yb3Al5O12. J. Mater. Sci. Technol. 2014, 30, 631–638. [Google Scholar] [CrossRef]
  41. Jiji, L.M. Heat Conduction, 3rd ed.; Springer-Verlag: Berlin, Germany; Heidelberg, Germany; New York, NY, USA, 2009. [Google Scholar]
  42. Klemens, P.G. Thermal resistance due to point defects at high temperature. Phys. Rev. 1960, 119, 507–509. [Google Scholar] [CrossRef]
  43. McMillen, C.D.; Thompson, D.; Tritt, T.; Kolis, J.W. Hydrothermal single crystal growth of Lu2O3 and lanthanide doped Lu2O3. Cryst. Growth Des. 2011, 11, 4386–4391. [Google Scholar] [CrossRef]
  44. Greibner, U.; Petrov, V.; Petermann, K.; Peters, V. Passively mode-locked Yb:Lu2O3 laser. Opt. Express 2004, 12, 3125–3130. [Google Scholar] [CrossRef]
  45. Slack, G.A.; Oliver, D.W. Thermal conductivity of garnets and phonon scattering by rare-earth ions. Phys. Rev. 1971, 4, 592–609. [Google Scholar] [CrossRef]
  46. Holland, M.G. Thermal conductivity of several optical maser materials. J. Appl. Phys. 1962, 33, 2910–2911. [Google Scholar] [CrossRef]
  47. Padture, N.P.; Klemens, P.G. Low thermal conductivity in garnets. J. Am. Ceram. Soc. 1997, 80, 1018–1020. [Google Scholar] [CrossRef]
  48. Klopp, P. New Yb3+-Doped Laser Materials and Their Application in Continuous-Wave and Mode-Locked Lasers. Ph.D. Thesis, University of Berlin, Berlin, Germany, 2006. [Google Scholar]
  49. Fredrich-Thornton, S.T. Nonlinear Losses in Single Crystalline and Ceramic Yb:YAG Thin Disk Lasers. Ph.D. Thesis, University of Hamburg, Hamburg, Germany, 2010. [Google Scholar]
  50. Beil, K.; Saraceno, C.J.; Schriber, C.; Emaury, F.; Heckl, O.H.; Baer, C.R.E.; Golling, M.; Südmeyer, T.; Keller, U.; Kränkel, C.; et al. Yb-doped mixed sesquioxides for ultrashort pulse generation in the thin disk laser setup. Appl. Phys. B Lasers Opt. 2013, 113, 13–18. [Google Scholar] [CrossRef]
  51. Koopman, P.; Lamrini, S.; Scholle, K.; Fuhrberg, P.; Petermann, K.; Huber, G. High Power Diode Pumped 1 µm laser operation of Tm:Lu2O3. In Proceedings of the CLEO/QELS Conference 2010, Optical Society of America Paper CMDD1, San Jose, CA, USA, 16–21 May 2010.
  52. Nikogosyan, D.N. Properties of Optical and Laser-Related Materials: A Handbook; John Wiley and Sons, Inc.: Hoboken, NJ, USA, 1998. [Google Scholar]
  53. Garrec, B.L.; Cardinali, V.; Bourdet, G. Thermo-optical measurements of ytterbium doped ceramics (Sc2O3, Y2O3, Lu2O3, YAG) and crystals (YAG, CaF2) at cryogenic temperatures. In High-Power, High-Energy, and High-Intensity Laser Technology; and Research Using Extreme Light; Entering New Frontiers with Petawatt-Class Lasers Proceedings of SPIE; Hein, J., Korn, G., Silva, L.O., Eds.; SPIE Press: Bellingham, WA, USA, 2013. [Google Scholar] [CrossRef]
  54. Popov, P.A.; Federov, P.P.; Kuznetsov, V.A.; Konyushkin, V.A.; Osiko, V.V.; Basiev, T.T. Thermal conductivity of single crystals of Ca1-xYbxF2+x solid solutions. Dokl. Phys. 2008, 53, 198–200. [Google Scholar] [CrossRef]
  55. Toulokian, Y.S.; Kirby, R.K.; Taylor, R.E.; Lee, T.Y.R. Thermophysical Properties of Matter; Plenum Press: New York, NY, USA, and London, UK, 1977. [Google Scholar]
  56. Linde, D.R. (Ed.) Handbook of Chemistry and Physics, 76th ed.; CRC Press: Boca Raton, FL, USA, 1995.
  57. Powell, R.L.; Blanpied, W.A. Thermal conductivity of metals and alloys at low temperature. In National Bureau of Standards Circular 556; U.S. Government Printing Office: Washington, D.C., USA, 1954. [Google Scholar]
  58. Yasuhara, R.; Furuse, H.; Iwamoto, A.; Kawanaka, J.; Yagatitani, T. Evaluation of thermo-optic characteristics of cryogenically cooled Yb:YAG ceramics. Opt. Express 2012, 20, 29532–29539. [Google Scholar] [CrossRef] [PubMed]
  59. Cardinalli, V.; Marmois, E.; Garrec, B.L.; Bourdet, G. Determination of the thermo-optic coefficient dn/dT of ytterbium doped ceramics (Sc2O3, Y2O3, Lu2O3, YAG) and crystals (YAG, CaF2) and neodymium doped phosphate glass at cryogenic temperature. Opt. Mater. 2012, 34, 990–994. [Google Scholar] [CrossRef]
  60. Reeber, R.R.; Wang, K. Lattice parameters and thermal expansion of important semiconductors and their substrates. Mater. Res. Soc. Symp. 2000, 622, T635.1–T635.6. [Google Scholar] [CrossRef]
  61. Senyshyn, A.; Vasylechko, L. Low temperature crystal structure behavior of complex yttrium aluminum oxides YAlO3 and Y3Al5O12. Acta Phys. Pol. A 2013, 124, 329–335. [Google Scholar] [CrossRef]
  62. Munro, R.G. Analytical representations of elastic moduli data with simultaneous dependence on temperature and porosity. J. Res. Natl. Inst. Stand. Technol. 2004, 109, 497–503. [Google Scholar] [CrossRef]
  63. Krupke, W.F.; Shinn, M.D.; Marion, J.E.; Caird, J.A.; Stokowski, S.E. Spectroscopic, optical, and thermomechnical properties of neodymium- and chromium-doped gadolinium scandium gallium garnet. J. Opt. Soc. Am. B 1986, 3, 102–114. [Google Scholar] [CrossRef]
  64. Boyd, R.W.; Lukishova, S.G. Topics in Applied Physics. In Self-Focusing: Past and Present; Springer-Verlag: New York, NY, USA, 2009. [Google Scholar]
  65. Soures, J.M. Selected Papers on High Power Lasers; SPIE Press: Bellingham, MA, USA, 1991. [Google Scholar]
  66. Strickland, D.; Mourou, G. Compression of amplified chirped optical pulses. Opt. Commun. 1985, 56, 219–221. [Google Scholar] [CrossRef]
  67. Boyd, R.W. Nonlinear Optics, 2nd ed.; Academic Press: London, UK; San Diego, CA, USA, 2003. [Google Scholar]
  68. DeSalvo, R.; Said, A.A.; Hagan, D.J.; van Stryland, E.W.; Sheik-Bahae, M. Infrared to ultraviolet measurements of two-photon absorption and n2 in wide bandgap solids. IEE J. Quantum Electron. 1996, 32, 1324–1333. [Google Scholar] [CrossRef]
  69. Major, A.; Yoshino, F.; Nikolakakos, I.; Aitchison, J.S.; Smith, P.W.E. Dispersion of the nonlinear index in sapphire. Opt. Lett. 2004, 29, 602–604. [Google Scholar] [CrossRef] [PubMed]
  70. Diels, J.C. Ultrashort Laser Pulse Phenomena, 2nd ed.; Elsevier, Inc.: Amsterdam, The Netherlands, 2006. [Google Scholar]
  71. Milam, D. Review and assessment of measured values of the nonlinear refractive-index coefficient of fused silica. Appl. Opt. 1998, 37, 546–550. [Google Scholar] [CrossRef] [PubMed]
  72. Senatsky, Y.; Shirahawa, A.; Sato, Y.; Hagiwara, J.; Lu, J.; Ueda, K.; Yagi, H.; Yanagitani, T. Nonlinear refractive index of ceramic laser media and perspectives on their usage in a high-power laser driver. Laser Phys. Lett. 2004, 1, 500–506. [Google Scholar] [CrossRef]
  73. Sanghera, J.; Kim, W.; Villalobos, G.; Shaw, B.; Baker, C.; Frantz, J.; Sadowski, B.; Aggarwal, I. Ceramic Laser Materials. Materials 2012, 5, 258–277. [Google Scholar] [CrossRef]
  74. Milam, D. Nonlinear refractive index of fluoride crystals. Appl. Phys. Lett. 1977, 32, 822–825. [Google Scholar] [CrossRef]
  75. Lagatsky, A.A.; Sarmani, A.R.; Brown, C.T.A.; Sibbett, W.; Kisel, V.E.; Selivanov, A.G.; Denisov, I.A.; Troshlin, A.E.; Yumashev, K.V.; Kuleshov, N.V.; et al. Yb3+-doped YVO4 crystal for efficient kerr-lens mode locking in solid-state lasers. Opt. Lett. 2005, 30, 3234–3236. [Google Scholar] [CrossRef] [PubMed]
  76. Vodchits, A.I.; Orlovich, V.A.; Apanasevich, P.A. Nonlinear refractive index of vanadate crystals in the near IR region. J. Appl. Spectrosc. 2012, 78, 918–921. [Google Scholar] [CrossRef]
  77. Major, A.; Nikolakakos, I.; Aitchison, J.S.; Ferguson, A.I.; Langford, N.; Smith, P.W.E. Characterization of the nonlinear refractive index of the laser crystal Yb:KGd(WO4)2. Appl. Phys. B Lasers Opt. 2003, 77, 433–436. [Google Scholar] [CrossRef]
  78. Geints, Y.E.; Kabanov, A.M.; Zemlyanov, A.A.; Bykova, E.E.; Bukin, O.A.; Golik, S.S. Kerr-driven nonlinear refractive index of air at 800 and 400 nm measured through femtosecond laser pulse filimentation. Appl. Phys. Lett. 2011, 99, 1–3. [Google Scholar] [CrossRef]
  79. DeFranzo, A.C.; Pazol, B.G. Index of refraction measurement of sapphire at low temperatures and visible wavelengths. Appl. Opt. 1993, 32, 2224–2234. [Google Scholar] [CrossRef] [PubMed]
  80. Uemura, S.; Torizuka, K. Development of a diode-pumped kerr-lens mode-locked Cr:LiSAF laser. IEEE J. Quantum Electron. 2003, 39, 68–73. [Google Scholar] [CrossRef]
  81. Peterson, R.D.; Pham, A.T.; Jensson, H.P.; Cassanho, A.; Castillo, V. Thermo-optical comparison of LiSAF, LiCAF, and LiSGaF. In Proceedings of the Advanced Solid-State Laser Conference, Boston, MA, USA, 31 January 1999.
  82. Payne, S.A.; Smith, L.K.; Beach, R.L.; Chai, B.H.T.; Tassano, J.K.; DeLoach, L.D.; Kway, W.L.; Solarz, R.W.; Krupke, W.F. Properties of Cr:LiSrAlF6 crystals for laser operation. Appl. Opt. 1994, 33, 5526–5536. [Google Scholar] [CrossRef] [PubMed]
  83. Woods, B.W.; Payne, S.A.; Marion, J.E.; Hughes, R.S.; Davis, L.E. Thermomechanical and thermo-optical properties of the LiCaAlF6:Cr3+ laser material. J. Opt. Soc. Am. B 1991, 8, 970–977. [Google Scholar] [CrossRef]
  84. Ileri, B. Lattice Matching of Epitaxial Rare-Earth-Doped Dielectric PLD-Films. Ph.D. Thesis, University of Hamburg, Hamburg, Germany, 2007. [Google Scholar]
  85. Weber, M.J. Handbook of Optical Materials: Supplement 2; CRC Press: Boca Raton, FL, USA, 2003. [Google Scholar]
  86. Morrison, C.A.; Leavitt, R.P. Handbook on the Physics and Chemistry of Rare Earths; North-Holland: Amsterdam, The Netherlands, 1982. [Google Scholar]
  87. Barnes, N.P.; Gettemy, D.J. Temperature variation of the refractive indices of yttrium lithium flouride. J. Opt. Soc. Am. 1980, 70, 1244–1247. [Google Scholar] [CrossRef]
  88. Zelmon, D.E.; Lee, J.J.; Currin, K.M.; Northridge, J.M.; Perlov, D. Revisiting the optical properties of Nd doped yttrium orthovanadates. Appl. Opt. 2010, 49, 644–647. [Google Scholar] [CrossRef] [PubMed]
  89. Zelmon, D.E.; Northridge, J.M.; Haynes, N.D.; Perlov, D.; Petermann, K. Temperature-dependent Sellmeier equations for rare-earth sesquioxides. Appl. Opt. 2013, 52, 3824–3828. [Google Scholar] [CrossRef] [PubMed]
  90. Paunescu, G. Ytterbium-Doped Femtosecond Solid-State Lasers. Ph.D. Thesis, Friedrich-Schiller University, Jena, Germany, 2006. [Google Scholar]
  91. Singh, J. Optical Properties of Condensed Matter and Applications; John Wiley and Sons, Ltd.: Hoboken, NJ, USA, 2006. [Google Scholar]
  92. Malitson, I.H. Interspeciman comparison of the refractive index of fused silica. JOSA 1965, 55, 1205–1209. [Google Scholar] [CrossRef]
  93. Koechner, W. Solid-State Laser Engineering, 5th ed.; Springer Series in Optical Sciences; Springer-Verlag: Berlin, Germany; Heidelberg, Germany, 1999. [Google Scholar]
  94. Wood, R.M. Laser-Induced Damage of Optical Materials; Series in Optics and Optoelectronics; Institute of Physics Publishing: Bristol, UK, 2003. [Google Scholar]
  95. Stuart, B.C.; Feit, M.D.; Herman, S.; Rubenchik, A.M.; Shore, B.W.; Perry, M.D. Optical ablation by high-power short-pulse lasers. J. Opt. Soc. Am. B 1996, 13, 459–468. [Google Scholar] [CrossRef]
  96. Wang, H.; Zhang, W.; He, H. Laser-induced damage behaviors of antireflective coatings at cryogenic condition. Appl. Opt. 2012, 51, 8687–8692. [Google Scholar] [CrossRef] [PubMed]
  97. Yang, L.; Yuan, H.D.; Deng, H.X.; Xiang, X.; Zheng, W.G.; He, S.B.; Jiang, Y.; Lv, H.B.; Ye, L.; Wang, H.J.; et al. Influence of ambient temperature on nanosecond and picosecond laser-induced bulk damage of fused silica. Adv. Cond. Matter Phys. 2014, 2014, 1–7. [Google Scholar] [CrossRef]
  98. Mikami, K.; Motokoshi, S.; Fujita, M.; Jitsuno, T.; Kawanaka, J.; Yasuhara, R. Temperature dependence of laser-induced damage threshold in silica glass. J. Phys. Conf. Ser. 2010, 244, 1–7. [Google Scholar] [CrossRef]
  99. Mikami, K.; Motokoshi, S.; Somekawa, T.; Jitsuno, T.; Fujita, M.; Tanake, K.A. Temperature dependence of laser-induced damage threshold of optical coatings at different pulsewidths. Opt. Express 2013, 21, 28719–28728. [Google Scholar] [CrossRef] [PubMed]
  100. Brown, D.C.; Tornegård, S.; Kolis, J. Cryogenic nanosecond and picosecond high average and peak power (HAPP) pump lasers for ultrafast applications, Paper Submitted to High Power Laser Sci. and Engin. 2015. [Google Scholar]
  101. Eggleston, J.M.; DeShazer, L.G.; Kangas, K.W. Characteristics and kinetics of Ti:Sapphire oscillators. IEEE J. Quantum Electron. 1988, 24, 1009–1015. [Google Scholar] [CrossRef]
  102. Chase, L.L.; Payne, S.A.; Smith, L.K.; Kway, W.L.; Newkirk, H.W.; Chai, B.H.T.; Long, M. Laser performance and spectroscopy of Cr3+ in LiCaAlF6 and LiSrAlF6. In Proceedings of the Advanced Solid-State Lasers Conference, Cape Cod, MA, USA, 1 May 1989.
  103. Ricaud, S.; Papadopoulos, D.N.; Camy, P.; Moncorge, R.; Courjaud, A.; Mottay, E.; Georges, P.; Druon, F. Highly efficient, high-power, broadly tunable cryogenically cooled and diode-pumped Yb:CaF2. Opt. Lett. 2010, 35, 3757–3759. [Google Scholar] [CrossRef] [PubMed]
  104. Brown, D.C.; McMillen, C.D.; Moore, C.; Kolis, J.W.; Envid, V. Spectral properties of hydrothermally-grown Nd:LuAG, Yb:LuAG, and Yb:Lu2O3 laser materials. J. Lumin. 2014, 148, 26–32. [Google Scholar] [CrossRef]
  105. Petermann, K.; Huber, G.; Fornasiero, L.; Kuch, S.; Mix, E.; Peters, V.; Basun, S.A. Rare-earth-doped sesquioxides. J. Lumin. 2010, 87–89, 973–975. [Google Scholar] [CrossRef]
  106. Körner, J.; Jambunathan, V.; Hein, J.; Siefert, R.; Loeser, M.; Siebold, M.; Schramm, U.; Sikocinshi, P.; Lucianetti, A.; Mocek, T.; et al. Spectroscopic characterization of Yb3+-doped laser materials at cryogenic temperatures. Appl. Phys. B Lasers Opt. 2014, 116, 75–81. [Google Scholar] [CrossRef]
  107. Peters, V. Growth and Spectroscopy of Ytterbium-Doped Sesquioxides. Ph.D. Thesis, University of Hamburg, Hamburg, Germany, 2001. [Google Scholar]
  108. Zapata, L.; Ripin, D.J.; Fan, T.Y. Power scaling of cryogenic Yb:LiYF4 lasers. Opt. Lett. 2010, 35, 1854–1856. [Google Scholar] [CrossRef] [PubMed]
  109. Kawanaka, J.; Yamakawa, K.; Niskioka, H.; Ueda, K. Inproved high-field laser characteristics of a diode-pumped Yb:LiYF4 crystal at low temperature. Opt. Express 2002, 10, 455–460. [Google Scholar] [CrossRef] [PubMed]
  110. Rand, D.A.; Shaw, S.E.J.; Ochoa, J.R.; Ripin, D.J.; Taylor, A.; Fan, T.Y.; Martin, H.; Hawes, S.; Zhang, J.; Sarkisyan, S.; et al. Picosecond pulses from a cryogenically cooled, composite amplifier using Yb:YAG and Yb:GSAG. Opt. Lett. 2011, 36, 340–342. [Google Scholar] [CrossRef] [PubMed]
  111. Friebel, F.; Druon, F.; Boudeile, J.; Papadopoulus, D.N.; Hanna, M.; Georges, P.; Camy, P.; Doualon, J.L.; Benayad, A.; Moncorgé, R.; et al. Diode-pumped 99 fs Yb:CaF2 oscillator. Opt. Lett. 2009, 34, 1474–1476. [Google Scholar] [CrossRef] [PubMed]
  112. McMillen, C.; Kolis, J.; Sanjeewa, D.; Moore, C.; Brown, D.C. Hydrothermal growth and spectroscopy of doped Lu2O3 single crystals. In Paper presented at 20th American Conference on Crystal Growth and Epitaxy, Nonlinear Optical and Host Materials Session 4, Big Sky, MT, USA, 5 August 2015.
  113. Heckl, O.H.; Peters, R.; Krankel, C.; Baer, C.R.E.; Saraceno, C.J.; Sudmeyer, T.; Petermann, K.; Keller, U.; Huber, G. Continuous-wave Yb-doped sesquioxide this disk laser with up to 300 W output and 74% efficiency. In Ultrafast Lasers I Session, AMD1, Advanced Solid-State Photonics Conference, San Diego, CA, USA, 31 January–3 February 2010.
  114. Peters, R.; Krankel, C.; Petermann, K.; Huber, G. Broadly tunable high-power Yb:Lu2O3 thin disk laser with 80% slope efficiency. Opt. Express 2007, 15, 7075–7082. [Google Scholar] [CrossRef] [PubMed]
  115. Mun, J.H.; Jouini, A.; Novoselov, A.; Yoshikawa, A.; Kasamoto, T.; Ohta, H.; Shibata, H.; Isshiki, M.; Waseda, Y.; Boulon, G.; et al. Thermal and optical properties of Yb3+-doped Y2O3 single crystal grown by the micro-pulling-down method. Jpn. J. Appl. Phys. 2006, 45, 5885–5888. [Google Scholar] [CrossRef]
  116. McMillen, C.D.; Kolis, J.W. Hydrothermal single crystal growth of Sc2O3 and lanthanide-doped Sc2O3. J. Cryst. Growth 2008, 310, 1939–1942. [Google Scholar] [CrossRef]
  117. McMillen, C.D.; Kolis, J.W. Bulk single crystal growth from hydrothermal solutions. Philos. Mag. 2012, 92, 2686–2711. [Google Scholar] [CrossRef]
  118. McMillen, C.; Mann, M.; Fan, J.; Zhu, L.; Kolis, J.W. Revisiting the hydrothermal growth of YAG. J. Cryst. Growth 2012, 356, 58–64. [Google Scholar] [CrossRef]
  119. Moore, C.A.; Brown, D.C.; Sanjeewa, L.D.; McMillen, C.D.; Kolis, J.W. Yb:Lu2O3 hydrothermally-grown single-crystal and ceramic absorption spectra obtained between 298 and 80 K. J. Lumin. accepted for publication. 2015. [Google Scholar]
  120. Brown, D.C.; Kowalewski, K.; Envid, V.; Zembeck, J.; Kolis, J.W.; McMillen, C.D.; Geisber, H. Advanced smart multi-functional laser crystals for next generation solid-state lasers. In Technology For Defense and Security VIII (Proceedings of SPIE); Dubinskii, M., Post, S., Eds.; SPIE Press: Bellingham, MA, USA, 2014. [Google Scholar] [CrossRef]
  121. Sträβer, A.; Ostermeyer, M. Improving the brightness of side pumped power amplifiers by using core doped ceramic rods. Opt. Express 2006, 14, 6687–6693. [Google Scholar] [CrossRef]
  122. Lucianetti, A.; Weber, R.; Hodel, W.; Weber, H.P.; Papashvili, A.; Konyushkin, V.A.; Basiev, T.T. Beam-quality improvement pf a passively Q-switched Nd:YAG laser with a core-doped rod. Appl. Opt. 1999, 38, 1777–1783. [Google Scholar] [CrossRef] [PubMed]
  123. Tsunekane, M.; Taira, T. Diode edge-pumped, composite ceramic Nd:YAG/Sm:YAG microchip lasers. In Proceedings of the Frontiers in Optics 2010, Rochester, NY, USA, 2010.
  124. Bowman, S.R.; O’Connor, S.; Condon, N.J. Diode pumped yellow dysprosium laser. Opt. Express 2012, 20, 12906–12911. [Google Scholar] [CrossRef] [PubMed]
  125. Yagi, H.; Bisson, J.F.; Ueda, K.; Yanagitani, T. Y3Al5O12 ceramic absorbers for the suppression of parasitic oscillations in high-power Nd:YAG lasers. J. Lumin. 2006, 121, 88–94. [Google Scholar] [CrossRef]
  126. Ripin, D.J.; Ochoa, J.R.; Aggarwal, R.L.; Fan, T.Y. 165-W cryogenically cooled Yb:YAG laser. Opt. Lett. 2004, 29, 2154–2156. [Google Scholar] [CrossRef] [PubMed]
  127. Ripin, D.J.; Ochoa, J.R.; Aggarwal, R.L.; Fan, T.Y. 300-W cryogenically cooled Yb:YAG laser. IEEE J. Quantum Electron. 2005, 41, 1274–1277. [Google Scholar] [CrossRef]
  128. Tokita, S.; Kawanaka, J.; Fujita, M.; Kawashima, T.; Izawa, Y. Sapphire-conductive end-cooling of high power cryogenic Yb:YAG lasers. Appl. Phys. B Lasers Opt. 2005, 80, 635–638. [Google Scholar] [CrossRef]
  129. Brown, D.C.; Singley, J.M.; Yager, E.; Kuper, J.W.; Lotito, B.J.; Bennett, L.L. Innovative high-power CW Yb:YAG laser. In Proceedings of SPIE 6552, Laser Source Technology for Defense and Security III, Orlando, FL, USA, 9 April 2007. [CrossRef]
  130. Brown, D.C.; Singley, J.M.; Yager, E.; Kowalewski, K.; Guelzow, J.; Kuper, J.W. Kilowatt class high-power CW Yb:YAG laser. In Proceedings of SPIE 6952, Laser Source Technology for Defense and Security IV, Orlando, FL, USA, 16 March 2008. [CrossRef]
  131. Furuse, H.; Kawanake, J.; Takeshita, K.; Miyanaga, N.; Saika, T.; Imasaki, K. Total-reflection active-mirror laser with cryogenic Yb:YAG ceramics. Opt. Lett. 2009, 34, 3439–3441. [Google Scholar] [CrossRef] [PubMed]
  132. Brown, D.C.; Singley, J.M.; Kowalewski, K.; Guelzow, J.; Vitali, V. High sustained average power cw and ultrafast Yb:YAG near-diffraction-limited cryogenic solid-state laser. Opt. Express 2010, 18, 24770–24792. [Google Scholar] [CrossRef] [PubMed]
  133. Furuse, H.; Kawanaka, J.; Miyanga, N.; Saiki, T.; Imasaki, K.; Fujita, M.; Takeshita, K.; Ishii, S.; Izawa, Y. Zig-zag active-mirror laser with cryogenic Yb3+:YAG/YAG composite ceramics. Opt. Express 2011, 19, 2448–2455. [Google Scholar] [CrossRef] [PubMed]
  134. Ricaud, S.; Papapdopoulos, D.N.; Pelligrina, A.; Balembois, F.; Georges, P.; Courjaud, A.; Camy, P.; Doualan, J.L.; Moncorgé, R.; Druon, F. High-power diode-pumped cryogenically cooled Yb:CaF2 laser with extremely low quantum defect. Opt. Lett. 2011, 36, 1602–1604. [Google Scholar] [CrossRef] [PubMed]
  135. Feve, J.P.M.; Shortoff, K.E.; Bohn, M.J.; Brasseur, J.K. High average power diamond Raman laser. Opt. Express 2011, 19, 913–922. [Google Scholar] [CrossRef] [PubMed]
  136. Vretenar, N.; Newell, T.C.; Carson, T.; Lucas, T.; Latham, W.P.; Bostanci, H.; Lindauer, J.J.; Saarloos, B.A.; Rini, D.P. Cryogenic ceramic 277 watt Yb:YAG thin-disk laser. Opt. Eng. 2012. [Google Scholar] [CrossRef]
  137. Ganija, M.; Ottaway, D.; Veitch, P.; Munch, J. Cryogenic, high power, near diffraction limited, Yb:YAG slab laser. Opt. Express 2013, 21, 6973–6978. [Google Scholar] [CrossRef] [PubMed]
  138. Fan, T.Y.; Ripin, D.J.; Hybl, J.D.; Gopinath, J.T.; Goyal, A.K.; Rand, D.A.; Augst, S.J.; Ochoa, J.R. Cryogenically Cooled Solid-State Lasers. Recent Developments and Future Prospects; MIT Lincoln Laboratory Internal Presentation: Lexington, MA, USA, 2010. [Google Scholar]
  139. Kärtner, F.X. Laser Technology for Compact X-ray Sources. Doha CLS-Workshop Presentation. 2014. [Google Scholar]
  140. Mackenzie, J.I.; Bailey, W.O.S.; Kim, J.W.; Pearson, L.; Shen, D.Y.; Yang, Y.; Clarkson, W.A. Tm:fiber laser in-band pumping a cryogenically-cooled Ho:YAG laser. In Solid State Lasers XVIII: Technology and Devices (Proceedings of SPIE); Clarkson, W.A., Hodges, N., Shori, R.K., Eds.; Bellingham, MA, USA, 2009. [Google Scholar] [CrossRef]
  141. Ter-Gabrielyan, N.; Merkle, L.D.; Newburgh, G.A.; Dubinskii, M. Resonantly-pumped Er3+:Y2O3 ceramic laser for remote CO2 monitoring. Laser Phys. 2009, 19, 867–869. [Google Scholar] [CrossRef]
  142. Sunamyan, T.; Kanskar, M.; Xiao, Y.; Kedlaya, D.; Dubinskii, M. High power diode-pumped 2.7-µm Er3+:Y2O3 laser with nearly quantum defect-limited efficiency. Opt. Express 2011, 19, A1082–A1087. [Google Scholar] [CrossRef] [PubMed]
  143. Ter-Gabrielyan, N.; Merkle, L.D.; Ikesue, A.; Dubinsii, M. Ultralow quantum-defect eye-safe Er:Sc2O3 laser. Opt. Lett. 2008, 33, 1524–1526. [Google Scholar] [CrossRef] [PubMed]
  144. Ter-Gabrielyan, N.; Dubinskii, M.; Newburgh, G.A.; Michael, A.; Merkle, L.D. Temperature dependence of a diode-pumped cryogenic Er:YAG laser. Opt. Express 2009, 17, 7159–7169. [Google Scholar] [CrossRef] [PubMed]
  145. Ter-Gabrielyan, N.; Fromzel, V.; Merkle, L.D.; Dubinskii, M. Resonant in-band pumping of cryo-cooled Er3+:YAG laser at 1532, 1534, and 1546 nm: a comparative study. Opt. Mater. Express 2011, 1, 223–233. [Google Scholar] [CrossRef]
  146. Seltzer, S.D.; Shaw, M.J.; Kukla, M.J.; Unternahrer, J.R.; Dinndorf, K.M.; Beattie, J.A.; Chickless, E.P. A 400 W cryogenic Er:YAG slab laser at 1645 nm. In Proceedings of SPIE 7686, Laser Technology for Defense and Security VI, Orlando, FL, USA, 5 April 2010. [CrossRef]
  147. Kawanaka, J.; Takeuchi, Y.; Yoshida, A.; Pearce, S.J.; Yasuhara, R.; Kawashima, T.; Kan, H. Highly efficient cryogenically-cooled Yb:YAG laser. Laser Phys. 2010, 20, 1079–1084. [Google Scholar] [CrossRef]
  148. Tokita, S.; Kawanaka, J.; Fujita, M.; Kawashima, T.; Izawa, Y. Efficient high-average-power operation of a Q-switched cryogenic Yb:YAG laser oscillator. Jpn. J. Appl. Phys. 2005, 44, L1520–L1531. [Google Scholar] [CrossRef]
  149. Perevezentsev, E.A.; Mukhin, I.B.; Kuznetsov, I.I.; Palashov, O.V.; Khazanov, E.A. Cryogenic disk Yb:YAG laser with 120 mJ energy at 500 Hz repetition rate. Quantum Electron. 2013, 43, 207–210. [Google Scholar] [CrossRef]
  150. Manni, J.G.; Hybl, J.D.; Rand, D.; Ripin, D.J.; Ochoa, J.R.; Fan, T.Y. 100-W Q-switched cryogenically cooled Yb:YAG laser. IEEE J. Quantum Electron. 2010, 46, 95–98. [Google Scholar] [CrossRef]
  151. Cheng, X.; Wang, J.; Yang, Z.; Liu, J.; Li, L.; Shi, X.; Huang, W.; Wang, J.; Chen, W. A high energy nanosecond cryogenic cooled Yb:YAG active-mirror amplifier system. High Power Laser Sci. Eng. 2014, 2, 1–4. [Google Scholar] [CrossRef]
  152. Mason, P.D.; Banerjee, S.; Ertel, K.; Phillips, P.J.; Greenhalgh, J.; Collier, J.L. DiPOLE—An efficirnt and scalable high pulse energy and high average power cryogenic gas cooled multi-slab amplifier concept. Plasma Fusion Res. 2013, 8, 1–4. [Google Scholar] [CrossRef]
  153. Kawanaka, J.; Yamakawa, K.; Nishioka, H.; Ueda, K. 30-mJ, diode-pumped chirped-pulse Yb:YLF regenerative amplifier. Opt. Lett. 2003, 28, 2121–2123. [Google Scholar] [CrossRef] [PubMed]
  154. Bayramian, A.; Armstrong, P.; Ault, E.; Beach, R.; Bibeau, C.; Caird, J.; Campbell, R.; Chai, B.; Dawson, J.; Ebbers, C.; et al. The Mercury project: A high average power gas-cooled laser for inertial fusion energy development. Fusion Sci. Technol. 2007, 52, 383–387. [Google Scholar]
  155. Lucianetti, A.; Albach, D.; Chanteloup, J.C. Active-mirror-laser-amplifier thermal management with tunable helium pressure at cryogenic temperatures. Opt. Express 2011, 19, 12766–12780. [Google Scholar] [CrossRef] [PubMed]
  156. Vaupel, A.; Bodnar, N.; Webb, B.; Shah, L.; Richardson, M. Concepts, performance review, and prospects of table-top, few-cycle optical parametric chirped-pulse amplification. Opt. Engin. 2014, 53, 1–12. [Google Scholar] [CrossRef]
  157. Fattahi, H.; Barros, H.G.; Gorjan, M.; Nubbemeyer, T.; Alsaif, B.; Teisset, C.Y.; Schultze, M.; Prinz, S.; Haefner, M.; Ueffing, M.; et al. Third generation femtosecond technology. Optica 2014, 1, 45–63. [Google Scholar] [CrossRef]
  158. Tokita, S.; Kawanaka, J.; Izawa, Y.; Fujita, M.; Kawashima, T. 23.7-W picosecond cryogenic-Yb:YAG multipass amplifier. Opt. Express 2007, 15, 3955–3961. [Google Scholar] [CrossRef] [PubMed]
  159. Akahane, Y.; Aoyama, M.; Ogawa, K.; Tsuji, K.; Tokita, S.; Kawanaka, J.; Nishioka, H.; Yamakawa, K. High-energy, diode-pumped, picosecond Yb:YAG chirped-pulse regenerative amplifier for pumping chirped-pulse amplification. Opt. Lett. 2007, 32, 1899–1901. [Google Scholar] [CrossRef] [PubMed]
  160. Hong, K.H.; Siddiqui, A.; Moses, J.; Gopinath, J.; Hybl, J.; Ilday, F.Ö.; Fan, T.Y.; Kärtner, F.X. Generation of 287 W, 5.5 ps pulses at 78 MHz repetition rate from a cryogenically cooled Yb:YAG amplifier seeded by a fiber chirped-pulse amplification system. Opt. Lett. 2008, 33, 2473–2475. [Google Scholar] [CrossRef] [PubMed]
  161. Hong, K.H.; Lai, C.J.; Siddiqui, A.; Kärtner, F.X. 130-W picosecond green laser based on a frequency-doubled hybrid cryogenic Yb:YAG amplifier. Opt. Express 2009, 19, 16911–16919. [Google Scholar] [CrossRef] [PubMed]
  162. Reagan, B.A.; Curtis, A.H.; Wernsing, K.A.; Furch, F.J.; Luther, B.M.; Rocca, J.J. Development of high energy diode-pumped thick-disk Yb:YAG chirped-pulse-amplification lasers. IEEE J. Quantum Electron. 2012, 48, 827–835. [Google Scholar] [CrossRef]
  163. Hong, K.H.; Gopinath, J.T.; Rand, D.; Siddiqui, A.M.; Huang, S.W.; Li, E.; Eggleton, B.J.; Hybl, J.D.; Fan, T.Y.; Kärtner, F.X. High-energy, kHz-repetition-rate, ps cryogenic Yb:YAQ chirped-pulse amplifier. Opt. Lett. 2010, 35, 1752–1754. [Google Scholar] [CrossRef] [PubMed]
  164. Kowalewski, K.; Zembec, J.; Envid, V.; Brown, D.C. 201 W picosecond green laser using a mode-locked fiber driven cryogenic Yb:YAG amplifier system. Opt. Lett. 2012, 37, 4633–4735. [Google Scholar] [CrossRef] [PubMed]
  165. Hong, K.H.; Huang, S.W.; Moses, J.; Fu, X.; Lai, C.J.; Cirmi, G.; Sell, A.; Granados, E.; Keathley, P.; Kärtner, F.X. High-energy, phase-stable, ultrabroadband kHz OPCPA at 2.1 µm pumped by a picosecond cryogenic Yb:YAG laser. Opt. Express 2011, 19, 15538–15548. [Google Scholar] [CrossRef] [PubMed]
  166. Curtis, A.H.; Reagan, B.A.; Wernsing, K.A.; Furch, F.J.; Luther, B.M.; Rocca, J.J. Demonstration of a compact 100 Hz, 0.1 J, diode-pumped picosecond laser. Opt. Lett. 2011, 36, 2164–2166. [Google Scholar] [CrossRef] [PubMed]
  167. Miller, D.E.; Zapata, L.E.; Ripin, D.J.; Fan, T.Y. Sub-picosecond pulses at 100 W average power from a Yb:YLF chirped-pulse amplification system. Opt. Lett. 2012, 37, 2700–2702. [Google Scholar] [CrossRef] [PubMed]
  168. Petrov, V.V.; Pestryakov, E.V.; Laptev, A.V.; Petrov, V.A.; Kuptsov, G.V. Pump channel of parametric amplifoer of terawatt femtosecond Yb laser system. Atmos. Ocean. Opt. 2014, 27, 344–347. [Google Scholar] [CrossRef]
  169. Zapata, L.E.; Lin, H.; Calendron, A.L.; Cankaya, H.; Hemmer, M.; Reichert, F.; Huang, W.R.; Granados, E.; Hong, K.H.; Kärtner, F.X. Cryogenic Yb:YAG composite-thin-disk for high energy and average power amplifiers. Opt. Lett. 2015, 40, 2610–2613. [Google Scholar] [CrossRef] [PubMed]
  170. Pugžlys, A.; Andriukaitas, G.; Sidorov, D.; Irshad, A.; Baltuška, A.; Lai, W.J.; Phua, P.B.; Su, L.; Xu, J.; Li, R.; et al. Spectroscopy and lasing of cryogenically cooled Yb, Na:CaF2. Appl. Phys. B Lasers Opt. 2009, 97, 339–350. [Google Scholar] [CrossRef]
  171. Divoky, M.; Smrz, M.; Chyla, M.; Sikocinski, P.; Novak, O.; Huynh, J.; Nagisetty, S.S.; Miura, T.; Pilař, J.; Slezak, O.; et al. Overview of the HiLASE project: High average power pulsed DPSSL systems for research and industry. High Power Laser Sci. Eng. 2014, 2, 1–10. [Google Scholar] [CrossRef]
  172. Novák, O.; Miura, T.; Smrž, M.; Chyla, M.; Nagisetty, S.S.; Mužik, J.; Linnemann, J.; Turčičova, H.; Jambunathan, V.; Slezák, O.; et al. Review, Status of the high average power diode-pumped solid state laser development at HiLASE. Appl. Sci. 2015, 5, 637–665. [Google Scholar] [CrossRef]
  173. Endo, A.; Sikocinski, P.; Chyla, M.; Miura, T.; Mocek, T.; Sakaue, K.; Washio, M. Cryogenically cooled 1 J, ps Yb:YAG slab laser for high-brightness laser-Compton X-ray source. In Proceedings of the IPAC, Dresden, Germany, 15–20 June 2014.

