
Experimental and Theoretical Studies of the Vibrational and Electronic Properties of (2E)-2-[3-(1H-imidazol-1-yl)-1-phenyl-propylidene]-N-phenylhydrazinecarboxamide: An Anticonvulsant Agent

 ,
, 
Abstract
:1. Introduction
2. Experimental Section
2.1. General
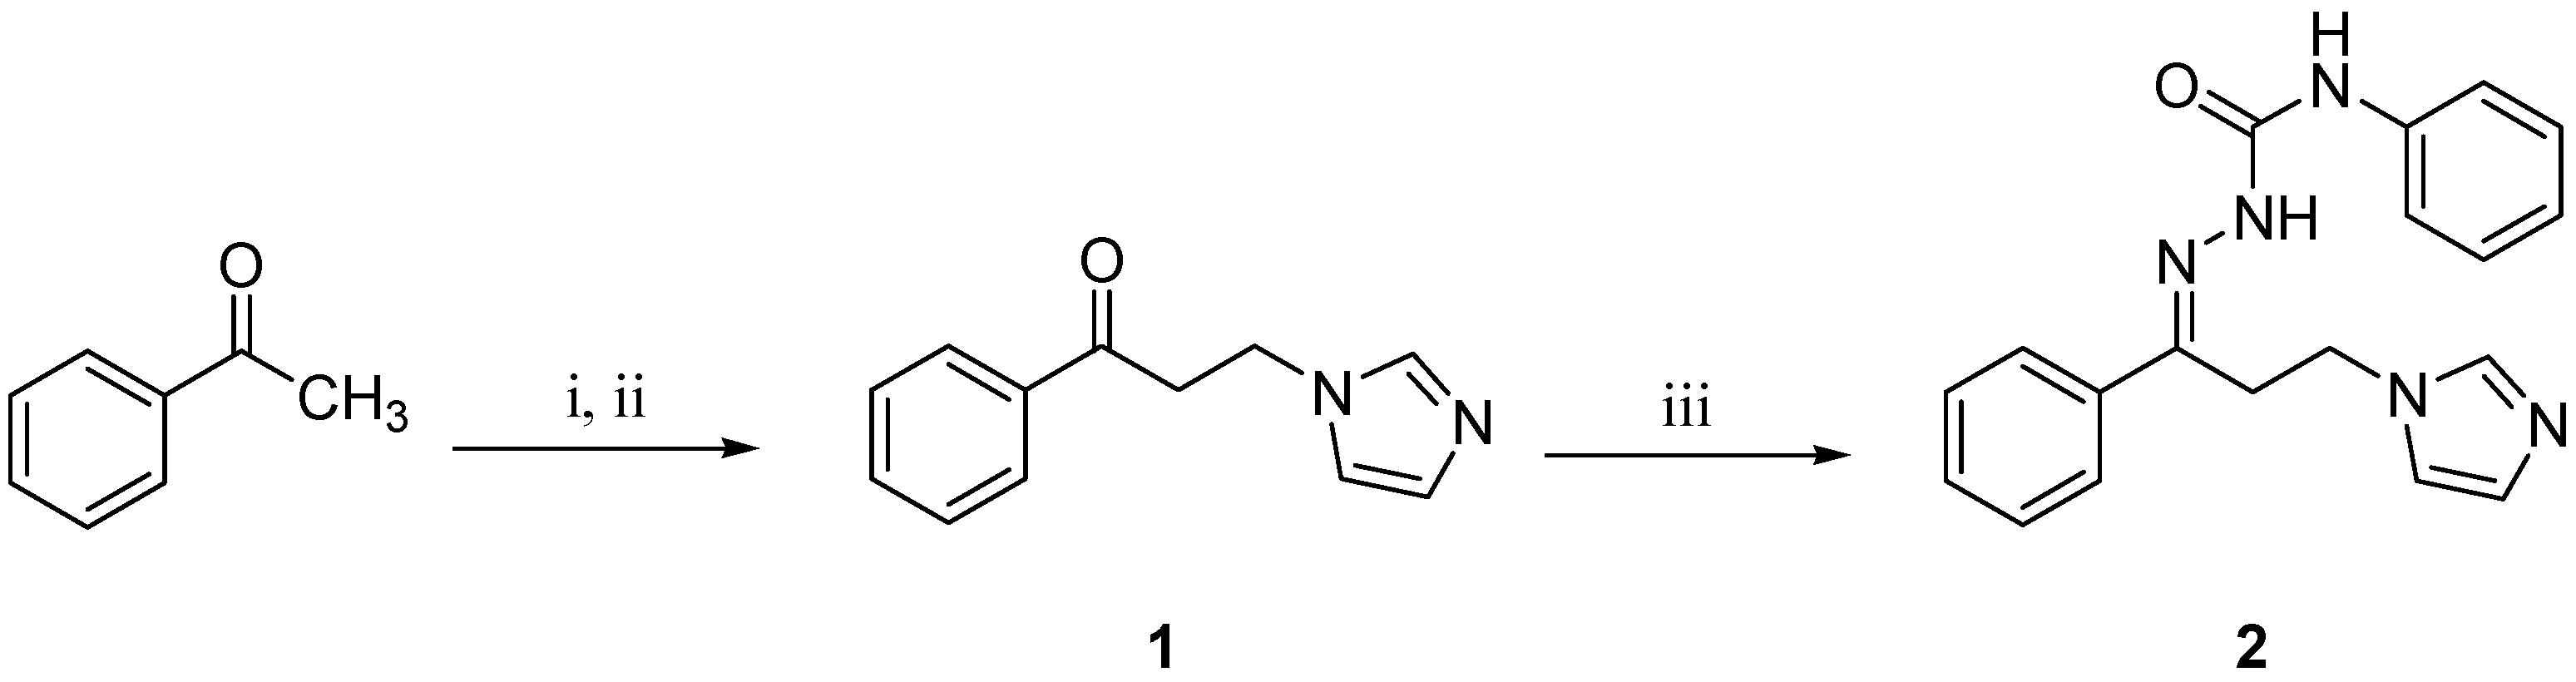
2.2. Synthesis
2.3. Quantum Chemical Calculations
3. Results and Discussion
3.1. Synthesis
3.2. X-ray Data Collection and Structure Description
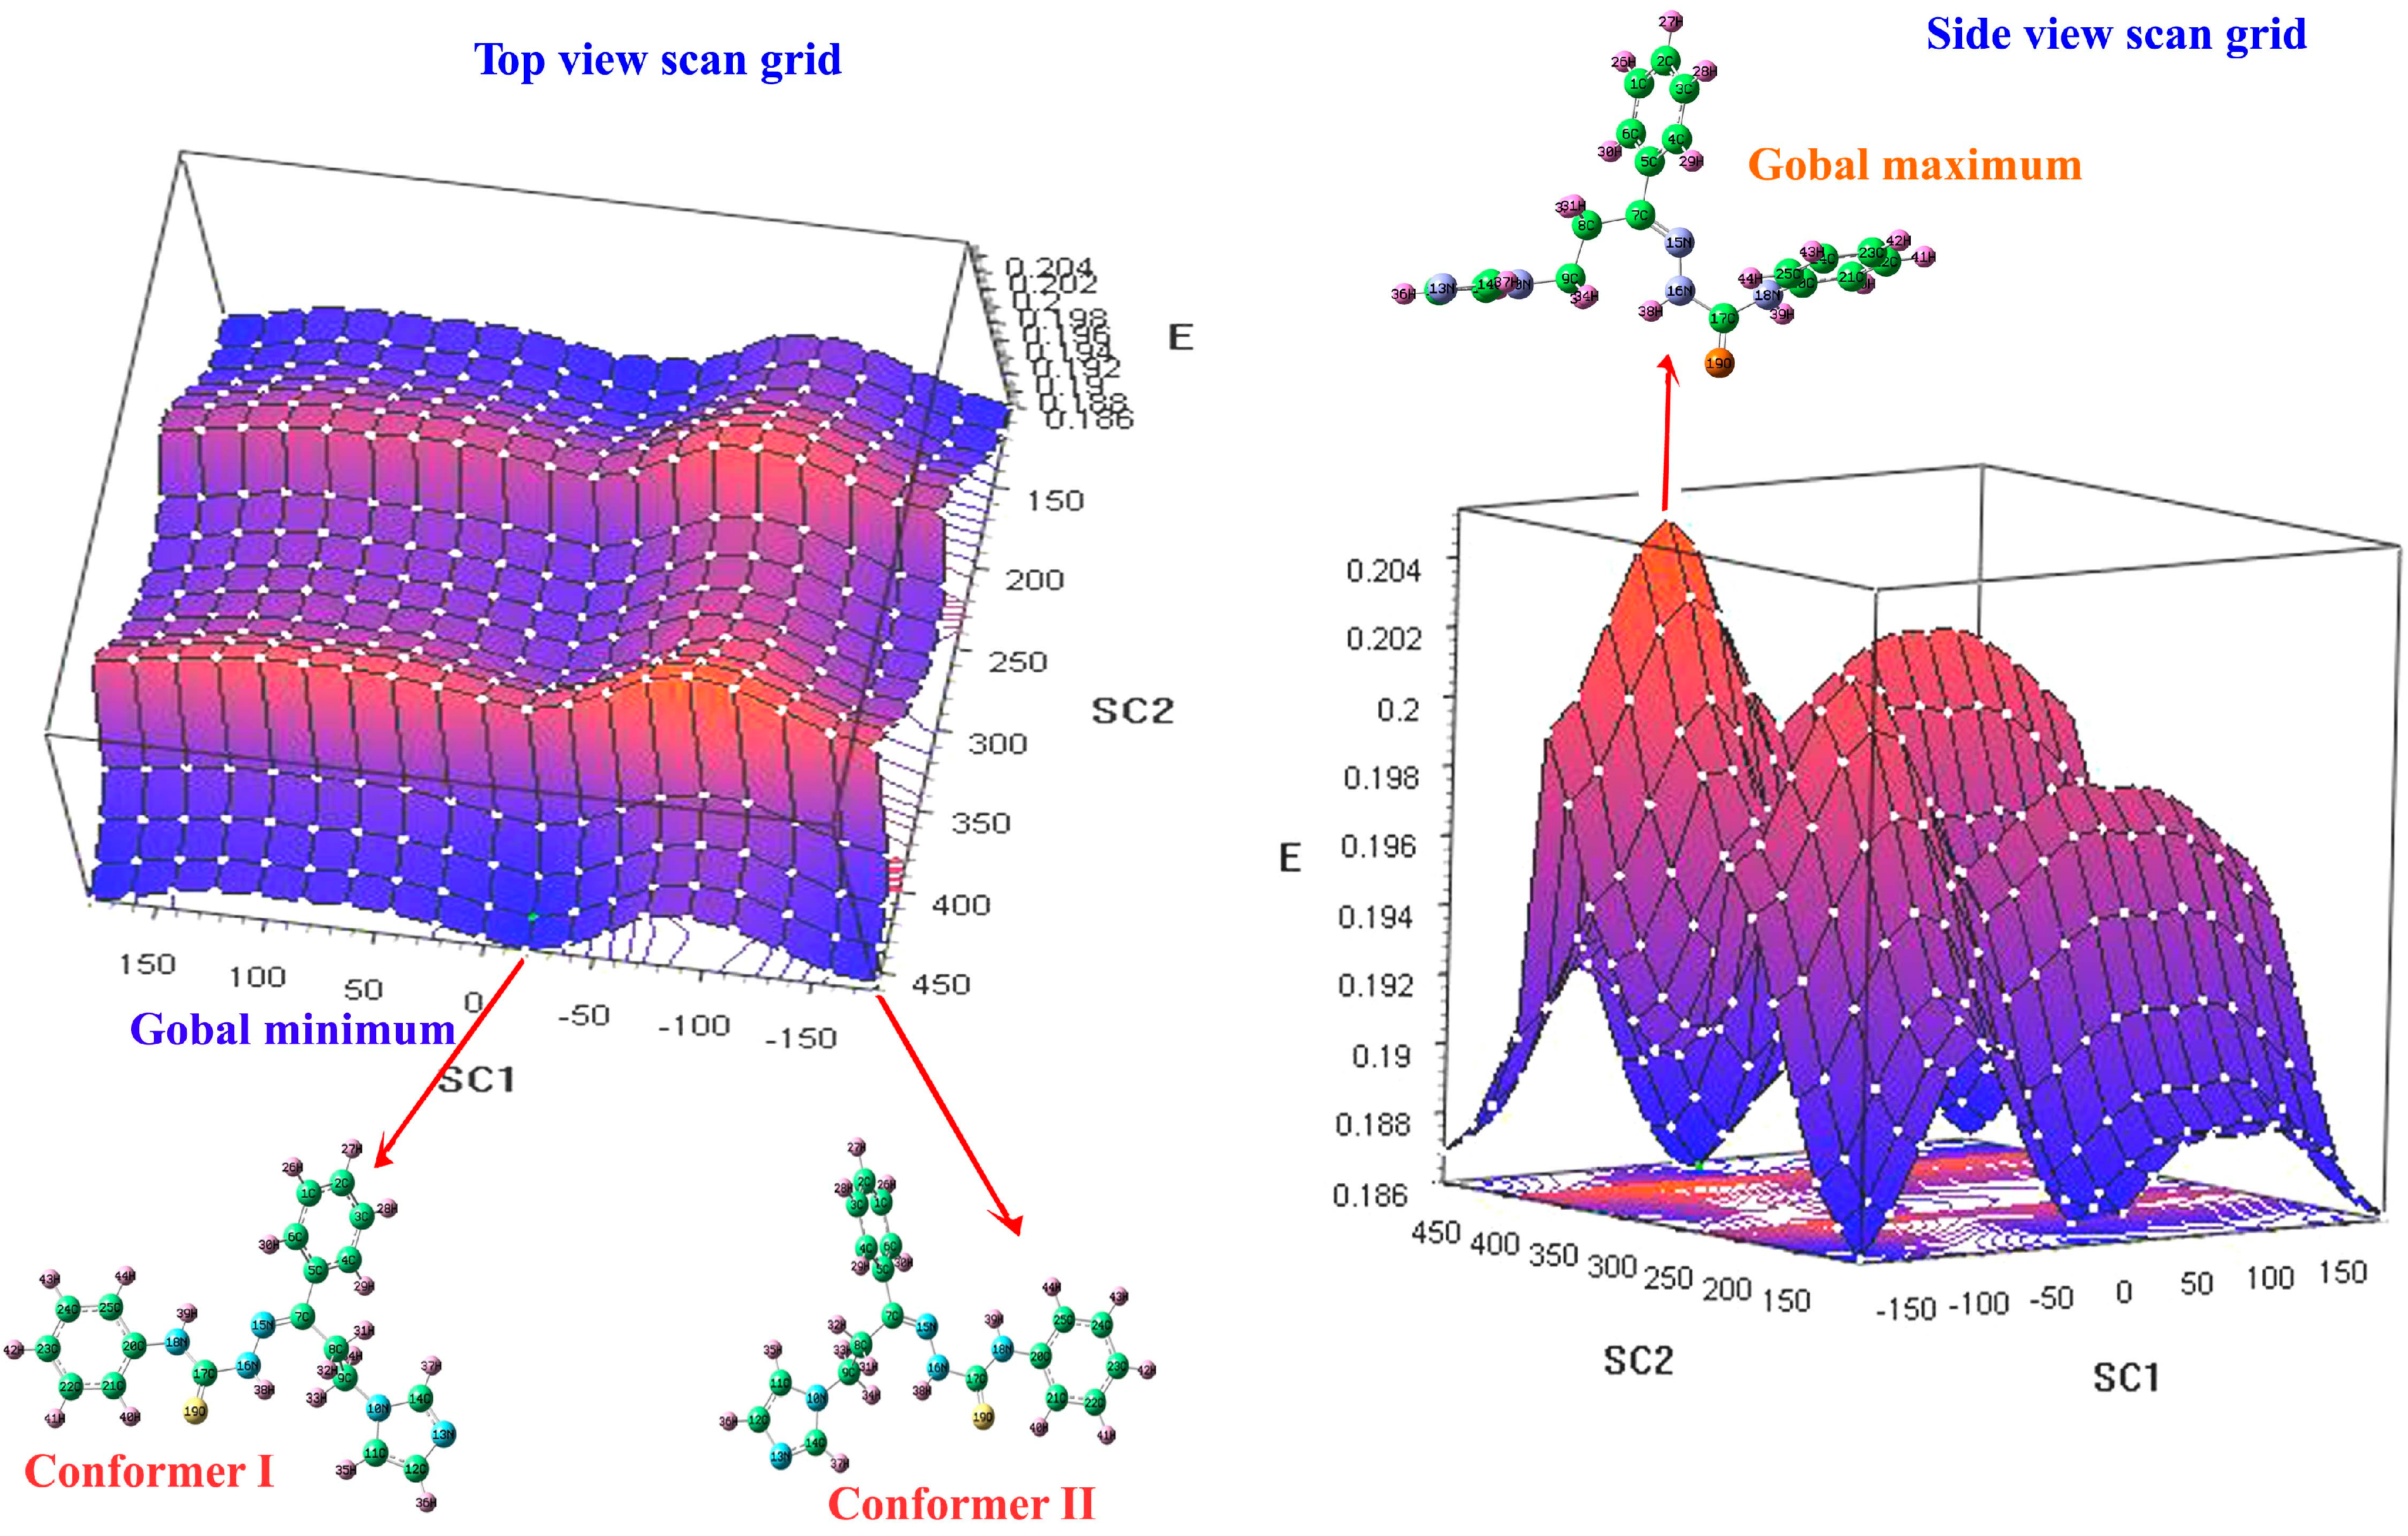
3.3. Potential Energy Surface Scan Grid
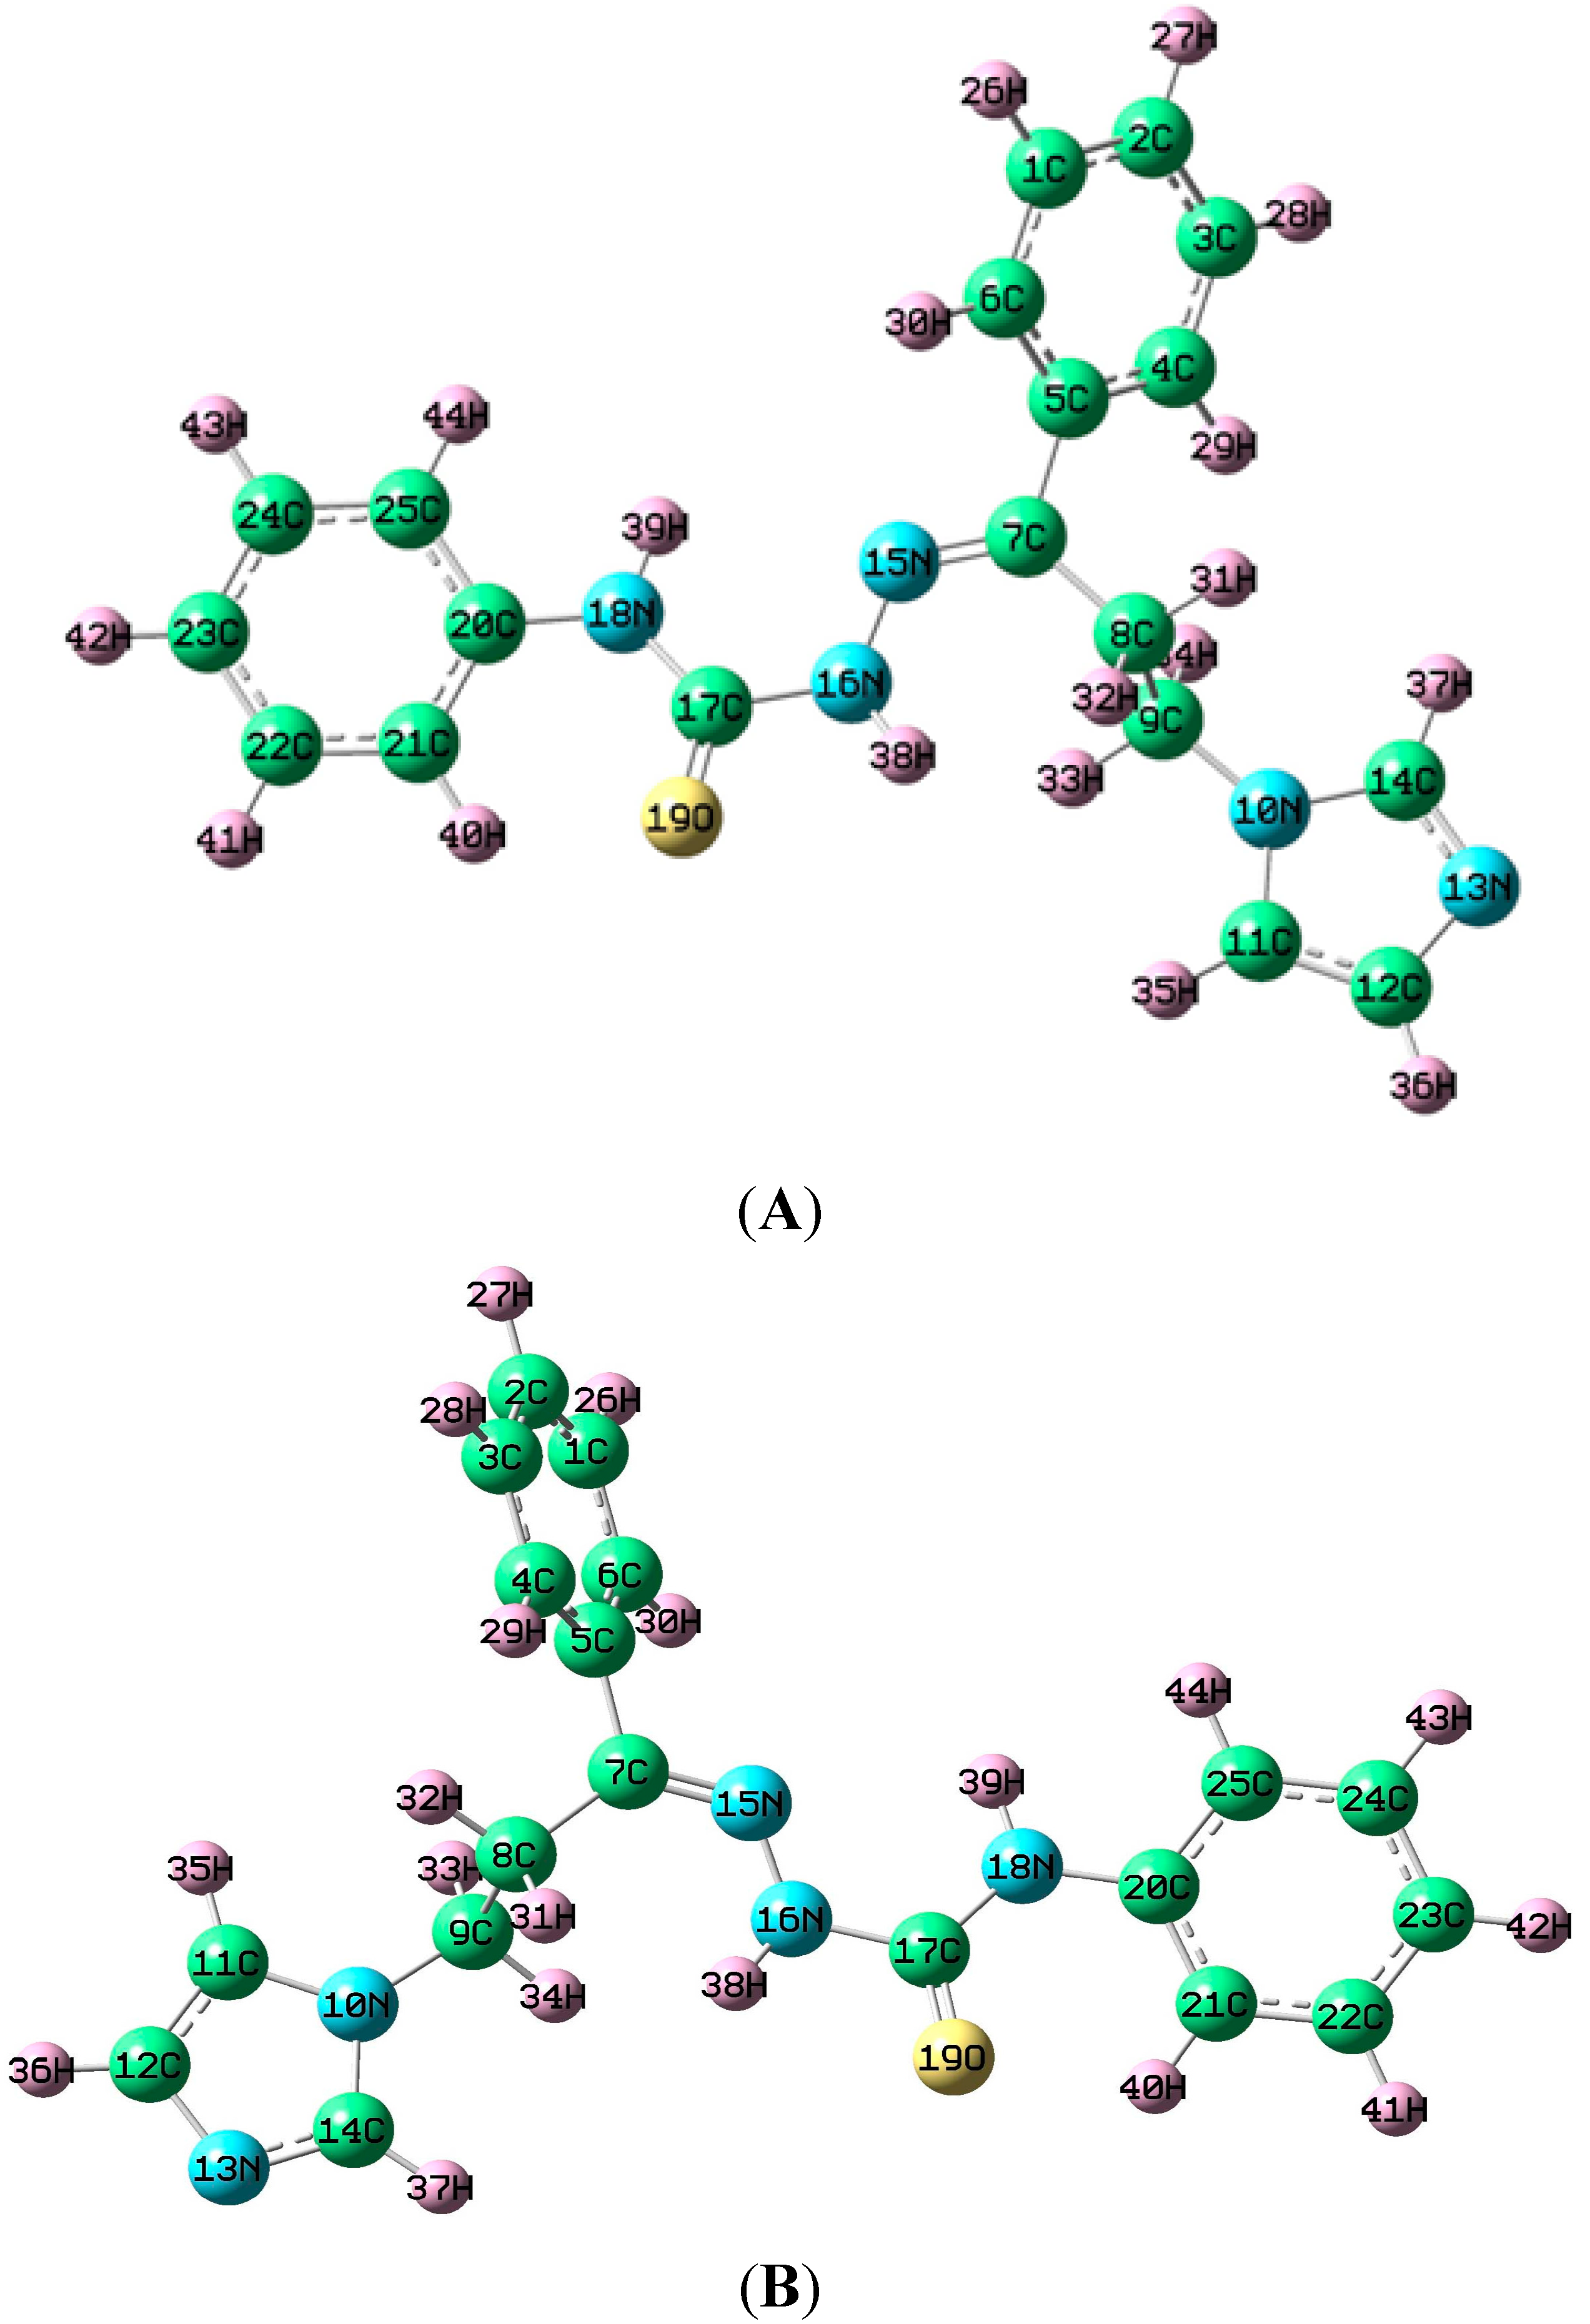
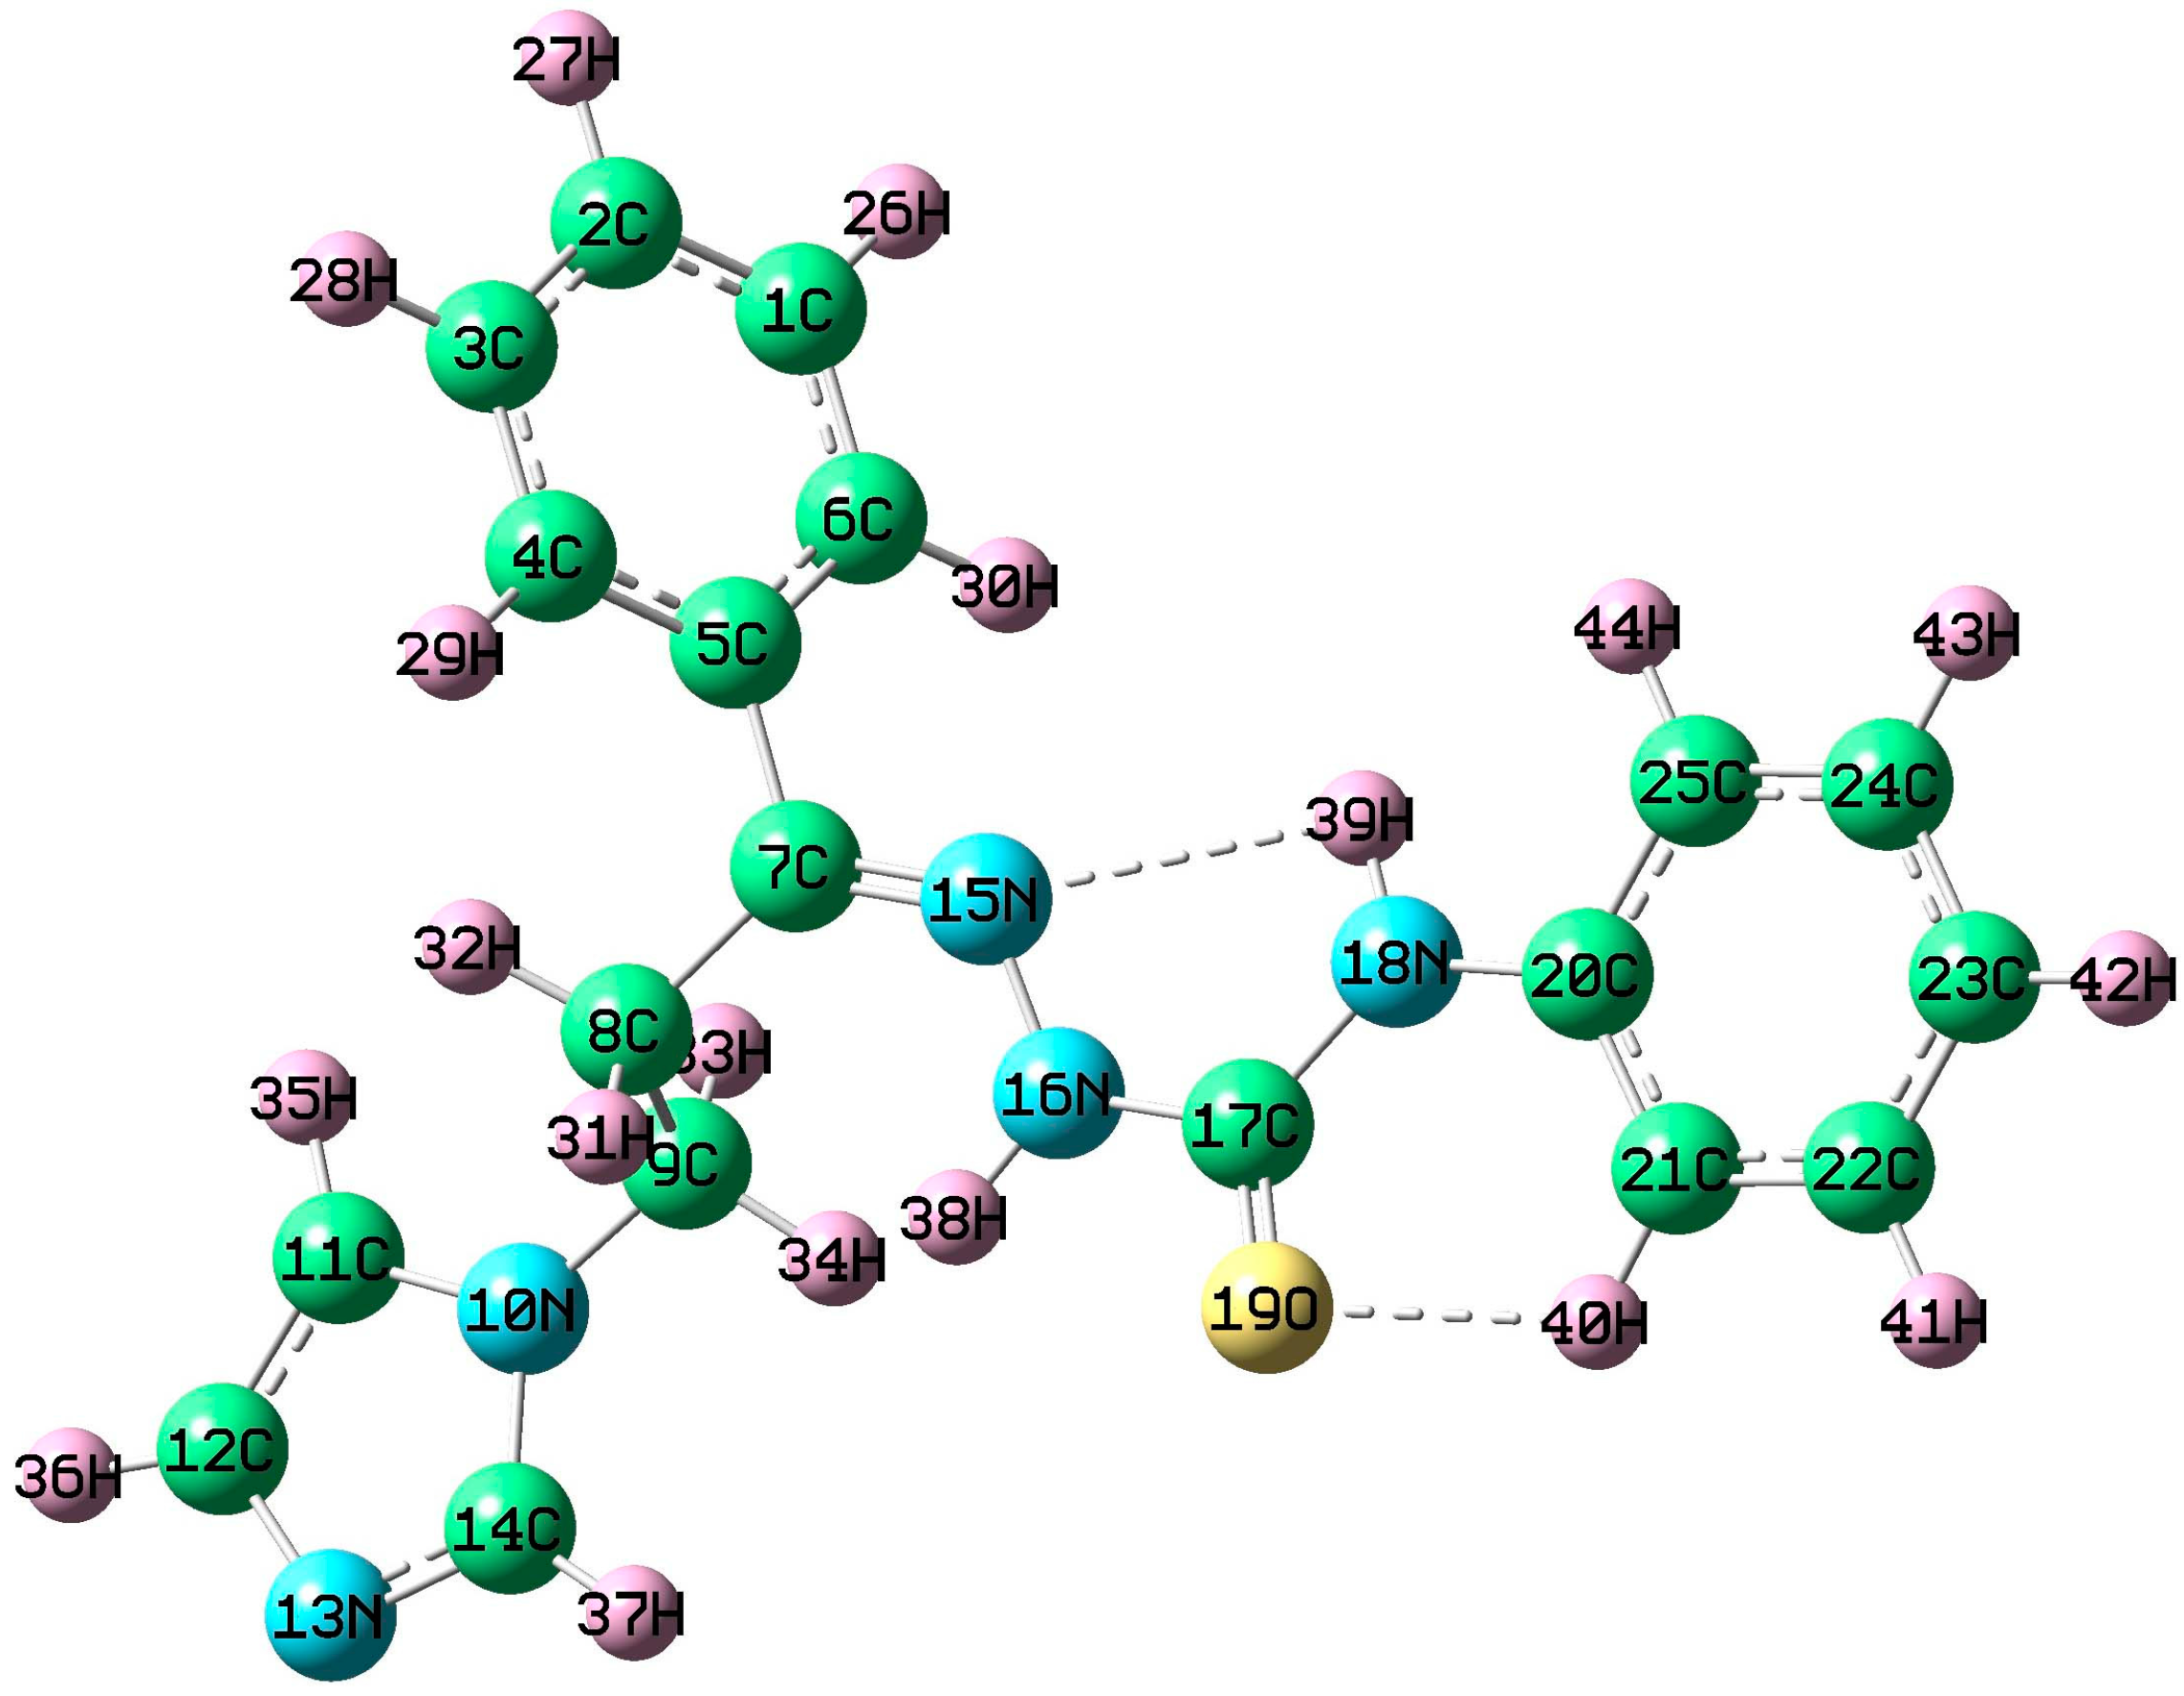
3.4. Geometry of the Title Molecule

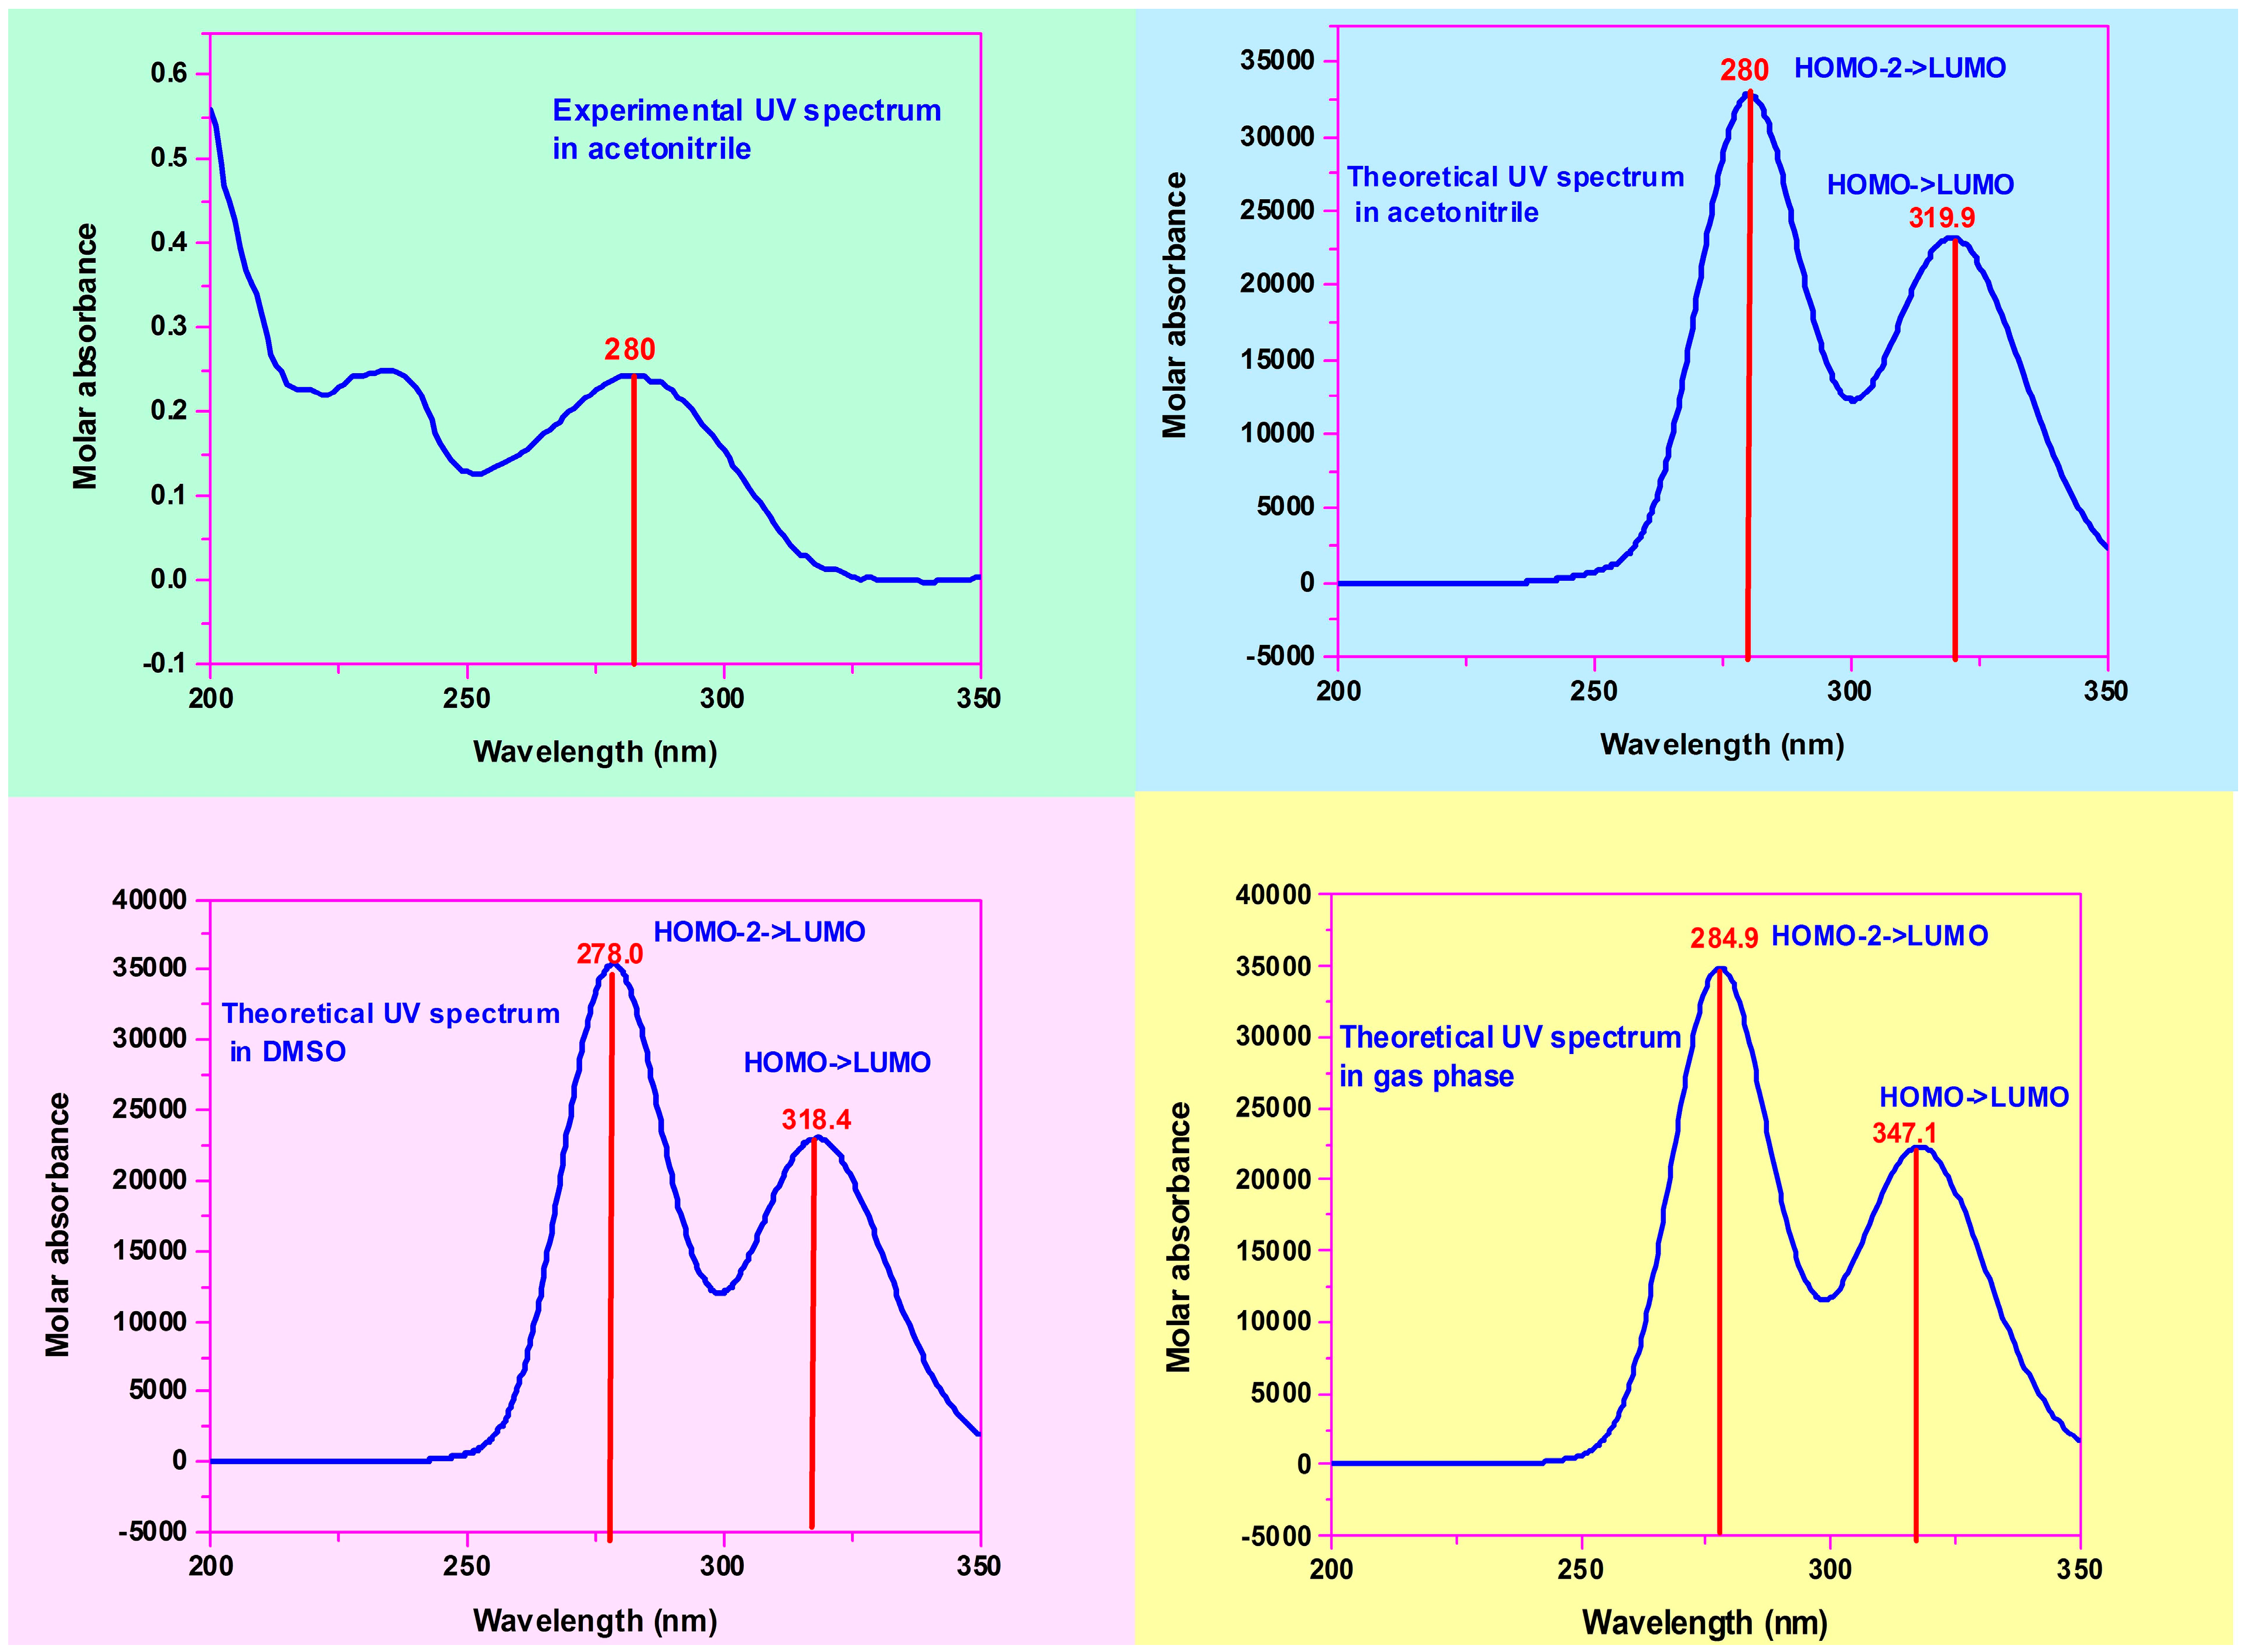
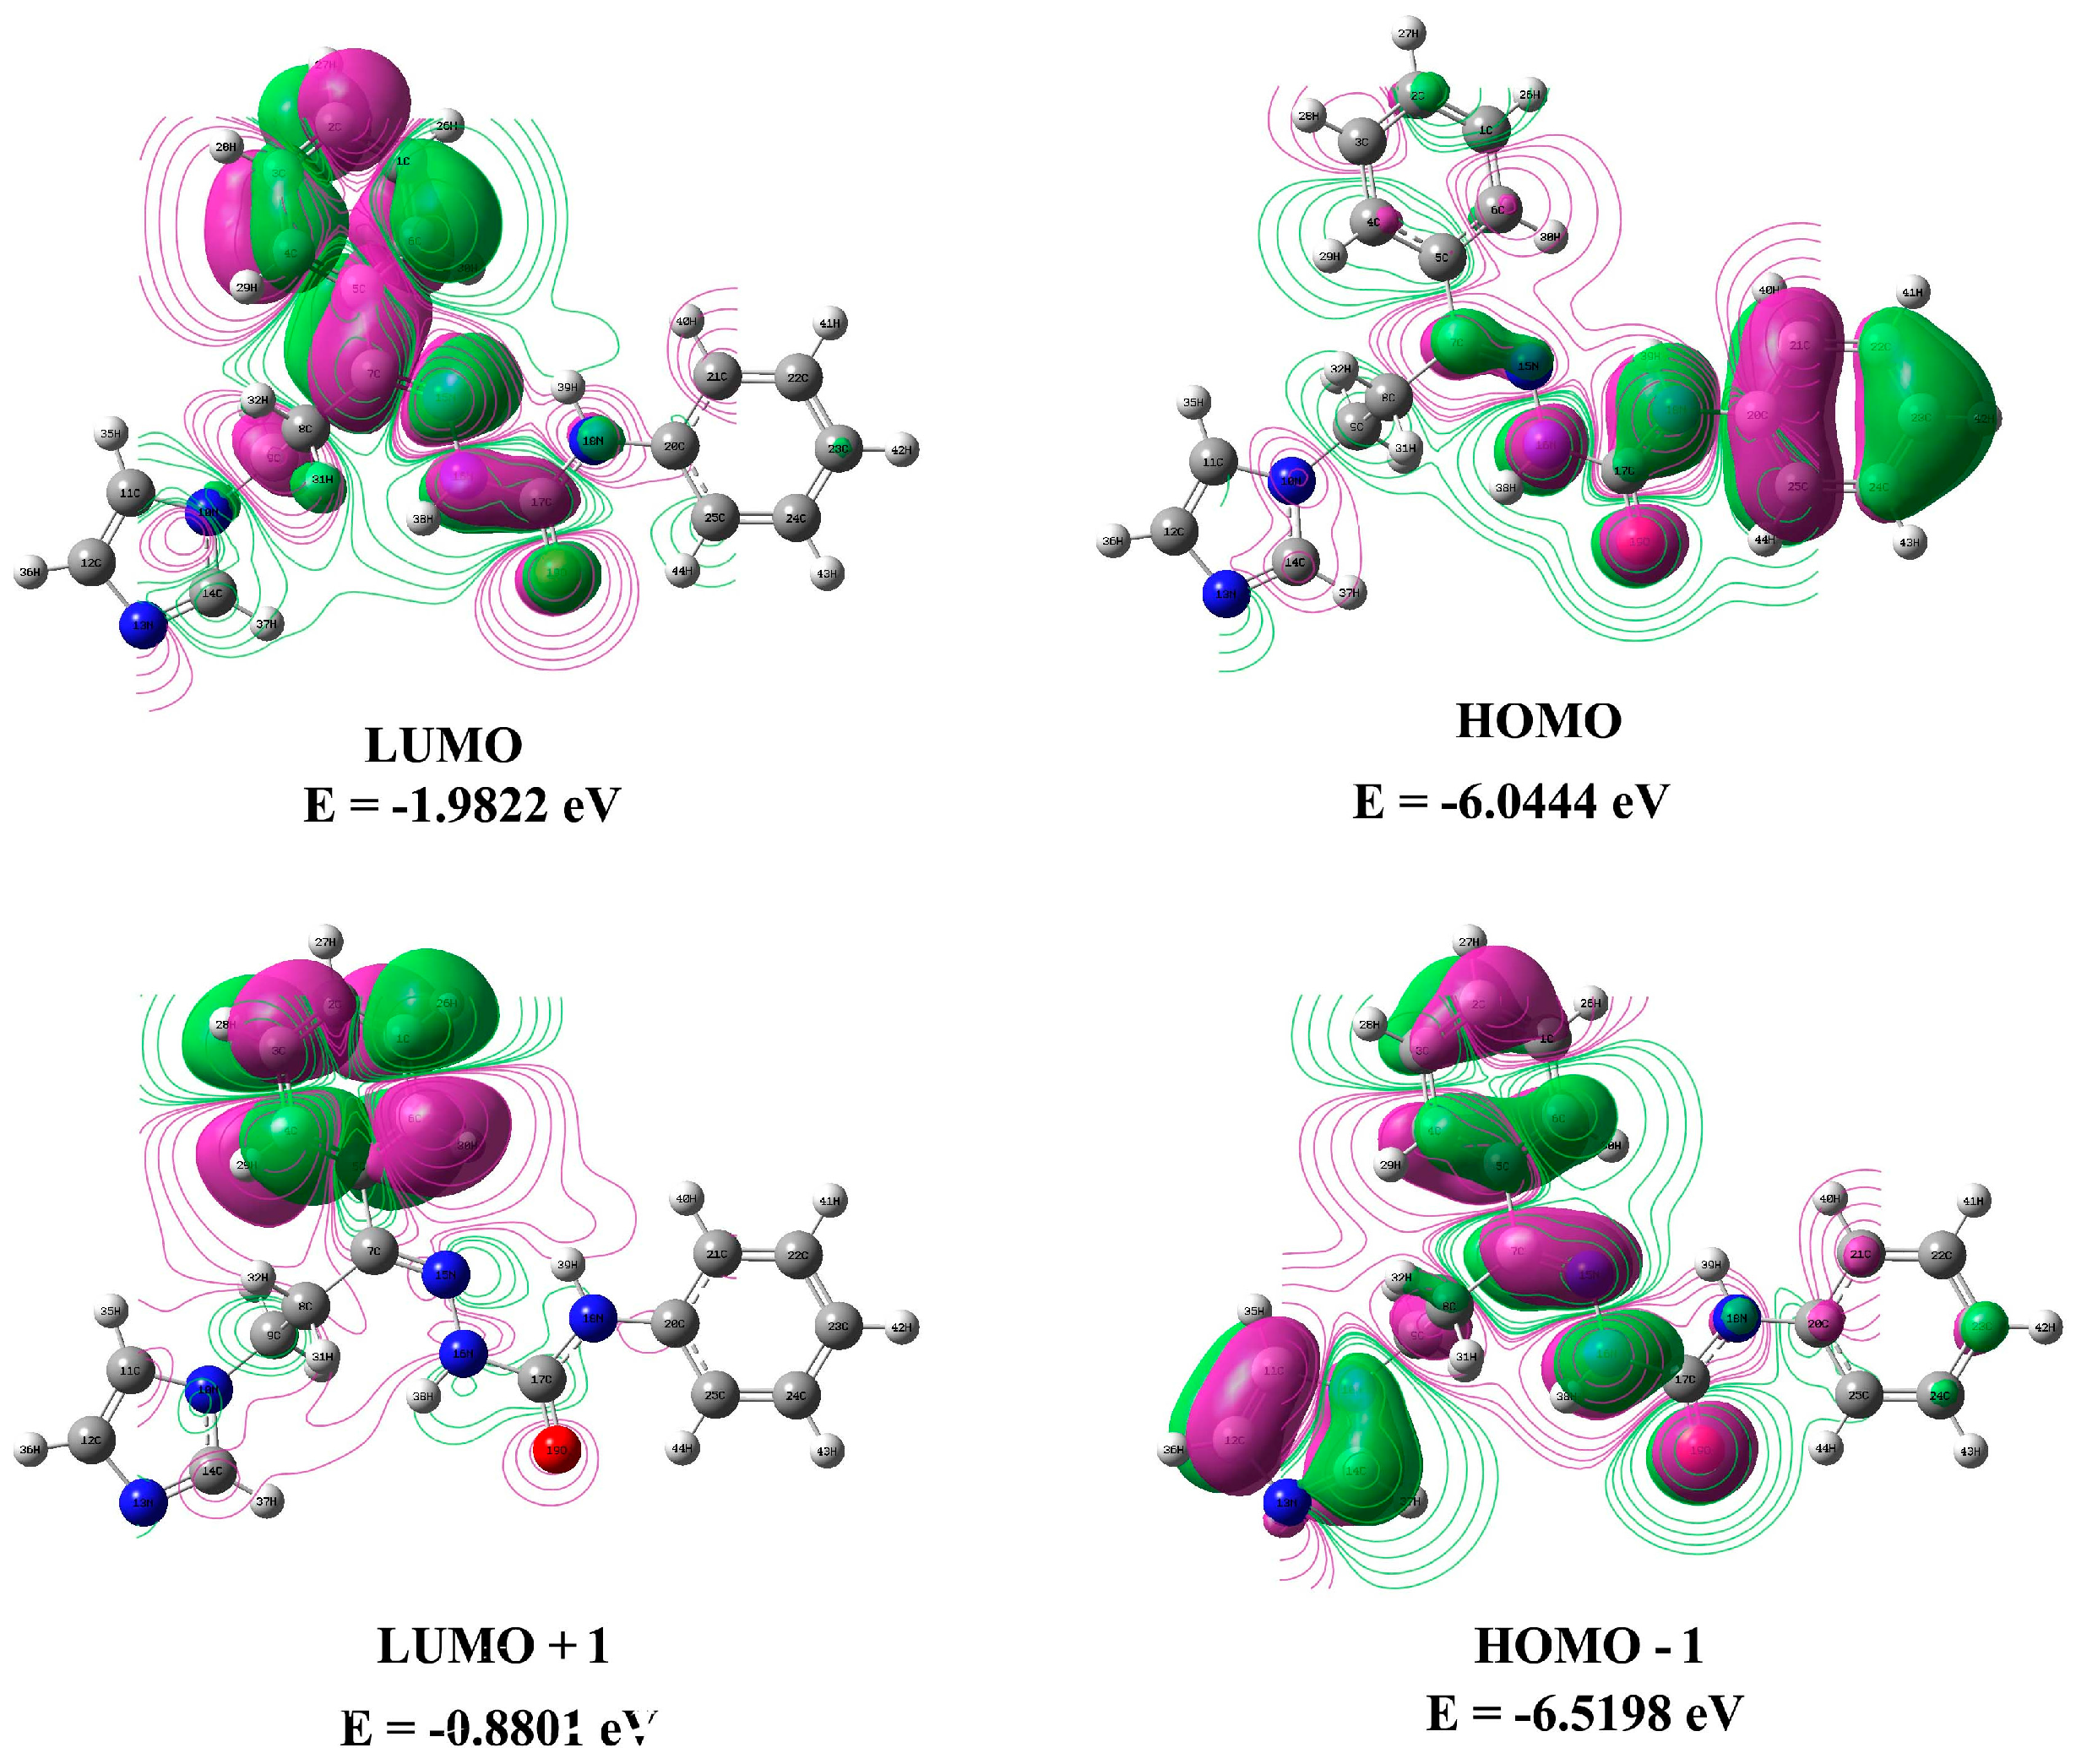
3.5. Frontier Molecular Orbitals (FMOs) and Ultraviolet Spectral Analysis
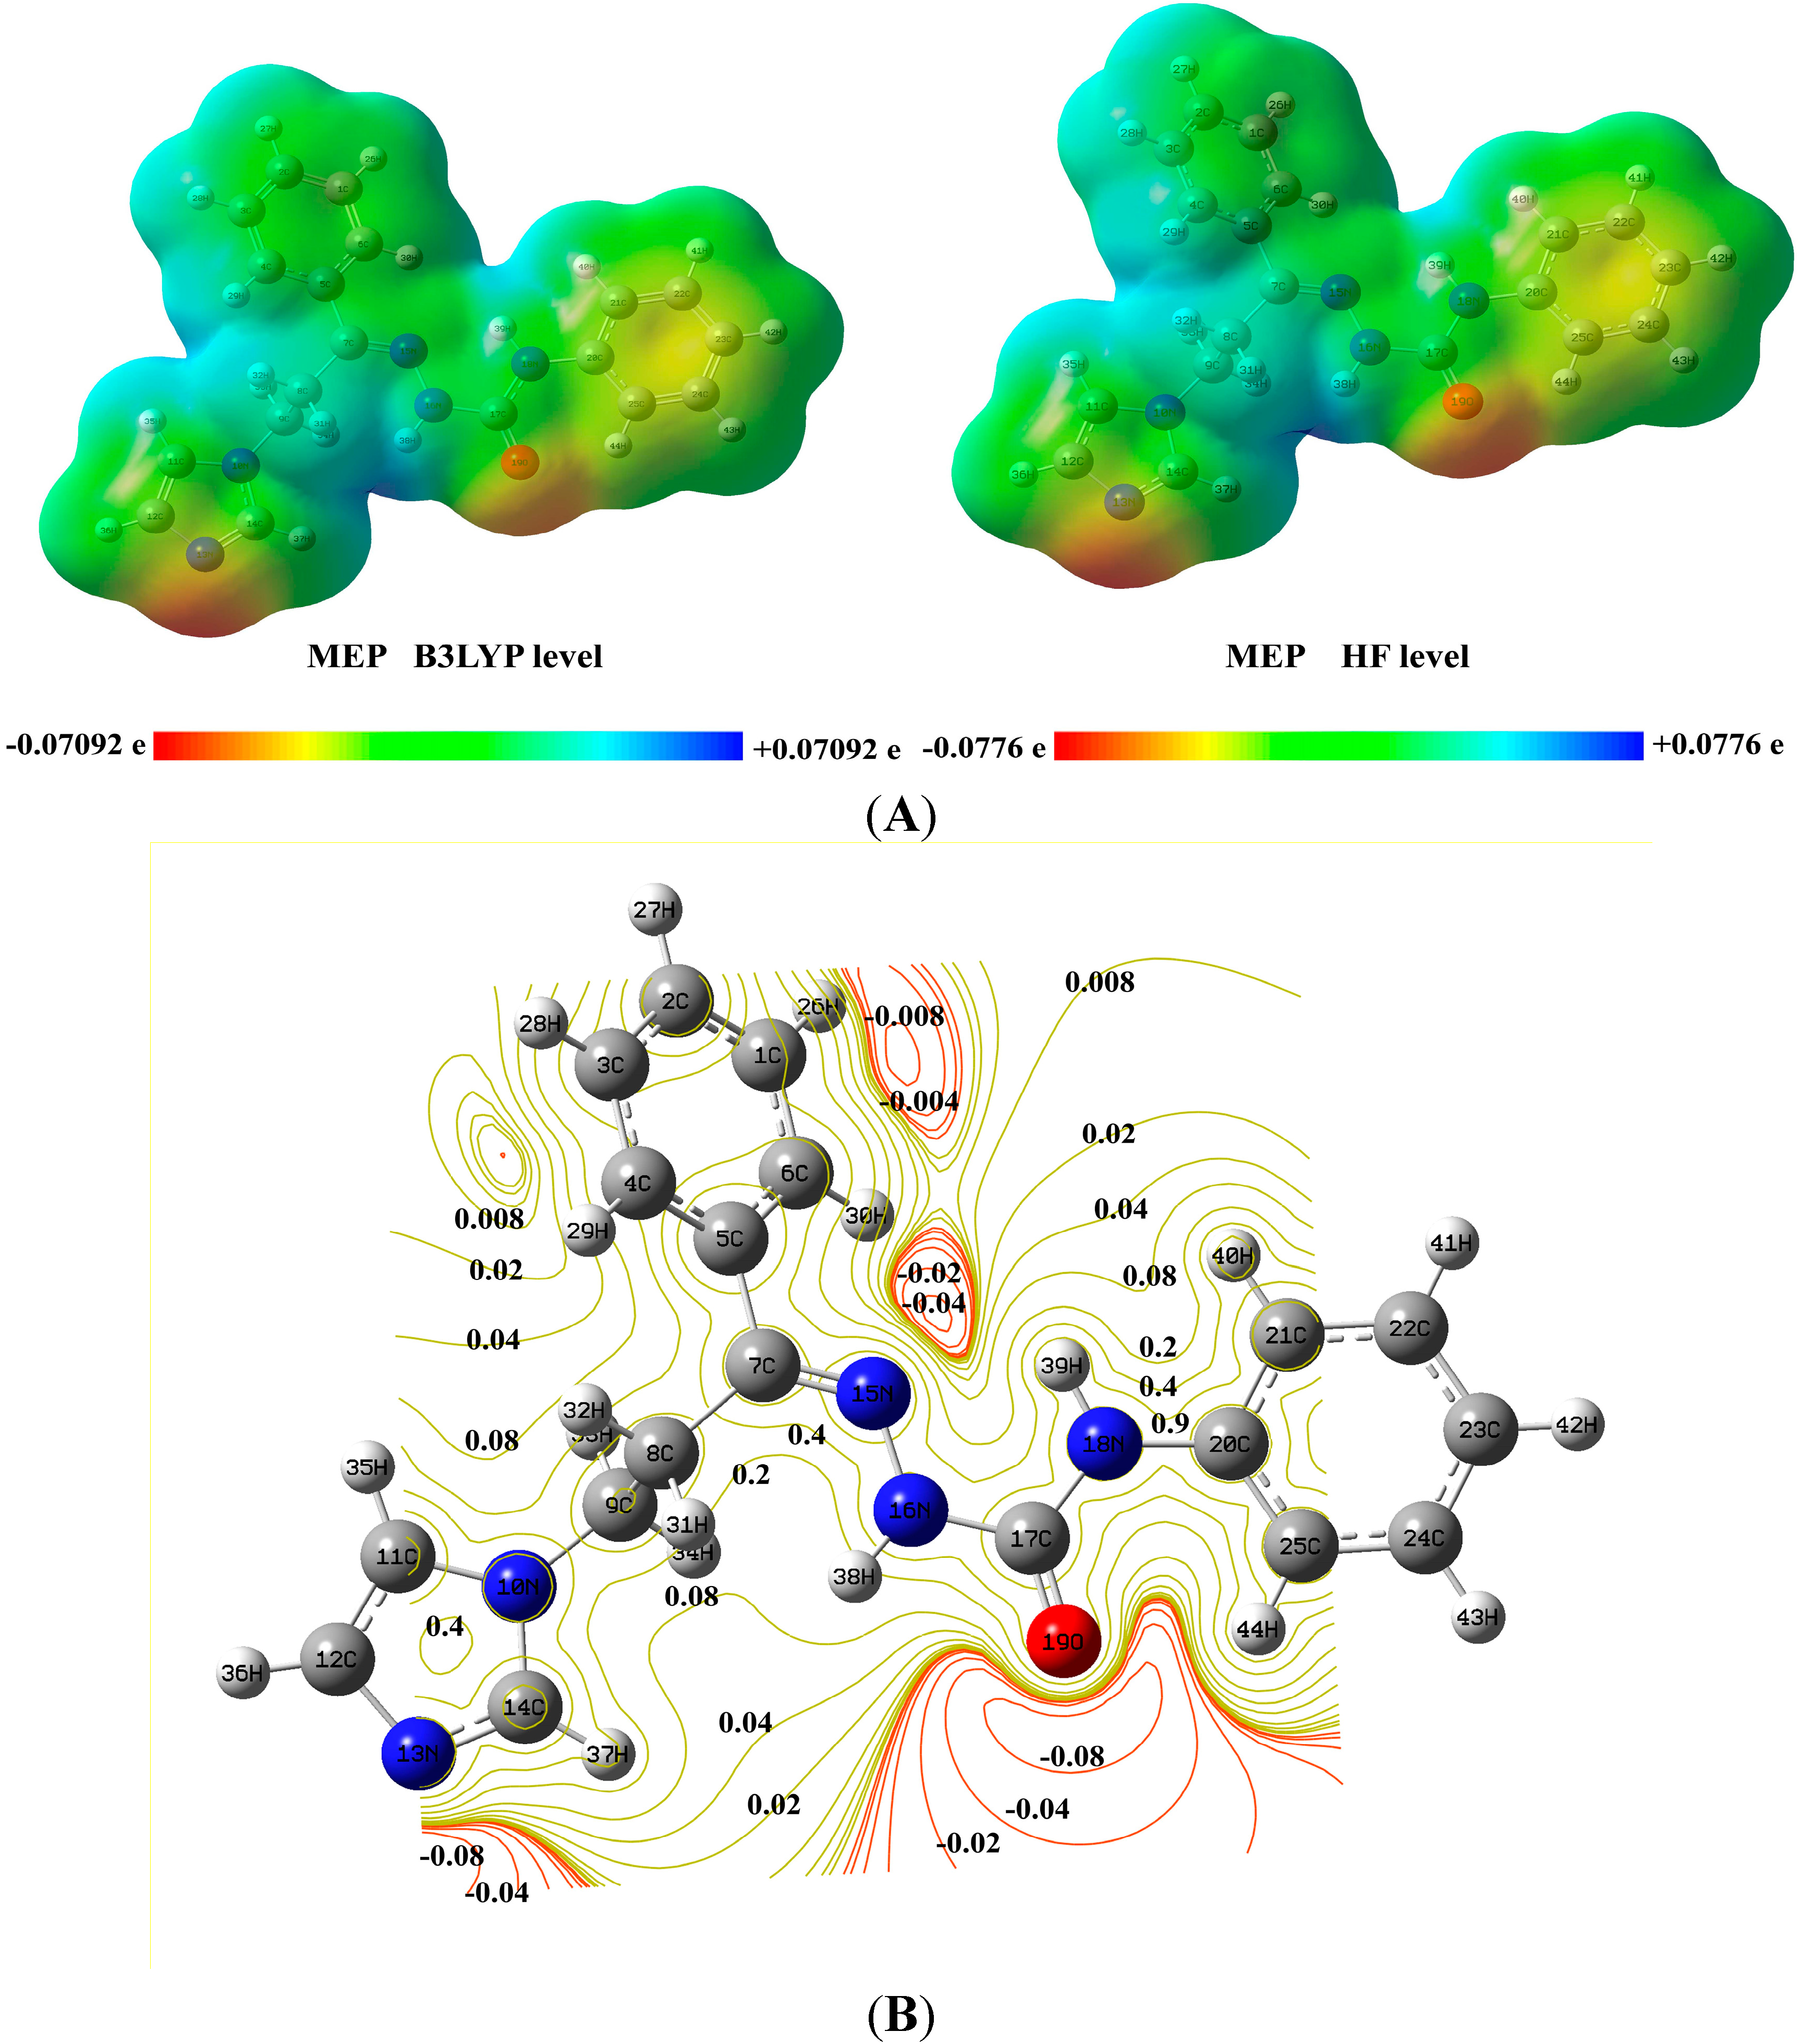
3.6. Electrostatic Potentials, Total Electron Densities, and Molecular Electrostatic Potentials
3.7. Infrared and Raman Spectral Analysis
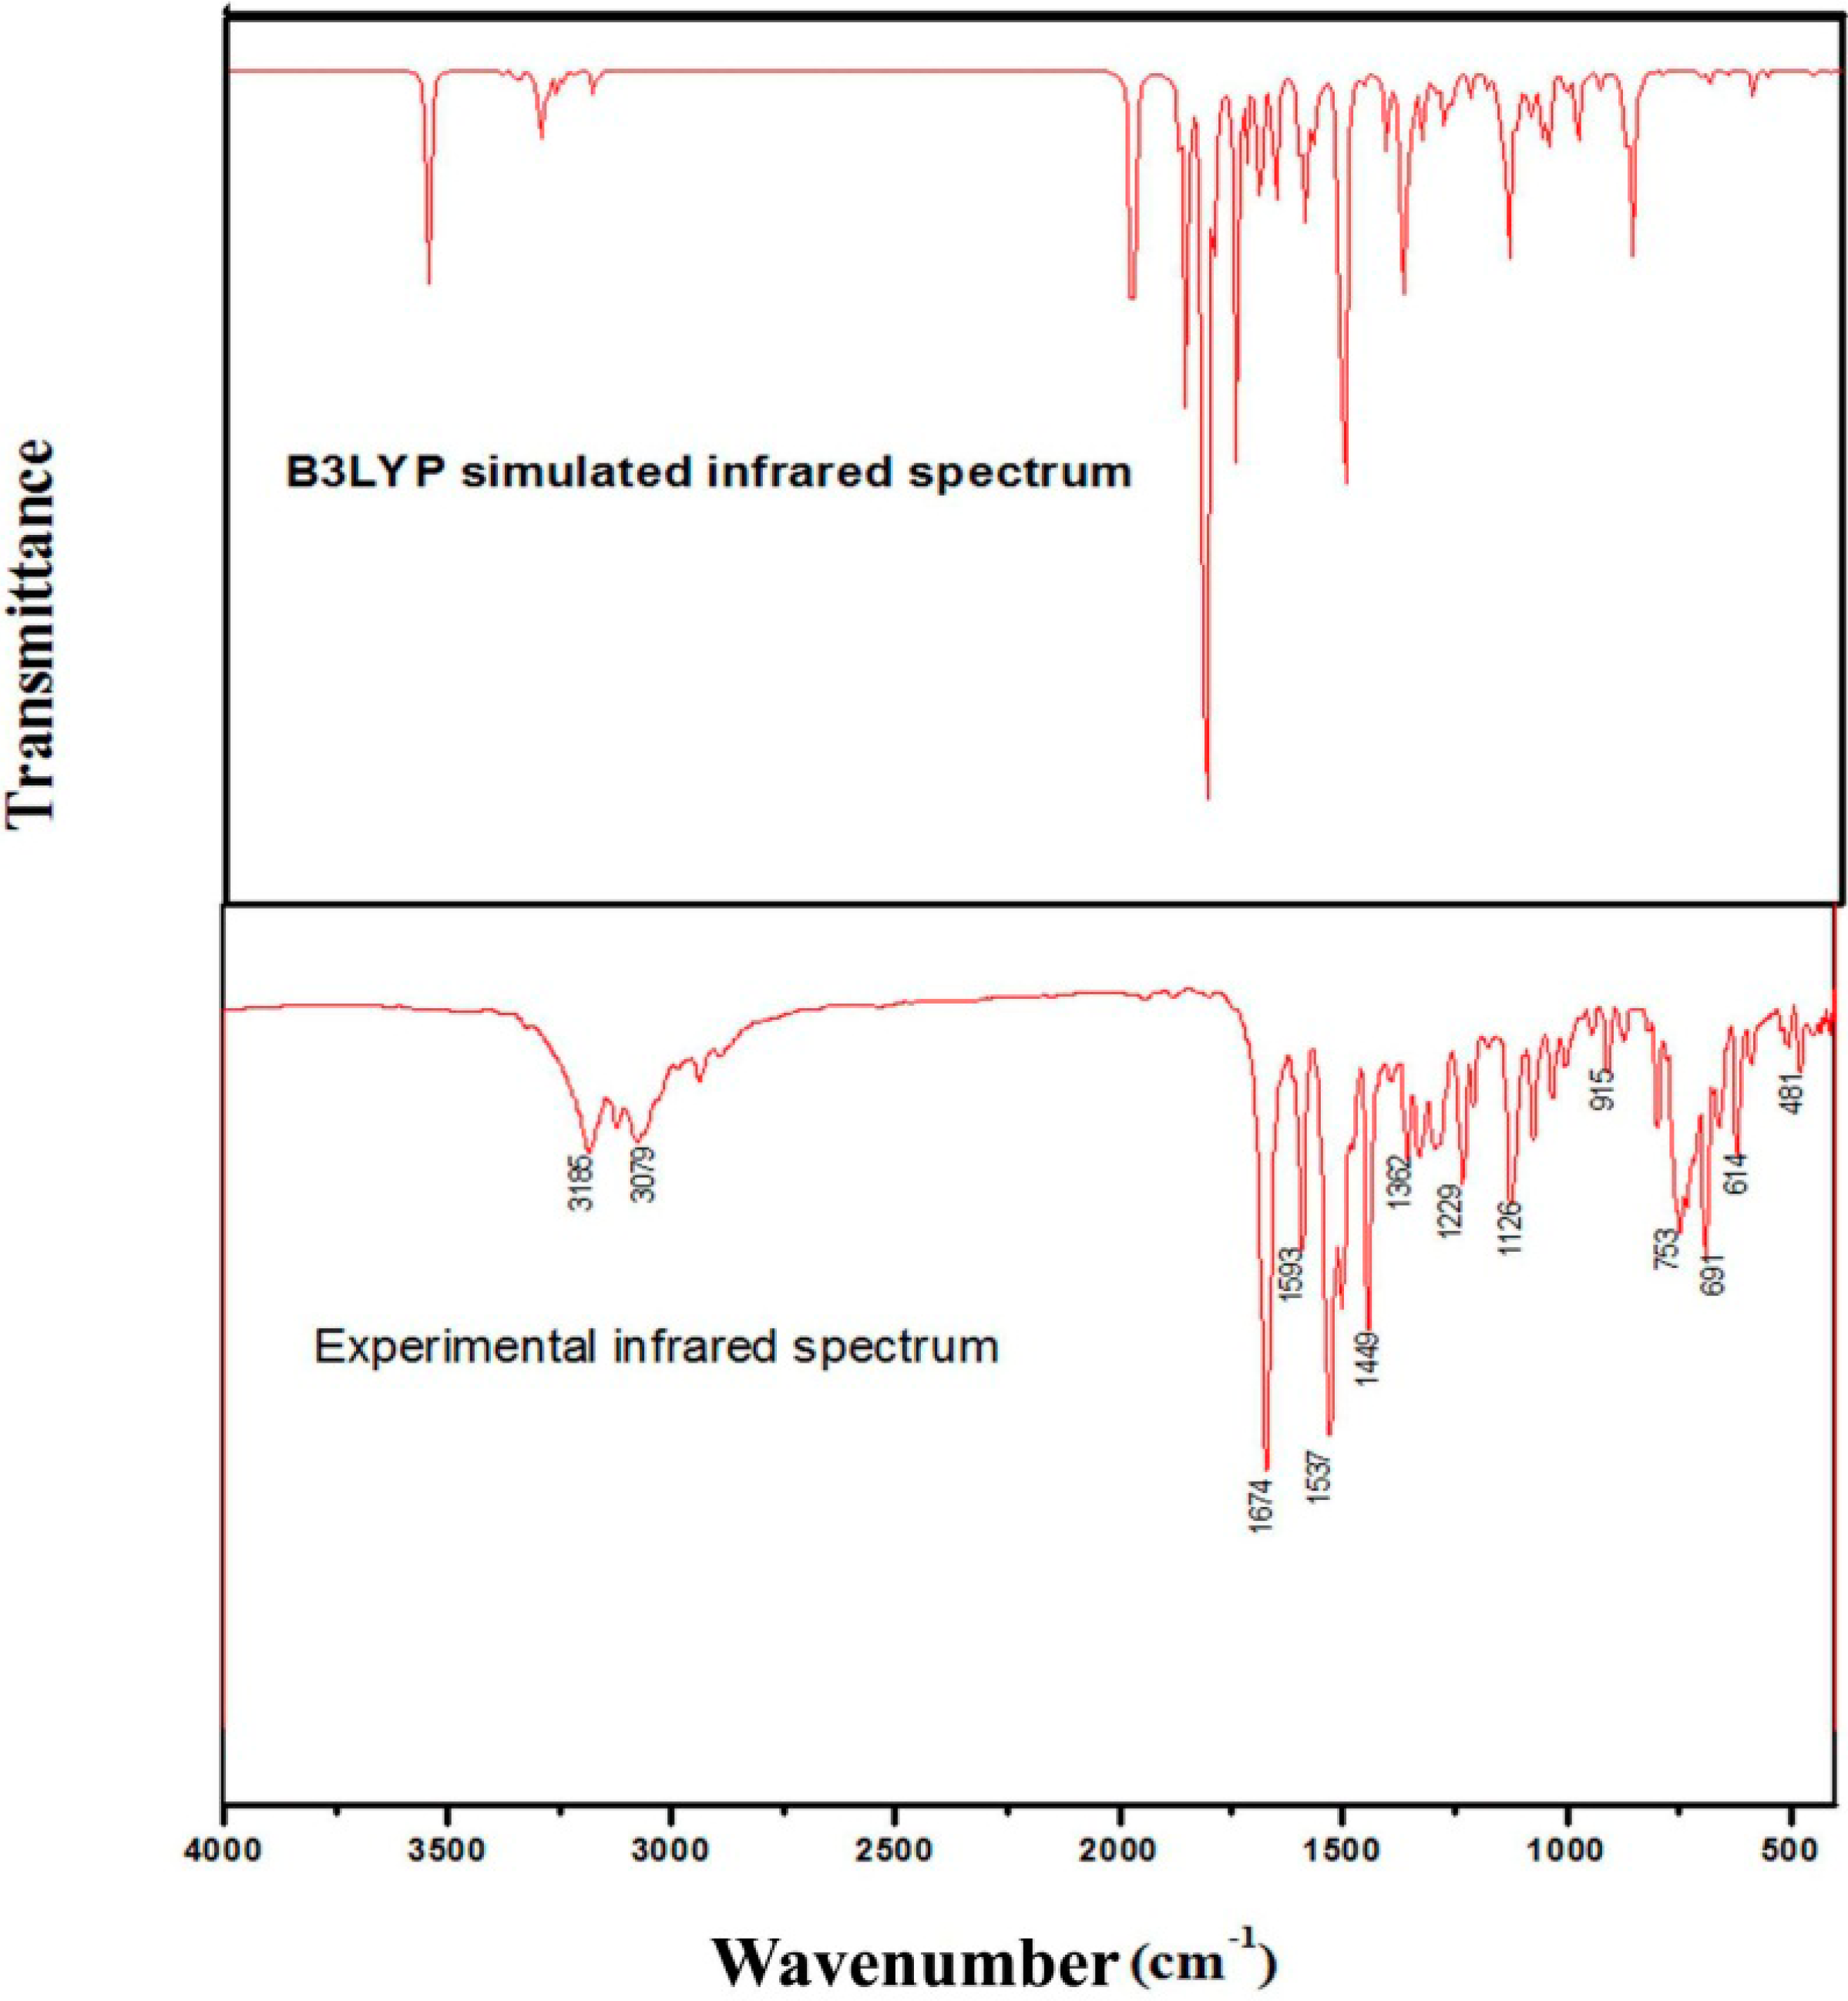
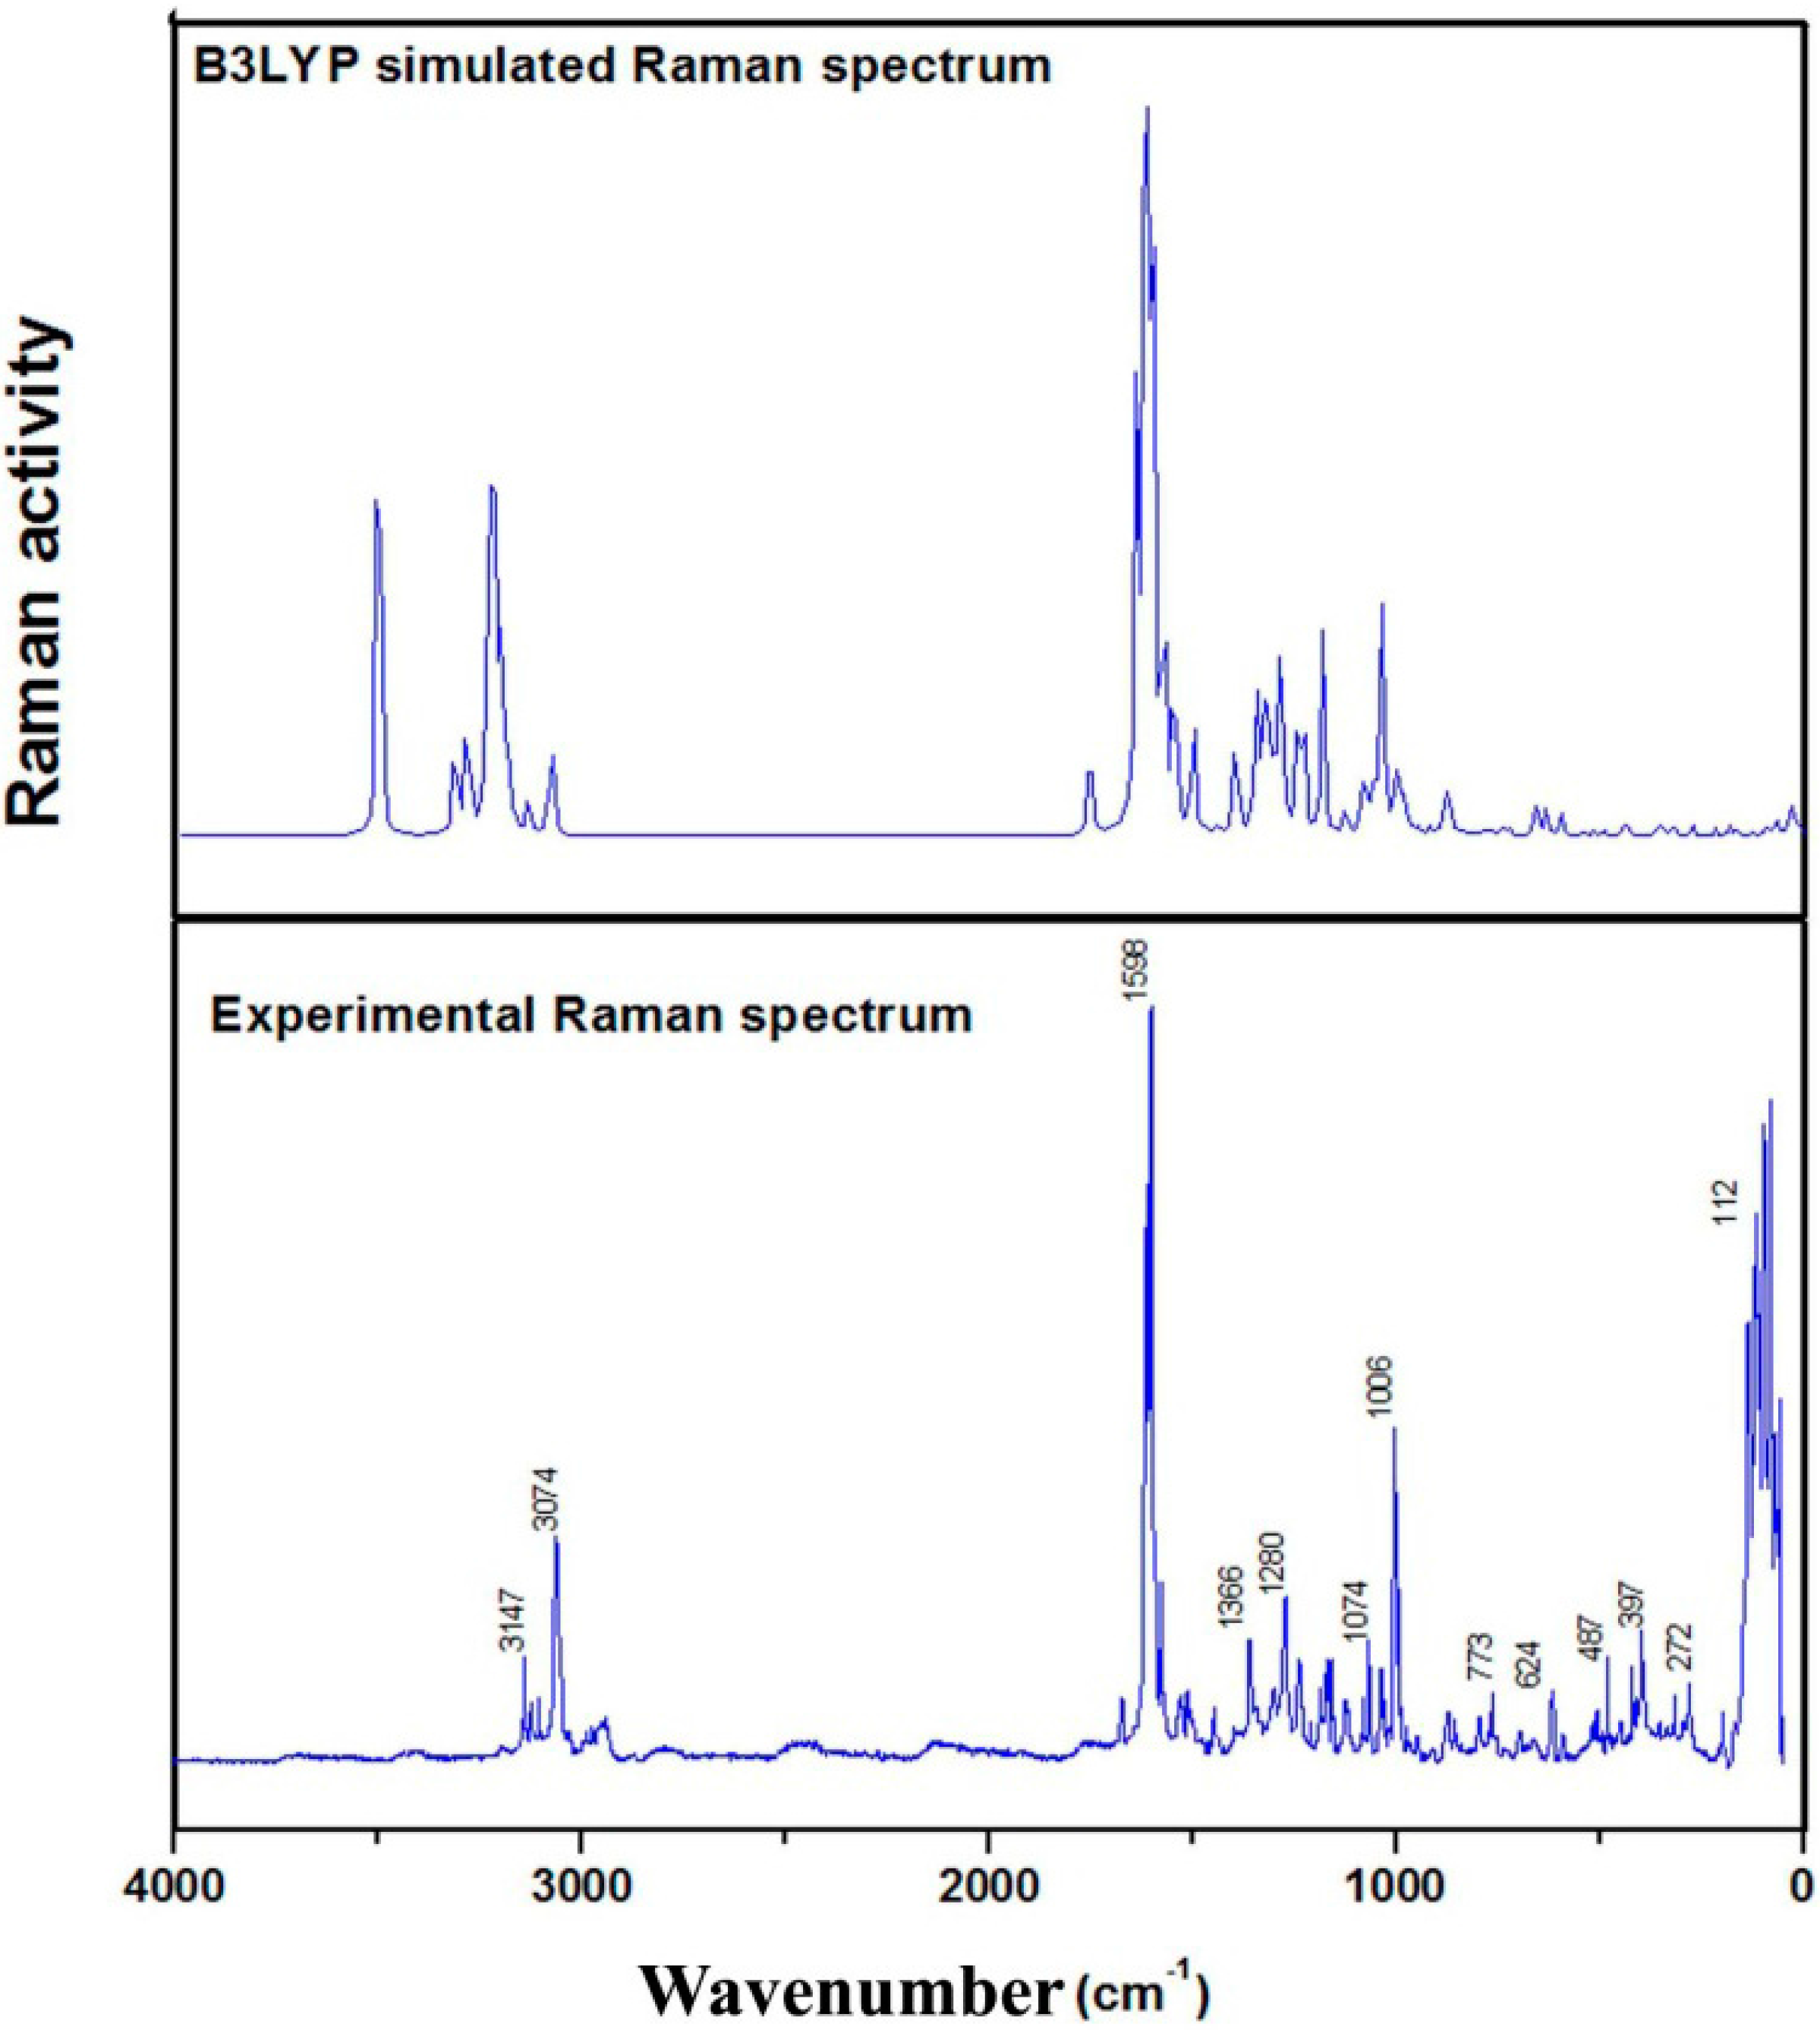
3.7.1. C–H Vibrations
3.7.2. Skeletal Vibrations
C–C Vibrations
Carbon-Oxygen Vibrations
N–H Vibrations
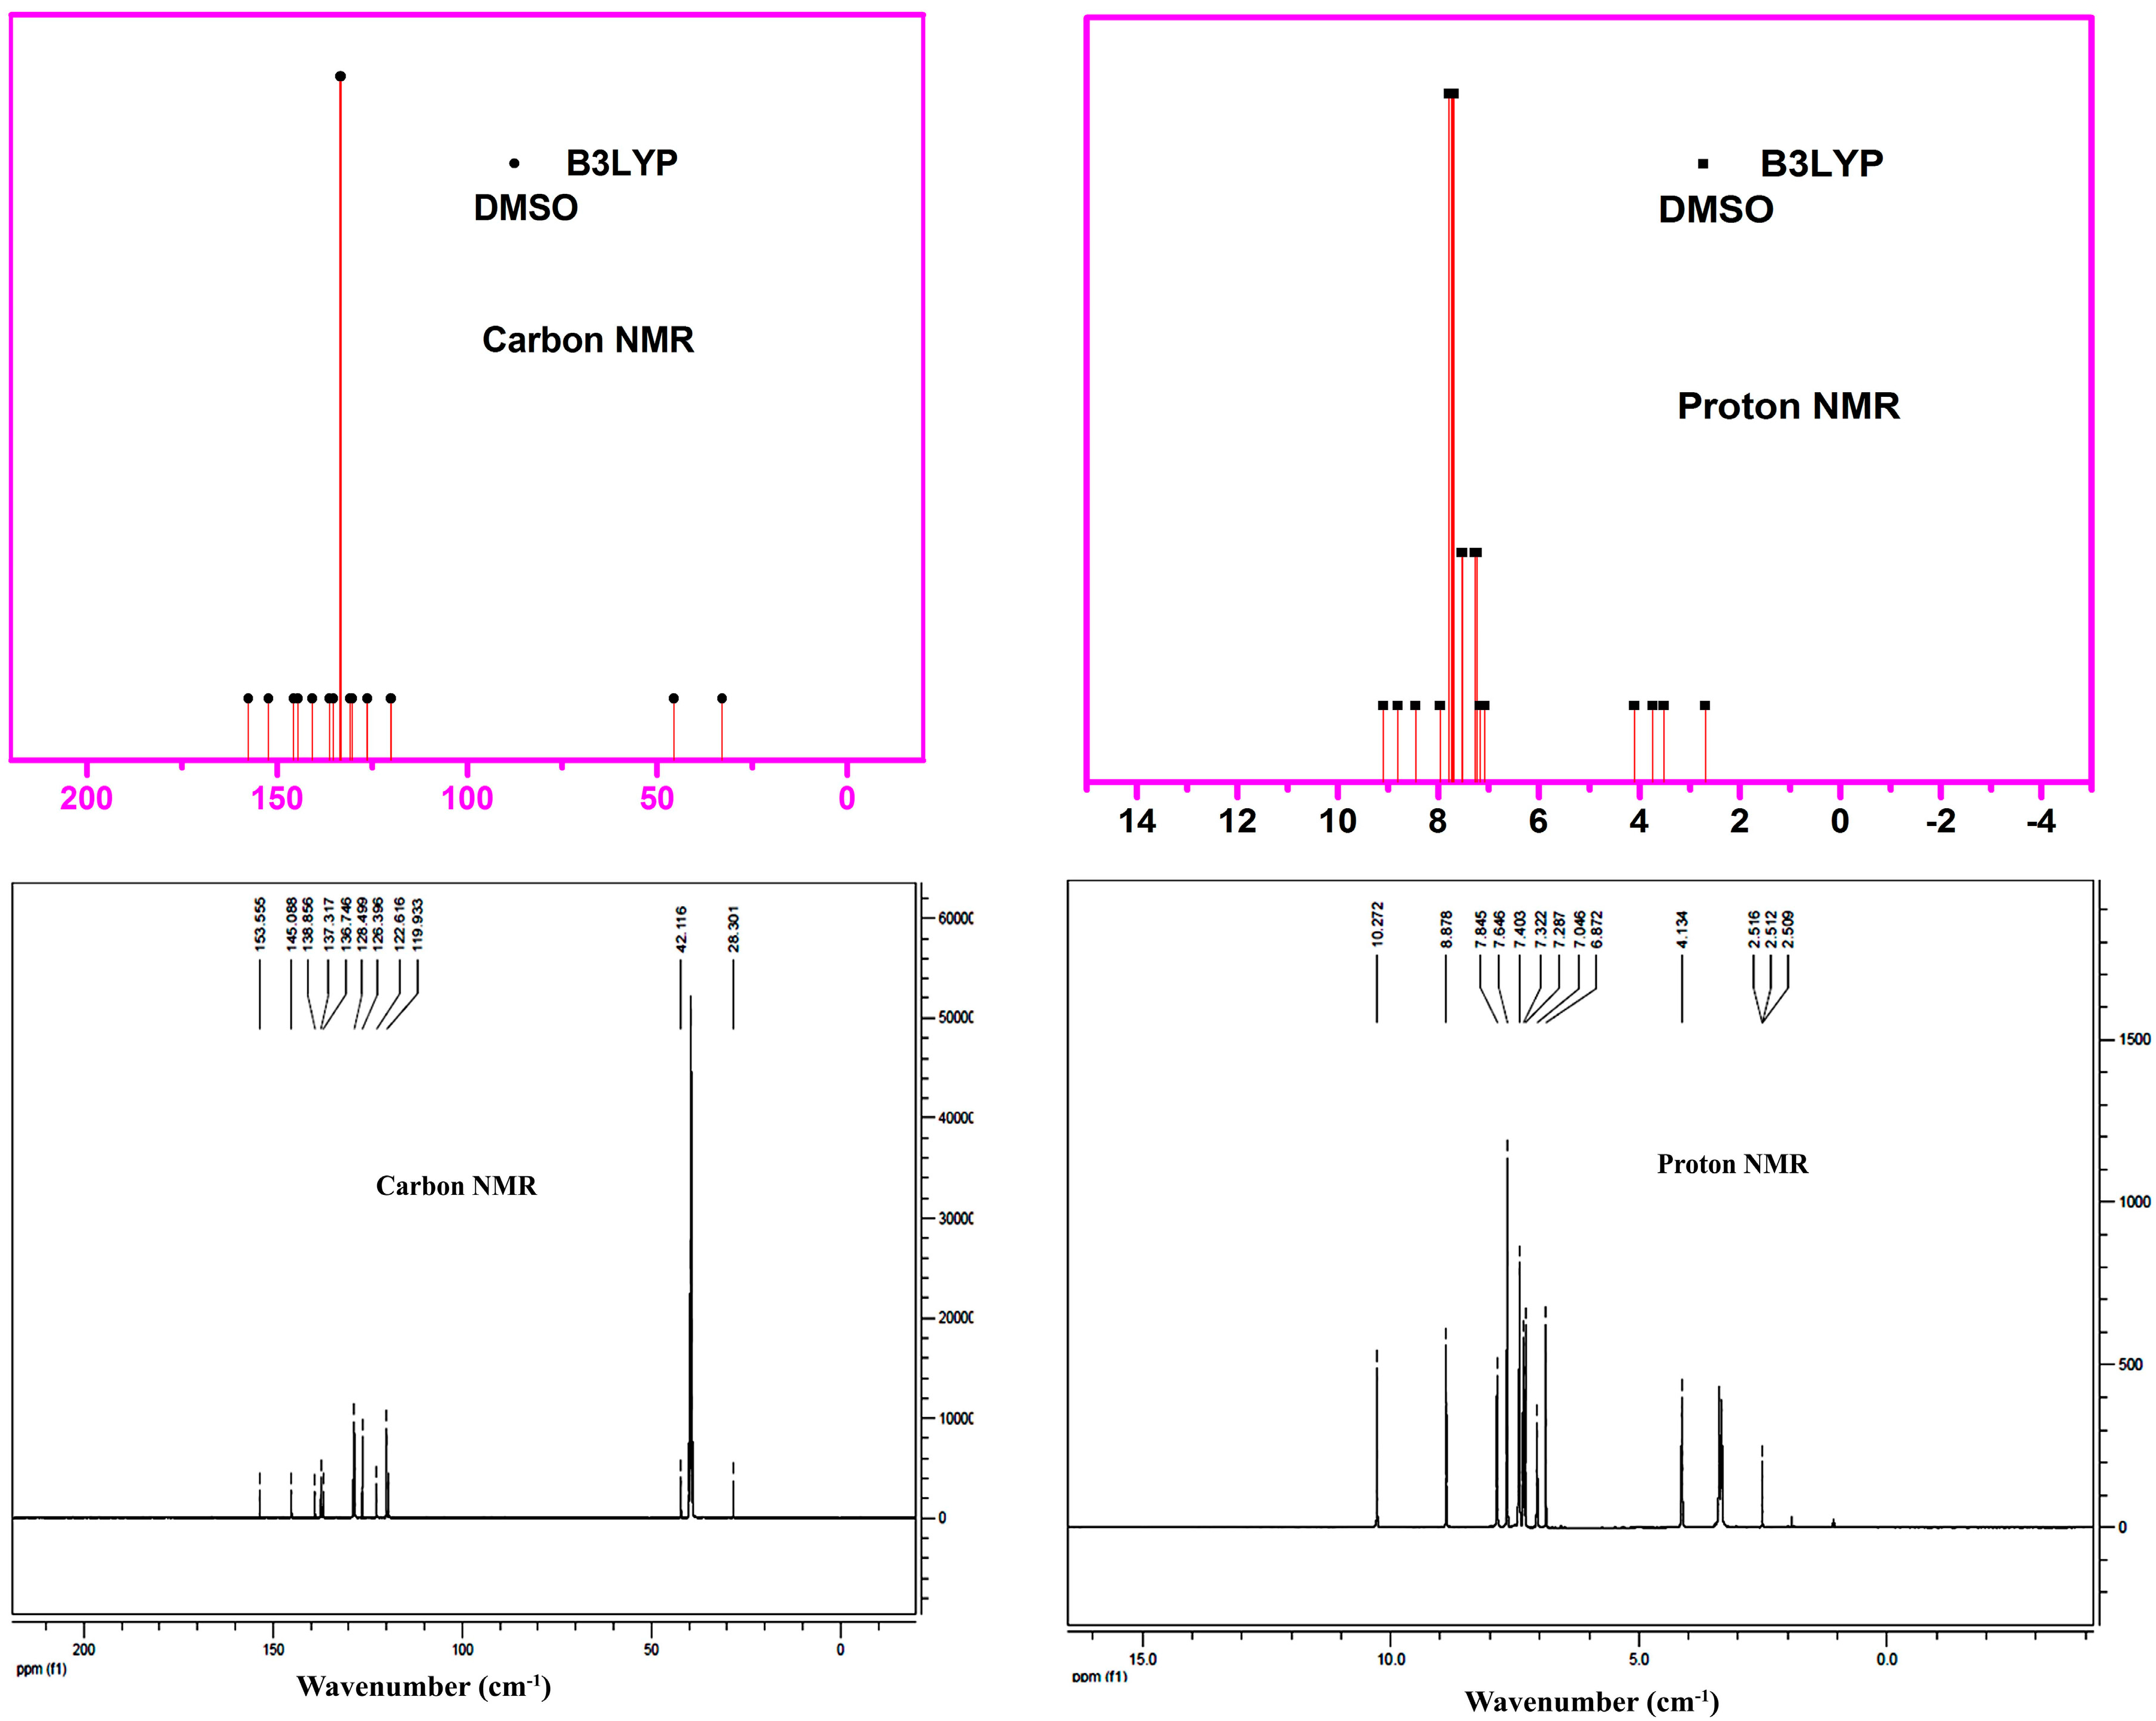
3.8. NMR Analysis
4. Conclusions
Supplementary Files
Supplementary File 1Acknowledgments
Author Contributions
Conflict of Interests
References
- Chang, B.S.; Lowenstein, D.H. Epilepsy. N. Engl. J. Med. 2003, 349, 1257–1266. [Google Scholar] [CrossRef] [PubMed]
- Meldrum, B.S.; Bruton, C.J. Epilepsy. In Greenfield’s Neuropathology; Adams, J.H., Duchen, L.W., Eds.; Oxford University Press: New York, NY, USA, 1992; pp. 1246–1283. [Google Scholar]
- Thiry, A.; Dogne, J.M.; Supuran, C.T.; Masereel, B. Carbonic anhydrase inhibitors as anticonvulsant agents. Curr. Top. Med. Chem. 2007, 7, 855–864. [Google Scholar] [CrossRef] [PubMed]
- Remi, J.; Hüttenbrenner, A.; Feddersen, B.; Noachtar, S. Carbamazepine but not pregabalin impairs eye control: A study on acute objective CNS side effects in healthy volunteers. Epilepsy Res. 2010, 88, 145–150. [Google Scholar] [CrossRef] [PubMed]
- Taylor, D.M.; Young, C.; Paton, C. Prior Antipsychotic Prescribing in Patients Currently Receiving Clozapine: A Case Note Review. J. Clin. Psychiatry 2003, 64, 30–34. [Google Scholar] [CrossRef] [PubMed]
- Kennedy, G.M.; Lhatoo, S.D. CNS adverse events associated with antiepileptic drugs. CNS Drugs 2008, 22, 739–760. [Google Scholar] [CrossRef] [PubMed]
- Penovich, P.E.; Willmore, L.J. Use of a new antiepileptic drug or an old one as first drug for treatment of absence epilepsy. Epilepsia 2009, 50, 37–41. [Google Scholar] [CrossRef] [PubMed]
- Barkmeier, D.T.; Loeb, J.A. An animal model to study the clinical significance of interictal spiking. Clin. EEG Neurosci. 2009, 40, 234–238. [Google Scholar] [CrossRef] [PubMed]
- Graziani, G.; Cazzulani, P.; Luca, C. Denzimol, a new anticonvulsant drug. II. General pharmacological activities. Arzneimittelforschung 1983, 33, 1161–1168. [Google Scholar] [PubMed]
- Dimmock, J.R.; Vashishtha, S.C.; Stables, J.P. Anticonvulsant properties of various acetylhydrazones, oxamoylhydrazones and semicarbazones derived from aromatic and unsaturated carbonyl compounds. Eur. J. Med. Chem. 2000, 35, 241–248. [Google Scholar] [CrossRef]
- Attia, M.I.; Aboul-Enein, M.N.; El-Azzouny, A.A.; Maklad, Y.A.; Ghabbour, H.A. Anticonvulsant Potential of Certain New (2E)-2-[1-aryl-3-(1H-imidazol-1-yl)propylidene]-N-(aryl/H)hydrazinecarboxamides. Sci. World J. 2014, 2014, 1–9. [Google Scholar] [CrossRef] [PubMed]
- Aboul-Enein, M.N.; El-Azzouny, A.A.; Attia, M.I.; Maklad, Y.A.; Amin, K.M.; Abdel-Rehim, M.; El-Behairy, M.F. Design and synthesis of novel stiripentol analogues as potential anticonvulsants. Eur. J. Med. Chem. 2012, 47, 360–369. [Google Scholar] [CrossRef] [PubMed]
- Aboul-Enein, M.N.; El-Azzouny, A.A.; Attia, M.I.; Saleh, O.A.; Kansoh, A.L. Synthesis and anti-candida potential of certain novel 1-[(3-substituted-3-phenyl)propyl]-1H-imidazoles. Arch. Pharm. Chem. Life Sci. 2011, 344, 794–801. [Google Scholar] [CrossRef] [PubMed]
- Attia, M.I.; Ghabbour, H.A.; El-Azzouny, A.A.; Al-Deeb, O.A.; Almutairi, M.S.; Fun, H.-K. Synthesis and single crystal X-ray structure of new (2E)-2-[3-(1H-imidazol-1-yl)-1-phenylpropylidene]-N-phenylhydrazinecarboxamide. J. Chem. 2013, 2013, 1–5. [Google Scholar] [CrossRef]
- Frisch, M.J.; Trucks, G.W.; Schlegel, H.B.; Scuseria, G.E.; Robb, M.A.; Cheeseman, J.R.; Montgomery, J.A., Jr.; Vreven, T.; Kudin, K.N.; Burant, J.C.; et al. Gaussion 03 Program; Gaussian, Inc.: Wallingford, CT, USA, 2004. [Google Scholar]
- Young, D.C. Computational Chemistry: A Practical Guide for Applying Techniques to Real World Problems (Electronic); John Wiley & Sons Inc.: New York, NY, USA, 2001. [Google Scholar]
- Karabacak, M.; Coruh, A.; Kurt, M. FT-IR, FT-Raman, NMR spectra, and molecular structure investigation of 2,3-dibromo-N-methylmaleimide: A combined experimental and theoretical study. J. Mol. Struct. 2008, 892, 125–131. [Google Scholar] [CrossRef]
- Sundaraganesan, N.; Illakiamani, S.; Saleem, H.; Wojciechowski, P.M.; Michalska, D. FT-Raman and FT-IR spectra, vibrational assignments and density functional studies of 5-bromo-2-nitropyridine. Spectrochim. Acta 2005, 61, 2995–3001. [Google Scholar] [CrossRef] [PubMed]
- Dennington, R.I.; Keith, T.; Millam, J.; Eppinnett, K.; Hovell, W.; Gilliland, R. Gauss View Version 3.09; Semichem, Inc.: Shawnee Mission, KS, USA, 2003. [Google Scholar]
- Fleming, I. Frontier Orbitals and Organic Chemical Reactions; Wiley: London, UK, 1976. [Google Scholar]
- O’Boyle, N.M.; Tenderholt, A.L.; Langer, K.M. cclib: A library for package-independent computational chemistry algorithms. J. Comput. Chem. 2008, 29, 839–845. [Google Scholar] [CrossRef] [PubMed]
- Krishnakumar, V.; Xavier, R.J. Normal coordinate analysis of 2-mercapto and 4,6-dihydroxy-2-mercapto pyrimidines. Indian J. Pure Appl. Phys. 2003, 41, 597–601. [Google Scholar]
- Dollish, F.R.; Fateley, W.G.; Bentley, F.F. Characteristic Raman Frequencies of Organic Compounds; Wiley: New York, NY, USA, 1997. [Google Scholar]
- Varsanyi, G. Vibrational Spectra of Benzene Derivatives; Academic Press: New York, NY, USA, 1969. [Google Scholar]
- Srivastava, A.; Singh, V.B. Theoretical and experimental studies of vibrational spectra of naphthalene and its cation. Indian J. Pure Appl. Phys. 2007, 45, 714–720. [Google Scholar]
- Lin-Vien, D.; Colthup, N.B.; Fateley, W.G.; Grasselli, J.G. The Handbook of Infrared Raman Characteristic Frequencies of Organic Molecules; Academic Press: Boston, MA, USA, 1991. [Google Scholar]
- Karabacak, M.; Karaca, C.; Atac, A.; Eskici, M.; Karanfil, A.; Kose, E. Synthesis, analysis of spectroscopic and nonlinear optical properties of the novel compound:(S)-N-benzyl-1-phenyl-5-(thiophen-3-yl)-4-pentyn-2-amine. Spectrochim. Acta A 2012, 97, 556–567. [Google Scholar] [CrossRef] [PubMed]
- Sourisseau, C.; Maraval, P. Optical and resonance Raman scattering study of two “bisazo” pigments derived from substituted benzene-2′-azonaphthols. J. Raman Spectrosc. 1994, 25, 477–488. [Google Scholar] [CrossRef]
- Barnes, A.J.; Majid, M.A.; Stuckey, M.A.; Gregory, P.; Stead, C.V. The resonance Raman spectra of Orange II and Para Red: Molecular structure and vibrational assignment. Spectrochim. Acta A 1985, 41, 629–635. [Google Scholar] [CrossRef]
- Silverstein, R.M.; Webster, F.X. Spectrometric Identification of Organic Compounds, 6th ed.; John Wiley, Inc.: New York, NY, USA, 2003. [Google Scholar]
- Karabacak, M.; Kurt, M. The spectroscopic (FT-IR and FT-Raman) and theoretical studies of 5-bromo-salicylic acid. J. Mol. Struct. 2009, 919, 215–222. [Google Scholar] [CrossRef]
© 2015 by the authors; licensee MDPI, Basel, Switzerland. This article is an open access article distributed under the terms and conditions of the Creative Commons Attribution license (http://creativecommons.org/licenses/by/4.0/).
Share and Cite
Govindarajan, M.; Abdelhameed, A.S.; Al-Saadi, A.A.; Attia, M.I. Experimental and Theoretical Studies of the Vibrational and Electronic Properties of (2E)-2-[3-(1H-imidazol-1-yl)-1-phenyl-propylidene]-N-phenylhydrazinecarboxamide: An Anticonvulsant Agent. Appl. Sci. 2015, 5, 955-972. https://doi.org/10.3390/app5040955
Govindarajan M, Abdelhameed AS, Al-Saadi AA, Attia MI. Experimental and Theoretical Studies of the Vibrational and Electronic Properties of (2E)-2-[3-(1H-imidazol-1-yl)-1-phenyl-propylidene]-N-phenylhydrazinecarboxamide: An Anticonvulsant Agent. Applied Sciences. 2015; 5(4):955-972. https://doi.org/10.3390/app5040955
Chicago/Turabian StyleGovindarajan, Munusamy, Ali S. Abdelhameed, Abdulaziz A. Al-Saadi, and Mohamed I. Attia. 2015. "Experimental and Theoretical Studies of the Vibrational and Electronic Properties of (2E)-2-[3-(1H-imidazol-1-yl)-1-phenyl-propylidene]-N-phenylhydrazinecarboxamide: An Anticonvulsant Agent" Applied Sciences 5, no. 4: 955-972. https://doi.org/10.3390/app5040955
APA StyleGovindarajan, M., Abdelhameed, A. S., Al-Saadi, A. A., & Attia, M. I. (2015). Experimental and Theoretical Studies of the Vibrational and Electronic Properties of (2E)-2-[3-(1H-imidazol-1-yl)-1-phenyl-propylidene]-N-phenylhydrazinecarboxamide: An Anticonvulsant Agent. Applied Sciences, 5(4), 955-972. https://doi.org/10.3390/app5040955