Communication

The Preparation and Application of Dendrimer Modified CdTe/CdS Near Infrared Quantum Dots for Brain Cancer Cells Imaging

1
Department of Neurology, Pudong People’s Hospital, Shanghai 201299, China
2
Department of Radiology, Pudong People’s Hospital, Shanghai 201299, China
*
Author to whom correspondence should be addressed.
Appl. Sci. 2015, 5(4), 1076-1085; https://doi.org/10.3390/app5041076
Submission received: 26 August 2015 / Revised: 25 October 2015 / Accepted: 27 October 2015 / Published: 10 November 2015
(This article belongs to the Section Nanotechnology and Applied Nanosciences)

Abstract

:
The most notable obstacle of brain cancer diagnosis is the inability of delivering imaging agents across the blood-brain barrier (BBB). Recently, quantum dots (QDs) has been demonstrated as an ideal image agent for brain imaging due to their ultra-small size for crossing BBB. The plolyamidoamine dendrimers modified CdTe/CdS core/shell near-infrared (NIR) region QDs was successfully synthesized in aqueous solution, and then was characterized by UV-vis absorption, photoluminescence (PL) spectroscopy, dynamic light scattering (DLS), X-ray powder diffraction (XRD) and high-resolution transmission electron microscopy (HR-TEM), etc. Our results reveal that the dendrimers modified CdTe/CdS QDs exhibits good water-dispersity and stable NIR fluorescence in various biological environments. In addition, this NIR QDs demonstrates a good biocompatibility and sensitive photoluminescence responses in brain tumor cell imaging. In a word, this type of dendrimers modified NIR CdTe/CdS QDs has huge potential applications in brain imaging.

1. Introduction

As for brain imaging diagnosis, both magnetic resonance imaging (MRI) and positron emission tomography (PET) are the current gold standard imaging methods for brain cancer, but the functional mapping information on the human brain has not been not fully accumulated [1]. Furthermore, experimental environments for PET and MRI studies are quite different from the daily one, and most patients find this is stressful. Therefore, a new neuroimaging technique that is completely noninvasive and does not require strict motion restriction is desirable.
Near infrared (NIR) optical imaging, as a noninvasive optical technique, has emerged as an attractive imaging technology for brain imaging [2]. Previous studies revealed that the NIR molecule Cy5.5 were injected to rats, and the NIR imaging was perfectly companied with the size of true tumor after surgical exposure [3]. However, the NIR fluorescence of Cy5.5 is not stable in a biologically environment which is easy to bleach or dye in vivo. Compared with organic molecule, NIR QDs is more suitable for NIR optical in vivo imaging due to their unique optical advantages such as higher photoluminescence and photostability [3]. Moreover, the size of NIR QDs is normally less than 10 nm, which is enough small to cross the BBB [3,4].
To date, a number of NIR-emitting QDs, such as CdTe/CdS [5], CdHgTe [6], CdTeS [7] and CdTeSe [8] QDs, have been successfully synthesized. Recently, some studies reported the directly using dendrimer as a capping agent for preparing QDs could prevent QDs from further aggregation in water phrase [9,10]. Furthermore, dendrimer modified QDs enable to decrease the release of metal ions from this organic and inorganic hybrid architecture in biological environments [11].
In this study, the one-pot water-phrase synthesis of hybrid nanocomposites constituted by CdTe/CdS NIR QDs and different generations (from 3 up to 5) of plolyamidoamine dendrimers is presented. Moreover, the feasibility of using this nanocomposite as an imaging agent for labeling brain tumor cells is also assessed in vitro.

2. Materials and Methods

2.1. Materials

Polypropylenimine dendrimer (generations 3 to 5), CdCl2 (99%), Tellurium and selenium powder (99%) and NaBH4 were purchased from sigma Aldrich. Milli-Q water (Millipore, Mississauga, ON, Canada) was used as the solvent for all solutions.

2.2. Preparation of CdTe/CdS Core/Shell QDs

Dendrimer of different generations (Gn = 3–5) (10.0 mg) were dissolved in 20.0 mL in deionised water and stirred for 24 h. CdTe/CdS QDs were prepared in aqueous solution by a modified previous method. Typically, dendrimer was added to a N2-saturated 2.5 mM CdCl2 solution, followed by adjustment to the desired pH value (about 11) by the addition of 5 M NaOH solution. Then the precursor solution was subjected to microwave irradiation at 120 °C for about 2 min. Then, a portion of concentrated CdTe core QDs solution was mixed with a N2-saturated CdS precursor solution. The mixed solution was subjected to microwave irradiation at 100 °C.

2.3. Structural and Optical Characterizations

TEM and HR-TEM images were recorded from a JEOL-3010 electron microscope (JEOL, Tokyo, Japan). Zeta potential and size distribution of our freshly prepared QDs in water solution measured by Nano ZS (Malvern, Worcestershire, UK). QDs powder (Christ Alpha, Shanghai, China) was used for XRD samples. UV-vis absorption spectra, PL spectra and Lifetime measurements were recorded using a Lambda 950 UV-vis spectrophotometer (Perkin Elmer, Wokingham, UK), F-4500 fluorescence spectrofluorimeter (Hitachi, Tokyo, Japan) and FL920-fluorescence lifetime spectrometer (Edinburgh Instruments, Edinburgh, UK), respectively.
For determination the fluorescence stability of dendrimer modified QDs, 1.0 mL dendrimer modified CdTe/CdS QDs solution and different amount of test solutions were sequentially added into test tubes, then diluted to the mark with water and mixed thoroughly. The resulting solutions were used to monitor the change of emission fluorescence intensity by means of spectrofluorimeter.

2.4. Cell Viability and Proliferation Assays

Human embryonic kidney cell line (HEK 293T), human brain cancer cell line (U251) and human gastric epithelial cell line (GES-1) were seeded at a density of 1 × 10⁴ cells per well in the 96-well plates, and then added with 50 μL of PBS and various concentrations (0.5 nM, 5 nM and 50 nM) of GSH-CdTe/CdSe QDs. After the additional 24 h and 48 h incubation, cell survivals were measured using a tetrazolium salt MTT assay. Fresh growth medium (180 μL) and MTT (20 μL, 5 mg·mL−1) solution were added to each well. The plate was incubated for 4 h, and then 200 μL of dimethyl sulphoxide (DMSO) was added to each well to dissolve the purple formazan crystals. Finally, the absorbance at 492 nm of each well was measure.

2.5. Cell Imaging

Human brain cancer U251 cells were plated at a density of 5 × 10⁵ cells per well in three 24-well plates with a glass cover slip bottom and incubated for 12 h at 37 °C with 5% CO2. Dendrimer modified CdTe/CdS QDs were subsequently added to the wells for incubation 24 h at 37 °C. Then, these cells were fixed by 5% paraformaldehyde and stained with 4,6-diamidino-2-phenylindole (DAPI). The cell imaging was analyzed by using an inverted confocal microscope (Leica TCS SP2 AOBS, CNSI, Heidelberg, Germany).

3. Results and Discussion

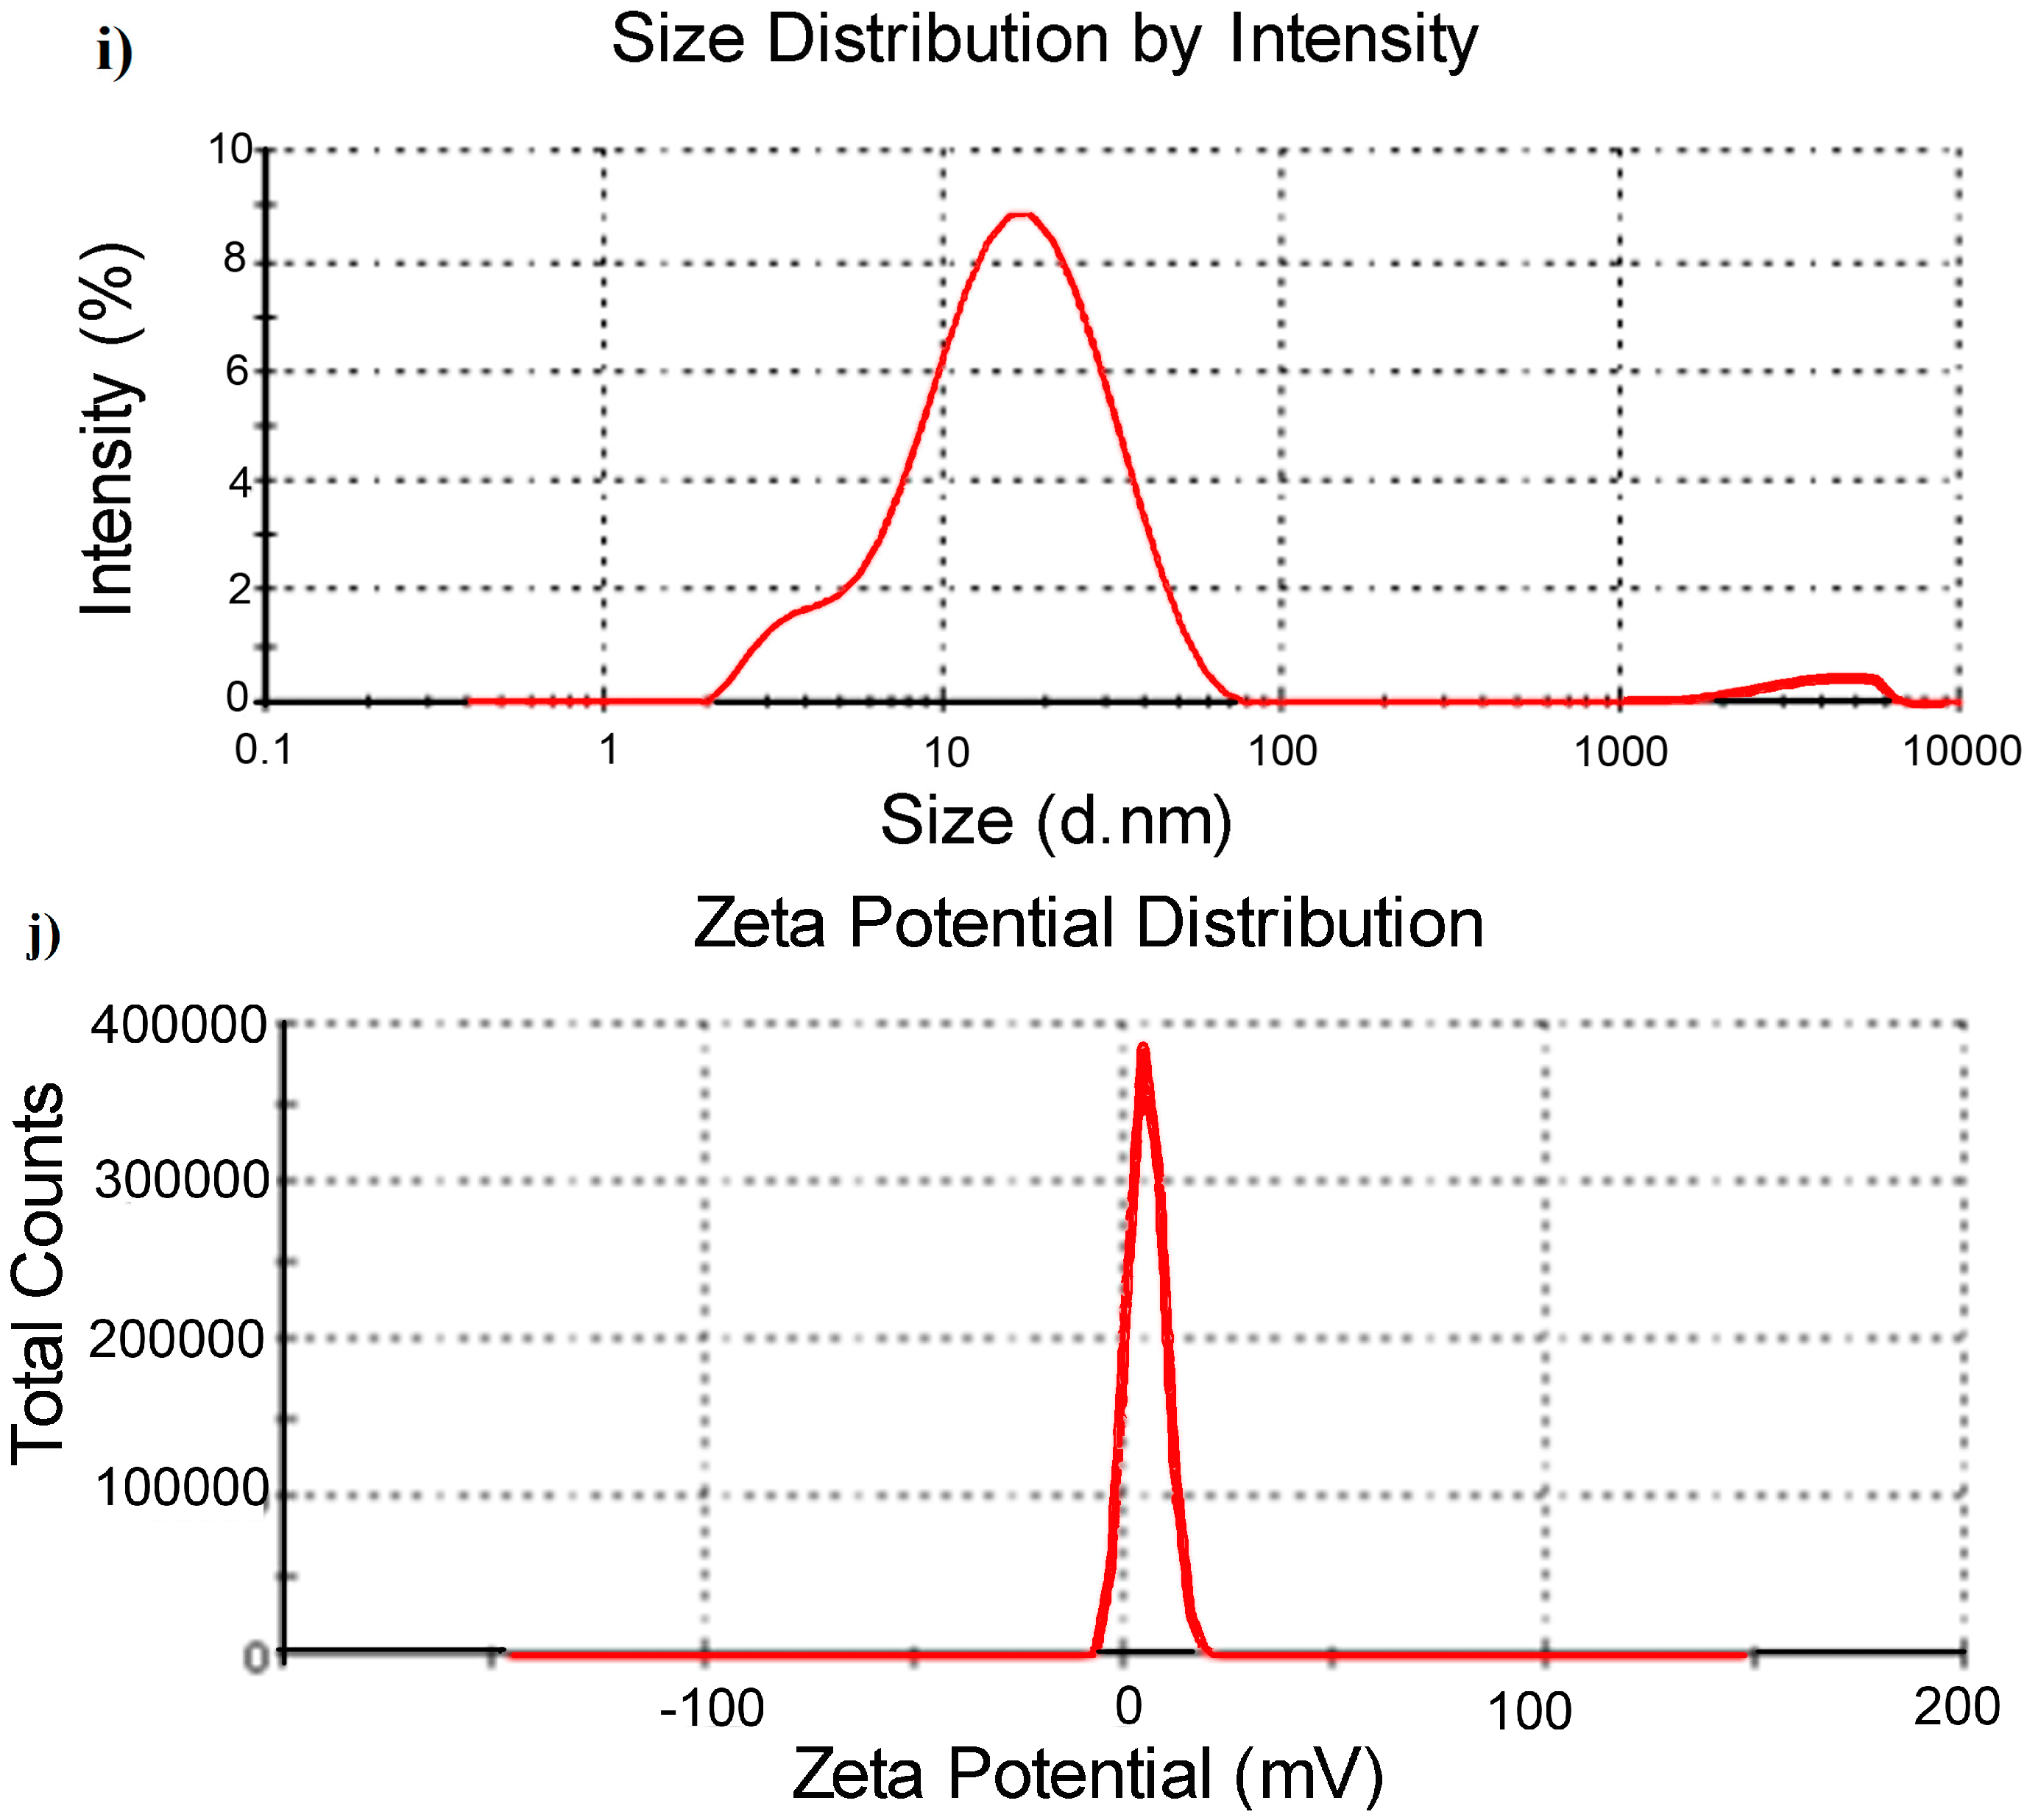
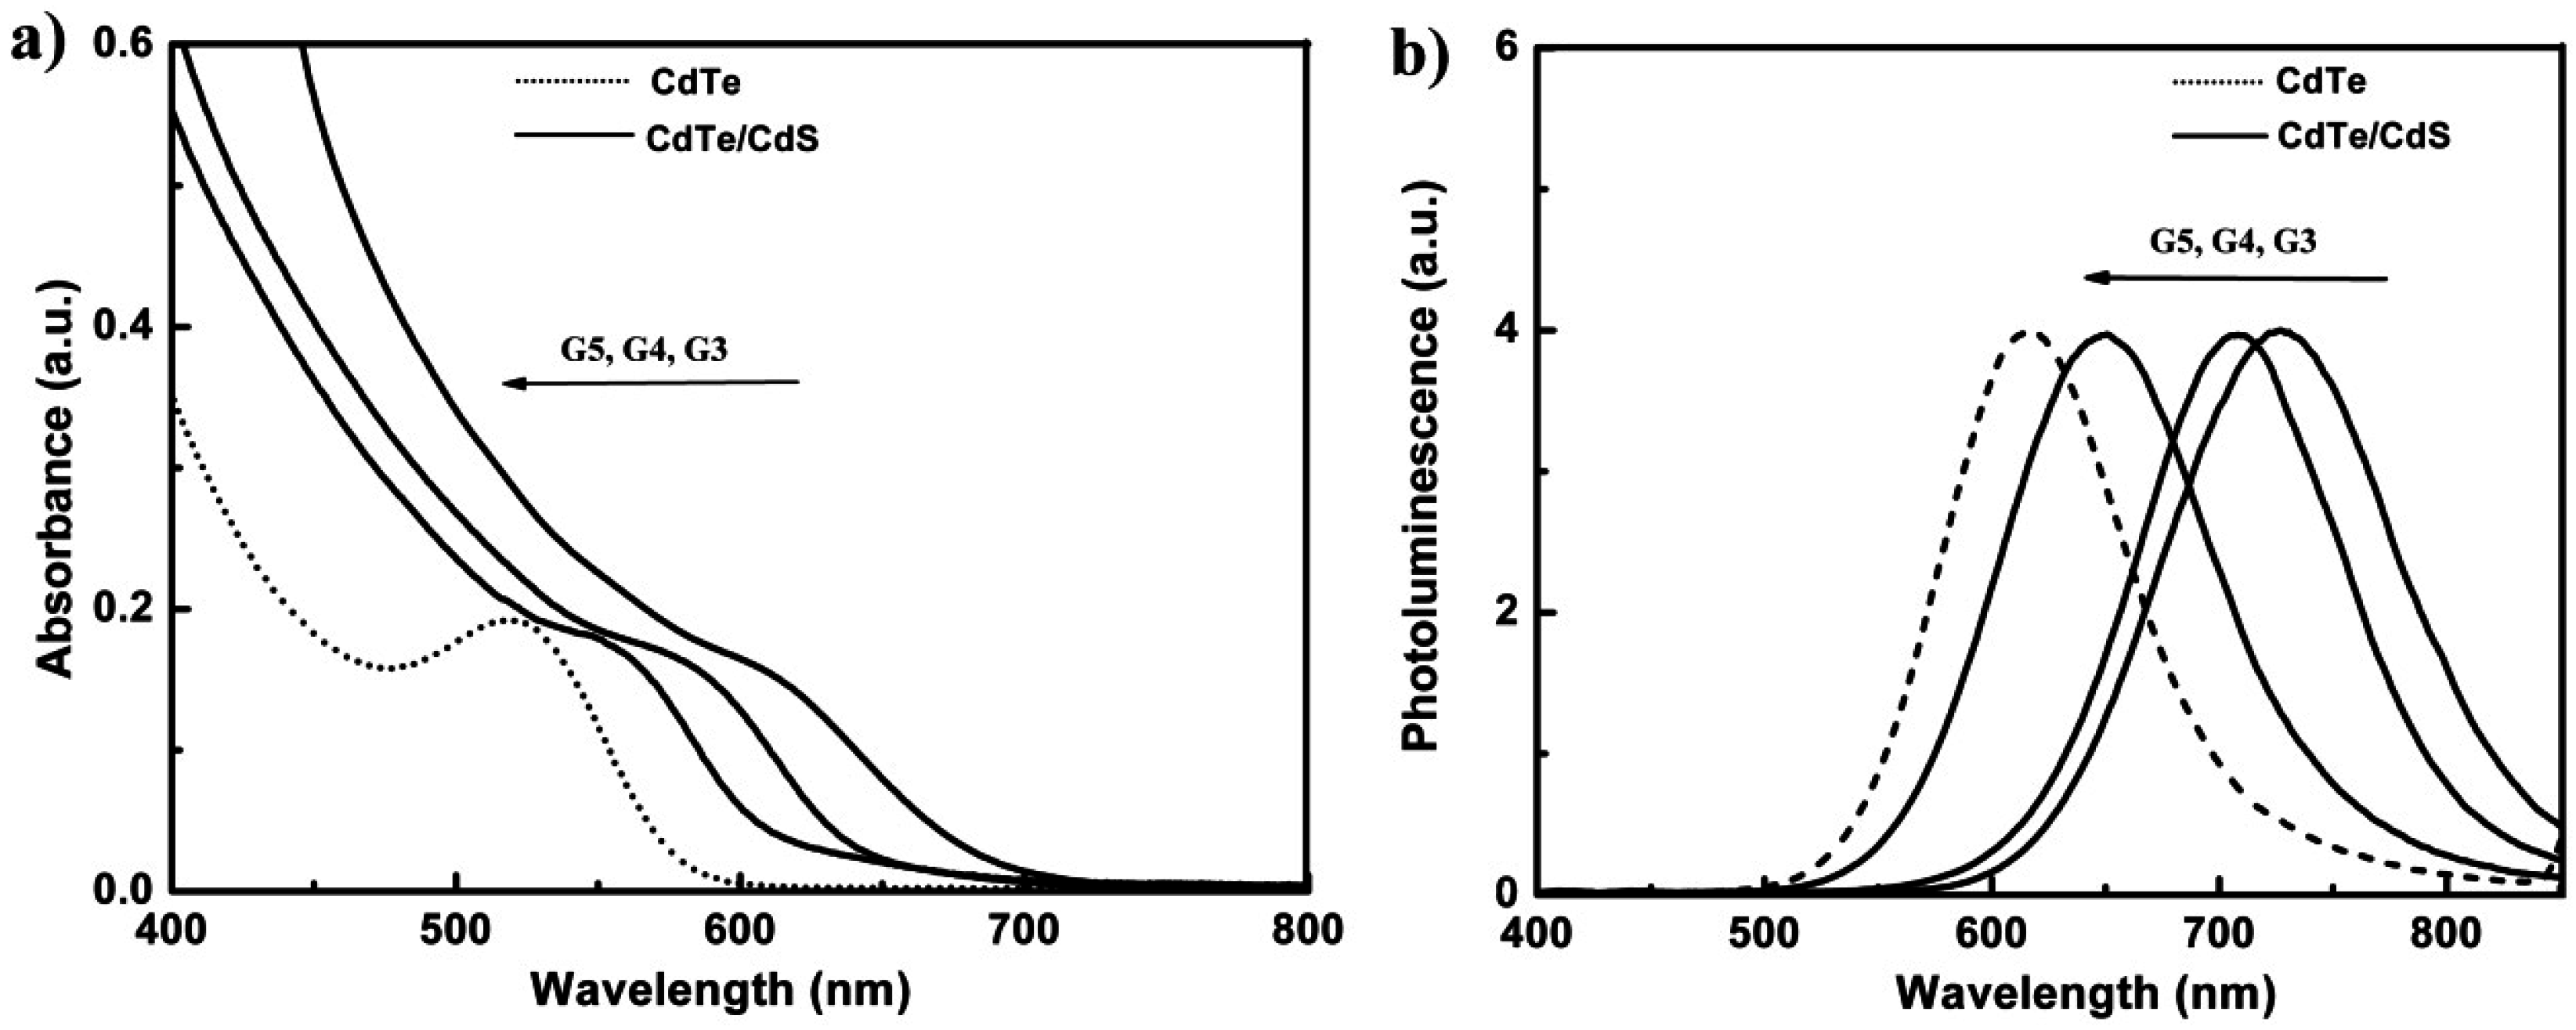
3.1. Characterization of Dendrimer Modified CdTe/CdS QDs

Figure 1 shows the TEM and HR-TEM images of the CdTe core (Figure 1a,b) and dendrimer modified CdTe/CdS core/shell (Figure 1d,e) QDs, which both the CdTe and dendrimer modified CdTe/CdS QDs displayed good dispersibility and water-solubility. As shown in Figure 1c,f, the average size of the CdTe and dendrimer modified CdTe/CdS QDs is about 3.25 ± 0.2 nm and 4.05 ± 0.3 nm, respectively. Figure 1g shows the powder XRD pattern of the CdTe core and dendrimer modified CdTe/CdS core/shell QDs, and the XRD of CdTe/CdS QDs is matched previous reported results. Moreover, these main diffraction peaks of (111), (220) and (311) crystal plane also were indicated in SAED patterns (shown in Figure 1h). The hydro diameter and zeta potential of our products are shown in Figure 1i,j, which is about 20.3 nm and +9.73 eV, respectively.
Figure 1. (a) Transmission electron microscopy (TEM) and (b) high-resolution (HR)-TEM images of CdTe QDs; (c) size distribution analysis of CdTe quantum dots (QDs); (d) TEM and (e) HR-TEM of dendrimer modified CdTe/CdS QDs; (f) size distribution analysis of dendrimer modified CdTe/CdS QDs; (g) X-ray powder diffraction (XRD) diffraction patterns of CdTe QDs and dendrimer modified CdTe/CdS QDs; (h) Selected area electron diffraction (SAED) pattern of dendrimer modified CdTe/CdS QDs; (i) zeta potential and (j) hydro diameter distribution of freshly prepared QDs.
Applsci 05 01076 g001aApplsci 05 01076 g001b
Figure 2. (a) UV-vis and Photoluminescence spectra of CdTe (dashed line) and CdTe/CdS QDs modified with different generations of dendrimer (solid lines); (b) Fluorescence decay curves of a CdTe core (dashed line) and CdTe/CdS QDs modified with different generations of dendrimer (solid lines).
Applsci 05 01076 g002
As shown in Figure 2a, in the UV-vis absorption spectrum, there is a blue shift of the absorption band as the generation of the dendrimer is increased. The absorption shift that is observed for the different generations of dendrimers confirms that the amine groups are participating with dendrimers in the capping of the QDs. In the PL spectrum, the CdTe QDs exhibited emission at 562 nm with the excitation wavelength set of 365 nm. Compared to CdTe QDs, the emission wavelength of dendrimer modified core/shell CdTe/CdS QDs shifted to 650 nm which has been taken as a feature of QDs with spatial separated charge carriers [12]. Furthermore, the excitoinc peak of the core/shell CdTe/CdS QDs shifted to shorter wavelength companying with increasing the generations of dendrimers. This phenomenon of blue shift in emission peak is consistent with the known theory of quantum size effects.

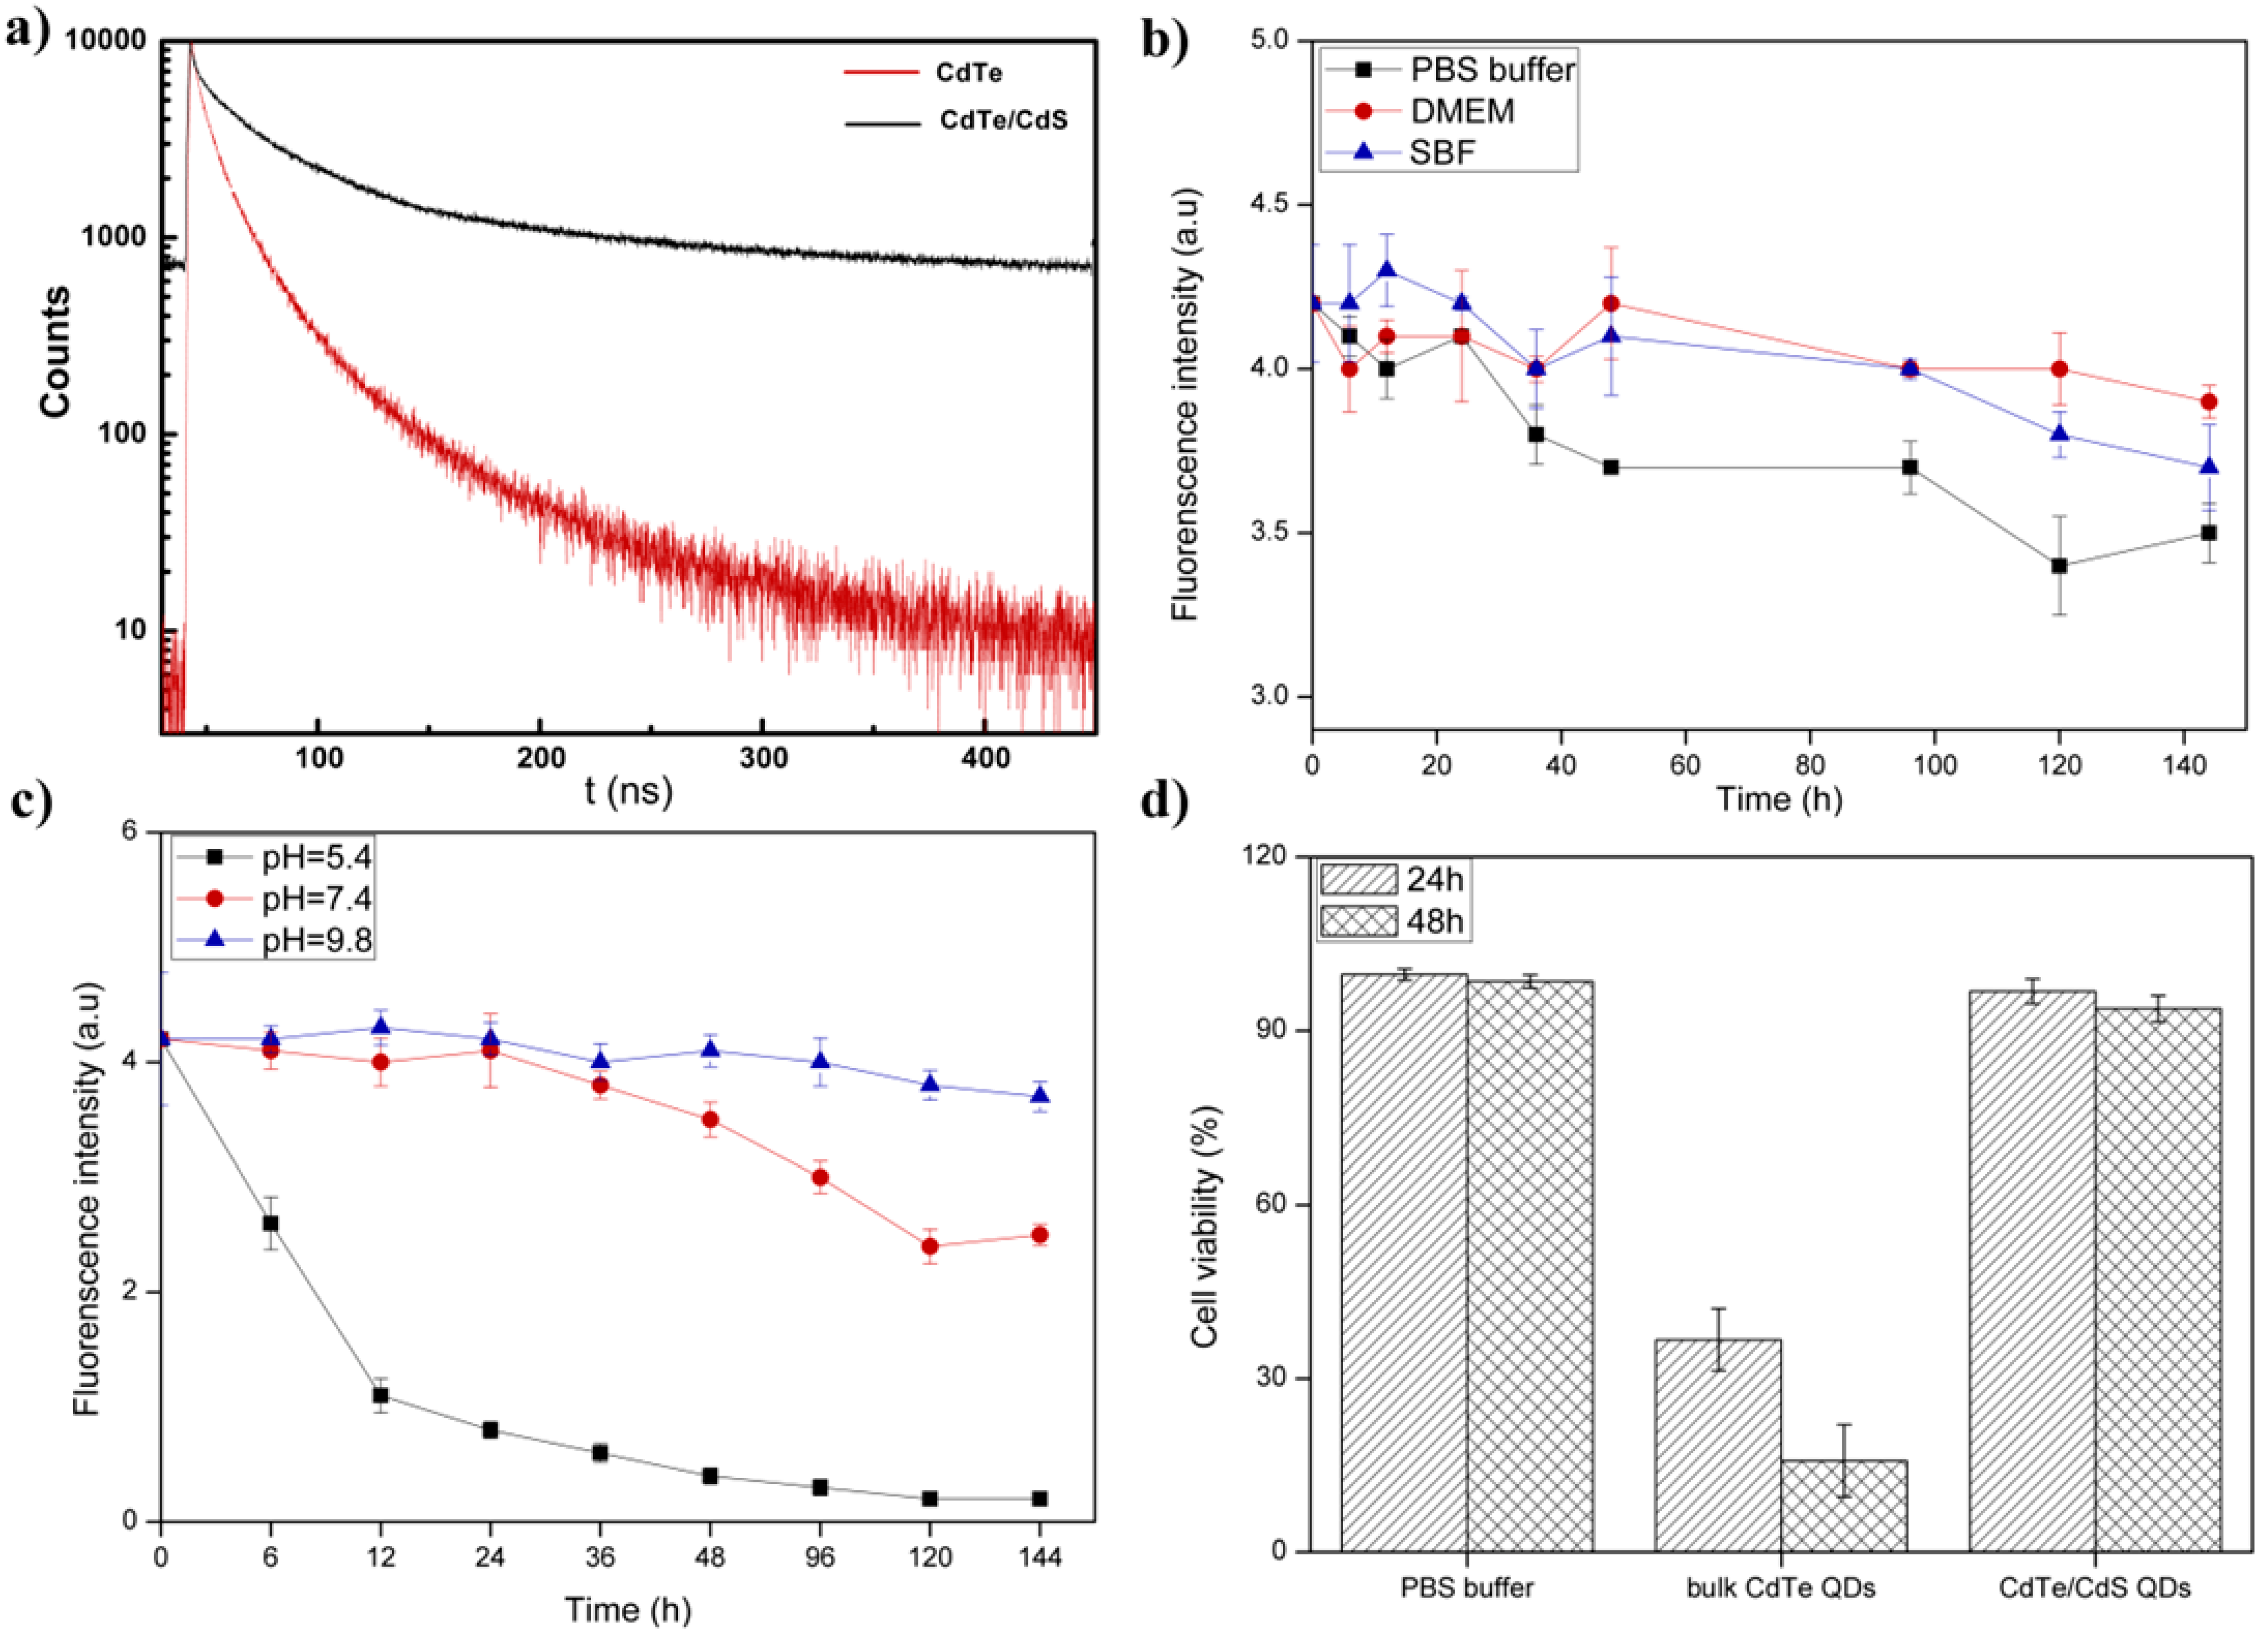
3.2. The Stability of Dendrimer Modified CdTe/CdS QDs
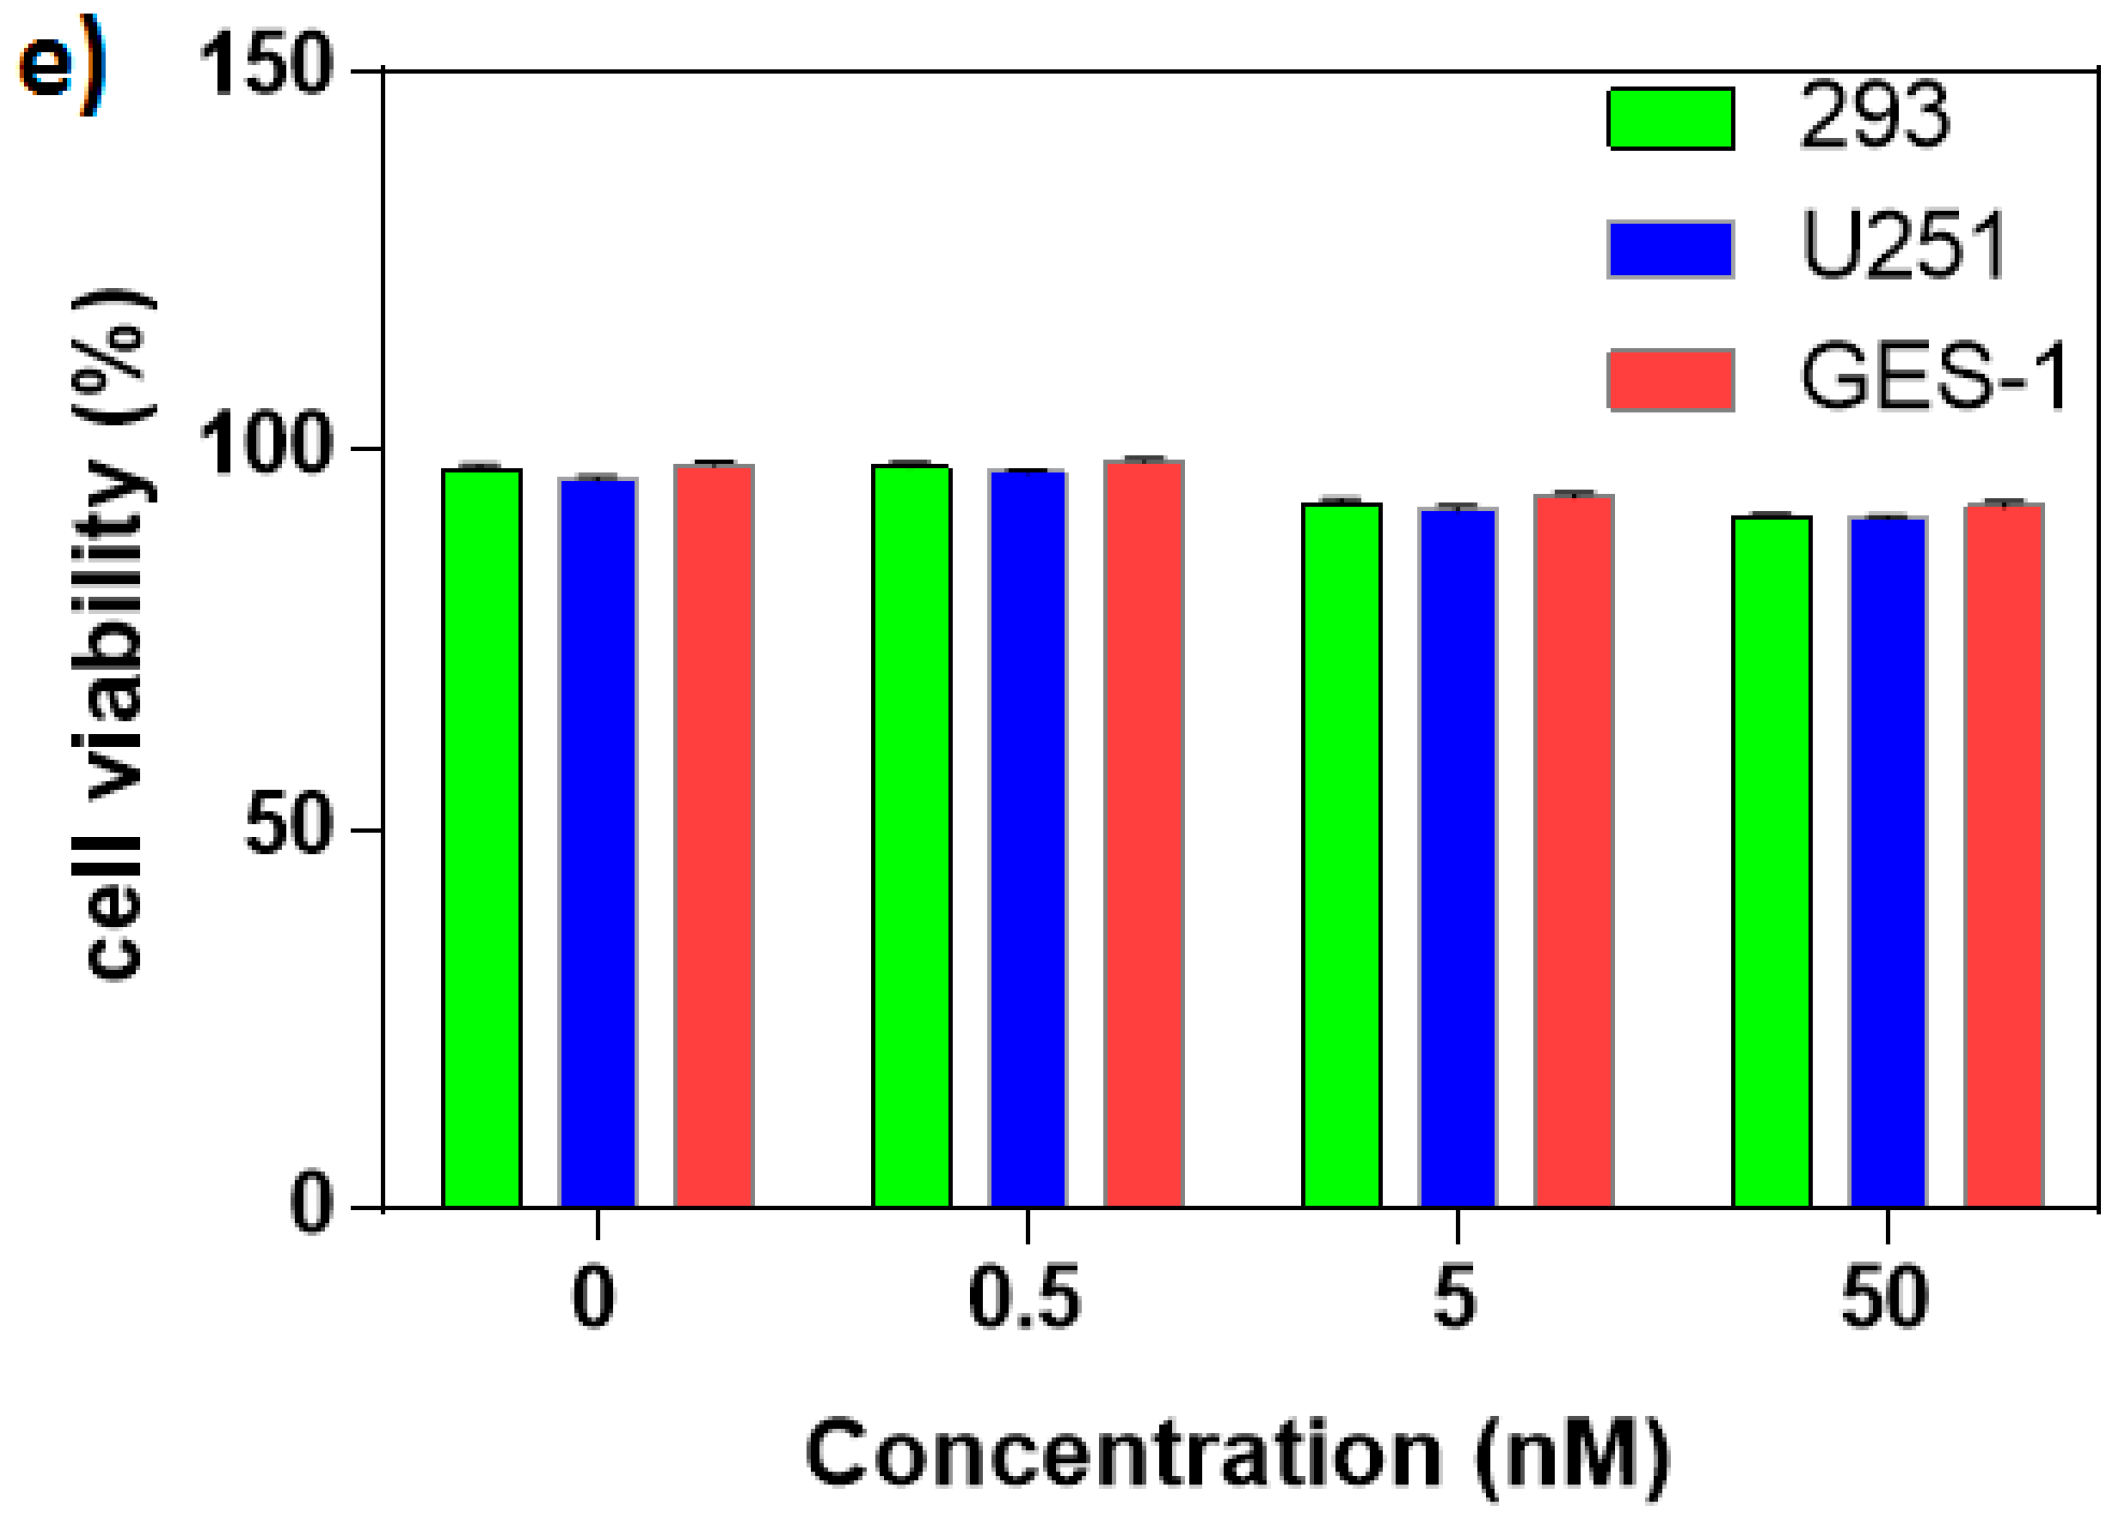
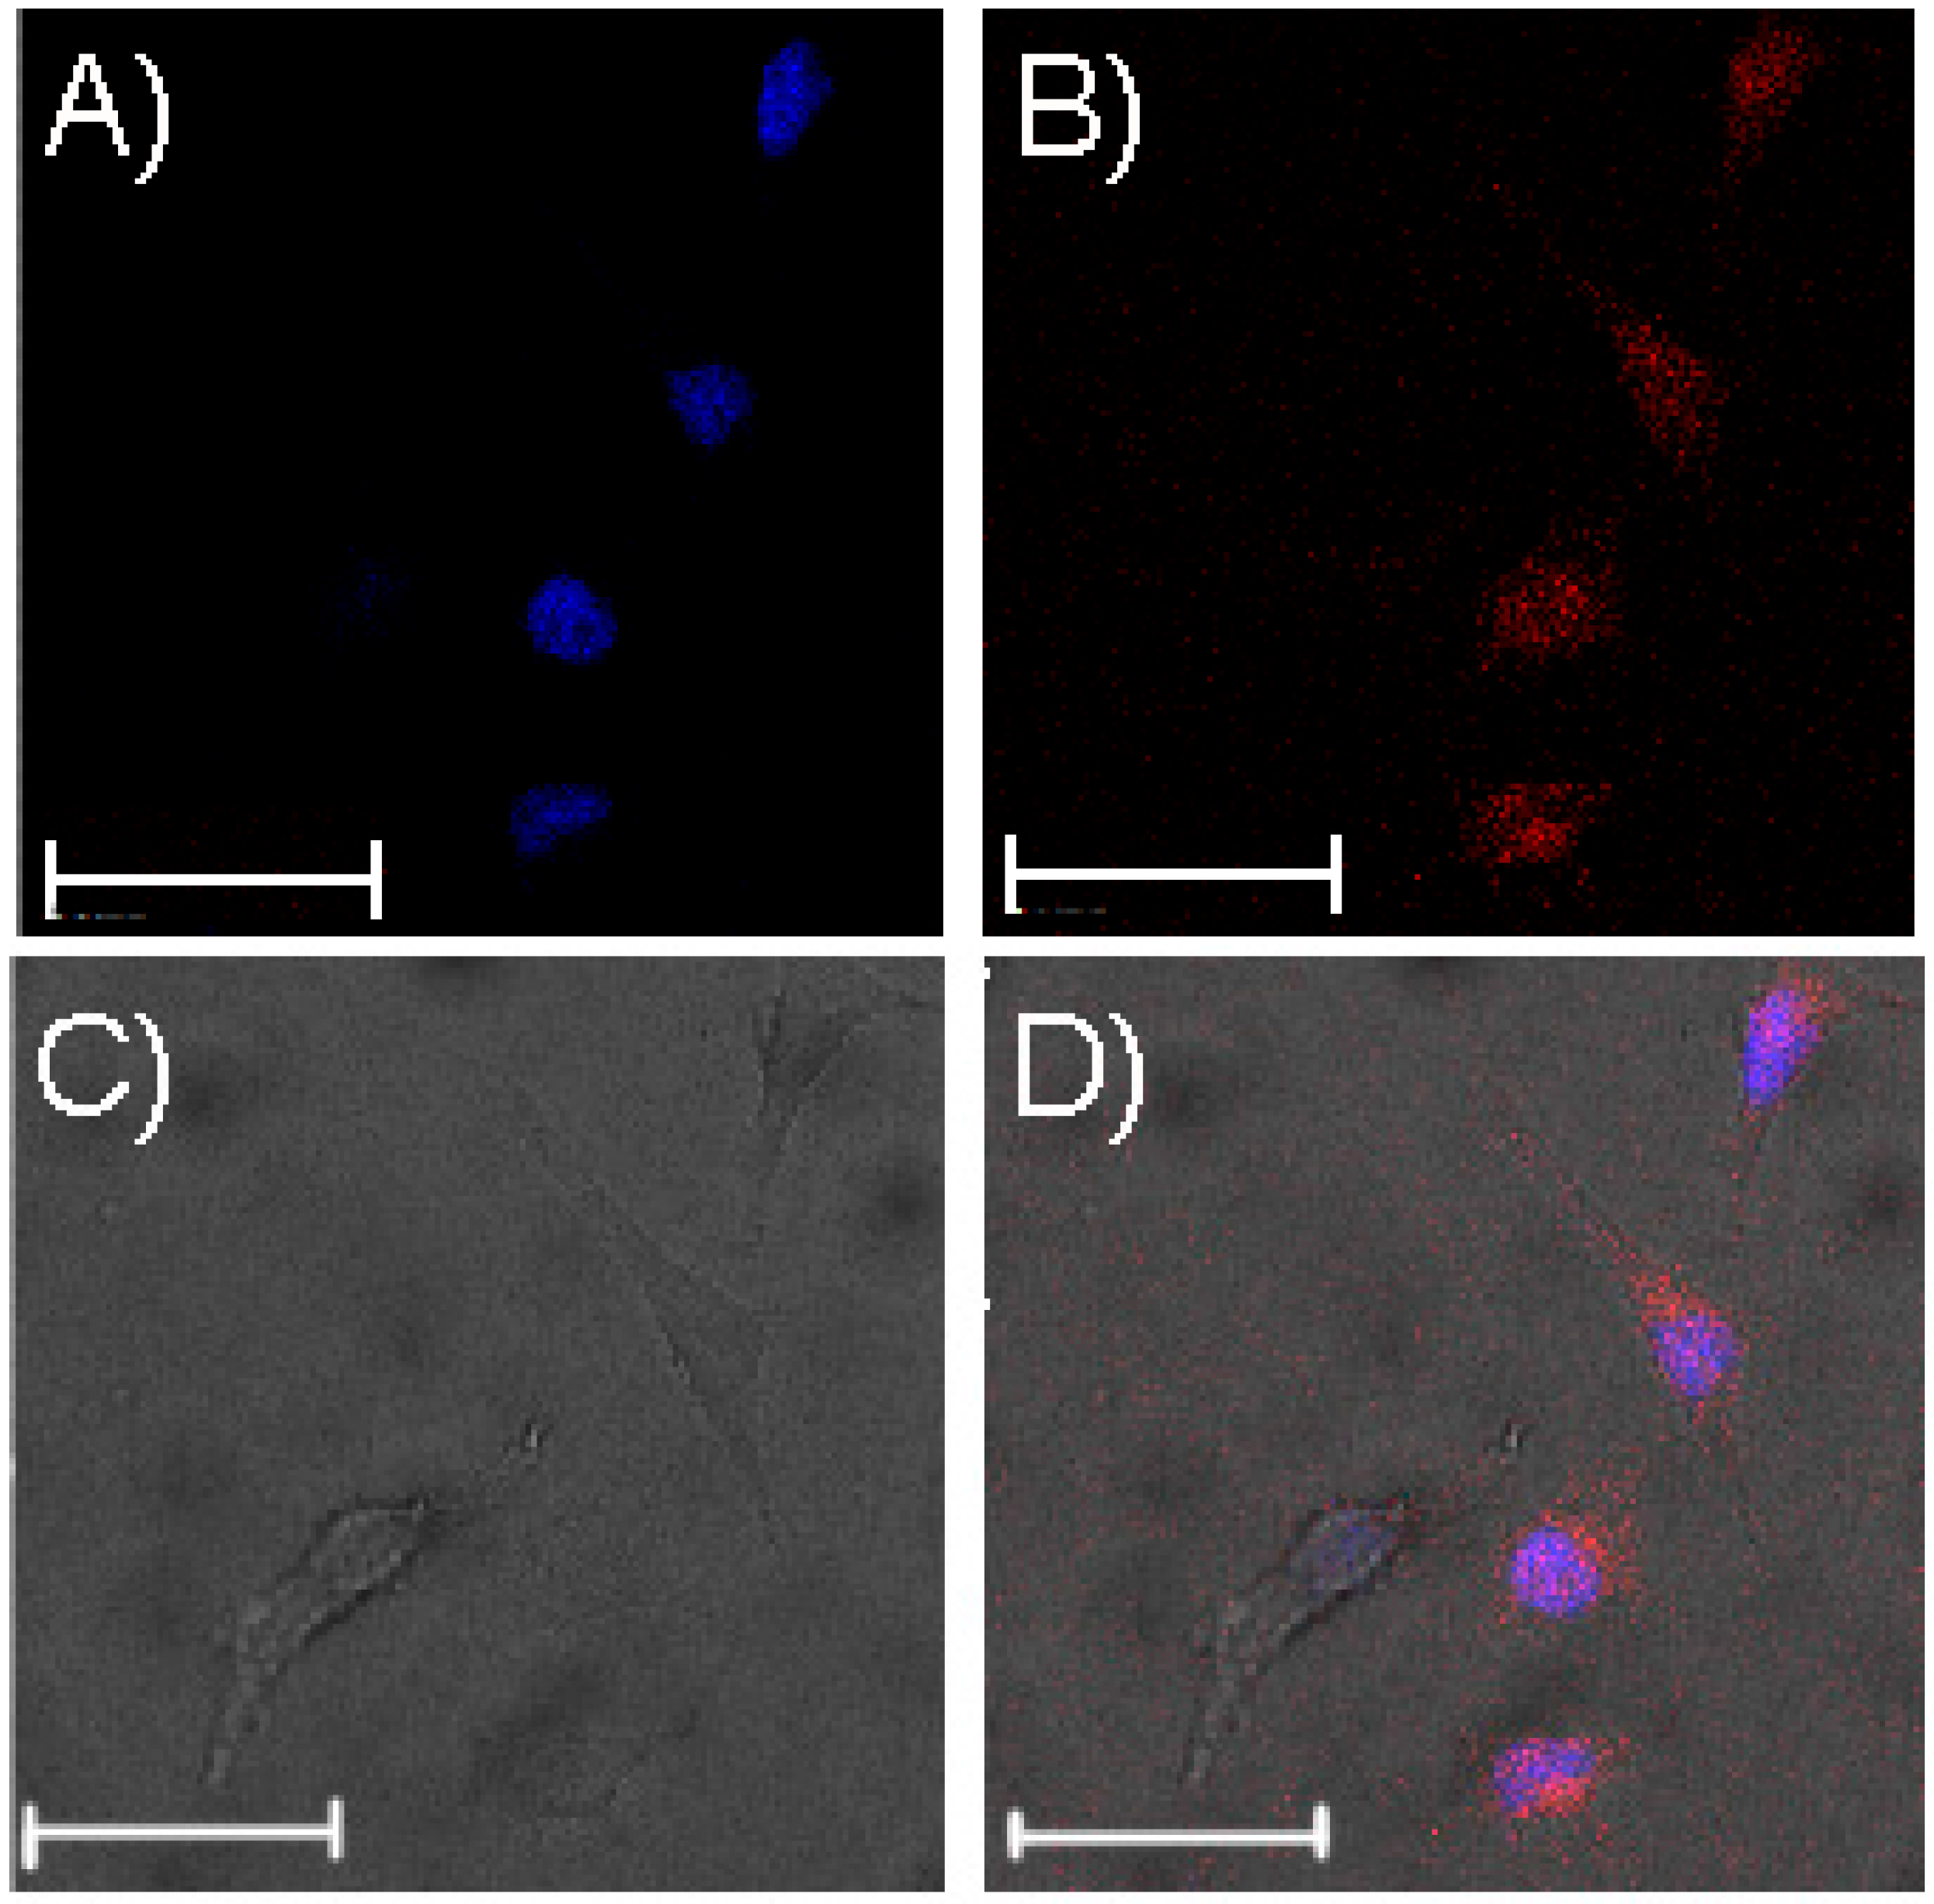
As seen in Figure 3a, the photoluminescence (PL) lifetimes of freshly prepared CdTe QDs and dendrimer modified CdTe/CdS QDs is about 20.1 ns and 58.3 ns, respectively. The great increase of the decay lifetime of dendrimer modified CdTe/CdS QDs is ascribed to the spatial separation of electron and hole in type-II QDs [13]. Additionally, the PL quantum yields (QYs) of CdTe QDs and dendrimer modified CdTe/CdS QDs are 25% and 55%, respectively.
Figure 3. (a) Photoluminescence (PL) decay profiles of CdTe QDs and dendrimer modified CdTe/CdS QDs; (b) Effect of different buffer on the fluorescence intensity of dendrimer modified CdTe/CdS QDs at different time intervals; (c) Effect of different buffers on the fluorescence intensity of dendrimer modified CdTe/CdS QDs at different time intervals; (d) Cell viability of 293T cells after incubation with PBS buffer, bulk CdTe QDs and dendrimer modified CdTe/CdS QDs at 24 h and 48 h, respectively; (e) Cell viabilities of 293T cells, U251 cells and gastric epithelial cell line (GES-1) cells after incubating with various concentrations (0.5, 5, and 50 nM) of freshly prepared QDs for 24 h. The 0 nM concentration of QDs is taken as a control.
Applsci 05 01076 g003aApplsci 05 01076 g003b
In order to develop a stable PL signal for the biological applications, the fluorescence stability of dendrimer modified CdTe/CdS QDs was accessed under various tested conditions such as pH, buffer solution and incubation time, respectively. As shown in Figure 3b, the PL signal of dendrimer-CdTe/CdS QDs is more stable when they were stored in Dulbecco’s modified eagle medium (DMEM) and stimulate body fluid (SBF) buffer compared with they were stored in PBS buffer. Particularly, the fluorescence intensity of dendrimer modified CdTe/CdS QDs remains at 88% of the initial value after storage for 144 h in the PBS buffer. However, exposure of the QDs solutions to the acidic condition resulted in a decreased PL intensity, but it was basically stable under either neutral condition or alkaline condition (Figure 3c). This phenomenon is attributed to the surface charge characteristics of dendrimer modified QDs [14].
As shown in Figure 3d, the cytotoxicity of as-prepared dendrimer modified CdTe/CdS QDs was measured by MTT analysis. The cell viability of 293T cells treated with dendrimer modified CdTe/CdS QDs (50 nM) was about 95.2% and 93.2% after 24 h and 48 h incubation, while the cell viability was only about 36.7% after incubation 293T cells directly exposed with bulk CdTe QDs for 24 h, which proved that the dendrimer modified CdTe/CdS QDs had lower cytotoxicity than bulk QDs. Furthermore, none of cell lines including 293T, U251 and GES-1 cells shows a significant decrease in cell viability after exposing dendrimer modified CdTe/CdS QDs in the concentrations arrange from 0.5 to 50 mM for 24 h (Figure 3e). In a word, our prepared dendrimer modified CdTe/CdS QDs demonstrates an impressive biocompatibility with ultra-low toxicity, which is benefited to our following research.

3.3. Cell Imaging

To ensure the feasibility of the NIRemitting dendrimer modified CdTe/CdS QDs for brain cancer imaging, we mainly applied them for brain tumor U251 cells imaging in vitro. As shown in Figure 4, we clearly observed the NIR emission from the cytoplasmic compartment of U251 cells. Moreover, the cell nucleus of U251 cells were hardly observed the NIR fluorescence of dendrimer modified CdTe/CdS QDs. This is probably due to the fact that the dendrimer modified QDs is easily interacted with cytosolic proteins during incubation, but is too large to enter the nucleus. This preliminary results show that dendrimer modified CdTe/CdS QDs with a suitable size and narrow, intense emission will be a promising probe for brain imaging in vivo.
Figure 4. Fluorescence images of primary cultured U251 cells labelled with dendrime modified QDs. The U251 cells were stained by DAPI (Blue, A); Dendrimer modified CdTe/CdS QDs (Red, B); bright field (C) and merge images (D); Original magnification of (AD) is 200×.
Applsci 05 01076 g004

4. Conclusions

In this work, we have had developed the synthesis procedure of dendrimer modified CdTe/CdS QDs in aqueous phase. Our data demonstrate that the as-prepared dendrimer modified CdTe/CdS QDs has a stable NIR fluorescence and favorable biocompatibility, which is vital for future biological applications. The as-prepared dendrimer modified CdTe/CdS QDs is also successfully applied for cell imaging in vitro. The dendrimer modified CdTe/CdS QDs will probably become an attractive alternative probe in future brain cancer imaging.

Acknowledgments

This work is funded by the Pudong medical system point discipline foundation (PWZx2014-15), Pudong medical system leading talent foundation (PWR12010-02), Health Bureau of Shanghai (Grant No. 20134179), Research Grant for Health Science and Technology of Pudong Health Bureau of Shanghai (Grant No. PKJ2013-Y27), The 2013 Key Disciplines Group Construction Project of Pudong people’s Hospital of Shanghai (Grant No. PRxkq2013-03).

Author Contributions

Conceived and designed the experiments: Qingke Bai, Haijing Sui, Zhenguo Zhao, Feng Wen; Performed the experiments: Qingke Bai, Juan Chen, Xiuhai Xie; Analyzed the data: Qingke Bai, Haijing Sui, Zhenguo Zhao, Feng Wen; Contributed reagents/materials/analysis tools: Qingke Bai, Haijing Sui, Zhenguo Zhao, Feng Wen.

Conflicts of Interest

The authors declare no conflict of interest.

References

  1. Young, G.S.; Stauss, J.; Mukundan, S. Advanced Imaging of Adult Brain Tumors with MRI and PET. In Neuro-Oncology: Blue Books of Neurology Series; Saunders: Philadelphia, PA, USA, 2010; pp. 71–78. [Google Scholar]
  2. Hoshi, Y. Functional Near-Infrared Optical Imaging: Utility and Limitations in Human Brain Mapping. Psychophysiology 2003, 40, 511–520. [Google Scholar] [CrossRef] [PubMed]
  3. Kircher, M.F.; Mahmood, U.; King, R.S.; Weissleder, R.; Josephson, L. A Multimodal Nanoparticle for Preoperative Magnetic Resonance Imaging and Intraoperative Optical Brain Tumor Delineation. Cancer Res. 2003, 63, 8122–8125. [Google Scholar] [PubMed]
  4. Koo, Y.-E.L.; Reddy, G.R.; Bhojani, M.; Schneider, R.; Philbert, M.A.; Rehemtulla, A.; Ross, B.D.; Kopelman, R. Brain cancer diagnosis and therapy with nanoplatforms. Adv. Drug Deliv. Rev. 2006, 58, 1556–1577. [Google Scholar] [CrossRef] [PubMed]
  5. Zhao, D.; He, Z.; Chan, W.; Choi, M.M. Synthesis and characterization of high-quality water-soluble near-infrared-emitting CdTe/CdS quantum dots capped by N-acetyl-l-cysteine via hydrothermal method. J. Phys. Chem. C 2009, 113, 1293–1300. [Google Scholar] [CrossRef]
  6. Chen, H.; Wang, Y.; Xu, J.; Ji, J.; Zhang, J.; Hu, Y.; Gu, Y. Non-invasive near infrared fluorescence imaging of CdHgTe quantum dots in mouse model. J. Fluores. 2008, 18, 801–811. [Google Scholar] [CrossRef] [PubMed]
  7. Mao, W.; Guo, J.; Yang, W.; Wang, C.; He, J.; Chen, J. Synthesis of high-quality near-infrared-emitting CdTeS alloyed quantum dots via the hydrothermal method. Nanotechnology 2007, 18, 485–611. [Google Scholar] [CrossRef]
  8. Liang, G.-X.; Gu, M.-M.; Zhang, J.-R.; Zhu, J.-J. Preparation and bioapplication of high-quality, water-soluble, biocompatible, and near-infrared-emitting CdSeTe alloyed quantum dots. Nanotechnology 2009, 20. [Google Scholar] [CrossRef] [PubMed]
  9. Cong, R.-M.; Luo, Y.-J.; Li, G.-P.; Tan, H.-M. In-situ Synthesis of CdS-ZnS Core-shell Structure Quantum Dots Inside PAMAM Dendrimer Templates. Chem. J. Chin. Univ. 2006, 27, 793–796. [Google Scholar]
  10. Yamamoto, D.; Koshiyama, T.; Watanabe, S.; Miyahara, M.T. Synthesis and photoluminescence characterization of dendrimer-encapsulated CdS quantum dots. Colloids Surf. A Physicochem. Eng. Asp. 2012, 411, 12–17. [Google Scholar] [CrossRef] [Green Version]
  11. Zhiming, L.; Peng, H.; Rong, H.; Xiaomin, Z.; Chenchen, B.; Qiushi, R.; Daxiang, C. Aptamer-conjugated dendrimer-modified quantum dots for glioblastoma cells imaging. J. Phys. Conf. Ser. 2009, 188, 012032. [Google Scholar]
  12. Yu, K.; Zaman, B.; Romanova, S.; Wang, D.-S.; Ripmeester, J.A. Sequential synthesis of type II colloidal CdTe/CdSe core-shell nanocrystals. Small 2005, 1, 332–338. [Google Scholar] [CrossRef] [PubMed]
  13. Chang, J.-Y.; Wang, S.-R.; Yang, C.-H. Synthesis and characterization of CdTe/CdS and CdTe/CdSe core/shell type-II quantum dots in a noncoordinating solvent. Nanotechnology 2007, 18, 345602–345606. [Google Scholar] [CrossRef]
  14. Campos, B.B.; Algarra, M.; Alonso, B.; Casado, C.M.; Esteves da Silva, J.C.G. Mercury(ii) sensing based on the quenching of fluorescence of CdS-dendrimer nanocomposites. Analyst 2009, 134, 2447–2452. [Google Scholar] [CrossRef] [PubMed]

