Article

An Investigation of the Thermal Expansion Coefficient for Resin Concrete with ZrW2O8

Key Laboratory of Advanced Ceramics and Machining Technology, Ministry of Education, Tianjin University, Tianjin 300072, China
*
Author to whom correspondence should be addressed.
These authors contributed equally to this work.
Appl. Sci. 2015, 5(3), 367-379; https://doi.org/10.3390/app5030367
Submission received: 23 June 2015 / Revised: 5 August 2015 / Accepted: 6 August 2015 / Published: 14 August 2015

Abstract

:
This paper presents a novel resin concrete obtained by adding cubic zirconium tungstate (ZrW2O8) as filler. A prediction algorithm on the thermal expansion coefficient (CTE) of resin concrete (including filler) was established on the basis of the meso-mechanics method and a three-phase model for concrete. The concept of twice mixing was also proposed for prediction accuracy. Then, a 2D and 3D irregular polygon aggregate particles packing model was set up by Matlab and the properties of the packing model were simulated by finite element analysis. Finally, resin concrete samples were made and their CTE were measured. Mix proportion and addition of ZrW2O8 as influencing factors were considered in this experiment. The CTE of resin concrete was verified by comparing results of the prediction model, simulation model and experiment. The optimum CTE obtained from the experiment was 1.504 × 10⁻⁶/K. Compared with 6.817 × 10⁻⁶/K without ZrW2O8, it was found that the addition of ZrW2O8 to resin concrete can make it perform significantly better in thermal expansion.

Graphical Abstract

1. Introduction

Nowadays, ultra-precision machining technology is developing towards the scales of micron, submicron and nano. Therefore, traditional cast iron machine tools can hardly satisfy the needs of actual application. The idea of using resin concrete as a bed material emerges for solving this problem. It is a kind of composite material that is mainly composed of aggregates of different sizes and liquid organic resin which hardens through polymerization reaction. Due to its outstanding properties such as high strength, excellent vibration attenuation and thermal stability, resin concrete attracts considerable attention.
Thermal deformation plays a vital role in the appearances of manufacturing errors. Aiming at special demand of ultra-precision computer numerical control (CNC) machine tool for high thermal stability, negative thermal expansion (NTE) material is urgently needed. It contracts upon heating within a certain range of temperature rises and adding NTE material can make the composite in CTE change. Cubic Zirconium Tungstate (ZrW2O8) exhibits strong, isotropic NTE behavior in a wide temperature scope from 0.3 K to 1050 K. Kofteros [1] conducted an experiment of CTE of cement by adding ZrW2O8. The experiment results showed addition of ZrW2O8 played a vital role in reduction of CTE. By finite element analysis, Yilmaz [2] studied thermal mismatch stresses of a Cu-ZrW2O8composite. Hence, we consider that the addition of ZrW2O8 can have a great effect on the thermal ability of resin concrete. The use of ZrW2O8 in concrete contributes in providing new advanced composites.
Numerous analytical approaches aiming at effective CTE prediction has been studied extensively in the literature. Turner [3] assumed that inner material does not exhibit internal stress at initial temperature and the CTE has no relation with the shape and size of the inclusions. It is also assumed that the components only bear isostatic pressure and the dimensional changes of the components and the macro composite material in terms of temperature occur at the same rate. In this model, the CTE of composites depends on volume fraction and bulk modulus of each component. Although this model is in accord with experimental results on some composite systems, deviations can also be observed because of the model assumption [4]. Considering internal boundaries of composites and shear effects between phase boundaries, Kerner’s model is widely applied for CTE prediction [5]. The derivation process is based on self-consistent algorithms. In this model, shear modulus of the matrix has an effect on the CTE of composites. This model completely accords with a linear correlation between the CTE of the components and volume fraction of each component [6]. Schapery [7] further developed the prediction model and studied bounds on effective CTE of composite materials made up of isotropic phases based onthermo-elastic principles. Upper and lower bounds can be obtained based on the Hashin-Shtrikman [8] model.
There are also many studies related to the CTE of concrete. Hulsey [9] investigated the effect of age, moisture content and mix proportion on concrete CTE. Venecanin [10] explored the influence of aggregate of low CTE to the whole CTE. Sellevold [11] held that moisture has a big impact on the CTE and proved it. Wyrzykowski [12] considered that superabsorbent polymers (SAP) can suppress the negative effect of self-desiccation which leads to increase of the CTE. In recent years, some scholars [13,14,15] have developed prediction models for CTE of concrete. Many aspects, such as volume fractions of aggregate, elastic moduli of components, and aggregate type, were investigated to analyze their effects on concrete CTE. However, up to now there is no special model or theory for the CTE of resin concrete. Experiments of the CTE of resin concrete were conducted by Kim [16] and Haddad [17]. Nonetheless, adding ZrW2O8 as filler to resin concrete has never been taken into account.
In order to reduce the CTE of resin concrete, we have tried to conduct research from three aspects: the first, making a prediction model; the second, establishing an irregular polygon aggregate particles packing model; the last, conducting experiments.

2. Prediction of the CTE of Resin Concrete Made by Adding ZrW2O8 Powders

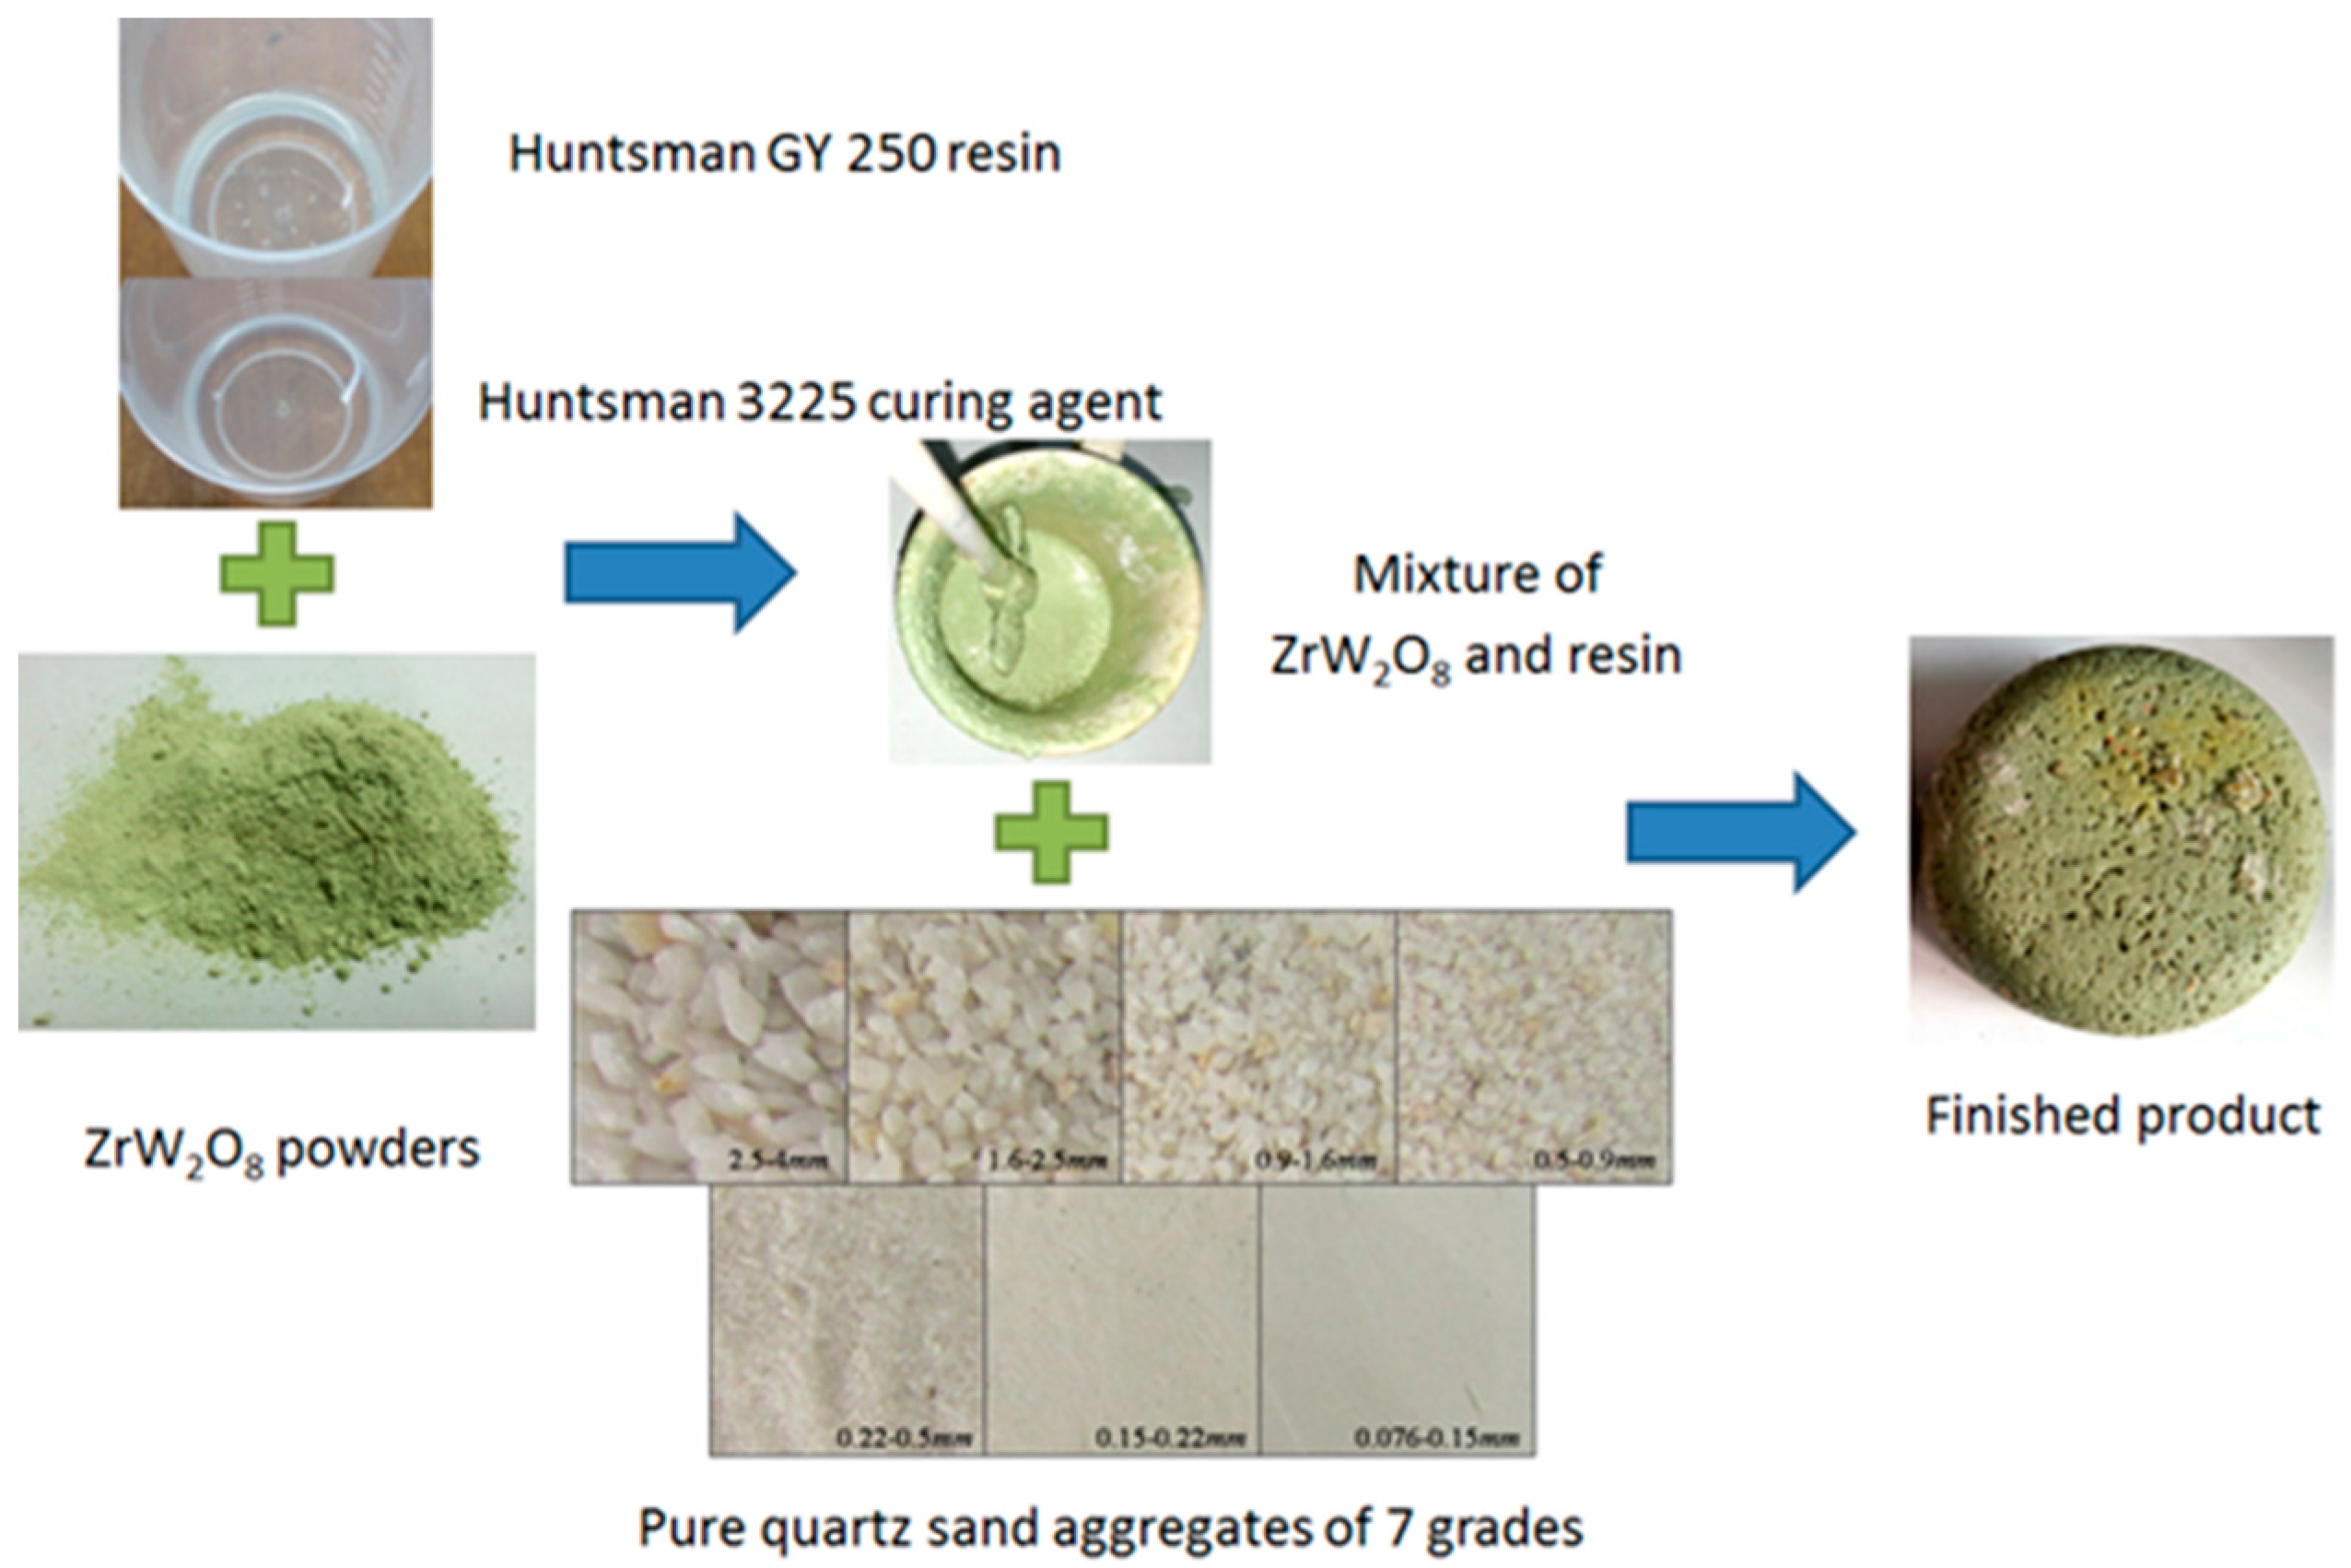
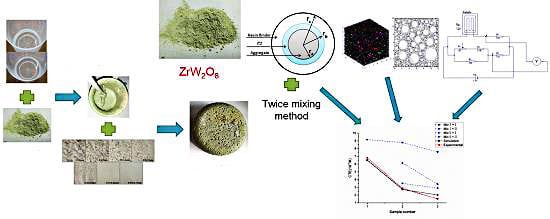
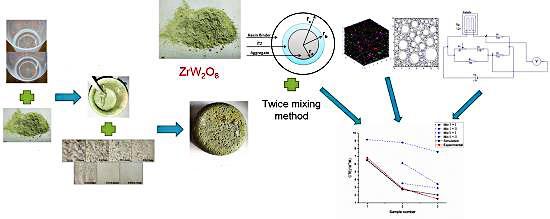
The fillers used in the paper are α-phase of ZrW2O8 powders and the average particle size is 250 mesh. Mesh is the number of meshes per unit length (1 inch in Tyler standard screen scale), which can indicate mesh size. Two hundred and fifty mesh is about 58 μm. There is obvious difference between quartz sand and ZrW2O8 powders in aggregate gradation. Therefore, ZrW2O8 powders (fillers) are mixed with resin binder initially (first mixing). Then, the mixtures generated in the previous step are mixed with quartz sand (aggregates) (second mixing). Through the process of “first mixing” and “second mixing", the finished product can be obtained. Cement particle size of common cement mortar is rarely more than 80 μm. Because the maximum particle size of ZrW2O8 powders is 61 μm, the mixing process of resin binder and ZrW2O8 powders is just similar to that of water and cement flour. The descriptions of resin binder, ZrW2O8 and quartz sand are shown in the following sections.

2.1. First Mixing

ZrW2O8 powders and resin binder are mixed. Denoting c 1 and ( 1 c 1 ) are the volume fractions of ZrW2O8 and resin binder in concrete, respectively. Let E 0 , μ 0 , α 0 be the Young’s modulus, Poisson’s ratio and CTE of the resin binder as matrix and E 1 , μ 1 , α 1 those of the ZrW2O8 powders as fillers. Model-A and Model-B are two different computing methods of CTE for determining the interactions between components of resin concrete. Filler strain is approximately equal to the CTE α 1 ¯ of isolated filler embedded in an infinite matrix under the constraint of matrix without considering the interactions between ZrW2O8 powders and between matrix and ZrW2O8 powders. It is named Model-A of “first mixing”. Thus, the CTE α 1 * of the mixtures can be given by [18]:
α 1 * = c 1 α 1 ¯ + ( 1 c 1 ) α 0
where
α 1 ¯ = 2 E 0 ( 1 + μ 0 ) α 0 + E 1 ( 1 2 μ 1 ) α 1 2 E 0 ( 1 + μ 0 ) + E 1 ( 1 2 μ 1 )
Due to the dense distribution of fillers, the correlations and interactions between fillers and between the matrix and the filler are under consideration. It is named Model-B of “first mixing”. G ¯ represents the macro effective shear modulus of the mixture. Thus, the CTE α 2 * of the mixtures can be given by [18]:
α 2 * = ( 4 G ¯ + E 1 1 2 μ 1 ) ( 1 c 1 ) E 0 α 0 3 ( 1 2 μ 0 ) + ( 4 G ¯ + E 0 1 2 μ 0 ) E 1 α 1 3 ( 1 2 μ 1 ) c ( 4 G ¯ + E 1 1 2 μ 1 ) E 0 3 ( 1 2 μ 0 ) + 4 G ¯ c 1 ( E 1 3 ( 1 2 μ 1 ) E 0 3 ( 1 2 μ 0 ) )
where
G ¯ = E 0 2 ( 1 + μ 0 ) [ 1 + c 1 ( E 0 E 1 ( 1 + μ 0 ) ( 1 + μ 1 ) 1 ) 1 + ( 1 c 1 ) 2 ( 4 5 μ 0 ) 15 ( 1 μ 0 ) ( E 0 E 1 ( 1 + μ 0 ) ( 1 + μ 1 ) 1 ) ]
As pointed out in [
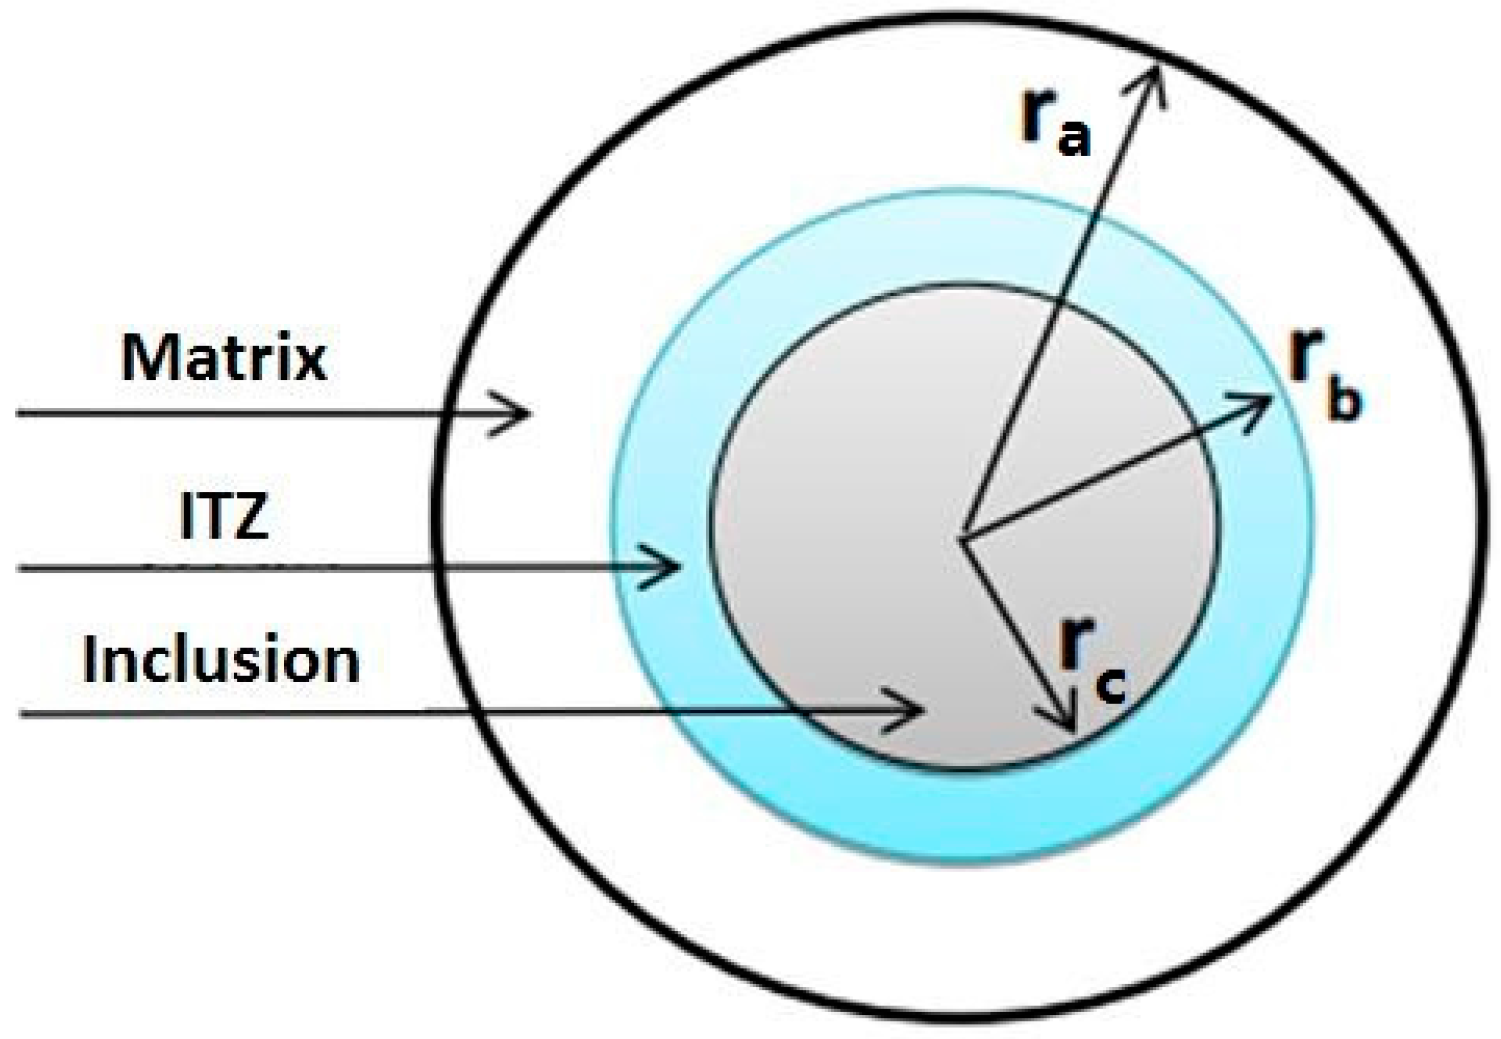
19], a three-phase model is presented for the prediction of Young’s modulus of concrete. The three phases are inclusion, Interfacial Transition Zone (ITZ) and matrix, as shown in Figure 1. The Poisson’s ratio of concrete experiences a smaller change than the shear modulus. Hence, in order to simplify the calculation process and be convenient for engineering applications, the transverse series model is used [20]. Thus, the Poisson’s ratio μ t * of concrete is approximated by:
μ t * = c a μ a + c b μ b + c c μ c
Where E a , μ a , c a are the Young’s modulus, Poisson’s ratio and CTE of matrix phase and E b , μ b , c b those of ITZ layer and E c , μ c , c c those of inclusion. According to [20], E b = 0.3 E a ,   μ b = 0.30 .
Figure 1. Three-phase model for concrete with Interfacial Transition Zone (ITZ).
Applsci 05 00367 g001
According to the inference result in [19], the Young’s modulus E t * after mixing can be given by:
E t * = k 21 a k 11 b k 1 c + k 22 a k 21 b k 1 c + k 21 a k 12 b k 2 c + k 22 a k 22 b k 2 c k 11 a k 11 b k 1 c + k 12 a k 21 b k 1 c + k 11 a k 12 b k 2 c + k 12 a k 22 b k 2 c ( 1 2 v t )
where
k 11 a = 1 ( 1 + μ a ) c a 3 ( 1 μ a ) , k 12 a = ( 1 + μ a ) ( 1 2 μ a ) c a 3 ( 1 μ a ) E a , k 21 a = 2 E a c a 3 ( 1 2 μ a ) , k 22 a = 1 2 ( 1 2 μ a ) c a 3 ( 1 2 μ a )
k 11 b = 1 ( 1 + μ b ) c b 3 ( 1 μ b ) ( c b + c c ) , k 12 b = ( 1 + μ b ) ( 1 2 μ b ) c b 3 ( 1 μ b ) E b ( c b + c c ) , k 21 b = 2 E b c b 3 ( 1 2 μ b ) ( c b + c c ) k 22 b = 1 2 ( 1 2 μ b ) c b 3 ( 1 2 μ b ) ( c b + c c )
k 1 c = 1 , k 2 c = E 1 2 μ c
Therefore, α 1 * ,   α 2 * , E t * and μ t * of the mixture can be solved by Equations (5) and (6).

2.2. Second Mixing

Quartz sand and the mixtures after the first mixing process are mixed. Let E 2 , μ 2 , α 2 be the Young’s modulus, Poisson’s ratio and CTE of the quartz sand as aggregates. Denoting c 2 and ( 1 c 2 ) are the volume fractions of quartz sand and resin binder in concrete, respectively. α 1 ¯ ( 1 ) and α 1 ¯ ( 2 ) are the restraint CTE of isolated aggregate embedded in an infinite matrix in “Model-A + Model-A” and “Model-B + Model-A” model, respectively. G ¯ ( 1 ) is the macro effective shear modulus of the final mixture. Due to the prediction models that are presented in the previous paper, Model-A and Model-B are also available in “second mixing” while replacing ZrW2O8 powders with quartz sand. They are named Model-A of “second mixing” and Model-B of “second mixing”, respectively. Thus, we also have two choices in the second mixing process, so there are four prediction results in all. For instance, “Model-B + Model-A” means that Model-B is used in “first mixing” and Model-A is applied to “second mixing”. These results can be obtained from α 1 * , α 1 ¯ , α 2 * , G ¯ by the replacement as shown in Table 1
Table 1. Substitution table.
Model SubstituteFor
Model-A + Model-A α 1 * ( ) ,   α 1 ¯ ( ) α 1 ¯ ,   c 1 ,   α 0 ,   α 1 ,   E 0 ,   E 1 ,   μ 1 ,   μ 1 α 1 ¯ ( ) ,   c 2 ,   α 1 * ,   α 2 ,   E t * ,   E 2 ,   μ t * ,   μ 2
Model-B + Model-A α 1 * ( ) ,   α 1 ¯ ( ) α 1 ¯ ( ) ,   c 2 ,   α 2 * ,   α 2 ,   E t * ,   E 2 ,   μ t * ,   μ 2
Model-A + Model-B α 2 * ( ) ,   G ¯ ( ) G ¯ ,   c 1 ,   α 0 ,   α 1 ,   E 0 ,   E 1 ,   μ 1 ,   μ 1 G ¯ ( ) ,   c 2 ,   α 1 * ,   α 2 ,   E t * ,   E 2 ,   μ t * ,   μ 2
Model-B + Model-B α 2 * ( ) ,   G ¯ ( ) G ¯ ( ) ,   c 2 ,   α 2 * ,   α 2 ,   E t * ,   E 2 ,   μ t * ,   μ 2
According to optimum proportion of resin binder to the sum of fillers and aggregates provided by the manufacturer, three mixing compositions used in this study are outlined in Table 2. Results of the prediction formula are shown in Table 3. Sample No.1 is a mixture of resin binder and quartz sand without ZrW2O8 powder. Hence, the mixing process cannot be divided into “first mixing” and “second mixing”. So, “Model-A + Model-B” and “Model-B + Model-A” do not exist. For Sample No.1, “Model-A + Model-A” means that Model-A is used in whole mixing process. Similarly, “Model-B + Model-B” means that Model-B is applied.
Table 2. Comparison of the proportions of three mixing compositions.
No.SubjectMass ratioVolume ratio
1Resin binder:quartz0.073:0.9270.148:0.852
2Resin binder:quartz:ZrW2O80.066:0.742:0.1920.148:0.767:0.085
3Resin binder:quartz:ZrW2O80.059:0.597:0.3440.148:0.682:0.170
Table 3. Results of the prediction formula.
No.CTE (× 10−6/K)
Model A + AModel A + B Model B + A Model B + B
19.161------6.598
28.7773.5126.1582.768
37.5772.9093.4031.536
---: Result does not exist.

3. Packing Model and Property Simulation

3.1. Establishment of Packing Model

The 2D/3D packing model of resin concrete was established based on relevant knowledge of material meso-structure and meso-mechanics. At least millions of particles exist in a granular pack. Hence, computer performance analysis of powder material is mainly applied to 2D packing models [21]. We consider that 3D model can be obtained by random arbitrary distribution, and then the 2D model is one slice directly captured from the 3D model.
Based on gradation results that we determine, related settings used to simulate packing model of resin concrete are as follows: According to Japan national standard JIS G5901-1974 [22], the aggregate size distribution is 0.076–0.15 mm, 0.15–0.22 mm, 0.22–0.5 mm, 0.5–0.9 mm, 0.9–1.6 mm, 1.6–2.5 mm and 2.5–4 mm, respectively. According to mass fractions of aggregate, the number of all kinds of aggregate is calculated for precision improvement. Detailed aggregates ratio and particle number of each grade are shown in Table 4. Aggregates are packed from the largest to the smallest size in a cube with an h side and h = 12 mm. Pores represent resin binder. In order to improve the reality and accuracy of the packing model, this paper adopts the polygonal aggregates model, not the spherical one. The process of establishing 3D microstructure is as follows: (1) Coordinate of sphere center x(i),y(i),z(i) and radius r(i) of each random aggregate are determined for be completely inside the cube and can be given by in Matlab:
{ x ( i ) = r ( i ) + ( h 2 × r ( i ) ) × r a n d ( ) y ( i ) = r ( i ) + ( h 2 × r ( i ) ) × r a n d ( ) z ( i ) = r ( i ) + ( h 2 × r ( i ) ) × r a n d ( )
The generated aggregate is reserved; (2) For newly generated sphere, intersection with other spheres might exist. Hence, interference calculation with generated spheres is carried out in order to determine whether interference exists or not. If it exists, the sphere is deleted; (3) According to the above rules, particles are accumulated grade by grade. For each grade, the volume should meet the need of aggregate ratio mentioned above; (4) We take n (n > 3) random points in one sphere. Then, planes are drawn by using three arbitrary points. After drawing, overlapped planes are deleted by Boolean Operation and polygonal aggregate is obtained. To avoid sharp aggregates, all points should not be placed in the same half spherical region.
The filling rate of the 3D model is higher than 85% which satisfies the condition of high density packing, and polygonal aggregates occupy the square area of 85.2% in the 2D model. Therefore, the generated 2D/3D models are given in Figure 2.
Table 4. Aggregates’ ratio of resin concrete.
Particle size (mm)Mass ratio (%)Particle number(without ZrW2O8)Particle number (Volume ratio of aggregate:ZrW2O8 = 9:1)Particle number (Volume ratio of aggregate:ZrW2O8 = 8:2)
0.076–0.1510.586%11730410557193837
0.15–0.229.064%160881447812871
0.22–0.516.075%324829232598
0.5–0.95.891%424381339
0.9–1.619.626%320288256
1.6–2.516.871%403632
2.5–421.887%161412
Figure 2. 3D and 2D particles packing model in Matlab.
Applsci 05 00367 g002

3.2. Finite Element Analysis on CTE

Ansys Mechanical APDL 14.5 is used to analyze CTE of 2D packing model with the side length of 12 mm. We import data of aggregate particles from Matlab R2012a and select plane13 element. The material parameters of resin concrete in the model are listed in Table 5. The mesh generation is automatic and sparse degree of mesh is controlled by SMRTSIZE function. Considering accuracy and precision of calculating, parameter SMRTSIZE is set at 3. A mesh convergence study is performed. As for boundary condition, as thermal deformation belongs to 2D nonlinear analysis, it is necessary to restrain X-direction freedom of all points on the bottom line for ensuring full deformation of the entire material in the Y-direction. Simulating the ambient temperature range from 20 °C to 140 °C, the CTE of the 2D model through the change of temperature can be obtained.
Table 5. Properties of constituents.
Density (× 103Kg/m3)Young’s modulus (GPa)Poisson’s ratioCTE (× 10−6/K)
Resin binder1.03.50.3855
Granite2.65310.224.6
Quartz sand2.20790.170.55
ZrW2O85.09820.342−8.6
With reference to Figure 3, the displacements of C relative to A and D relative to B are 0.0197 mm and 0.0164 mm at Y-direction, respectively. According to constraint load conditions and formulas of CTE, the ratio of distance change of AC/BD to length of AC/BD is CTE of resin concrete owing to change in unit temperature. The aggregate uses granite. Due to the simulated temperature range from 20 °C to 140 °C, α ¯ A C = 0.0197 - 0 12 × 1 140 - 20 = 1.36 × 10⁻⁵/K, α ¯ A C = 0.0164 - 0 12 × 1 140 - 20 = 1.17 × 10⁻⁵/K. Therefore, the average CTE of resin concrete is 12.7 × 10⁶/K and approximate closely to 12 × 106/K in [16]. It indicates that this model has high accuracy.
Figure 3. Thermal deformation of resin concrete under constraint condition. AC and BD are dimensions of left side and right side of model, respectively.
Applsci 05 00367 g003
The filler of resin concrete is ZrW2O8 and the aggregates constitute quartz sand in this paper. According to three situations of experimental design in Table 2, thermal deformation and the simulation results are shown in Table 6.
Table 6. Simulation results of three samples.
No.AC(mm)BD(mm)CTE(× 10−6/K)
10.01020.00856.493
20.004240.003662.743
30.003060.002722.007

4. Experimental Program

4.1. Materials

Epoxy resin and curing agent used in this experiment were supplied by The Huntsman Corporation. ZrW2O8 powders were supplied by Kunming Titan Advanced Materials Co., ltd. GY 250 is typical bisphenol A epoxy resin with high viscosity. ARADUR 3225 was applied as curing agent that is suitable to GY 250. There is no need for adding diluent because GY 250 has been diluted before it is sold. The aggregate is high grade quartz sand with a purity of 99.5%. The aggregate size distribution and aggregates ratio is the same as the packing model aforementioned. ZrW2O8 with a purity of 99.5% was used as filler to improve the thermal stability of resin concrete.
The moulds were 1000 mL beakers. Release agent was coated on the surface of the beakers beforehand in order to demould easily. First, each grade of aggregates was put in successively and mixed evenly. Second, resin and curing agent were measured with measuring cylinder and stirred uniformly, then resin binder was mixed with aggregates thoroughly and stirred in a plastic bucket manually. If ZrW2O8 was added to resin concrete, there were some changes in the manufacturing process. ZrW2O8 powders after measuring and resin binder were mixed first. Then, after stirring for 5 min by hand, the mixture and aggregates were mixed and stirred in the plastic bucket. The mixture was rolled in the rotary mixer (motor model: Y90L-6; speed: 910 r/min) for about 0.5 hour so that it blended well and compacted in the moulds. Finally, we placed it under indoor temperature conditions for 24 hours and demoulded it after curing. The production process diagram is shown in Figure 4. Test samples of 50 × 25 × 10 mm3 were obtained after finished products were machined on a machine tool.
Figure 4. The production process of resin concrete.
Applsci 05 00367 g004

4.2. Experimental Technique

A strain gauge was attached to a measured sample that is connected to a bridge arm of a Wheatstone bridge. The entire circuitry is shown in Figure 5.
Figure 5. Schematic circuit diagram in this experiment.
Applsci 05 00367 g005
As the gauge produces expansion because of temperature change, the resistance of the gauge is changed accordingly [23]. The output voltage V o u t between points a and b of the bridge can be given by:
V o u t = [ V i n / ( R + R g ) ] R g [ V i n / ( 2 R ) ] R
where V i n is the voltage applied to the bridge, R g is the resistance of the strain gauge, R 4 = R 5 = R . When R g = R , the output voltage of the bridge is zero.
The CTE of the sensitive gate α g can be given by:
α e = 4 V o u t / ( K V i n Δ T ) + α g
where K is the sensitivity coefficient of the strain gauge, Δ T is the temperature change of the sample, α g is the CTE of the gauge material.
The strain gauge BX120-30AA consists of constantan foil as sensitive gate material and phenolic as substrate material. It was supplied by Taizhou Huangyan Juxing Testing Instrument Factory. The other two bridge arms were fixed resistance value and R = 120Ω. The variable one consisted of a 1000-Ω potentiometer in series with a 2400-Ω resistor and a 160-Ω resistor in parallel for zero adjustment. The temperature coefficient of resistance of these resistors is less than 25 ppm and their accuracy is no more than 0.05%. According to error analysis, the error is very little and can be ignored. With the temperature increases, the output voltage can be measured by a digital multimeter HP34401A. The sample and the Platinum resistance of temperature measurement equipment LS-1100 produced by Tianjin Overblue Technology Development Co., ltd were placed in incubator.

4.3. Experimental Results

Quartz glass sample was attached to the strain gauge in order to get α g . The CTE of quartz glass α e is 0.5 × 10⁻⁶/K and V i n = 1.400 V . When the temperature rose from T1 = 18 °C to T2 = 60 °C and the output voltage was stable, V o u t = 0.342 m V ,
α g = α e 4 V o u t / ( K V i n Δ T ) = 11.579 × 10 6 / K
where the sensitivity coefficient of the gauge K = 2.10 .
The three different samples were measured in turn. V o u t , Δ T obtained and α g were substituted in Equation (11), respectively, and the results are outlined in Table 7.
Table 7. Results in the experiment.
Sample number V o u t (mV) α e (× 10−6/K)
1−0.1476.817
2–0.2692.885
3–0.3111.504

5. Results and Discussion

In order to facilitate the discussion, the experimental data of Table 3, Table 6 and Table 7 are all shown in Figure 6. As seen in 
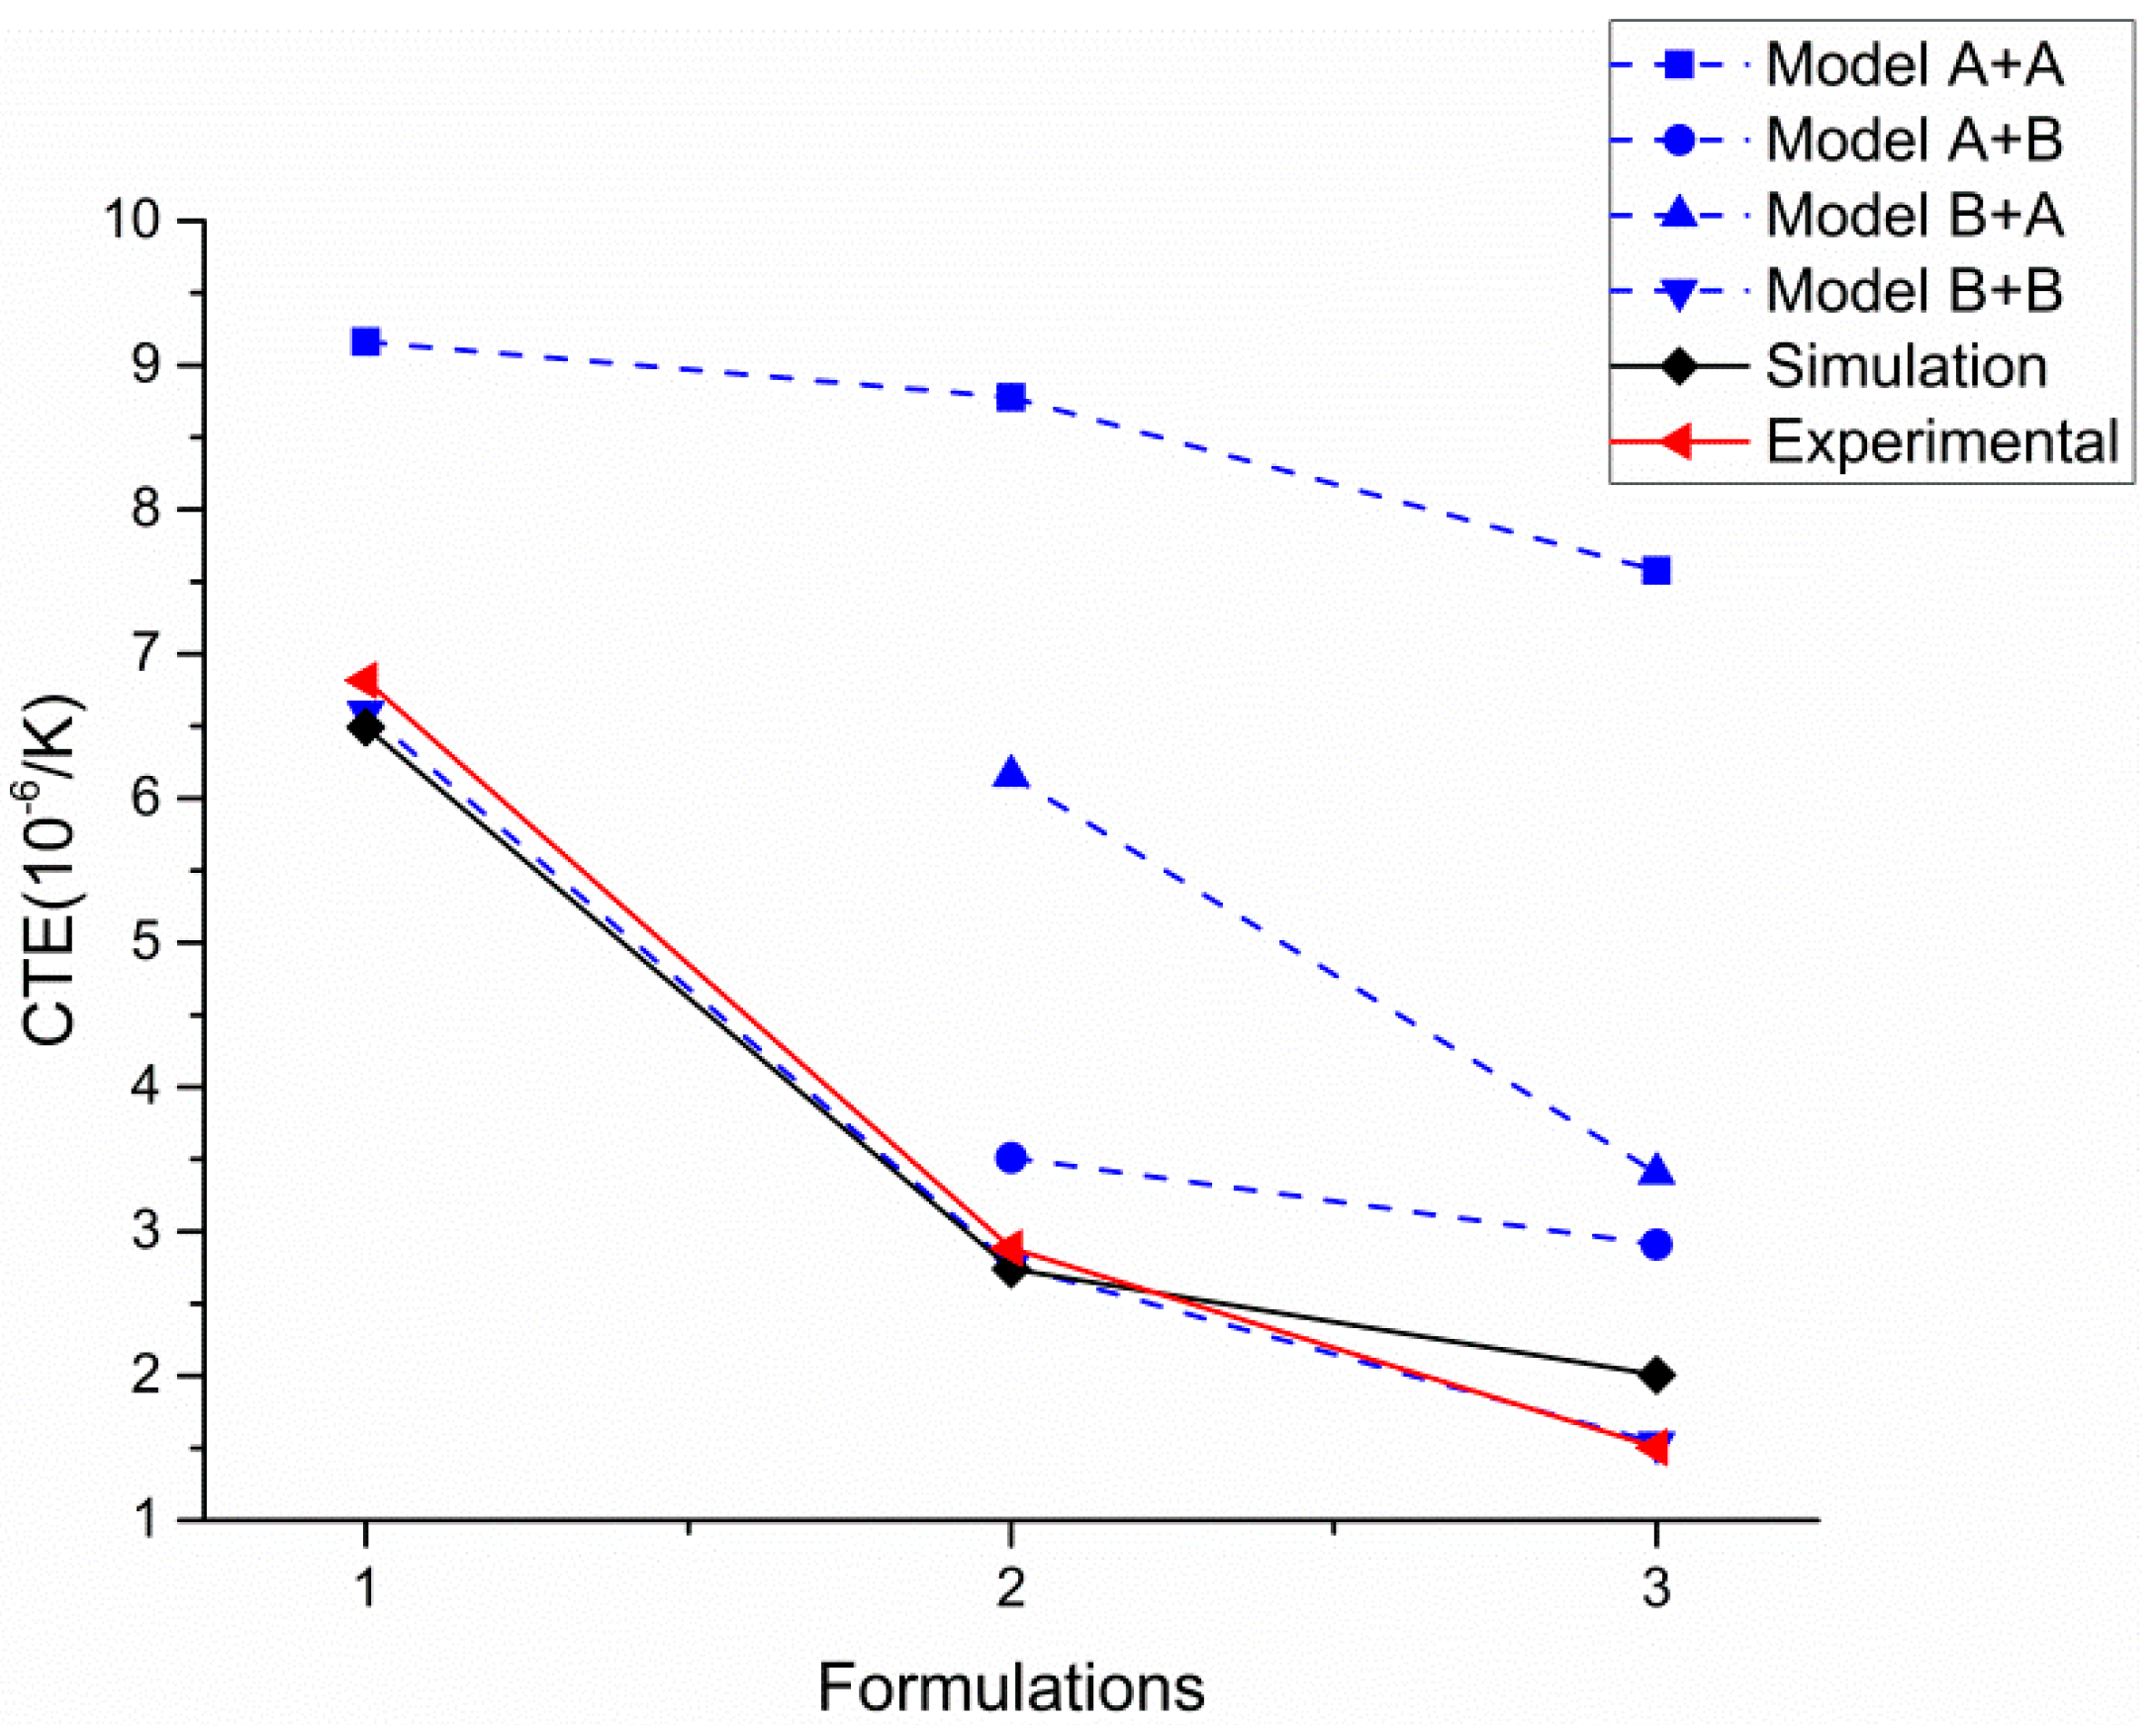
Figure 6, it might be concluded that the prediction equation of “Model-B + Model-B” and the irregular polygon model has higher accuracy because the broken lines of “Model-B + Model-B”, simulation and experiment match well with each other. For “Model-A + Model-A”, “Model-A + Model-B” and “Model-B + Model-A”, there are obvious deviations due to neglecting interactions between components. The addition of ZrW2O8 can significantly reduce the CTE of resin concrete. Sample No.3 has lower CTE than the other two samples. The volume ratio of aggregate to ZrW2O8 powders is an important factor which influences the concrete CTE.
Figure 6. Comparison between prediction, simulation and experimental results.
Applsci 05 00367 g006

6. Conclusions

In this paper, the influence of addition of ZrW2O8 to resin concrete was investigated. A prediction algorithm on CTE of resin concrete (including filler) was established on the basis of the meso-mechanics method and a three-phase model for concrete. Four CTE computational models were deduced based on the consideration of interactions between inclusions and the effect, if any, of inclusions on the matrix and the twice mixing method. A 2D and 3D irregular polygon aggregate particles packing model was set up and the concrete CTE was analyzed by the finite element method. From the experiment, it was found that the addition of ZrW2O8 to resin concrete showed appreciable reduction in thermal expansion and mix proportion had an effect on CTE. By comparing all the results, the irregular polygon model was found to have very high simulation precision. The computational model of “Model-B + Model-B” has higher precision than the other three models. It proves that the accuracy of models can be improved effectively when considering interactions between components of resin concrete. The optimum CTE obtained was 1.504 × 10⁻⁶/K when the volume ratio of aggregate to ZrW2O8 powder was 8:2.

Acknowledgments

This work was supported by the national key science and technology projects of China. Project Grant No.2011ZX04016-011.

Author Contributions

Establishment of models and simulation: Shuang Qiu; Performing the experiment: Kuangzhe Lin; Drafting of manuscript: Kuangzhe Lin, Shuang Qiu; Critical revision: Bin Lin, Yuguo Wang; Planning and supervision of the research: Bin Lin.

Conflicts of Interest

The authors declare no conflict of interest.

References

  1. Kofteros, M.; Rodrigues, S.; Tandon, V. A preliminary study of thermal expansion compensation in cement by ZrW2O8 additions. Scripta. Mater. 2001, 45, 369–374. [Google Scholar] [CrossRef]
  2. Yilmaz, S.; Dunand, D.C. Finite-element analysis of thermal expansion and thermal mismatch stresses in a Cu-60vol%ZrW2O8 composite. Compos. Sci. Technol. 2004, 64, 1895–1898. [Google Scholar] [CrossRef]
  3. Turner, P.S. Thermal expansion stresses in reinforces plastics. J. Res. Nat. Bur. Stand. 1946, 37, 239–250. [Google Scholar] [CrossRef]
  4. Tummala, R.R.; Friedberg, A.L. Thermal expansion of composite materials. J. Appl. Phys. 1970, 41, 5104–5107. [Google Scholar] [CrossRef]
  5. Kerner, E.H. The elastic and thermo-elastic properties of composite media. Proc. Phys. Soc. Sect. B 1956, 69, 808. [Google Scholar] [CrossRef]
  6. Nielsen, L.E. Mechanical properties of particulate-filled systems. J. Compos. Mater. 1967, 1, 100–119. [Google Scholar]
  7. Schapery, R.A. Thermal expansion coefficients of composite materials based on energy principles. J. Compos. Mater. 1968, 2, 380–404. [Google Scholar] [CrossRef]
  8. Hashin, Z.; Shtrikman, S. A variational approach to the theory of the elastic behaviour of multiphase materials. J. Mech. Phys. Solids. 1963, 11, 127–140. [Google Scholar] [CrossRef]
  9. Emanuel, J.H.; Hulsey, J.L. Prediction of the thermal coefficient of expansion of concrete. ACI J. Proc. 1977, 74, 149–155. [Google Scholar]
  10. Venecanin, S.D.T. Hermal incompatibility of concrete components and thermal properties of carbonate rocks. ACI Mater. J. 1990, 87, 602–607. [Google Scholar]
  11. Sellevold, E.J.; Bjøntegaard, Ø. Coefficient of thermal expansion of cement paste and concrete: Mechanisms of moisture interaction. Mater. Struct. 2006, 39, 809–815. [Google Scholar] [CrossRef]
  12. Wyrzykowski, M.; Lura, P. Controlling the coefficient of thermal expansion of cementitious materials―A new application for superabsorbent polymers. Cem. Concr. Compos. 2013, 35, 49–58. [Google Scholar] [CrossRef]
  13. Zhou, C.; Shu, X.; Huang, B. Predicting concrete coefficient of thermal expansion with an improved micromechanical model. Constr. Build. Mater. 2014, 68, 10–16. [Google Scholar] [CrossRef]
  14. Mukhopadhyay, A.K.; Neekhra, S.; Zollinger, D.G. Preliminary characterization of aggregate coefficient of thermal expansion and gradation for paving concrete; Report 0-1700-5; Texas Transportation Institute: College Station, TX, USA, 2007. [Google Scholar]
  15. Naik, T.R.; Chun, Y.M.; Kraus, R.N. Influence of types of coarse aggregates on the coefficient of thermal expansion of concrete. J. Mater. Civil. Eng. 2010, 23, 467–472. [Google Scholar] [CrossRef]
  16. Kim, H.S.; Park, K.Y. A study on the epoxy resin concrete for the ultra-precision tool bed. J. Mater. Process. Technol. 1995, 48, 649–655. [Google Scholar] [CrossRef]
  17. Haddad, H.; Al Kobaisi, M. Optimization of the polymer concrete used for manufacturing bases for precision tool machines. Compos. Part. B 2012, 43, 3061–3068. [Google Scholar] [CrossRef]
  18. Zhang, Z.; Zhang, Y.; Song, Z. Prediction on thermal expansion coefficient of concrete based on meso-mechanics method. Chin. J. Comput. Mech. 2007, 24, 806–810. [Google Scholar]
  19. Zheng, J.; Zhou, X.; Jiang, L. Three-phase composite sphere model for the prediction of Young’s modulus of concrete. Acta Mater. Compos. Sin. 2005, 22, 102–107. [Google Scholar]
  20. Li, G.; Zhao, Y.; Pang, S.S. Four-phase sphere modelling of effective bulk modulus of concrete. Cem. Concr. Res. 1999, 29, 839–845. [Google Scholar] [CrossRef]
  21. Ueda, T.; Matsusgima, T.; Yamada, Y. Micro structures of granular materials with various grain size distribution. Powder Technol. 2012, 217, 533–539. [Google Scholar] [CrossRef]
  22. Hashimoto, Y.; Kanai, T.; Furuya, Y. Resin concrete composition and molded article thereof. US6221935, 24 April 2001. [Google Scholar]
  23. Fox, J.N. Measurement of thermal expansion coefficients using a strain gauge. Am. J. Phys. 1990, 58, 875–877. [Google Scholar] [CrossRef]

