Abstract
Initial studies on aging detection of three way catalysts with a microwave cavity perturbation method were conducted. Two physico-chemical effects correlate with the aging state. At high temperatures, the resonance frequencies for oxidized catalysts (λ = 1.02) are not influenced by aging, but are significantly affected by aging in the reduced case (λ = 0.98). The catalyst aging state can therefore potentially be inferred from the resonance frequency differences between reduced and oxidized states or from the resonance frequency amplitudes during lambda oscillations. Secondly, adsorbed water at low temperatures strongly affects the resonance frequencies. Light-off experiment studies showed that the resonance frequency depends on the aging state at temperatures below the oxygen storage light-off. These differences were attributed to different water sorption capabilities of differently aged samples due to a surface area decrease with proceeding aging. In addition to the aging state, the water content in the feed gas and the temperature affect the amount of adsorbed water, leading to different integral electrical material properties of the catalyst and changing the resonance properties of the catalyst-filled canning. The classical aging-related properties of the catalyst (oxygen storage capacity, oxygen storage light-off, surface area), agreed very well with data obtained by the microwave-based method.
1. Introduction
Increasingly tighter emission limits, along with the pressure on the automotive industry to reduce fuel consumption, require new concepts for controlling and monitoring of emission reduction systems [1,2].
To abate exhaust gas emission of gasoline engines, three-way catalysts (TWC) are used. They consist of ceramic honeycomb monoliths, mostly of cordierite, with small channels that are coated with a so-called washcoat. A typical washcoat consists of carrier oxides of stabilized alumina, highly dispersed precious metals (Pt, Rh, and Pd) and an oxygen buffer of ceria zirconia solid solutions [3]. The washcoat provides specific surfaces in the range of 100 m2/g.
For stoichiometrically operated gasoline engines, the air-fuel ratio (λ) is determined in the exhaust gas by means of a first lambda probe. When a deviation from the nominal stoichiometric value of λ = 1 occurs, the air-fuel ratio is adjusted. As an average over time, a stoichiometric value of about λ = 1 must be ensured. An optimal conversion occurs only as long as the catalyst is still in good condition, i.e., as long as it is not “aged”. A decreasing catalyst quality leads to a decrease in the conversion of harmful and limited exhaust components like hydrocarbons (HC), carbon monoxide (CO), and nitrogen oxides (NOx), and to an increase in the light-off temperature. These effects are correlated with the ability of the TWC to store oxygen. A second lambda-probe arranged downstream of the TWC is able to detect this. By an indirect method, the state of the oxygen storage catalyst, more exactly the oxidation state of the applied ceria in the washcoat, is deduced from the signals of the two lambda-probes applying complicated models. More details on the present state-of-the-art can be found in the literature [4,5].
A relatively new approach to determine the state of catalysts in situ uses the so-called microwave cavity perturbation method. It measures directly the ceria oxidation state as has been shown previously by careful titrations experiments [6]. It allows also to find more exactly the point of best operation, which depends slightly on the type of reducing agents and hence on the type and quality of the fuel (gas, gasoline, bio fuel, etc.) and on the combustion processes. Even more, a TWC model from [7] could have been quantitatively validated [8]. First attempts to control a TWC-based exhaust gas aftertreatment system have also been published [9,10].
This microwave-based method has been successfully studied in lab experiments [11] as well as in an engine dynamometer test benches [12]. Even for novel exhaust catalyst systems, like NH3-SCR catalysts, where the amount of stored ammonia needs to be detected [13] or for diesel particulate filters, where the amount of stored soot is an important measurand [14], this microwave-based technique can be applied. A recent overview on this technique is given in [15].
For a simplified arrangement of the microwave-based technique, the canning of the catalyst forms a cavity resonator, which is filled with the TWC monolith including its washcoat. As a “sensing element”, one coaxial antenna is installed into the canning. The resonance behavior of such a device depends on the electrical material parameters (conductivity and complex permittivity) of the catalyst device. Because the electrical properties of the cordierite honeycomb are not dependent on the exhaust composition, but the properties of the catalytically active washcoat depend on the state of the catalyst, the resonance behavior can be used as a measure for the oxidation state of ceria in the washcoat, which correlates fully with the conductivity of ceria in the ceria-zirconia storage material [16].
The resonance parameters can be determined by the S-parameters [17] in transmission (S21 or S12) if one uses two antennas or in reflection with only antenna as it is the case in this study. Then the reflection parameter S11 shows distinct minima, each of them can be attributed to distinct resonance modes and the corresponding resonance frequencies, fres. A typical S11-spectrum around a resonance mode is shown in Figure 1b. Further details on the microwave cavity perturbation method applied in the automotive exhaust can be found in [15,18,19].
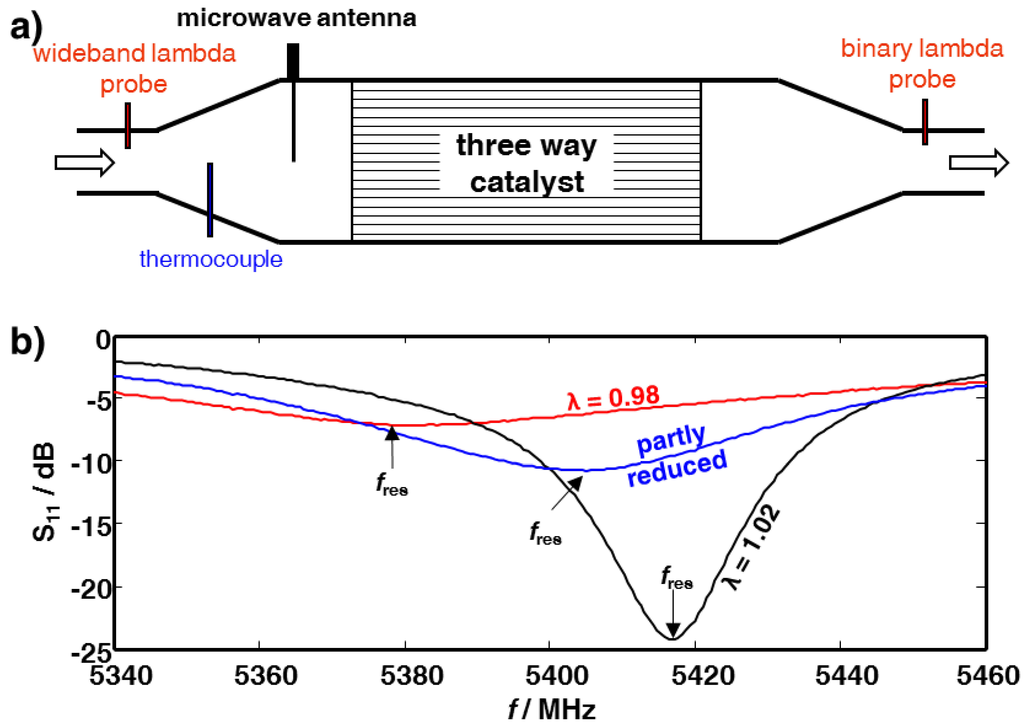
Figure 1.
(a) Sketch of the setup. (b) Typical resonance spectra in the reduced and in the oxidized state (data: 500 °C, lean: λ = 1.02, rich: λ = 0.98). The resonance frequency is indicated by an arrow. Peak width (FWHM) or reflection parameter at fres were not considered further.

Prior investigations with this method on the state observation of three-way catalysts with the size of ∅4.66″ × 6″ (∅11.84 cm × 15.24 cm; full size as it is installed in the exhaust pipe) [11,12,20] and ∅1″ × 3″ (∅2.54 cm × 7.62 cm; typical lab sample) [6,8] have shown that there is a good correlation between the resonance parameter “resonance frequency” and the catalysts’ oxidation states.
This work reports for the first time on an initial study to investigate whether the microwave-based technique can also be used to detect the aging state of the catalyst.
2. Experimental Section
The results shown in this work were obtained in a dynamic test bench for ∅1″ × 3″ catalyst cores. A TWC sample with a precious metal loading of 100 g/ft3 (Pt:Pd:Rh = 1:8:1) was used in three different aging states. After obtaining results in a fresh state, the sample was aged at 850 °C for 12 h (aging state ①) and in a further step at 1050 °C for 12 h under cycling lean-rich conditions (aging state ②). All tests were conducted with a constant flow rate of 2500 L/h, which corresponds to a gas-hourly space velocity of about 65,000 h−1. Prior to each test, the catalyst samples were pre-conditioned at 600 °C under cycling lean-rich atmosphere and cooled down in nitrogen atmosphere.
The gas-mixture of the shown light-off experiments were composed of 10% H2O, 10% CO2, 1000 ppm NO and 333 ppm C3H8 in N2. To adjust the air-fuel ratio λ of the feed gas, O2, CO and H2 were added. For that purpose, CO and H2 were premixed in a constant ratio of 3:1, with a minimum value of 2000 ppm CO. For a lean feed gas with λ ≥ 1, the oxygen concentration was varied and for the rich compositions with λ < 1, the CO and H2 concentration was varied at a constant O2 concentration of 2498 ppm. The λ-value was calculated using the feed gas concentration of each component i, whereby Xi denotes its mole fraction (adapted from [7]):
The microwave measurement system consists of an upstream-located stub-like coaxial antenna connected via coaxial cable to a vector network analyzer (VNA Master MS2028C, Anritsu, München, Germany). Additionally, a thermocouple and a wideband lambda probe (UEGO) was installed upstream, a binary lambda probe (EGO) was installed downstream of the catalyst. A schematic sketch of the test setup is shown in Figure 1a. Similarly to [12], no attempt has been made at this stage to optimize the coupling of the feeds to the resonator (i.e., to optimize the position and the length of the antennas) because, in contrast to applications, in which the dielectric properties should be measured under process conditions [21], it was the intention to disturb the resonator anyway with the catalyst filling. Therefore, with this system only relative changes in the resonance behavior can be measured.
3. Results and Discussion
3.1. Aging Dependency of the Resonance Frequencies of Reduced Ceria
Since the aging degree of a TWC is correlated with its light-off temperature [22], and since the resonance frequency depends on catalyst temperature [6], the first series of experiments investigated the temperature dependence of the samples at different aging states in light-off experiments. At each aging state of the catalyst sample, three light-off experiments were conducted. Two runs were conducted under constant lean atmosphere of λ = 1.02 or under rich atmosphere at λ = 0.98. Starting at 80 °C, the temperature was increased with a constant rate heating of 20 K/min up to 600 °C. The third test was performed under periodical lean-rich switching between λ = 0.98 and 1.02 for 20 s each and a constant increase of the temperature with a rate of 10 K/min.
The resonance frequencies obtained during heating for the fresh and the differently aged TWC samples are shown in Figure 2.
At low temperatures, the resonance frequencies increase in all cases up to a maximum at about 190 °C followed by a decrease. Indicated by differences between the resonance frequency curves obtained from constant rich and lean feed gas as well as by the amplitudes of the air-fuel ratio oscillations, the catalysts’ oxygen storage capacity is reduced with each aging step. This observation is mirrored by the calculated oxygen uptake of the sample when the step-like rich-lean changes in the feed gas are applied during heating. By integrating the excess oxygen, the amount of stored oxygen was calculated. It was based on the approach and equations reported in [23]. For that purpose, rich-lean switch were conducted. The integration started when the lambda probe signal upstream of the catalyst indicated a lean atmosphere and ended when the lambda probe downstream of the catalyst indicated lean exhausts. The results are shown in Figure 3 for samples in all three aging states.
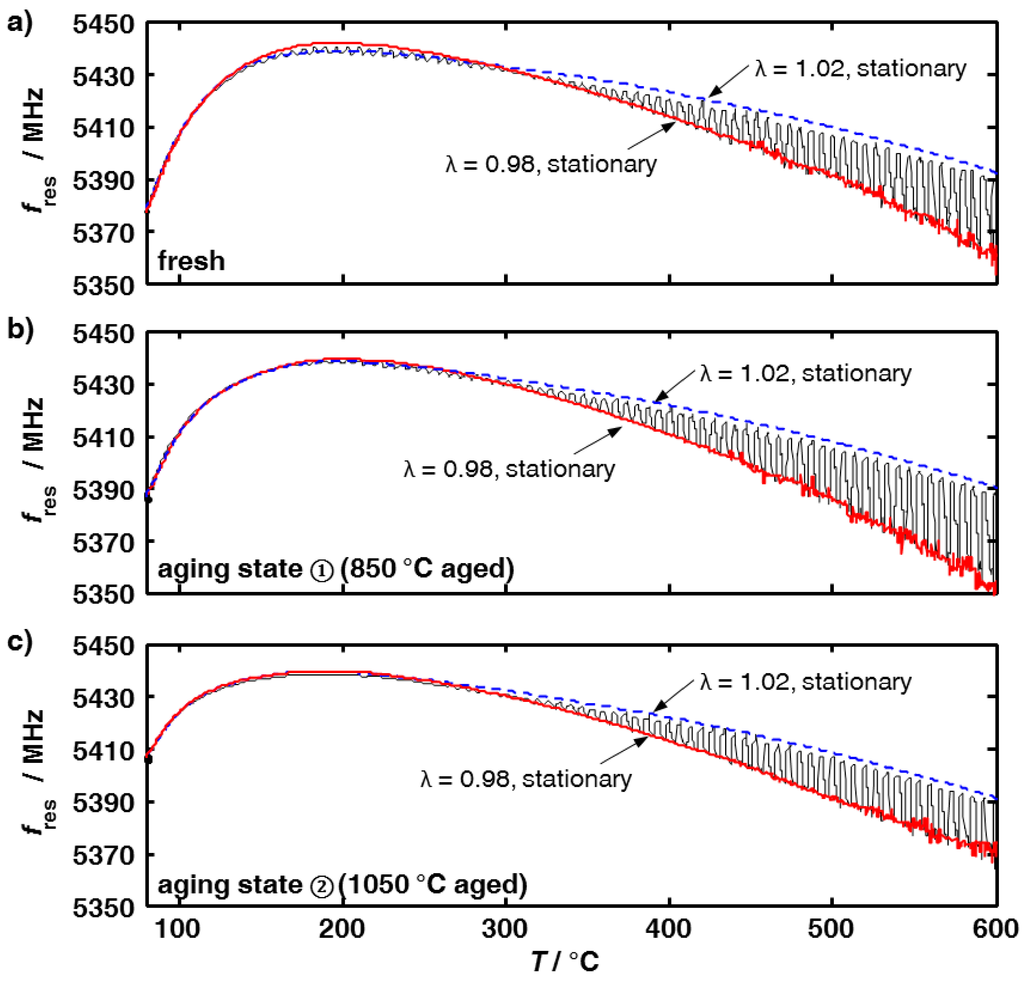
Figure 2.
Resonance frequencies of a fresh and aged TWC samples at constant feed gas composition with λ = 1.02 (dotted blue line) and λ = 0.98 (drawn red line) and with alternating λ (black line) during light-off tests: (a) fresh sample; (b) aging state ① (850 °C, 12 h); and (c) aging state ② (1050 °C, additional 12 h).
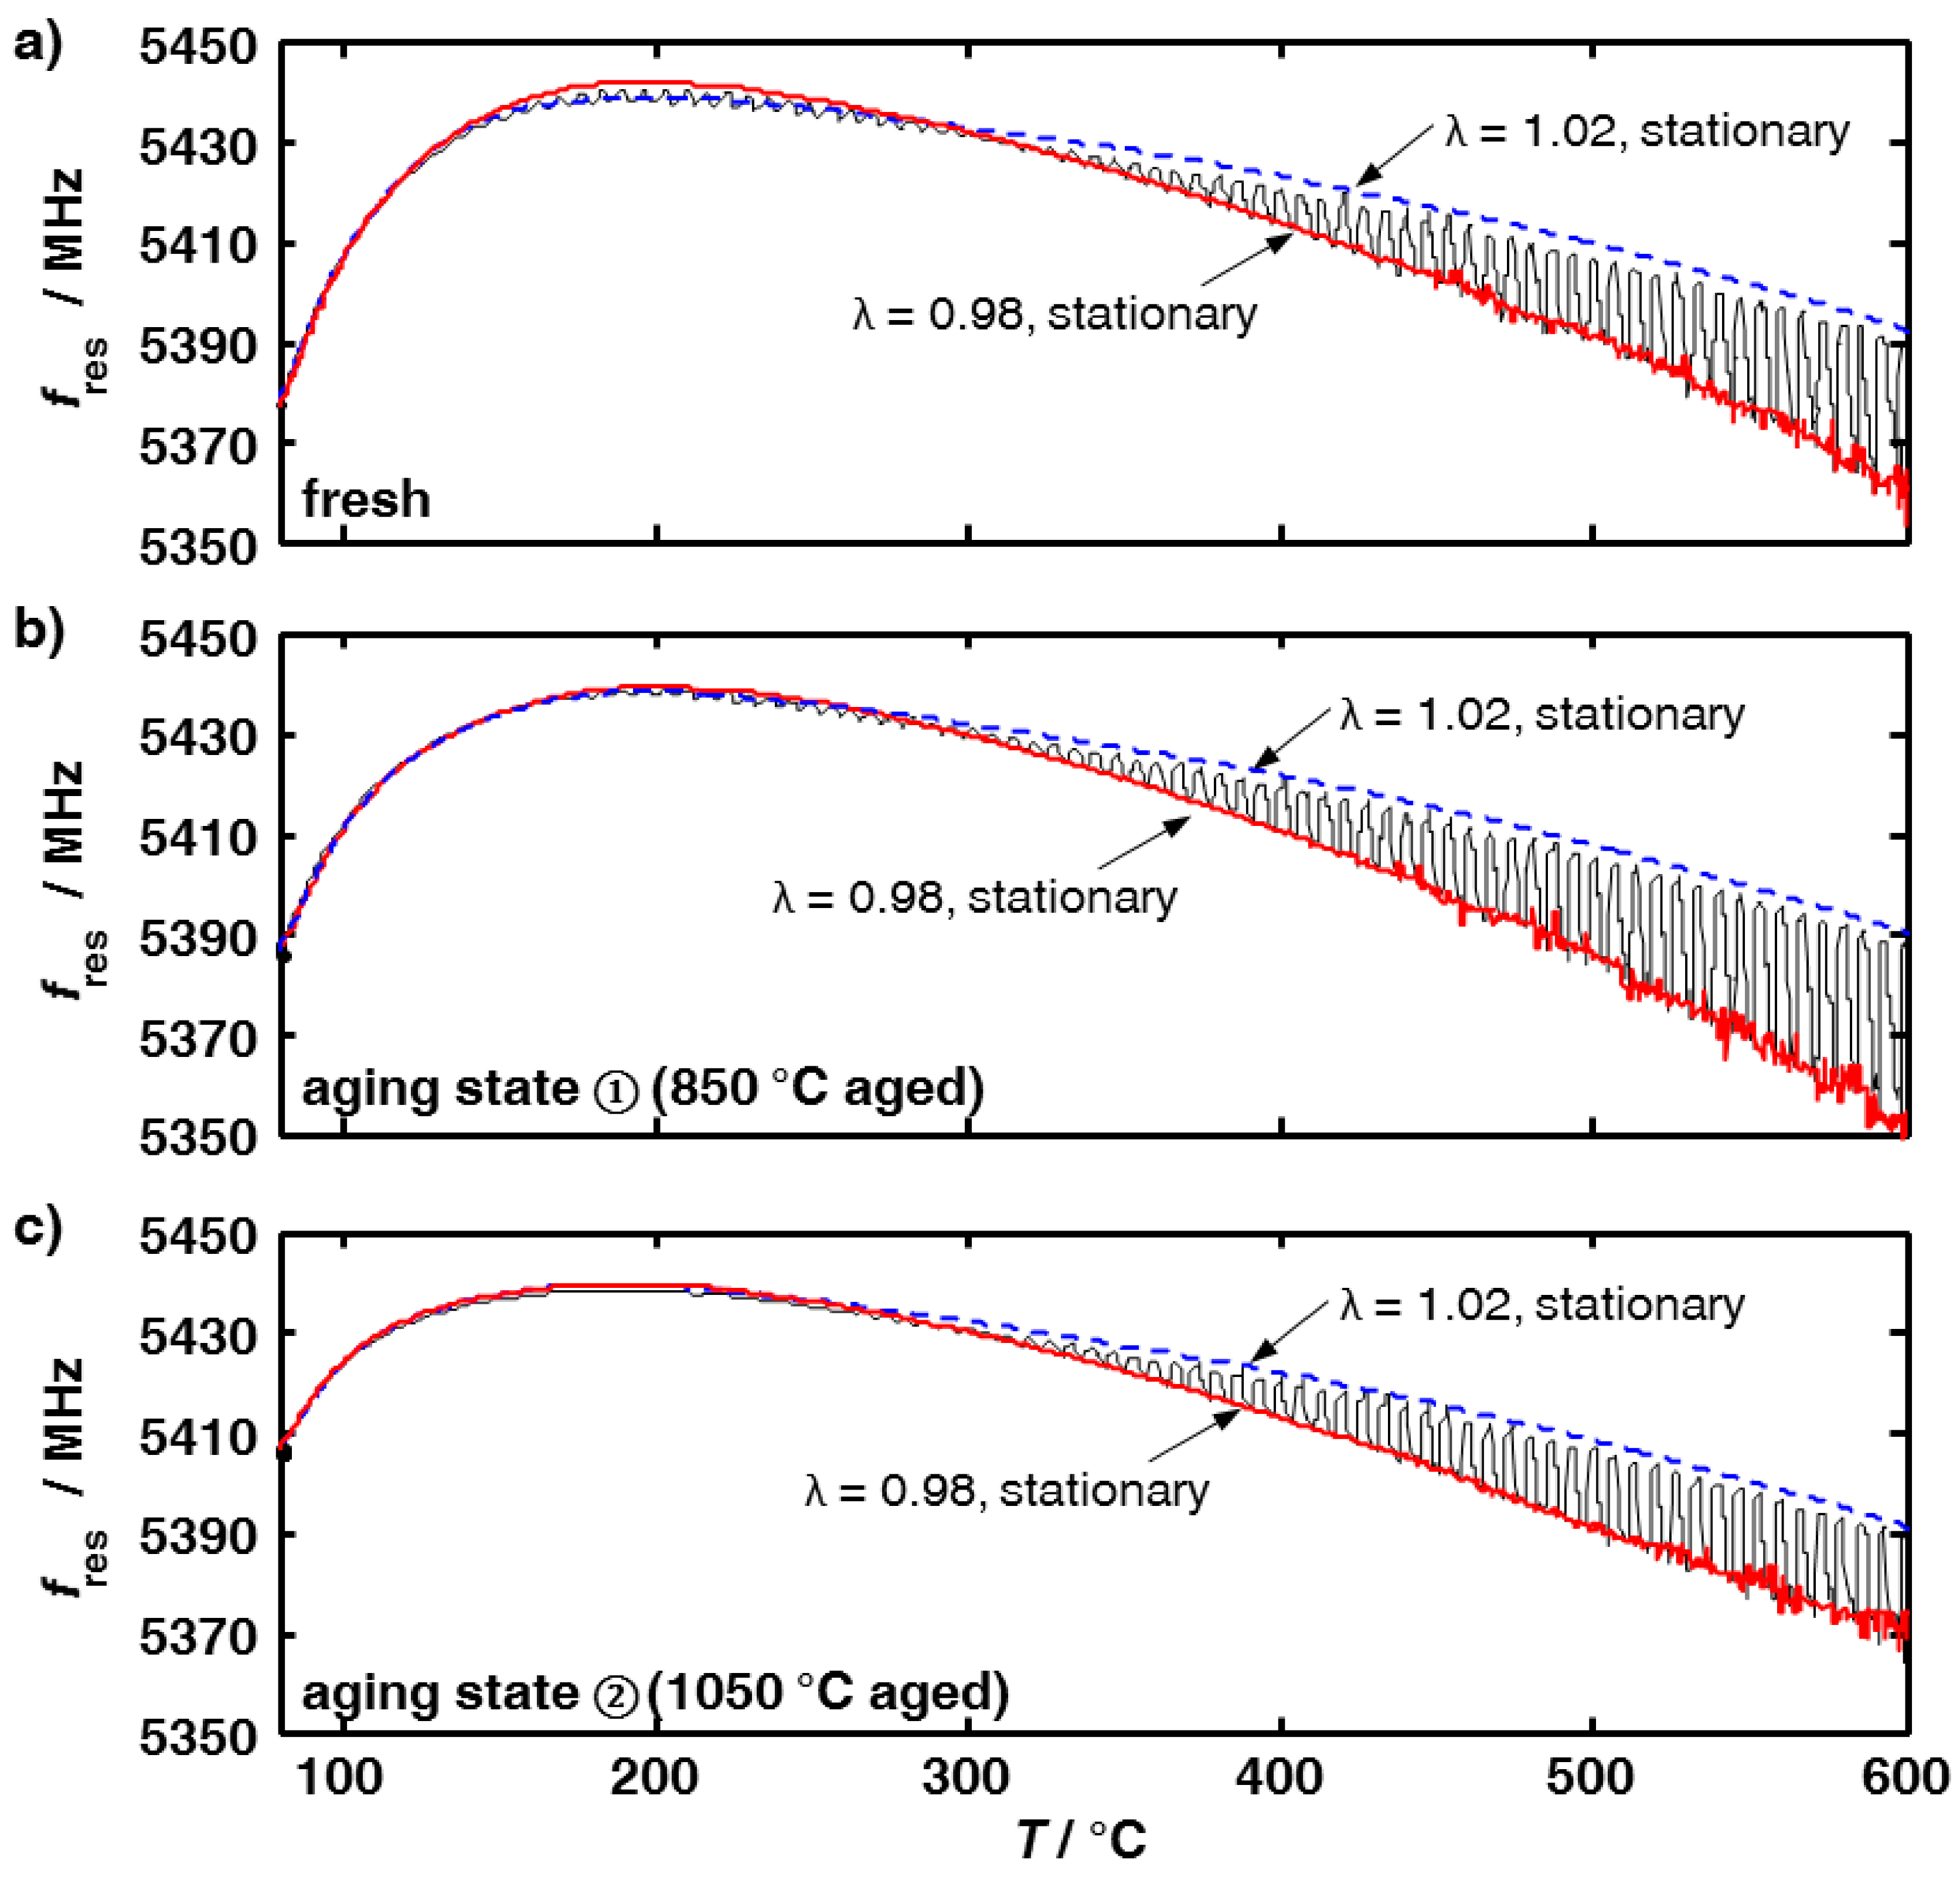
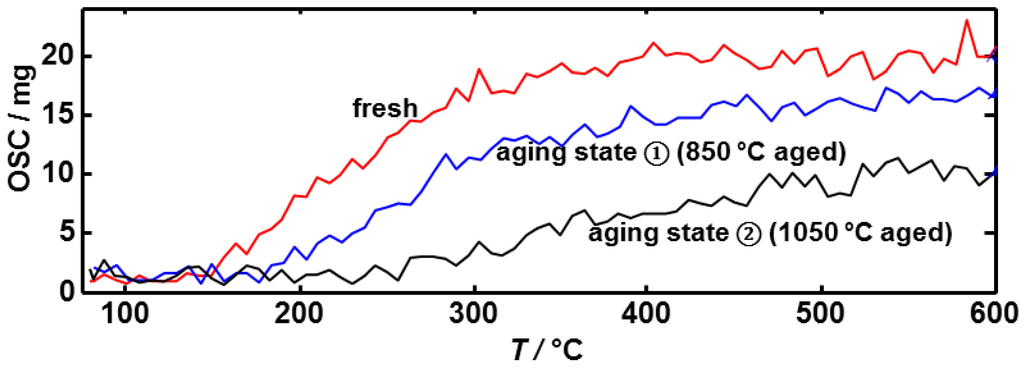
Figure 3.
Oxygen storage capacity (OSC) during light-off tests with alternating rich-lean feed gases for samples with three different aging states.

Besides the OSC decrease that occurs at higher temperature of some hundreds of degrees Celsius with aging, one finds an increasing OSC in the lower temperature range for both fresh and aged samples.
Let us consider Figure 2 in detail. At λ = 1.02, the oxygen buffer is completely filled up, i.e., ceria exists in the form of Ce4+. Therefore, the temperature dependency of the resonance frequency cannot be due to changes in the oxidation state of ceria. The line for λ = 1.02 can therefore be considered as a baseline, indicating the “full” oxygen buffer. Its temperature dependency may be explained by the volume expansion of the catalyst housing with temperature in conjunction with the increase of the electrical conductivity, as expected for an oxide semiconductor [24]. Both effects affect the resonance frequency. This has already been demonstrated in [25]. The resonance frequency differences between the curves at λ = 0.98 and 1.02, however, increase with increasing temperature. On the one hand, the electrical material properties, mainly the conductivity, of Ce3+ are different to those of Ce4+ [24]. On the other hand, the ratio of Ce3+ to the total ceria amount increase with temperature at a constant feed gas λ of 0.98 resulting in a stronger decreasing curve compared to the one at λ = 1.02.
In the fresh state, an additional effect can be observed in the resonance frequency plot in Figure 2a. Between a temperature of about 150 °C and 270 °C, the resonance frequency curve obtained under rich conditions is slightly above the one measured at λ = 1.02. This is just mentioned here; it will be discussed later.
The very small differences in the resonance frequency between the tests with constant feed gas and the ones with alternating atmospheres can be explained by a slightly different temperature downstream of the catalyst as a result of the different exothermicities of the occurring reactions.
One of the key functionalities of the three way catalysts is their oxygen storage capacity to buffer lean-rich variations in the feed gas stoichiometry. By thermal and chemical stress, this oxygen storage capacity decreases with time and has to be monitored in automotive engine exhaust applications (on board diagnosis, OBD). In this study, the OSC was calculated in accordance to ([23], pages 25–28, 140). Thereby, the excess oxygen was integrated starting at a rich-lean change (indicated by the upstream-located wideband lambda-probe λ > 1) and ending indicated by a detected lean exhaust downstream of the catalyst (UEgo < 450 mV). As can be seen in Figure 3, the calculated OSC using the data of the lambda probes up- and downstream the catalyst decreases with proceeding aging. The amount of stored oxygen decreases by about 20% between the fresh state and the first aging state ①, and by about further 37% between aging state ① and aging state ② at a catalyst temperature of 600 °C. Altogether, a 50% OSC decrease can be noted between the fresh and the second aging state.
Since at 600 °C all resonance frequencies at λ = 1.02 are equal, and since water adsorption can be neglected at this high temperature, it can be assumed that due to the ageing procedure no material loss occurs and therefore, the same amount of ceria is available on the catalyst. Due to aging, the TWC is less reduced under the same reducing conditions, here at λ = 0.98. Therefore, the differences in the resonance frequencies ∆fres measured between λ = 0.98 and 1.02 get increasingly smaller with proceeding catalyst aging since the catalyst gets less reduced with increased OSC loss.
The resonance frequency difference at 600 °C after the first aging step is ∆fres = 38.6 MHz and ∆fres = 22.2 MHz for the second aging, which is a reduction of about 42% between both aging steps. This is in the same range as the OSC deterioration of about 37%.
3.2. Microwave-Based Detection of Aging State Dependent Water Adsorption at Low Temperatures
A further aging-dependent difference in the resonance data can be seen at low temperatures below 180 °C. Figure 4 shows the time dependent resonance frequencies and temperatures during heating under a constant feed gas atmosphere at λ = 1.02. The resonance frequencies at the starting point of the temperature ramp at T = 80 °C differ from each other depending on the aging state. With increasing temperature, the resonance frequencies increase. The steepness of the curves, or, in other words, the time-derivative dfres/dt, respectively, the temperature dependency dfres/dT, differ depending on the aging state. For temperatures T > 180 °C, however, all resonance frequencies have the same value.

Figure 4.
Resonance frequencies of a fresh (red), at 850 °C aged (blue, aging state ①) and at 1050 °C aged (black, aging state ②) TWC-sample at the beginning of light-off tests with a ramp of 20 °C/min and a constant lean feed gas of λ = 1.02 as well as the corresponding feed gas temperatures.
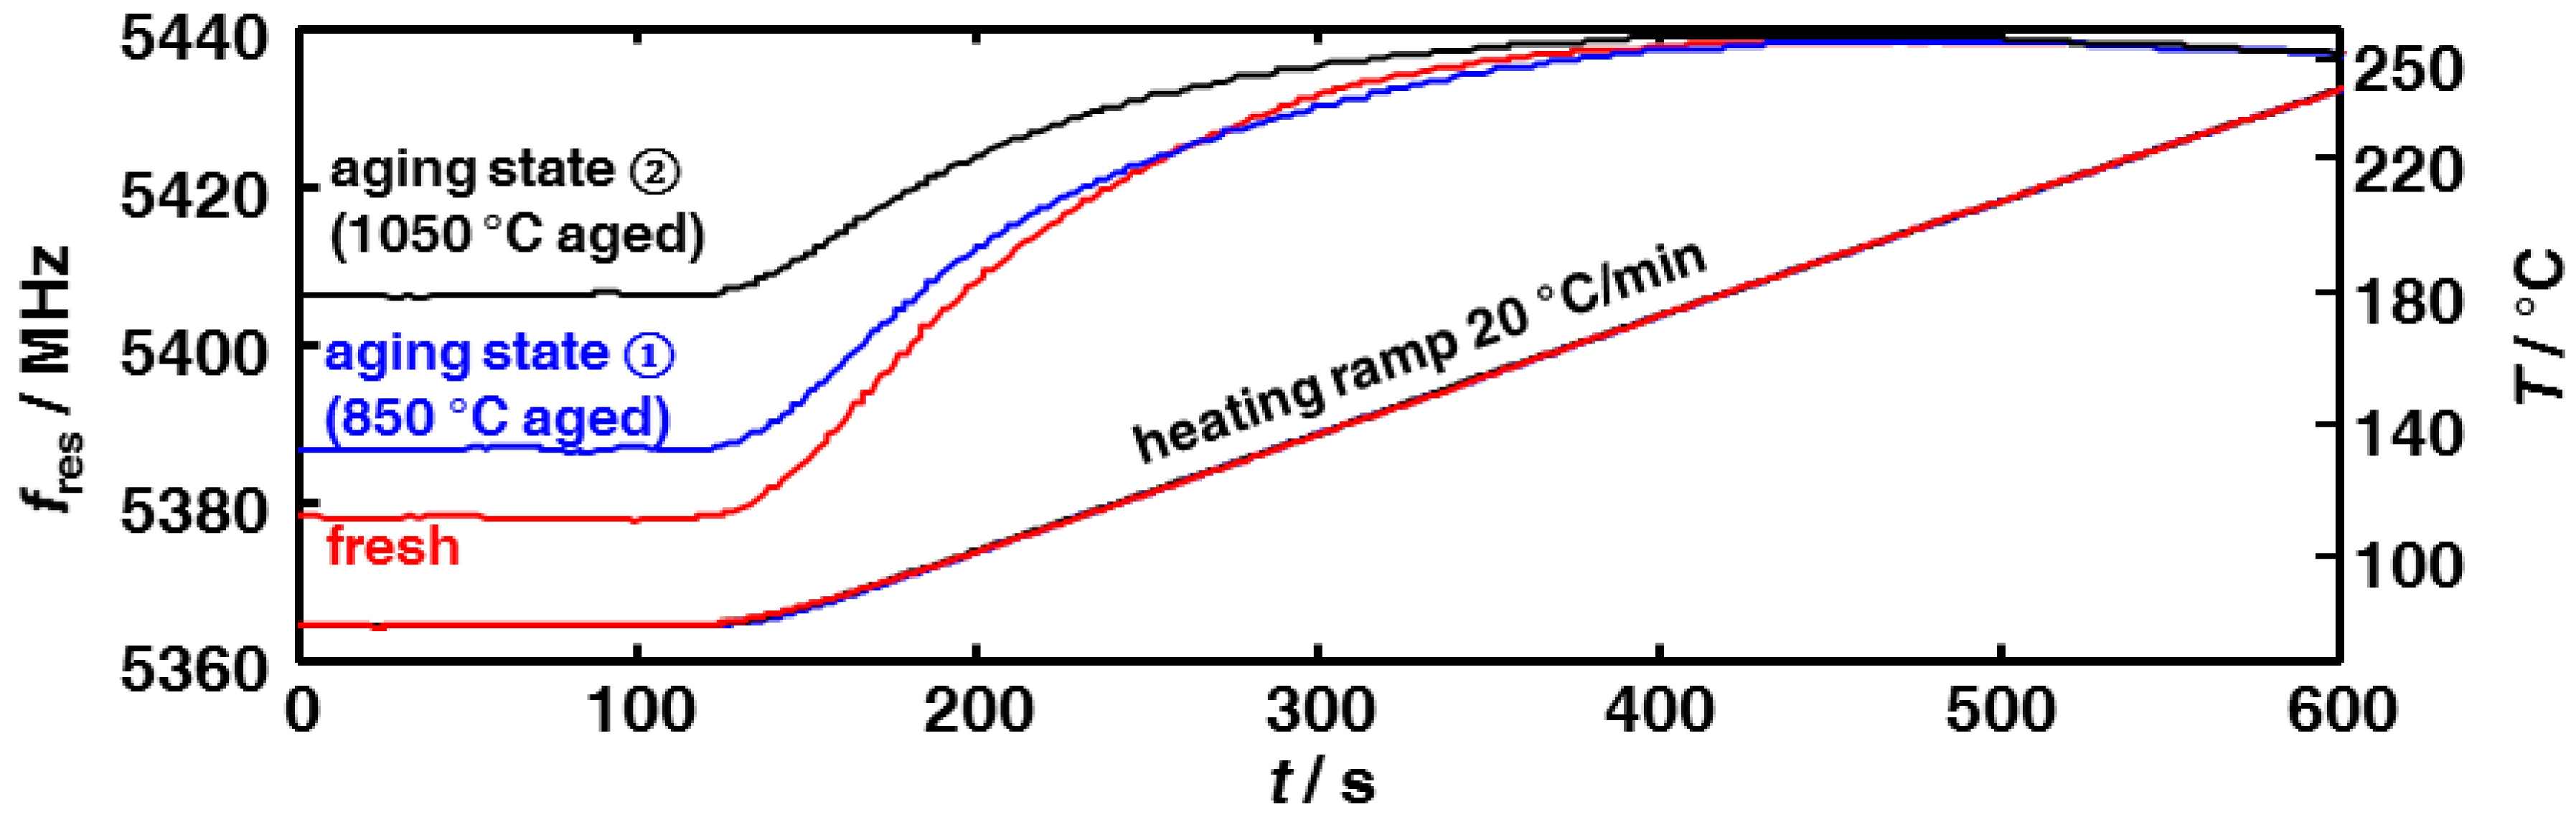
The observed resonance frequency increases at low temperatures and their dependence on the aging state can be explained by assuming an effect of adsorbed water on the microwave signal. Therefore, the water influence is investigated further.
Since the oxidation state of ceria under rich conditions is dependent on temperature and on the oxygen partial pressure, the following experiments are conducted in lean atmosphere to ensure that all ceria exists in form of Ce4+. The gas mixture was calculated according to Equation (1) to λ = 1.05 with a water content of 10 vol. %. All feed gas species were then kept constant, with the exception of water, which was varied between 0 and 10 vol. % in steps of 2% balanced with N2 to a total flow rate of 2500 L/h. Additionally, the feed gas temperature was varied between 70 and 300 °C. The water content at all tested conditions was below the dew point to avoid condensation.
Figure 5 shows for the fresh catalyst sample the resonance frequency differences (∆fres) between water containing and water free feed gas. A huge influence on the water content can be seen. With increasing temperature, this influence gets smaller. The dependence is in accordance to results on the influence of relative humidity between 13 °C and 80 °C obtained on measurements with diesel particulate filter substrates [25].
It is well known from Al2O3-based humidity sensors that Al2O3, which is part of the washcoat to provide a high surface area, is able to adsorb water [26]. Temperature programmed desorption experiments on Al2O3 in [27,28] have shown that water still desorbs at temperatures above the here-tested 300 °C. Nanosized ceria is able to sorb water as well [29]. It is even considered as a material for humidity sensors [30] since its electrical impedance changes by decades with water in the ambience.
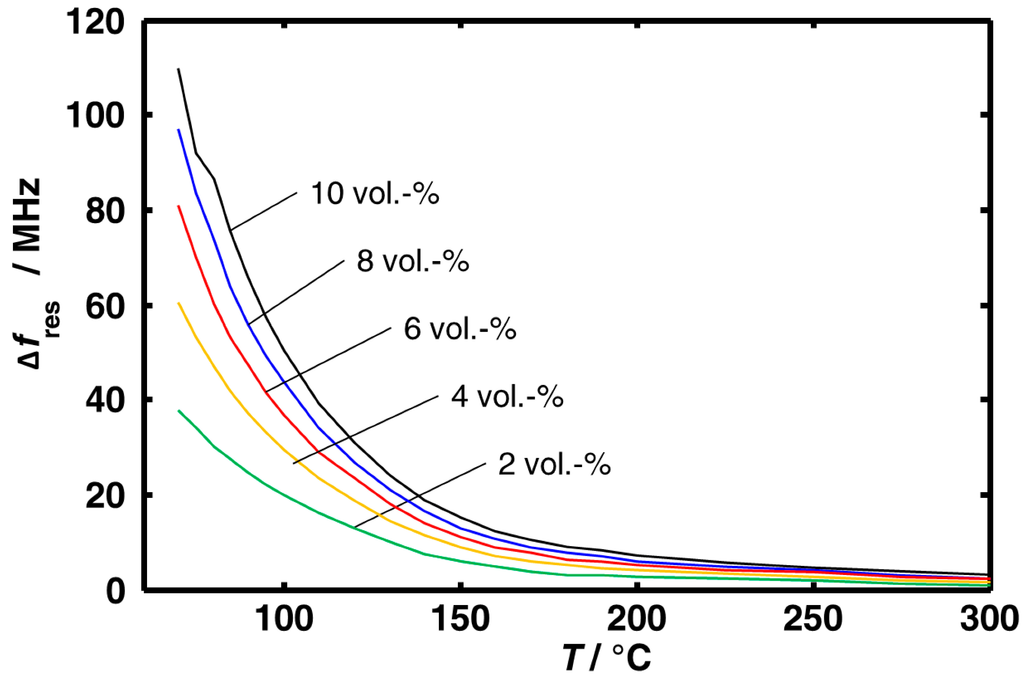
Figure 5.
Resonance frequency differences, ∆fres, between water free and 2–10 vol. % water containing feed gas, measured with a fresh catalyst sample.
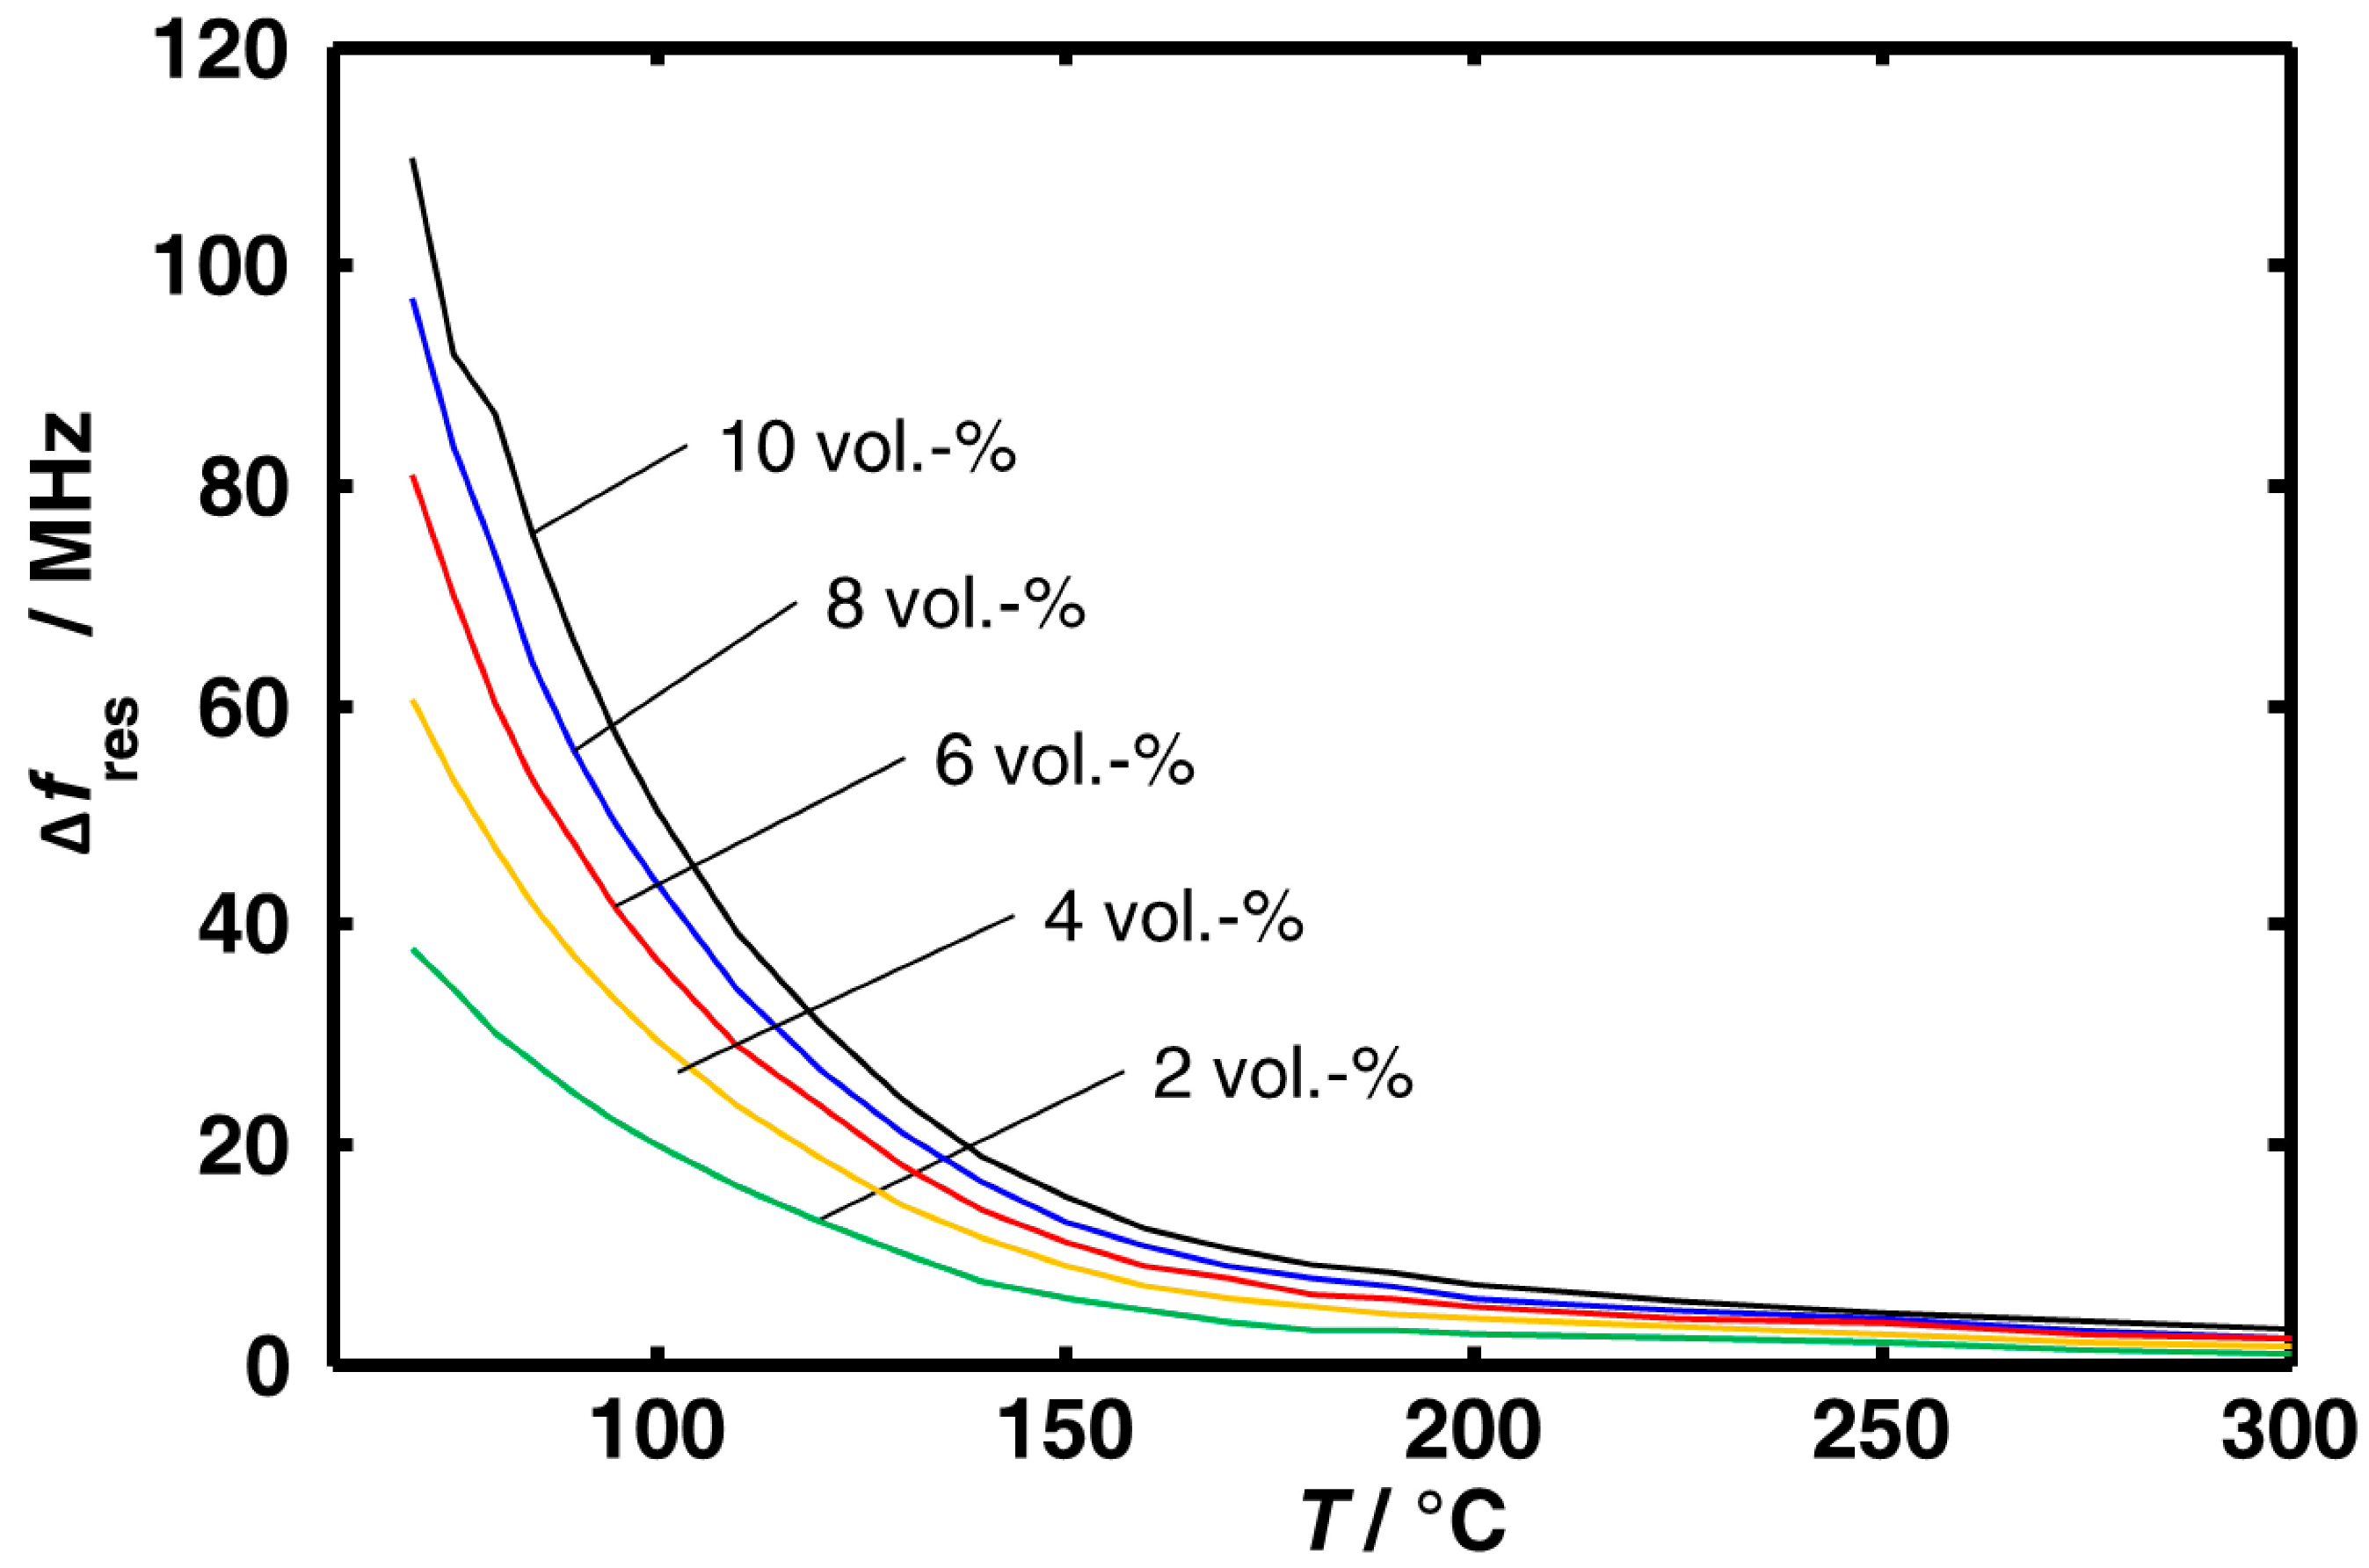
As already shown in Figure 4, the aging state of the catalyst has an influence on the resonance frequency at low temperatures. Figure 6 compares the resonance frequency differences when 2 or 10 vol. % water are added to the feed gas to the ones without water in the feed for the three aging states. When aging proceeds, the influence of water decreases for both water concentrations. The influence of water on the high temperature aged sample (aging state ②) is about 50% smaller compared to the fresh sample. The different amounts of adsorbed water and therefore the different resonance behavior during desorption may be a measure for the TWCs’ aging state.

Figure 6.
Temperature dependent resonance frequency differences to water-free feed gas compositions for all three aging state.
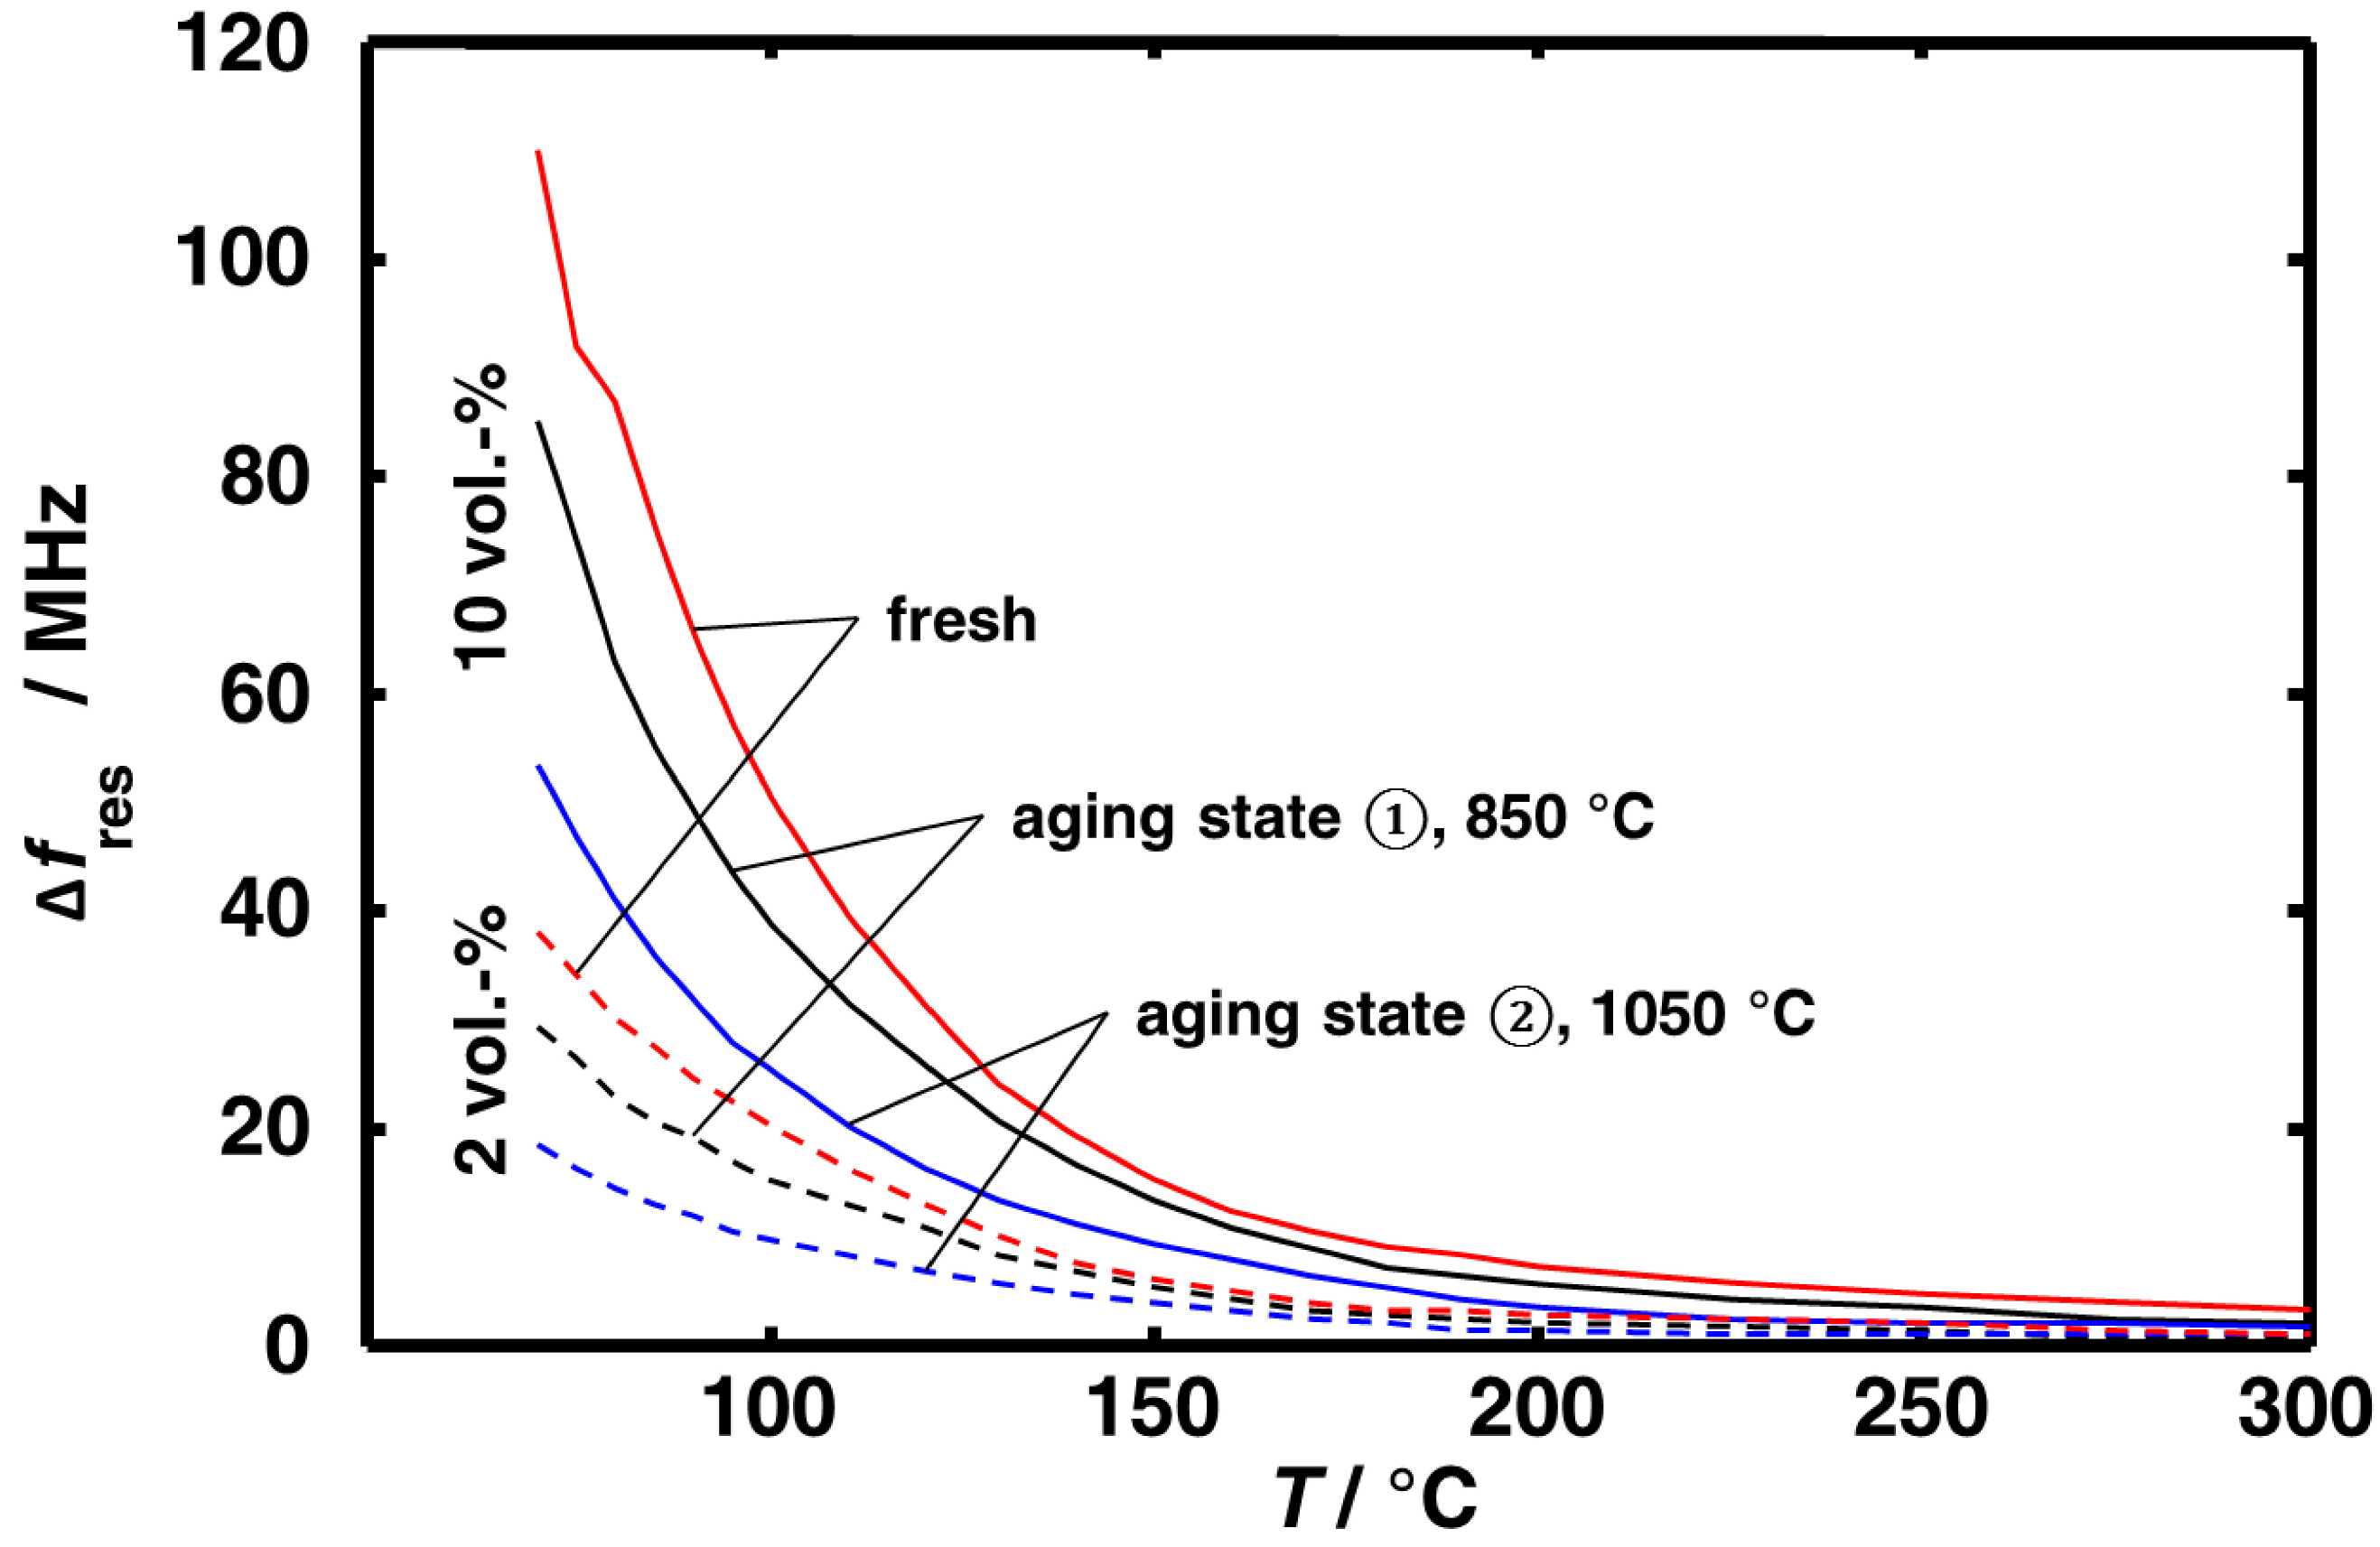
Since the surface area, which decreases with aging due to sintering effects, may have an influence on the sorption of water, a BET analysis of catalysts samples that were analogously aged was conducted. The BET surface area of the milled fresh catalyst including the cordierite honeycomb is 49.2 m2/g. Aged at 850 °C, it is reduced by about 33% to 33.0 m2/g and after the second aging by about 48% compared to the fresh state to a value of 25.4 m2/g.
Figure 2 had shown that between 150 and 290 °C the resonance frequencies at λ = 1.02 are slightly lower than the one at λ = 0.98. A different amount of adsorbed water depending on the oxidation state of the ceria may be an explanation for this effect. Since the influence of water on the resonance frequency is not negligible at those temperatures, and since the surface area in the fresh state is higher than the one in an aged state, this small effect disappears when the catalyst sample gets aged. However, this explanation needs further support by appropriate experiments.
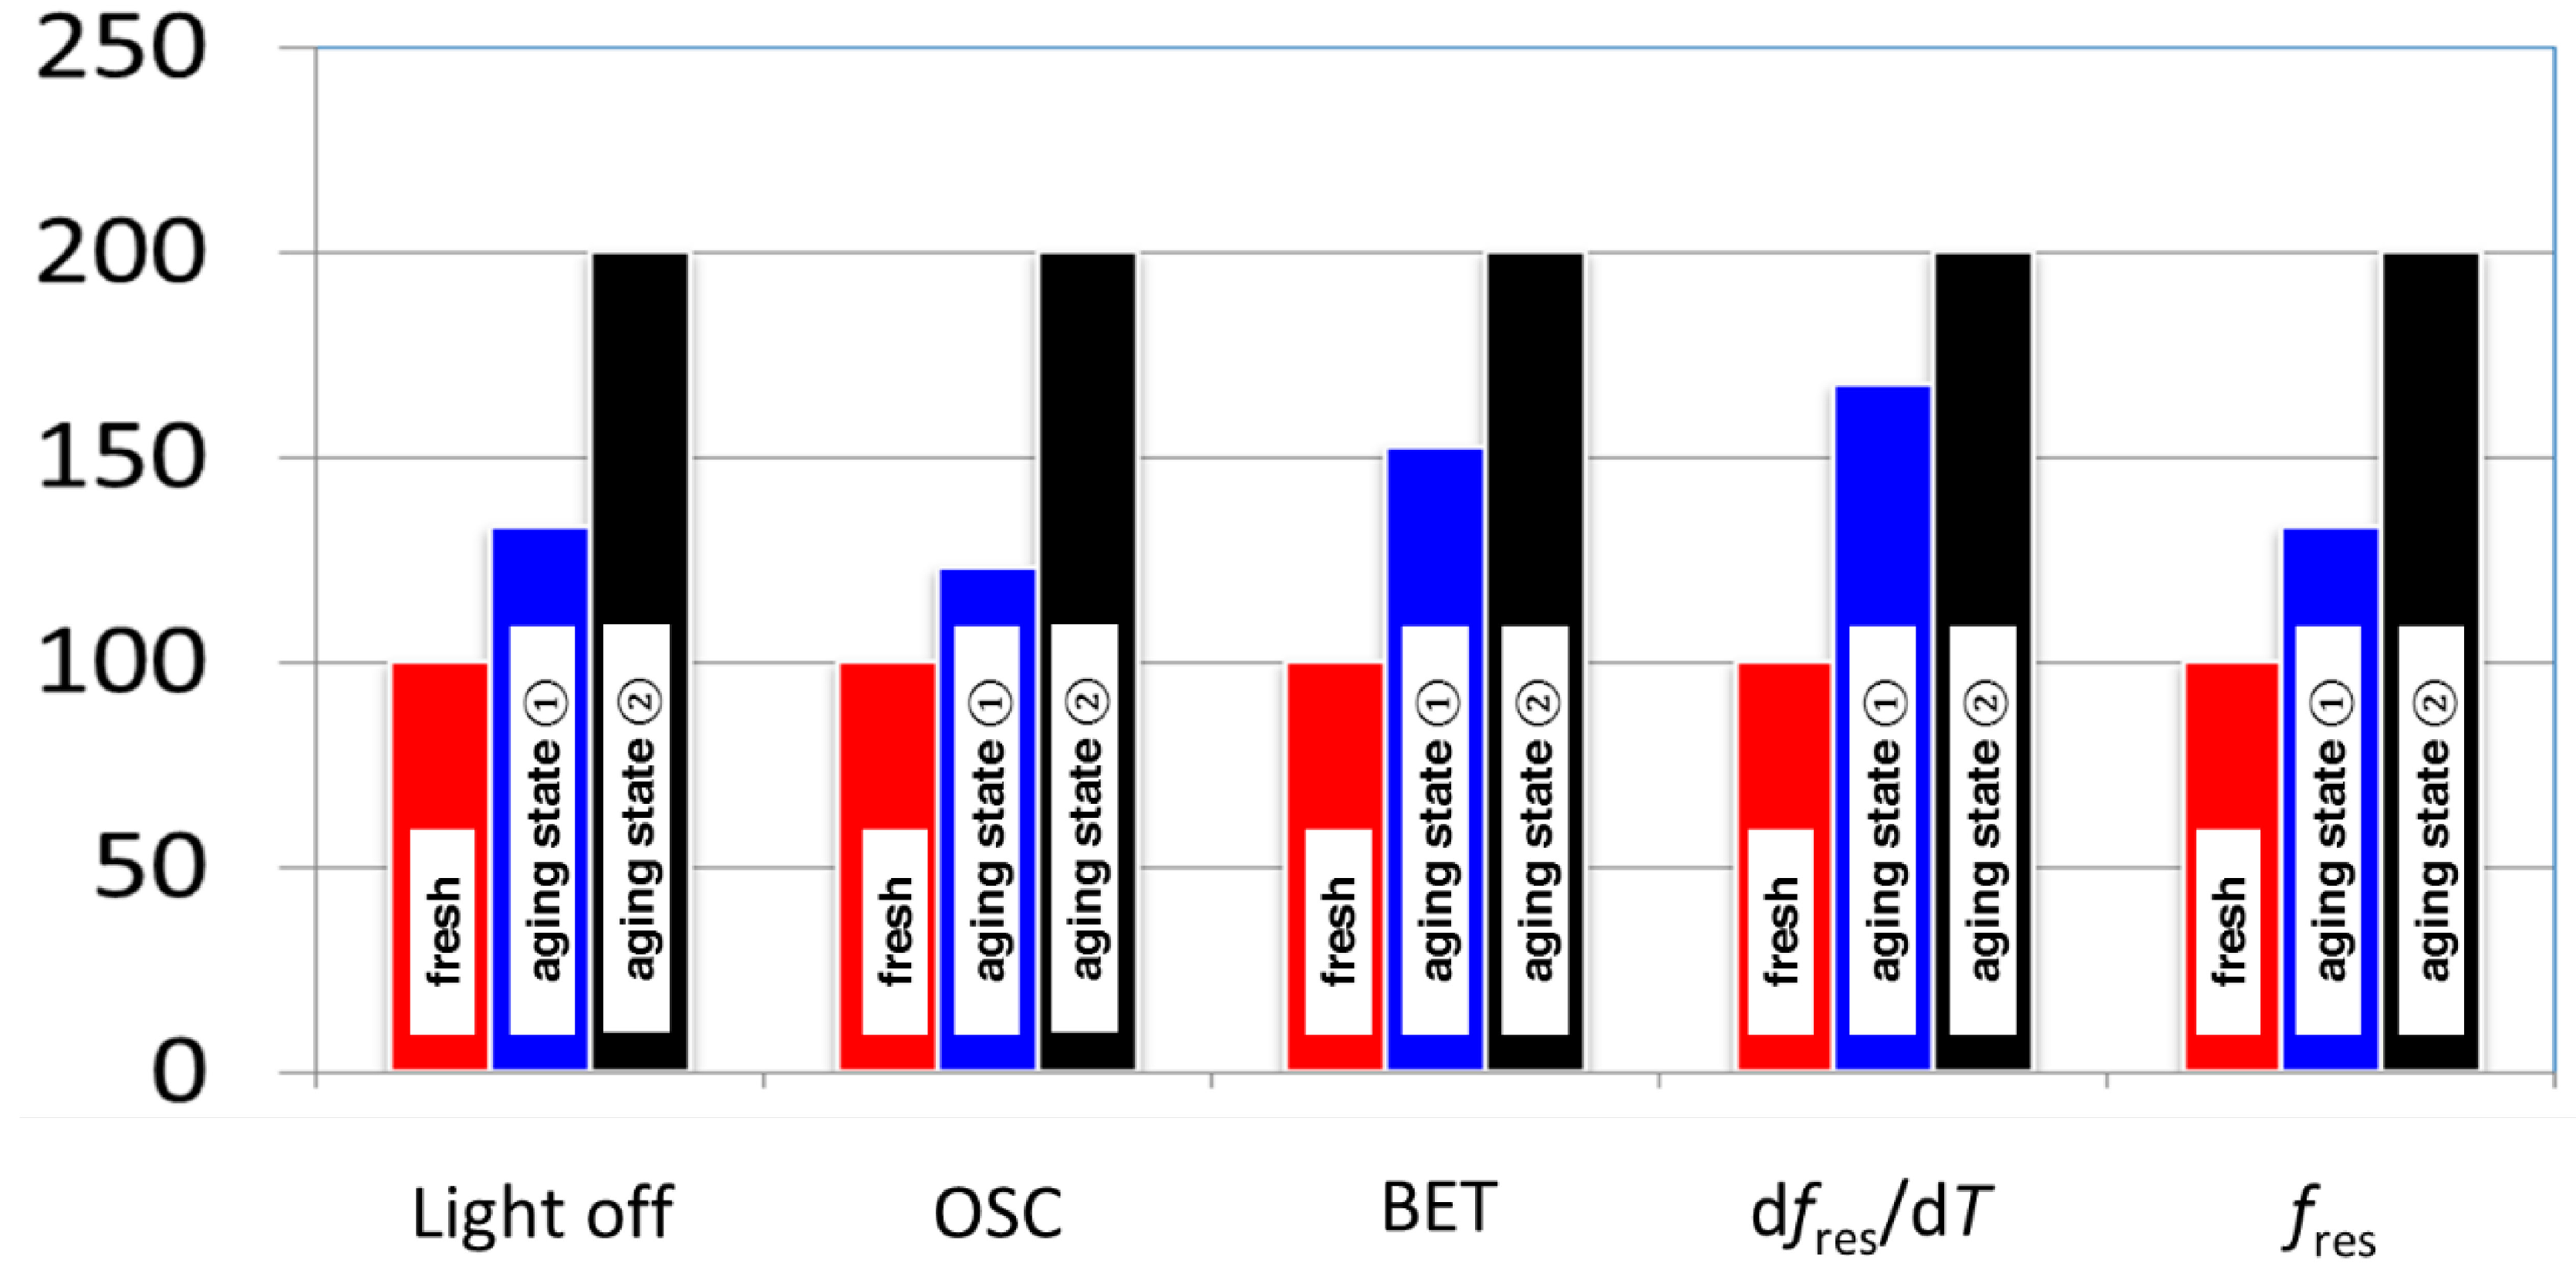
All obtained data are summarized in Figure 7 in a strongly normalized representation, so that all values lie in a range between 100% and 200%. Red bars denote fresh catalysts, blue bars stand for samples aged at 850 °C (aging state ①), and black bars indicate samples aged at 1050 °C (aging state ②). Whereas the first three groups (light off temperature, oxygen storage capacity, BET surface) are classical catalyst data, as they are used for catalyst characterization, the microwave-derived data are evaluated in this study for the first time. It is astonishing how similar they behave. Especially the changes of the oxygen storage capacity (derived at 500 °C) and the resonance frequency at 80 °C seem to correlate quite well. These observations may open the door not only to control an engine with the microwave-based method, but also to determine catalyst-aging processes with this method, which is required for on-board diagnosis (OBD).
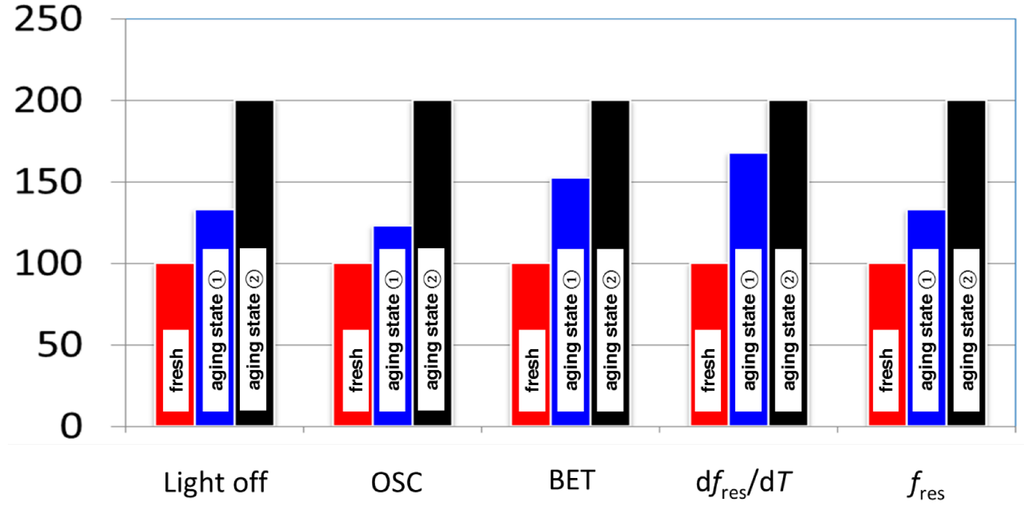
Figure 7.
Normalized parameters that vary with aging: The following normalization equations were used: (a) for the OSC light off temperature: 100 × (∆Tlight off/∆Tlight off,max + 1); (b) for OSC, the reciprocal value was normalized: 100 × (∆[1/OSC]/∆[1/OSCmax] + 1); (c) for the BET surface, the reciprocal value was normalized: 100 × (∆[1/BET]/∆[1/BETmax] + 1); (d) for the slope of the resonance frequency at 90 °C: 100 × (∆[dfres/dT]/∆[dfres/dT]max + 1); and (e) for the resonance frequency at 80 °C: 100 × (∆fres/∆fres,max + 1).
The demonstrated effect is based on a correlation between surface area and water adsorption capacity of the washcoat. Since such a correlation is expected for all kinds of high surface area catalysts, the proposed OBD procedure is not limited to three way catalysts. Rather the method should be useful for different catalyst technologies such as diesel oxidation catalysts, catalytically coated filters, NOx-storage catalysts or SCR catalysts. The method might be especially advantageous for ceria-free catalysts such as diesel oxidation catalysts, since there is currently a lack of proven OBD methods for these catalysts.
4. Conclusions
First investigations with a catalyst sample in different aging states have shown differences in the resonance behavior depending on the catalysts’ aging state. With decreasing oxygen storage capacity, the maximum resonance frequency amplitude between the reduced and the oxidized state decreases. It was also shown that the temperature dependent resonance frequencies of a fresh catalyst behave differently to aged ones.
The influence of the water concentration on the resonance frequency at low temperatures, between 70 °C and 300 °C, was also investigated. With increasing water content, the resonance frequency shifts towards lower frequencies and the absolute resonance frequency differences compared to water-free feed gases increase. When aging proceeds, the total surface area of the catalyst decreases resulting in lower water adsorption and a decreased influence on the resonance frequency. This reduced water adsorption capability with proceeding aging may be used to determine the aging state of a catalyst by evaluating the change in resonance frequency by time and/or temperature. The low temperature slopes of the resonance frequency curves during heating or their values themselves at fixed low temperature decrease when aging proceeds. A direct application for OBD may be investigated in future studies.
Acknowledgments
The results were obtained in the framework of the DFG project MO 1060/13-1. The authors would also like to thank J. Schell of Umicore AG & Co. KG for assistance while conducting the experiments and P. Fremerey of the chair of Chemical Engineering at the University of Bayreuth (A. Jess) for conducting the BET experiments.
Author Contributions
G. Beulertz was responsible for, and conducted, the measurements; and M. Votsmeier and R. Moos supervised the work and lead the discussions.
Conflicts of Interest
The authors declare no conflict of interest.
References
- Johnson, T. Vehicular Emissions in Review. SAE Int. J. Engines 2014, 7, 1207–1227. [Google Scholar] [CrossRef]
- Winkler, M.; Grimm, J.; Lenga, H.; Min, B.H. Gasoline engine combustion development for EU 6c emission legislation. In Internationaler Motorenkongress 2014; Springer: Wiesbaden, Germany, 2014; pp. 193–206. [Google Scholar]
- Deutschmann, O.; Grunwaldt, J.D. Abgasnachbehandlung in mobilen Systemen: Stand der Technik, Herausforderungen und Perspektiven. Chem. Ing. Tech. 2014, 85, 595–617. [Google Scholar] [CrossRef]
- Baunach, T.; Schänzlin, K.; Diehl, L. Sauberes Abgas durch Keramiksensoren. Phys. J. 2006, 5, 33–38. [Google Scholar]
- Riegel, J.; Wiedenmann, H.M.; Neumann, H. Chemical Sensors for Oxygen Detection and Air/Fuel Ratio Control. In Sensors for Automotive Applications; Marek, J., Trah, H.P., Suzuki, Y., Yokomori, I., Eds.; Sensors Applications; Wiley: Weinheim, Germany, 2006; Volume 4, pp. 480–499. [Google Scholar]
- Beulertz, G.; Votsmeier, M.; Moos, R. Effect of propene, propane, and methane on conversion and oxidation state of three-way catalysts: A microwave cavity perturbation study. Appl. Catal. B Environ. 2015, 165, 369–377. [Google Scholar] [CrossRef]
- Möller, R.; Votsmeier, M.; Onder, C.; Guzzella, L.; Gieshoff, J. Is oxygen storage in three-way catalysts an equilibrium controlled process? Appl. Catal. B Environ. 2009, 91, 30–38. [Google Scholar] [CrossRef]
- Beulertz, G.; Fritsch, M.; Fischerauer, G.; Herbst, F.; Gieshoff, J.; Votsmeier, M.; Hagen, G.; Moos, R. Microwave Cavity Perturbation as a Tool for Laboratory in situ Measurement of the Oxidation State of Three Way Catalysts. Top. Catal. 2013, 56, 405–409. [Google Scholar] [CrossRef]
- Beulertz, G.; Votsmeier, M.; Herbst, F.; Moos, R. Replacing the lambda probe by radio frequency-based in operando three-way catalyst oxygen loading detection. In Proceedings of the 14th International Meeting on Chemical Sensors, IMCS 14, Nuremberg, Germany, 20–23 May 2012; pp. 1426–1428.
- Schödel, S.; Moos, R.; Votsmeier, M.; Fischerauer, G. SI-Engine Control with Microwave-Assisted Direct Observation of Oxygen Storage Level in Three-Way Catalysts. IEEE Trans. Control Syst. Technol. 2014, 22, 2346–2353. [Google Scholar] [CrossRef]
- Reiß, S.; Spörl, M.; Hagen, G.; Fischerauer, G.; Moos, R. Combination of wirebound and microwave measurements for in situ characterization of automotive three-way catalysts. IEEE Sens. J. 2011, 11, 434–438. [Google Scholar]
- Moos, R.; Spörl, M.; Hagen, G.; Gollwitzer, A.; Wedemann, M.; Fischerauer, G. TWC: Lambda Control and OBD without Lambda Probe—An Initial Approach; SAE Technical Paper 2008-01-0916; SAE International: Warrendale, PA, USA, April 2008. [Google Scholar] [CrossRef]
- Rauch, D.; Kubinski, D.; Simon, U.; Moos, R. Detection of the ammonia loading of a Cu Chabazite SCR catalyst by a radio frequency-based method. Sens. Actuators B Chem. 2014, 205, 88–93. [Google Scholar] [CrossRef]
- Sappok, A.; Bromberg, L.; Parks, J.; Prikhodko, V. Loading and Regeneration Analysis of a Diesel Particulate Filter with a Radio Frequency-Based Sensor; SAE Technical Paper 2010-01-2126; SAE International: Warrendale, PA, USA, October 2010. [Google Scholar] [CrossRef]
- Moos, R. Microwave-Based Catalyst State Diagnosis—State of the Art and Future Perspectives. SAE Int. J. Engines 2015, 8, 1240–1245. [Google Scholar] [CrossRef]
- Boaro, M.; Trovarelli, A.; Hwang, J.H.; Mason, T.O. Electrical and oxygen storage/release properties of nanocrystalline ceria-zirconia solid solutions. Solid State Ion. 2002, 147, 85–95. [Google Scholar] [CrossRef]
- Pozar, D.M. Microwave Engineering, 4th ed.; John Wiley & Sons: New York, NY, USA, 2012. [Google Scholar]
- Reiß, S. Direkte Zustandssensorik von Automobilabgaskatalysatoren. Ph.D. Thesis, Universität Bayreuth, Bayreuth, Germany, 2012. [Google Scholar]
- Fischerauer, G.; Spörl, M.; Gollwitzer, A.; Wedemann, M.; Moos, R. Catalyst State Observation via the Perturbation of a Microwave Cavity Resonator. Frequenz 2008, 62, 180–184. [Google Scholar] [CrossRef]
- Moos, R.; Wedemann, M.; Spörl, M.; Reiß, S.; Fischerauer, G. Direct catalyst monitoring by electrical means: An overview on promising novel principles. Top. Catal. 2009, 52, 2035–2040. [Google Scholar] [CrossRef]
- Dietrich, M.; Rauch, D.; Porch, A.; Moos, R. A Laboratory Test Setup for in situ Measurements of the Dielectric Properties of Catalyst Powder Samples under Reaction Conditions by Microwave Cavity Perturbation: Set up and Initial Tests. Sensors 2014, 14, 16856–16868. [Google Scholar] [CrossRef] [PubMed]
- Kang, S.B.; Kwon, H.J.; Nam, I.S.; Song, Y.I.; Oh, S.H. Activity Function for Describing Alteration of Three-Way Catalyst Performance over Palladium-Only Three-Way Catalysts by Catalyst Mileage. Ind. Eng. Chem. Res. 2011, 50, 5499–5509. [Google Scholar] [CrossRef]
- Brinkmeier, C. Automotive Three-Way Exhaust Aftertreatment under Transient Conditions—Measurements, Modeling and Simulation. Ph.D. Thesis, University of Stuttgart, Stuttgart, Germany, 2006. [Google Scholar]
- Tuller, H.L.; Nowick, A.S. Defect Structure and Electrical Properties of Nonstoichiometric CeO2 Single Crystals. J. Electrochem. Soc. 1979, 126, 209–217. [Google Scholar] [CrossRef]
- Feulner, M.; Müller, A.; Stöber, R.; Fischerauer, G.; Moos, R. Messungen zum Einfluss von Wasser auf die Beladungserkennung von Dieselpartikelfiltern mit Mikrowellentechnik. In Proceedings of the 11th Dresdner Sensor-Symposium, Dresden, Germany, 9–11 December 2013; Gerlach, G., Schütze, A., Eds.; pp. 239–242. [CrossRef]
- Nahar, R.K.; Khanna, V.K. A study of capacitance and resistance of Al2O3 humidity sensor. Int. J. Electron. 1982, 52, 557–567. [Google Scholar] [CrossRef]
- Ralohs, K.; D’Agostino, C.; Burch, R.; Chansai, S.; Gladden, L.F.; Hardacre, C.; James, S.L.; Mitchell, J.; Taylor, S.F.R. Assessing the surface modifications following the mechanochemical preparation of a Ag/Al2O3 selective catalytic reduction catalyst. Catal. Sci. Technol. 2014, 4, 531–539. [Google Scholar] [CrossRef]
- Thissen, P.; Grundmeier, G.; Wippermann, S.; Schmidt, W.G. Water adsorption on the α-Al2O3 (0001) surface. Phys. Rev. B 2009, 80. [Google Scholar] [CrossRef]
- Molinari, M.; Parker, S.C.; Sayle, D.C.; Islam, M.S. Water Adsorption and Its Effect on the Stability of Low Index Stoichiometric and Reduced Surfaces of Ceria. J. Phys. Chem. C 2012, 116, 7073–7082. [Google Scholar] [CrossRef]
- Xie, W.; Liu, B.; Xiao, S.; Li, H.; Wang, Y.; Cai, D.; Wang, D.; Wang, L.; Liu, Y.; Li, Q.; et al. High performance humidity sensors based on CeO2 nanoparticles. Sens. Actuators B Chem. 2015, 215, 125–132. [Google Scholar] [CrossRef]
© 2015 by the authors; licensee MDPI, Basel, Switzerland. This article is an open access article distributed under the terms and conditions of the Creative Commons Attribution license (http://creativecommons.org/licenses/by/4.0/).