
Vibrational Microspectroscopy for Cancer Screening


Abstract
:1. Introduction

2. Vibrational Spectroscopy

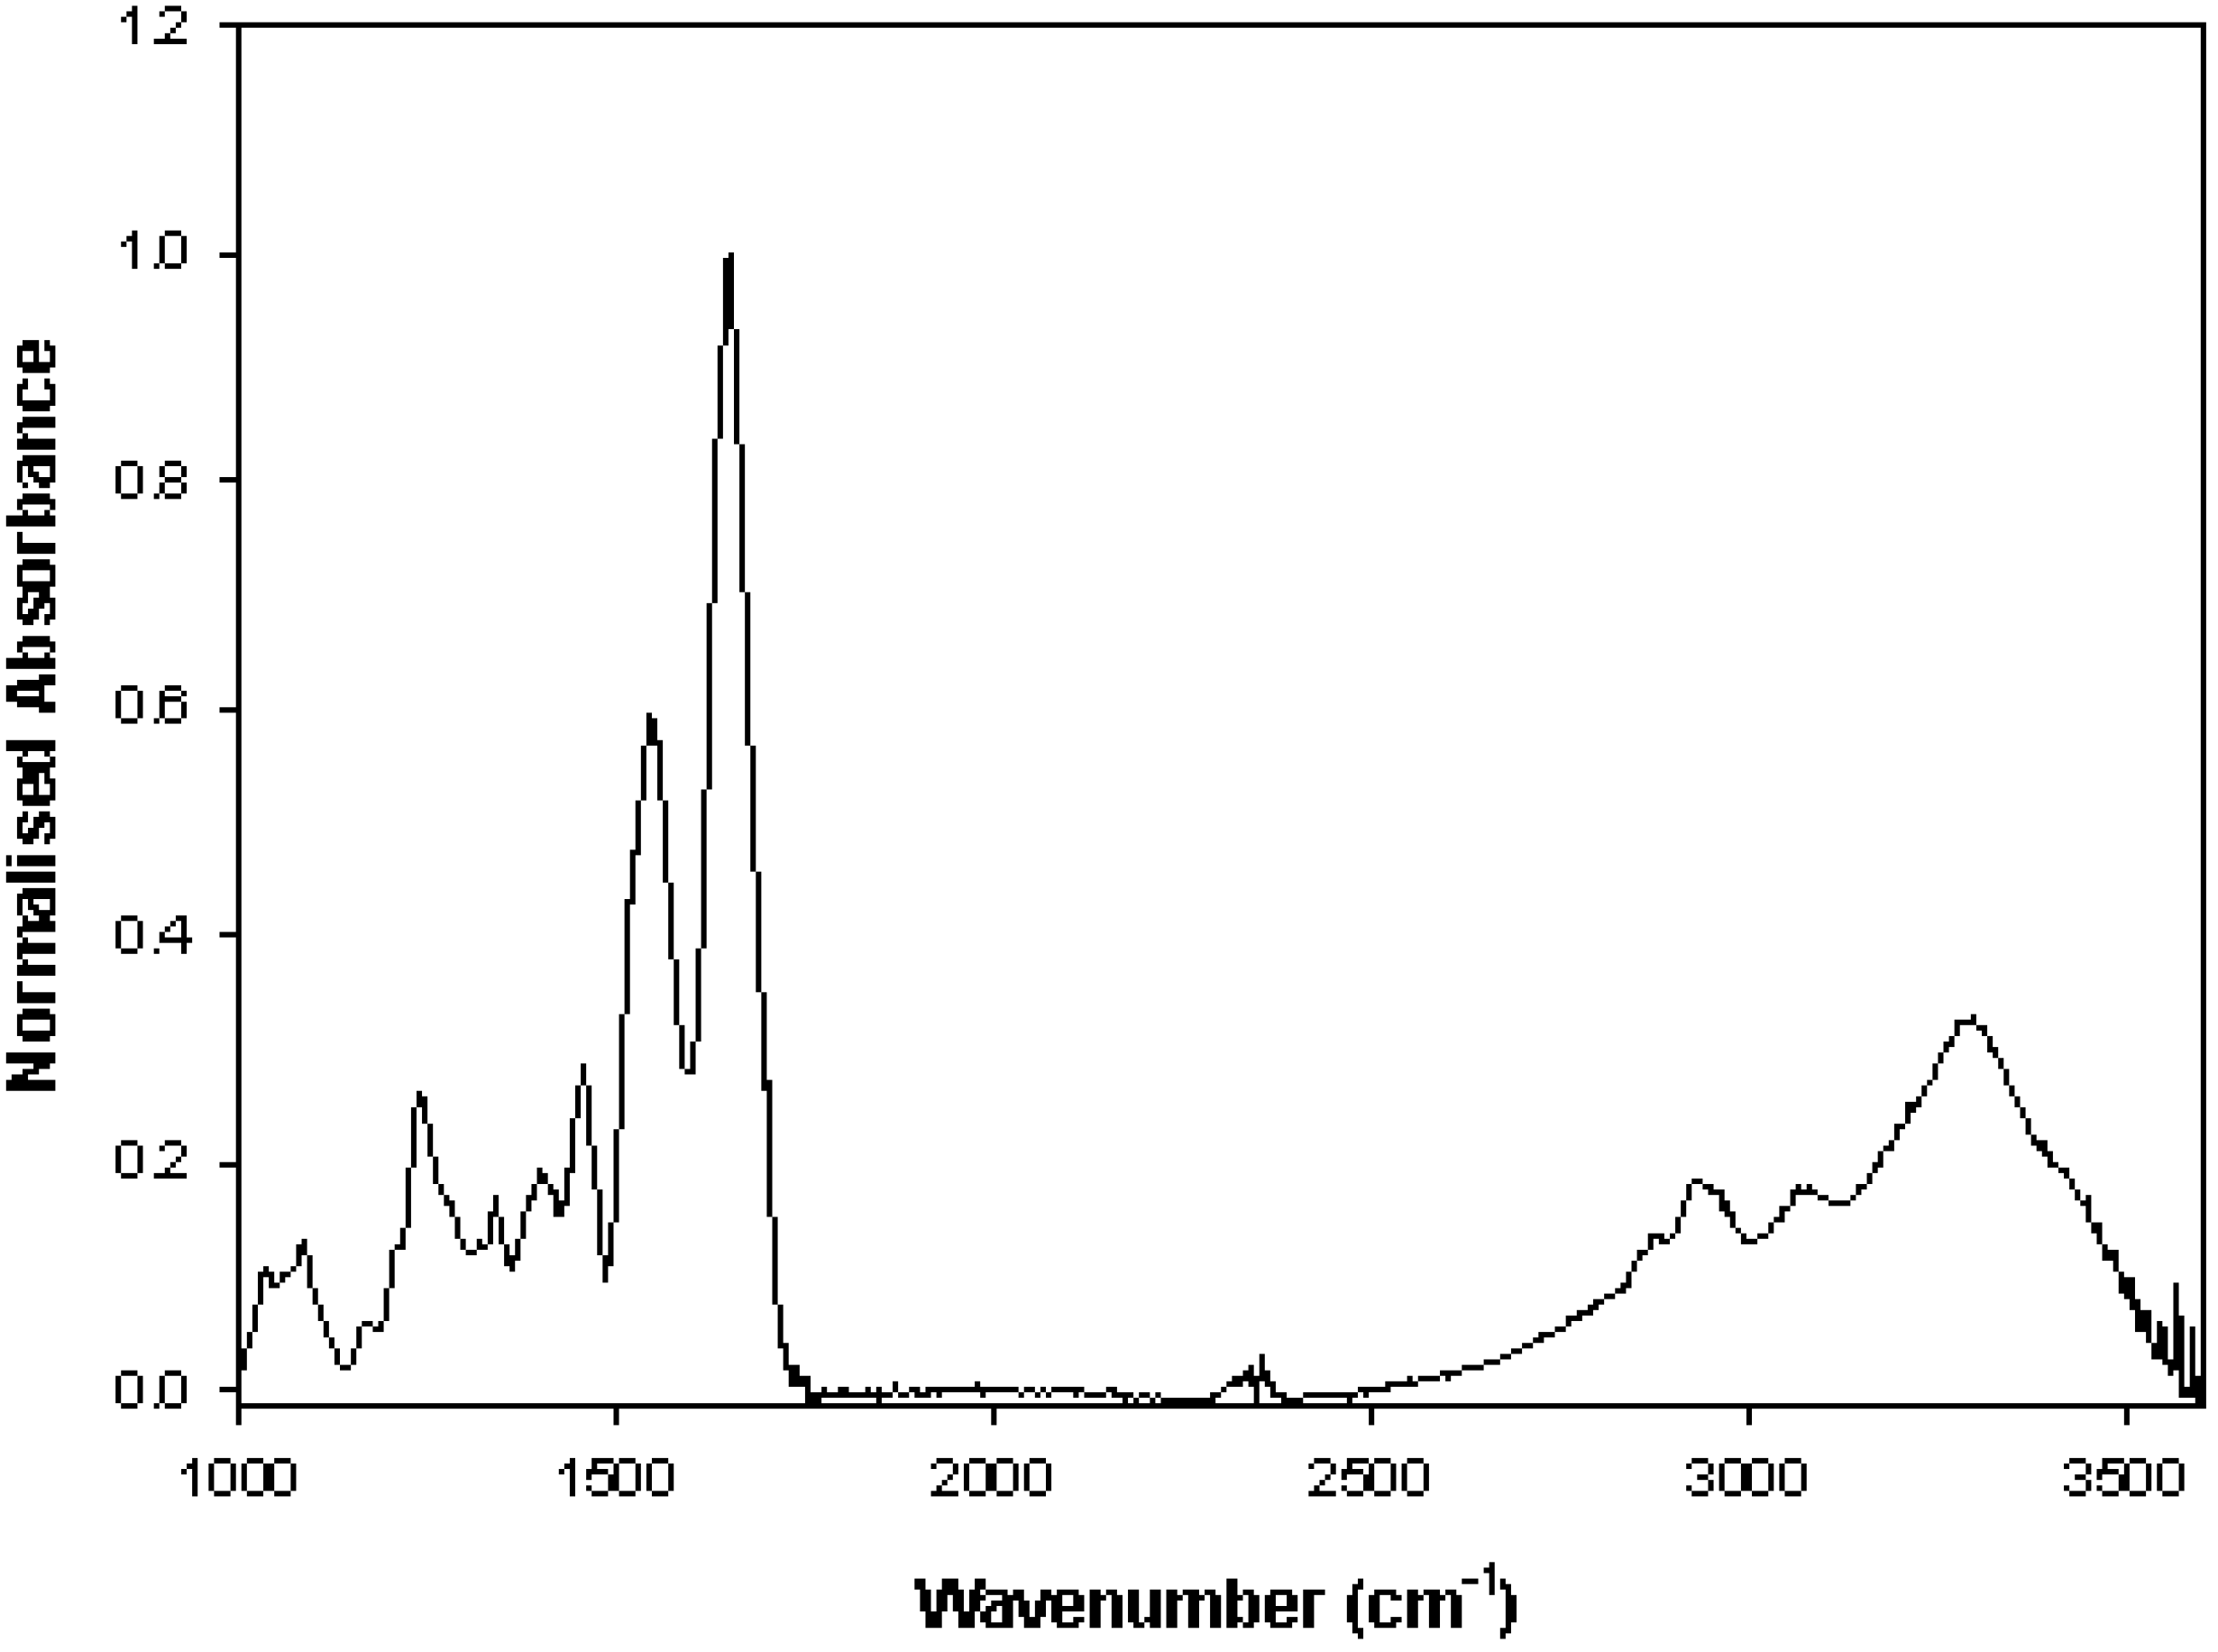
| Wavenumber (cm−1) | FTIR Peak Assignments |
|---|---|
| 1036 | C-C skeletal stretching (proteins) |
| 1080 | PO2 symmetric stretching (DNA/RNA) |
| 1150 | C-C and C-O stretching (proteins) |
| 1220–1280 | PO2 asymmetric stretching (DNA/RNA), Amide III (C-N stretching, N-H bending, proteins) |
| 1310 | CH2 stretching (phospholipids) |
| 1450–1470 | CH3 asymmetric stretching (proteins, lipids) |
| 1520–1550 | Amide II (N-H bending, C-N stretching, proteins) |
| 1620–1700 | Amide I (C=O stretching, C-N stretching and N-H bending, proteins) |
| 2850 | CH2 symmetric stretching (lipids) |
| 2920 | CH2 asymmetric stretching (lipids) |
| 2960 | CH3 asymmetric stretching (lipids and proteins) |
| 3290 | NH asymmetric stretching (proteins) |
| 3400 | OH stretching (water) |

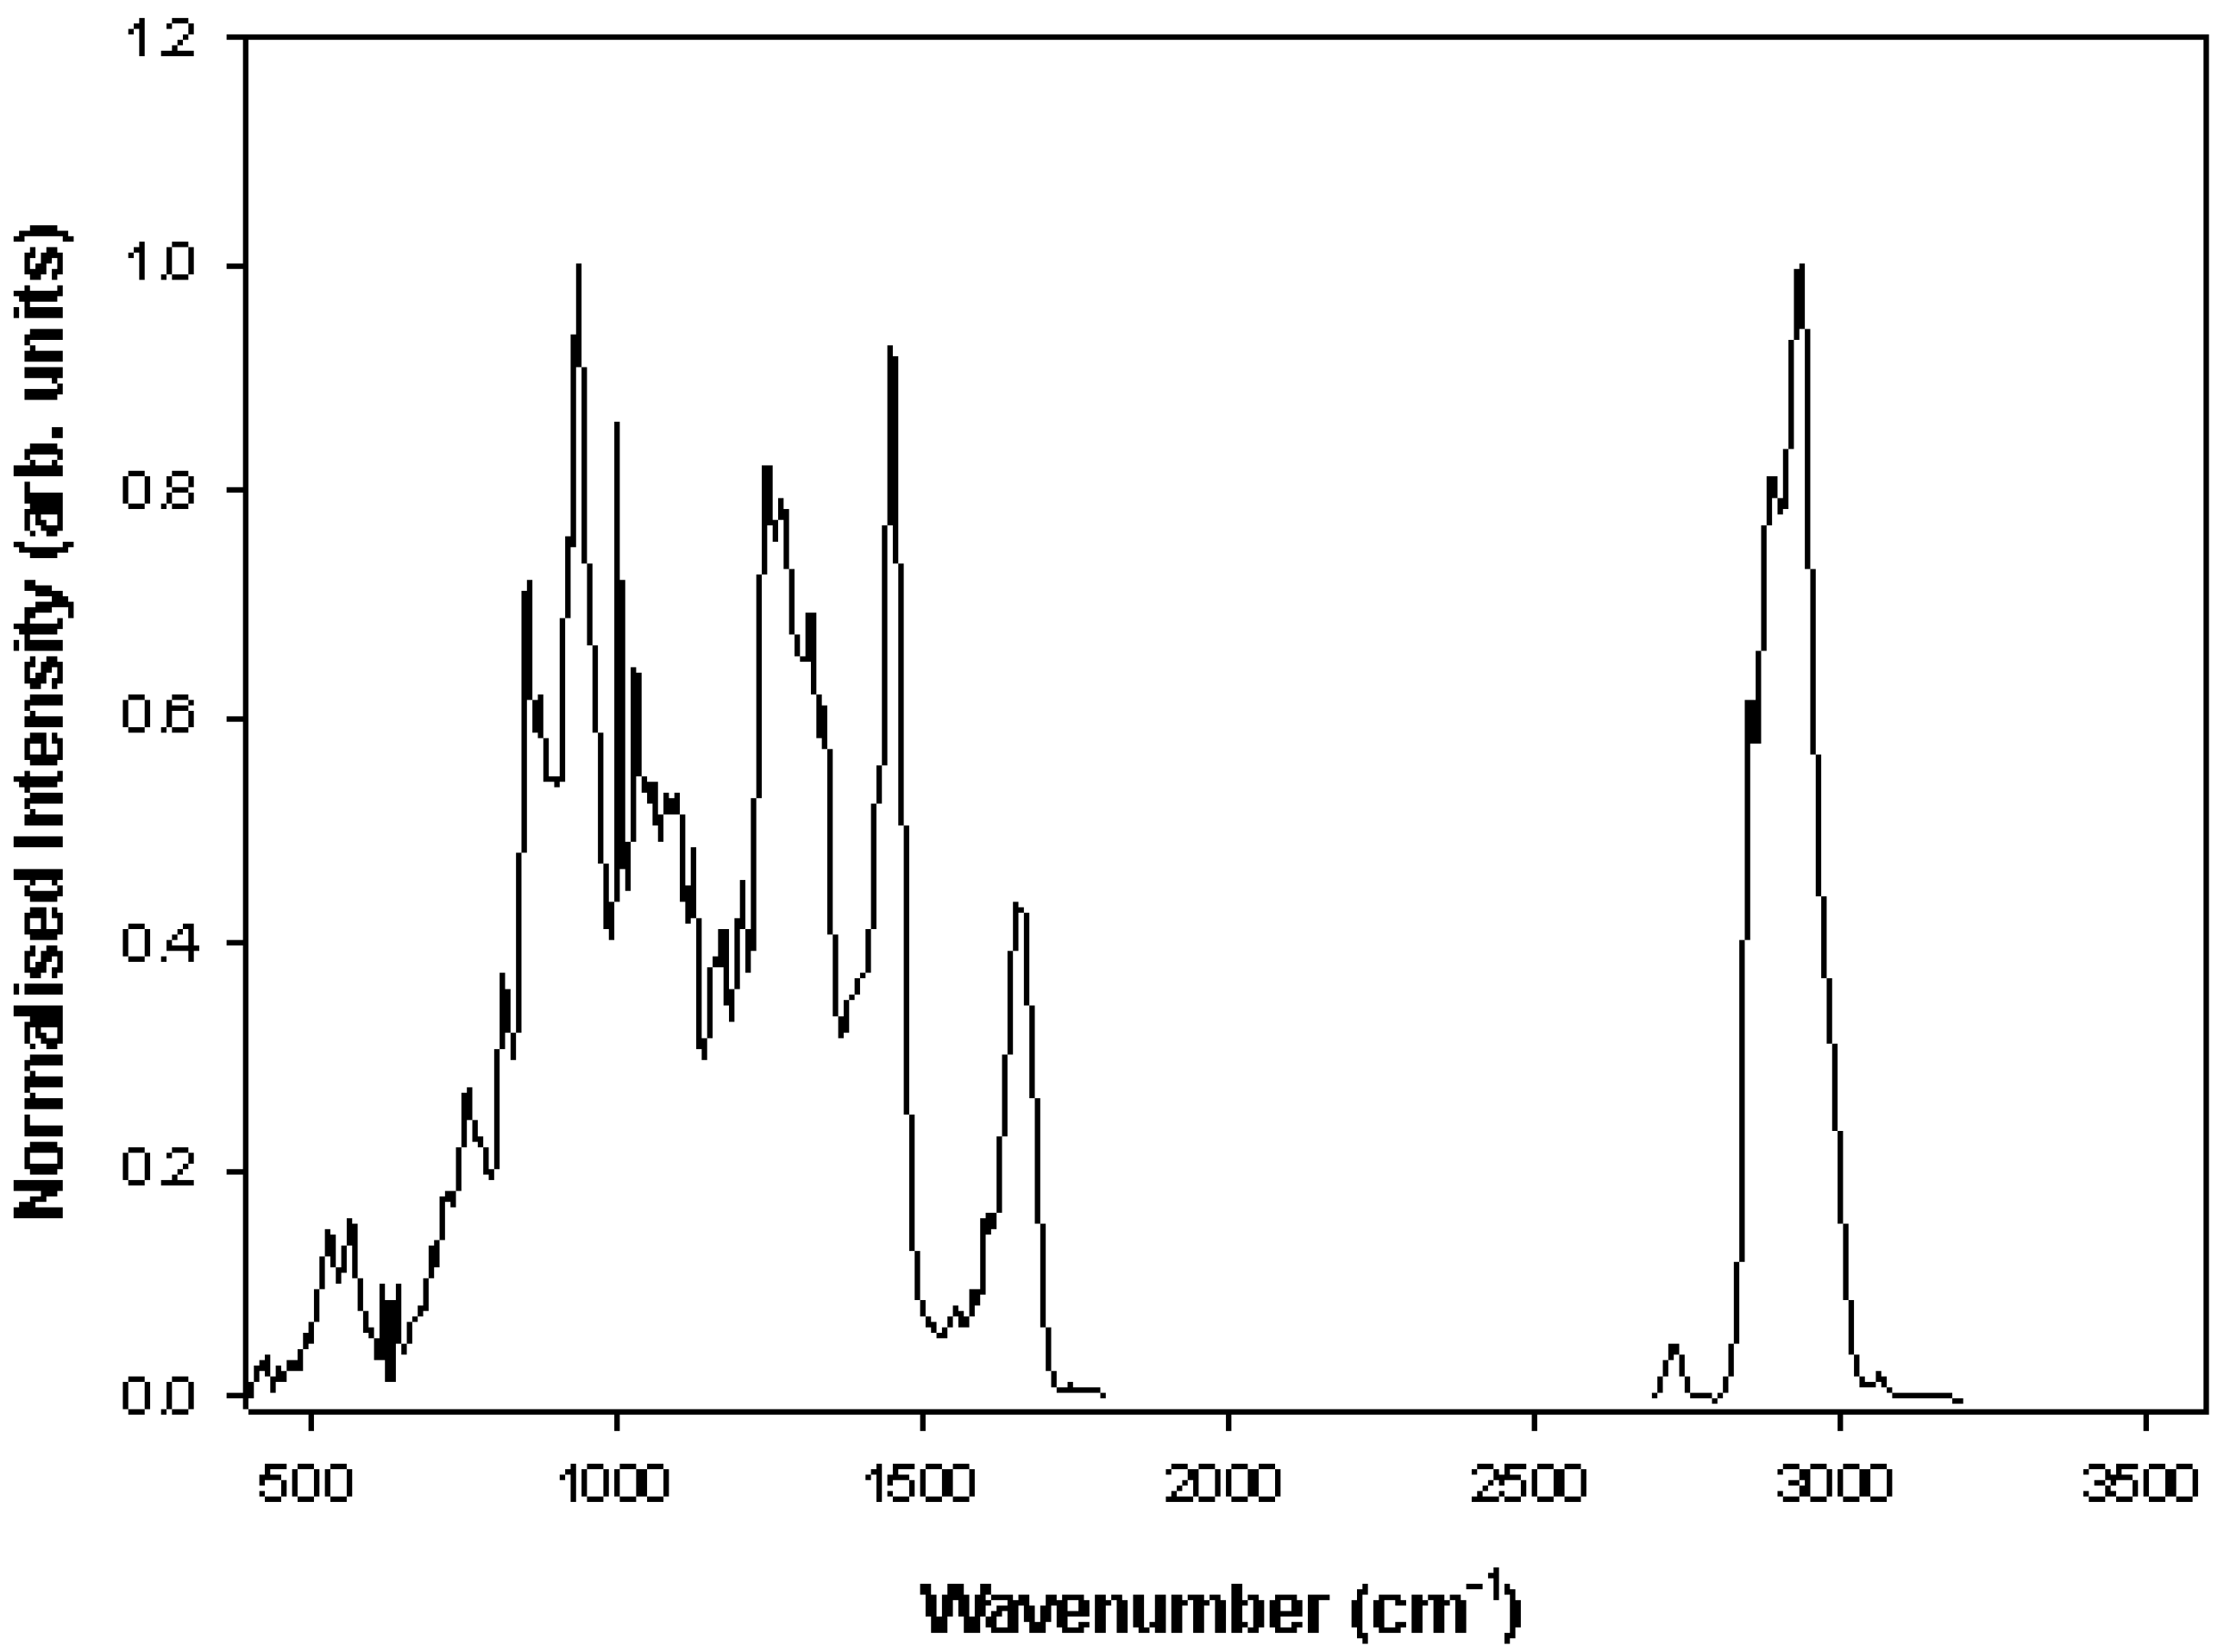
| Wavenumber (cm−1) | Raman Peak Assignments |
|---|---|
| 621 | C-C twisting mode of Phenylalanine (proteins) |
| 642 | C-C twisting mode of Tyrosine and Phenylalanine |
| 670 | Thymine, Guanine (DNA/RNA) |
| 720 | C-N stretching in Adenine and lipids |
| 750 | symmetric breathing of Tryptophan (protein) |
| 782 | Uracil, Thymine, Cytosine (ring breathing modes in the DNA/RNA) |
| 827 | PO2 stretching in DNA, Tyrosine |
| 854 | Ring breathing in Tyrosine and Proline (proteins) |
| 935 | C-C stretching mode of Proline and Valine |
| 1003 | C-C aromatic ring stretching in Phenylalanine |
| 1030 | C-H bending mode in Phenylalanine, C-N stretching in proteins |
| 1080 | PO2 symmetric stretching (DNA/RNA) |
| 1085 | C-O stretching |
| 1130 | C-N stretching in proteins; C-O stretching in carbohydrates |
| 1155 | C-C and C-N stretching of proteins/lipids |
| 1175 | C-H in plane bending mode of Tyrosine and Phenylalanine; Cytosine, Guanine |
| 1208 | C-C6H5 stretching mode in Tryptophan, Phenylalanine |
| 1220–1280 | Amide III (C-N stretching, N-H bending, proteins), PO2 asymmetric stretching (DNA/RNA) |
| 1311 | CH3/CH2 twisting mode of collagen and lipid |
| 1340 | Guanine (DNA/RNA), CH def. in proteins and carbohydrates |
| 1430–1460 | CH (CH2) bending mode in proteins and lipids |
| 1485 | Amide II (N-H bending, C-N stretching, proteins); Adenine, Guanine (DNA/RNA) |
| 1580 | Adenine, Guanine (DNA/RNA); C=C bending mode of Phenylalanine |
| 1615 | C=C Phenylalanine, Tyrosine and Tryptophan |
| 1620–1700 | Amide I (C=O stretching, C-N stretching and N-H bending, proteins) |
| 2890 | CH2 symmetric stretching (lipids) |
| 2940 | CH2 and CH3 symmetric stretching (lipids) |
| 2980 | CH3 symmetric stretching (lipids) |
3. Cervical Cancer
4. Oral Cancer
5. Future Perspectives
Acknowledgments
Author Contributions
Conflicts of Interest
References
- Ferlay, J.; Soerjomataram, I.; Ervik, M.; Dikshit, R.; Eser, S.; Mathers, C.; Rebelo, M.; Parkin, D.M.; Forman, D.; Bray, F. GLOBOCAN, 2012 v1.0, Cancer Incidence and Mortality Worldwide: IARC CancerBase No. 11, 2013. International Agency for Research on Cancer Web site. Available online: http://globocan.iarc.fr (accessed on 24 November 2014).
- Diem, M. Introduction to Modern Vibrational Spectroscopy; Wiley: New York, NY, USA, 1993. [Google Scholar]
- Movasaghi, Z.; Rehman, S.; Rehman, I.U. Fourier Transform Infrared (FTIR) Spectroscopy of Biological Tissues. Appl. Spectrosc. Rev. 2008, 43, 134–179. [Google Scholar] [CrossRef]
- Movasaghi, Z.; Rehman, S.; Rehman, I.U. Raman Spectroscopy of Biological Tissues. Appl. Spectrosc. Rev. 2007, 42, 493–541. [Google Scholar] [CrossRef]
- Diem, M.; Mazur, A.; Lenau, K.; Schubert, J.; Bird, B.; Miljkovic, M.; Krafft, C.; Popp, J. Molecular pathology via IR and Raman spectral imaging. J. Biophotonics 2013, 6, 855–886. [Google Scholar] [CrossRef] [PubMed]
- Baker, M.J.; Trevisan, J.; Bassan, P.; Bhargava, R.; Butler, H.J.; Dorling, K.M.; Fielden, P.R.; Fogarty, S.W.; Fullwood, N.J.; Heys, K.A.; et al. Using Fourier transform IR spectroscopy to analyze biological materials. Nat. Protoc. 2014, 9, 1771–1791. [Google Scholar] [CrossRef] [PubMed]
- Ellis, D.I.; Cowcher, D.P.; Ashton, L.; O’Hagan, S.; Goodacre, R. Illuminating disease and enlightening biomedicine: Raman spectroscopy as a diagnostic tool. Analyst 2013, 138, 3871–3884. [Google Scholar] [CrossRef] [PubMed]
- Kendall, C.; Isabelle, M.; Bazant-Hegemark, F.; Hutchings, J.; Orr, L.; Babrah, J.; Baker, R.; Stone, N. Vibrational spectroscopy: A clinical tool for cancer diagnostics. Analyst 2009, 134, 1029–1045. [Google Scholar] [CrossRef] [PubMed]
- Nijssen, A.; Koljenovic, S.; Bakker Schut, T.C.; Caspers, P.J.; Puppels, G.J. Towards oncological application of Raman spectroscopy. J. Biophotonics 2009, 2, 29–36. [Google Scholar] [CrossRef] [PubMed]
- Kitchener, H.C.; Blanks, R.; Cubie, H.; Desai, M.; Dunn, G.; Legood, R.; Gray, A.; Sadique, Z.; Moss, S.; MAVARIC Trial Study Group. MAVARIC—A comparison of automation-assisted and manual cervical screening: A randomised controlled trial. Health Technol. Assess. 2011, 15, iii–iv, ix–xi. 1–170. [Google Scholar]
- Koss, L.G.; Melamed, M.R. Koss’ Diagnostic Cytology and Its Histopathologic Bases; Lippincott Williams & Wilkins: Philadelphia, PA, USA, 2006. [Google Scholar]
- Walboomers, J.M.; Jacobs, M.V.; Manos, M.M.; Bosch, F.X.; Kummer, J.A.; Shah, K.V.; Snijders, P.J.; Peto, J.; Meijer, C.J.; Munoz, N. Human papillomavirus is a necessary cause of invasive cervical cancer worldwide. J. Pathol. 1999, 189, 12–19. [Google Scholar] [CrossRef] [PubMed]
- Schiffman, M.; Wentzensen, N.; Wacholder, S.; Kinney, W.; Gage, J.C.; Castle, P.E. Human papillomavirus testing in the prevention of cervical cancer. J. Natl. Cancer Inst. 2011, 103, 368–383. [Google Scholar] [CrossRef] [PubMed]
- Fung Kee Fung, M.; Senterman, M.; Eid, P.; Faught, W.; Mikhael, N.Z.; Wong, P.T. Comparison of Fourier-transform infrared spectroscopic screening of exfoliated cervical cells with standard Papanicolaou screening. Gynecol. Oncol. 1997, 66, 10–15. [Google Scholar] [CrossRef] [PubMed]
- Neviliappan, S.; Fang Kan, L.; Tiang Lee Walter, T.; Arulkumaran, S.; Wong, P.T.T. Infrared spectral features of exfoliated cervical cells, cervical adenocarcinoma tissue, and an adenocarcinoma cell line (SiSo). Gynecol. Oncol. 2002, 85, 170–174. [Google Scholar] [CrossRef] [PubMed]
- Wong, P.T.; Wong, R.K.; Caputo, T.A.; Godwin, T.A.; Rigas, B. Infrared spectroscopy of exfoliated human cervical cells: Evidence of extensive structural changes during carcinogenesis. Proc. Natl. Acad. Sci. USA 1991, 88, 10988–10992. [Google Scholar] [CrossRef] [PubMed]
- Yazdi, H.M.; Bertrand, M.A.; Wong, P.T. Detecting structural changes at the molecular level with Fourier transform infrared spectroscopy. A potential tool for prescreening preinvasive lesions of the cervix. Acta Cytol. 1996, 40, 664–668. [Google Scholar] [CrossRef] [PubMed]
- Wong, P.T.T.; Senterman, M.K.; Jackli, P.; Wong, R.K.; Salib, S.; Campbell, C.E.; Feigel, R.; Faught, W.; Fung Kee Fung, M. Detailed account of confounding factors in interpretation of FTIR spectra of exfoliated cervical cells. Biopolymers 2002, 67, 376–386. [Google Scholar] [CrossRef] [PubMed]
- Chiriboga, L.; Xie, P.; Vigorita, V.; Zarou, D.; Zakim, D.; Diem, M. Infrared spectroscopy of human tissue. II. A comparative study of spectra of biopsies of cervical squamous epithelium and of exfoliated cervical cells. Biospectroscopy 1998, 4, 55–59. [Google Scholar] [CrossRef] [PubMed]
- Cohenford, M.A.; Godwin, T.A.; Cahn, F.; Bhandare, P.; Caputo, T.A.; Rigas, B. Infrared spectroscopy of normal and abnormal cervical smears: Evaluation by principal component analysis. Gynecol. Oncol. 1997, 66, 59–65. [Google Scholar] [CrossRef] [PubMed]
- Diem, M.; Chiriboga, L.; Lasch, P.; Pacifico, A. IR spectra and IR spectral maps of individual normal and cancerous cells. Biopolymers 2002, 67, 349–353. [Google Scholar] [CrossRef] [PubMed]
- Romeo, M.J.; Quinn, M.A.; Burden, F.R.; McNaughton, D. Influence of benign cellular changes in diagnosis of cervical cancer using IR microspectroscopy. Biopolymers 2002, 67, 362–366. [Google Scholar] [CrossRef] [PubMed]
- Wood, B.R.; Quinn, M.A.; Tait, B.; Ashdown, M.; Hislop, T.; Romeo, M.; McNaughton, D. FTIR microspectroscopic study of cell types and potential confounding variables in screening for cervical malignancies. Biospectroscopy 1998, 4, 75–91. [Google Scholar] [CrossRef] [PubMed]
- Cohenford, M.A.; Rigas, B. Cytologically normal cells from neoplastic cervical samples display extensive structural abnormalities on IR spectroscopy: Implications for tumor biology. Proc. Natl. Acad. Sci. USA 1998, 95, 15327–15332. [Google Scholar] [CrossRef] [PubMed]
- Schubert, J.M.; Bird, B.; Papamarkakis, K.; Miljkovic, M.; Bedrossian, K.; Laver, N.; Diem, M. Spectral cytopathology of cervical samples: Detecting cellular abnormalities in cytologically normal cells. Lab. Invest. 2010, 90, 1068–1077. [Google Scholar] [CrossRef] [PubMed]
- Walsh, M.J.; Singh, M.N.; Pollock, H.M.; Cooper, L.J.; German, M.J.; Stringfellow, H.F.; Fullwood, N.J.; Paraskevaidis, E.; Martin-Hirsch, P.L.; Martin, F.L. ATR microspectroscopy with multivariate analysis segregates grades of exfoliative cervical cytology. Biochem. Biophys. Res. Commun. 2007, 352, 213–219. [Google Scholar] [CrossRef] [PubMed]
- Gajjar, K.; Ahmadzai, A.A.; Valasoulis, G.; Trevisan, J.; Founta, C.; Nasioutziki, M.; Loufopoulos, A.; Kyrgiou, M.; Stasinou, S.M.; Karakitsos, P.; et al. Histology verification demonstrates that biospectroscopy analysis of cervical cytology identifies underlying disease more accurately than conventional screening: Removing the confounder of discordance. PLoS One 2014, 9, e82416. [Google Scholar] [CrossRef] [PubMed]
- Kelly, J.G.; Cheung, K.T.; Martin, C.; O’Leary, J.J.; Prendiville, W.; Martin-Hirsch, P.L.; Martin, F.L. A spectral phenotype of oncogenic human papillomavirus-infected exfoliative cervical cytology distinguishes women based on age. Clin. Chim. Acta 2010, 411, 1027–1033. [Google Scholar] [CrossRef] [PubMed]
- Jess, P.R.T.; Smith, D.D.W.; Mazilu, M.; Dholakia, K.; Riches, A.C.; Herrington, C.S. Early detection of cervical neoplasia by Raman spectroscopy. Int. J. Cancer 2007, 121, 2723–2728. [Google Scholar] [CrossRef] [PubMed]
- Kim, D.-H.; Jarvis, R.M.; Allwood, J.W.; Batman, G.; Moore, R.E.; Marsden-Edwards, E.; Hampson, L.; Hampson, I.N.; Goodacre, R. Raman chemical mapping reveals site of action of HIV protease inhibitors in HPV16 E6 expressing cervical carcinoma cells. Anal. Bioanal. Chem. 2010, 398, 3051–3061. [Google Scholar] [CrossRef] [PubMed]
- Ostrowska, K.M.; Garcia, A.; Meade, A.D.; Malkin, A.; Okewumi, I.; O’Leary, J.J.; Martin, C.; Byrne, H.J.; Lyng, F.M. Correlation of p16(INK4a) expression and HPV copy number with cellular FTIR spectroscopic signatures of cervical cancer cells. Analyst 2011, 136, 1365–1373. [Google Scholar] [CrossRef] [PubMed]
- Ostrowska, K.M.; Malkin, A.; Meade, A.; O’Leary, J.; Martin, C.; Spillane, C.; Byrne, H.J.; Lyng, F.M. Investigation of the influence of high-risk human papillomavirus on the biochemical composition of cervical cancer cells using vibrational spectroscopy. Analyst 2010, 135, 3087–3093. [Google Scholar] [CrossRef] [PubMed]
- Vargis, E.; Tang, Y.-W.; Khabele, D.; Mahadevan-Jansen, A. Near-infrared Raman Microspectroscopy Detects High-risk Human Papillomaviruses. Transl. Oncol. 2012, 5, 172–179. [Google Scholar] [CrossRef] [PubMed]
- Rubina, S.; Amita, M.; Kedar, K.D.; Bharat, R.; Krishna, C.M. Raman spectroscopic study on classification of cervical cell specimens. Vib. Spectrosc. 2013, 68, 115–121. [Google Scholar] [CrossRef]
- Bonnier, F.; Traynor, D.; Kearney, P.; Clarke, C.; Knief, P.; Martin, C.; O’Leary, J.J.; Byrne, H.J.; Lyng, F. Processing ThinPrep cervical cytological samples for Raman spectroscopic analysis. Anal. Methods 2014, 6, 7831–7841. [Google Scholar] [CrossRef]
- Jemal, A.; Siegel, R.; Ward, E.; Hao, Y.; Xu, J.; Thun, M.J. Cancer statistics, 2009. CA Cancer J. Clin. 2009, 59, 225–249. [Google Scholar] [CrossRef] [PubMed]
- Howlader, N.; Noone, A.M.; Krapcho, M.; Neyman, N.; Aminou, R.; Waldron, W.; Altekruse, S.F.; Kosary, C.L.; Ruhl, J.; Tatalovich, Z.; et al. SEER Cancer Statistics Review, 1975–2008, 2011. The SEER Web site. Available online: http://seer.cancer.gov/csr/1975_2008/ (accessed on 24 November 2014).
- Rennemo, E.; Zatterstrom, U.; Boysen, M. Impact of second primary tumors on survival in head and neck cancer: An analysis of 2063 cases. Laryngoscope 2008, 118, 1350–1356. [Google Scholar] [CrossRef] [PubMed]
- Hashibe, M.; Brennan, P.; Chuang, S.C.; Boccia, S.; Castellsague, X.; Chen, C.; Curado, M.P.; Dal Maso, L.; Daudt, A.W.; Fabianova, E.; et al. Interaction between tobacco and alcohol use and the risk of head and neck cancer: Pooled analysis in the International Head and Neck Cancer Epidemiology Consortium. Cancer Epidemiol. Biomark. Prev. 2009, 18, 541–550. [Google Scholar] [CrossRef]
- Hennessey, P.T.; Westra, W.H.; Califano, J.A. Human papillomavirus and head and neck squamous cell carcinoma: Recent evidence and clinical implications. J. Dent. Res. 2009, 88, 300–306. [Google Scholar] [CrossRef] [PubMed]
- Rethman, M.P.; Carpenter, W.; Cohen, E.E.; Epstein, J.; Evans, C.A.; Flaitz, C.M.; Graham, F.J.; Hujoel, P.P.; Kalmar, J.R.; Koch, W.M.; et al. Evidence-based clinical recommendations regarding screening for oral squamous cell carcinomas. J. Am. Dent. Assoc. 2010, 141, 509–520. [Google Scholar] [CrossRef] [PubMed]
- Lingen, M.W.; Kalmar, J.R.; Karrison, T.; Speight, P.M. Critical evaluation of diagnostic aids for the detection of oral cancer. Oral. Oncol. 2008, 44, 10–22. [Google Scholar] [CrossRef] [PubMed]
- Holmstrup, P.; Vedtofte, P.; Reibel, J.; Stoltze, K. Long-term treatment outcome of oral premalignant lesions. Oral. Oncol. 2006, 42, 461–474. [Google Scholar] [CrossRef] [PubMed]
- Krishna, C.M.; Sockalingum, G.D.; Kurien, J.; Rao, L.; Venteo, L.; Pluot, M.; Manfait, M.; Kartha, V.B. Micro-Raman spectroscopy for optical pathology of oral squamous cell carcinoma. Appl. Spectrosc. 2004, 58, 1128–1135. [Google Scholar] [CrossRef] [PubMed]
- Cals, F.L.J.; Bakker Schut, T.C.; Koljenović, S.; Puppels, G.J.; de Jong, R.J.B. Method development: Raman spectroscopy-based histopathology of oral mucosa. J. Raman Spectrosc. 2013, 44, 963–972. [Google Scholar] [CrossRef]
- Malini, R.; Venkatakrishna, K.; Kurien, J.; Pai, K.M.; Rao, L.; Kartha, V.B.; Krishna, C.M. Discrimination of normal, inflammatory, premalignant, and malignant oral tissue: A Raman spectroscopy study. Biopolymers 2006, 81, 179–193. [Google Scholar] [CrossRef] [PubMed]
- Papamarkakis, K.; Bird, B.; Schubert, J.M.; Miljković, M.; Wein, R.; Bedrossian, K.; Laver, N.; Diem, M. Cytopathology by optical methods: Spectral cytopathology of the oral mucosa. Lab. Invest. 2010, 90, 589–598. [Google Scholar] [CrossRef] [PubMed]
- Miljkovic, M.; Bird, B.; Lenau, K.; Mazur, A.I.; Diem, M. Spectral cytopathology: New aspects of data collection, manipulation and confounding effects. Analyst 2013, 138, 3975–3982. [Google Scholar] [CrossRef] [PubMed]
- Byrne, H.J.; Sockalingum, G.D.; Stone, N. Raman Microscopy: Complement or Competitor? In Biomedical Applications of Synchrotron Infrared Microspectroscopy: A Practical Approach; Moss, D., Ed.; RSC Analytical Spectroscopy Monographs, Royal Society of Chemistry: Cambridge, UK, 2011; No. 11. [Google Scholar]
- Keating, M.E.; Byrne, H.J. Raman spectroscopy in nanomedicine: Current status and future perspectives. NanoMedicine 2013, 8, 1335–1351. [Google Scholar] [CrossRef] [PubMed]
- Byrne, H.J.; Baranska, M.; Puppels, G.J.; Stone, N.; Wood, B.; Gough, K.M.; Lasch, P.; Heraud, P.; Sulé-Suso, J.; Sockalingum, G.D. Spectropathology for the Next Generation: Quo Vadis? Analyst 2015. [Google Scholar] [CrossRef]
© 2015 by the authors; licensee MDPI, Basel, Switzerland. This article is an open access article distributed under the terms and conditions of the Creative Commons Attribution license (http://creativecommons.org/licenses/by/4.0/).
Share and Cite
Lyng, F.M.; Ramos, I.R.M.; Ibrahim, O.; Byrne, H.J. Vibrational Microspectroscopy for Cancer Screening. Appl. Sci. 2015, 5, 23-35. https://doi.org/10.3390/app5010023
Lyng FM, Ramos IRM, Ibrahim O, Byrne HJ. Vibrational Microspectroscopy for Cancer Screening. Applied Sciences. 2015; 5(1):23-35. https://doi.org/10.3390/app5010023
Chicago/Turabian StyleLyng, Fiona M., Inês R. M. Ramos, Ola Ibrahim, and Hugh J. Byrne. 2015. "Vibrational Microspectroscopy for Cancer Screening" Applied Sciences 5, no. 1: 23-35. https://doi.org/10.3390/app5010023
APA StyleLyng, F. M., Ramos, I. R. M., Ibrahim, O., & Byrne, H. J. (2015). Vibrational Microspectroscopy for Cancer Screening. Applied Sciences, 5(1), 23-35. https://doi.org/10.3390/app5010023