1. Introduction
Electron magnetic resonance (EMR) techniques including ferromagnetic resonance (FMR) and electron paramagnetic resonance (EPR) find new applications in material science and nanotechnology. In particular, they are currently directed towards investigation of properties of magnetofilled composites [
1]. In this area, it is important to follow the distribution of the magnetic filler since it can affect the mechanical and magnetic properties of the material [
2].
In an external magnetic field of a high strength (higher than 1 kG) magnetic nanoparticles obtain significant polarization at room temperature and are self-arranged into elongated structures—linear aggregates [
3], like chains or more complex multi-chain constructions such as needles made of several laterally joined chains [
4].
In this work, we study the influence of gelation on the aggregation of magnetite nanoparticles in external magnetic fields and determine the dimensional parameters of the aggregates. Magnetic particle aggregation can be revealed by measuring the demagnetizing fields produced by elongated structures formed in magnetic fields [
5]. This parameter allows the estimation of the magnetic anisotropy of the samples (gels, films). However, it has a poor sensitivity with fields with a strength higher than 1,000 G. Thus in [
5] the parameter of magnetic anisotropy obtained by the torque angle technique changes slightly (15%) for the magnetic gels formed in the field range 1,000–10,000 G. The torque angle technique gives quantitative information on the magnetic anisotropy of samples but it does not allow the quantitative estimation of the aggregates aspect ratio. Transmission electron microscopy (TEM) and scanning electron microscopy (SEM) can also be applied to research particle ordering [
5,
6,
7,
8]. However, this method requires special preparation of samples and does not give unambiguous results for magnetic gels [
5]. To solve the problem we use the paramagnetic sensor technique for magnetic gels—this is investigated for the first time. The technique, developed in [
9], is based on the analysis of EPR spectra of paramagnetic particles (stable nitroxide radicals) introduced into a magnetically diluted system. It was tested previously on magnetic liquids [
9,
10]. The results obtained for the magnetic liquids using the paramagnetic sensor technique [
10] were in agreement with TEM data for similar samples [
6,
7,
8]. According to TEM [
6,
7,
8] the aggregates’ length can reach tens of microns while their width remains hundreds of nanometers, which corresponds to an aspect ratio (
Nel) of 50–100.
2. Experimental Section
Polymeric gels filled with ferromagnetic nanoparticles were obtained by radical copolymerization of acrylamide (main monomer) and N,N'-methylenebisacrylamide (cross linking agent) in an aqueous dispersion of magnetite (Fe3O4) nanoparticles. The reaction medium contained 10 wt.% of acrylamide. The weight ratio of cross linking agent to main monomer was 0.02. To initiate copolymerization, hydrogen peroxide (H2O2) in combination with Fe2+ ions was used. The surface of the magnetite particles was the source of Fe2+ ions. The concentration of hydrogen peroxide was equal to 0.001 M. The copolymerization was performed at room temperature in air.
Magnetite dispersion was obtained by coprecipitation of Fe
2+ and Fe
3+ salts in an alkaline medium (NH
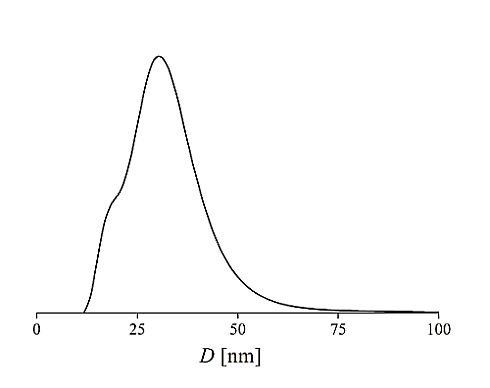
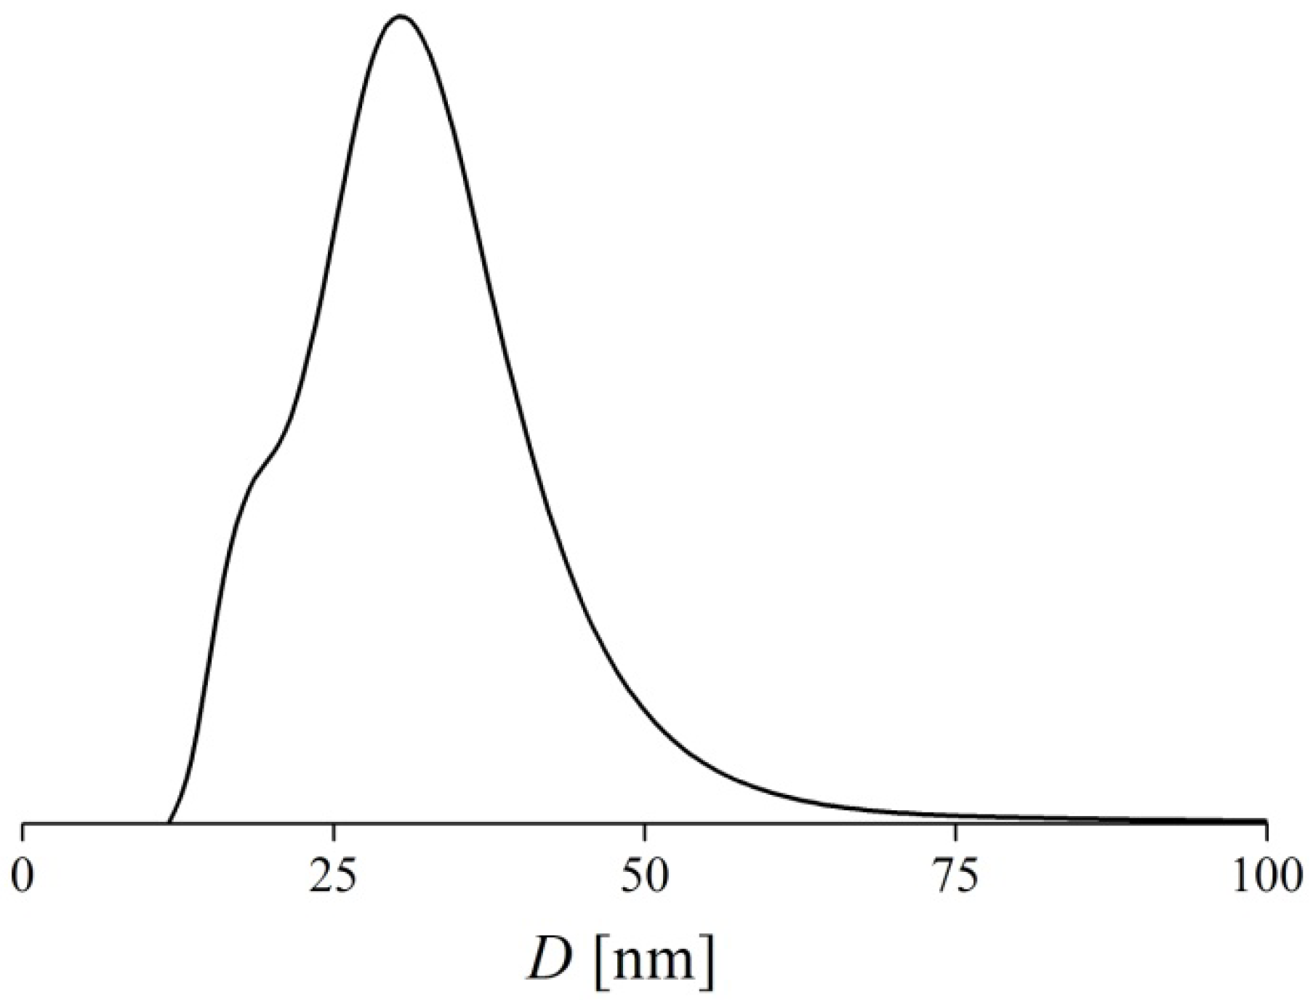
4OH, 10 wt.%). The process was carried out at reduced temperatures (~2 °C) in order to increase the nanoparticles size. The average diameter of nanoparticles in the magnetic dispersion was 30(1) nm as measured by quasielastic light scattering (
Figure 1). The concentration of nanoparticles in the dispersion was 0.630(25) vol.%. The dispersion was stabilized by an electrical double layer in a phosphate-citrate buffer with pH 4.0. The magnetization of the magnetic liquid was 2.05(10) G. It decreased to 1.49(10) G after hydrogen peroxide addition. The reduction probably resulted from oxidation of the magnetite particles by hydrogen peroxide accompanied by the formation of non-ferromagnetic Fe
3+ oxide (α-Fe
2O
3) on the particle surface.
Figure 1.
Nanoparticles size distribution in hydrosol according to quasielastic light scattering.
Figure 1.
Nanoparticles size distribution in hydrosol according to quasielastic light scattering.
The solution of acrylamide and N,N’-methylenebisacrylamide was mixed with the magnetic liquid in the volume ratio of 1:1. Then hydrogen peroxide was added to the mixture. Hydrogel was formed within several minutes. Gel formation was carried out in a static magnetic field of 1.5 kG as well as without a magnetic field. Gels obtained in the presence of the field are referred to as “magnetoanisotropic gels” and those obtained without field as “magnetoisotropic ones”. After preparation, the magnetic gels were placed in an aqueous solution of paramagnetic sensor. The water soluble stable nitroxide radical TEMPOL (2,2,6,6-tetramethyl-4-hydroxypiperidine-1-oxyl) was used as paramagnetic sensor. The radical concentration was 8.5 mM. The gels swelled in the radical solution, and radical molecules penetrated into them. In this process, the weight of the gels increased by a factor of 1.2 to 1.7. The concentration of nanoparticles in the gels after swelling was 0.19(2) and 0.27(3) vol.% for magnetoisotropic and magnetoanisotropic gels respectively.
The EPR spectrum of the dilute solution of the nitroxide radical showed three lines of hyperfine structure (HFS) of equal intensity [
11] that resulted from the interaction of unpaired electrons with the nuclear spin of nitrogen (
IN = 1). The experimental values of the hyperfine interactions and isotropic
g-factor of the TEMPOL radical were
Aiso = 16.9(1) G and
giso = 2.00532(5), respectively. The intrinsic line shape of the radical (instrumental line shape) was presented by a convolution
![]()
, where
![]()
and
![]()
with Г
L = 1.021(45) G and Г
G = 0.714(28) G.
Electron magnetic resonance (EPR and FMR) spectra of the magnetic gels were recorded at room temperature using the X-band spectrometer Bruker EMX-8/2.7 with microwave radiation power of 1 mW. The parameters of the magnetic field modulation applied in the experiments were 1 G in amplitude and 100 kHz in frequency. The first derivative of the adsorption signal was recorded. Gel samples of cubic shape (1.0(1) × 1.0(1) × 1.0(2) mm) were placed inside a cavity in plastic tubes.
Special checking indicated that the influence of the modulation field on the measured resonance line shape was negligible.
3. Results and Discussion
As noted above, the paramagnetic sensor technique was previously tested on magnetic hydrosols (inviscid dispersions of magnetic particles). Aggregates of magnetic particles, formed in the liquids in a magnetic field, fell apart immediately after the field was switched off. In the magnetoanisotropic gel, the aggregates formed in course of the gel synthesis (when the particles’ mobility was rather high) should be fixed by a polymer network. They should not disintegrate even after removing the gel out of the magnetic field. In the magnetoisotropic gel, individual magnetic particles immobilized by polymer network seem to be unable to form long aggregates under magnetic field influence.
These assumptions are qualitatively supported by FMR data (
Figure 2). It is known that aggregation of the particles leads to FMR spectra transformation [
12]. When linear aggregates are formed and aligned along magnetic fields of the spectrometer their FMR spectrum is shifted significantly to low fields due to dipole-dipole interaction between the aggregated particles [
12]. In our experiment, the main axes of the aggregates in the magnetoanisotropic gel were orientated along and across the spectrometer field (due to corresponding orientation of the gel sample). In case of parallel orientation of the aggregates, the FMR spectrum of the magnetoanisotropic gel (as well as of the magnetic liquids) should be shifted to lower fields relative to the spectrum of the magnetoisotropic gel. While in case of transversal orientation of the aggregates, the FMR spectrum should shift to higher magnetic fields.
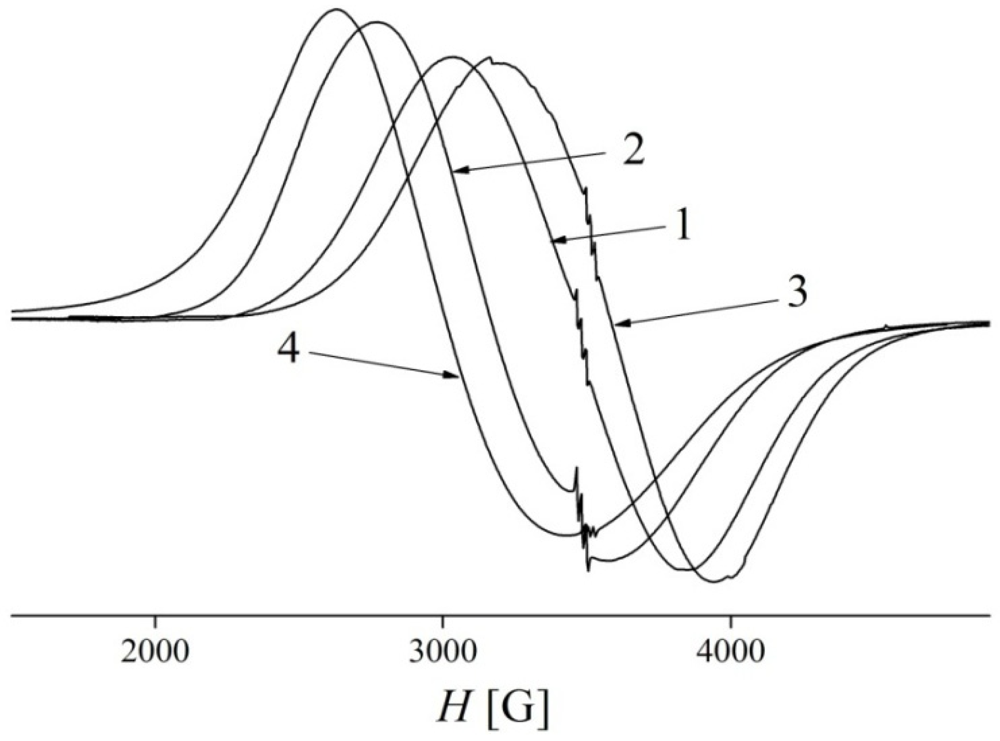
Figure 2.
Ferromagnetic resonance (FMR) spectra of magnetite nanoparticles in polyacrylamide gel (1, 2, 3) and in water (4). 1—gel synthesized without magnetic field; 2—gel synthesized in a magnetic field of ~1.5 kG and orientated by its magnetic axis along the spectrometer field; 3—gel synthesized in a magnetic field of ~1.5 kG and orientated by its magnetic axis across the spectrometer field.
It can be seen from
Figure 2 that the expectation is justified. The FMR spectrum of the magnetoisotropic gel (curve 1) is observed in stronger fields than the spectra of magnetoanisotropic gel (curve 2) and magnetic liquid (curve 4). The rotation of the magnetoanisotropic gel sample by 90° in the spectrometer field, results in a FMR spectrum shift to higher fields (curve 3). Thus the aggregates formed in magnetoanisotropic gel rotate with the sample and are not influenced by the magnetic field of spectrometer. This confirms the strong aggregate fixation in the gel matrix. The FMR spectrum of the magnetic liquid has a maximal shift to low fields mainly because of average magnetization of the nanoparticles in the magnetic liquid. It is higher than the particles magnetization in the magnetic gels (the magnetization decreases during polymerization, see
Section 2).
To get quantitative information on the fraction of aggregated particles and aggregate’s aspect ratio, the paramagnetic sensor technique is used. As it was shown earlier [
9], the EPR line of the sensor in magnetically diluted medium is inhomogeneously broadened by the local magnetic fields of the nanoparticles and their aggregates, and the line shape is defined by the local field configuration.
If point-like or spherical dipoles act as the sources of the local fields, the paramagnetic sensor line should be described by Lorentzian with the line width
where
MG is the gel magnetization. Such a line is called “Anderson line” [
13,
14,
15]. Here and below full polarization of the nanoparticles is assumed. The above description is adequate when the gyromagnetic ratio of a sensor and of the absolute majority of particles is sufficiently different to omit flip-flop terms of their interaction. The position of the Anderson line is defined by the resonance condition
![]()
(
f is the radio-wave frequency,
γ is the electron gyromagnetic ratio,
ge is the electron
g-value,
gR is the sensor
g-value) as well as by macroscopic demagnetizing fields
HD [
16] and by the fluctuation shift
δdDA [
17,
18]. The value and direction of the demagnetizing fields depend on the sample shape and orientation according to Equations (5.61)–(5.63) in [
16]. For spherical and cubic samples the demagnetizing fields equal zero. The fluctuation shift is caused by the fluctuations in location of dipoles of the nearby sensor. These fluctuations result in the line shift
δdDA to higher fields with
The Anderson line can be observed for the sensor located in the magnetoisotropic gel, where magnetic particles are uniformly distributed over the gel medium and isolated from each other.
An experimental EPR spectrum of the radical in the magnetoisotropic gel (
MG = 0.45(5) G) is represented in
Figure 3 together with the Anderson line. The Anderson line fits the experimental line when the line width
DA = 2.17(5) G and the line position
HR =
H0 +
δdDA = 3478.89(10) G. The spectrometer frequency
f = 9.763559(1) GHz and
gR = 2.00532(5) correspond to
H0 = 3478.65(10) G. The value of
DA is close to the theoretically predicted line width
DA = 2.27(25) G, and the difference of
HR−
H0 gives the fluctuation shift
δdDA = 0.24(10) G which is in agreement with Equation (1a). The macroscopic demagnetizing field was neglected according to the cubical symmetry of the sample (
Section 2).
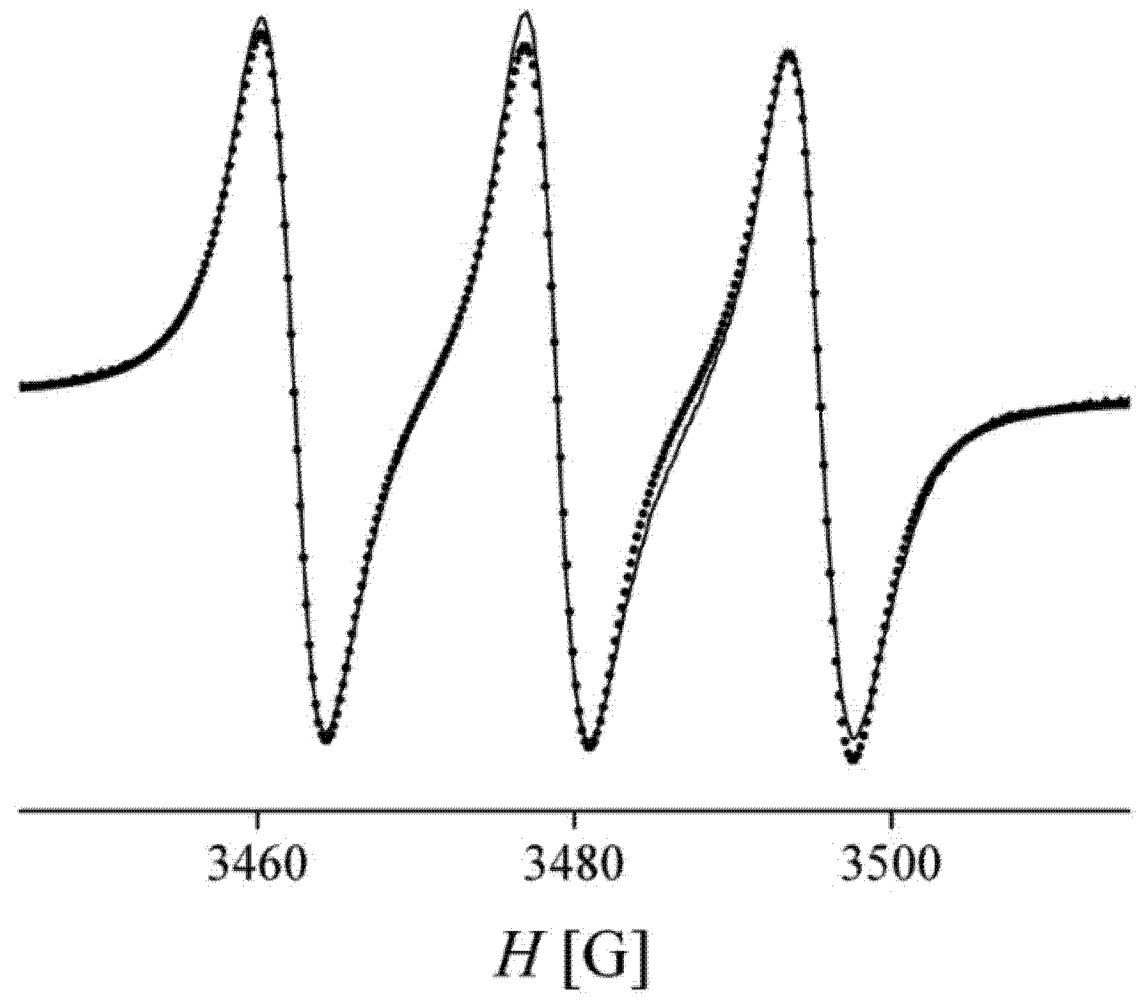
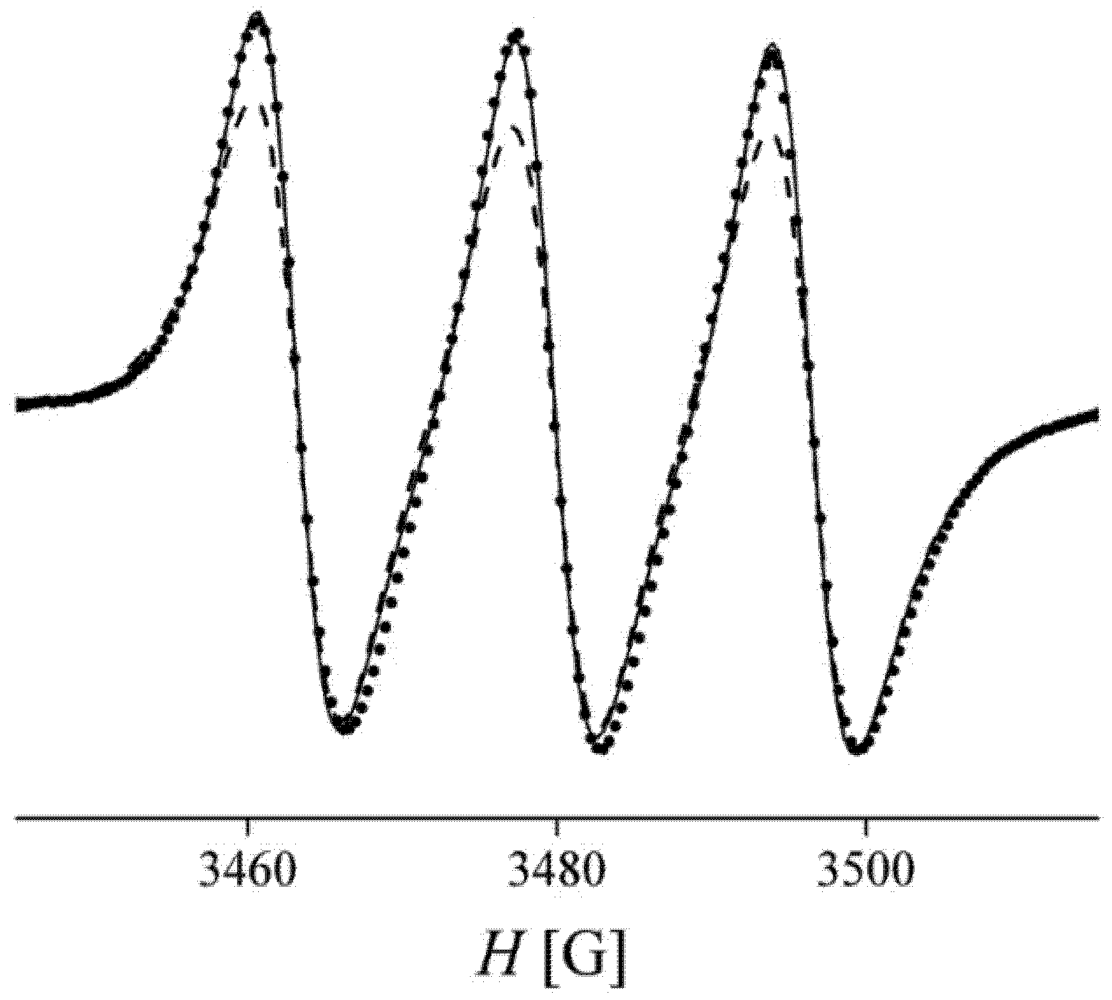
The experimental spectrum of the sensor in magnetoanisotropic gels has an asymmetry and cannot be fitted by the Lorentzian (
Figure 4). An attempt to fit the spectrum by the Lorentz function centered at
HR =
H0 +
δdDA gives
H0 = 3479.28(1) G instead of the expected
H0 = 3478.65(10) G. The line shape transformation and line shift find a natural explanation in the model [
9], which takes into account the formation of elongated aggregates of magnetic particles.
Figure 3.
Electron magnetic resonance (EPR) spectra of TEMPOL radical in magnetoisotropic gel (f = 9.763559 GHz). Dots: experimental spectrum. Solid line: theoretical description by the Anderson line.
Figure 3.
Electron magnetic resonance (EPR) spectra of TEMPOL radical in magnetoisotropic gel (f = 9.763559 GHz). Dots: experimental spectrum. Solid line: theoretical description by the Anderson line.
Figure 4.
EPR spectrum of TEMPOL radical in magnetoanisotropic polyacrylamide gel (f = 9.763559 GHz). Dots: experimental spectrum. Solid line: theoretical spectrum calculated for elongated aggregates. Dashed line: theoretical Lorentz line.
Figure 4.
EPR spectrum of TEMPOL radical in magnetoanisotropic polyacrylamide gel (f = 9.763559 GHz). Dots: experimental spectrum. Solid line: theoretical spectrum calculated for elongated aggregates. Dashed line: theoretical Lorentz line.
The theoretical analysis presented in [
9] is based on the calculation of free induction decay (FID). The FID function
F(
t) is related to the line shape function by the Fourier transformation. In the limit of short time FID coincides with the monopole one:
where
![]()
is the monopole line width (
ν is the linear density of the magnetic moment,
сс is the number of aggregate centers in unit volume), and
![]()
is such that the monopole shift
δmDA is equal to the Lorentz field. In the opposite limit of long times
t, the structure of aggregates is unimportant, and
F(
t) corresponds to the dipole FID of the Anderson line (with consideration for the fluctuation shift):
At the intermediate area,
F(
t) is described by more complicated relations represented in Reference [
9]. These relations were applied to calculate the resonance absorption line
g(
ω) presented in
Figure 4 as the Fourier transform of
F(
t). General analysis of the resonance line is fulfilled in terms of monopole and Anderson widths. We use the aspect ratio
![]()
to measure the aggregate elongation. Here
Nn is the total number of particles in the aggregate of a length
l,
nl =
l/
d, and
d is nanoparticle’s diameter. The aspect ratio can be calculated from the equation
where φ is a volume fraction of magnetic particles in the sample and κ is the fraction of aggregated particles.
Fitting the theoretical spectrum to the experimental one was carried out by variation of the parameters of F(t). It was assumed that only a part of nanoparticles was aggregated (κ ≤ 1) and therefore
where DA1 = (1− κ)DA0 and DA1δd are the Anderson line width and fluctuation shift produced by isolated (nonaggregated) nanoparticles, and DA0 is defined by Equation (1). Note that DA0 = DA if all particles are aggregated, and DA0 = DA1 if there are no aggregated particles in the system. For the calculation of FID F(t, Dm, DA) only aggregated particles are taken into account.
Figure 4 shows that the theoretical spectrum obtained in this framework has satisfactory agreement with the experimental spectrum of the sensor in magnetoanisotropic gel (
MG = 0.64(7) G) in both the shape of line and its position in the field.
For the experimental spectrum under study (
Figure 4), the line width parameters
DA and
Dm are equal to 2.01(5) and 2.05(6) G, respectively. The Anderson line width in the absence of aggregates
DA0 = 3.22(35) G. The fraction of aggregated particles
κ = 62(6)% was calculated as the ratio of
DA and
DA0. The aspect ratio of the aggregates in the analyzed sample
Nel = 12.6(1.3) was obtained from Equation (4).
These values can be compared with the results for the magnetic liquid, where both the fraction of the aggregated particles and the average aggregate’s length are larger than in the gel. They reach 100% and 60(6), respectively [
10]. The latter value is greater than the average aggregate’s length in the gel by a factor of about five. The first reason for the difference consists in the fact that the aggregate formation in the magnetic hydrosol was realized at approximately a two times higher magnetic field than in the gel. The second reason results from the prevention of aggregate development by the gel formation process. The difference in the aspect ratio and fraction of aggregated particles for magnetic liquid and gel obtained here are expected because the efficiency of aggregation in magnetic liquid is higher than in magnetic gel.


 , where
  and
and  with ГL = 1.021(45) G and ГG = 0.714(28) G.

 (f is the radio-wave frequency, γ is the electron gyromagnetic ratio, ge is the electron g-value, gR is the sensor g-value) as well as by macroscopic demagnetizing fields HD [16] and by the fluctuation shift δdDA [17,18]. The value and direction of the demagnetizing fields depend on the sample shape and orientation according to Equations (5.61)–(5.63) in [16]. For spherical and cubic samples the demagnetizing fields equal zero. The fluctuation shift is caused by the fluctuations in location of dipoles of the nearby sensor. These fluctuations result in the line shift δdDA to higher fields with


 is the monopole line width (ν is the linear density of the magnetic moment, сс is the number of aggregate centers in unit volume), and
  is such that the monopole shift δmDA is equal to the Lorentz field. In the opposite limit of long times t, the structure of aggregates is unimportant, and F(t) corresponds to the dipole FID of the Anderson line (with consideration for the fluctuation shift):
 to measure the aggregate elongation. Here Nn is the total number of particles in the aggregate of a length l, nl = l/d, and d is nanoparticle’s diameter. The aspect ratio can be calculated from the equation
