Article

Optimizing Data Preprocessing and Hyperparameter Tuning for Soil Organic Carbon Content Prediction Using Large Language Models: A Case Study of the Black Soil and Windblown Sandy Soil Regions in Northeast China


1
School of Environment, Shenyang University, Shenyang 110044, China
2
School of Agricultural Science and Practice, Royal Agricultural University, Cirencester GL7 6JS, Gloucestershire, UK
3
Key Laboratory of Eco-Restoration of Regional Contaminated Environment, Ministry of Education, Shenyang University, Shenyang 110044, China
*
Author to whom correspondence should be addressed.
Appl. Sci. 2026, 16(7), 3349; https://doi.org/10.3390/app16073349
Submission received: 3 March 2026 / Revised: 23 March 2026 / Accepted: 27 March 2026 / Published: 30 March 2026
(This article belongs to the Section Environmental Sciences)

Abstract

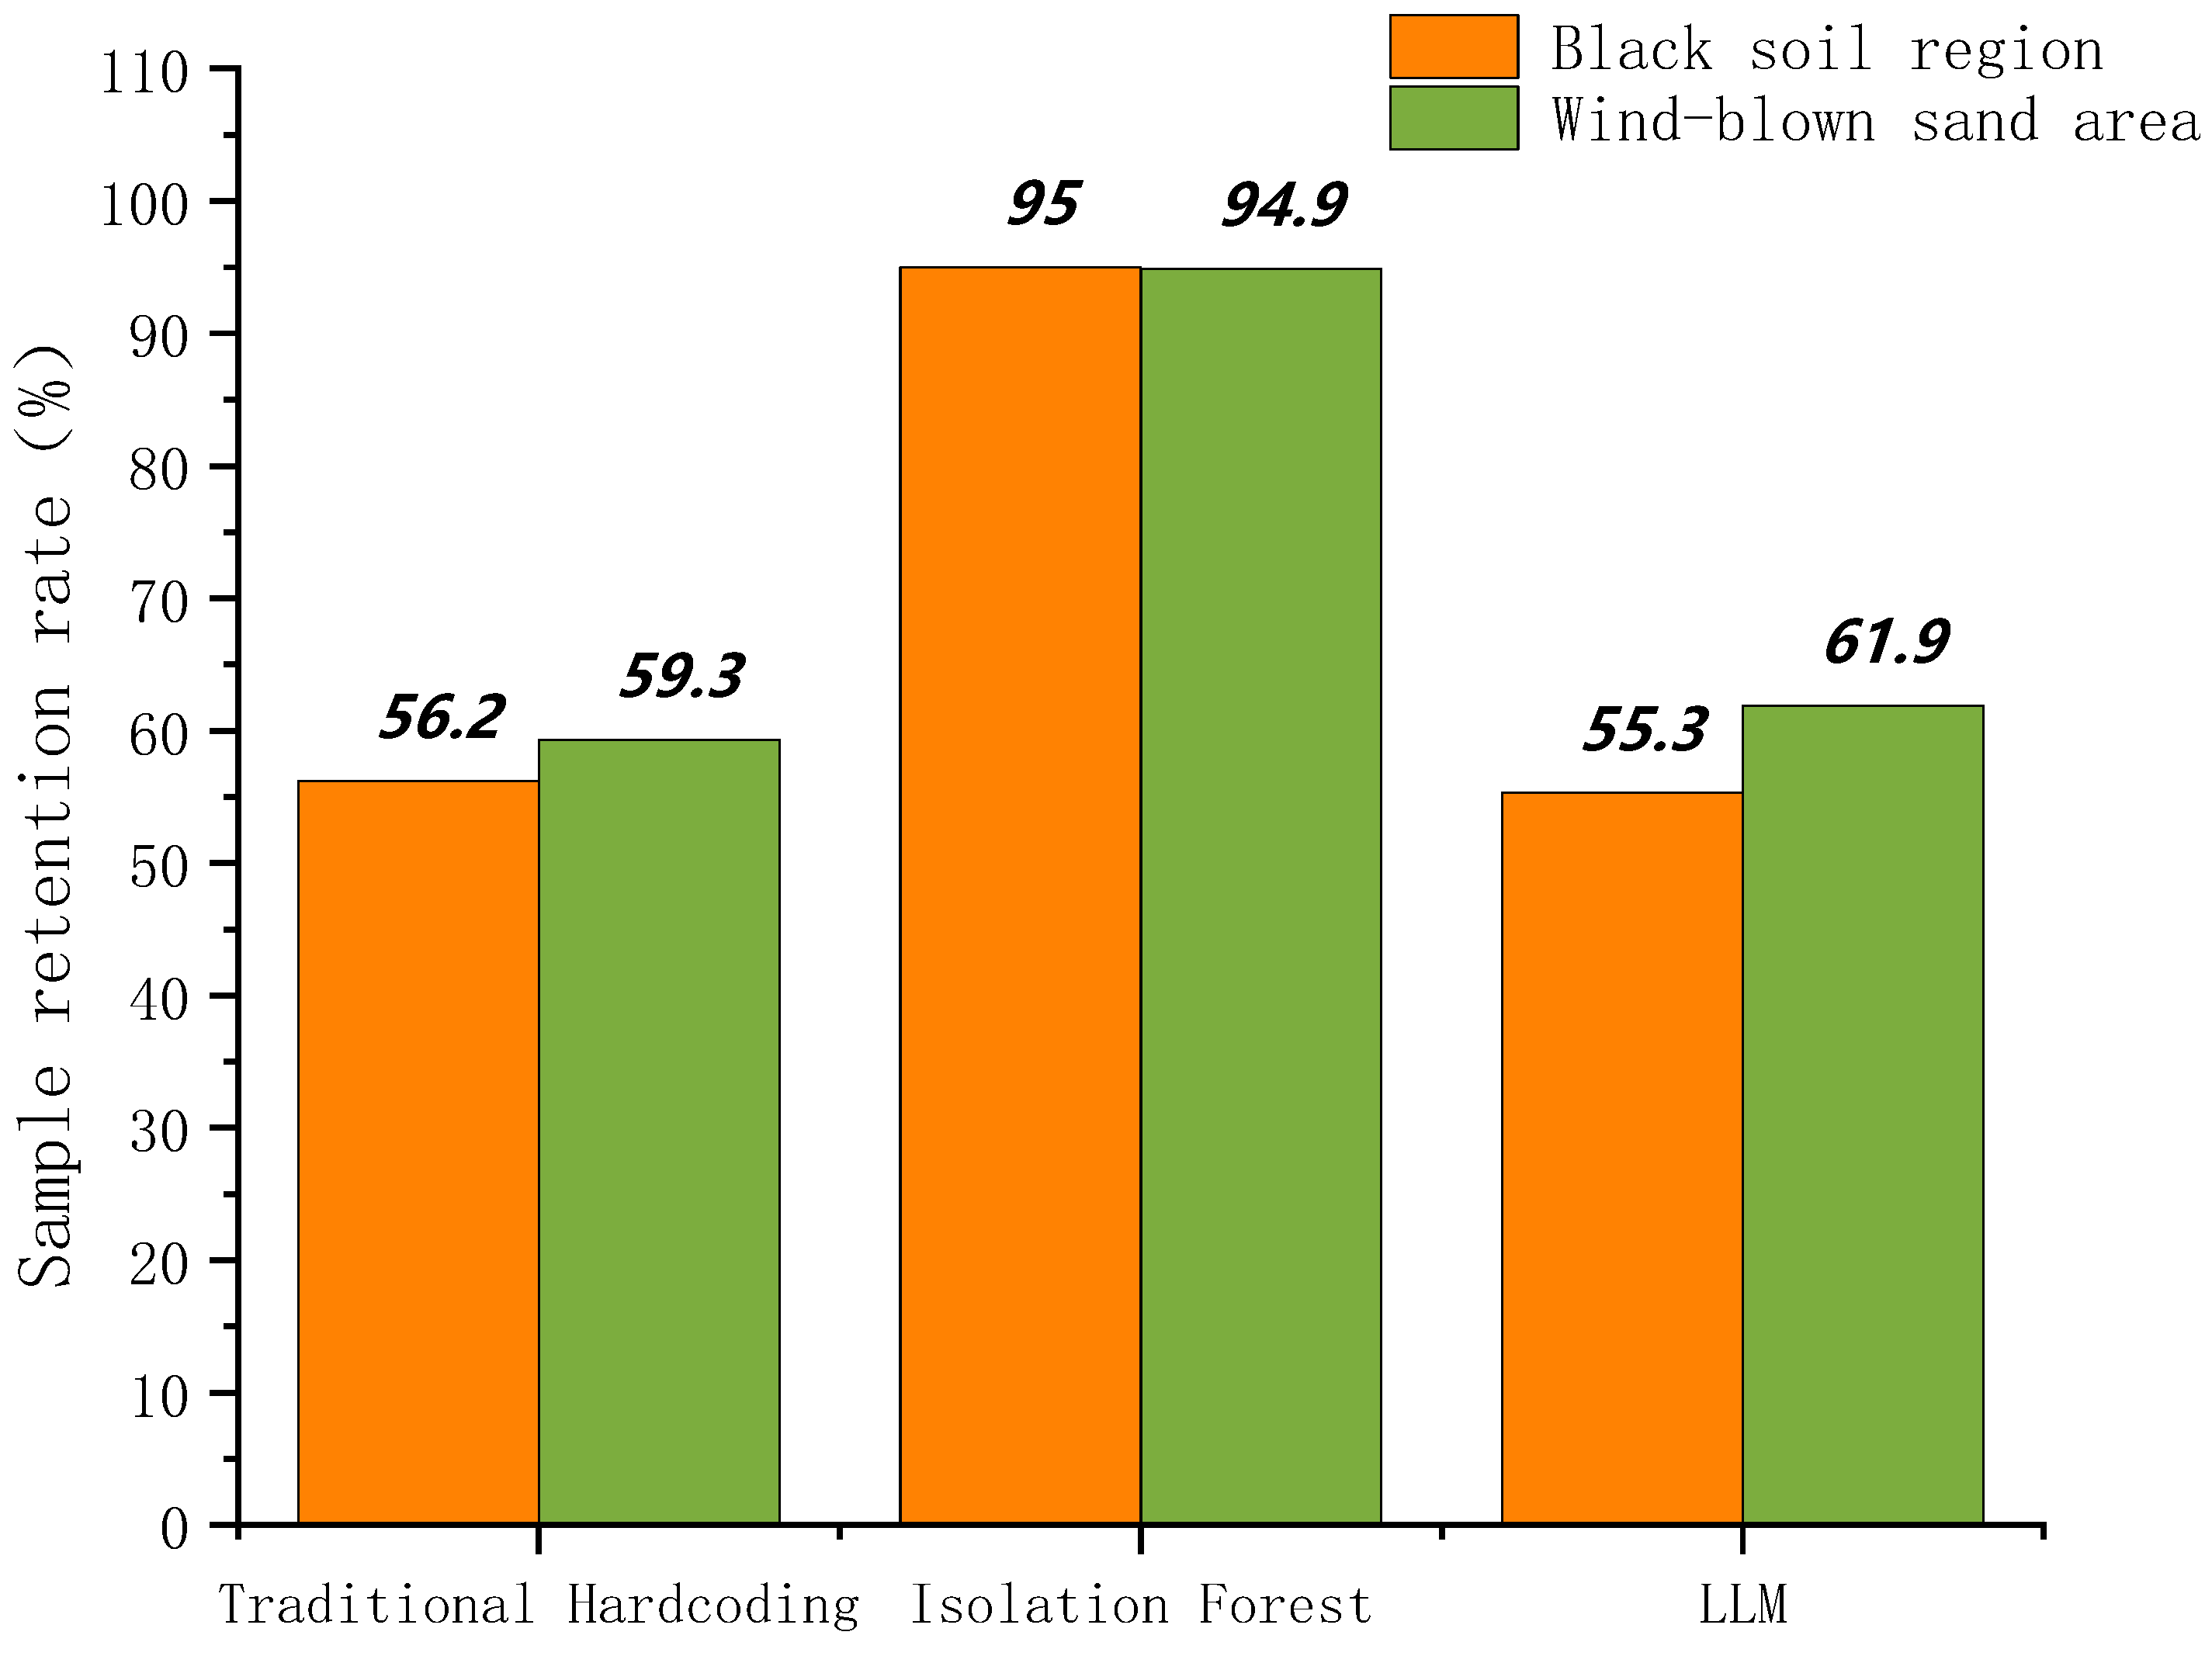
To address the current issues in soil organic carbon (SOC) content prediction where data preprocessing relies on expert experience to formulate fixed rules, resulting in a lack of uniform standards and insufficient consideration of regional soil heterogeneity; while hyperparameter tuning faces problems of high computational costs and excessively long runtimes, this study proposes an intelligent modeling workflow driven by Large Language Models (LLM). This workflow focuses on optimizing two key aspects of SOC Random Forest modeling: data preprocessing and hyperparameter tuning. Results: The LLM-defined rules achieved sample retention rates of 55.33% and 61.90% in the two regions, respectively, showing more significant differences compared to traditional hard-coded rules (56.2% and 59.3%), and the mean soil organic carbon content deviations (30.27% and 20.05%) were both lower than those of traditional hard-coding. At the same time, the mean soil organic carbon content values in both regions closely matched the effectiveness of other methods, indicating that the large language model has effectively captured regional soil differences. With only a single evaluation of hyperparameter optimization, the adaptive model achieved test set R2 values of 0.394 and 0.694 in the black soil region and the aeolian sandy soil region, respectively, with root mean square error values of 8.76 g/kg and 6.07 g/kg—its performance is comparable to that of Grid Search and Random Search, while computational efficiency improved by over 95%. Performance comparisons with eXtreme Gradient Boosting (XGBoost) and Partial Least Squares Regression (PLSR) show that the LLM-optimized Random Forest achieved R2 = 0.394 and RMSE = 8.76 g/kg in the black soil region, and R2 = 0.694 and RMSE = 6.07 g/kg in the windblown sandy soil region, demonstrating practical application value.

1. Introduction

Soil organic carbon (SOC), as the major component of the soil carbon pool, is not only a key indicator of soil fertility but is also closely related to the severity of soil desertification [1]. Previous domestic and international studies have shown that SOC acts as a “glue” for soil particles: abundant SOC helps bind soil particles into stable aggregate structures [2]. At the same time, due to its strong water-holding capacity, SOC can effectively enhance the drought resistance of soils and support the healthy growth of vegetation communities [3]. The well-developed root systems of vegetation further improve soil stabilization capacity. Therefore, SOC content is one of the effective indicators for assessing the degree of soil desertification. Accurately uncovering the relationship between SOC content and environmental factors to enable quantitative prediction has become an important research direction, and ensuring the correctness and rationality of data preprocessing methods in this process is also crucial. With the rapid development of artificial intelligence, machine learning algorithms have been widely applied to SOC estimation studies. For example, Mansur and Abbod trained various machine learning models using the RGB values of soil samples, thereby achieving effective estimates of soil organic matter content [4]; Beisekenov et al. combined remote sensing data with various machine learning models to monitor soil organic carbon in conservation agriculture systems, emphasizing the importance of model performance comparisons and environmental covariates [5]. However, current SOC estimation research still faces several problems: Traditional data preprocessing typically relies on expert experience to define fixed rules and thresholds for a study area, yet expert knowledge lacks unified standards and often fails to fully consider soil–environment heterogeneity across regions, making it easy to excessively discard valid data during preprocessing and thereby reducing model accuracy [6,7]. Meanwhile, during the development of SOC content estimation models, hyperparameter tuning usually requires extensive computational resources through repeated searches, leading to high computational cost and long runtime [8,9,10].
With the continued advancement of artificial intelligence, large language models (LLMs) have been widely used due to their strong capabilities in language processing and rule generation. At present, the intersection of LLM and the carbon domain mainly focuses on carbon emissions [11,12,13], carbon capture [14,15], and carbon footprints [16,17], while applications to SOC remain relatively scarce. As a deep learning model trained on massive text corpora, an LLM essentially forms a parameterized knowledge system by learning from large-scale information sources and then draws on this internal knowledge to generate new textual responses to user queries. This implies that LLM can respond to diverse questions flexibly. Accordingly, this study considers introducing LLM-based methods into SOC data preprocessing and hyperparameter tuning, aiming to provide adaptive processing standards for datasets from different regions and to generate hyperparameter combination schemes informed by broad literature knowledge.
This study focuses on the black soil region and the windblown sandy soil region. The black soil region, although generally characterized by relatively high SOC content, still faces desertification risk; the windblown sandy soil region, due to its arid climate with low precipitation, has lower SOC content and more prominent desertification problems [18]. Using these two regions as study areas can better highlight how SOC responds under contrasting environmental conditions. Taking these two regions as the research objects, this study aims to address the following questions: Can an LLM generate region-specific, well-adapted data preprocessing rules for different regions? When an LLM intelligently recommends differentiated random forest hyperparameter combinations for different regions, how do its efficiency and performance compare with traditional approaches? Do models built by LLM-optimized random forest hyperparameters meet the need for regional land/soil differentiation, and how is their performance across regions?
The structure of this study is as follows: Section 1 discusses the importance of soil organic carbon prediction, the specific research questions, and the latest research progress in this field, both domestically and internationally. Section 2 presents the research roadmap for this study. Section 3 describes the study area, data sources, and research methods. Section 4 analyzes the experimental results and compares the performance of methods based on large language models (LLMs) with those using traditional hard-coding, isolated forests, grid search, random search, XGBoost, and partial linear regression (PLSR). Section 5 summarizes the research findings and outlines future research directions.

2. Research Roadmap

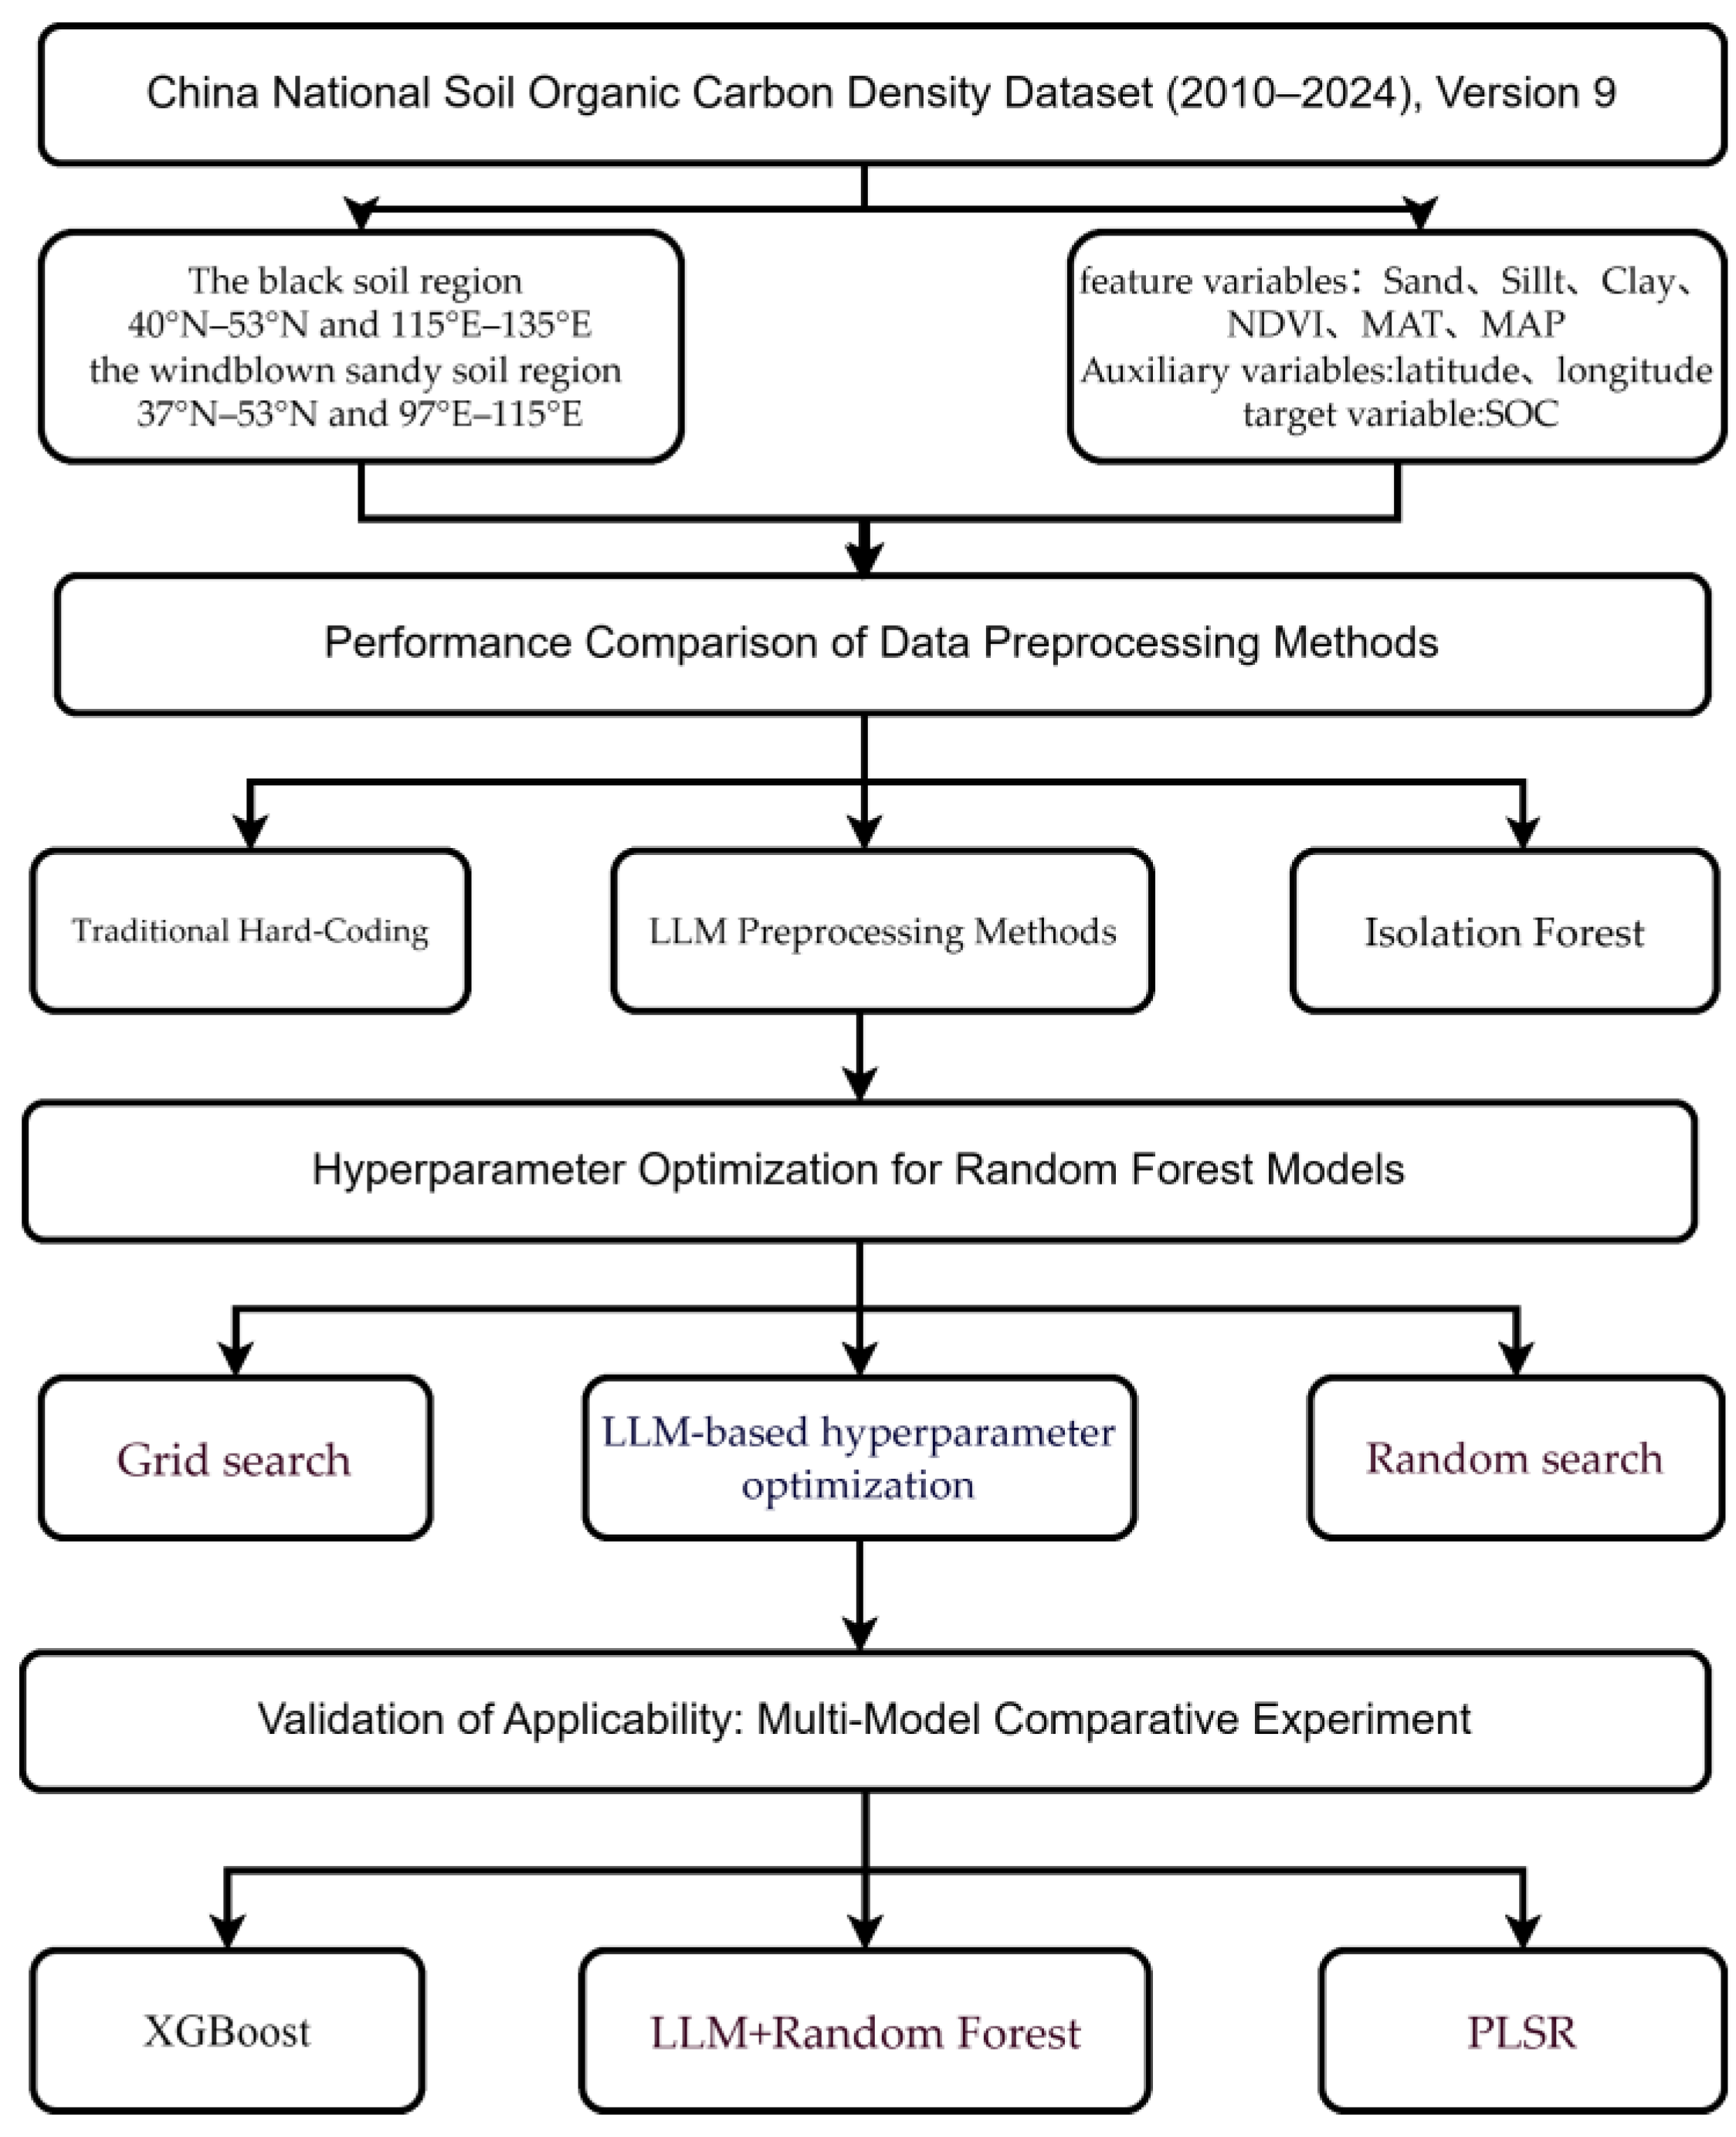
This paper leverages the decision-making capabilities of large language models. The workflow aims to improve the automation level and regional adaptability of traditional SOC preprocessing methods and random forest hyperparameter tuning. The overall research framework is shown in Figure 1.
In this study, the Chinese National Soil Organic Carbon Density Dataset (2010–2024), Version 9, was divided according to the boundaries of the Black Soil Region (40–53° N, 115–135° E) and the Wind-Sand Region (37–53° N, 97–115° E). The selected feature variables included sand, silt, and clay; the Normalized Difference Vegetation Index (NDVI); monthly mean temperature (MAT); and annual mean precipitation (MAP). The auxiliary variable was latitude and longitude, and the target variable was soil organic carbon (SOC). This study designed a series of comparative experiments around key stages of model development: during the data preprocessing stage, the effectiveness of traditional hard-coding, intelligent preprocessing methods based on large language models, and isolated forest anomaly detection algorithms in handling soil data was compared; during the model optimization stage, three strategies—grid search, hyperparameter optimization based on large language models, and random search—were applied to the random forest model to explore the decision-support capabilities of large language models in model configuration; In the model validation phase, multi-model comparison experiments were conducted to evaluate the predictive performance and transferability of Extreme Gradient Boosting (XGBoost), large language model-based Random Forest, and Partial Least Squares Regression (PLSR) across two soil regions.

3. Materials and Methods

3.1. Study Area and Data Sources

3.1.1. Study Area

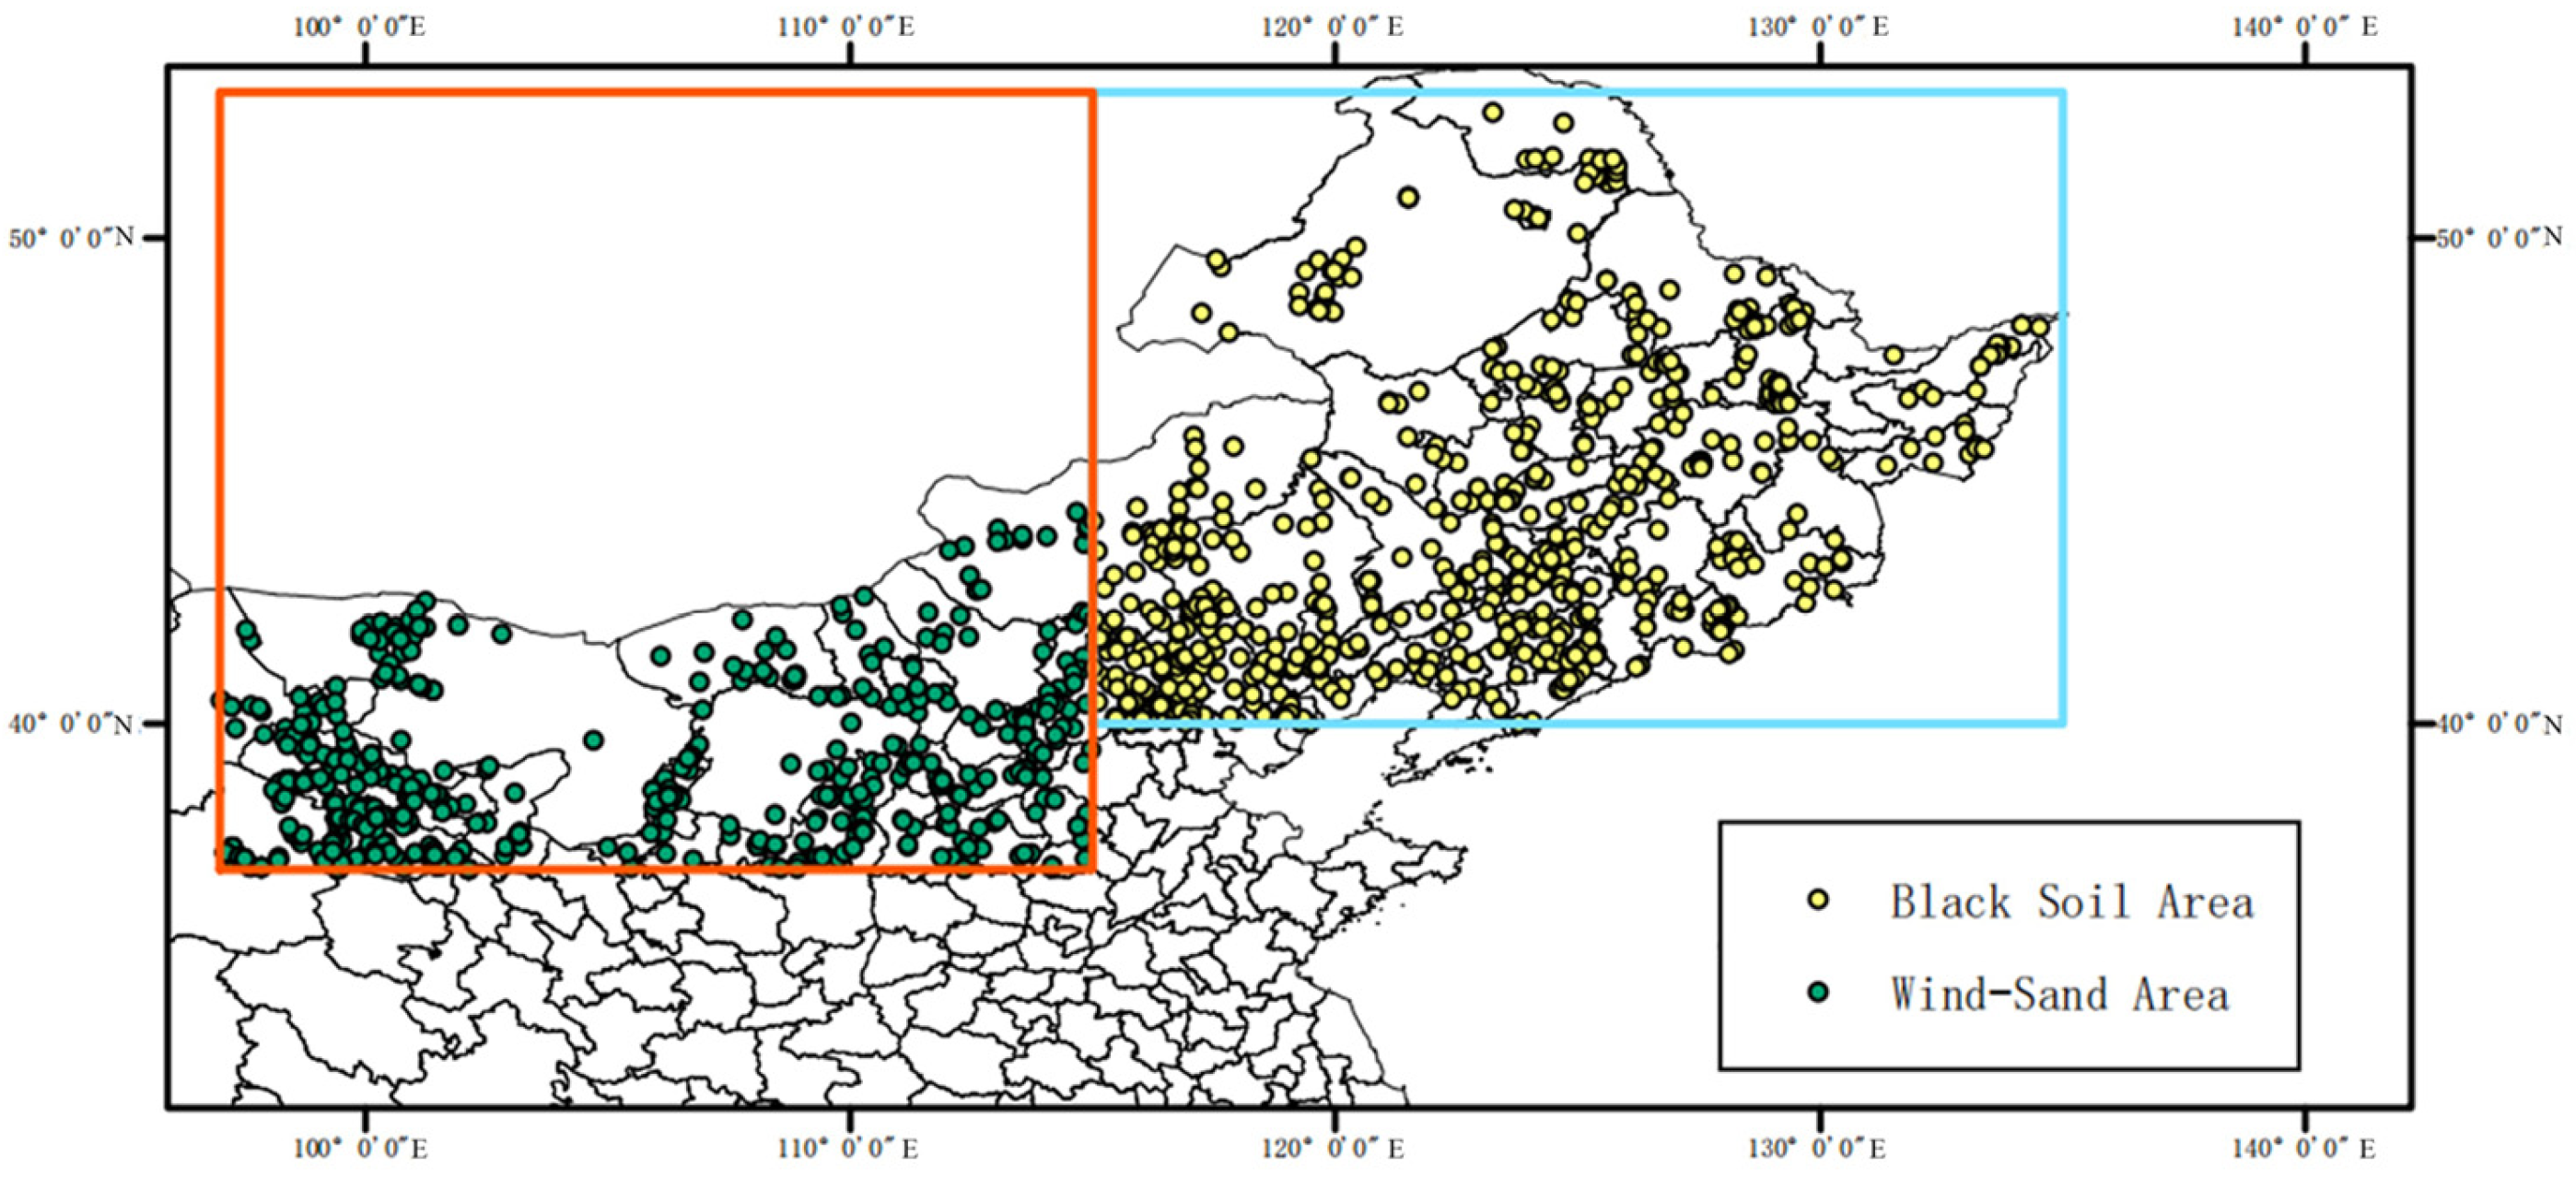
The study area focuses on two regions in Northeast China that differ markedly in climate and soil characteristics: the black soil region and the windblown sandy soil region. The black soil region spans 40°–53° N and 115°–135° E [19], while the windblown sandy soil region spans 37°–53° N and 97°–115° E [20]. Latitude and longitude were used to delineate the two regional datasets rather than traditional administrative boundaries because this study investigates relationships between the soil environment and SOC and builds predictive models accordingly. Administrative divisions are human-defined and can place samples from contrasting environmental conditions into the same region, leading to mixed samples that may obscure true associations and compromise scientific rigor [21,22]. In contrast, a latitude–longitude-based delineation can more precisely capture relatively homogeneous natural regions, avoiding these issues. This provides a more reliable data foundation for modeling and also offers theoretical support for future desertification control across administrative boundaries.
The black soil region is a typical representative black soil area in China, characterized by a mild climate and humid, rainy conditions. These climatic features contribute to the high-carbon nature of soils in this region. Its soil types consist mainly of black soil (70%), supplemented by chernozem-like soils (20%) and meadow soils (10%). The windblown sandy soil region exhibits typical arid conditions with low precipitation and sparse vegetation, which in turn shape its low-carbon soil characteristics. Its soil types are dominated by aeolian sandy soil (62%), followed by chestnut soil (28%) and brown calcareous soil (10%). The distribution of sampling sites in the dataset is shown in Figure 2.

3.1.2. Data Sources

The soil organic carbon density (SOCD) data used in this study were obtained from the national China Soil Organic Carbon Density dataset released by Chen et al. in 2025 [23]. Using the latitude–longitude bounds and the surface soil depth (0–20 cm) [24], a total of 797 samples from the black soil region and 609 samples from the windblown sandy soil region were selected. Key metrics from the dataset are shown in Table 1.

3.2. Data Preprocessing Methods

This study compares three data preprocessing approaches: traditional hard-coded rules, Isolation Forest, and an LLM-based method. Each approach is used to preprocess the data, including three main steps—data standardization [25], missing-value imputation [26], and outlier detection [27]—to prepare the dataset for subsequent analyses.

3.2.1. Traditional Hard-Coding

This approach relies on authoritative domain expertise and historical literature to establish fixed preprocessing rules and threshold values for data cleaning. The procedure is as follows:
Data standardization: Traditional hard coding conducts data standardization in several steps. Non-numeric characters are removed, including invalid symbols such as percent signs, parentheses, and spaces in both feature variables and the target variable. The cleaned string data are converted to numeric values; any entries that cannot be converted are set to NaN. The data types of all variables are checked to ensure they are suitable for computation.
Missing-value imputation: For missing values in numeric variables in both regions, imputation is performed using a global measure of central tendency; for missing values in categorical variables, the most frequent category is used.
Outlier handling: Fixed rules and thresholds are defined based on authoritative expert knowledge and historical literature. For the black soil region and the windblown sandy soil region, region-specific upper and lower SOC thresholds are set, and samples with SOC values outside these thresholds are removed.

3.2.2. Isolation Forest

This approach follows the principle of “few and different,” moving away from predefined threshold settings for data preprocessing [28]. The workflow is as follows:
Data standardization: Because the dataset contains multiple types of numeric data, the primary goal is to ensure valid, interference-free data formats. Feature scaling operations such as Z-score standardization or Min–Max normalization are not required, because Isolation Forest isolates anomalies by randomly partitioning features and evaluating the degree to which a sample is isolated from others. It does not depend on the absolute magnitudes of feature values; therefore, feature scaling is unnecessary.
Outlier detection: After standardization, key features that are closely related to SOC are selected and fed into the Isolation Forest model. Isolation Forest constructs multiple decision trees to “isolate” samples; outliers, because they are rare and clearly different from normal observations, tend to be separated quickly and end up in leaf nodes at shallow depths, thus being distinguished from normal samples.
Outlier removal: After training, an anomaly score is computed for each sample. Scores closer to 1 indicate that a sample is more likely to be an outlier. The anomaly score is calculated as follows:
s x , n = 2 E h x c n .
Here, (h(x)) denotes the path length of sample (x) in a decision tree, i.e., the number of edges from the root node to the leaf node. ( E h x ) is the average path length of sample (x) across all trees, and (c(n)) is the reference value of the expected (average) path length for a given sample size (n).
The calculation formula for (c(n)) is shown below:
c n = 2 H n 1 2 n 1 n ,
where H n 1 is the n 1 -th harmonic number, defined as H ( n 1 ) = k = 1 n 1 1 k , It can be approximated by ln ( n 1 ) + γ , with γ 0.5772 being the Euler–Mascheroni constant.
Missing-value imputation: After outlier removal, missing values are imputed using latitude binning and stratified filling. Following the assumption that “similar latitudes imply similar soil characteristics,” samples are divided into five spatial groups. Missing values within each group are then imputed using the group mean. If a spatial group contains too few samples, the global mean is used instead to impute missing values.

3.2.3. LLM Preprocessing Methods

This paper employs the large language model service provided by Zhipu AI as the core component for intelligent data preprocessing. Its core workflow is as follows:
Build a contextual environment for the study region that incorporates professional soil knowledge. The context includes background information such as climate type, soil-type composition, and statistical characteristics of the soil dataset.
The LLM performs reasoning based on the contextual information and “tailors” region-specific preprocessing rules, including data standardization, outlier removal, and missing-value imputation. Meanwhile, because the LLM’s core mechanism relies on semantic understanding and data-quality cues for flexible screening, slight variations may occur in preprocessing results. When the temperature is set to a low value (0.1), the outputs remain highly consistent, although small differences may still exist. Such variability is considered reasonable [29].
The system executes data preprocessing according to the rules generated by the LLM.

3.3. Model and Hyperparameter Optimization

3.3.1. Random Forest

This study uses the random forest algorithm to evaluate feature attributes and to build a random forest regression model. The input features are Sand, Silt, Clay, NDVI (vegetation cover index), MAT (mean annual temperature), and MAP (mean annual precipitation), and the target variable is SOC (g/kg).
Perform bootstrap sampling (random sampling with replacement) from the original training data to generate (M) training subsets.
For each training subset, select (m) features from the full set of predictors, where (m) is much smaller than the total number of features in the subset. The contribution of each feature is then computed using the Gini index, and the most representative feature is chosen to split nodes and construct the base decision tree. The Gini index is calculated as follows:
G i n i D , A = D 1 D G i n i D 1 + D 2 D G i n i D 2 .
In this equation, ( G i n i D , A ) denotes the Gini index of attribute (A) on dataset (D). (D1) is the number of samples in (D) that take a certain value (or fall into a certain partition) under attribute (A), and (D2) is the number of remaining samples. The unified formula for constructing ( G i n i D 1 ) and ( G i n i D 2 ) is:
G i n i ( D ) = 1 k = 1 K | C k | | D | 2
Here, ( C k ) is the number of samples in set (D) that belong to class (k), and (K) is the number of classes.
The multiple constructed decision trees are combined to form the random forest model.
The final predicted SOC value is obtained by averaging the SOC predictions from all trees in the forest [30].

3.3.2. Hyperparameter Optimization

In this study, three hyperparameter optimization methods are used to tune three random forest hyperparameters: n_estimators (number of trees), max_depth (tree depth), and max_features (number of features). The three optimization methods are grid search [31], random search [32], and LLM-based hyperparameter optimization [33].
Grid search:
For each hyperparameter to be tuned, a candidate value list is manually specified.
Enumerate all combinations: all values across the lists are combined to generate every possible hyperparameter combination.
Train and evaluate each combination: for every hyperparameter set, a model is trained and its performance is evaluated using cross-validation or similar methods.
Select the best combination: the hyperparameter set with the best performance on the evaluation set is chosen as the optimal configuration.
Random search:
Unlike grid search, random search does not exhaustively try all possible combinations.
Define a statistical distribution for each hyperparameter and set a fixed number of trials (n).
In each iteration, the algorithm randomly samples a value from each hyperparameter distribution to form a hyperparameter set.
Train the model with this set and evaluate its performance using cross-validation; repeat the above steps (n) times [34].
LLM-based hyperparameter optimization:
Build an “intelligent context” and prepare a detailed diagnostic report for the LLM, including: a data profiling report (e.g., sample size, feature dimensionality, SOC mean, and other summary statistics); a regional background profile (e.g., climate type of the study area, such as temperate monsoon or continental climate, and major soil types); and task instructions explicitly asking the LLM to act as a machine learning expert and recommend random forest hyperparameters.
The LLM conducts logical reasoning based on this context. For example, it analyzes data scale (“the black soil region has more than 1000 samples and can support a more complex model, so a larger n_estimators is recommended”), considers regional characteristics (“data in the windblown sandy soil region are relatively sparse, so model complexity should be controlled to avoid overfitting, and max_depth should not be too large”), and integrates domain knowledge by drawing on its learned information about random forests and soil science.
The LLM directly outputs a complete, customized set of hyperparameters. With temperature = 0.1 [35], the recommendations remain highly consistent; moreover, random forest algorithms are robust to small variations within a reasonable range of hyperparameter values.

3.4. Model Evaluation Metrics

The coefficient of determination (R2) is used to evaluate the overall goodness of fit of a model, and it is calculated based on the differences between observed and predicted values. R2 is computed as (R2 = SSR/SST), where (SST) represents the deviation of the observed values from their mean, calculated as SST = Σ(yi y ¯ )2, with ( y ¯ ) being the mean of the dependent variable; and (SSR) represents the explained variation relative to the mean, calculated as (SSR = Σ( y ^ i y ¯ )2), where ( y ^ i ) is the predicted value. The closer (R2) is to 1, the better the model fit [36].
The root mean square error (RMSE) is used to quantify the magnitude of the differences between model predictions and the observed values. A smaller RMSE indicates higher prediction accuracy [37]. The formula is as follows:
R M S E = 1 n i = 1 n ( y i y ^ i ) 2 ,
where (yi) is the observed (true) value of the (i)-th sample, and ( y ^ i is the predicted value of the (i)-th sample).

4. Results and Analysis

4.1. Data Preprocessing Performance Comparison

This study uses six indicators—Sand, Silt, Clay, NDVI, MAT, and MAP—as input variables, with soil organic carbon (SOC) content as the output variable. The rationale for this selection is as follows: Research by Chen Xintong et al. on desert, grassland, shrubland, and forest ecosystems in northern China indicates that SOC content is significantly negatively correlated with mean annual temperature (MAT), pH, and sand content, and significantly positively correlated with mean annual precipitation (MAP), clay content, silt content, NDVI, and plant species richness. This study confirms that, at the regional scale, SOC content is primarily influenced by the combined effects of climatic factors (MAT, MAP), soil factors (Sand, Silt, Clay), and vegetation factors (NDVI). Therefore, this study selected these six variables as predictors, also considering their availability in the dataset used [38].
During data preprocessing, the two types of variables are cleaned separately: for the input variables, both outliers and missing values are handled; for soil organic carbon content, only outliers are filtered, and samples with missing soil organic carbon content values are directly removed. Finally, the preprocessing performance is compared across three approaches: traditional hard-coded rules, a machine learning method (Isolation Forest), and an LLM-based method. The context generated by the LLM during the data preprocessing stage for the two regions is as follows:
As a soil data specialist, generate data preprocessing rules for the [Region Name] area.
[Data Context]
Region: [Region Name], [Climate Type]
Sample size: [Sample Size] samples
SOC statistics: Mean [SOC Mean] ± [SOC Standard Deviation] g/kg
Sand statistics: Mean [Sand Mean] ± [Sand Standard Deviation]%
[Rule Requirements]
1. SOC outlier range: Set reasonable upper/lower limits based on statistical distribution
2. Sand outlier upper limit: Establish the maximum value considering soil characteristics
3. Missing value imputation strategy: Fill based on soil_type_lat
[Northeast Black Soil Region Rules]
Soil organic carbon content distribution in the black soil region is relatively concentrated, thus employing a small-scale range for Soil organic carbon content anomalies. Under humid climatic conditions, sand content is relatively low. Median values are estimated by grouping soil types and latitudes to fully preserve the high-carbon characteristics of black soil.
[Northeast Windblown Sandy Soil Region Rules]
Soil organic carbon content exhibits significant variability in the Windblown Sandy Soil Region, necessitating an expanded range for Soil organic carbon content anomalies to preserve genuinely low values. Arid areas feature higher sand content. Latitude-based binning and median interpolation by soil type are employed to avoid introducing external biases.
The preprocessing rules and associated numerical thresholds for the context representation settings of the large language model (LLM) were autonomously generated by the LLM based on the provided regional background information. Specifically, the LLM received statistical summaries derived from the dataset (e.g., mean and standard deviation of SOC and sand content, sample size) and regional background information compiled manually from the literature (e.g., climate type, major soil types, environmental characteristics). Based on these inputs, the LLM independently derives appropriate anomaly ranges and thresholds and formulates the complete rule text described above.
This adaptability is clearly demonstrated in the LLM’s differentiated outputs for the two study regions. For the black soil region—characterized by relatively concentrated soil organic carbon (SOC) content distribution, a humid climate, and low sand content—the LLM set the SOC anomaly range to 5–45 g/kg and the upper limit for sand content to 80%. In contrast, for the windblown sandy soil region —characterized by high soil organic carbon (SOC) content variability, predominantly arid conditions, and typically high sand content—the LLM expanded the SOC anomaly range to 0.5–60 g/kg and set the upper limit for sand content at 95%.
These results demonstrate that LLM possesses the ability to adaptively generate region-specific preprocessing rules without the need for humans to explicitly specify numerical boundaries. The stability and validity of the generated rules were verified through multiple runs. The consistency of the results across runs confirms the robustness of LLM’s reasoning and that the selected thresholds are not coincidental outcomes but rather reflect the integration of its internal knowledge with the provided context.
Based on the above results, the following findings can be drawn:
As shown in Table 2 and Table 3, all three methods achieved a 100% missing-value imputation ratio.
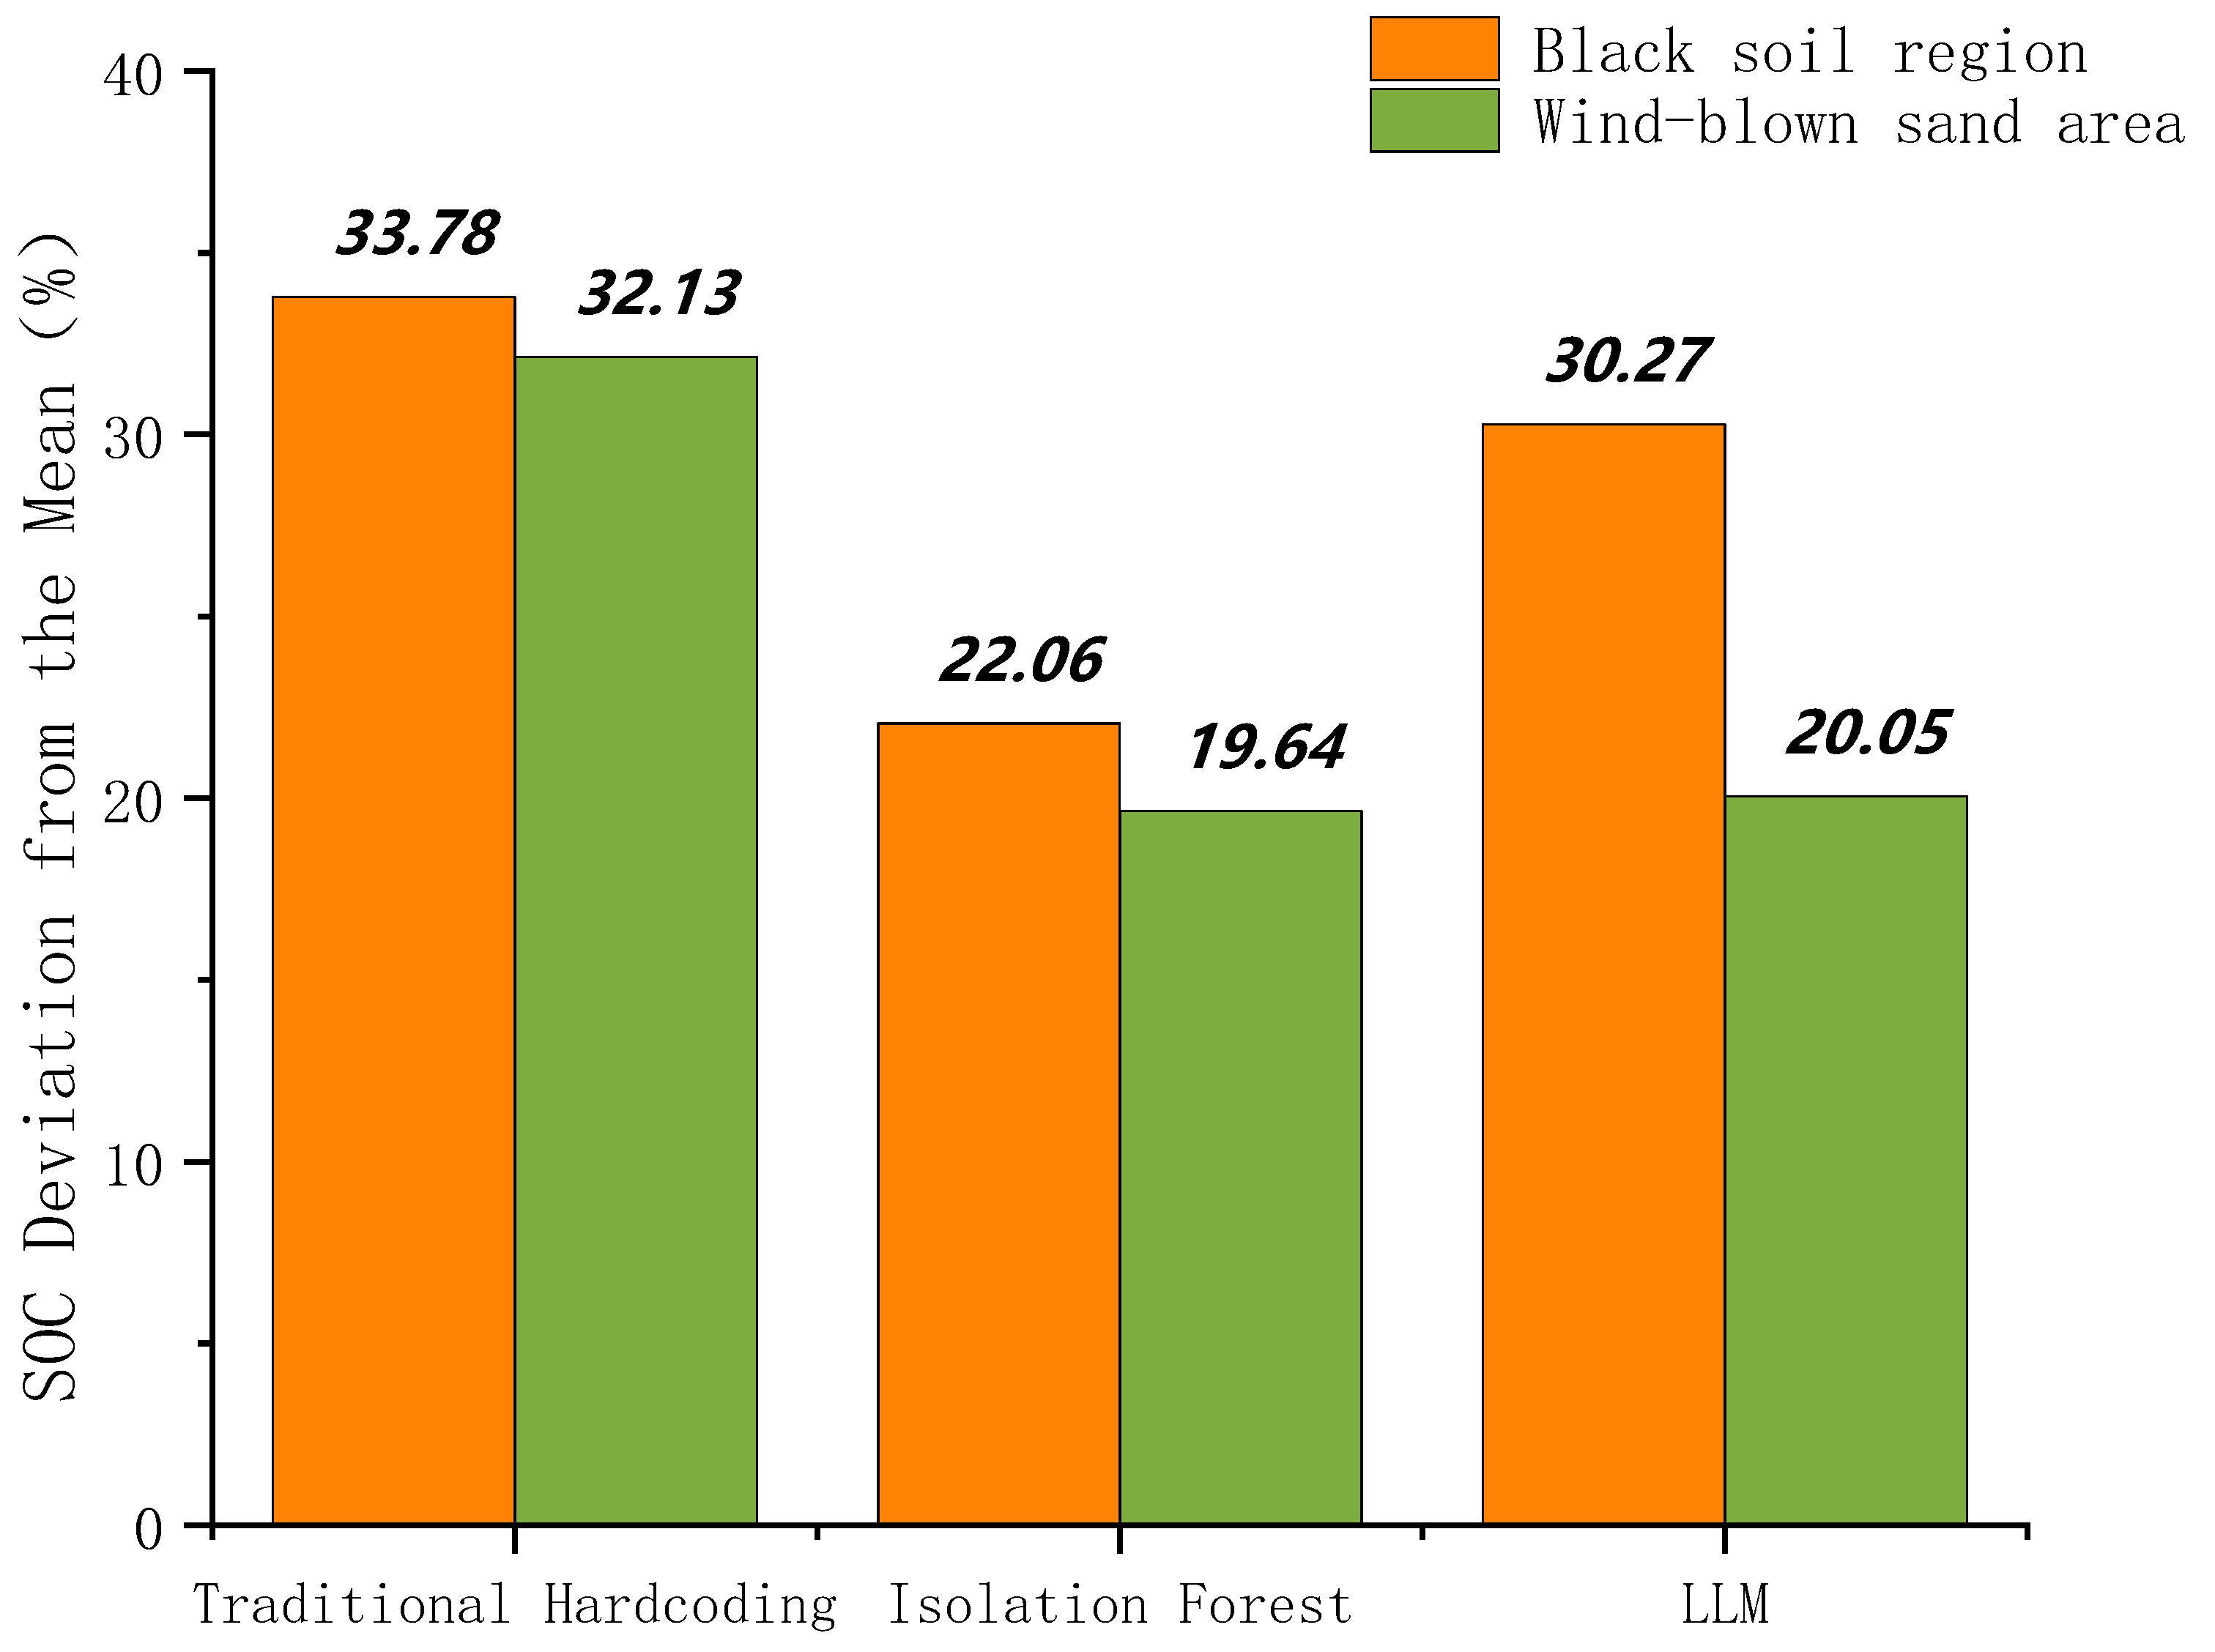
Figure 3 indicates that Isolation Forest yields the highest sample retention rate, and Figure 4 further shows that it also performs best in terms of SOC mean bias. However, because Isolation Forest processes data primarily based on statistical characteristics—unlike the other two approaches, which follow a dual screening principle combining soil-science knowledge and data characteristics—its advantage is not considered here in order to better account for regional heterogeneity. Regarding retention rates, the black soil region and the windblown sandy soil region exhibit contrasting soil environmental characteristics (high-carbon and complex conditions in the black soil region versus low-carbon and relatively simple conditions in the windblown sandy soil region), which indirectly affect sampling difficulty and data quality. Because the LLM is sensitive to data quality, it can more accurately identify high-quality samples under varying regional data conditions, resulting in the reasonable phenomenon of lower retention rates in the black soil region and higher rates in the wind-sand region. Compared to traditional hard-coded rules, LLM demonstrated a more pronounced difference in retention rates between the two regions (LLM retention rate difference 6.6 > traditional hard-coded retention rate difference 3.1), indicating stronger regional specificity. Furthermore, the mean deviation in soil organic carbon content produced by LLM was lower than that of traditional hard-coded methods. Overall, LLM exhibited optimal adaptability in both cross-regional high-quality sample selection and control of mean deviation in soil organic carbon content.
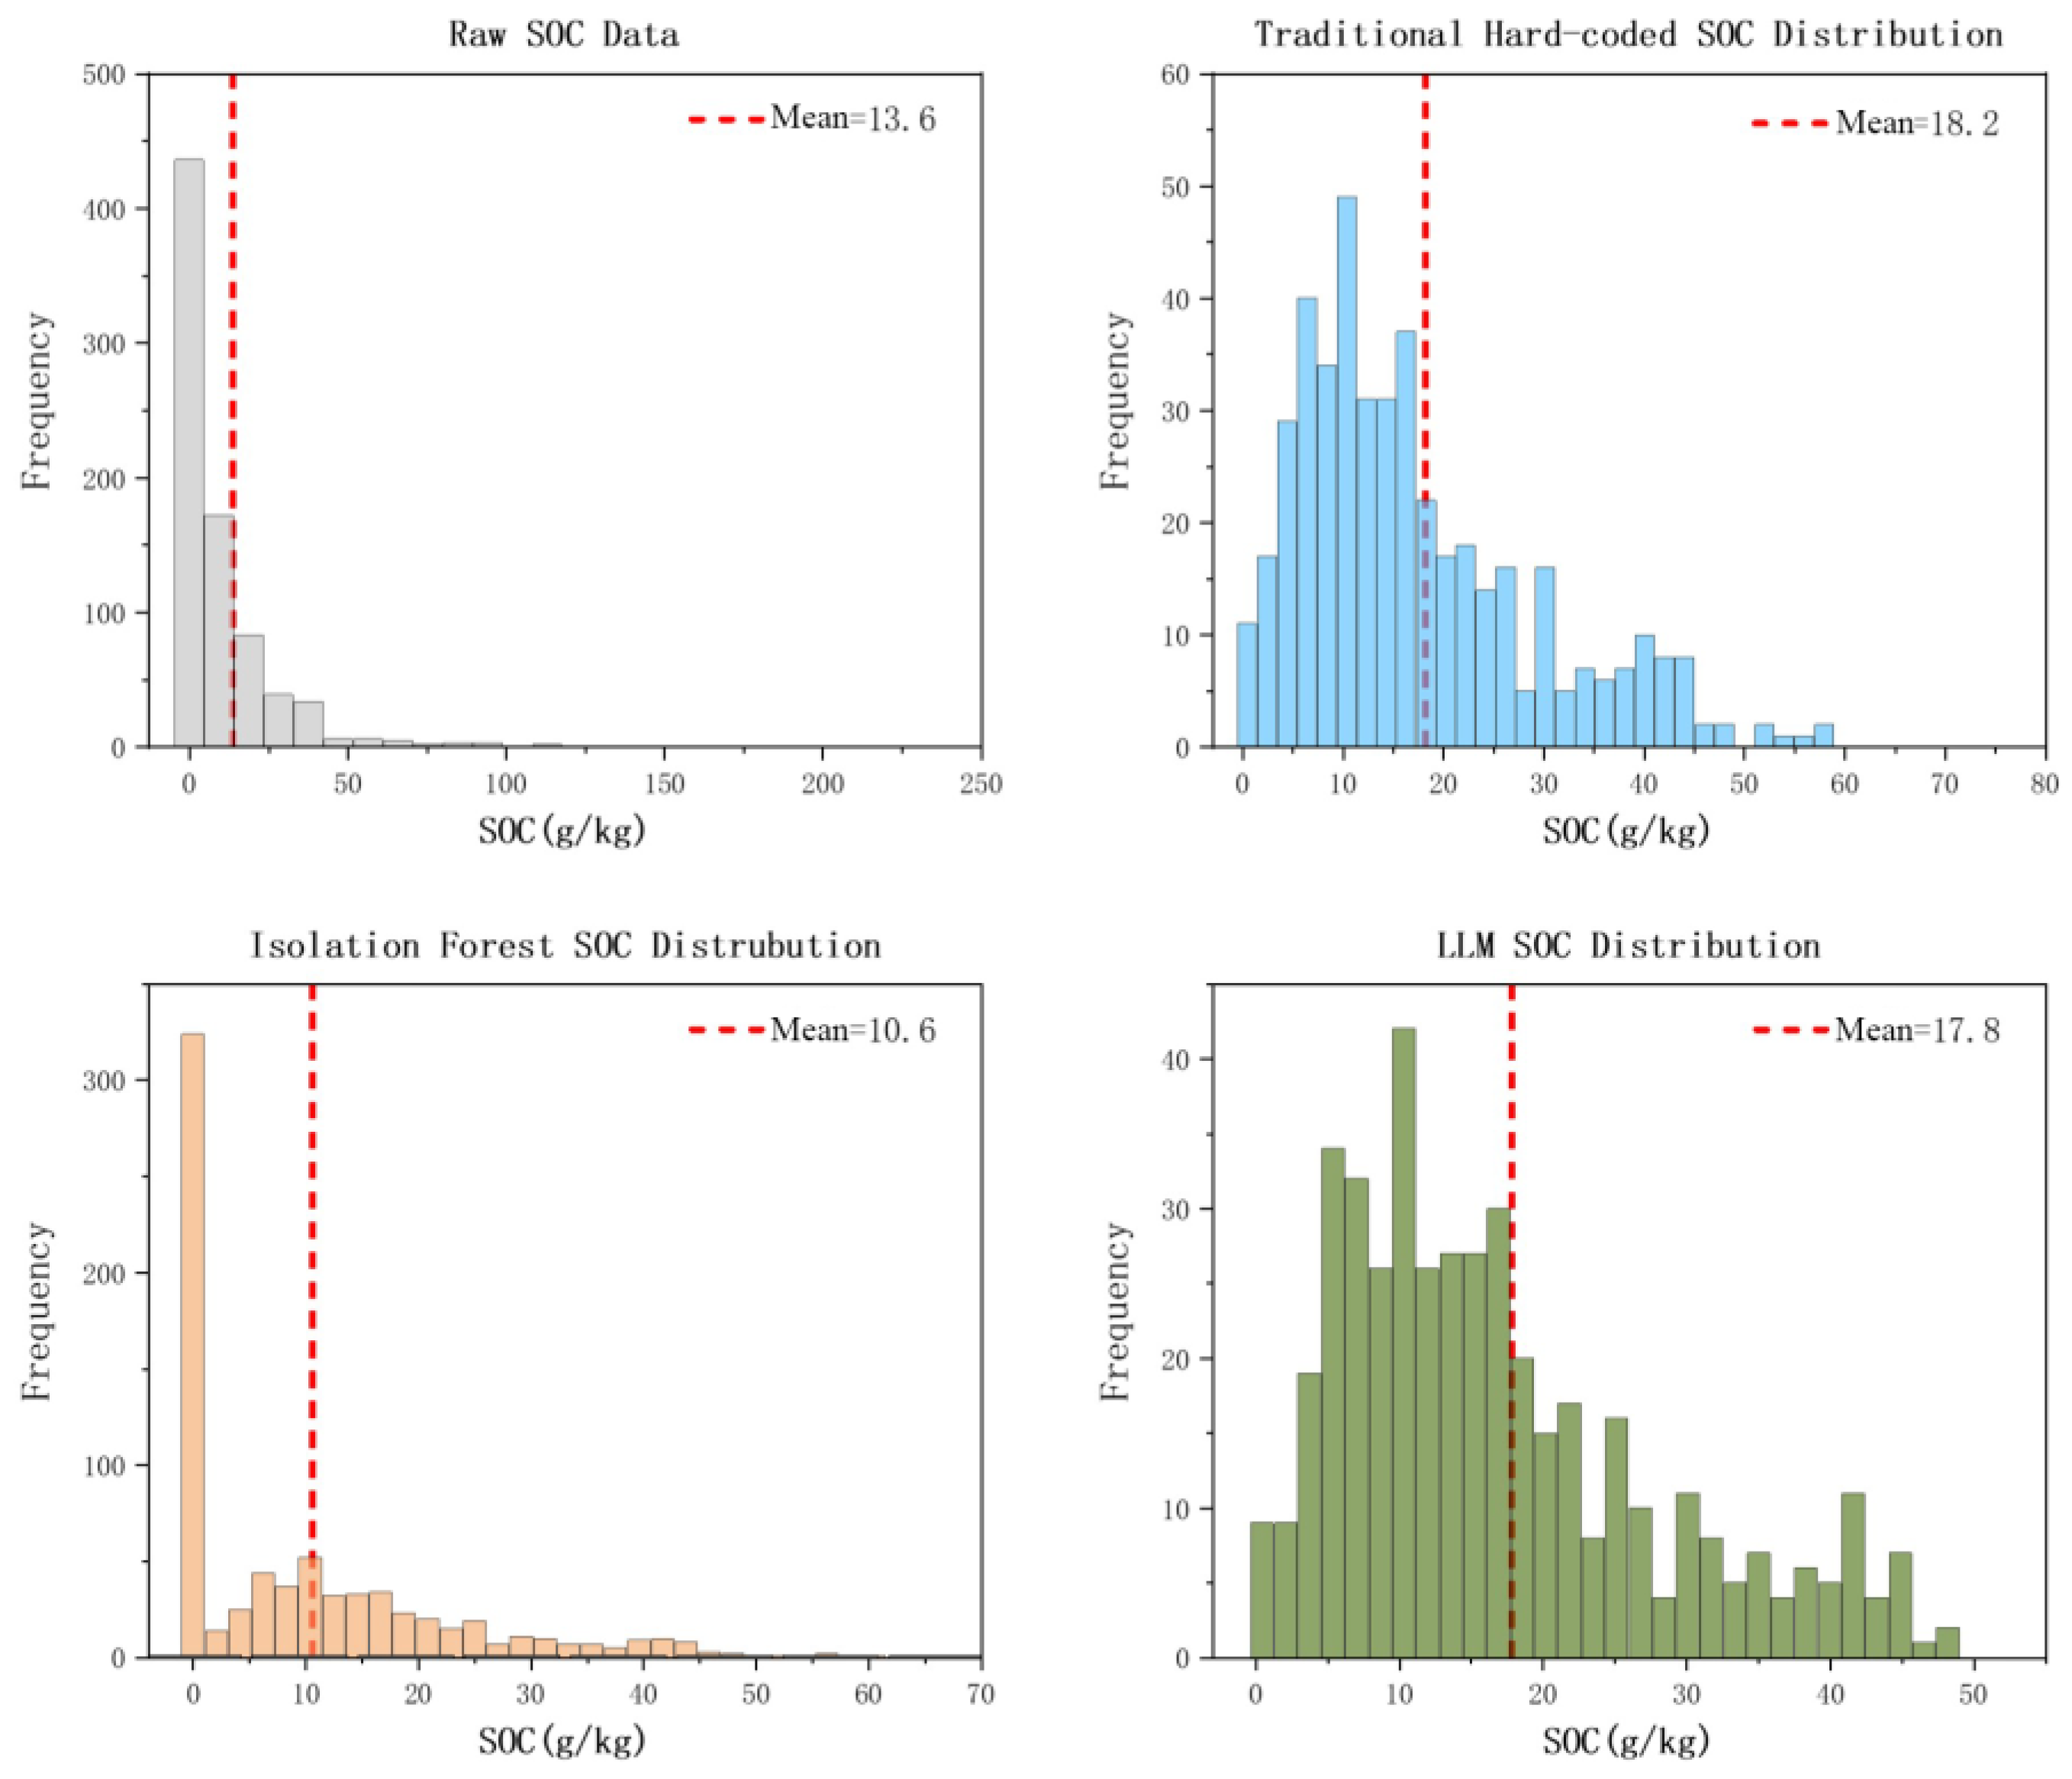
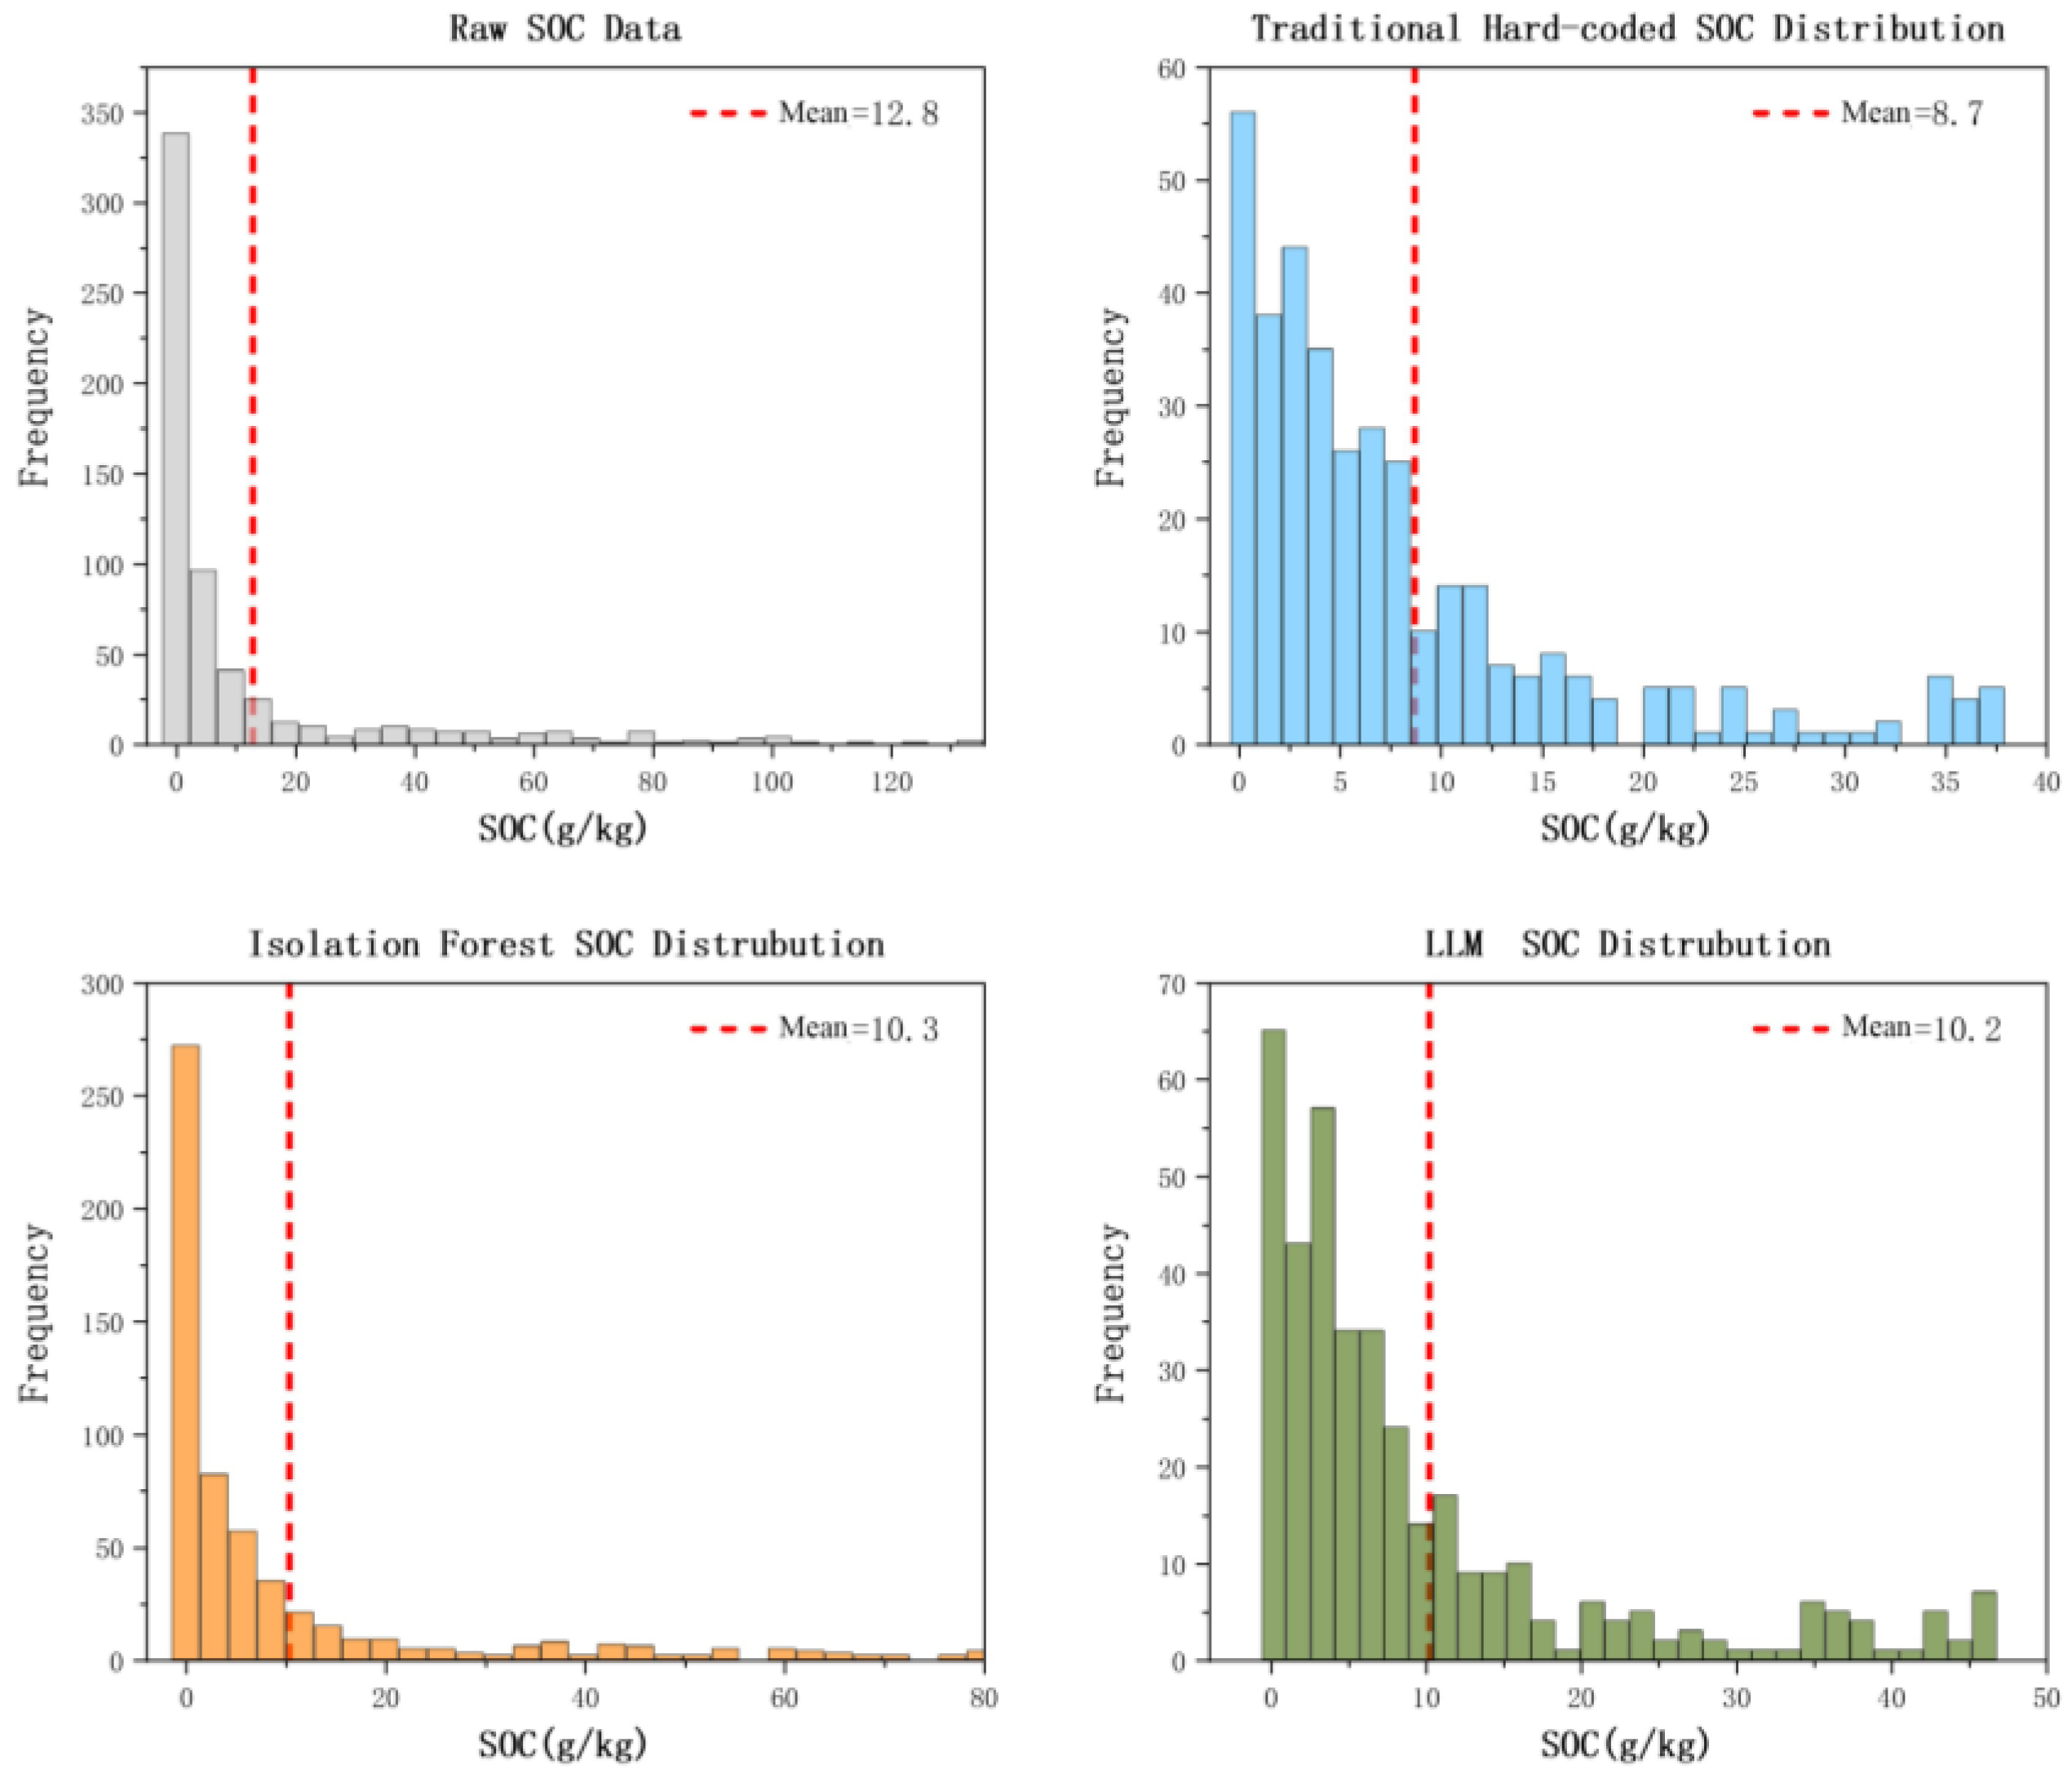
Figure 5 and Figure 6 show that, after LLM-based preprocessing, the mean SOC in the black soil region increases from 13.6 g/kg to 17.8 g/kg, close to 18.2 g/kg obtained with traditional hard coding. In the windblown sandy soil region, the mean SOC decreases from 12.8 g/kg to 10.2 g/kg, close to 10.3 g/kg obtained with Isolation Forest. This indicates that the LLM exhibits region-specific preprocessing behavior and can effectively retain samples that are reasonable for each region. The results of simultaneous processing align with the characteristics of high carbon content in black soil regions and low carbon content in wind-sand areas.
In summary, comparison of the three preprocessing methods suggests that the LLM can not only apply soil-science knowledge to screen samples rigorously, but also generate region-specific rules for different areas, making the filtering results more consistent with the actual SOC characteristics of the black soil region and the windblown sandy soil region. Overall, the LLM delivers the best preprocessing performance.

4.2. Hyperparameter Optimization Performance Comparison

In this section, the performance of three methods—grid search, random search, and LLM-based optimization of random forest hyperparameters—is compared. The context for the large language model recommending optimal hyperparameters for the random forest model is as follows:
As a soil science expert, I recommend optimal hyperparameters for the random forest model in the [Region Name] area.
[Data Information]
Number of training samples: [Number of Training Samples]
Number of features: [Number of Features]
Mean of target variable (SOC): [Mean SOC Value] g/kg
[Parameter Constraints]
- n_estimators: Integer between 100 and 400
- max_depth: Integer between 8 and 20
- max_features: Decimal between 0.6 and 0.8
[Northeast Black Soil Region Rules]
Regional Characteristics: Moderate sample size with relatively concentrated SOC distribution. A moderate number of trees balances model capacity and computational efficiency; limiting tree depth prevents overfitting while capturing key patterns; setting max_features to an appropriate value ensures sufficient feature interaction without excessive randomness, guaranteeing robust generalization.
[Northeast Windblown Sandy Soil Region Rules]
Regional Characteristics: Given the high variability of SOC in the Windblown Sandy Soil Region, using slightly more trees helps stabilize prediction results and capture complex patterns. Moderate depth prevents overfitting to noise, while the feature sampling ratio ensures sufficient feature diversity at each split. This configuration effectively balances bias and variance under conditions of limited sample size and high data variability.
Based on the context provided by large language models (LLMs) regarding the tuning of Random Forest parameters, it is clear that LLMs establish different parameter configuration standards for each region based on their respective environmental characteristics. As mentioned above, there are significant differences in the inference criteria between these two regions.
It is important to note that the parameter descriptions provided (e.g., “moderate number of trees,” “slightly higher number of trees”) are specific characteristics derived manually from foundational literature and geographical knowledge. The LLM then translates these inference guidelines into specific numerical recommendations within the given parameter constraints (n_estimators: 100–400, max_depth: 8–20, max_features: 0.6–0.8).
For the black soil region, the LLM recommends: n_estimators = 250, max_depth = 12, max_features = 0.7. For the Windblown Sandy Soil Region, the LLM recommends: n_estimators = 300, max_depth = 12, max_features = 0.7. These specific values are derived by the LLM rather than pre-specified by the authors, demonstrating its ability to autonomously generate context-aware hyperparameter configurations.
It is worth noting that although the parameter constraints and regional description rules were provided by the authors, the selection of specific values was autonomously performed by the LLM based on its inference of environmental characteristics in each region (e.g., the contrast between the relatively concentrated distribution of soil organic carbon and high variability). This indicates that the LLM can adaptively generate context-aware hyperparameter configurations without the need for manually specifying exact values. The stability of these recommendations was verified through multiple runs, ensuring that the output results are robust and not due to random fluctuations.
The final comparison of hyperparameter optimization results among the three methods (grid search, random search, and LLM-based optimization) is as follows:
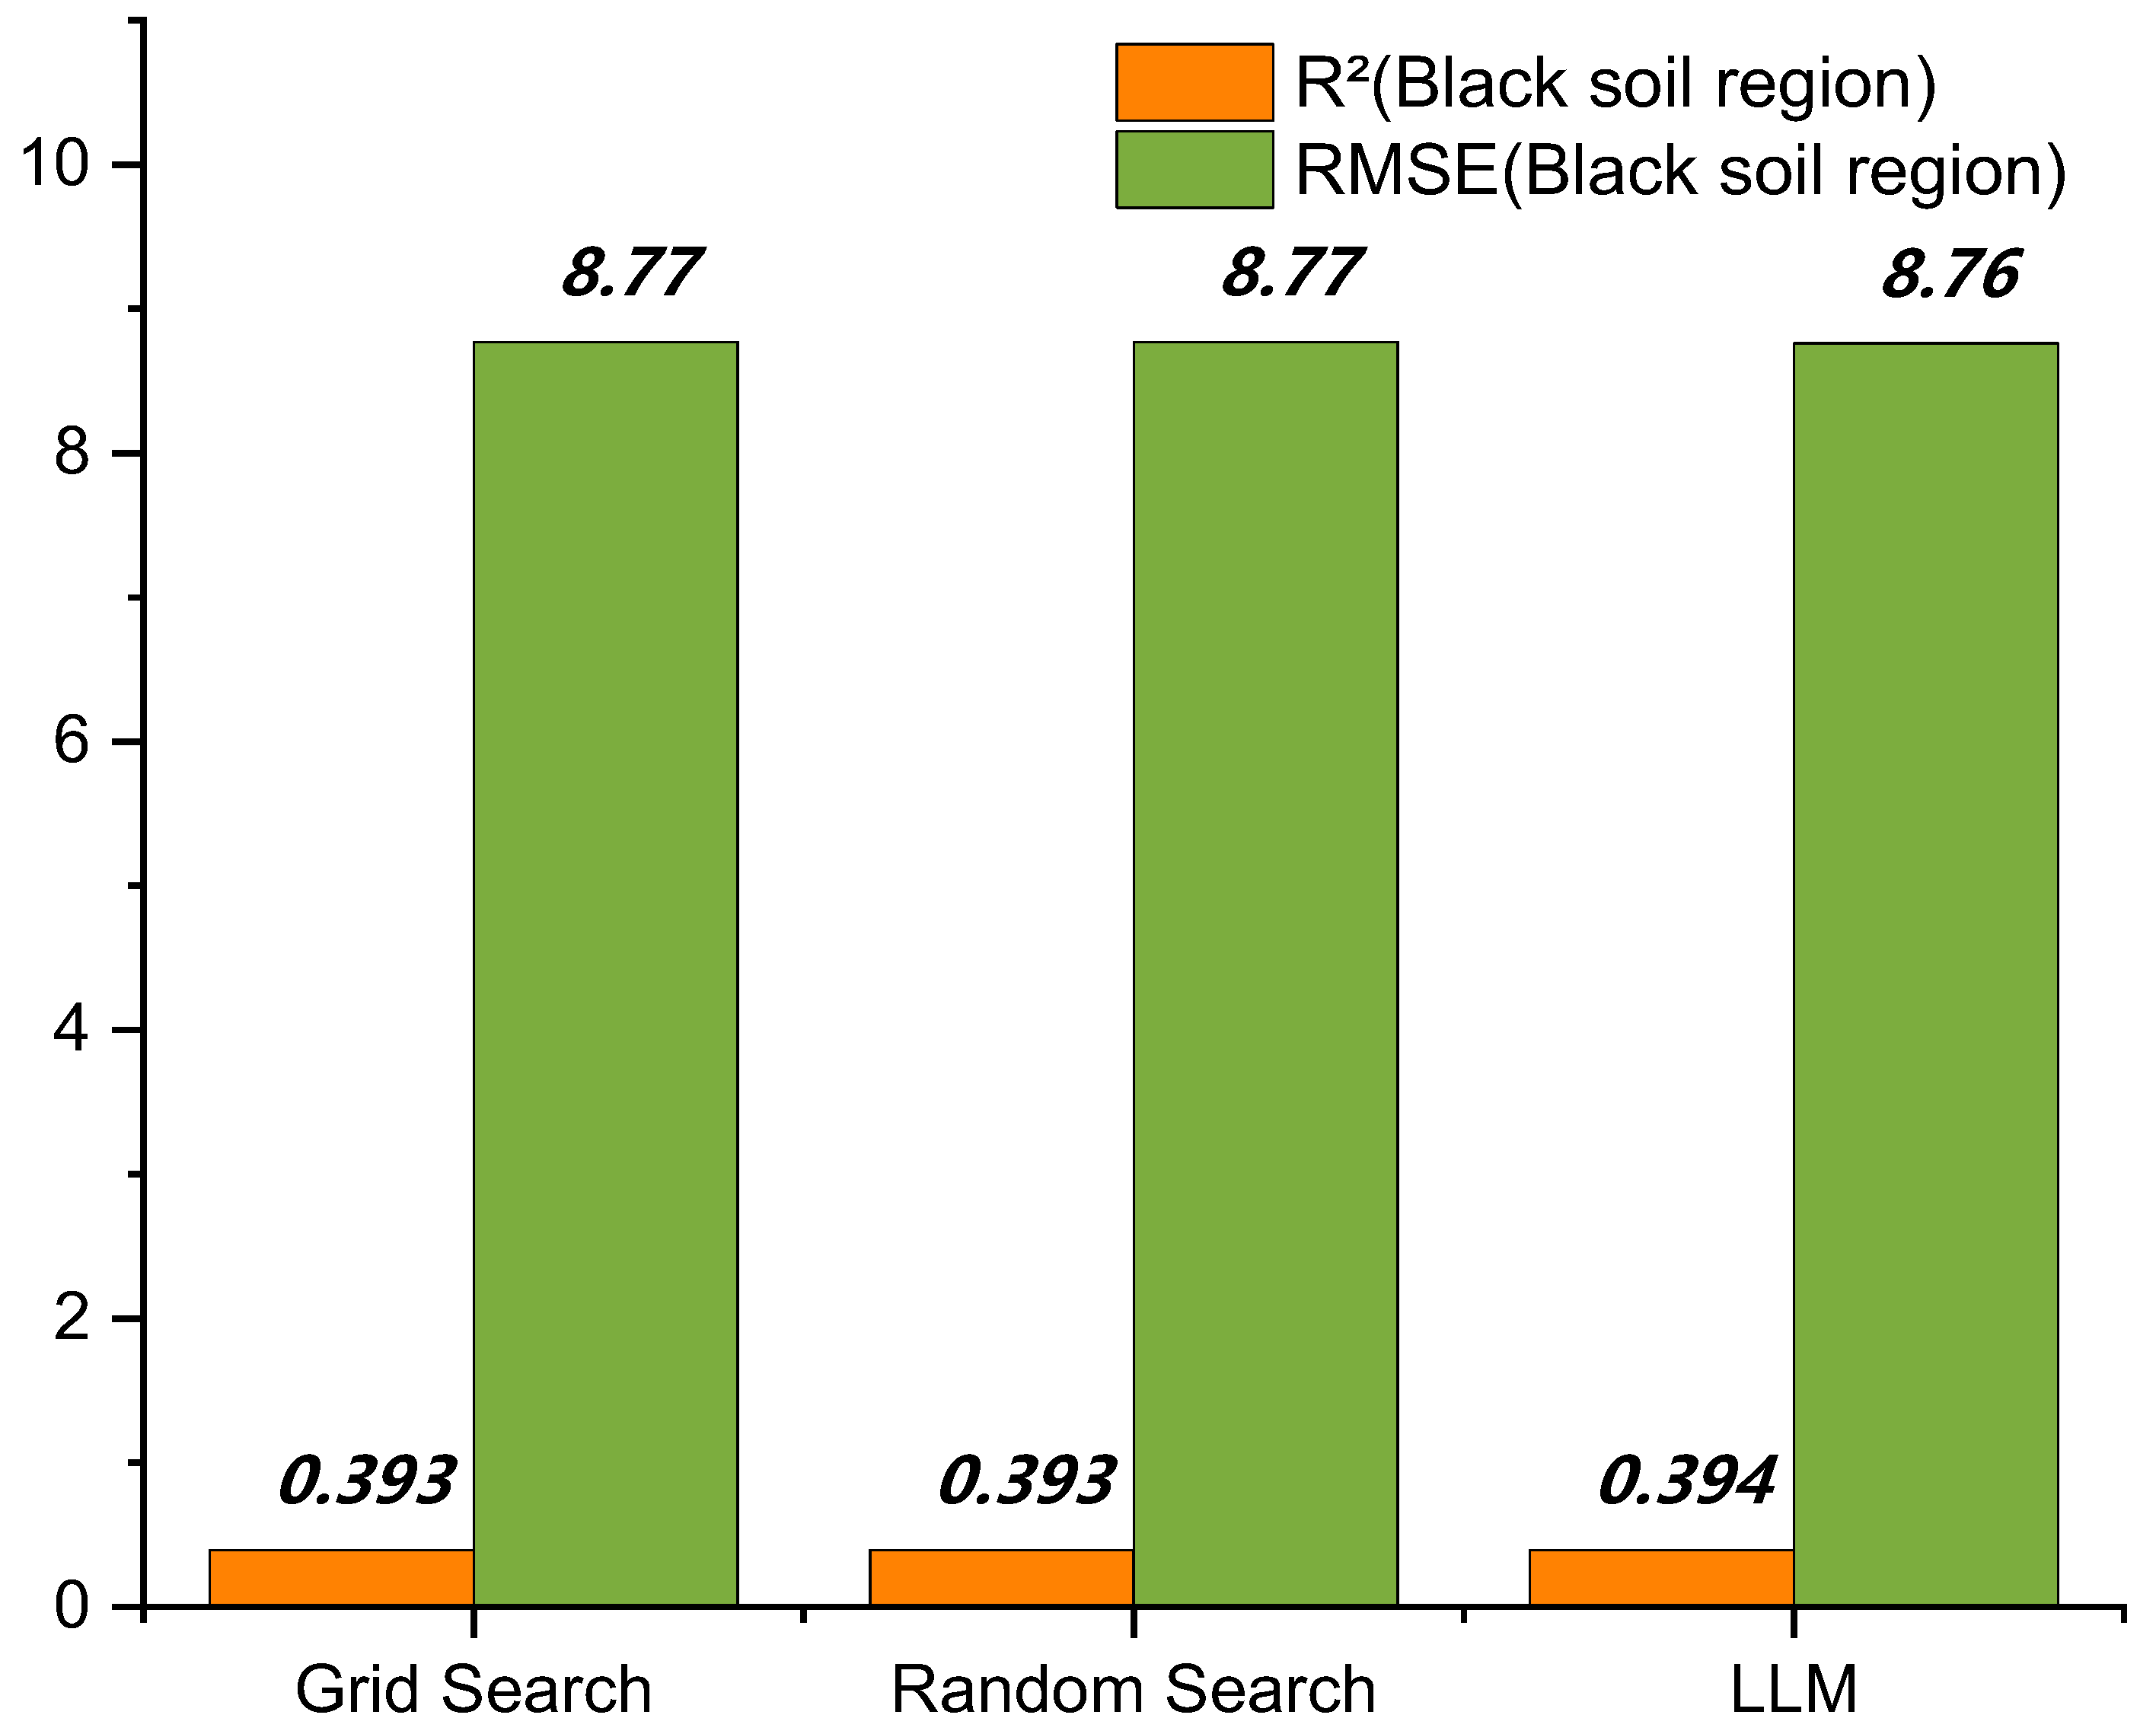
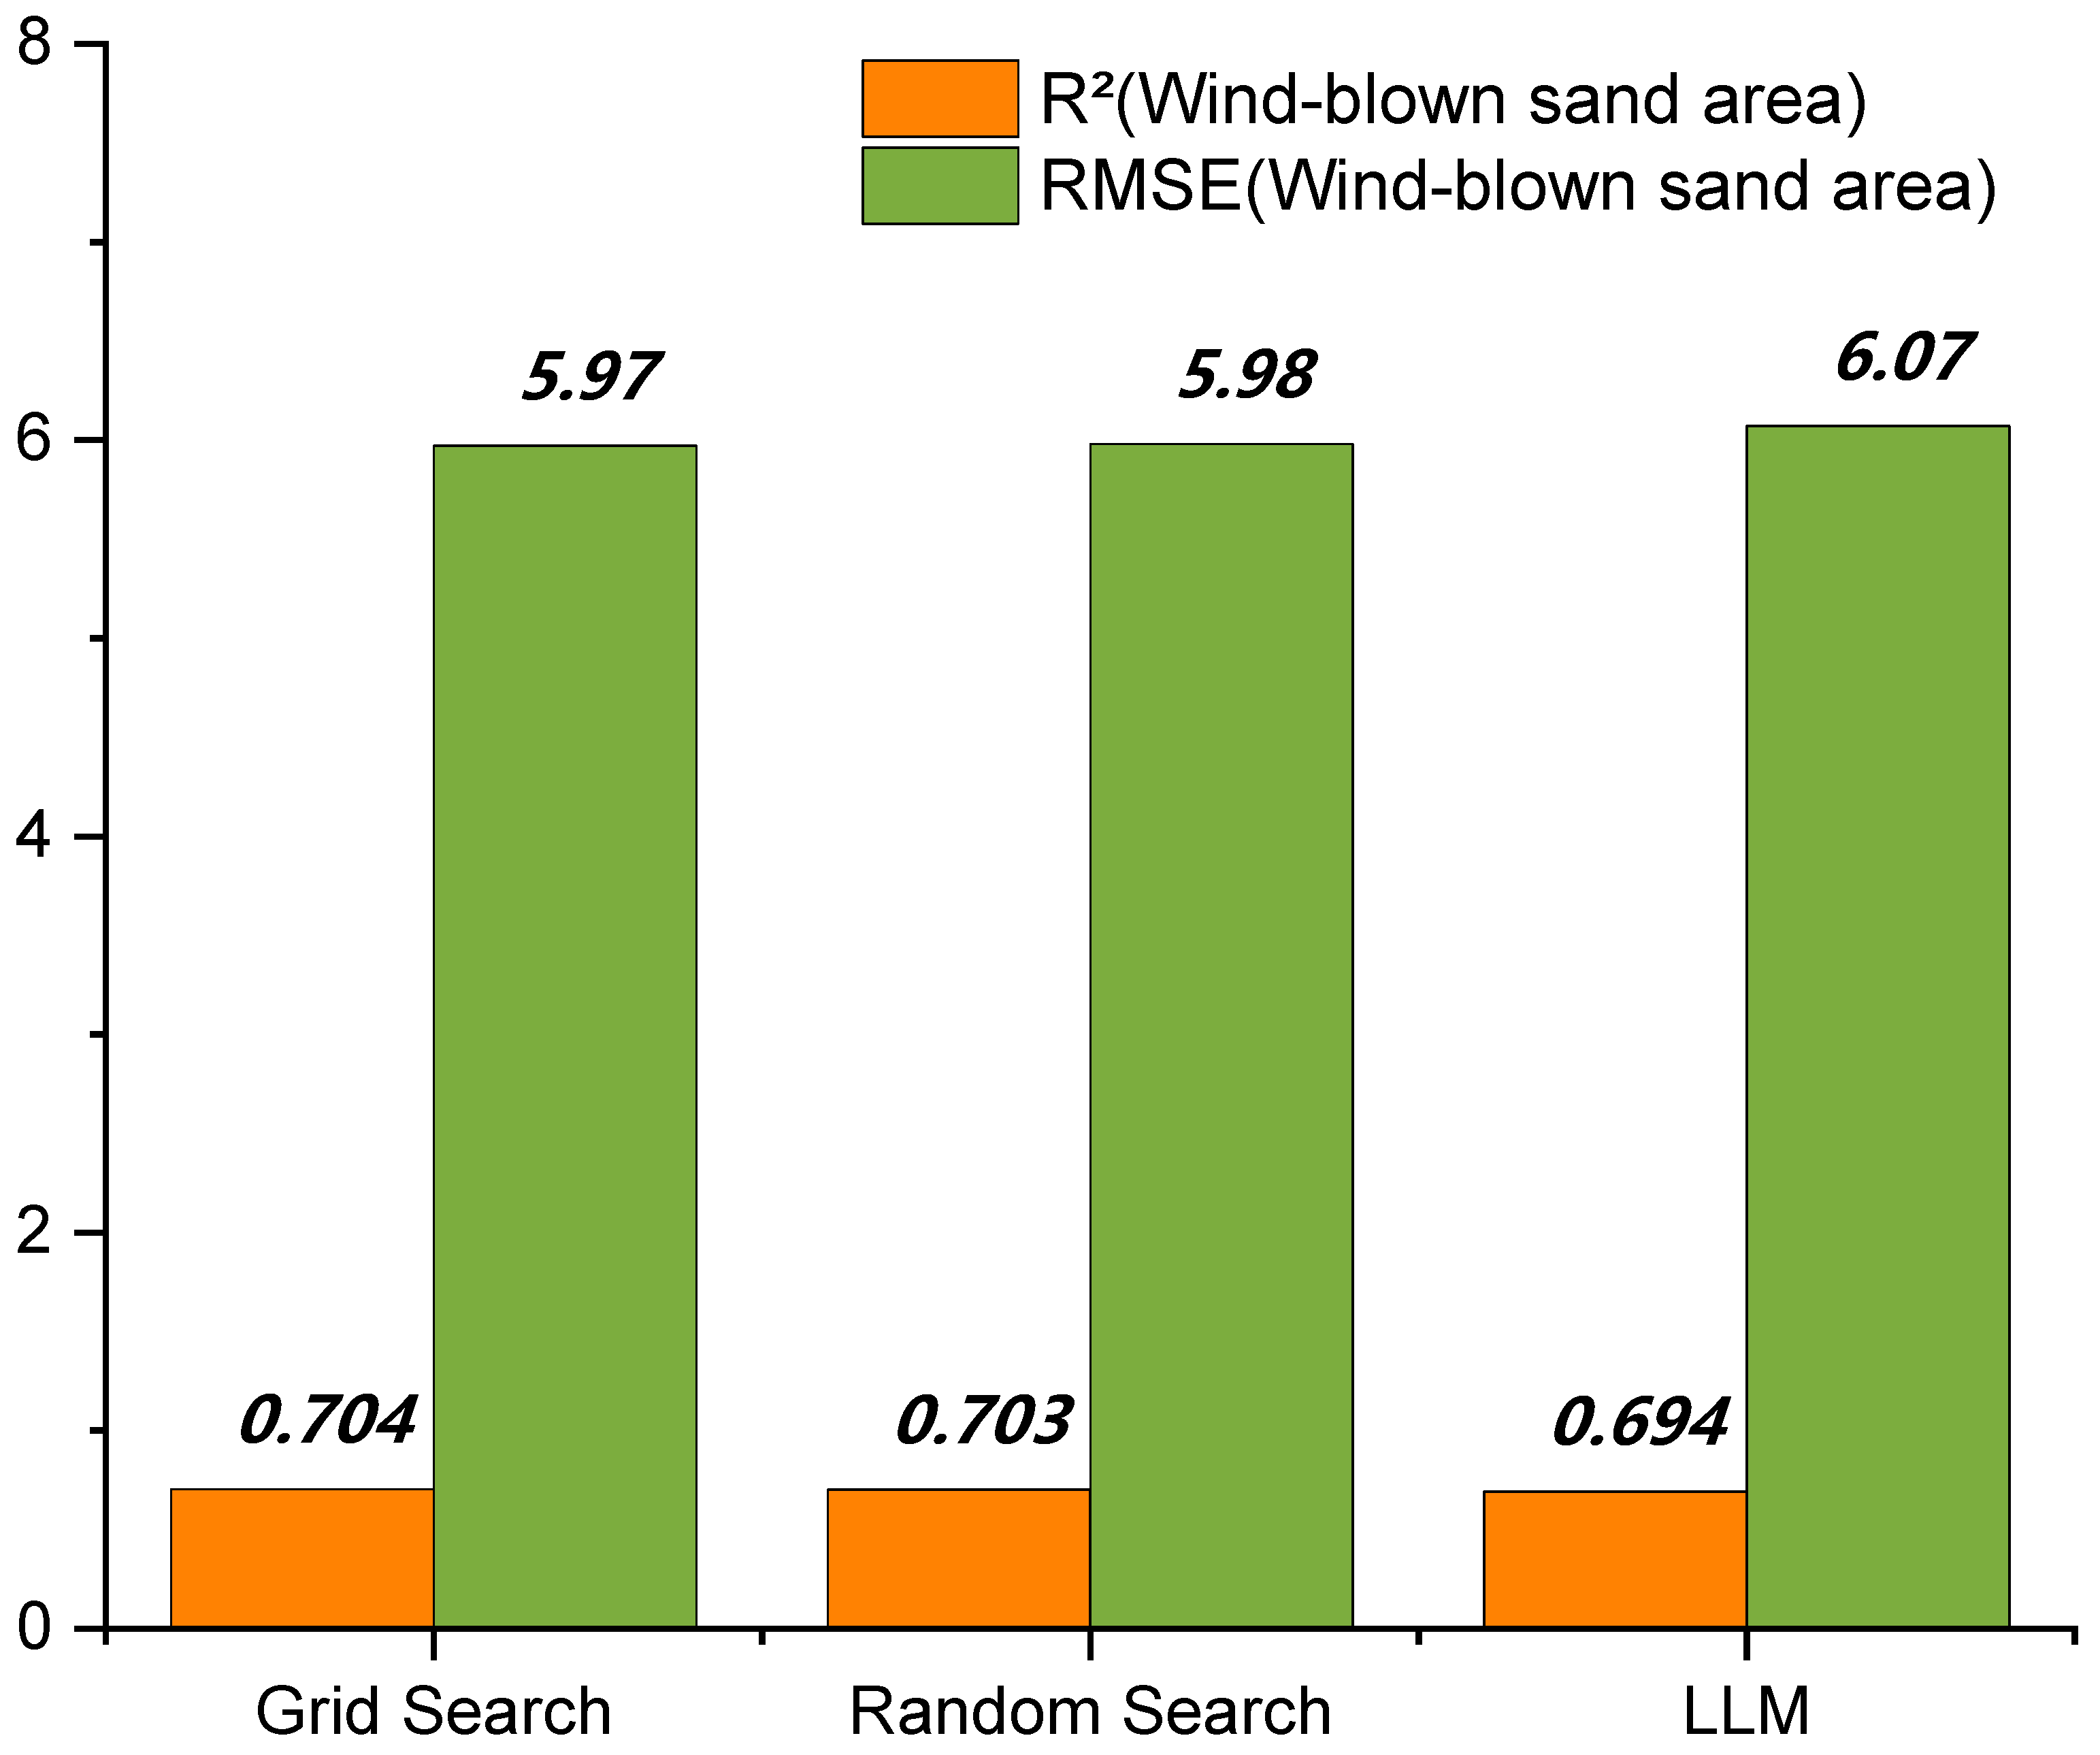
Figure 7 and Figure 8 show that the random forest model built with LLM-optimized hyperparameters achieves the following performance in the black soil region: (R2 = 0.394) and (RMSE = 8.76) g/kg, which is comparable to grid search and random search ((R2 = 0.393), (RMSE = 8.77) g/kg for both). In the windblown sandy soil region, the LLM-optimized model achieves (R2 = 0.694) and (RMSE = 6.07) g/kg, which is very close to grid search ((R2 = 0.704), (RMSE = 5.97) g/kg) and random search ((R2 = 0.703), (RMSE = 5.98) g/kg). Furthermore, as shown in Table 4 and Table 5, the LLM-based method reduced the number of model evaluation iterations by approximately 95–98% compared to grid search and random search. In terms of actual runtime, grid search took 21.03 s in the black soil region and 19.31 s in the sandy region; while random search took 4.87 s and 4.28 s, respectively; in contrast, LLM optimization took only 1.71 s and 1.74 s, representing a reduction of 91.8–92.7% compared to random search and 97.9–98.7% compared to grid search.
Although a runtime of approximately 20 s for grid search is not unacceptable for a single small-scale dataset, the advantages of the LLM method are evident in multiple aspects. When modeling multiple regions or datasets, the efficiency advantage of LLM is significantly amplified: for example, when tuning parameters for 10 regions, grid search requires a cumulative total of about 200 s, while LLM requires only about 17 s. The LLM method requires no model training and obtains parameters through a single inference, whereas grid search and random search require training models dozens of times, resulting in significantly higher cumulative computational resource consumption.
It is important to note that the results of all three methods were validated through five independent runs. Notably, across all five runs for the two regions, the LLM consistently recommended exactly the same parameters for the random forest model. This indicates that the LLM can directly derive robust hyperparameter configurations with strong generalization capabilities, effectively mitigating the inherent randomness in single-run evaluations while ensuring stable and reliable model performance. The hyperparameters obtained in this manner possess significant practical value.

4.3. Performance Comparison of Random Forest Models Based on LLM Hyperparameter Optimization

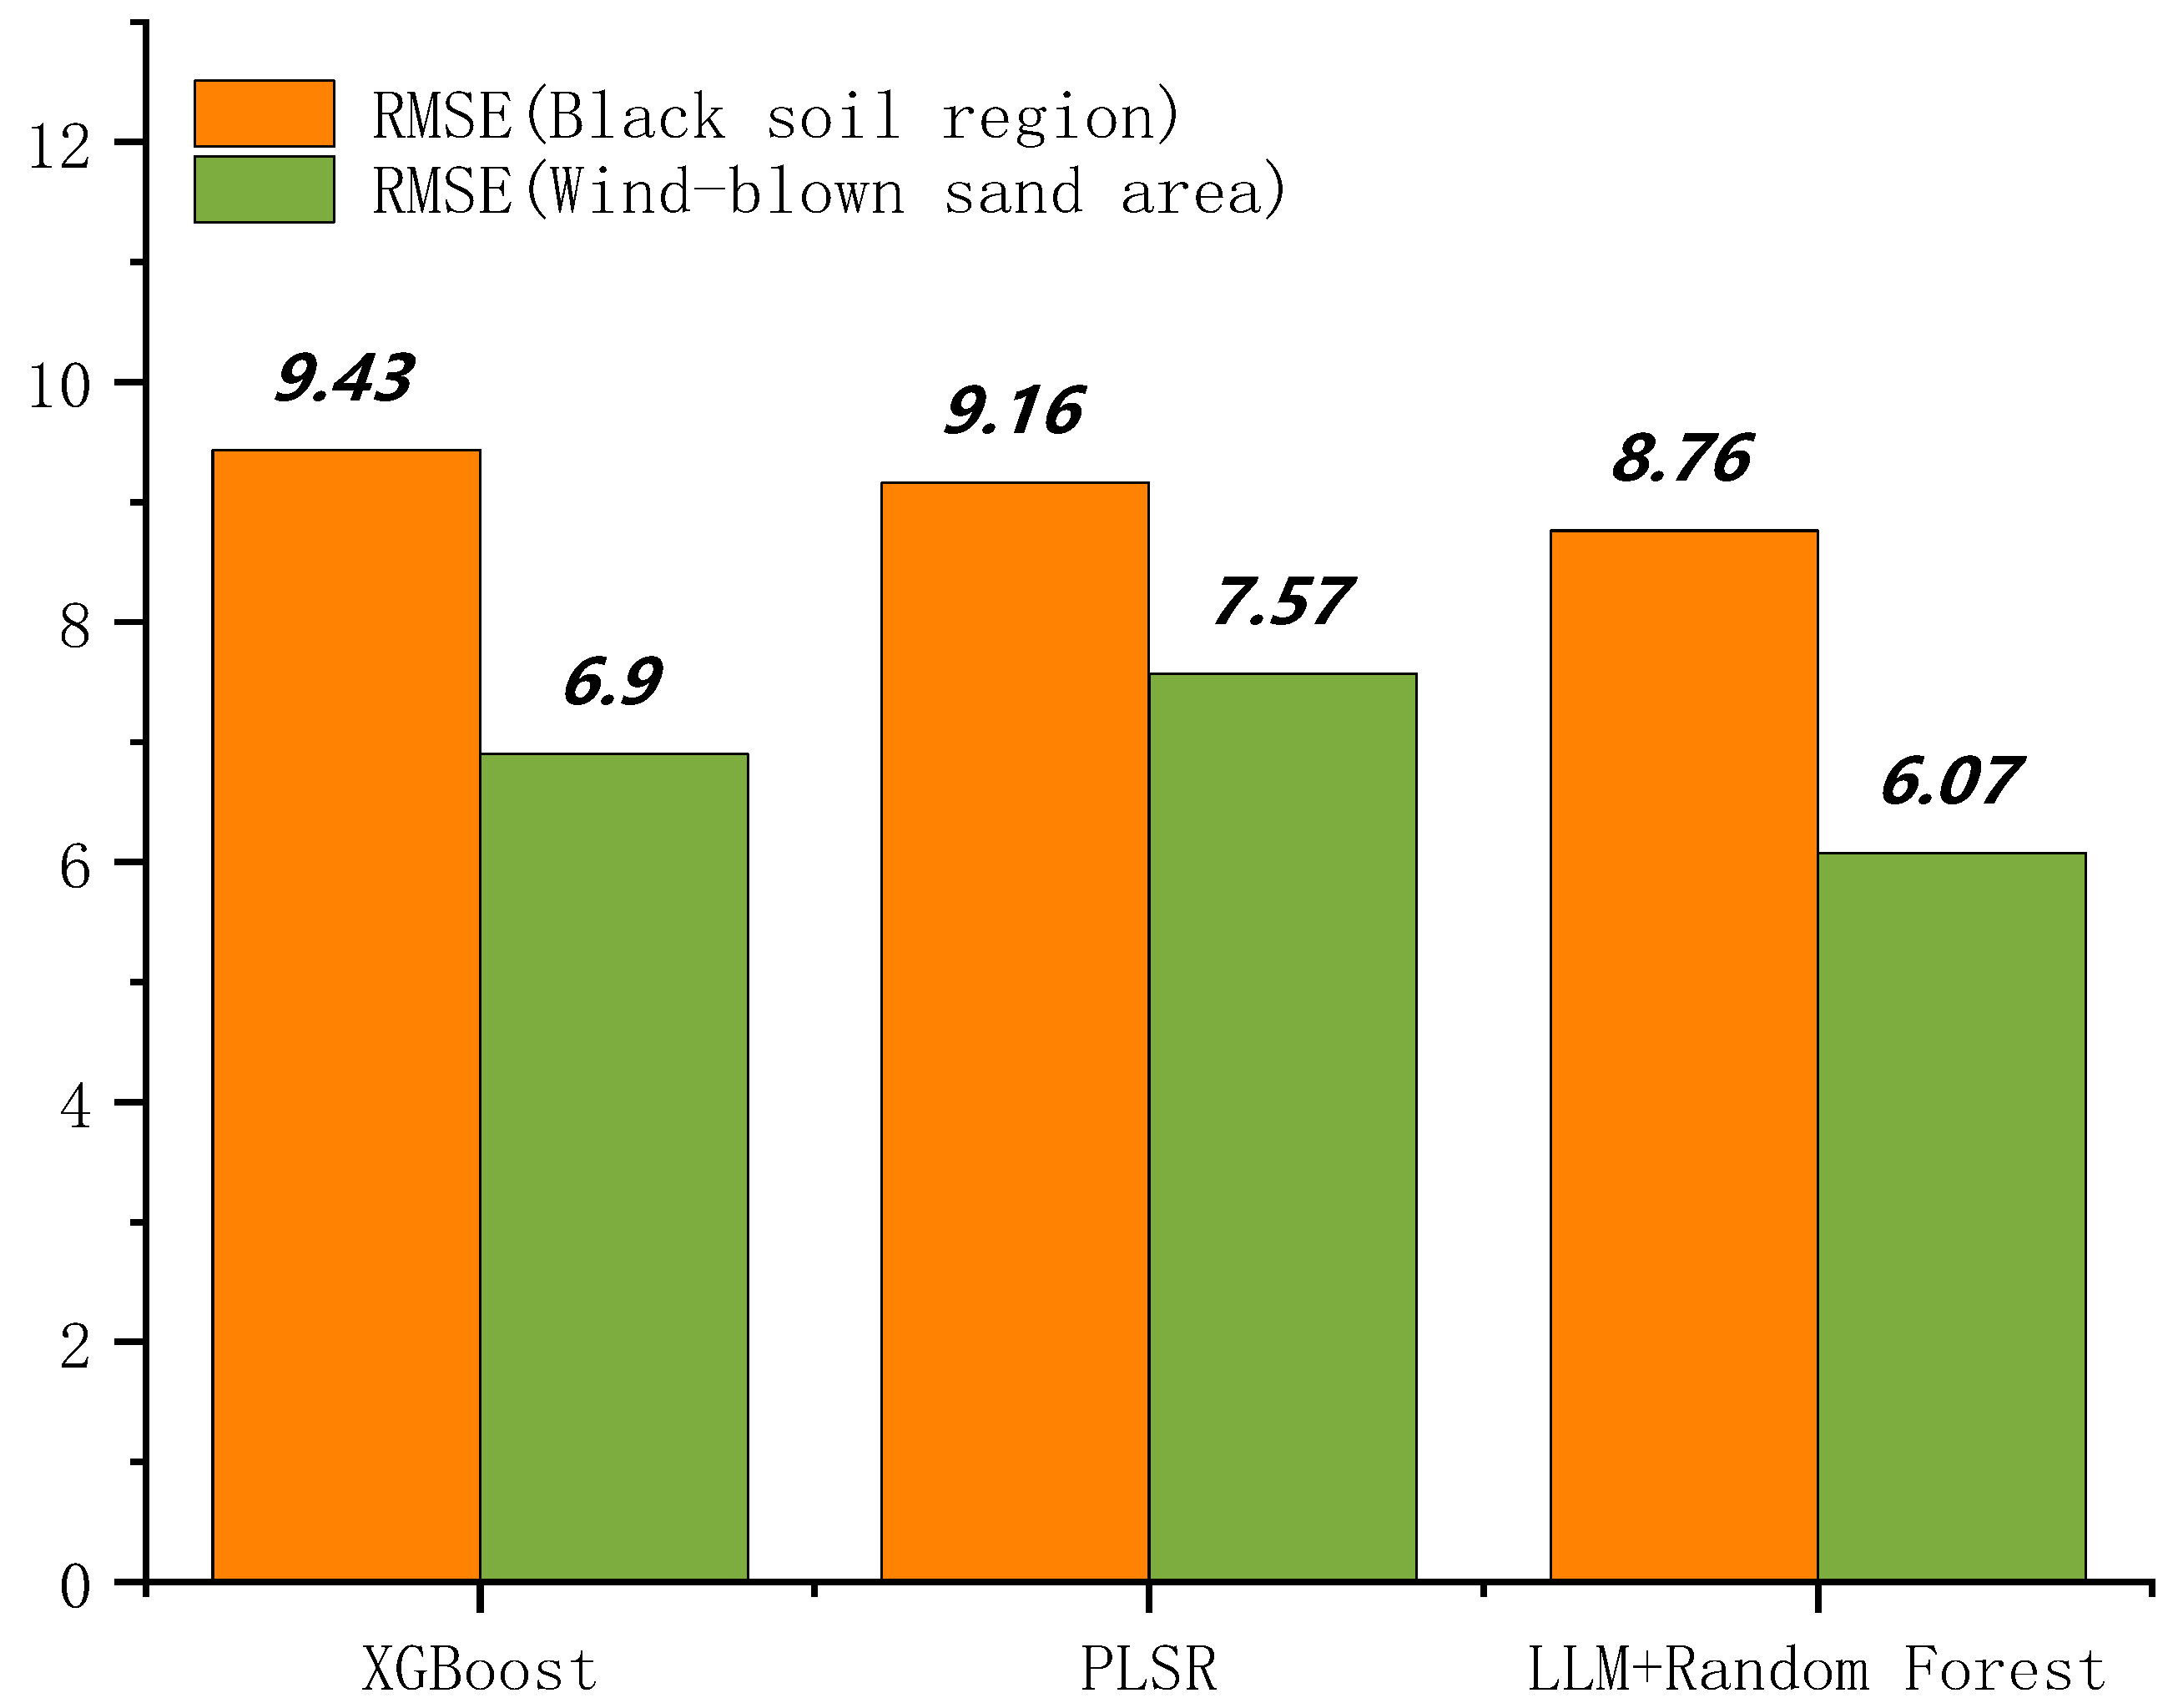
In this section, the performance of the XGBoost model [39,40], the PLSR (partial least squares regression) model [41,42], and the random forest model with LLM-optimized hyperparameters is compared to validate the practical applicability of the latter under heterogeneous soil environmental conditions across regions. The training-to-testing split is 7:3. The comparison results of the three models are shown in the figure below.
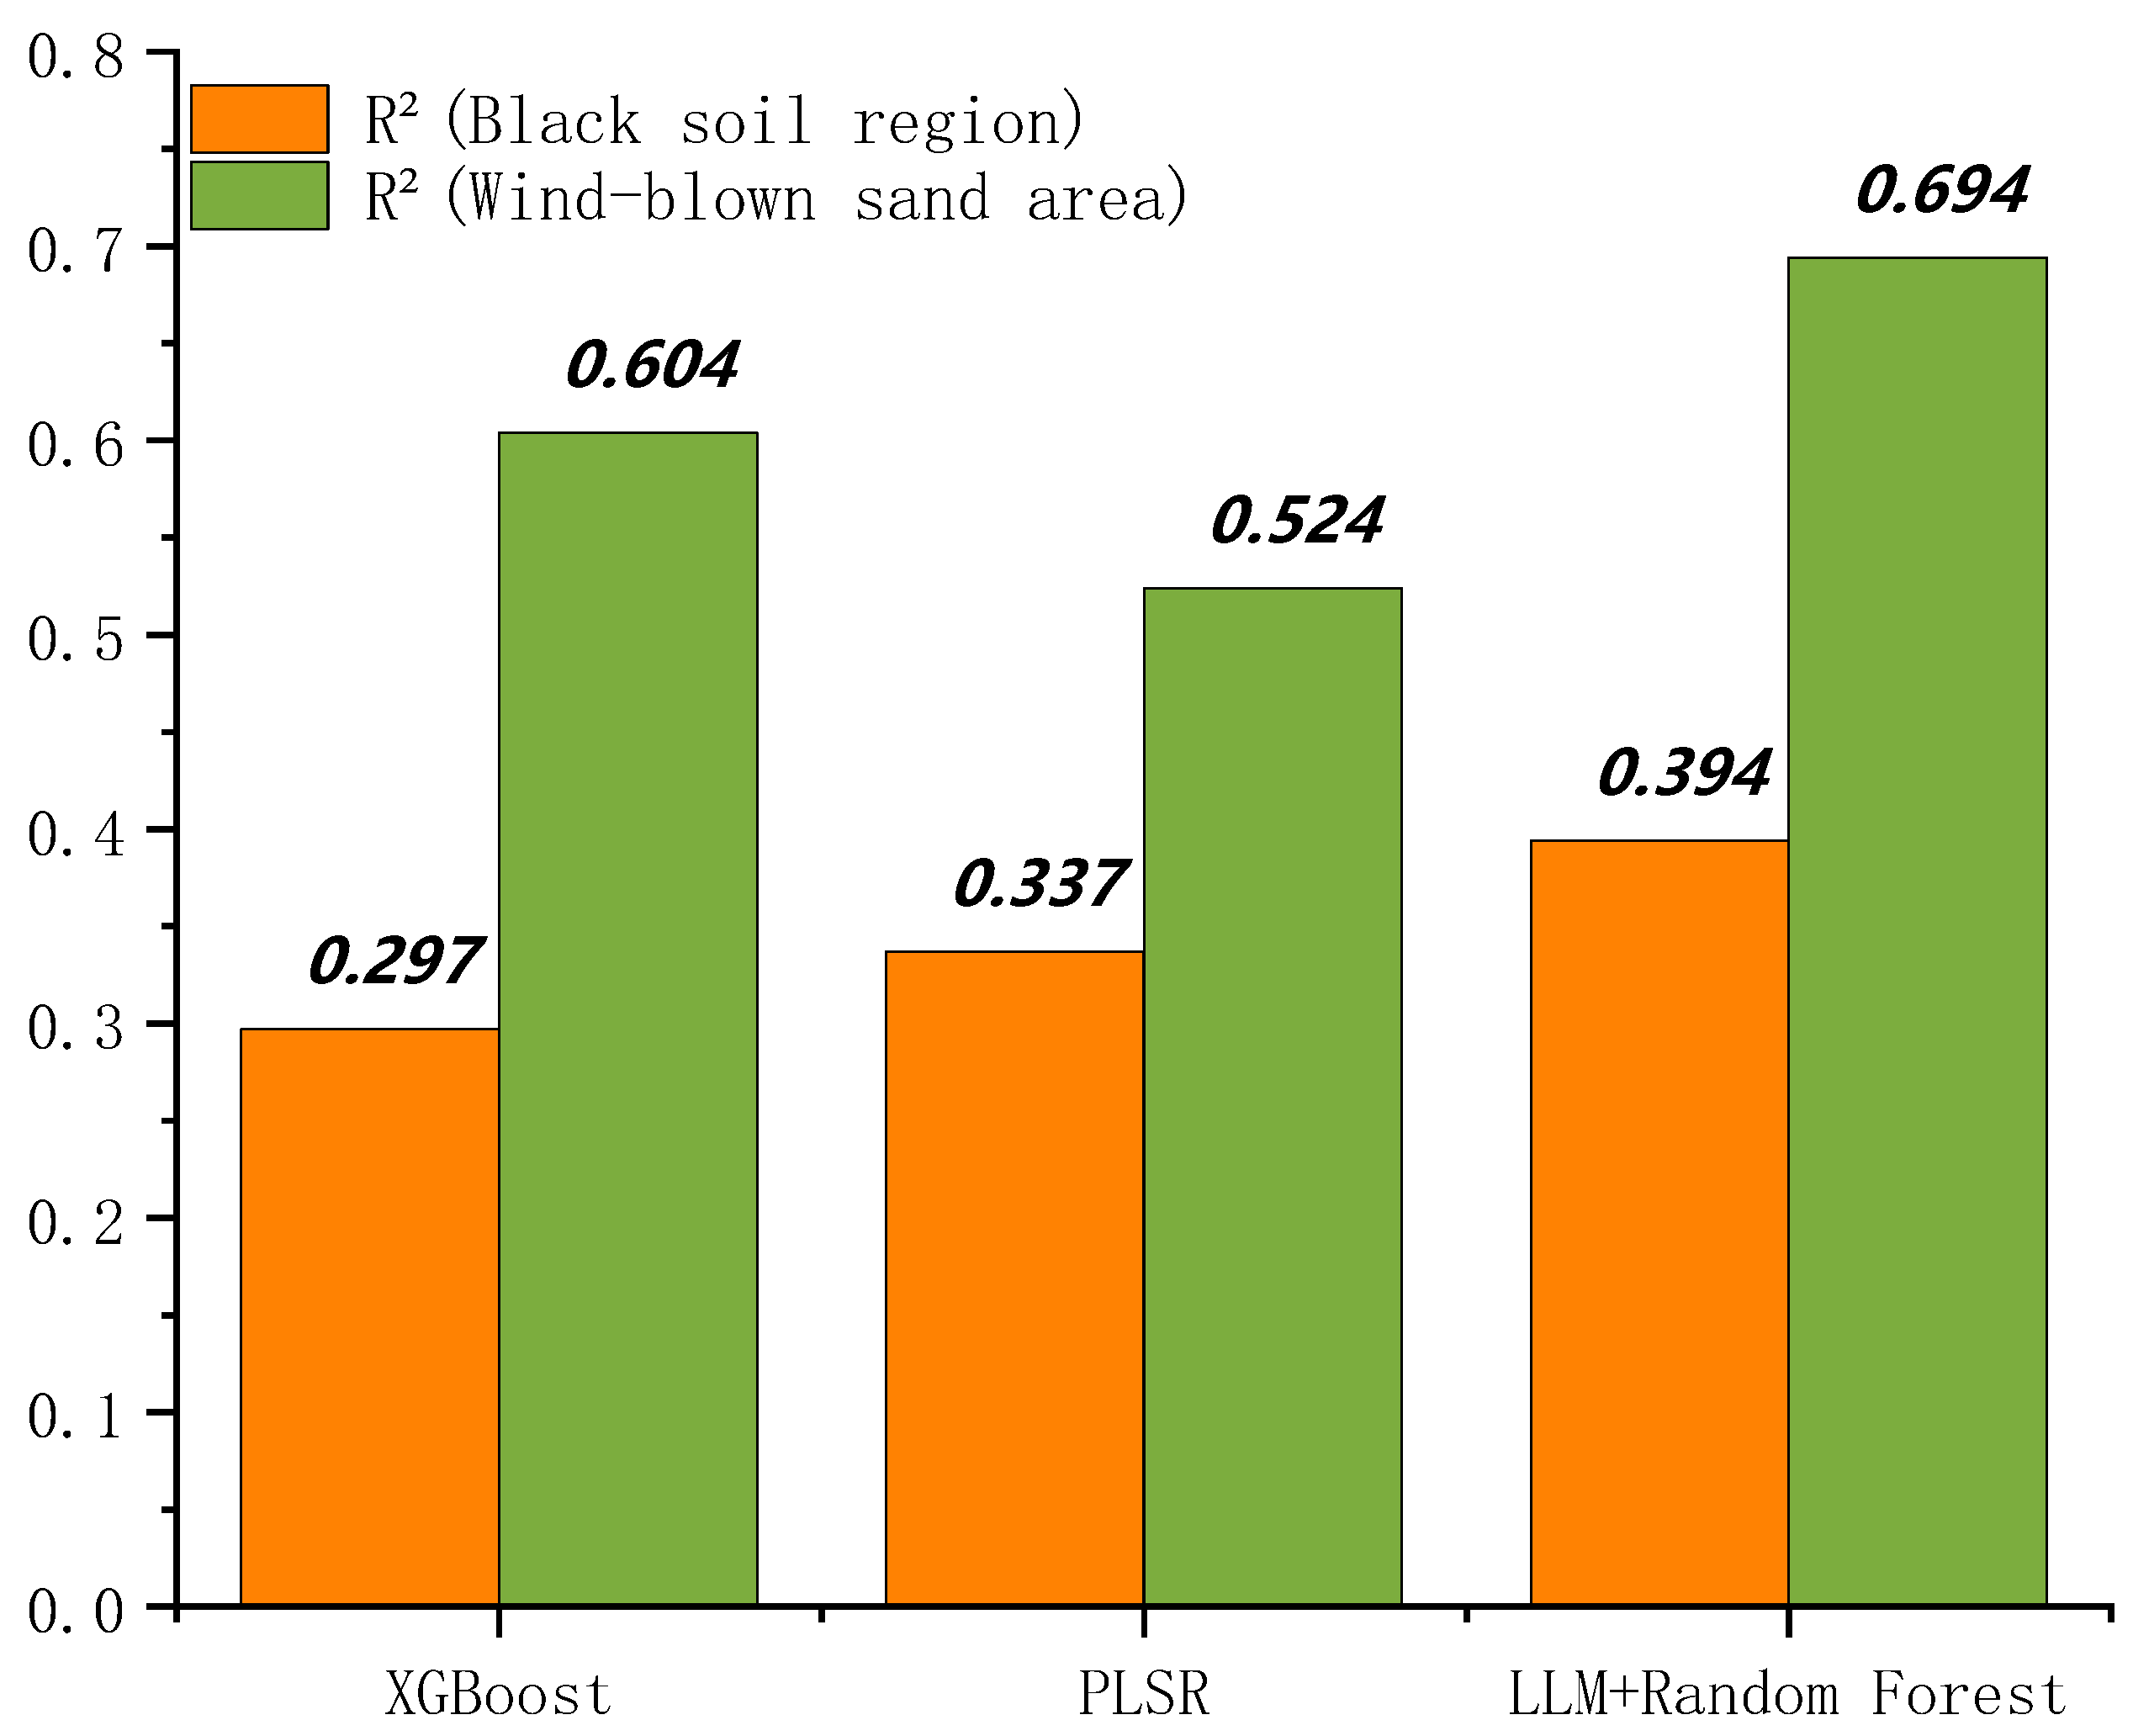
Figure 9 and Figure 10 indicate the following results:
In the black soil region, the XGBoost model achieved an R2 of 0.297 with a root mean square error (RMSE) of 9.43 g/kg, whereas the PLSR model achieved an R2 of 0.337 with an RMSE of 9.16 g/kg. In the windblown sandy soil region, the corresponding R2 values were 0.604 and 0.524, with RMSEs of 6.90 g/kg and 7.57 g/kg, respectively. By comparison, the random forest model developed using LLM-based preprocessing and LLM-optimized hyperparameters performed better: in the black soil region, R2 increased to 0.394 and RMSE decreased to 8.76 g/kg; in the windblown sandy soil region, R2 further increased to 0.694 and RMSE decreased to 6.07 g/kg.
The random forest model developed after LLM-based preprocessing and LLM-based hyperparameter optimization shows clear performance differences across regions: in the windblown sandy soil region, (R2) (0.694) is substantially higher than that in the black soil region (0.394), and RMSE (6.07 g/kg) is lower than that in the black soil region (8.76 g/kg), indicating better SOC prediction performance in the windblown sandy soil region. A plausible explanation is that, due to the windblown sandy characteristics, the key factors controlling SOC in the windblown sandy soil region are relatively more concentrated, whereas SOC in the black soil region is influenced by multiple interacting factors (e.g., temperature, precipitation, and vegetation), leading to a more complex and dispersed set of drivers.
Overall, the observed regional performance differences in the LLM-optimized random forest are closely related to region-specific soil characteristics and the complexity of controlling factors. The constructed model can adapt to SOC patterns across different soil types and regions, and its performance metrics meet basic requirements.

4.4. Variable Importance Analysis

To explain the extent to which each input variable contributes to the model’s predictions, this study conducted a variable importance analysis based on the built-in feature importance metric of the Random Forest model (average reduction in impurity). The analysis utilized a Random Forest model optimized via LLM, and the results are shown in Table 6.
As shown in Table 6, the importance of variables differs significantly between the two regions, reflecting their distinct environmental characteristics:
In the black soil region, mean annual temperature (MAT) had the highest importance score (0.358), followed by Clay (0.188) and Sand (0.132). This indicates that in this humid, high-carbon region, temperature is the dominant controlling factor influencing soil organic carbon content dynamics.
In the wind-blown sandy region, Clay (0.320) was the most important predictor, followed by mean annual temperature (MAT) (0.314) and mean annual precipitation (MAP) (0.141). The dominant role of Clay reflects the arid nature of this region, where Clay minerals play a critical role in stabilizing organic carbon. The significant contributions of climatic variables (MAT and MAP) further highlight the constraining effects of moisture and temperature on organic carbon accumulation in semi-arid regions.
The differences in variable importance across these regions validate the necessity of region-specific modeling and support the adaptive preprocessing and parameter optimization strategies adopted in this study.

5. Conclusions

This study proposes an LLM-driven intelligent modeling workflow and takes the Northeast China black soil region and the windblown sandy soil region as the study areas. The main conclusions are as follows:
The LLM can generate different data preprocessing rules tailored to the distinct soil environmental conditions of the black soil region and the windblown sandy soil region. This addresses limitations of traditional approaches, where expert-defined rules lack unified standards and often fail to adequately account for regional soil heterogeneity, and it provides a new pathway for cross-regional data preprocessing.
LLM-driven hyperparameter tuning can achieve performance close to grid search and random search with only a single evaluation, while improving computational efficiency by more than 95%, offering a highly efficient approach for model hyperparameter optimization.
The LLM-optimized random forest model achieves improved performance, with (R2) increasing to 0.394 and RMSE decreasing to 8.76 g/kg in the black soil region, and (R2) further increasing to 0.694 with RMSE decreasing to 6.07 g/kg in the windblown sandy soil region. It not only outperforms XGBoost and PLSR, but also shows adaptability to inter-regional differences and region-specific SOC patterns.
In addition to its application in predicting soil organic carbon, our method also offers new insights for the fields of machine learning and artificial intelligence. Using large language models (LLMs) for hyperparameter tuning represents an innovative approach—whereas traditional tuning methods often rely on trial and error, LLMs can now directly provide suitable parameters. This method is not limited to this specific application but can be extended to other models and tasks. The LLM-based data preprocessing framework we have developed can automatically adjust rules based on user-provided contextual information across different data environments, establishing an effective model for “how to perform intelligent data cleaning across various domains.” From prompt design to result validation, our entire workflow is open and reproducible. Any future research aimed at LLM-assisted machine learning can use this as a starting point.
This study also has certain limitations. The research areas were concentrated in black soil regions and wind-sand areas, and the soil types examined did not include other types, such as red soil or loess. Furthermore, the data were sourced from open-access datasets without incorporating field sampling data. Future work could include more soil types and regions, adding field sampling data to enhance the model’s applicability nationwide. However, at this stage, the findings of this paper already provide a foundation of technical support for subsequent research.

Author Contributions

H.C. performed experimental procedures, wrote code, and analyzed experimental data results. He participated in the entire process from the initial draft to the final version of the paper. S.G. provided theoretical and technical support for the soil environment aspect, secured funding, supervised the research progress, proposed the core problem addressed in the paper, and participated in the entire process from the initial draft to the final version. X.C. contributed to the paper’s framework design and interpretation of some results. All authors have read and agreed to the published version of the manuscript.

Funding

This work was supported by the Ministry of Science and Technology of the People’s Republic of China for its invaluable support through the National Key R&D Program of China (2025YFE0124700); National Key Research and Development Program of China (2025YFE0124700) [Foundation: National Key R&D Program of China, No. 2025YFE0124700].

Institutional Review Board Statement

Not applicable.

Informed Consent Statement

Not applicable.

Data Availability Statement

The data used is openly available. https://doi.org/10.5281/zenodo.15851730.

Acknowledgments

We are deeply grateful to Liang Linjie for his valuable discussions and insightful contributions during the preparation of this manuscript, and we acknowledge the valuable support provided by the Ministry of Science and Technology of the People’s Republic of China through the National Key R&D Program (2025YFE0124700). National Key R&D Program (2025YFE0124700) [Funding Project: National Key R&D Program, Project Number: 2025YFE0124700].

Conflicts of Interest

The authors declare no conflicts of interest.

References

  1. Zhang, P.; He, M.Z.; Wang, J.; Huang, L.; Yang, H.T.; Song, G.; Zhao, J.C.; Li, X.R. Desertification Reduces Organic Carbon Content and Nutrient Availability in Dryland Soils: Evidence from a Survey in the Amu Darya River Basin. Land Degrad. Dev. 2025, 36, 1181–1194. [Google Scholar] [CrossRef]
  2. Chen, H.; Zhu, D.; Chen, H. Effects of land-use patterns on soil aggregate stability and organic carbon in rocky desertification areas. Carsol. Sin. 2021, 40, 346–354. [Google Scholar] [CrossRef]
  3. Tang, X.; Wu, H.; Dong, J.; Liu, X.; Li, W.; Cui, Y. Effects of desertification and degradation on carbon sequestration of grassland ecosystem in Gannan. Chin. J. Ecol. 2022, 41, 278–286. [Google Scholar] [CrossRef]
  4. Mansur, N.; Abbod, M. Machine learning-based estimation of soil organic matter using RGB values. DYSONA Appl. Sci. 2026, 7, 73–81. [Google Scholar] [CrossRef]
  5. Beisekenov, N.; Banakinaou, W.; Ajayi, A.D.; Hasegawa, H.; Tadao, A. Remote sensing-based soil organic carbon monitoring using advanced machine learning techniques under conservation agriculture systems. Smart Agric. Technol. 2025, 11, 101036. [Google Scholar] [CrossRef]
  6. Sharma, R.; Levi, M.R.; Ricker, M.C.; Thompson, A.; King, E.G.; Robertson, K. Scaling of soil organic carbon in space and time in the Southern Coastal Plain, USA. Sci. Total Environ. 2024, 933, 14. [Google Scholar] [CrossRef] [PubMed]
  7. Tziolas, N.; Tsakiridis, N.; Heiden, U.; van Wesemael, B. Soil organic carbon mapping utilizing convolutional neural networks and Earth observation data, a case study in Bavaria state Germany. Geoderma 2024, 444, 15. [Google Scholar] [CrossRef]
  8. Ding, Z.J.; Liu, K.; Grunwald, S.; Smith, P.; Ciais, P.; Wang, B.; Wadoux, A.; Ferreira, C.; Karunaratne, S.; Shurpali, N.; et al. Advancing Soil Organic Carbon Prediction: A Comprehensive Review of Technologies, AI, Process-Based and Hybrid Modelling Approaches. Adv. Sci. 2025, 12, 28. [Google Scholar] [CrossRef]
  9. Song, Y.Q.; Wang, F.; Yang, W.H.; Liang, R.L.; Zhan, D.X.; Xiang, M.Y.; Yang, X.H.; Xu, R.; Lu, M. High-performance prediction of soil organic carbon using automatic hyperparameter optimization method in the yellow river delta of China☆. Comput. Electron. Agric. 2025, 236, 16. [Google Scholar] [CrossRef]
  10. Ben Ghorbal, A.; Grine, A.; Eid, M.M.; El-kenawy, E.M. Sustainable soil organic carbon prediction using machine learning and the ninja optimization algorithm. Front. Environ. Sci. 2025, 13, 23. [Google Scholar] [CrossRef]
  11. Liang, W.; Ma, Z.X.; Li, Z.Q.; Li, W.D.; Zhang, X.S.; Cai, L. A bi-level optimization framework for household distributed energy systems: Integrating multiple flexible loads. Energy Sources Part A-Recovery Util. Environ. Eff. 2025, 47, 12202–12226. [Google Scholar] [CrossRef]
  12. Zhang, E.; Wu, D.; Boman, J. Carbon-Aware Workload Shifting for Mitigating Environmental Impact of Generative AI Models. In Proceedings of the 2024 Congress on Cybermatics-Cybermatics, Copenhagen, Denmark, 19–22 August 2024; IEEE: New York, NY, USA, 2024; pp. 446–453. [Google Scholar] [CrossRef]
  13. Usman, Y.; Ihejirika, C.J.; Offor, S.N.; Akl, R.; Chataut, R. Green Cybersecurity: Leveraging AI, ML, and LLMs to Optimize Energy, Threat Detection, and Sustainability Frameworks. IEEE Access 2025, 13, 159345–159379. [Google Scholar] [CrossRef]
  14. Jami, H.C.; Singh, P.R.; Kumar, A.; Bakshi, B.R.; Ramteke, M.; Kodamana, H. CCU-Llama: A Knowledge Extraction LLM for Carbon Capture and Utilization by Mining Scientific Literature Data. Ind. Eng. Chem. Res. 2024, 63, 17585–17598. [Google Scholar] [CrossRef]
  15. Hu, L.; Zhou, Z.R.; Jia, G.Z. A one-shot automated framework based on large language model and AutoML: Accelerating the design of porous carbon materials and carbon capture optimization. Sep. Purif. Technol. 2025, 376, 15. [Google Scholar] [CrossRef]
  16. Zhang, X.J.; Guo, X.; Zhao, J.H.; Xiong, J.; Tian, Y.J. Intelligent application of large language model to life cycle assessment methodology. J. Clean. Prod. 2025, 529, 19. [Google Scholar] [CrossRef]
  17. Jiang, P.; Sonne, C.; Li, W.L.; You, F.Q.; You, S.M. Preventing the Immense Increase in the Life-Cycle Energy and Carbon Footprints of LLM-Powered Intelligent Chatbots. Engineering 2024, 40, 202–210. [Google Scholar] [CrossRef]
  18. Geng, J.; Lv, J.W.; Pei, J.; Liao, C.H.; Tan, Q.Y.; Wang, T.X.; Fang, H.J.; Wang, L. Prediction of soil organic carbon in black soil based on a synergistic scheme from hyperspectral data: Combining fractional-order derivatives and three-dimensional spectral indices. Comput. Electron. Agric. 2024, 220, 12. [Google Scholar] [CrossRef]
  19. Chen, Y.L.; Guo, L.C.; Cui, J.Y.; Xiong, S.F. Spatiotemporal variation of well-dated soil organic carbon pool in Northeast China during the Holocene. Quat. Sci. 2022, 42, 1311–1327. [Google Scholar] [CrossRef]
  20. Sun, X.D.; Ning, Z.Y.; Yang, H.L.; Zhang, Z.Q.; Li, Y.L. The Stoichiometry of carbon, nitrogen and phosphorus in soil in typical desertified regions, North China. J. Desert Res. 2018, 38, 1209–1218. [Google Scholar] [CrossRef]
  21. Dong, C.; Meng, X.T.; Ruan, W.M.; Cui, J.; Zhang, X.L.; Liu, H.J. An innoval hyperspectral prediction model for soil organic matter in croplands of the Northeast China Mollisols Region. Soil Tillage Res. 2025, 253, 16. [Google Scholar] [CrossRef]
  22. Wang, L.P.; Wang, X.; Kooch, Y.; Song, K.S.; Zheng, S.F.; Wu, D.H. Remote estimation of soil organic carbon under different land use types in agroecosystems of Eastern China. Catena 2023, 231, 13. [Google Scholar] [CrossRef]
  23. Chen, Z.X.; Chen, L.K.; Lu, R.; Lou, Z.H.; Zhou, F.R.; Jin, Y.C.; Xue, J.; Guo, H.C.; Wang, Z.; Wang, Y.Y.; et al. A national soil organic carbon density dataset (2010–2024) in China. Sci. Data 2025, 12, 9. [Google Scholar] [CrossRef] [PubMed]
  24. Zhang, Y.H.; Wang, Y.Q.; Bai, Y.R.; Zhang, R.Y.; Liu, X.; Ma, X. Prediction of Spatial Distribution of Soil Organic Carbon in Helan Farmland Based on Different Prediction Models. Land 2023, 12, 15. [Google Scholar] [CrossRef]
  25. Bao, Y.L.; Meng, X.T.; Liu, H.J.; Xu, M.Y.; Wang, M.C. A novel method for soil organic carbon prediction using integrated ‘ground-air-space’ multimodal remote sensing data. Geoderma 2025, 460, 14. [Google Scholar] [CrossRef]
  26. Adeniyi, O.D.; Brenning, A.; Maerker, M. Spatial prediction of soil organic carbon: Combining machine learning with residual kriging in an agricultural lowland area (Lombardy region, Italy). Geoderma 2024, 448, 13. [Google Scholar] [CrossRef]
  27. Geng, J.; Tan, Q.Y.; Lv, J.W.; Fang, H.J. Assessing spatial variations in soil organic carbon and C:N ratio in Northeast China’s black soil region: Insights from Landsat-9 satellite and crop growth information. Soil Tillage Res. 2024, 235, 14. [Google Scholar] [CrossRef]
  28. Yepmo, V.; Smits, G.; Lesot, M.J.; Pivert, O. Leveraging an Isolation Forest to Anomaly Detection and Data Clustering. Data Knowl. Eng. 2024, 151, 16. [Google Scholar] [CrossRef]
  29. Dhuliawala, S.; Kulikov, I.; Yu, P.; Celikyilmaz, A.; Weston, J.; Sukhbaatar, S.; Lanchantin, J. Adaptive Decoding via Latent Preference Optimization. arXiv 2024, arXiv:2411.09661. [Google Scholar] [CrossRef]
  30. Wang, Z.Q.; Zhang, D.Y.; Xu, X.B.; Lu, T.Y.; Yang, G.H. Collaborative Utilization of Sentinel-1/2 and DEM Data for Mapping the Soil Organic Carbon in Forested Areas Based on the Random Forest. Forests 2024, 15, 16. [Google Scholar] [CrossRef]
  31. Chandra, J.; Hidayaturrahman; Tjoaquinn, C. Predicting Stroke Diagnosis Using Hyperparameter Tuning. In Proceedings of the 2024 7th International Conference of Computer and Informatics Engineering (IC2IE), Bali, Indonesia, 12–13 September 2024; IEEE: New York, NY, USA, 2024; pp. 1–7. [Google Scholar] [CrossRef]
  32. Kakhani, N.; Taghizadeh-Mehrjardi, R.; Omarzadeh, D.; Ryo, M.; Heiden, U.; Scholten, T. Towards Explainable AI: Interpreting Soil Organic Carbon Prediction Models Using a Learning-Based Explanation Method. Eur. J. Soil Sci. 2025, 76, 18. [Google Scholar] [CrossRef]
  33. Song, J.R.; Gao, J.H.; Zhang, Y.B.; Li, F.P.; Man, W.D.; Liu, M.Y.; Wang, J.H.; Li, M.Q.; Zheng, H.; Yang, X.W.; et al. Estimation of Soil Organic Carbon Content in Coastal Wetlands with Measured VIS-NIR Spectroscopy Using Optimized Support Vector Machines and Random Forests. Remote Sens. 2022, 14, 21. [Google Scholar] [CrossRef]
  34. Bergstra, J.; Bengio, Y. Random Search for Hyper-Parameter Optimization. J. Mach. Learn. Res. 2012, 13, 281–305. [Google Scholar]
  35. Evstafev, E. Optimizing Humor Generation in Large Language Models: Temperature Configurations and Architectural Trade-offs. arXiv 2025, arXiv:2504.02858. [Google Scholar] [CrossRef]
  36. Wang, Y.; Chen, S.C.; Hong, Y.S.; Hu, B.F.; Peng, J.; Shi, Z. A comparison of multiple deep learning methods for predicting soil organic carbon in Southern Xinjiang, China. Comput. Electron. Agric. 2023, 212, 12. [Google Scholar] [CrossRef]
  37. Meng, X.T.; Bao, Y.L.; Wang, Y.; Zhang, X.L.; Liu, H.J. An advanced soil organic carbon content prediction model via fused temporal-spatial-spectral (TSS) information based on machine learning and deep learning algorithms. Remote Sens. Environ. 2022, 280, 21. [Google Scholar] [CrossRef]
  38. Chen, X.T.; Xu, T.L.; Li, X.J.; Zhao, A.H.; Feng, H.Y.; Chen, B.D. Soil organic carbon concentrations and the influencing factors in natural ecosystems of northern China. Chin. J. Ecol. 2019, 38, 1133–1140. [Google Scholar] [CrossRef]
  39. Türker, Y.S.; Kilincarslan, S.; Ince, E.Y. Performance of ANN, Random Forest and XGBoost methods in predicting the flexural properties of wood beams reinforced with carbon-FRP. Wood Mater. Sci. Eng. 2025, 20, 657–668. [Google Scholar] [CrossRef]
  40. Khaldi, Z.; Weng, J.N.; Lopez, F.P.A.; Zhou, G.H.; Ghedjatti, I.; Ali, A. PyGEE-ST-MEDALUS: AI Spatiotemporal Framework Integrating MODIS and Sentinel-1/-2 Data for Desertification Risk Assessment in Northeastern Algeria. Remote Sens. 2025, 17, 33. [Google Scholar] [CrossRef]
  41. Li, S.B.; He, S.Y.; Xu, Z.; Liu, Y.; von Bloh, W. Desertification process and its effects on vegetation carbon sources and sinks vary under different aridity stress in Central Asia during 1990–2020. Catena 2023, 221, 15. [Google Scholar] [CrossRef]
  42. Wang, C.Y.; Gao, B.B.; Yang, K.; Wang, Y.X.; Sukhbaatar, C.; Yin, Y.; Feng, Q.L.; Yao, X.C.; Zhang, Z.H.; Yang, J.Y. Inversion of soil organic carbon content based on the two-point machine learning method. Sci. Total Environ. 2024, 943, 13. [Google Scholar] [CrossRef]
Figure 1. Overall research framework.
Applsci 16 03349 g001
Figure 2. Spatial distribution of sampling sites in the dataset.
Applsci 16 03349 g002
Figure 3. Retention rates of preprocessing methods in the black soil region and the windblown sandy soil region.
Applsci 16 03349 g003
Figure 4. SOC mean bias results of preprocessing methods in the black soil region and the windblown sandy soil region.
Applsci 16 03349 g004
Figure 5. Changes in mean SOC under the three preprocessing methods in the black soil region.
Applsci 16 03349 g005
Figure 6. Changes in mean SOC under the three preprocessing methods in the windblown sandy soil region.
Applsci 16 03349 g006
Figure 7. Performance comparison of the random forest model under three hyperparameter optimization methods in the black soil region.
Applsci 16 03349 g007
Figure 8. Performance comparison of the random forest model under three hyperparameter optimization methods in the windblown sandy soil region.
Applsci 16 03349 g008
Figure 9. Comparison of R2 values among the three models in the black soil region and the windblown sandy soil region.
Applsci 16 03349 g009
Figure 10. Comparison of RMSE among the three models in the black soil region and the windblown sandy soil region.
Applsci 16 03349 g010
Table 1. Description of variables in the dataset.
Variable CategoryVariable NameDefinition/RoleVariable Type
Core variables—feature variablesSandSand/gravel content; soil texture indicatorNumeric (%)
SiltSilt content; soil texture indicatorNumeric (%)
ClayClay content; soil texture indicatorNumeric (%)
NDVINormalized Difference Vegetation Index; indicates vegetation coverNumeric (unitless)
MATMean annual temperature; climatic factorNumeric (°C)
MAPMean annual precipitation; climatic factorNumeric (mm)
Core variables—target variableSOC (g/kg)Soil organic carbon content; model prediction targetNumeric (g/kg)
Auxiliary variableslatitudeLatitude; used to delineate the black soil region and windblown sandy soil regionNumeric (°N)
longitudeLongitude; used to delineate the black soil region and windblown sandy soil regionNumeric (°E)
Table 2. Comparison of data preprocessing results for the black soil region.
MethodOriginal Sample SizeSample Size After CleaningMissing-Value Imputation Ratio
Traditional hard coding797448100
Isolation Forest797757100
LLM797441100
Table 3. Comparison of data preprocessing results for the windblown sandy soil region.
MethodOriginal Sample SizeSample Size After CleaningMissing-Value Imputation Ratio
Traditional hard coding609361100
Isolation Forest609578100
LLM609377100
Table 4. Comparison of hyperparameter settings and tuning efficiency across different optimization methods in the black soil region.
Methodn_estimatorsmax_depthmax_featuresNumber of EvaluationsTime (seconds)
Grid search200120.66421.03
Random search200120.6204.87
LLM250120.711.71
Table 5. Comparison of Parameter Configuration and Computational Efficiency of Different Hyperparameter Optimization Methods in the Windblown Sandy Soil Region.
Methodn_estimatorsmax_depthmax_featuresNumber of EvaluationsTime (seconds)
Grid search400120.66419.31
Random search200100.6204.28
LLM300120.711.74
Table 6. Variable importance rankings for the Random Forest model optimized by LLM.
RankBlack Soil RegionImportanceWind-Blown Sandy RegionImportance
1MAT0.358Clay0.320
2Clay0.188MAT0.314
3Sand0.132MAP0.141
4MAP0.116Silt0.091
5Silt0.107Sand0.070
6NDVI0.098NDVI0.065
Disclaimer/Publisher’s Note: The statements, opinions and data contained in all publications are solely those of the individual author(s) and contributor(s) and not of MDPI and/or the editor(s). MDPI and/or the editor(s) disclaim responsibility for any injury to people or property resulting from any ideas, methods, instructions or products referred to in the content.