1. Introduction
Self-similarity analytical methods for the deformation and failure of rock surrounding circular excavations have become an important approach for stability analysis in tunnels, mine shafts, and roadways. Various methods have been proposed and developed for the theoretical analytical modeling of circular excavations, with simplified assumptions regarding the far-field hydrostatic pressure and uniformly distributed support pressure applied to the excavation boundary. These methods generally differ in their constitutive models, yield criteria, association and non-association flow rules, full- and partial-incremental theories of plasticity, and choice of theoretical and numerical solution methods [
1].
Detournay [
2] pioneered a self-similarity analytical approach for circular excavations in strain-softening rock masses employing the Mohr–Coulomb yield criteria alongside both associative and non-associative plastic potential functions. His methodology includes a self-similarity differential equation governing radial displacement within the plastic zone, which was subsequently integrated with the fourth-order Runge–Kutta numerical technique to create a numerical method for analyzing circular excavation behavior under varying dilation conditions. Carranza-Torres [
3] established a complete set of self-similarity governing equations characterizing the stress–displacement behavior of plastic zones around circular excavations, yielding analytical solutions for two distinct failure modes: (1) elastic–perfectly plastic and elastic–brittle–plastic analyses under standard Mohr–Coulomb conditions, and (2) strain-softening analyses requiring simplification to the Tresca yield criterion. Carranza-Torres [
4] also proposed analytical solutions to study circular excavation deformation and failure in elastic–brittle–plastic rock masses using the Hoek–Brown yield criterion combined with a self-similarity method. Alonso et al. [
5] developed a numerical method to construct Ground Reaction Curves (GRCs) for circular excavations in strain-softening rock masses by incorporating either the Mohr–Coulomb yield criterion or original Hoek–Brown yield criterion, building on the self-similarity equations governing stress and displacement previously established by Carranza-Torres [
4]. Carranza-Torres [
6] formulated analytical solutions for both elastic–brittle–plastic and elastic–perfectly plastic analyses of circular excavation surrounding rock by employing the generalized Hoek–Brown yield criterion within the self-similarity framework. Meanwhile, Zhao et al. [
1] developed an approach for constructing the GRCs of circular excavations based on the generalized Hoek–Brown yield criterion, which extends the self-similarity construction method introduced by Alonso et al. [
5]. In addition to the plastic and elastic zones, Chen et al. [
7] proposed a self-similarity numerical method for constructing the GRCs of circular excavations that incorporates the influence of the surrounding rock reinforcement zone, based on the unified strength criterion and self-similar solution theory. These developments illustrate how the application of self-similarity methods has driven advances in the analytical and numerical analyses of deformation and failure for circular excavations.
The rock mass conditions vary for engineering projects such as tunnels, mine shafts, and roadways, and the post-peak strain-softening mechanisms consequently differ. Therefore, the softening coefficients in analytical algorithms should be selected accordingly [
8]. Only Guan et al. [
9] and Park et al. [
10] have developed analytical and numerical algorithms (non-self-similarity algorithms) using the maximum principal plastic strain as the softening coefficient. Unfortunately, these analytical algorithms are based on simplified assumptions about plastic zone strain, leading to limited accuracy. Moreover, plastic shear strain is used as the softening coefficient in all the existing self-similarity analysis methods, which inherently limits their broader applicability [
1,
2,
3,
4,
5,
6,
7]. Hence, the development of self-similarity analytical methods using varying softening coefficients is essential, as the advancement of such algorithms can ensure the accurate acquisition of stress, deformation, and failure distributions around circular excavations in strain-softening rock masses under different conditions.
In the elastoplastic plane strain analysis of circular excavation-surrounding rock, in addition to the plastic shear strain corresponding to engineering surrounding rock shear sliding failure softening, the maximum and minimum plastic principal strains are also involved, corresponding to engineering surrounding rock circumferential compressive–shear failure softening and radial tensile failure softening, respectively. In this study, we extend the original self-similarity numerical algorithm that uses plastic shear strain as the softening coefficient, incorporating two additional cases wherein the maximum and minimum plastic principal strains serve as softening coefficients. We then systematically analyze how these softening coefficients affect the stress, deformation, and failure distributions around a circular excavation, offering practical insights for tunnel, mine shaft, and roadway stability control in engineering applications.
2. Problem Definition
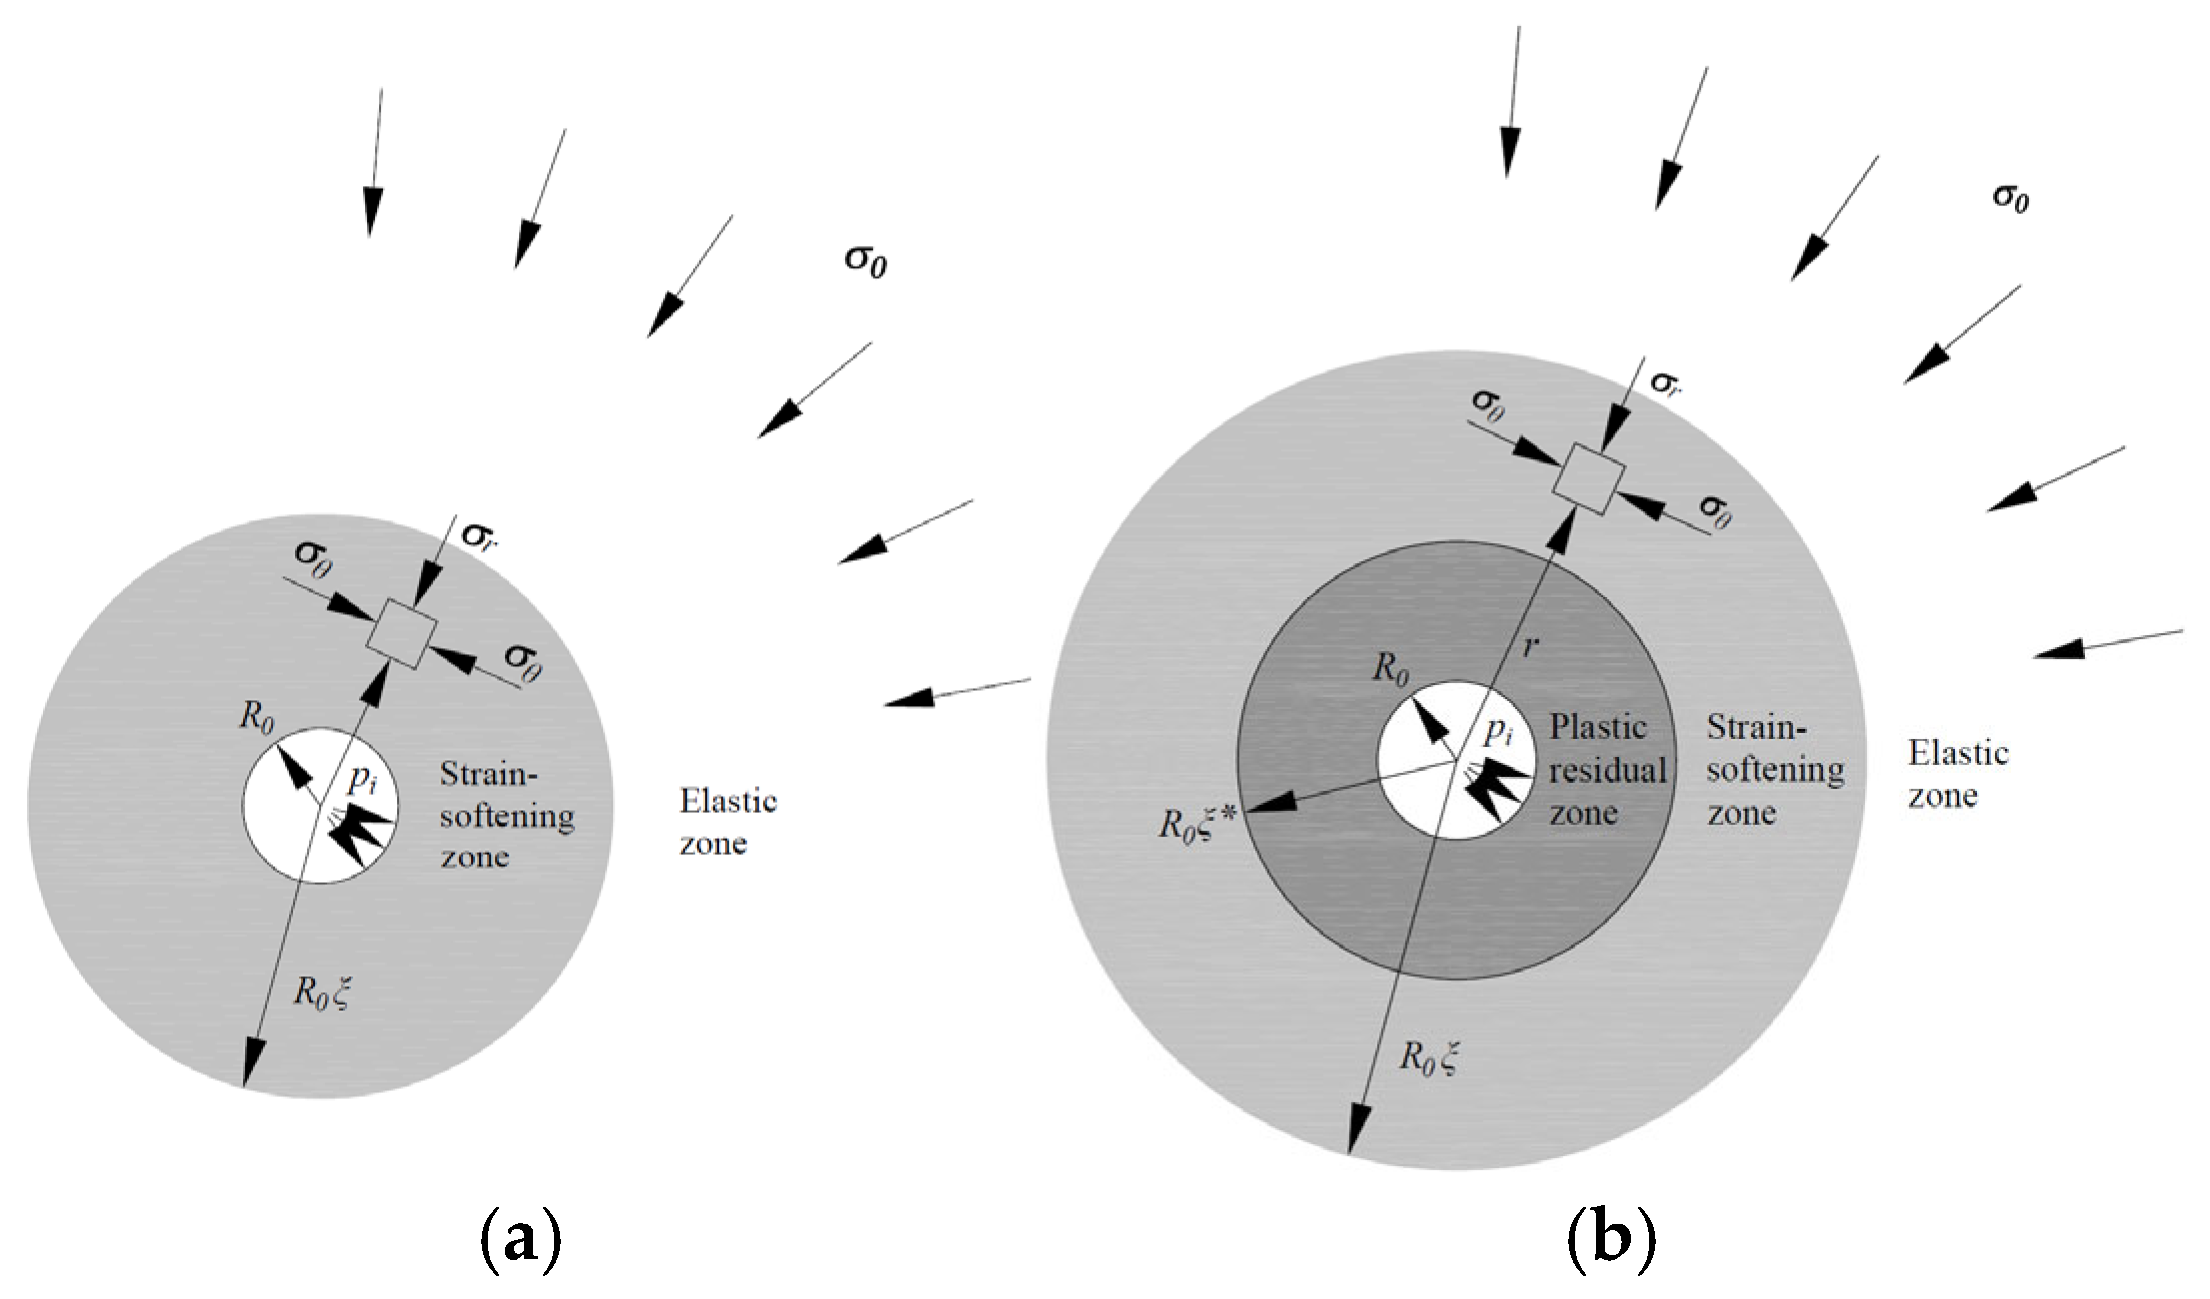
Figure 1 depicts a circular excavation in an infinite, continuous, homogeneous, and isotropic rock mass, characterized by an excavation radius (
R0) and in situ stress (
σ0). The intermediate principal stress (
σ2) acts perpendicular to the plane, while uniform radial support pressure (
pi) is applied to the excavation boundary. This configuration forms an axisymmetric plane strain model, where the minimum principal stress (
σ3) is equal to the radial stress (
σr), while the maximum principal stress (
σ1) coincides with the tangential stress (
σθ).
As illustrated in
Figure 1a, when the internal support pressure falls below a certain value, a plastic zone with radius
R0ξ forms in the surrounding rock, which corresponds to the strain-softening zone at this stage. As illustrated in
Figure 1b, when the internal support pressure further decreases to another critical value, a plastic residual zone with the radius
R0ξ* emerges within the strain-softening zone. At this point, the plastic zone consists of both the strain-softening and plastic residual zones, while the region beyond the plastic zone remains elastic.
Within the plastic zone, the mechanical response of the surrounding rock follows the plastic incremental theory, which is governed by the yield function F(σ1, σ3, η) and the plastic potential function G(σ1, σ3, η), where η represents the softening coefficient. In contrast, the elastic zone is assumed to adhere to the fundamental principles of linear elastic mechanics, which are characterized by the elastic modulus (E) and Poisson’s ratio (ν). In this paper, we introduce a self-similarity numerical algorithm to analyze the deformation and failure of surrounding rock under varying softening coefficients by systematically examining their influence on mechanical behavior.
2.1. Softening Coefficients
For shallow-buried tunnels, mine shafts, and roadways, the strain-softening behavior of the surrounding rock is often dominated by radial tensile failure, and the softening coefficient should be defined by the plastic radial tensile strain (i.e., the minimum plastic principal strain). For medium-depth, weak, or heavily jointed rock engineering, the strain-softening behavior of the surrounding rock is typically dominated by shear slip failure, and the softening coefficient should be defined by the plastic shear strain. For deep-buried rock engineering, the strain-softening behavior of the surrounding rock is usually dominated by tangential compressive failure, and the softening coefficient should be defined by the plastic tangential compressive strain (i.e., the maximum plastic principal strain) [
8,
11,
12,
13,
14] (refer to
Figure 1). These softening coefficients are defined as follows:
where the plastic tangential strain (
) and the plastic radial strain (
) represent the maximum and minimum plastic principal strains in the plane, respectively. The elastic tangential strain (
) and the elastic radial strain (
) can be determined using Hooke’s law. Additionally,
γp denotes the plastic shear strain. Together, these softening coefficients effectively characterize the plastic deformation evolution of the surrounding rock of circular excavations.
2.2. Strength and Deformation Parameters of Rock Mass
Assuming that the mechanical parameters of the surrounding rock of circular excavations have the same functional relationship with the softening coefficient—that is, the same piecewise linear function—then
where
χ denotes the mechanical parameters of the surrounding rock of circular excavations, and the subscripts ‘
p’ and ‘
r’ represent peak and residual values, respectively.
2.3. Yield Functions
The Mohr–Coulomb and the generalized Hoek–Brown yield criteria are commonly used yield criteria in rock mass engineering. The Mohr–Coulomb yield criterion is suitable for shear failure under low confining pressure and is more applicable to shallow rock mass engineering, while the generalized Hoek–Brown yield criterion offers higher accuracy in unloading failure analysis and is better suited to deep rock mass engineering under complex geological conditions [
15]. The polar coordinate expression of the yield function based on the Mohr–Coulomb yield criterion is given by
where
, and the cohesion (
c) and internal friction angle (
φ) follow the assignment function shown in (4).
The polar coordinate expression of the yield function based on the generalized Hoek–Brown yield criterion is given by
where
σci represents the uniaxial compressive strength of the intact rock, a constant parameter throughout the plastic deformation process of the surrounding rock, while m, s, and a denote the Hoek–Brown material constants, whose values are determined by the assignment function in (4).
2.4. Plastic Potential Function
The plastic potential function has the same form as the Mohr–Coulomb yield criterion and is expressed as
where the dilation coefficient
, and the dilation angle ψ is determined by the assignment function in (4). When the plastic potential function matches the yield function’s form, it is known as an associated plastic potential function; otherwise, it is classified as non-associated.
2.5. Critical Internal Support Pressure
The critical internal support pressure (
) represents the maximum value at which the circular excavation surrounding rock undergoes plastic failure initiation. Under the Mohr–Coulomb yield criterion, its analytical determination involves coupling the elastic stress distribution with the yield function through theoretical derivation. The explicit expression is given by
where
. For
, the analytical solution of Equation (8) is as follows, as reported by Lee and Pietruszczak [
16]:
The analytical equation for
under the generalized Hoek–Brown yield criterion is
For the original Hoek–Brown yield criterion, the analytical solution of Equation (10) for
is derived as follows:
where
. When
ap exceeds 0.5, the
in Equation (10) lacks an analytical solution. In such cases, the Newton–Raphson numerical method must be employed for iterative computation [
17].
3. Governing Equations
Based on the self-similarity transformation method and construction method for the self-similarity governing equation given by Zhao et al. [
1], the general forms of the self-similarity balance equation, consistency condition, and compatibility equation are directly given as follows, where the variable marked with “-” represents the self-similarity transformation variable:
The general form for calculating coefficient B is as follows:
According to Equations (13) and (15), for different softening coefficients, the consistency equation and its coefficient B are not the same, and these equations are now restructured as follows:
a.
The consistency equation is transformed as follows:
Coefficient B in the softening zone is calculated as follows:
Coefficient B in the residual zone is calculated as follows:
b.
The consistency equation is transformed as follows:
Coefficient B in the softening zone is calculated as follows:
Coefficient B in the residual zone is calculated as follows:
c.
The consistency equation is transformed as follows:
Coefficient B in the softening zone is calculated as follows:
Coefficient B in the residual zone is calculated as follows:
For the case using the Mohr–Coulomb yield criterion,
For the case using the generalized Hoek–Brown yield criterion,
To derive coefficient B for the residual zone, the residual mechanical parameters of the rock mass need to be substituted into the aforementioned equations. As the plastic potential function (Equation (7)) is the same for various types of softening coefficients, the corresponding expression for coefficient A remains unchanged. Coefficient A is calculated as follows:
4. Boundary Conditions
The boundary conditions of the plastic zone exhibit continuity in field variables when either the elastic–perfectly plastic or strain-softening constitutive model is employed, which can be mathematically expressed as follows:
In the elastic–brittle–plastic model, both the radial stress (
) and radial displacement (
) remain continuous across the plastic zone boundary, sharing the same values with those specified in Equation (30). However, the tangential stress (
) and first derivative of radial displacement with respect to
ρ (
) exhibit discontinuity. The tangential stress (
) can be determined by applying the radial stress at the plastic zone boundary to the yield criterion and, under the Mohr–Coulomb yield condition, we obtain
Using the generalized Hoek–Brown yield criterion, we obtain
The first derivative (
or
) of radial displacement can be calculated in conjunction with the plastic flow rule; i.e.,
where
, and the total tangential strain is
. Hooke’s law enables the calculation of both the elastic radial (
) and tangential (
) strains.
5. Numerical Calculation Procedure
The stress, displacement, and failure distributions in the plastic zone around the circular excavation (as illustrated in
Figure 1) were reformulated as an initial value problem for a second-order ordinary differential equation system consisting of Equations (12)–(14). We present the numerical computation procedure for the analytical model (
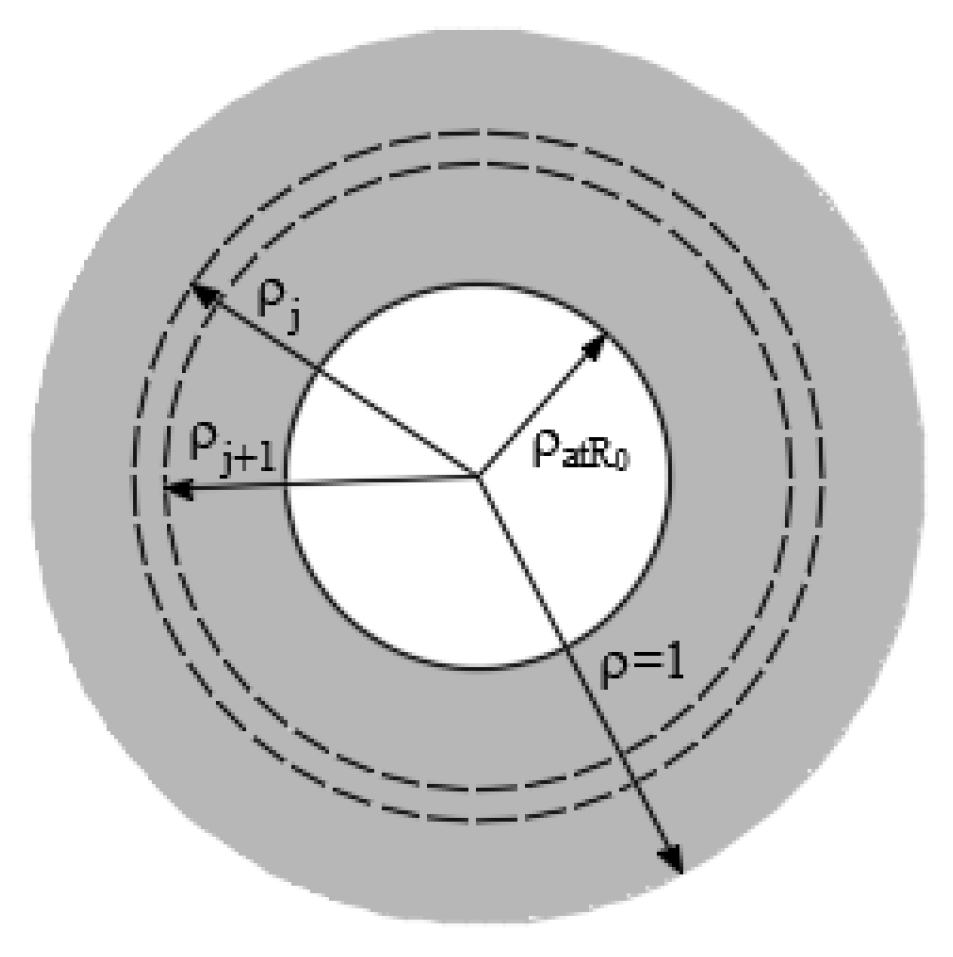
Figure 1) under different softening coefficients and yield criteria using the plastic shear strain for the softening coefficient as an example. The plastic zone around the circular excavation obtained through a self-similarity transformation is a unit plane circular ring which is discretized into several concentric rings, as illustrated in
Figure 2. If the stress, displacement, and failure distributions of the unit plane ring obtained from the self-similarity transformation satisfy Equations (12)–(14), then the self-similarity transformation applies to the discrete concentric rings.
The ordinary differential equation for radial stress within the plastic zone around the circular excavation can be derived by integrating Equations (5) and (12) under the Mohr–Coulomb yield criterion, yielding
Using the generalized Hoek–Brown yield criterion, we obtain
To numerically solve the ordinary differential of Equation (34) or Equation (35) for radial stress within the plastic zone around the circular excavation, the fourth-order Runge–Kutta numerical method [
15] was employed. The equation for calculating radial stress in the (j + 1)th ring of the unit circular ring (see
Figure 2) is as follows:
The coefficients in Equation (36) are given as follows:
The tangential stress at the (j + 1)th ring can be determined by inserting the calculated
from Equation (36) into the yield criterion for the plastic zone around the circular excavation. The expression for tangential stress is solved as follows when using the Mohr–Coulomb yield criterion:
The tangential stress is solved as follows when using the generalized Hoek–Brown yield criterion:
When the equilibrium equation (Equation (12)) and consistency equations (Equations (16), (19), and (22)) are substituted into the compatibility equation (Equation (14)), the resulting second-order ordinary differential equations describing radial displacement in the plastic zone take the following form:
a.
b.
c.
Similarly, we obtain the discrete equation for calculating the radial displacement of the (j + 1)th ring in the plastic zone using the fourth-order Runge–Kutta numerical method [
18]:
where
The radial (
εr) and tangential (
εθ) strains in the discrete circular rings (illustrated in
Figure 2) comprise two distinct components—namely, elastic and plastic contributions—as expressed below:
where
and
denote the elastic radial and tangential strains, while
and
correspond to their plastic counterparts. Substituting the calculated values
and
into the elastic constitutive equations, the radial and tangential strains of the (
j + 1)th ring can be obtained, which are as follows:
From this, the plastic shear strain of the (
j + 1)th ring can be further calculated as its softening coefficient, where
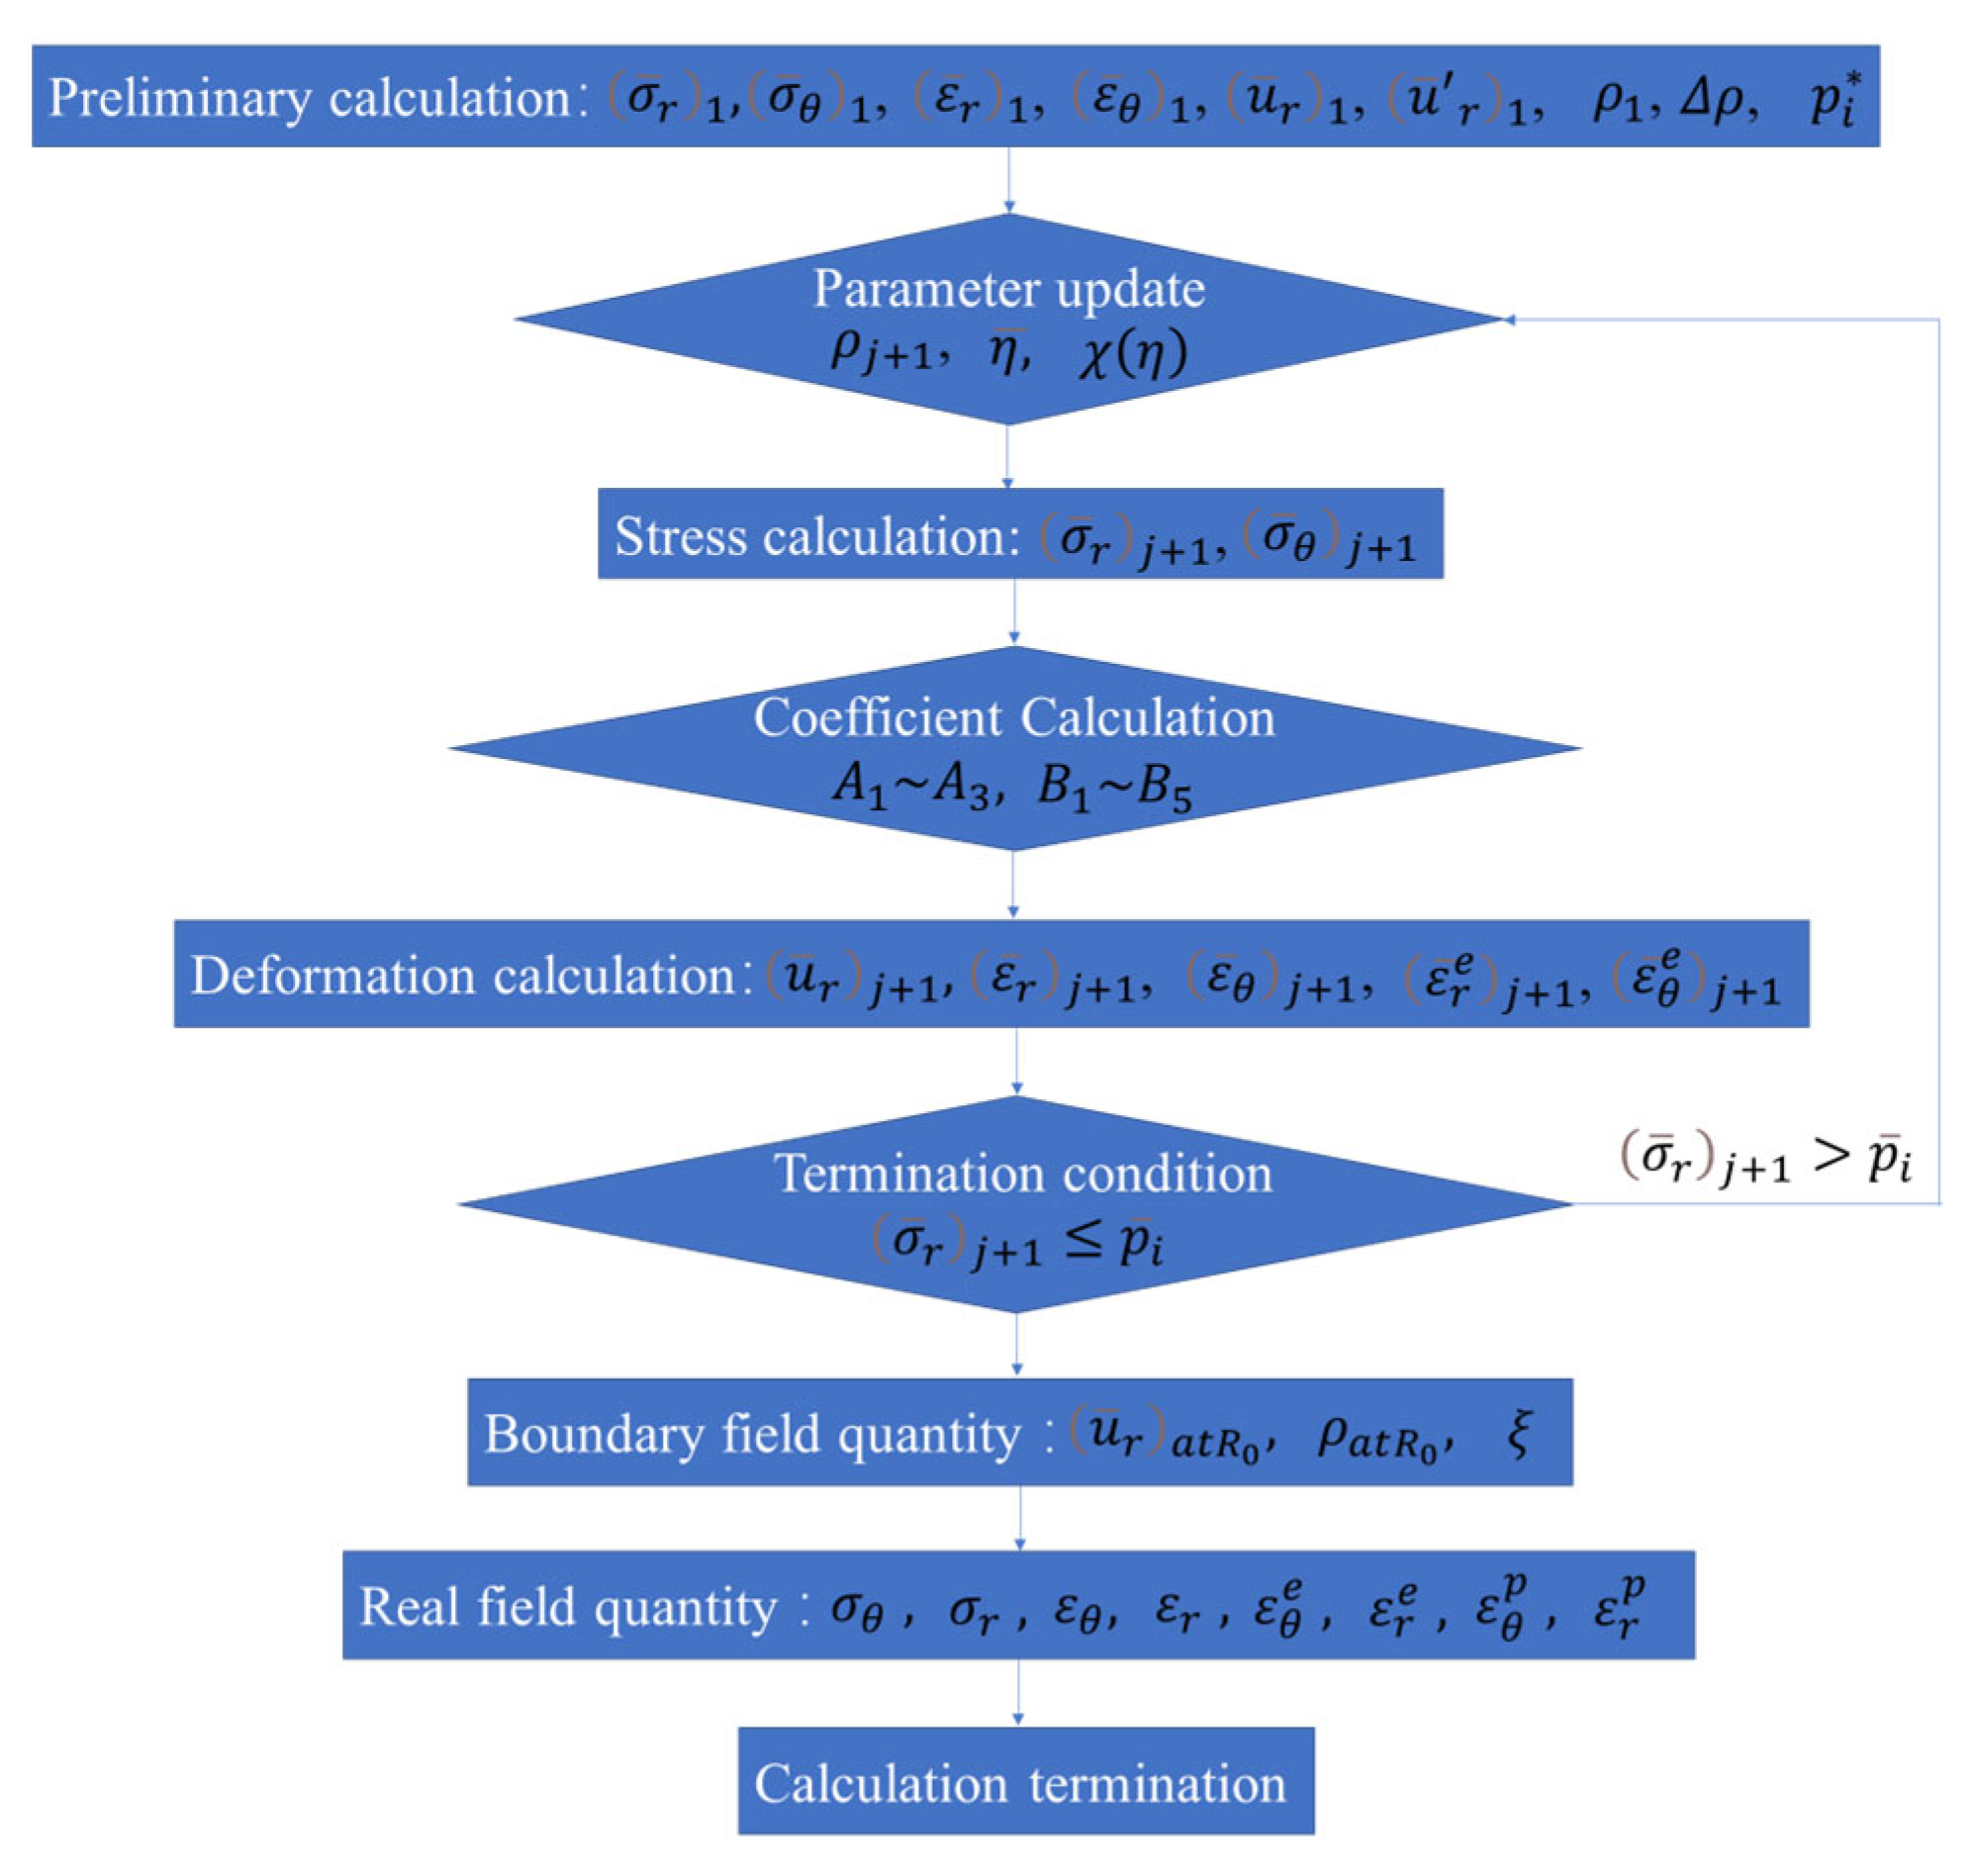
The numerical calculation process is shown in
Figure 3, where the softening coefficient derived from Equation (56) is substituted into Equation (4) to iteratively update the computational parameters. The discrete ring at
ρ = 1 is designated as the initial ring, with its field quantities serving as the starting values (refer to
Section 4: Boundary Conditions). By defining the ring width as Δ
ρ =
ρj+1 −
ρj, the
,
, and
at the (j + 1)th ring are sequentially calculated through Equations (34)–(51).
During the iterative calculation from the plastic zone boundary to the excavation boundary,
monotonically decreases and reaches its minimum value (
) at the excavation boundary; that is, when
, the above iterative calculation procedure is completed. After the calculation is completed, ξ can be derived via
. Subsequently, the actual stress, displacement, and failure distributions within the plastic zone are determined using the self-similarity transformation method. The computational workflow is elaborated in
Appendix A.
6. Validation of the Numerical Algorithm
6.1. Numerical Simulation Verification
FLAC3D finite-difference numerical simulations were performed, assigning parameters from Lee and Pietruszczak’s [
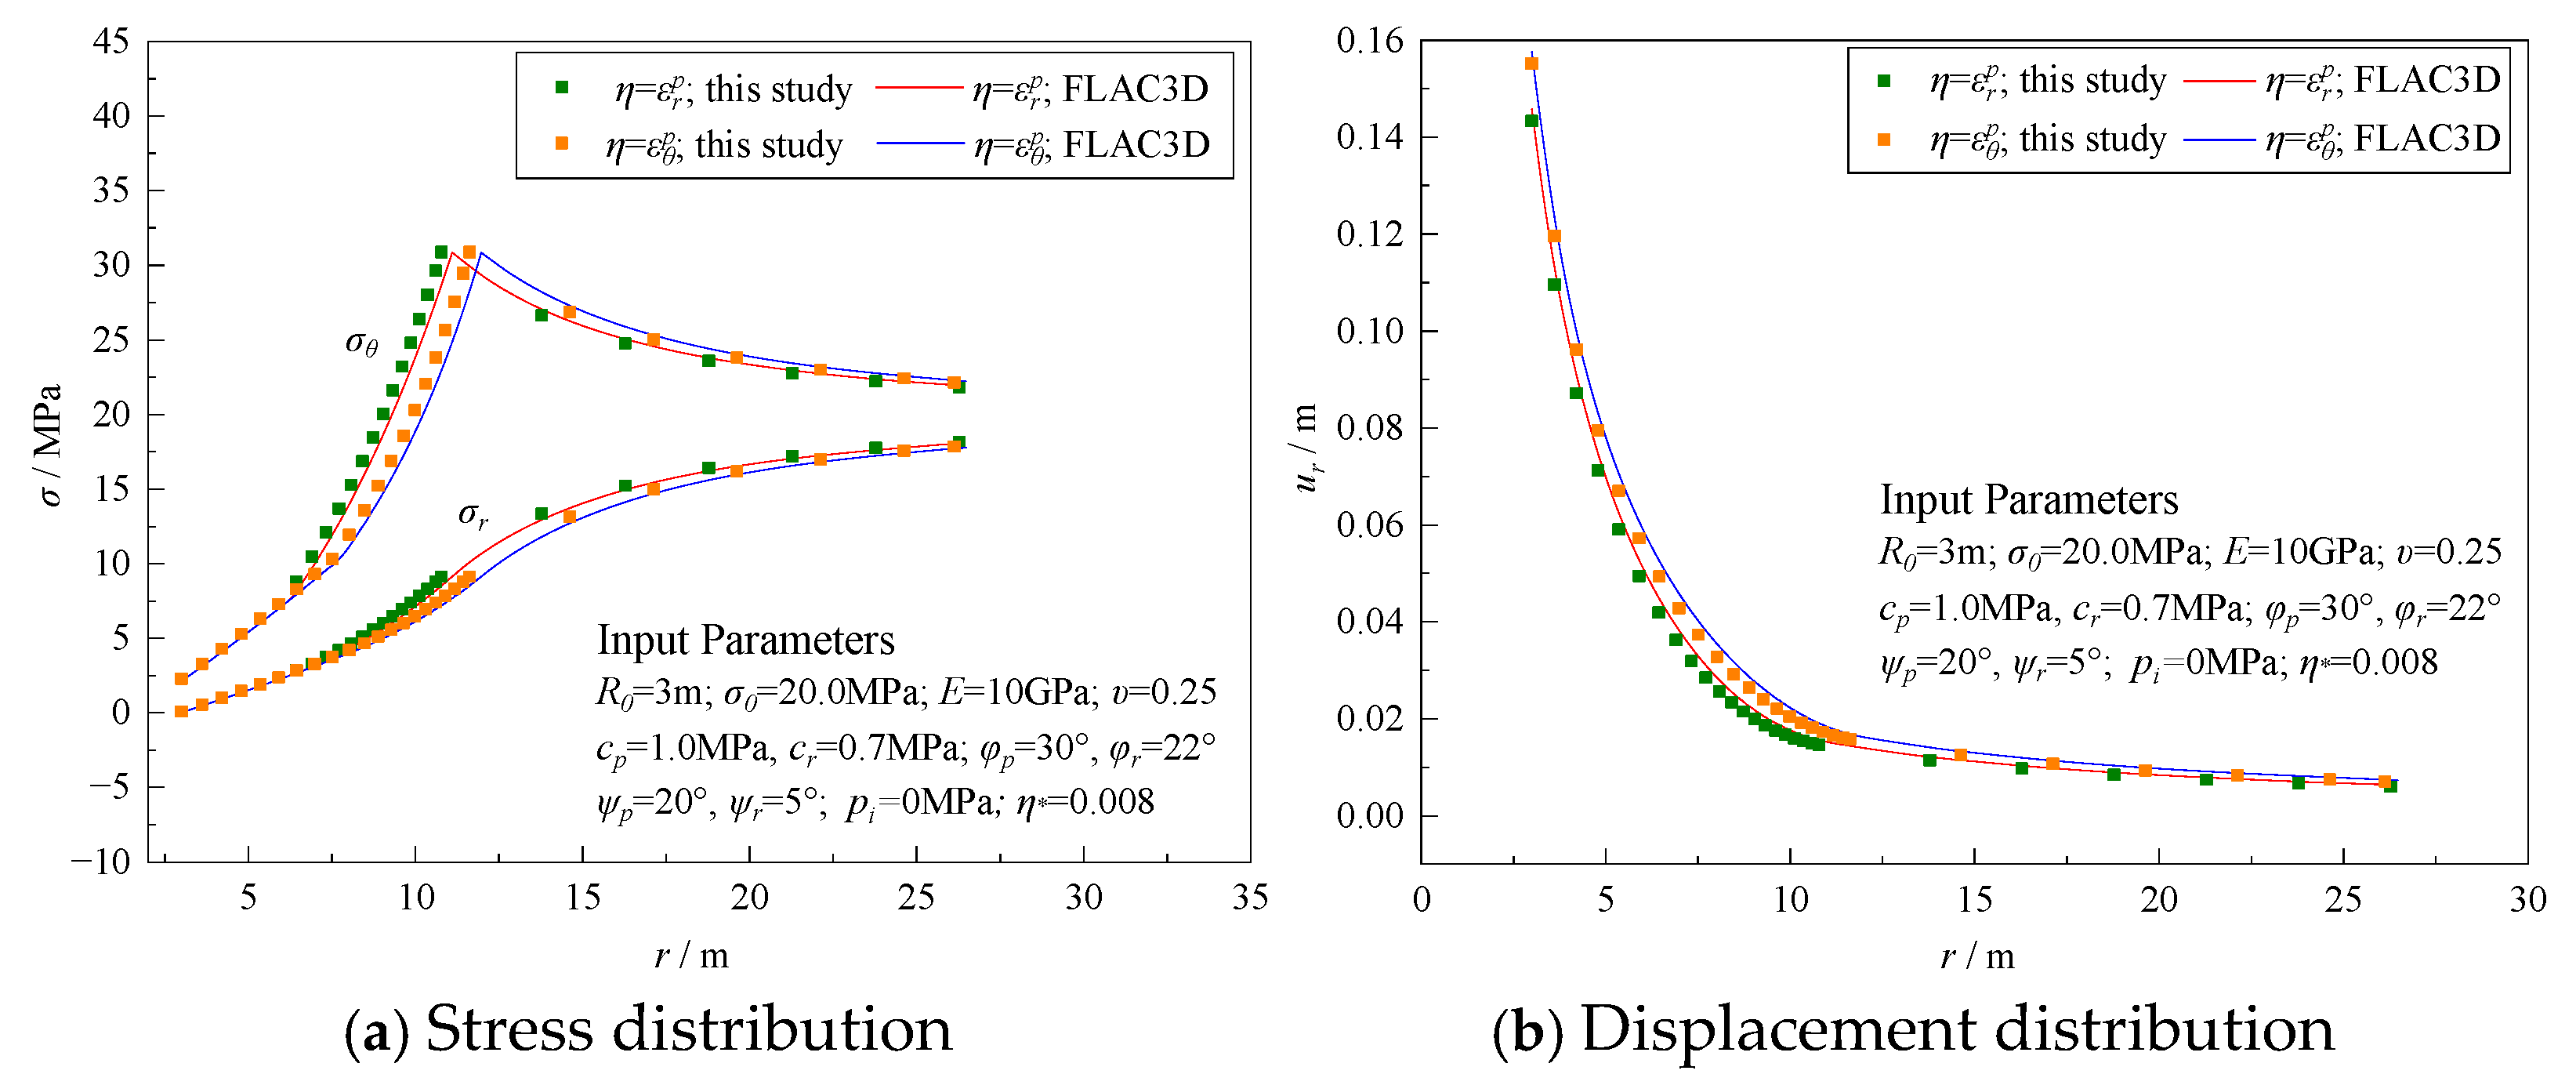
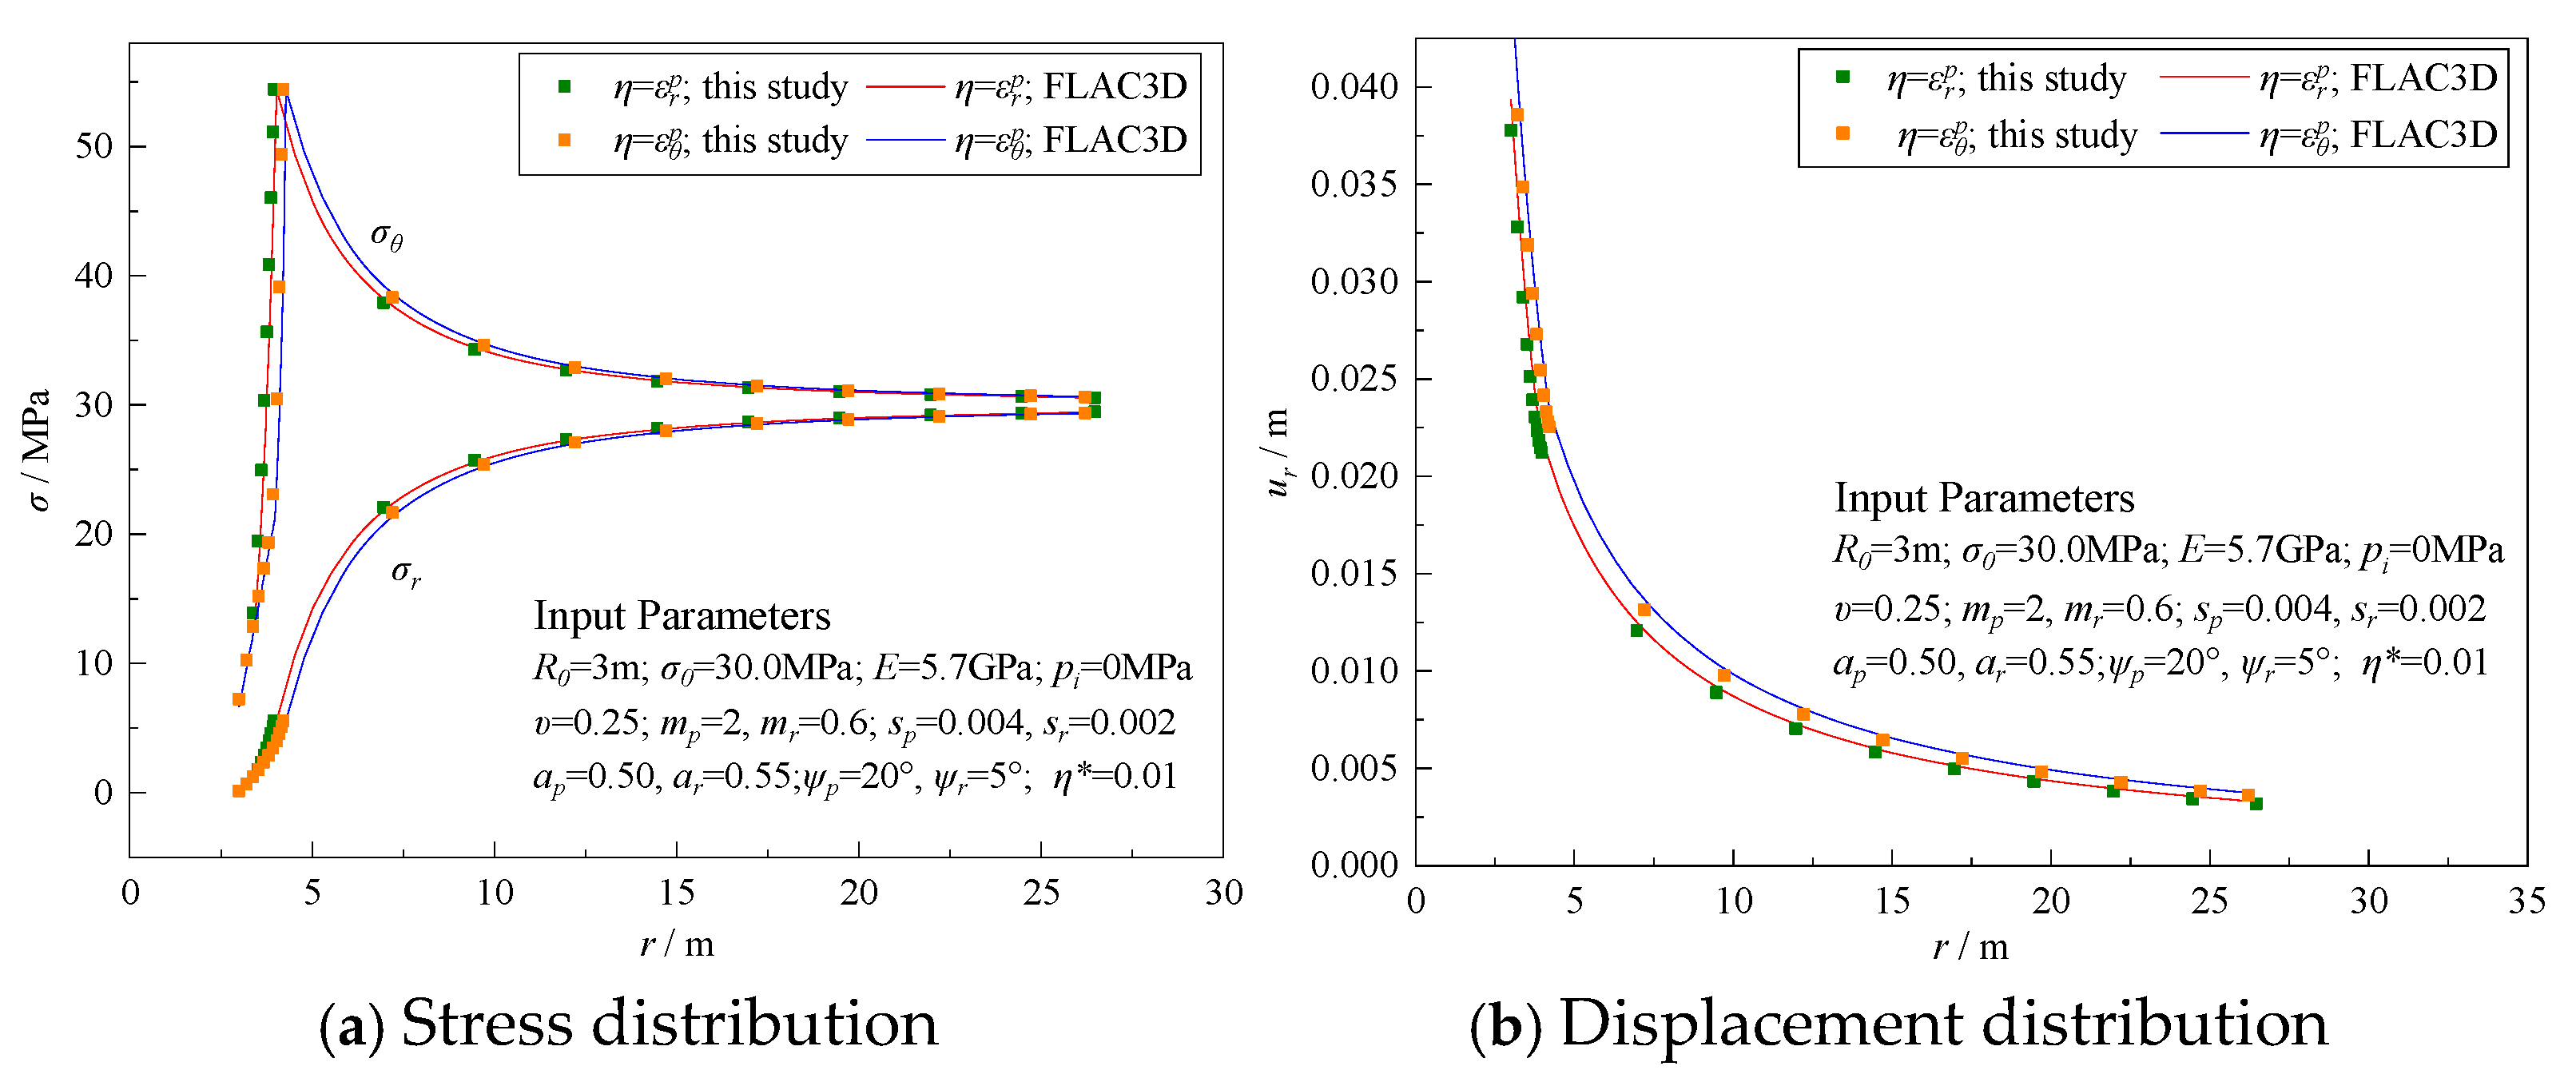
16] verification model to the circular excavation to simulate the stress and displacement distribution in the surrounding rock. We validated the proposed algorithm by comparing its theoretical calculations with the abovementioned FLAC3D results. The FLAC3D simulation results for the stress and displacement distributions of the rock surrounding a circular excavation, using different yield criteria and separately taking the maximum and minimum plastic principal strains as the softening coefficients, are presented in
Figure 4 and
Figure 5, respectively. The corresponding results calculated using the proposed algorithm are also provided for comparison.
In
Figure 4 and
Figure 5, the
for the input parameter is the critical softening coefficient, which refers to the softening coefficient value when the surrounding rock in the plastic zone enters the residual state. The calculation of the plastic zone radius was run through the entire self-similarity numerical analysis process for the deformation and failure of circular excavation surrounding rock, and the calculation results directly reflect the accuracy and reliability of the self-similarity numerical algorithm proposed in this paper. Further verification of the proposed algorithm’s accuracy was conducted by comparing the plastic zone radii calculated using the proposed algorithm (α) and the validation method (β), with the relative error (RE) computed via Equation (57).
Table 1 presents the calculated plastic zone radii and their corresponding relative errors under different yield criteria and softening coefficients.
As illustrated in
Figure 4 and
Figure 5, the stress and displacement distributions around the circular excavation calculated via both methods exhibit consistent patterns under different yield criteria and softening coefficient conditions. Moreover, the maximum relative error in the plastic zone radius calculations between the two methods reaches only 3.01% under various conditions, thereby validating the accuracy of the algorithm presented in this paper.
6.2. Engineering Verification
In this study, we took the main shaft project of Shaling Gold Mine in China as an example and used the proposed self-similarity algorithm and acoustic testing method to determine and compare the plastic zone radii of the shaft-surrounding rock, thereby verifying the accuracy and reliability of the proposed algorithm.
The main shaft of Shaling Gold Mine has a depth of 1551.8 m. According to Pei’s (2020) study on this shaft [
19], the excavation radius of the main shaft was 4.35 m at the sampling depth (1018 m) of rock mechanics experiments in the borehole acoustic testing area. Additionally, the maximum horizontal principal stress was 32 MPa, while the minimum horizontal principal stress was 24 MPa. The rock mass is composed of metamorphic gabbro, with a uniaxial compressive strength of 145.9 MPa, an elastic modulus of 58.1 GPa, a Poisson’s ratio of 0.47, a peak shear dilation angle of 20°, and a residual value of 10°. The peak GSI of the rock mass is 65, and the residual GSI is 35. The calculation method for the strength and deformation parameters of rock mass proposed by Hoek et al. [
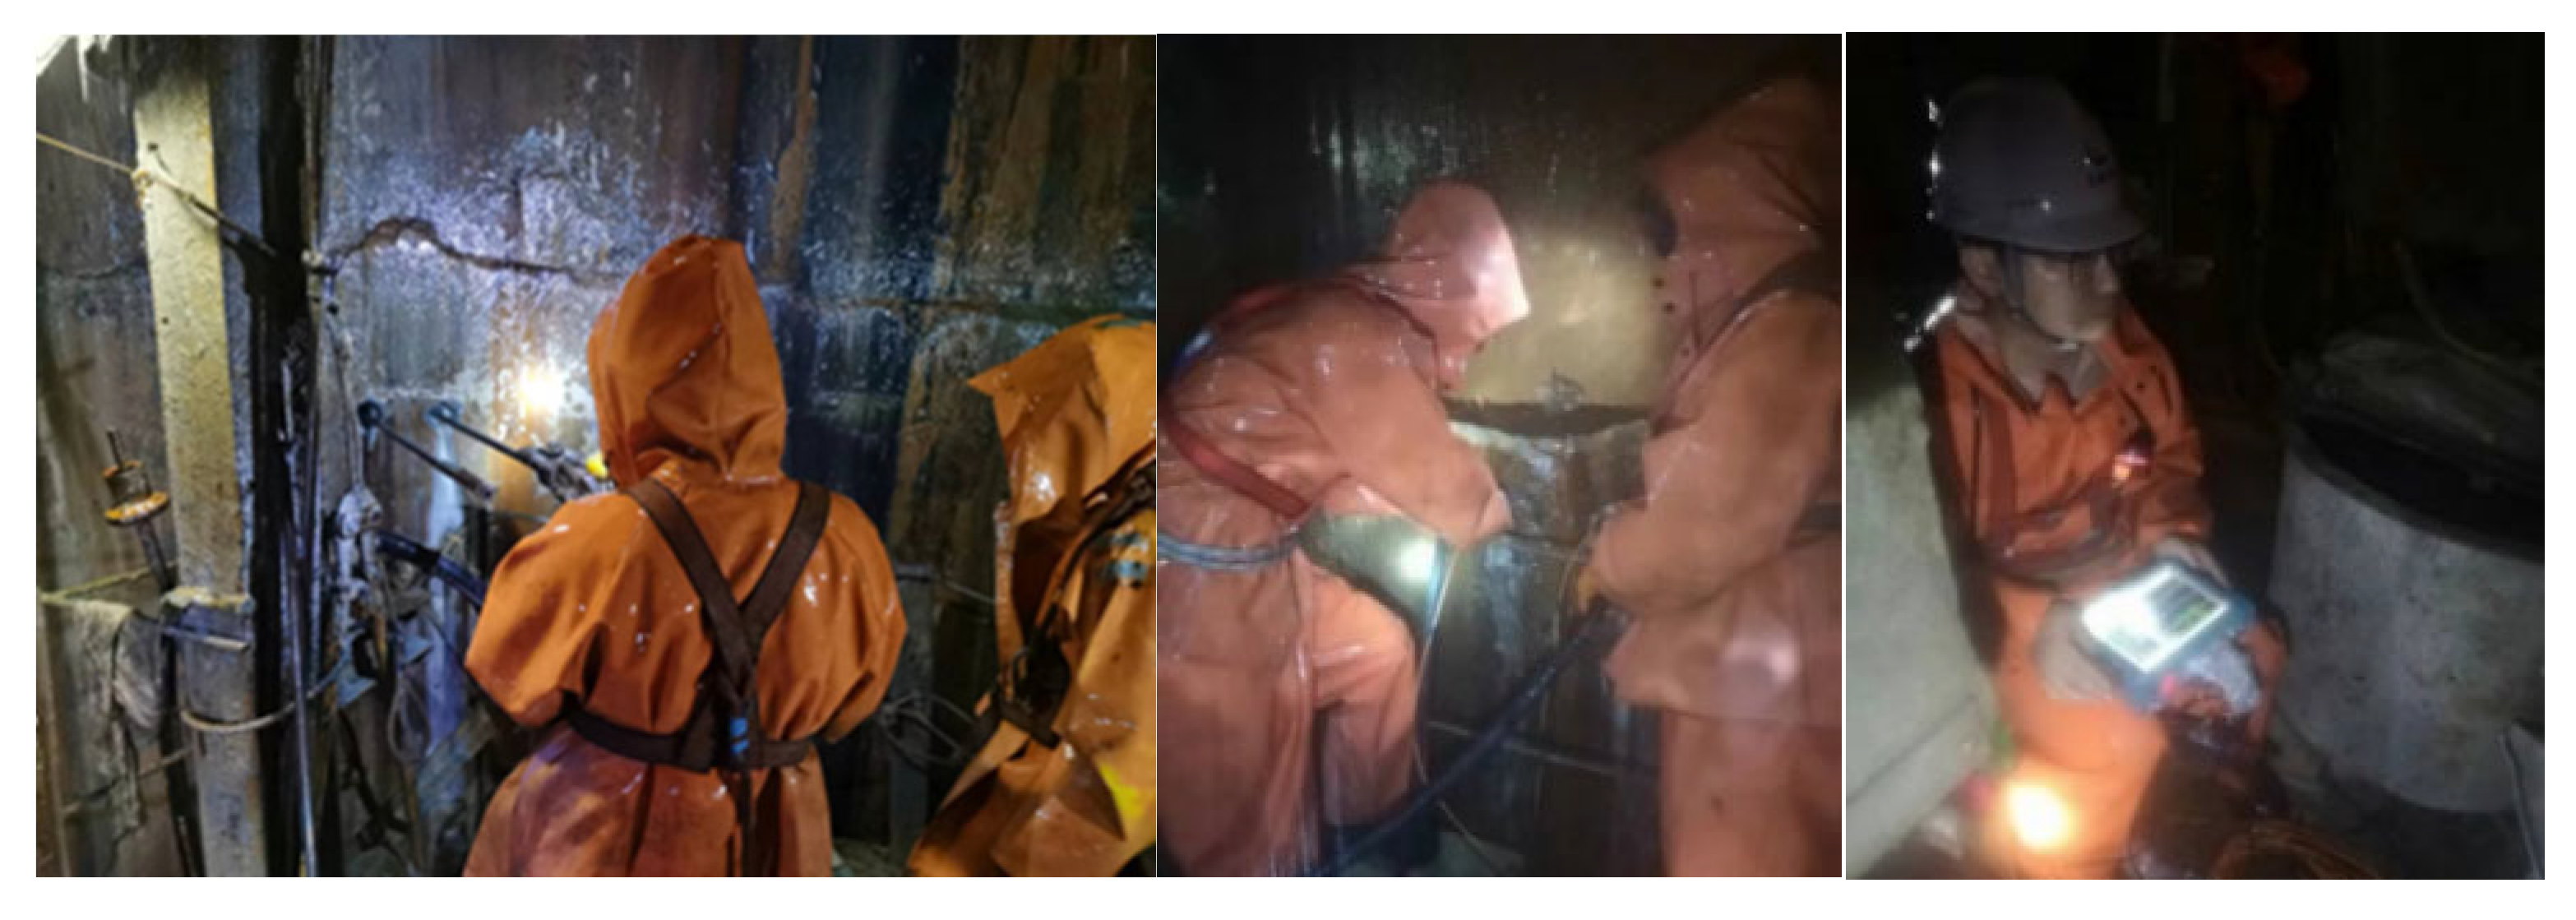
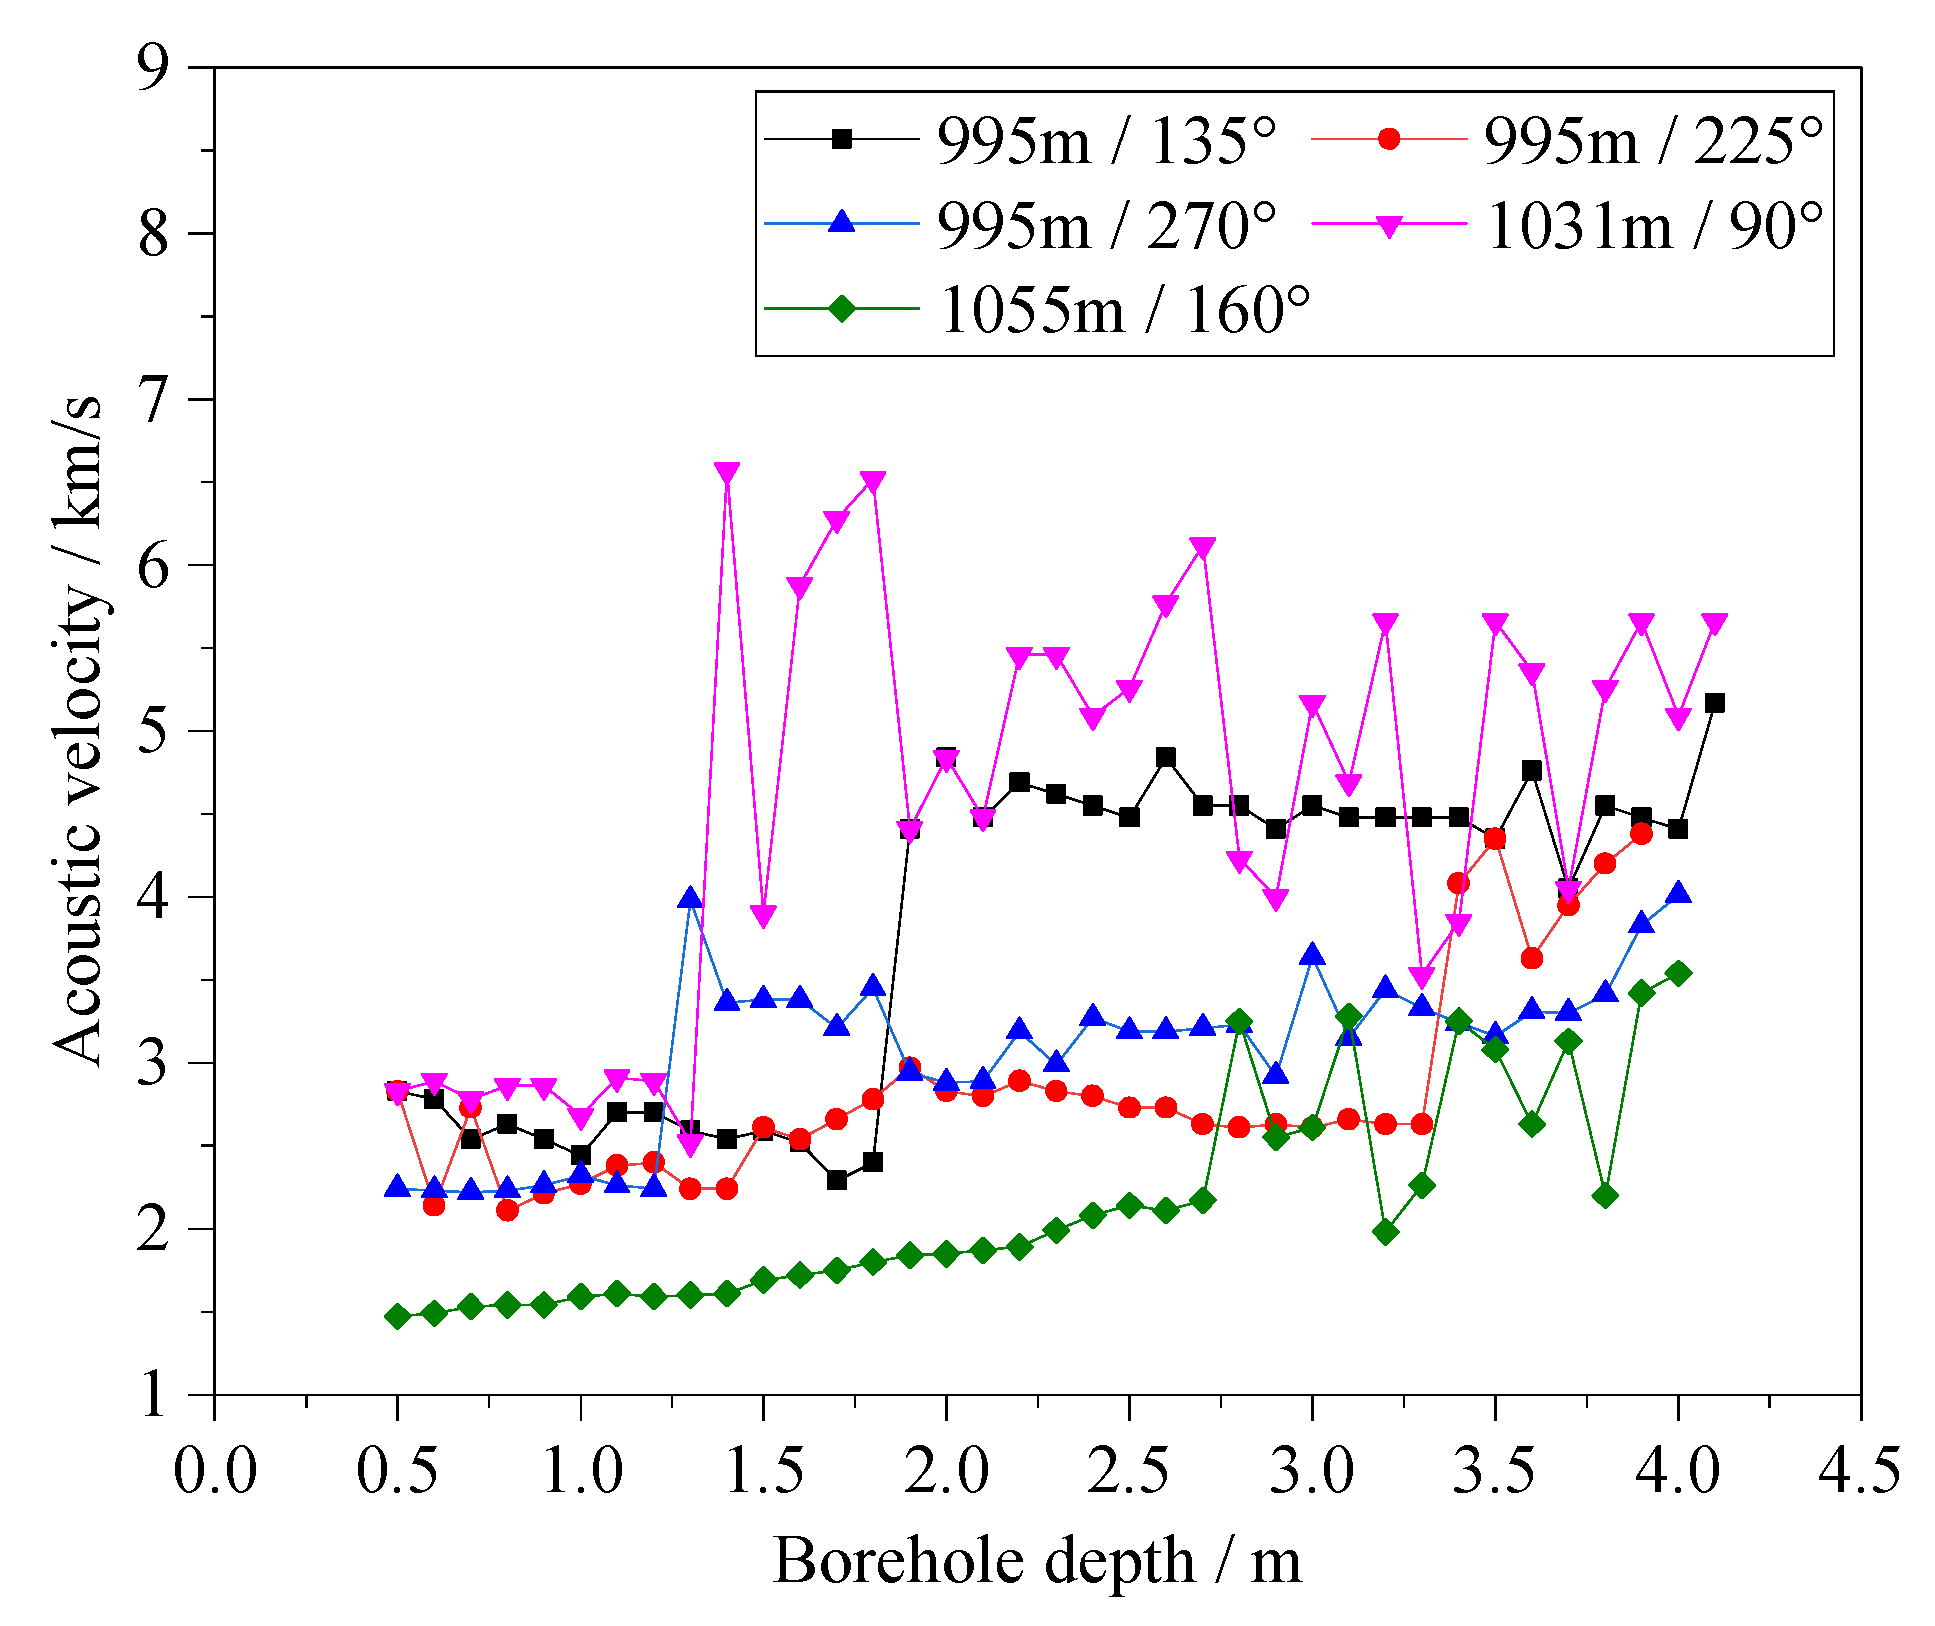
20] (disturbance coefficient, D = 0.8) was used to calculate the rock mass parameters of the shaft-surrounding rock at the depth of borehole acoustic testing. The critical softening coefficients were be determined based on the triaxial test results of gabbro under a confining pressure of 20 MPa. When the maximum principal plastic strain was adopted as the softening parameter, the critical value was 0.055. In contrast, when the minimum principal plastic strain was considered, the critical value was 0.0034. Additionally, using plastic shear strain as the softening parameter yielded a critical coefficient of 0.0089. Borehole acoustic tests were conducted in different directions of the main shaft at depths of 995 m, 1031 m, and 1055 m, as shown in
Figure 6. The acoustic velocity distribution with the borehole depth in different directions is shown in
Figure 7.
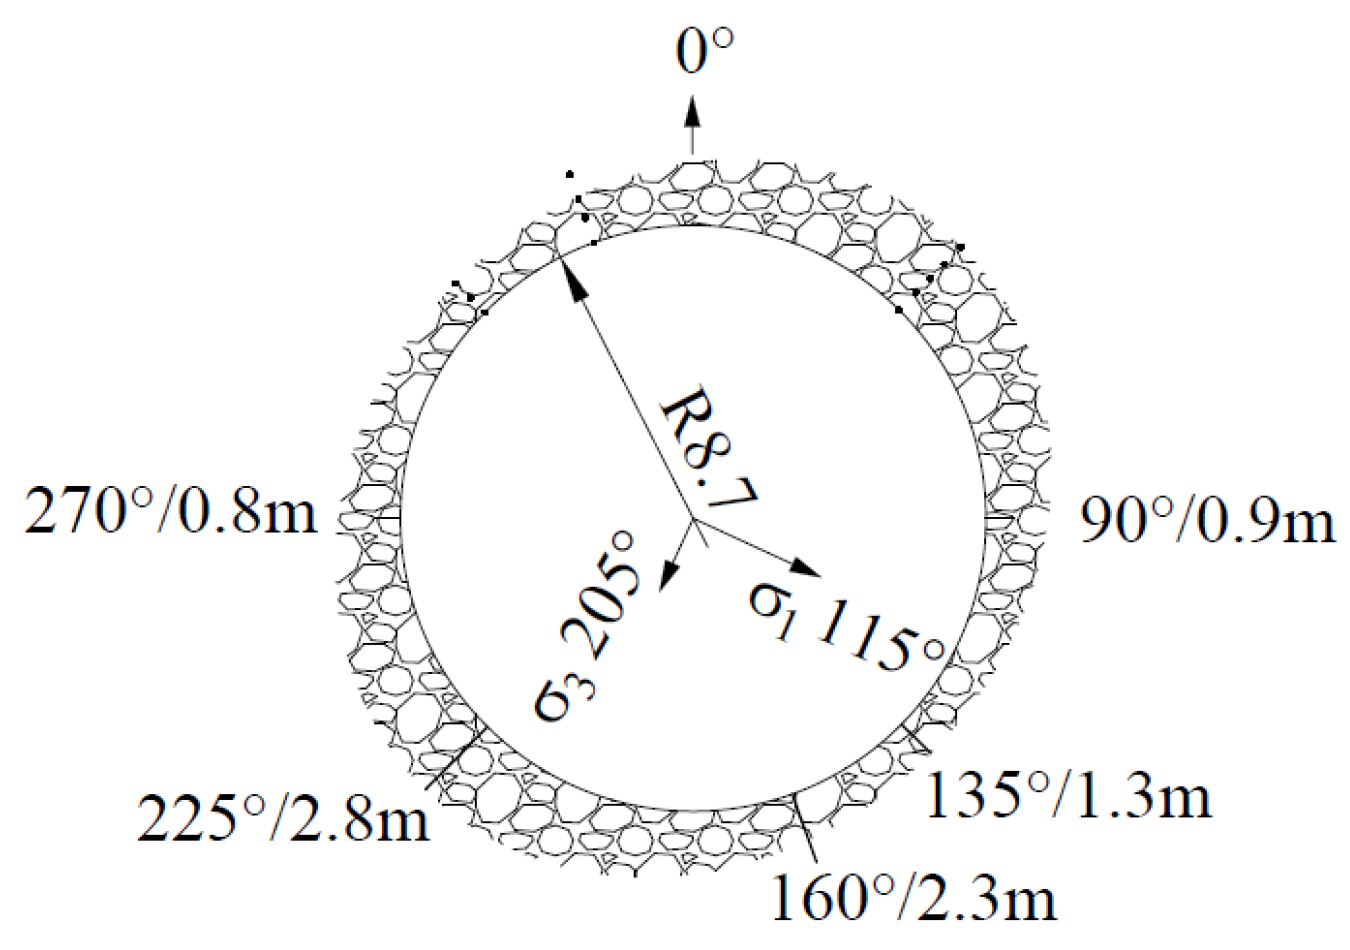
The measurements obtained at depths of 995 m, 1031 m, and 1055 m in the main shaft of Shaling Gold Mine are close, with nearly identical ground stress distributions. Under conditions of little variation in the regional rock mass conditions, the failure distributions of the main-shaft-surrounding rock at each level are nearly consistent. Therefore, the failure range of the surrounding rock in corresponding directions could be determined by conducting acoustic wave velocity tests in different directions at these levels. Subsequently, the failure distribution of the main-shaft-surrounding rock within this depth range could be plotted by superimposing the failure ranges in several directions, as shown in
Figure 8. As shown in
Figure 8, the failure distribution of the main-shaft-surrounding rock in the depth range from 995 m to 1055 m follows an elliptical pattern, with an average failure depth of approximately 1.80 m.
According to Carranza Torres and Fairhurst [
21], when the failure mode of circular excavation surrounding rock is ear-shaped or elliptical, the average plastic zone radius of the circular excavation surrounding rock under symmetric stress is consistent with the plastic zone radius under hydrostatic pressure equal to the average value of the symmetric stress. Therefore, the numerical algorithm proposed in this paper could be validated by comparing the measured average failure depth of the shaft-surrounding rock under symmetric stresses (horizontal maximum and minimum principal stresses) with the calculated results using the proposed algorithm under hydrostatic pressure equal to the mean of the principal stresses.
Using the above verification methods, the plastic zone radii of the main-shaft-surrounding rock using the proposed algorithm under different yield criteria and softening coefficients, along with the relative error calculations compared to the measured failure range of the main-shaft-surrounding rock (using Equation (57)), are presented in
Table 2. The calculation results obtained using the theoretical and numerical algorithms proposed by Guan et al. [
9] and Park et al. [
10]—which are not only based on the plastic shear strain as the softening coefficient—are also listed in
Table 2 for comparative analysis.
According to
Table 2, the failure depth of the main-shaft-surrounding rock calculated using the proposed algorithm with different types of softening coefficients and yield criteria is basically consistent with the on-site measurement results, verifying the accuracy and reliability of the algorithm with different types of softening coefficients proposed in this paper. Moreover, under the condition of using the maximum plastic principal strain as the softening coefficient, the relative error of the plastic zone radius of the main-shaft-surrounding rock calculated via the self-similarity algorithm is the smallest; that is, selecting the maximum plastic principal strain as the softening coefficient is appropriate, as it aligns with the principle of softening coefficient type selection discussed in
Section 2.1. Furthermore, selecting an appropriate softening coefficient can significantly enhance the accuracy of the self-similarity analytical results for surrounding rock stability.
In addition to using the plastic shear strain as the softening coefficient, the algorithms proposed by Guan et al. [
9] and Park et al. [
10] both adopt the maximum plastic principal strain as the softening coefficient, without considering the minimum plastic principal strain. Furthermore, the yield criterion used in both algorithms is the single yield criterion, and the Hoek–Brown yield criterion adopted by Park et al. [
10] is still the original Hoek–Brown yield criterion. According to a comparative analysis of the calculation results, the relative errors of the main shaft plastic zone radius calculated via the theoretical and numerical algorithms of Guan et al. [
9] and Park et al. [
10]—where the plastic zone strain in the algorithms was simplified—reach as high as 29% and 26%, respectively, far exceeding the relative errors of 8.9% and 11.7%, respectively, obtained for the plastic zone radius using the proposed algorithm under the same softening coefficient types. According to the above comparative analysis, the algorithm proposed in this paper has certain advantages in terms of its systematicity, integrity, and accuracy in comparison to similar algorithms.
6.3. Step Length Sensitivity Analysis
In the proposed self-similarity algorithm, the step size (Δ
ρ) is a dimensionless quantity derived from the radial coordinate (Δ
r) through self-similarity transformation, which essentially represents a multiple of the plastic zone radius. From this perspective, the adopted range of Δ
ρ values is applicable to any scenario involving the self-similarity theoretical analysis of the deformation and failure of rock surrounding a circular excavation. Among similar numerical algorithms, the typical step length (Δ
ρ) range is [0.001, 0.1] [1–7, 9, 10]. In this study, we used step lengths (Δ
ρ) of 0.100, 0.050, 0.025, 0.013, 0.007, 0.004, 0.002, and 0.001. Combined with the validated model parameters in
Figure 4 and
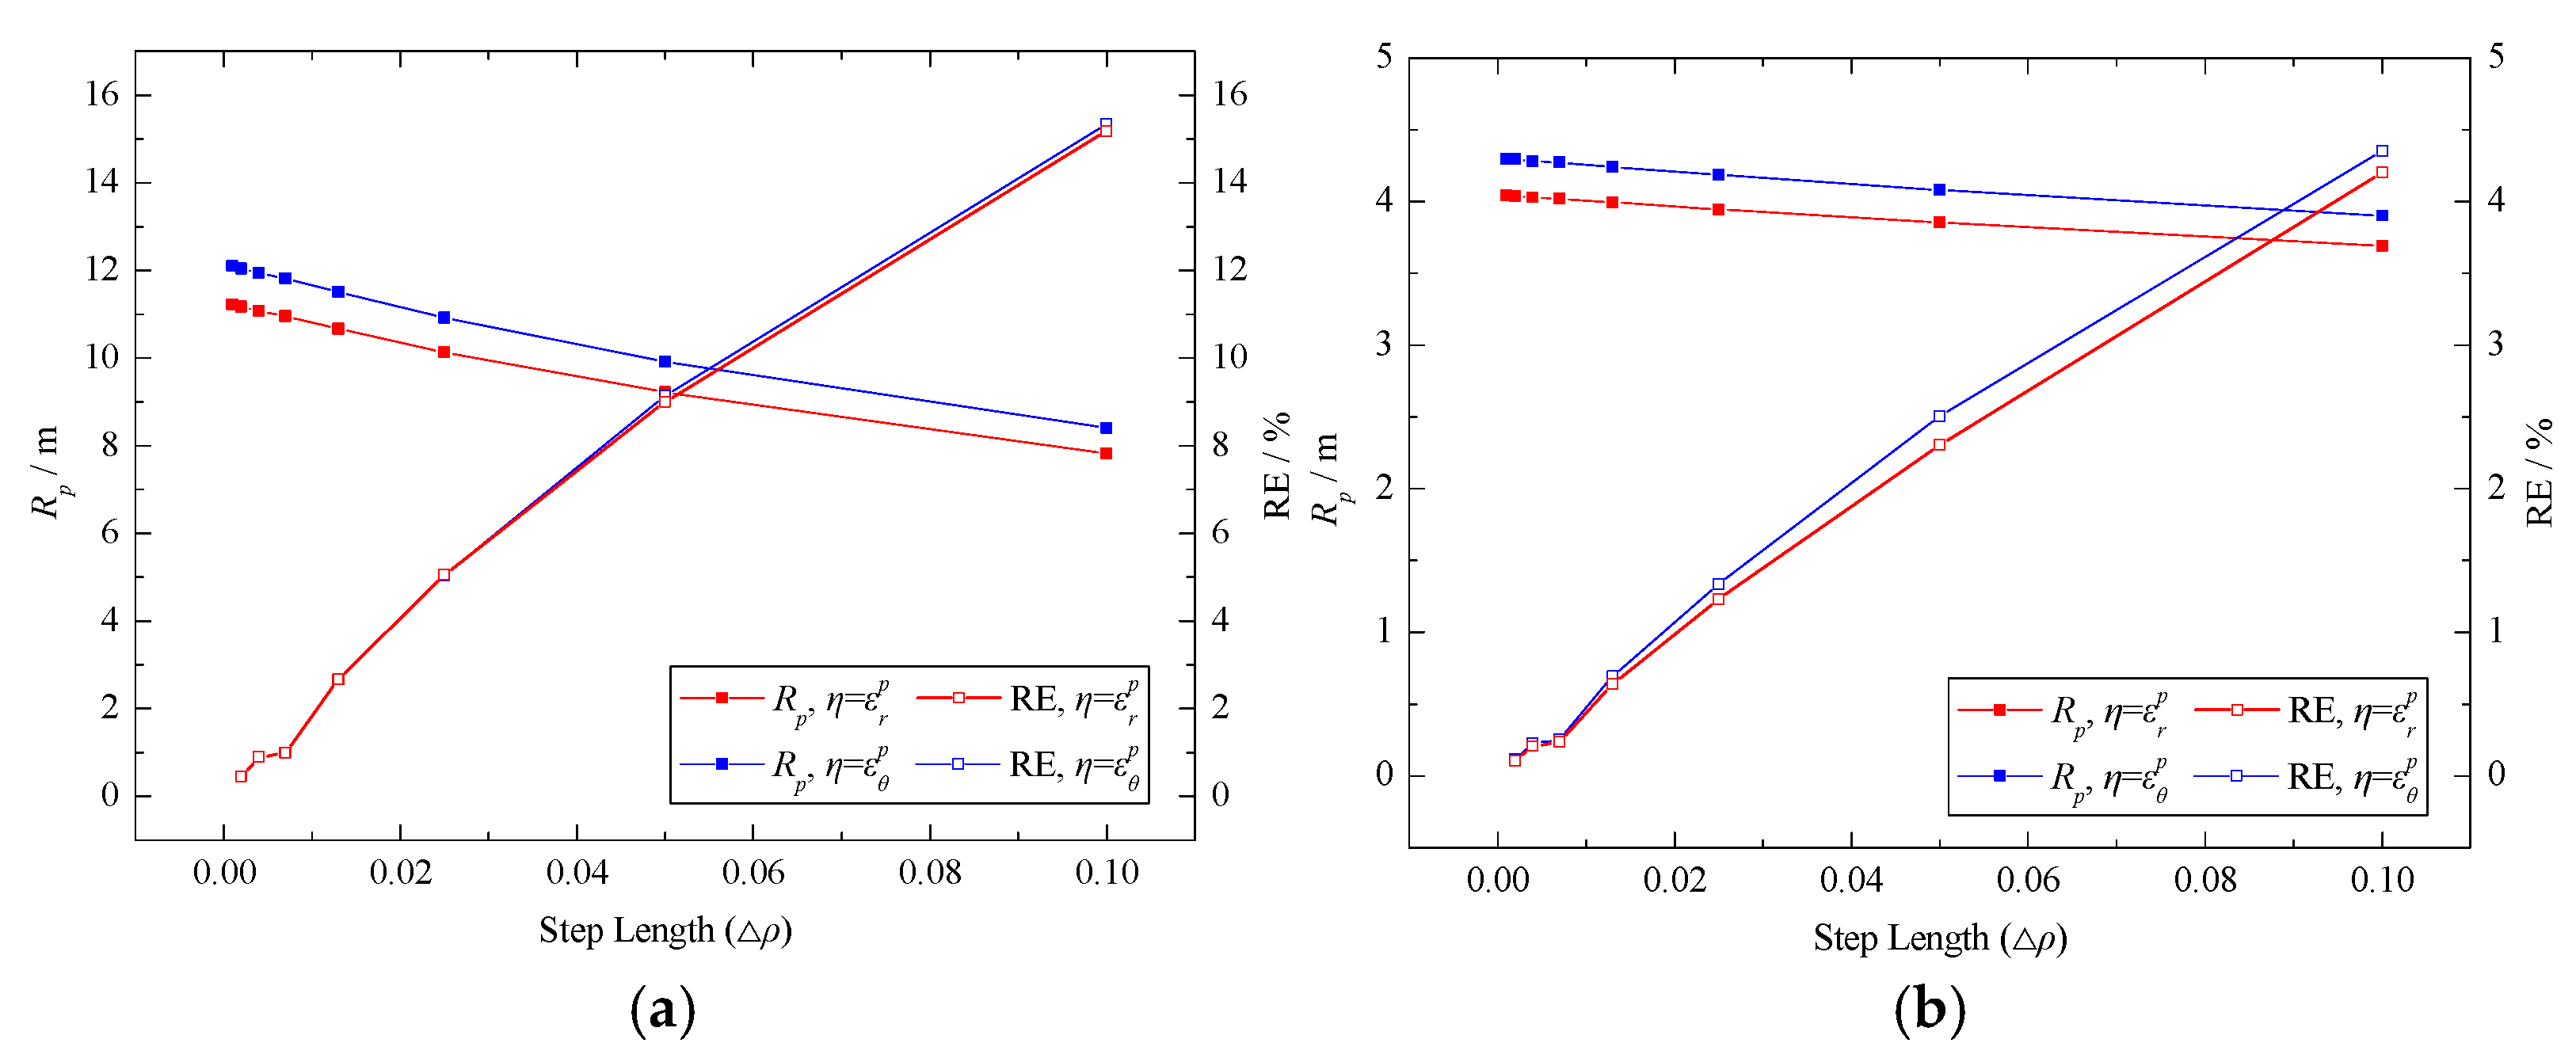
Figure 5, we analyzed the step length sensitivity of numerical algorithms employing either the maximum or minimum plastic principal strain as the softening coefficient using the relative error between adjacent step sizes in plastic zone radius calculations as an indicator. The calculated plastic zone radii and their relative errors under different conditions are shown in
Figure 9.
As illustrated in
Figure 9, for the Mohr–Coulomb yield criterion, the relative error of the plastic zone radius calculated from adjacent step lengths decreases from a maximum of 15.3% to a minimum of 0.4% as the step length geometrically reduced from 0.100 to 0.001 under different softening coefficient conditions, and this range decreases from 4.3% to 0.1% for the generalized Hoek–Brown yield criterion. Additionally, when the step length exceeds 0.007, the relative error of the plastic zone radius changes rapidly, indicating that the proposed algorithm’s results are highly sensitive to step length variations in this range. Conversely, when the step length is below 0.007, the relative error changes gradually, demonstrating insensitivity to step length variations in this regime. Based on these findings, we recommend the adoption of a step length smaller than 0.01 when using the proposed algorithm for analysis. In this range, the results are less affected by step size variations, ensuring greater reliability.
7. Impact of the Softening Coefficient on the Circular Excavation Surrounding Rock Behavior
Based on the mechanical properties of granite at a depth of 1000 m (uniaxial compressive strength: 102.5 MPa; elastic modulus: 70.8 GPa; Poisson’s ratio: 0.29), in this study, we adopted a peak GSI (GSI
p) of 60 to meet the analytical requirements. The residual GSI (GSI
r) was determined as 40 using Alejano et al.’s [
5] calculation method, and the rock mass parameters for both peak and residual states were calculated via Hoek et al.’s methodology [
20], employing a material constant (m
i) of 30 and a disturbance coefficient (D) of 0.8.
We employed the proposed self-similarity algorithm based on the generalized Hoek–Brown criterion under a hydrostatic pressure condition of 32 MPa with a 3.75 m excavation radius and zero support pressure (
pi = 0 MPa) to investigate how softening coefficients affect the deformation and failure of circular excavation surrounding rock. Utilizing the maximum plastic principal strain as the representative softening coefficient (with a shear dilation angle (ψ) of 0°), we used the proposed algorithm to calculate the radial stress (
σr), tangential stress (
σθ), and radial displacement (
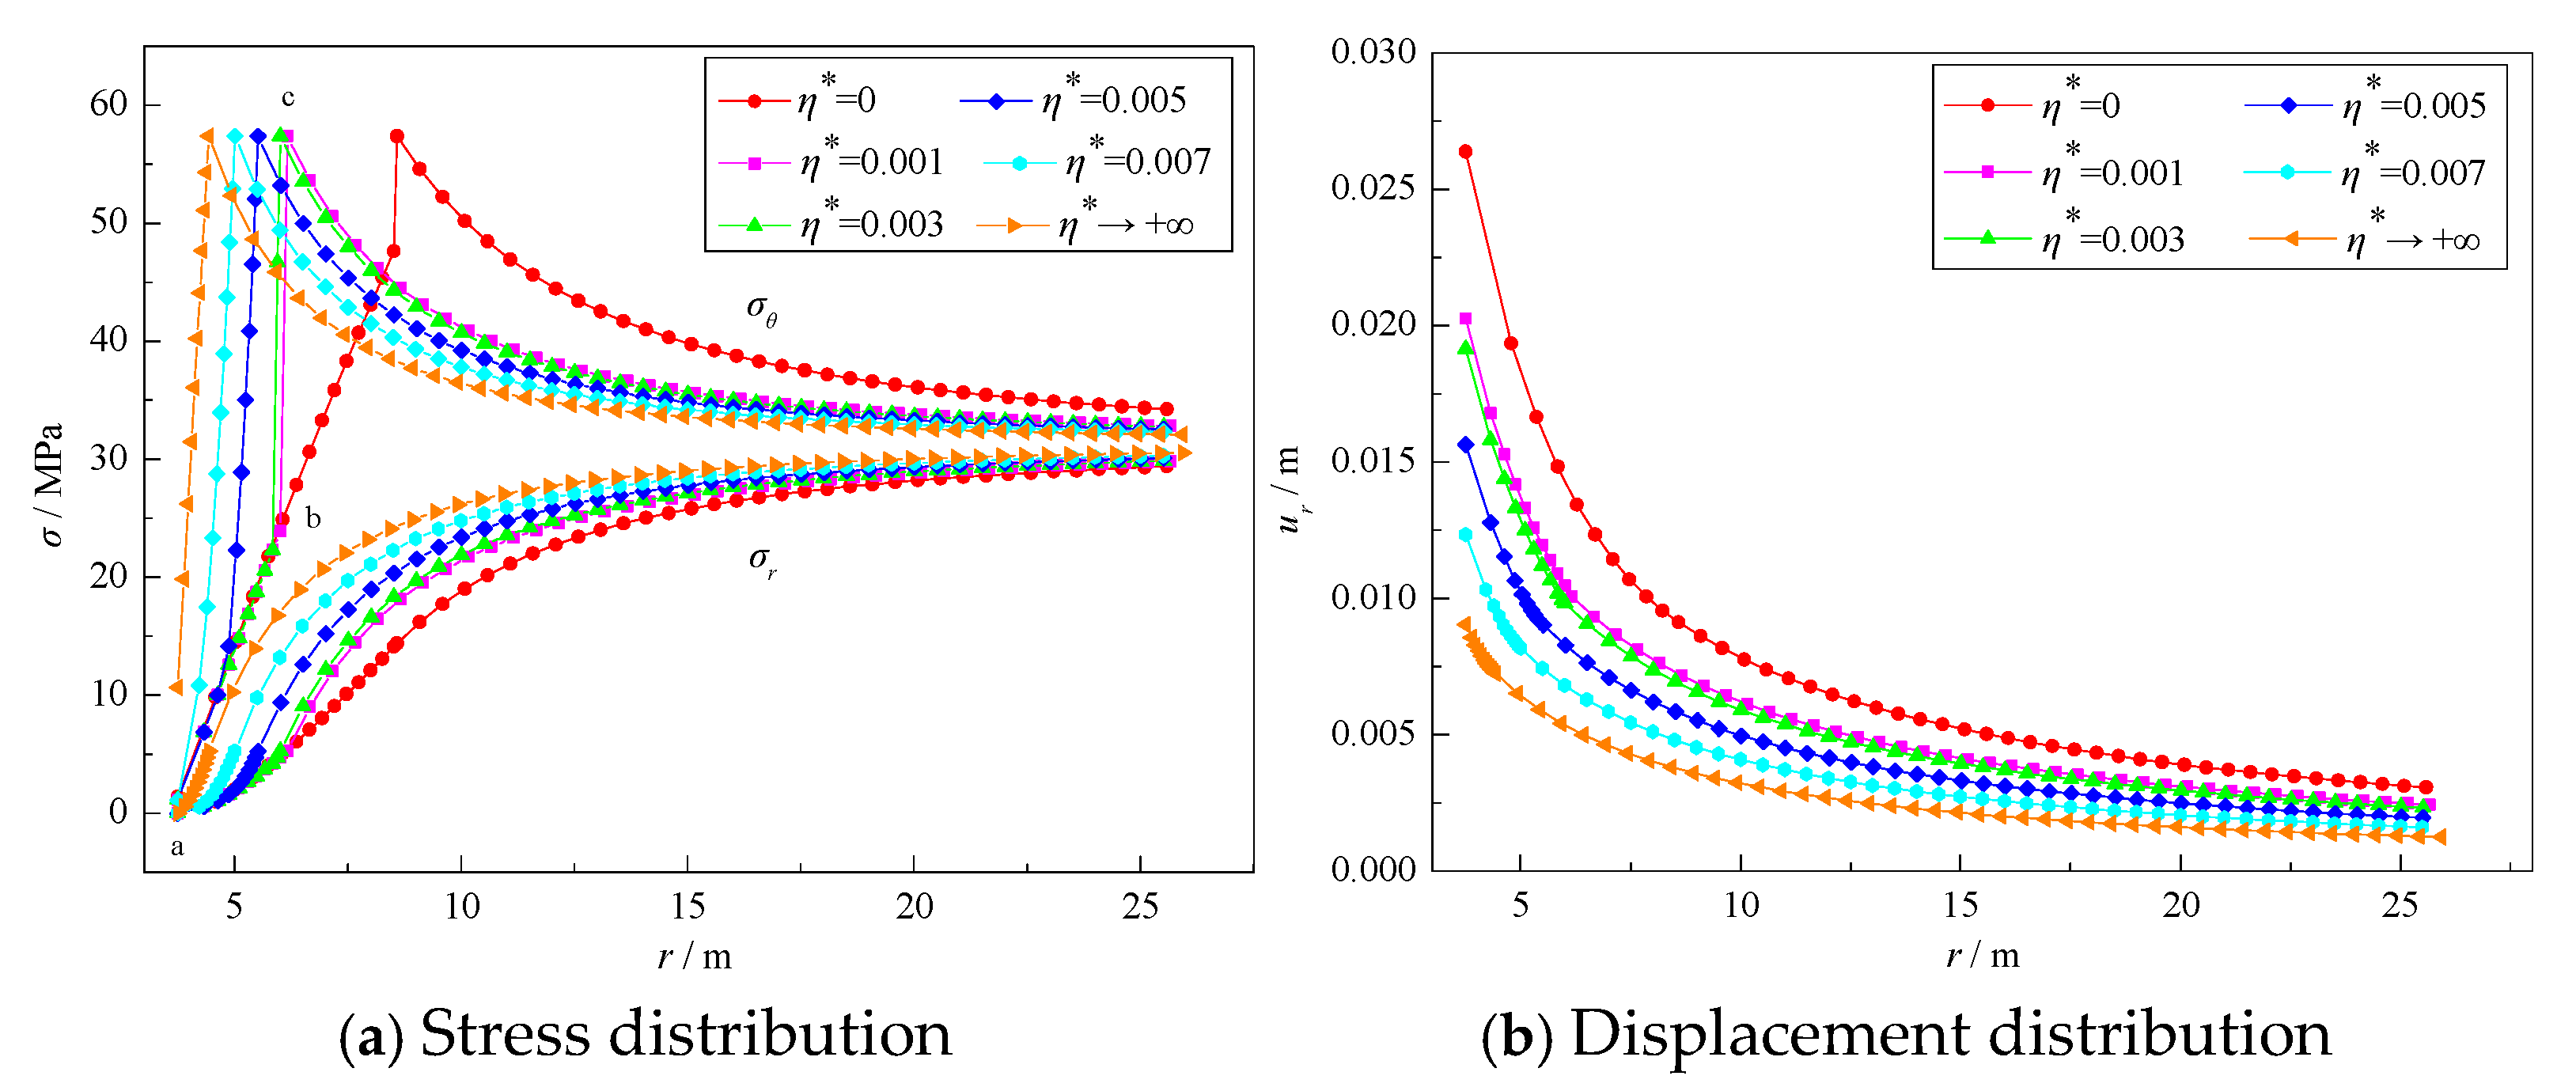
ur) distributions under varying softening conditions. The resulting analytical solutions are presented in
Figure 10.
Figure 10a illustrates the
σθ around the circular excavation using
η* = 0.001. The abscissa markers a, b, and c indicate the excavation, plastic residual zone, and plastic zone radius, respectively. Section ab represents the plastic residual zone, section bc represents the strain-softening zone, and section ac, which is composed of sections ab and bc, represents the entire plastic zone. In some cases, the plastic zone is only composed of the strain-softening zone, without the plastic residual zone.
Figure 10a demonstrates that, with increasing
η*, both the plastic and residual zones gradually diminish, while the maximum
σθ progressively approaches the excavation boundary of the circular excavation. Additionally, higher
η* values correspond to elevated
σr values at the same positions.
Figure 10b demonstrates that
ur values at the same positions progressively decrease with increasing
η*. Furthermore, according to the analysis, the stress, deformation, and failure distributions in the strain-softening surrounding rock exhibit transitional behavior, occupying an intermediate position between elastic–brittle–plastic (
η* = 0) and elastic–perfectly plastic (
η*→+∞) rock masses.
The proposed numerical algorithm based on the generalized Hoek–Brown yield criterion was used to calculate the
σr,
σθ,
ur, and
η distributions around the circular excavation for different types of softening coefficients (
,
, and
γp) and their critical values, with GSI
p = 70, GSI
r = 50,
ψp = 20°,
ψr = 5°, and
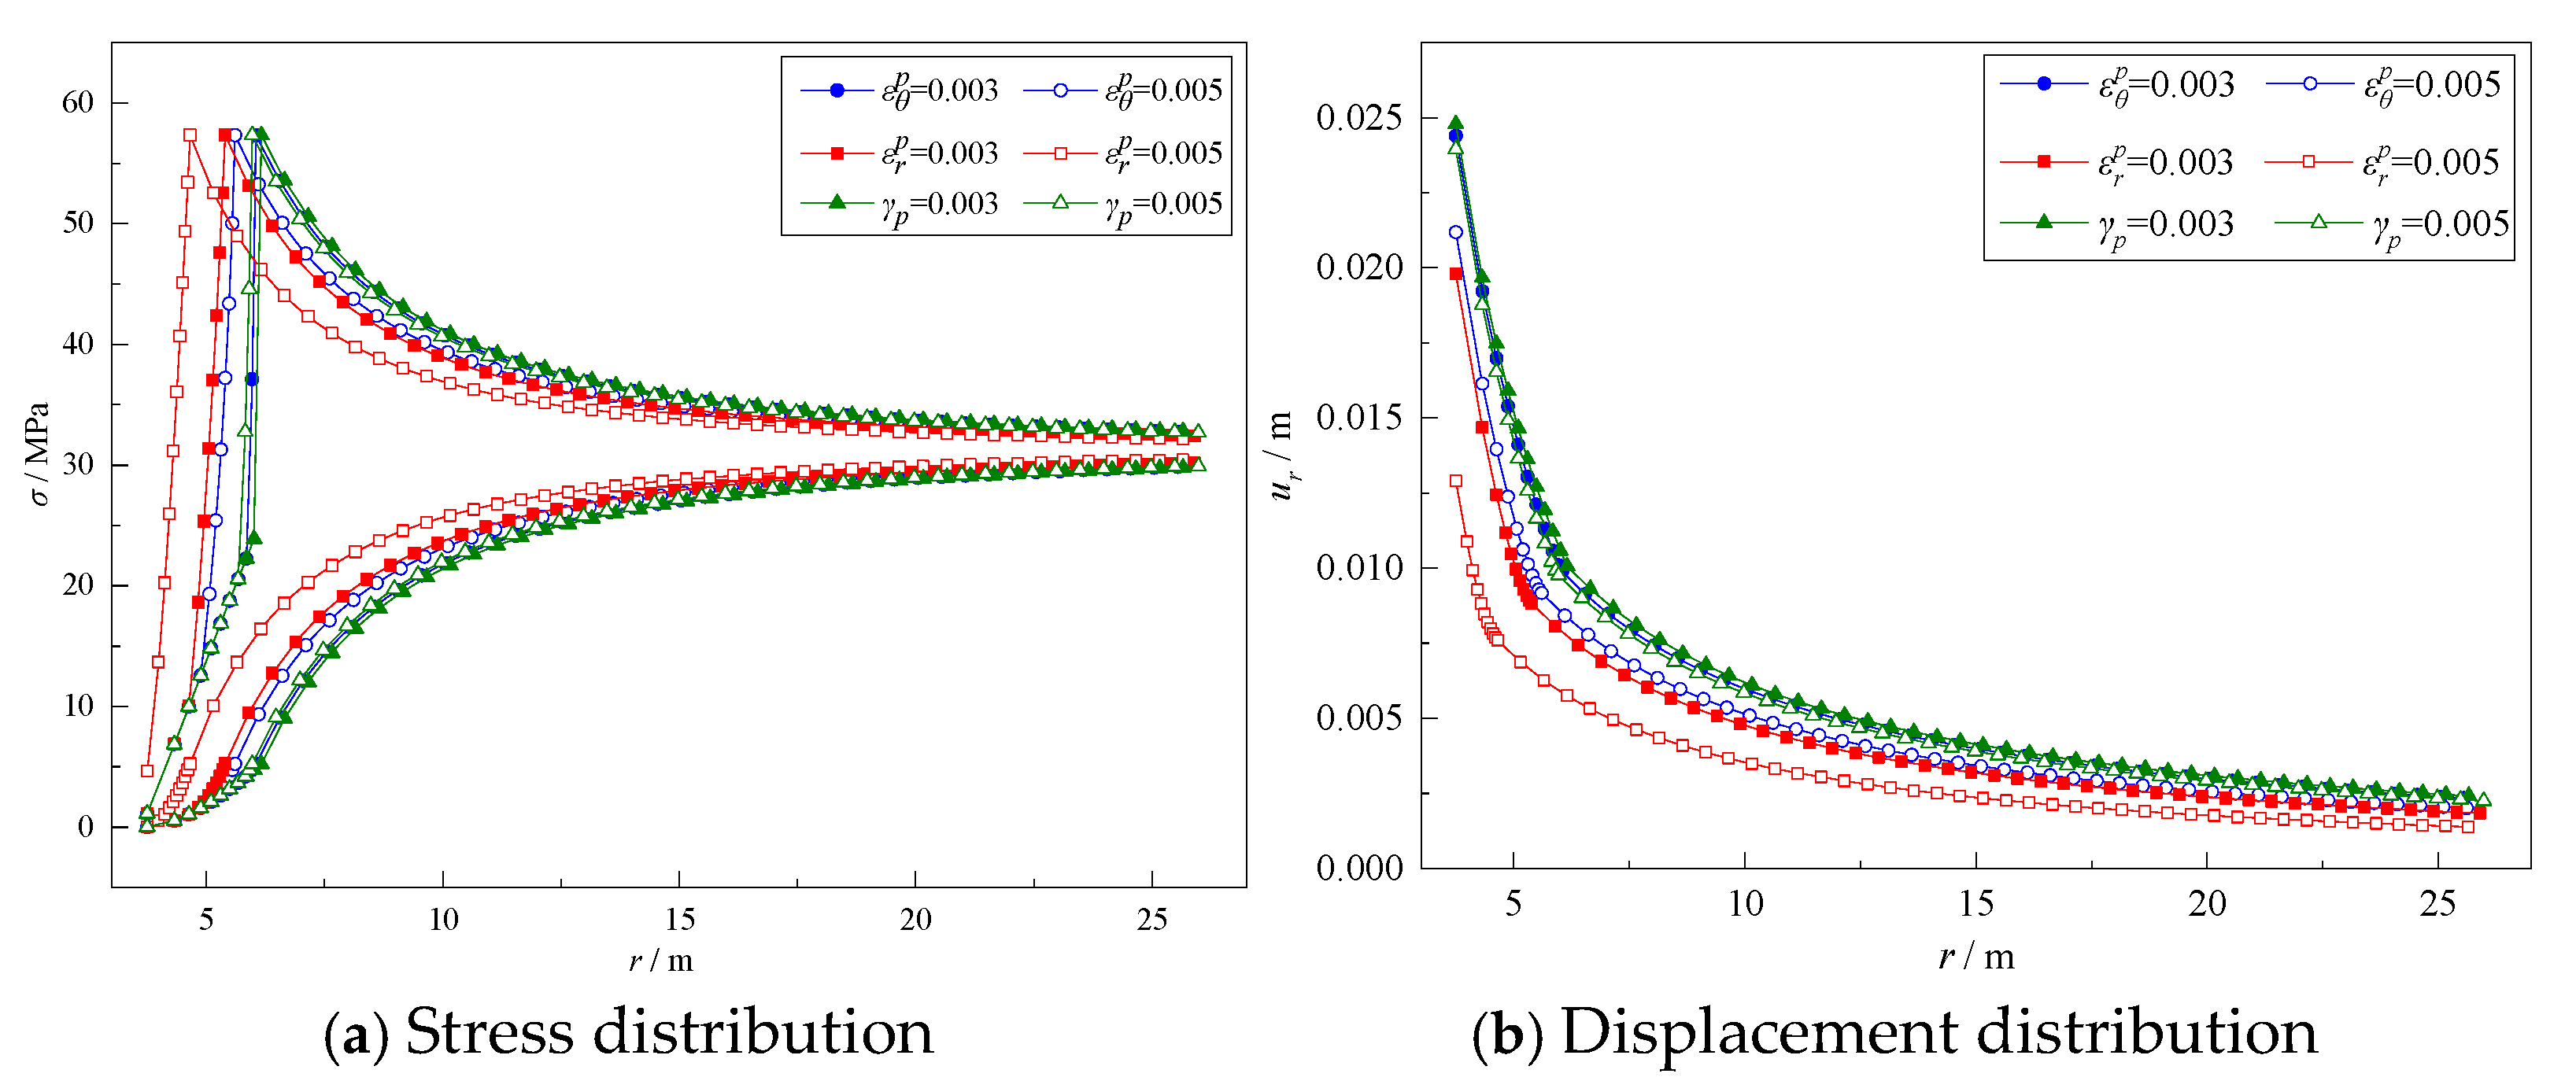
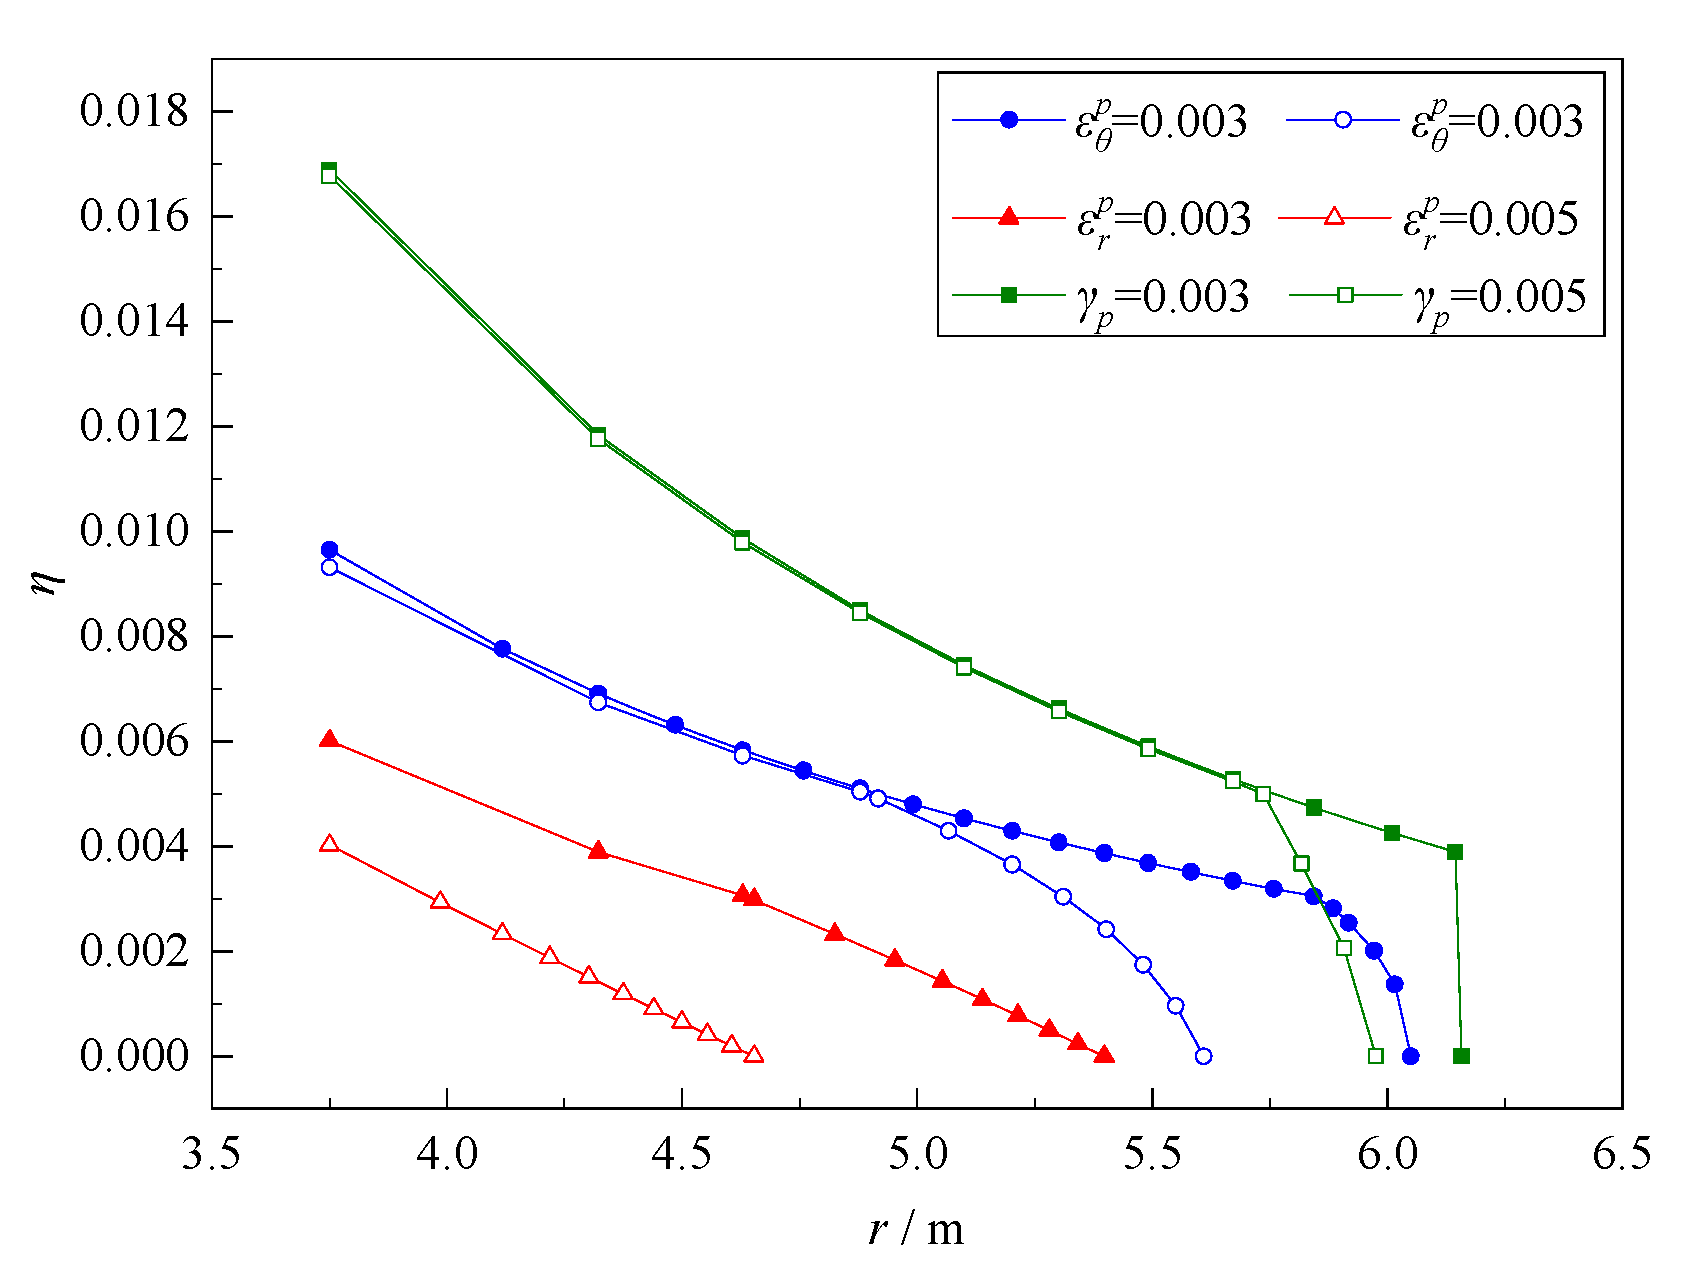
pi = 0 MPa, as illustrated in
Figure 11 and
Figure 12.
In the plane strain analysis of circular excavations, the softening coefficient essentially represents the absolute values of the plastic principal and plastic shear strains. Under constant initial rock stress conditions, as the excavation proceeds and stress redistribution occurs, the damage in the surrounding rock gradually develops and the absolute values of all plastic strains progressively increase. As shown in
Figure 12, the closer to the excavation boundary, the greater the softening coefficient (i.e., the plastic strain absolute value) of the surrounding rock, and vice versa. When the distance from the excavation boundary is great enough to reach the elastic zone of the surrounding rock, where no plastic deformation has occurred, the plastic strain is zero and, thus, the softening coefficient is also zero.
As illustrated in
Figure 12, the absolute values of the various softening coefficients around the circular excavation exhibit the following order at the same positions:
γp >
>
. When combined with Equation (4), this demonstrates that the strength parameters of the rock mass around the circular excavation follow the order ω(
) > ω(
) > ω(
γp).Moreover, based on
Figure 11a, the plastic zone radius (
Rp) obeys the order
Rp(
γp) >
Rp(
) >
Rp(
), indicating that when employing the softening coefficient
, the peak
σθ value occurs nearest to the excavation boundary, whereas using
γp results in the most distant position from the excavation boundary.
The distribution of
σr around the circular excavation exhibits a consistent trend across different softening coefficients and their critical values, following the sequence
σr(
) >
σr(
) >
σr(
γp) at the same positions. As illustrated in
Figure 10b, the distribution of
ur around the circular excavation exhibits an inverse relationship with the rock strength—higher overall strength corresponds to smaller
ur. Under the same conditions, the magnitude of
ur presents a consistent order across the softening types at the same positions:
ur(
γp) >
ur(
) >
ur(
).
The
and
around a circular excavation have the following quantitative relationship:
When ψ = 0 (resulting in Kψ = 1), the absolute values of and become equal, thereby eliminating any differential requirement for softening coefficient selection between these two strain components. The differential effects of various softening coefficients on the mechanical response of circular excavation surrounding rock fundamentally stem from variations in the absolute values of these softening coefficients. At the same positions, the distinct magnitudes of the softening coefficients alter the mechanical parameters of the in situ rock mass, thereby generating corresponding differences in the stress, displacement, and failure distributions around the circular excavation.
8. Discussion
In this paper, we propose an extended algorithm for the self-similarity numerical analysis of the deformation and failure of circular excavation surrounding rock, utilizing several common types of softening coefficients. The algorithm was developed on the basis of the basic parameter degradation model, where the post-peak mechanical parameters of the rock surrounding a circular excavation linearly decay with the softening coefficient. This algorithm facilitates stability analysis and supports designs for tunnels and shafts in rock engineering applications, while also serving as a validation tool for the development of comparable analytical methods or simulation software.
The extended algorithm follows the assumptions of continuity, uniformity, and isotropy of the rock mass in elastoplastic mechanics, as well as the plane strain assumption, and does not consider the influence of complex construction conditions, such as blasting vibrations. Therefore, in engineering applications, the extended algorithm is only applicable for preliminary analysis and design, and its computational results still require verification through methods such as three-dimensional numerical simulation and engineering monitoring. The post-peak mechanical properties of rock masses typically exhibit nonlinear degradation with the softening coefficient, where complete stress–strain curves can be acquired via rock mechanics testing or numerical modeling, allowing for suitable softening coefficient selection and realistic degradation model establishment for post-peak parameters. Furthermore, following the self-similarity numerical algorithm framework presented in this paper, an enhanced and dependable self-similarity numerical method can be developed to analyze the deformation and failure around circular excavations.
In actual rock engineering, the softening types of surrounding rock are complex and diverse. In addition to the dominant single strain-softening types such as tensile failure, compressive failure, and shear failure, the surrounding rock often exhibits a multi-mechanism coupling mode combining the aforementioned single strain-softening types. Under such circumstances, the adoption of dual-parameter or multi-parameter softening coefficients is advisable, as well as the proposal and development of corresponding self-similarity numerical algorithms.
9. Conclusions
In this paper, we proposed a self-similarity numerical algorithm for modeling the deformation and failure of surrounding rock in circular excavations with multiple types of softening coefficients and systematically explored the influence of the softening coefficient on the stress, deformation, and failure around a circular excavation. The main conclusions are as follows:
(1) An extended self-similar numerical analytical algorithm for the stability of rock surrounding circular openings was presented. The algorithm employs the Mohr–Coulomb yield criterion and the generalized Hoek–Brown yield criterion and extends a previous approach—using only the plastic shear strain as the softening coefficient—to cases where the maximum and minimum plastic principal strains are also used as softening coefficients.
(2) Numerical simulations were conducted using FLAC3D to validate the proposed extended self-similarity algorithm. According to the results, under different softening coefficients and yield criteria, the results of numerical simulations for the stress and displacement distributions around the circular excavation and those obtained with the extended self-similarity algorithm are in basic agreement. Furthermore, the maximum relative error in the plastic zone radius calculations between the two methods under different cases was only 3.01%, preliminarily verifying the accuracy of the extended self-similarity numerical algorithm.
(3) Integrating acoustic wave velocity test results for the plastic zone around the new main shaft at Xincheng Gold Mine to validate the proposed algorithm, we found that the maximum relative error between the plastic zone radius measured in the acoustic wave velocity test and that calculated via the extended self-similarity algorithm under different softening coefficients and yield criteria was only 15.6%, further verifying the accuracy and reliability of the proposed extended self-similarity algorithm.
(4) We conducted a comparison between the proposed extended self-similarity numerical algorithm and existing similar algorithms using the acoustic wave velocity test results for the plastic zone radius of the surrounding rock of the new main shaft at Xincheng Gold Mine as a benchmark. Under varying softening coefficients and yield criteria, the maximum relative errors in the plastic zone radius calculations between the two algorithms were 15.6% (proposed) and 29% (existing). The proposed extended self-similar algorithm showed significantly smaller errors, confirming its superior accuracy over existing methods.
(5) When the maximum plastic principal strain was used as the softening coefficient, the relative errors in the calculated plastic zone radius of the new main shaft under the same yield criterion were the smallest for all algorithms—8.9% and 1.7% for the extended self-similar algorithm, compared to 29% and 23% for the existing algorithms—indicating that selecting the maximum plastic principal strain as the softening coefficient is appropriate for this deep engineering project (a kilometer-deep vertical shaft). This result is consistent with the method for selecting the softening coefficient type presented in
Section 2.1 of this paper and further verifies that the proposed extended self-similarity algorithm is more comprehensive and accurate compared to existing algorithms.
(6) The results of the proposed extended self-similarity algorithm are highly sensitive to step length variations when the step size exceeds approximately 0.01. Therefore, a maximal step length of 0.01 is recommended; within this range, the algorithm exhibits minimal sensitivity to step length changes, thus yielding more reliable calculation results.
(7) The variations in the stress, deformation, and failure distributions around a circular excavation under different softening coefficients result from the distinct distributions of the absolute values of the softening coefficients within the plastic zone. These differences at the same position lead to corresponding variations in the rock’s mechanical properties which, in turn, cause distinct stress, deformation, and failure distributions around the circular excavation.
Author Contributions
Conceptualization, Y.L. and X.Z.; methodology, Y.L.; software, Y.L.; validation, Y.L. and X.Z.; formal analysis, Y.L.; investigation, Y.L. and X.Z.; resources, X.Z.; data curation, Y.L.; writing—original draft preparation, Y.L.; writing—review and editing, Y.L., J.Z., Y.Z. and C.L.; visualization, Y.L.; supervision, X.Z.; project administration, X.Z.; funding acquisition, X.Z., J.Z. and C.L. All authors have read and agreed to the published version of the manuscript.
Funding
This research was funded by the Key Program of the National Natural Science Foundation of China (52130403), the Liaoning Provincial Central Leading Local Science and Technology Development Special Project (2023JH6/100100050), Key Project of Chinese Ministry of Education (N2301027), the National Natural Science Foundation of China (52208384, 52474026), the State Key Laboratory of Precision Blasting and Hubei Key Laboratory of Blasting Engineering, Jianghan University (PBSKL2022C05) and the China Postdoctoral Science Foundation (2023TQ0024).
Institutional Review Board Statement
Not applicable.
Informed Consent Statement
Not applicable.
Data Availability Statement
The data is availability on request.
Conflicts of Interest
The authors declare no conflicts of interest.
Appendix A. The Detailed Calculation Procedure of Self-Similarity Numerical Algorithm
Table A1.
Self-similarity numerical calculation procedure using Mohr-Coulomb yield criterion.
Table A1.
Self-similarity numerical calculation procedure using Mohr-Coulomb yield criterion.
| Calculation Contents | Calculation Procedure |
|---|
| Preliminary calculation for the first ring | , , |
|
: ,
: , |
|
|
: ;
: ; |
|
| Step length | |
| Softening coefficient | Equations (1)–(3) |
| Update strength parameters | Equation (4) |
| Equation (34), Equations (36)–(40) |
| Equation (41) |
| Coefficient A | Equation (29) |
| Coefficient B | Equations (16)–(26), select the corresponding coefficient B calculation formula based on the type of softening coefficient |
| Equations (43)–(51) |
| Equation (52) |
| Equation (53) |
| Equation (54) |
| Equation (55) |
| Check with | If , then j = j + 1, and proceed to the next ring, otherwise, stop iteration and perform the following calculation. |
| |
| |
| |
| Calculation of real values of field quantities | , , , |
| The end of calculation | Data organization and analysis |
Table A2.
Self-similarity numerical calculation procedure using Hoek-Brown strength criterion.
Table A2.
Self-similarity numerical calculation procedure using Hoek-Brown strength criterion.
| Calculation Contents | Calculation Procedure |
|---|
| Preliminary calculation for the first ring | ; ; ; |
| Numerical analysis , solve |
: ;
: ; |
|
|
: ;
: ; |
|
| Step length | |
| Softening coefficient | Equations (1)–(3) |
| Update strength parameters | Equation (4) |
| Equations (35)–(40) |
| Equation (42) |
| Coefficient A | Equation (29) |
| Coefficient B | Equations (16)–(25), Equations (27) and (28), select the corresponding coefficient B calculation formula based on the type of softening coefficient |
| Equations (43)–(51) |
| Equations (43)–(51) |
| Equation (52) |
| Equation (53) |
| Equation (54) |
| Check with | If , then j = j + 1, and proceed to the next ring, otherwise, stop iteration and perform the following calculation. |
| |
| |
| |
| Calculation of real values of field quantities | , , , |
| The end of calculation | Data organization and analysis |
References
- Zhao, X.D.; Li, Y.Y.; Shi, J.Y.; Qu, Q.D. A numerical algorithm for ground reaction curves of circular excavations in strain-softening rock masses satisfying the generalized Hoek-Brown criterion. Tunn. Undergr. Space Technol. 2003, 134, 104925. [Google Scholar] [CrossRef]
- Detournay, E.; Fairhurst, C. Two-dimensional elastoplastic analysis of a long, cylindrical cavity under non-hydrostatic loading. In International Journal of Rock Mechanics and Mining Sciences & Geomechanics Abstracts; Elsevier: Amsterdam, The Netherlands, 1987; Volume 24, pp. 197–211. [Google Scholar]
- Carranza-Torres, C.M. Self-Similarity Analysis of the Elasto-Plastic Response of Underground Excavations in Rock and Effects of Practical Variables. Doctoral Dissertation, University of Minnesota, Minnesota, MI, USA, 1998. [Google Scholar]
- Carranza-Torres, C.; Fairhurst, C. The elasto-plastic response of underground excavations in rock masses that satisfy the Hoek–Brown failure criterion. Int. J. Rock Mech. Min. Sci. 1999, 36, 777–809. [Google Scholar] [CrossRef]
- Alejano, L.R.; Rodríguez-Dono, A.; Veiga, M. Plastic radii and longitudinal deformation profiles of tunnels excavated in strain-softening rock masses. Tunn. Undergr. Space Technol. 2012, 30, 169–182. [Google Scholar] [CrossRef]
- Carranza-Torres, C. Elasto-plastic solution of tunnel problems using the generalized form of the Hoek-Brown failure criterion. Int. J. Rock Mech. Min. Sci. 2004, 41, 629–639. [Google Scholar] [CrossRef]
- Chen, X.H.; Zhang, D.L.; Sun, Z.Y.; Chen, W.B. Ground reaction curves for strain-softening rock masses with ground reinforcement based on unified strength criterion. J. Cent. South Univ. 2025, 32, 3383–3404. [Google Scholar] [CrossRef]
- Jankowski, A.F. On the origin of stress-strain relationships, the evaluation of softening coefficients, and mechanistic models for work hardening. Mater. Sci. Eng. 2023, 882, 145472. [Google Scholar] [CrossRef]
- Guan, Z.; Jiang, Y.; Tanabasi, Y. Ground reaction analyses in conventional tunnelling excavation. Tunn. Undergr. Space Technol. 2007, 22, 230–237. [Google Scholar] [CrossRef]
- Park, K.H.; Tontavanich, B.; Lee, J.G. A simple procedure for ground response curve of circular tunnel in elastic-strain softening rock masses. Tunn. Undergr. Space Technol. 2008, 23, 151–159. [Google Scholar] [CrossRef]
- Guo, C.; Fan, L.; Han, K.; Li, P.; Zhang, M. Progressive failure analysis of shallow circular tunnel based on the functional catastrophe theory considering strain softening of surrounding rock mass. Tunn. Undergr. Space Technol. 2023, 131, 104799. [Google Scholar] [CrossRef]
- Zobeiry, N.; Vaziri, R.; Poursartip, A. Characterization of strain-softening behavior and failure mechanisms of composites under tension and compression. Compos. Part A Appl. Sci. Manuf. 2015, 68, 29–41. [Google Scholar] [CrossRef]
- Yang, P.; Zhang, S.; Liu, C. Study on Shear Failure Process and Zonal Disintegration Mechanism of Roadway under High Ground Stress: A Numerical Simulation via a Strain-Softening Plastic Model and the Discrete Element Method. Appl. Sci. 2024, 14, 4106. [Google Scholar] [CrossRef]
- Qiu, K.; Li, S.C.; Liu, Z.Z.; Yuan, M.; Zhao, S.S.; Wan, Z. An elastoplastic solution for lined hydrogen storage caverns during excavation and operation phases considering strain softening and dilatancy. Int. J. Rock Mech. Min. Sci. 2024, 183, 105949. [Google Scholar] [CrossRef]
- Aksoy, C.O.; Uyar, G.G.; Ozcelik, Y. Comparison of Hoek-Brown and Mohr-Coulomb failure criterion for deep open coal mine slope stability. Struct. Eng. Mech. 2016, 60, 809–828. [Google Scholar] [CrossRef]
- Lee, Y.K.; Pietruszczak, S. A new numerical procedure for elasto-plastic analysis of a circular excavation excavated in a strain-softening rock mass. Tunn. Undergr. Space Technol. 2008, 23, 588–599. [Google Scholar] [CrossRef]
- Press, W.H. Numerical Recipes in Fortran; Cambridge University Press: Cambridge, MA, USA, 1992; pp. 355–361. [Google Scholar]
- Dormand, J.R.; Prince, P.J. A family of embedded Runge-Kutta formulae. J. Comput. Appl. Math. 1980, 6, 19–26. [Google Scholar] [CrossRef]
- Pei, F. Mechanical Properties of Rock in Deep Stratum and Analysis and Control of Shaft Surrounding Rock Stability in Shaling Gold Mine. Ph.D. Thesis, University of Science and Technology Beijing, Beijing, China, 2020; pp. 26–93. [Google Scholar]
- Hoek, E.; Carranza-Torres, C.; Corkum, B. Hoek-Brown failure criterion-2002 edition. In Proceedings of the NARMS-Tac, Seattle, WA, USA, 20–22 September 2022; pp. 18–22. [Google Scholar]
- Carranza-Torres, C.; Fairhurst, C. Application of the convergence-confinement method of tunnel design to rock masses that satisfy the Hoek-Brown failure criterion. Tunn. Undergr. Space Technol. 2000, 15, 187–213. [Google Scholar] [CrossRef]
| Disclaimer/Publisher’s Note: The statements, opinions and data contained in all publications are solely those of the individual author(s) and contributor(s) and not of MDPI and/or the editor(s). MDPI and/or the editor(s) disclaim responsibility for any injury to people or property resulting from any ideas, methods, instructions or products referred to in the content. |