1. Introduction
The railway transportation system serves as a vital component of modern transportation infrastructure, playing an indispensable role in national economic and social development. Within this system, the rail fastening system is a critical component connecting the rail to the sleeper, whose structural integrity directly determines the safety performance of the entire track system. The fastening system must not only withstand vertical, lateral, and longitudinal forces from trains but also provide sufficient elasticity to buffer dynamic impacts while maintaining precise gauge and rail inclination [
1]. Under the coupled effects of long-term high-frequency cyclic train loads and environmental factors, the fastening system faces severe challenges. During operation, a single fastener can endure impact loads reaching thousands of cycles per minute. This sustained dynamic action readily leads to various types of defects in fasteners, such as fracture, displacement, and wear [
2].
The initiation and progression of these defects can trigger a chain reaction. Firstly, damaged fasteners alter the wheel–rail contact relationship, intensifying wheel–rail dynamic interactions and accelerating the deterioration of track geometry [
3]. Secondly, fastener defects reduce the overall stiffness of the track structure, compromising train running stability and comfort. More seriously, severely damaged fasteners may directly threaten operational safety, potentially causing derailment accidents [
3]. According to statistical data, fastener system defects account for 15–20% of all railway infrastructure failures, making them one of the primary factors affecting railway operational safety [
4]. Therefore, developing rapid, intelligent, and accurate fastener defect detection technology is of great significance for ensuring the operational safety and maintenance efficiency of railway transportation systems.
Traditional fastener condition inspection primarily relies on manual visual checks, which present obvious limitations. Manual inspection is not only inefficient and labor-intensive but also susceptible to subjective factors such as inspector experience and mental state [
5]. In complex operational environments, manual inspection also poses safety risks and involves high workload intensity. The challenge is further compounded by limited maintenance windows, particularly on busy railway lines.
To overcome the limitations of manual inspection, a range of non-destructive testing technologies have been applied to defect detection in railway components. Acoustic emission monitoring technology identifies damage by collecting elastic waves released by materials under stress [
6], while vibration signal analysis technology utilizes accelerometers installed on bogies and axle boxes to collect vibration signals, identifying track defects through signal processing algorithms [
7]. While these methods demonstrate satisfactory detection performance in specific scenarios, their effectiveness remains limited for defects such as fastener loosening and displacement that generate only weak signals [
8]. Furthermore, these methods require the installation of specialized sensor equipment, resulting in high implementation costs that hinder large-scale popularization and application.
In contrast, vision-based inspection technology utilizing image acquisition and processing demonstrates unique advantages. Visual inspection methods acquire fastener images through non-contact means and automatically identify defect features using image processing algorithms, characterized by simple implementation, low cost, and high efficiency [
9]. With the rapid development of digital image technology, vision inspection systems can now capture fastener images in real-time during train operation, enabling continuous monitoring of rail fastener conditions and providing timely and reliable data support for fastener maintenance.
Early visual inspection methods primarily relied on conventional image processing techniques and machine learning algorithms. Researchers proposed various feature extraction approaches, such as directional field template matching [
10], variance projection and wavelet transform [
11], etc. These methods extracted geometric and texture features of fasteners and combined them with classifiers like Support Vector Machines [
12] and Artificial Neural Networks for condition identification. Ma et al. [
13] proposed a real-time missing fastener detection method based on curve projection template matching, achieving fastener positioning through analyzing image projection features. Liu et al. [
14] developed a novel visual inspection system for fastener region localization based on few-shot learning. Although these methods improved inspection efficiency to some extent, they still suffered from notable limitations: firstly, they were heavily reliant on handcrafted features requiring specialized prior knowledge; secondly, feature stability was poor under different track conditions and lighting environments; finally, these methods demonstrated limited generalization capability for diverse fastener defects, particularly early-stage minor defects [
15].
In recent years, the evolution of deep learning has fundamentally transformed the paradigm for automated fastener defect inspection. Moving beyond the constraints of manual feature engineering, contemporary models utilize deep convolutional neural networks (CNNs) to autonomously derive hierarchical feature representations from raw image data. This end-to-end learning framework not only circumvents the subjectivity and inefficiency of traditional approaches but also confers remarkable gains in detection accuracy and robustness when handling complex railway environments [
16]. The capacity to directly learn from pixels empowers these models to identify subtle and latent defect signatures that were previously undetectable. Demonstrating this potential, Lin et al. [
17] deployed the You Only Look Once (YOLO) v3 architecture for large-scale fastener inspection, validating its efficacy over a 20 km track segment. Concurrently, Liu et al. [
18] contributed an embedded detection system employing a cascade learning strategy to refine region proposal mechanisms within the Region-based Convolutional Neural Network (R-CNN) framework, thereby enhancing localization precision.
The landscape of deep learning-based object detection is dominated by two distinct architectural philosophies. The first, embodied by two-stage detectors such as Faster R-CNN [
19], prioritizes accuracy through a sequential “propose-then-classify” mechanism. This design generates region proposals in an initial stage before performing detailed classification and regression, yielding high precision. Its effectiveness is evidenced in diverse structural health monitoring applications: Cha et al. [
20] adapted it for multi-class damage detection in civil infrastructure, while Gibert et al. [
21] specifically targeted rail fastener inspection, reporting improved detection efficiency. Further refinements, like the work of Guo et al. [
22], introduced K-means clustering for optimal anchor box generation, addressing class imbalance in fastener datasets. However, the inherent sequential processing of these models incurs significant computational overhead, often rendering them impractical for real-time, high-throughput inspection scenarios where latency is a critical constraint [
23].
Driven by the imperative for real-time performance in railway inspection, research has decisively pivoted toward single-stage detectors. These models reconceptualize object detection as a unified, dense prediction task, directly inferring bounding boxes and class labels in a single forward pass, which substantially accelerates inference. The YOLO family, pioneered by Redmon et al. [
24], epitomizes this efficiency–accuracy balance and has become a cornerstone for industrial vision systems [
25]. Its evolution through YOLOv2 and YOLOv3 enhanced multi-scale recognition, crucial for small objects like fasteners. Subsequent advancements have systematically refined the architecture along three primary vectors: lightweighting for deployment (e.g., YOLOv3-Tiny [
26] and Track Line Multi-target Defect Detection Network (TLMDDNet) [
27] for efficient railway scene analysis), enhanced feature fusion (e.g., the cost-effective YOLOv4 [
28] and YOLOv4-FPM for cluttered backgrounds [
29]), and the integration of attention mechanisms (e.g., attention-augmented YOLOv5 [
30] and YOLOv5 with Swin Transformer heads [
31]) to focus on salient defects. This trajectory highlights a concerted effort to tailor general-purpose detection frameworks to the specific challenges of automated railway infrastructure inspection. Aiming at the detection challenges posed by the diversity of railway fastening types and the coexistence of multi-label defects, recent research has proposed a dedicated task-decoupling framework. For instance, Lv et al. [
32] introduced a two-stage detection method based on a type-guided expert model (TGEM-FDD). This framework follows the paradigm of “first identifying the type, then diagnosing the defects.” In the first stage, an improved Yolov8 with Deepstar Block, SPPF-Attention, Dysample (YOLOv8s-DSD) model is employed for fastening localization and type identification. In the second stage, based on the identified type, a pre-trained specialized multi-label classification “expert model” is dynamically invoked to complete defect diagnosis. Experiments conducted on a self-constructed dataset show that the end-to-end system of this framework achieves a comprehensive task mean Average Precision (mAP) of 88.1%, effectively validating the feasibility of handling the heterogeneity of fastening types and the complexity of defects through task decoupling and expert model strategies.
Although the aforementioned deep learning-based object detection algorithms have demonstrated satisfactory performance in addressing “explicit” defects (such as clip fractures or missing clips), they face significant challenges when dealing with “implicit” geometric defects (such as minor clip displacements and rotations). The morphological changes in these defects are continuous and subtle, leading to inherent limitations in the traditional object detection paradigm based on bounding box classification: Firstly, models struggle to effectively perceive subtle posture anomalies from fasteners with insignificant overall appearance changes, resulting in poor detection performance. Secondly, and more critically, such methods typically only provide qualitative judgments of defects (“yes” or “no”), failing to deliver precise, quantifiable geometric parameters, such as the specific distance of displacement or the exact angle of rotation. However, in the precision maintenance operations of railway maintenance departments, these quantitative pieces of information are crucial for assessing defect severity and formulating maintenance prioritization decisions. The deficiency of existing methods in this aspect severely restricts their closed-loop application from “detection” to “precision-guided maintenance”.
Keypoint detection technology initially gained widespread application and validation in fields such as facial landmark localization and human pose estimation. In recent years, due to its ability to provide rich component-level geometric information, this technology is gradually being introduced into the field of industrial visual inspection for precise positioning and pose analysis of workpieces. Addressing the core bottleneck of “difficult detection and even more difficult quantification” of displacement and rotation defects in current fastener inspection methods, this paper innovatively proposes a quantitative detection method for fastener displacement and rotation based on keypoint detection technology. The core concept of our method lies in accurately locating pre-defined geometric keypoints on the fastener clip (such as the clip tip, bending vertex, etc.), and subsequently constructing a mathematical model for calculating deflection angles and offset distances based on the spatial topological relationships between these keypoints. This approach not only enables the qualitative identification of fastener conditions but also breakthrough provides specific numerical values of displacement and rotation angles, offering key technical support for the refined and digital maintenance of rail fastener status.
The main research work of this paper comprises the following aspects:
- (1)
Construction of a high-quality rail fastener keypoint detection dataset. This dataset provides fine-grained annotations tailored to the geometric structure and pose characteristics of fasteners, establishing a reliable data foundation for the keypoint detection task.
- (2)
Proposal of an improved fastener keypoint detection model based on YOLOv8-pose. By embedding attention mechanisms into the original network, optimizing the Spatial Pyramid Pooling Fast (SPPF) module structure, and redesigning its loss function, the model effectively enhances keypoint localization accuracy and robustness without significantly increasing model complexity.
- (3)
Design of a quantitative fastener displacement detection method based on keypoint spatial information. By analyzing the coordinates of detected keypoints and establishing a conversion relationship from pixel space to physical space, precise calculation of fastener offset distances and rotation angles is achieved.
- (4)
Execution of field experiments and comprehensive performance evaluation. The improved model was deployed in an actual track inspection environment. Through comparative analysis with baseline models and existing methods, the enhancements in accuracy and efficiency offered by the proposed method, along with its practical engineering value, were validated.
2. Materials and Methods
2.1. Image Acquisition and Dataset Construction
The rail fastener image data were collected in November 2024 from an internal railway line of an enterprise in Hengshui City, Hebei Province, China. The data acquisition was conducted using a HIKROBO MV-CL042-91GM camera, with a collection vehicle speed of approximately 10 km/h. To enhance the diversity and robustness of the dataset, the acquisition process fully accounted for practical environmental variations. Lighting conditions included direct sunlight during daytime, non-direct sunlight during daytime, and nighttime scenarios. The background environment was maintained in its original state as much as possible, without artificial intervention. A total of 160 original images capturing various damage states were obtained, with each image covering a 12 m track segment and having an original resolution of 512 × 9000 pixels. Through preliminary cropping and screening, 4000 valid images of Type II clip fasteners were selected.
To comprehensively evaluate the algorithm’s generalization capability and robustness in real-world complex scenarios, this study constructed a specialized test set incorporating different clip poses beyond the standard dataset. By manually adjusting the clips, multiple typical failure modes including loosening, deflection, and displacement were simulated, with 200 corresponding images captured and annotated with clip pose labels. This specialized validation set is specifically designed to rigorously test the algorithm’s detection performance when confronted with varying degrees and types of pose anomalies.
In this work, 4000 standard fastener images were allocated to training and validation sets in an 8:2 ratio. An additional 200 images, each annotated with pose information, formed the test set.
Table 1 outlines the composition of the test set, while
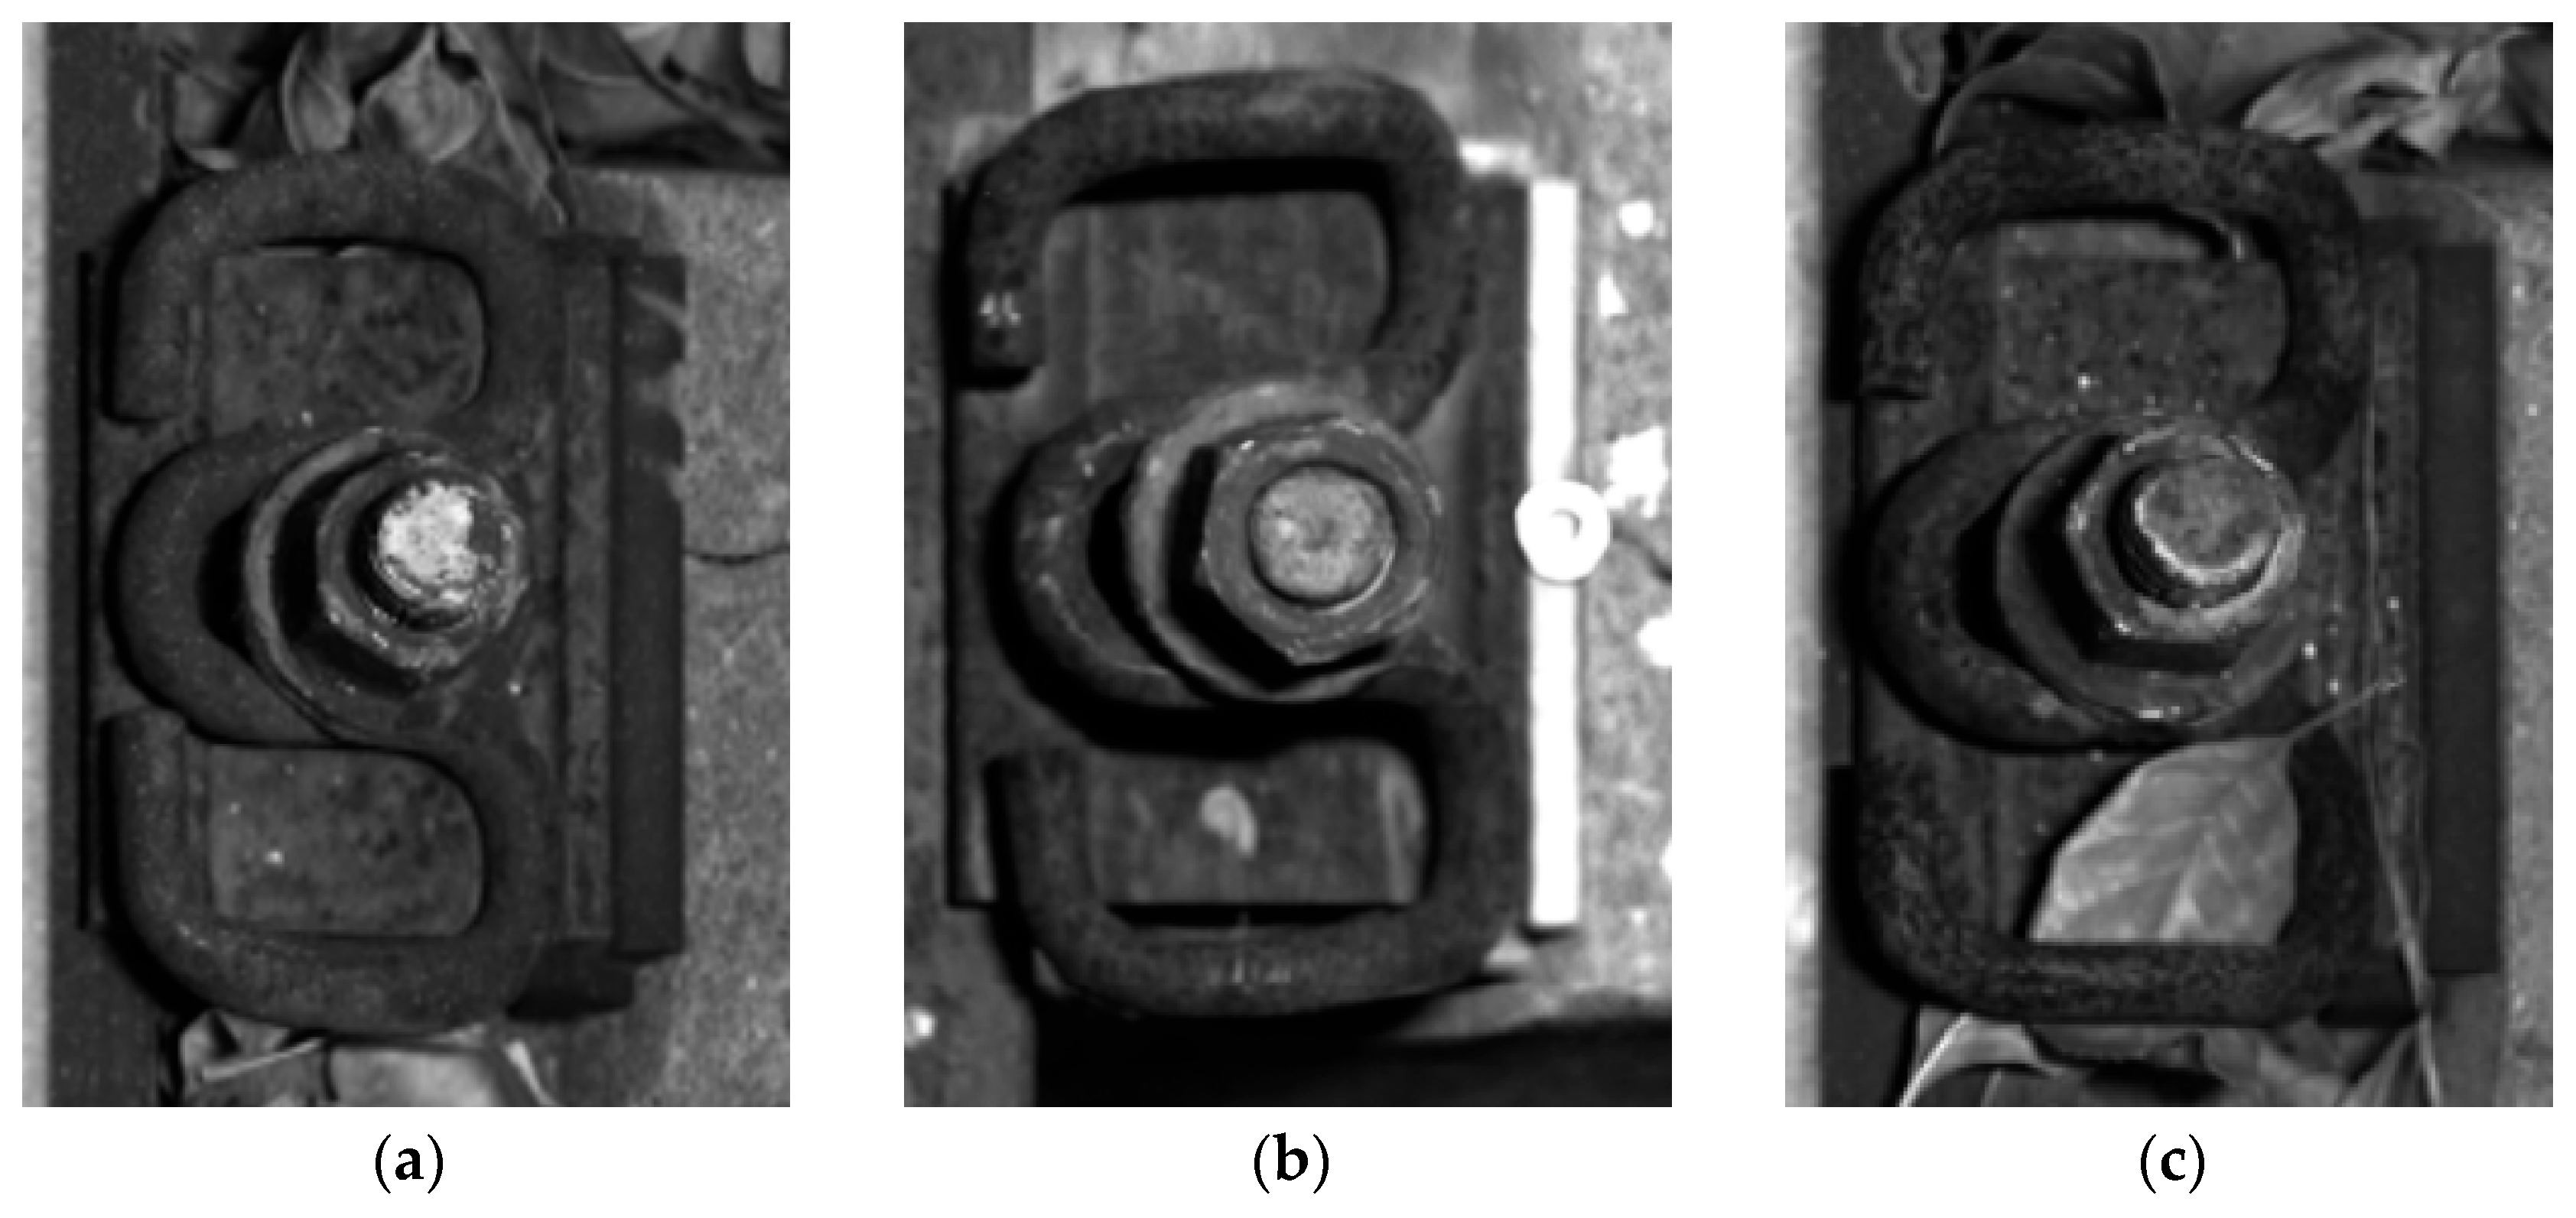
Figure 1 displays representative samples illustrating various fastener poses from the dataset. These poses are characterized by key parameters: θ denotes the deflection angle of the clip, ΔX represents the longitudinal displacement along the rail direction, and ΔY indicates the lateral displacement perpendicular to the rail.
2.2. Overall Framework
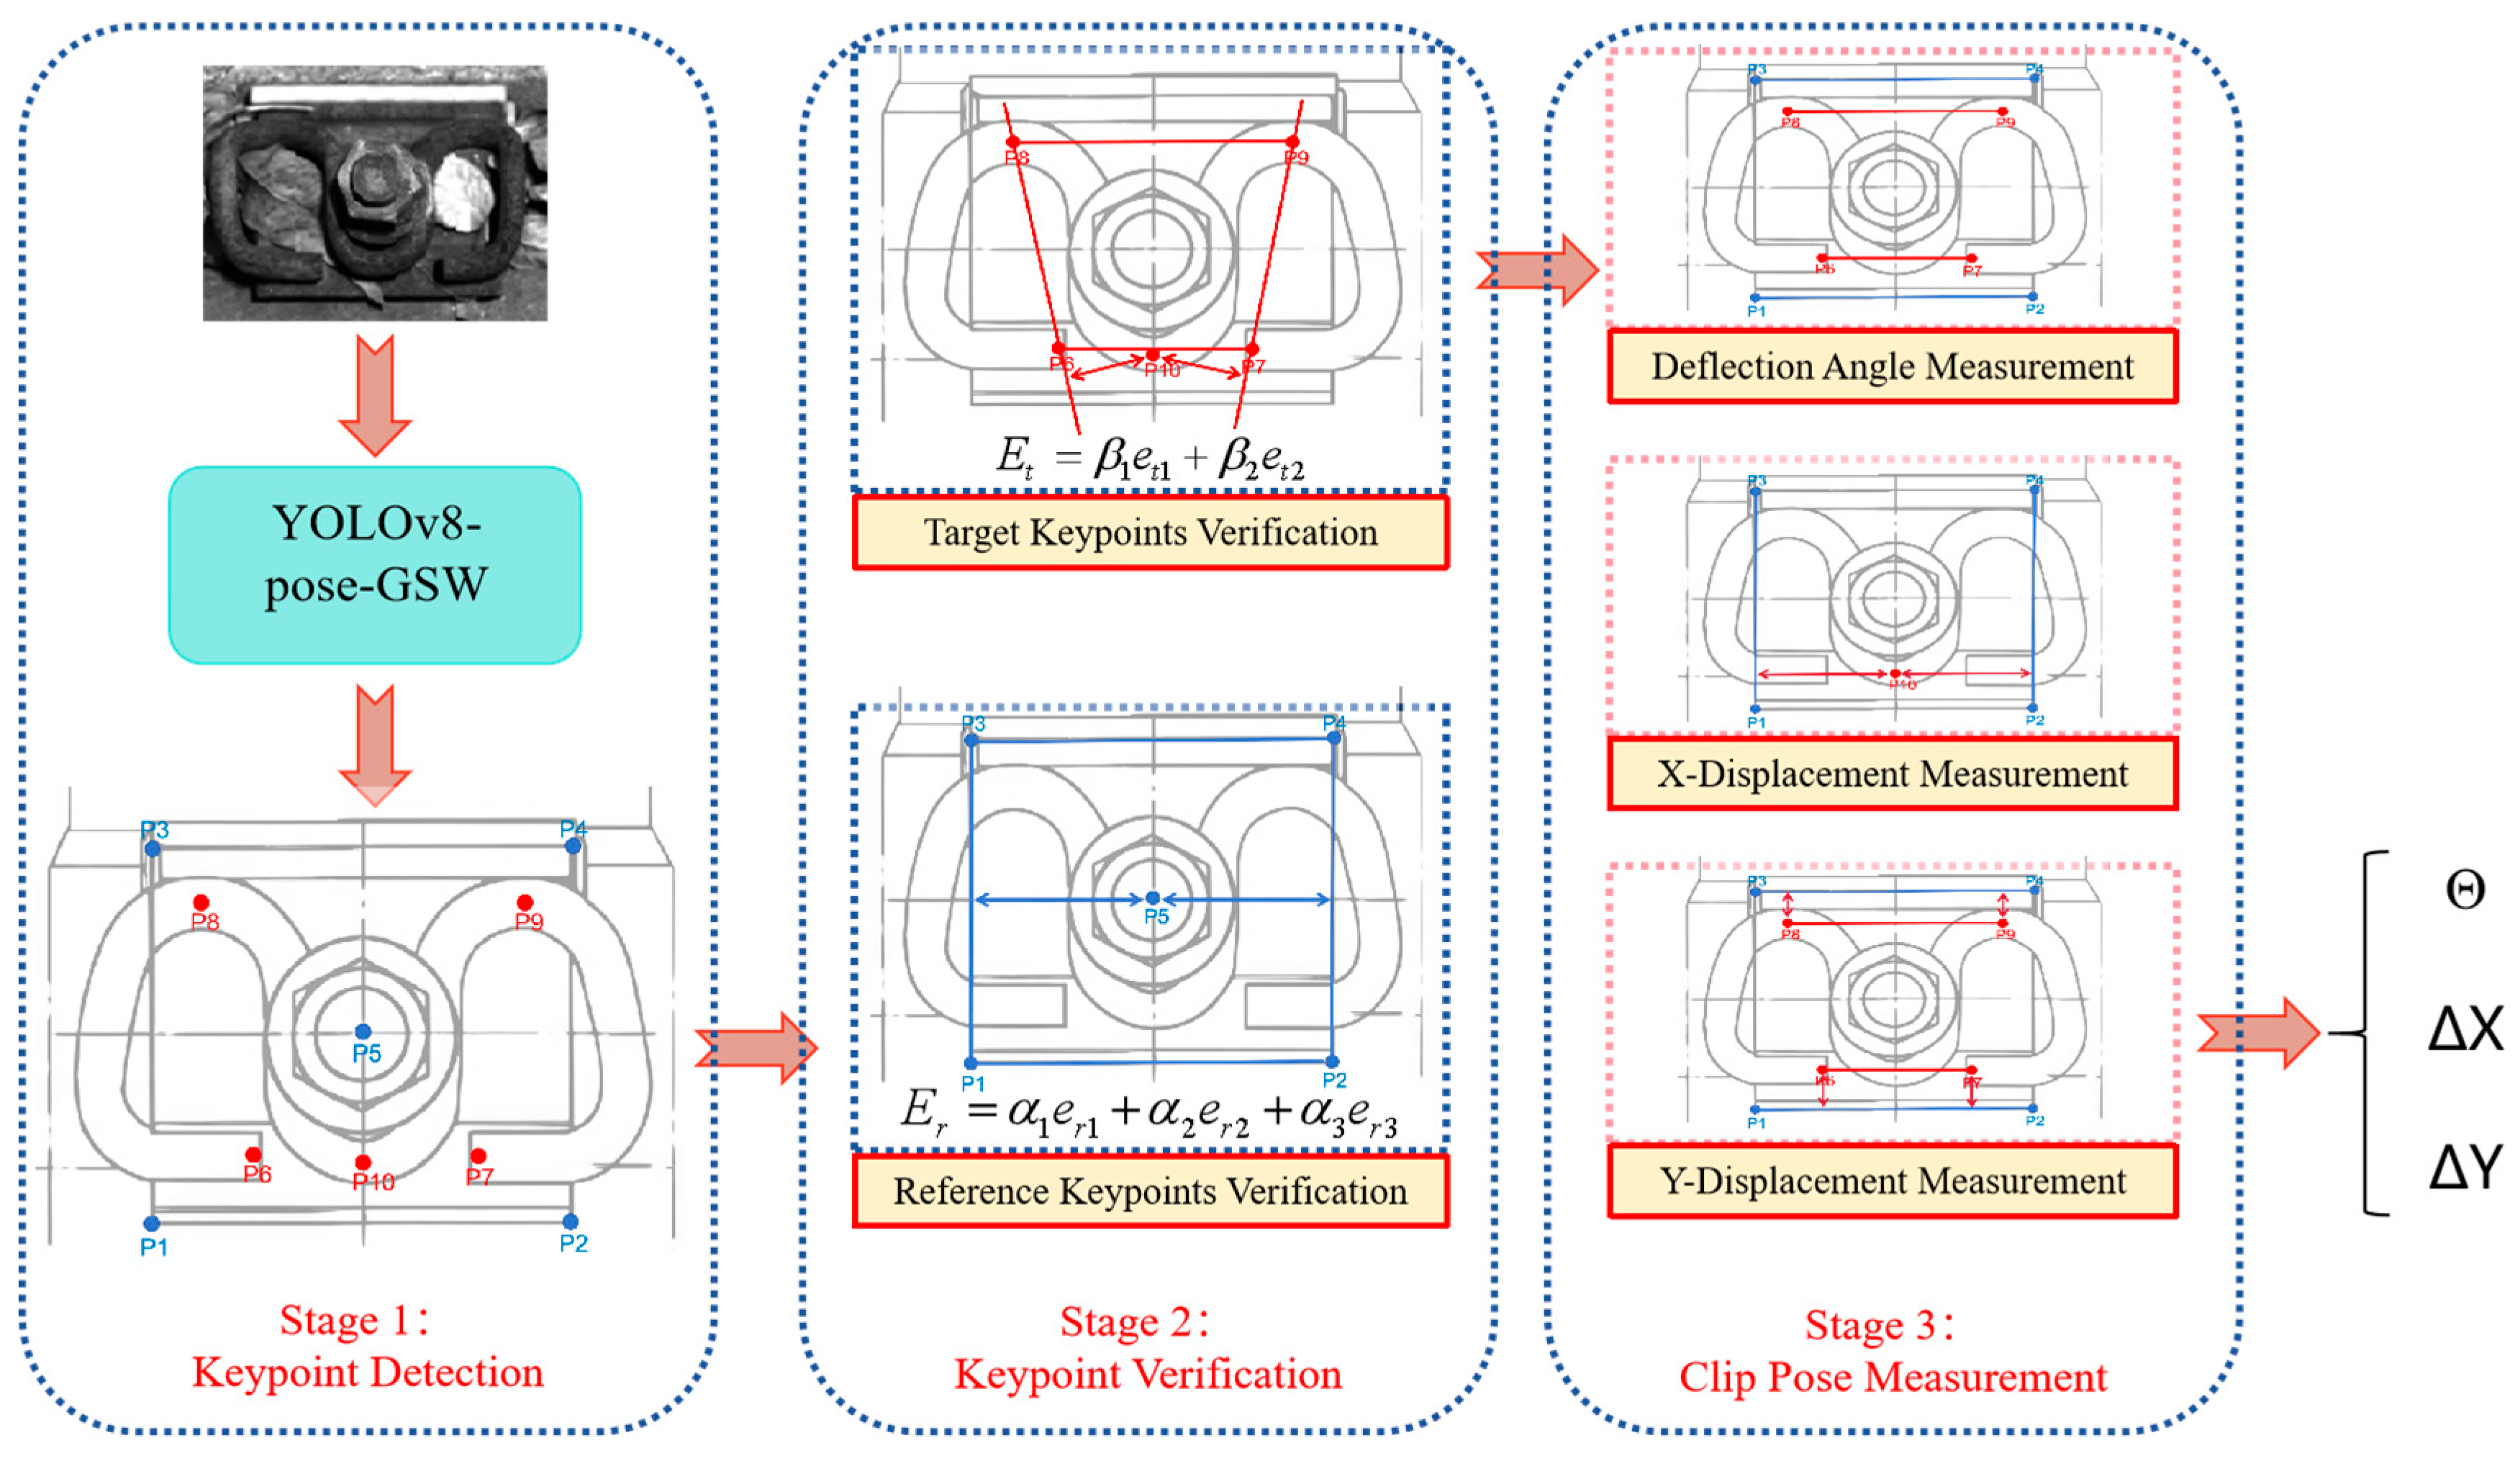
To overcome the limitations of traditional image processing methods in detecting geometric parameters of rail fasteners, this paper proposes a novel approach based on keypoint detection and spatial geometric analysis. The core workflow of this method aims to achieve precise quantitative measurement of rail fastener clip poses. The measurement process, illustrated in
Figure 2, consists of the following specific steps:
(1) Detection of various keypoints in the fastener region using the improved You Only Look Once version 8-pose with GAM, SPPF-Attention, Wise-IoU (YOLOv8-pose-GSW) model.
(2) Introduction of a verification mechanism based on the inherent positional relationships between keypoints. By analyzing their spatial geometric constraints, this step eliminates abnormal detection results with low confidence, thereby enhancing the overall system reliability.
(3) Utilization of the verified reference keypoints to establish a measurement baseline. The scale factor relating image pixels to physical dimensions is calculated by determining the correspondence between the imaged distances and the actual physical sizes.
(4) Based on this scale factor, precise quantification of the clip deflection angle and lateral/longitudinal offset distances is achieved by calculating the relative positions and angular information of the target keypoints (clip endpoints and bend corners) with respect to the reference keypoints. This completes the fully automated, high-precision detection of the fastener clip pose.
2.3. Yolov8-Pose-GSW Model
YOLOv8-pose, built upon the YOLOv8 framework, extends its capability to simultaneous object detection and human pose estimation (keypoint detection). In this architecture, input images first undergo feature extraction through the backbone network. The neck network then fuses these features across different scales, and finally, the head network performs classification and regression to output both human bounding boxes and corresponding keypoints.
Based on the prior research conducted by our team [
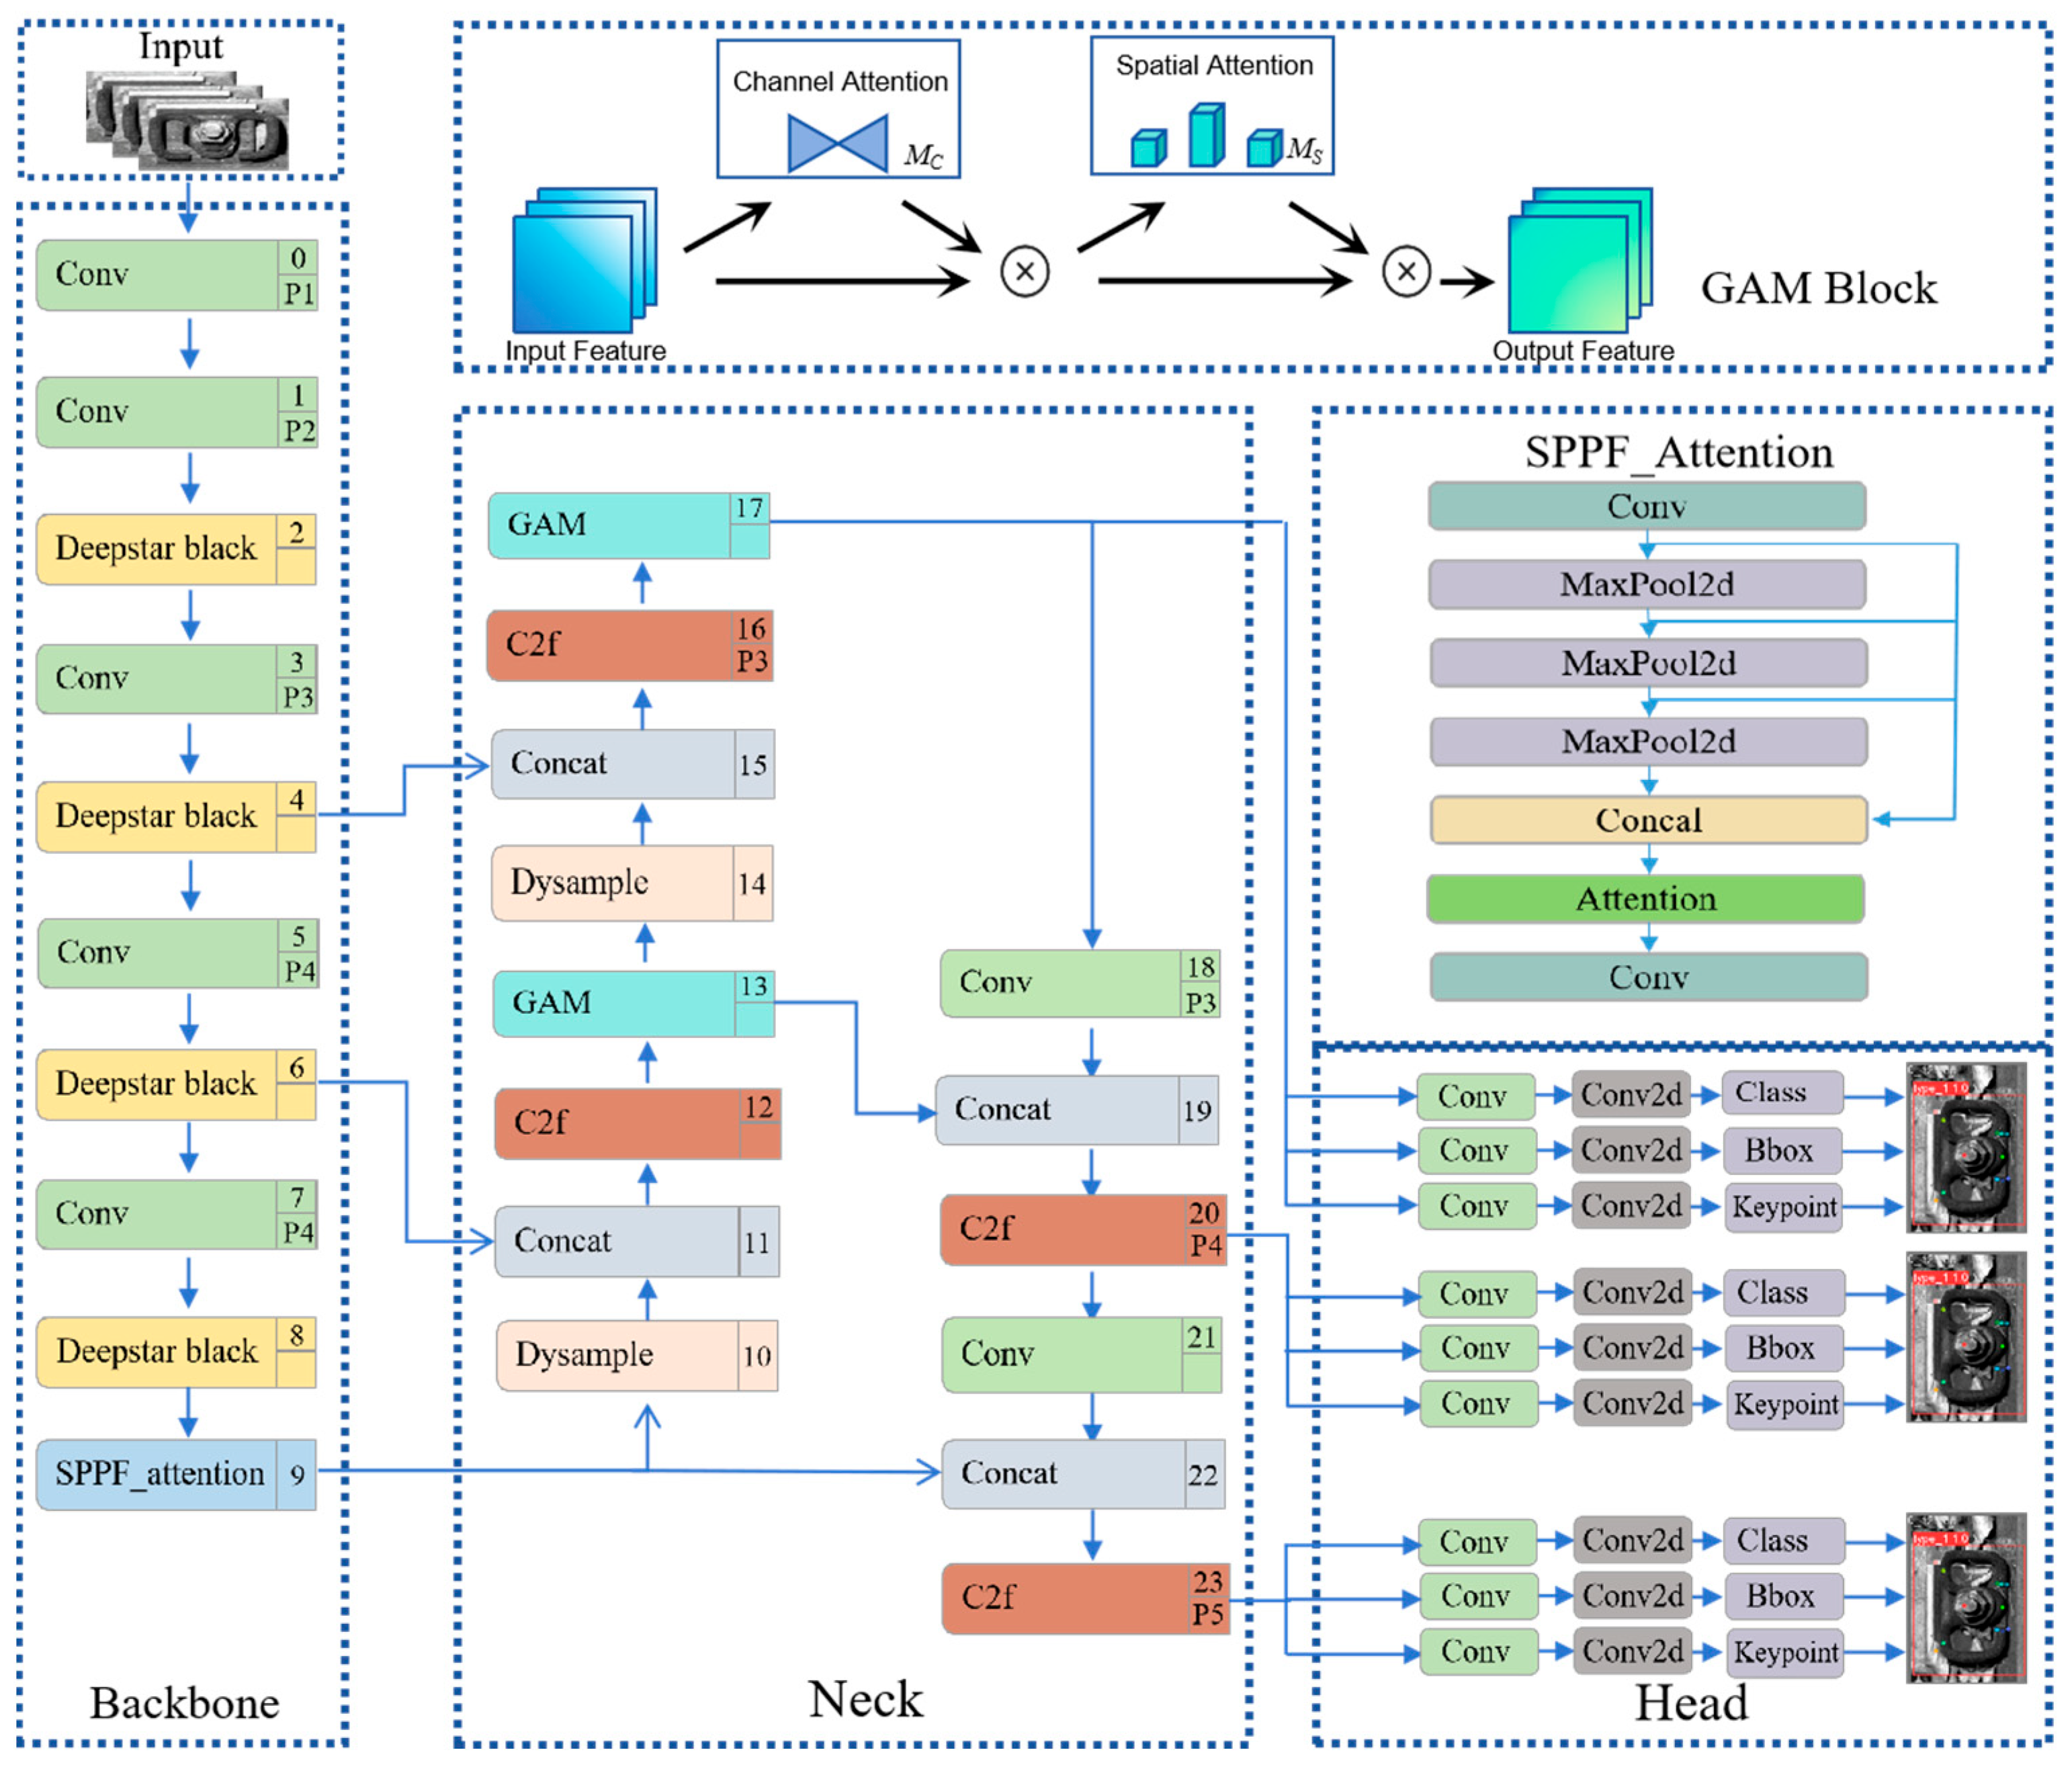
32], the YOLOv8 framework has demonstrated excellent performance and strong potential for improvement in railway fastener detection tasks. Therefore, this study continues to adopt its overall architecture. To address the specific requirements of clip keypoint localization and precise pose measurement, we have introduced targeted enhancements to the YOLOv8-pose model, proposing a detection method named YOLOv8-pose-GSW. The overall structure is illustrated in
Figure 3. While retaining the advantages of the original single-stage, end-to-end detection paradigm, the algorithm incorporates the following three key improvements to enhance the accuracy and robustness of keypoint detection:
- (1)
Integration of a Global Attention Mechanism (GAM) during feature fusion to improve the model’s ability to comprehensively reason with multi-scale information.
- (2)
Embedding of an Spatial Pyramid Pooling Fast with Attention (SPPF-Attention) module that combines spatial pyramid pooling with an attention mechanism, effectively enhancing multi-scale feature extraction and fusion capabilities for fasteners.
- (3)
Adoption of the Wise Intersection over Union (Wise-IoU) loss function to optimize bounding box regression accuracy.
These improvements collectively enhance the detection accuracy and robustness for measuring clip deflection and displacement in complex railway environments.
- (1)
Global Attention Mechanism Module (GAM)
Under the intricate conditions typical of railway environments, accurately localizing fastener keypoints is often affected by error and uncertainty. To mitigate this issue, the present study incorporates the GAM into the YOLOv8 framework. The module is positioned after the Cross Stage Partial network with 2 convolutions (C2f) feature extraction and fusion blocks at each scale of the feature pyramid. It performs channel-wise recalibration on the feature maps, amplifying critical information and attenuating less meaningful signals. This refinement strengthens the model’s capacity to synthesize multi-scale features for holistic interpretation, thereby improving attention to keypoints of fasteners under occlusion [
33].
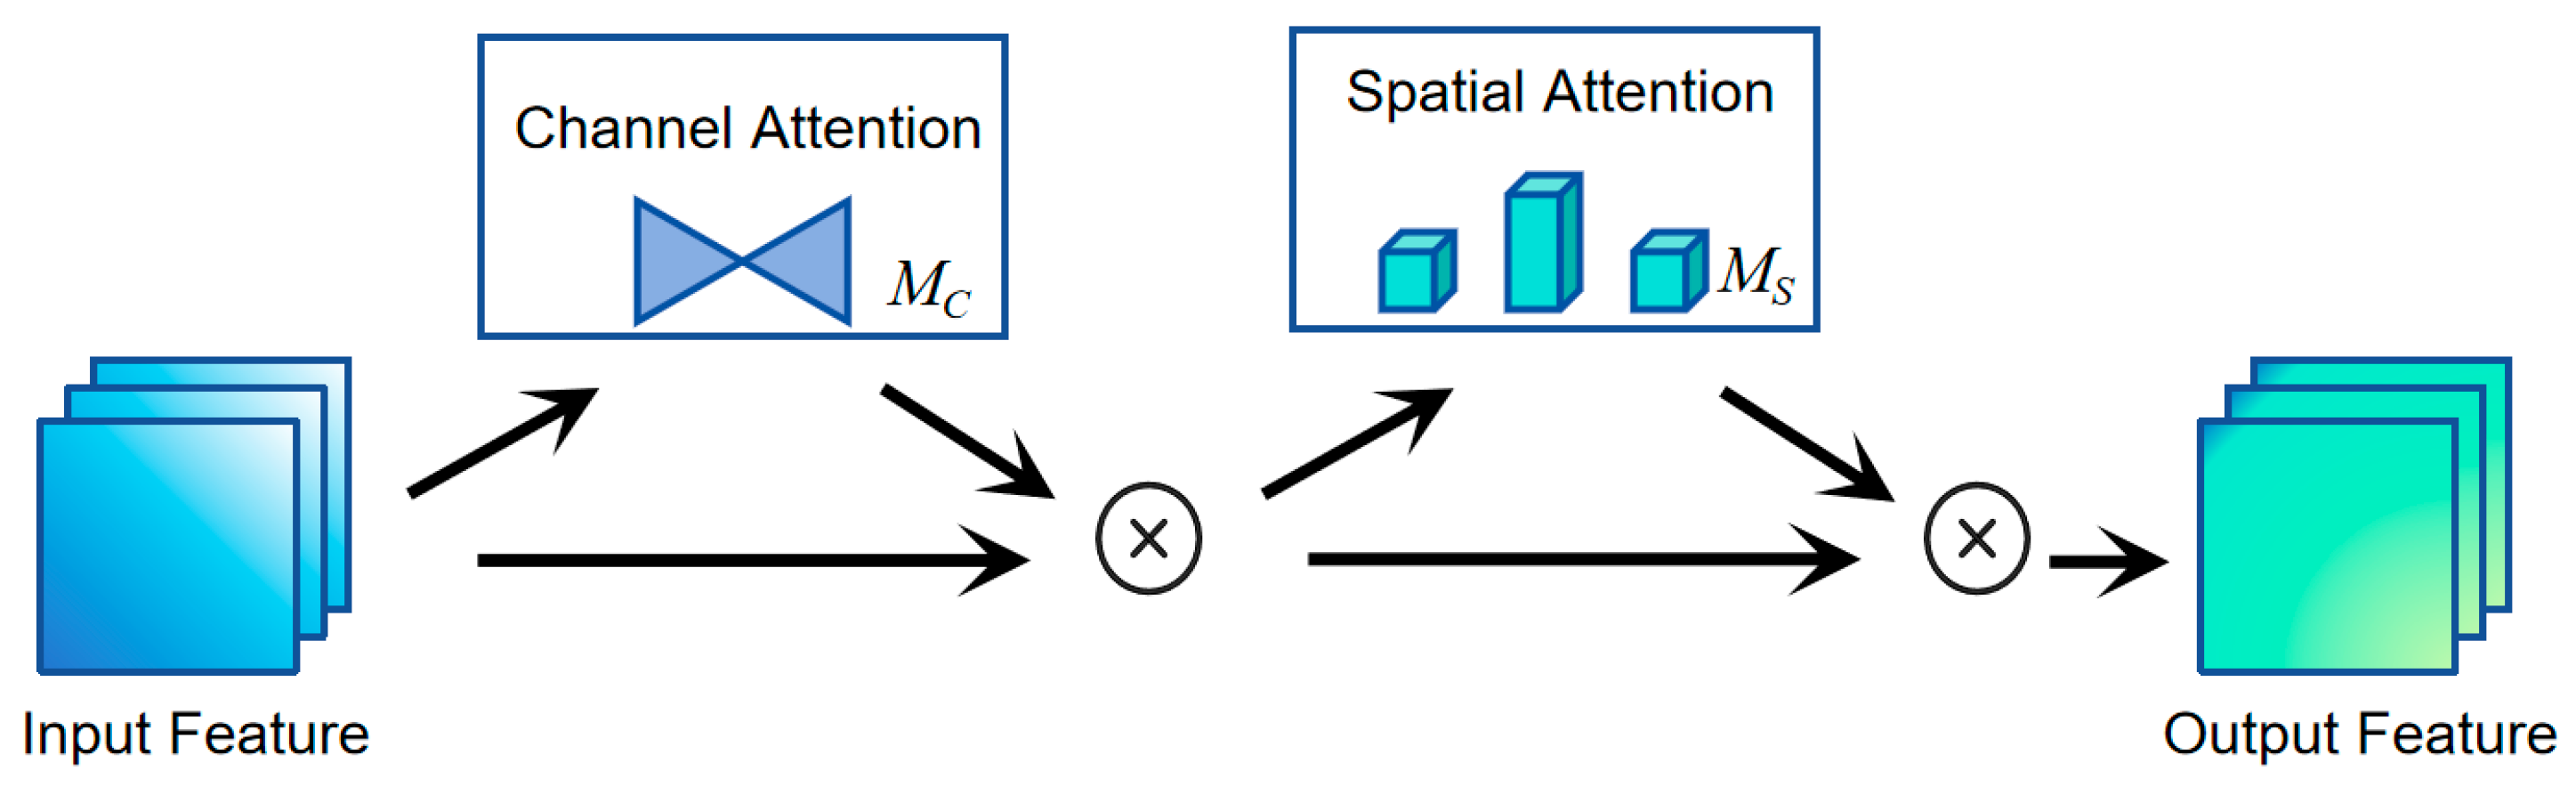
Attention mechanisms are widely adopted in deep learning to improve model performance by selectively highlighting salient features, suppressing noise, and refining information in tasks such as segmentation and detection. Several attention designs, including Efficient Multi-scale Attention (EMA), Convolutional Block Attention Module (CBAM), and Coordinate Attention (CA), have been successfully introduced into vision tasks such as classification, detection, and segmentation. While CBAM processes channel and spatial attention in sequence, Bottleneck Attention Module (BAM) implements them in parallel. However, both designs restrict dimensional interaction, overlooking correlations between channel and spatial information and thus limiting cross-dimensional awareness. In contrast, the GAM emphasizes holistic consistency, retains informative signals, enhances interaction across dimensions, and effectively boosts model accuracy. The architecture of the GAM is illustrated in
Figure 4.
GAM achieves dynamic calibration of feature maps through a dual-path collaborative working mechanism. Given an input feature map
F1, the intermediate state
F2 and output result
F3 are defined as:
In the equation, F1 represents the feature information of the input image, F2 denotes the intermediate weighted result, while Mc and Ms correspond to the channel and spatial output results, respectively.
Within the channel attention submodule, the input feature map undergoes dimensional restructuring through 3D permutation, transforming it into a (C, H, W) tensor—where C, H, and W indicate channel, height, and width dimensions, respectively—to better capture and preserve cross-dimensional feature relationships. Subsequently, a Multilayer Perceptron (MLP) is applied to strengthen spatial interactions across these dimensions. The output from the MLP is then passed through a Sigmoid function, generating the final channel attention weight vector.
The spatial attention submodule first compresses the channel dimension of the input features from
C to
C/r using a 7 × 7 convolution, with r denoting the reduction ratio for lower computational overhead. This is followed by a second 7 × 7 convolution that expands the channels back to
C, preserving the original feature dimensions. The output is then activated through a Sigmoid function to produce the spatial attention map. Diagrams of both the channel and spatial attention submodules are provided in
Figure 5 and
Figure 6, respectively.
- (2)
Spatial Pyramid Pooling Fast Attention (SPPF_Attention)
To address the weak focus on key regions in fastener detection, this study improves upon the SPPF [
34] module. The SPPF module is a spatial pyramid pooling structure for feature extraction and fusion. However, when processing fastener features, it struggles to effectively concentrate on crucial attention information, resulting in limited discriminative capability for fastener types. Therefore, this study introduces an attention mechanism into the SPPF module, proposing the SPPF_Attention module.
To enhance the focus on key regions in fastener detection, this work refines the SPPF module [
34]. While the SPPF structure effectively extracts and fuses multi-scale features, it often lacks sufficient emphasis on spatially critical information when handling fastener data, limiting its ability to distinguish between fastener types. To address this, we integrate an attention mechanism into SPPF, resulting in the proposed SPPF_Attention module.
As illustrated in
Figure 7, the SPPF_Attention module incorporates a spatial attention mechanism prior to the final 1 × 1 convolutional layer. This mechanism generates a spatial attention map that highlights salient regions by operating directly on the feature map’s spatial dimensions. Specifically, the input features undergo both global average pooling and global max pooling along the channel axis, producing two feature descriptors of size h × w × 1. These are concatenated channel-wise and then fused through a 7 × 7 convolutional layer for dimensionality reduction. A Sigmoid function subsequently computes spatial weights between 0 and 1. Finally, these weights are multiplied element-wise with the original features, amplifying relevant regions while suppressing less informative ones. By directing the network’s focus to crucial fastener areas, this attention-augmented module improves feature discriminability and strengthens defect recognition performance.
- (3)
Wise-IoU (WIoU) Loss Function
To overcome the limitations of the Complete Intersection over Union (CIoU) loss function in YOLOv8’s bounding box regression—specifically its neglect of the true discrepancy between height/width dimensions and their confidence, along with its high computational expense—this study incorporates WIoU with a dynamic non-monotonic focusing mechanism [
35]. WIoU adopts a judicious gradient allocation strategy to assess anchor boxes, directing greater attention to anchors of average quality and thereby boosting detection performance. Among the three variants of WIoU-version 3 (WIoUv3) is obtained by applying a non-monotonic focusing coefficient
r—constructed from the outlier measure
β—to WIoUv1. Here,
β reflects the quality of an anchor; a lower value corresponds to a superior anchor. When
β is large, assigning a smaller gradient gain to lower-quality anchors helps mitigate the influence of harmful gradients. Through this balanced gradient allocation, WIoUv3 encourages the model to focus on moderately qualified anchor boxes, enhancing overall detection robustness. The computation of WIoUv3 is defined by Equations (3)–(5).
where α and β are two hyperparameters, and modifying their values enables the model to achieve different performance characteristics.
2.4. Fastener Keypoint Selection
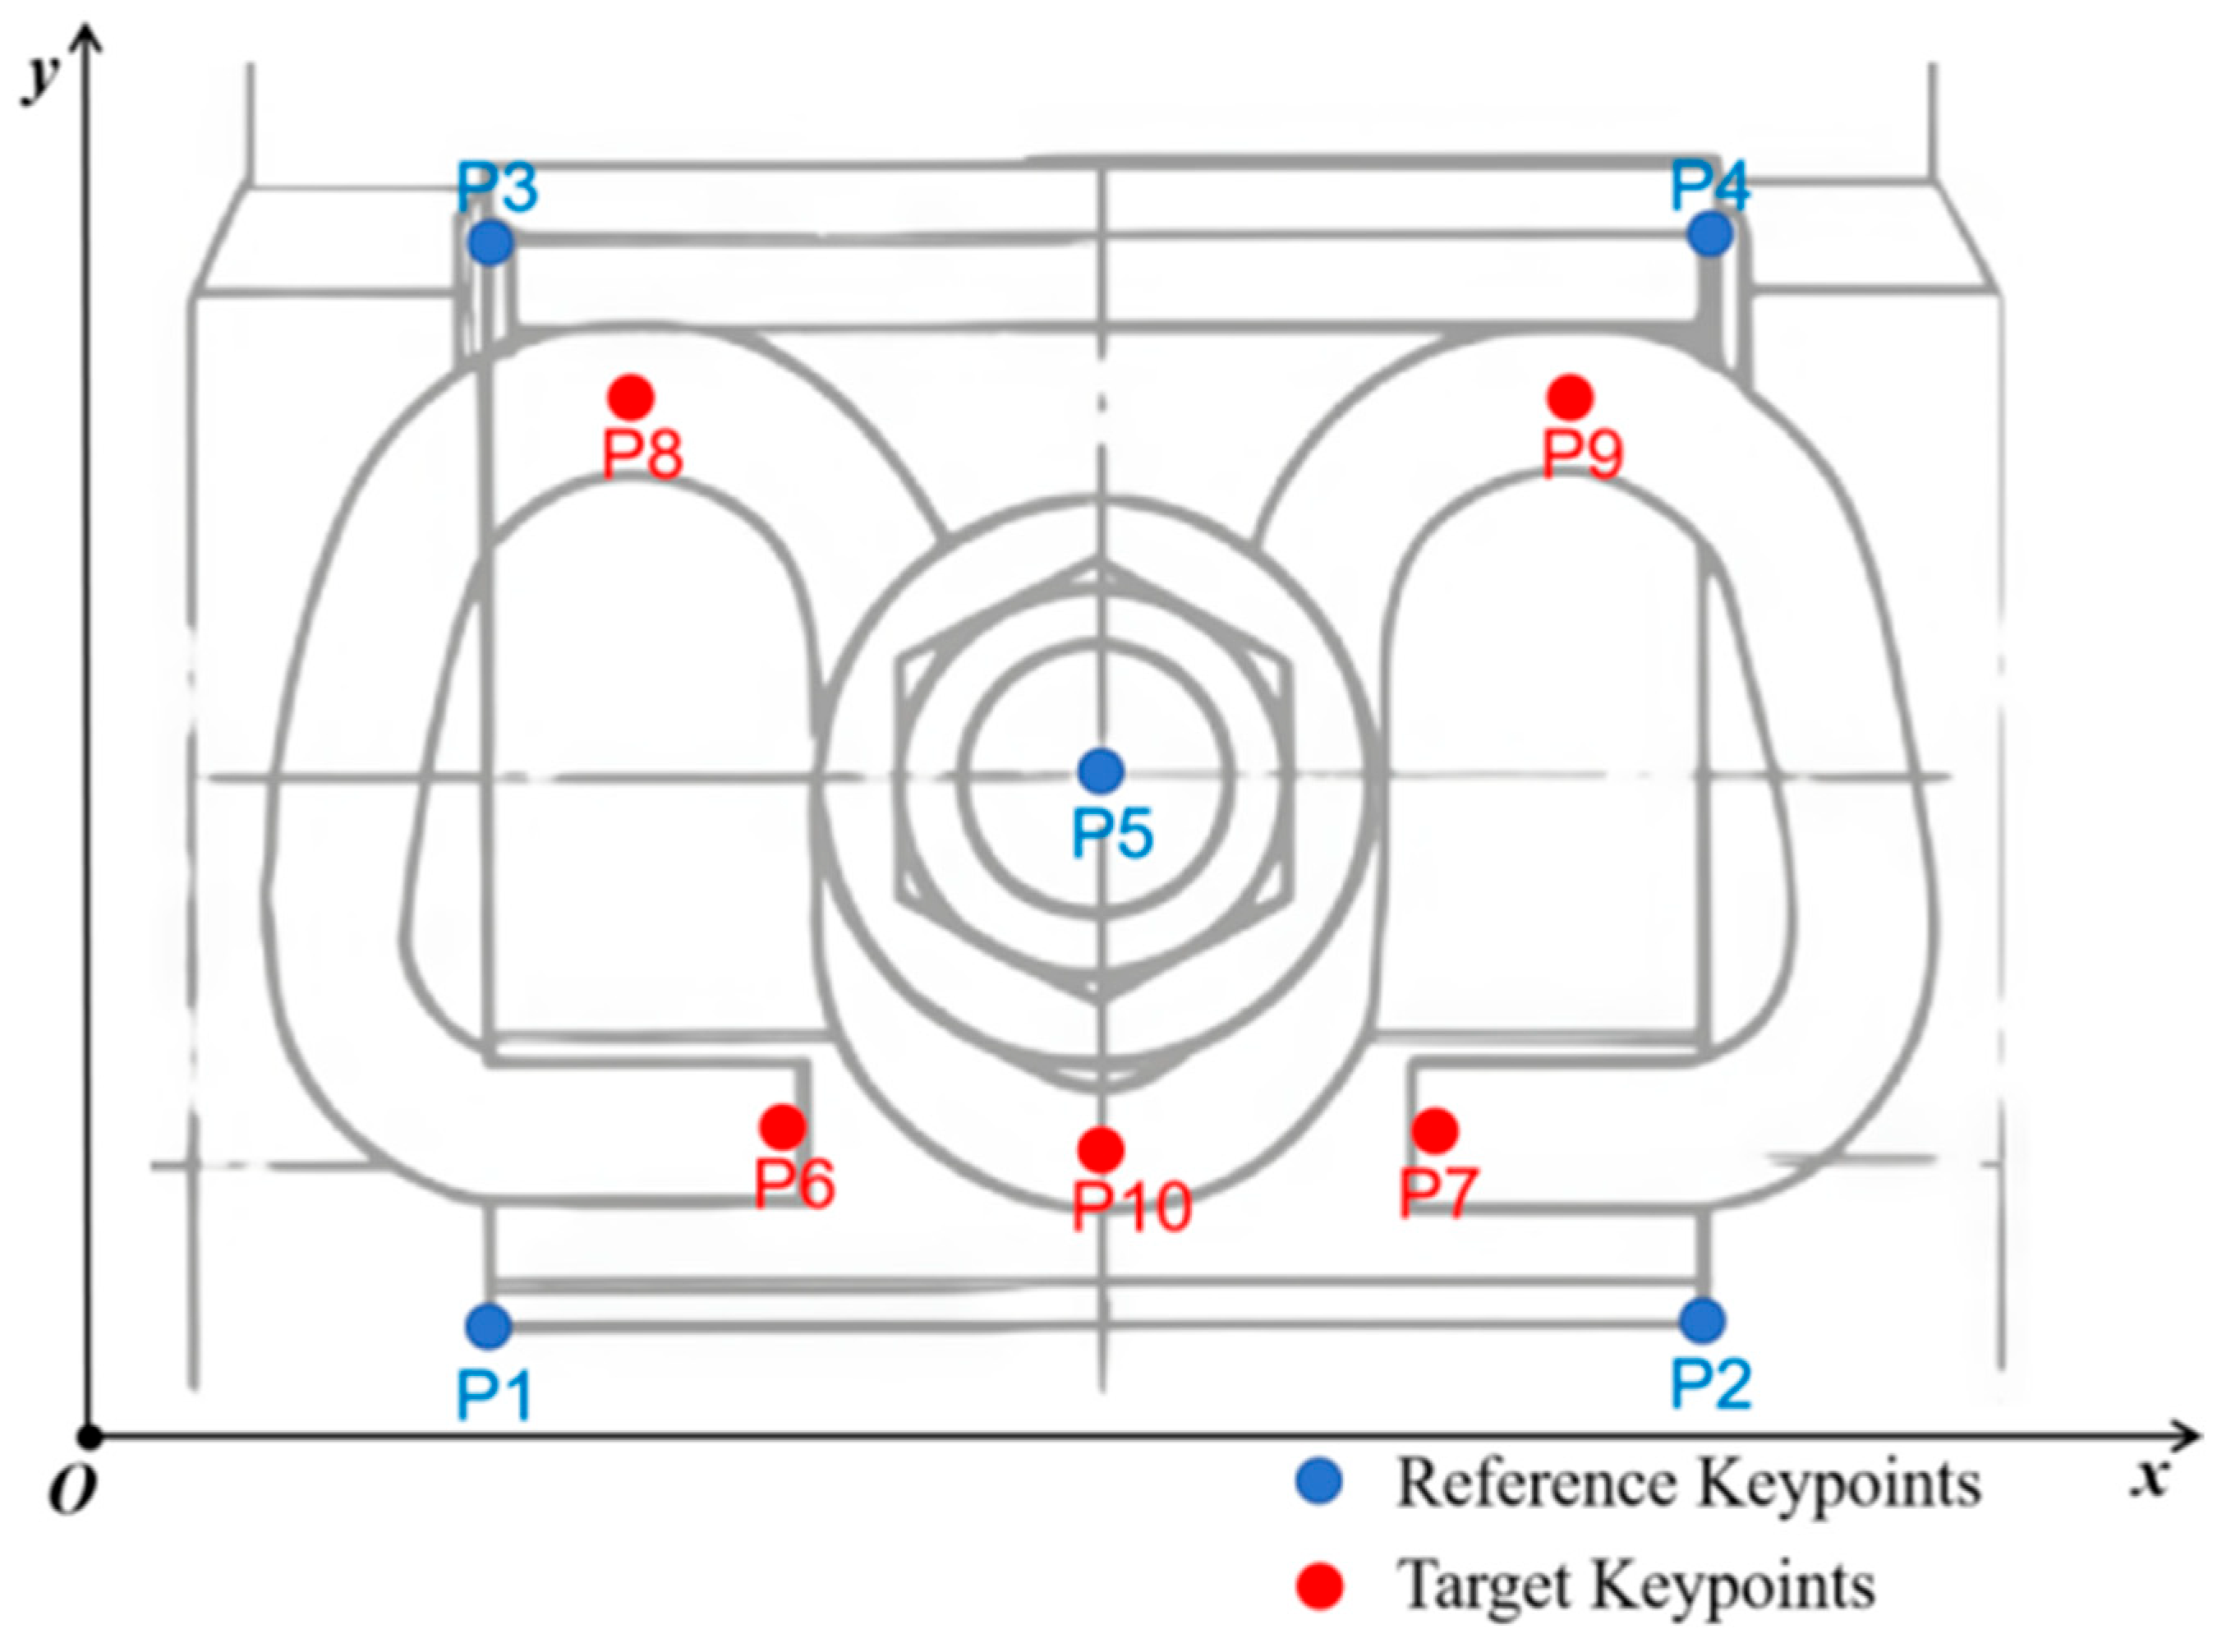
Due to the complex railway field environments where rail fasteners are located, their images are susceptible to interference from factors such as strong illumination, shadows, and oil stains. Therefore, selecting keypoints with high distinctiveness and strong robustness to represent the fastener structure is a critical step in the visual inspection system. This study focuses on the Type II clip fastener and proposes a keypoint selection strategy tailored to its structure and inspection requirements, as illustrated in
Figure 8.
In the figure, the points marked in blue represent the reference keypoints, which are positioned on structurally stable and distinctive fixed components such as the four corners of the soleplate and the center of bolts. These keypoints define a standard spatial coordinate system for the fastener within the image. Given that the soleplate possesses fixed physical dimensions, the pixel distances between its four corner points after imaging, in relation to their actual physical distances, allow for precise calculation of the image’s scale factor. This enables the conversion of measurements from pixel space to physical space.
The points marked in red in the figure denote the target keypoints. These are located in core deformation areas of the clip, such as the toe end and the arch crown. These keypoints accurately characterize the real-time spatial position and posture of the clip. By analyzing the relative geometric relationships (such as distances and angles) formed between these target keypoints and the reference keypoints, the offset and deflection angle of the clip can be quantified. This facilitates precise diagnosis of the clip’s operational condition.
2.5. Keypoint Confidence Verification and Scale Factor Calculation
Although deep learning models possess powerful feature extraction capabilities, their outputs may still contain spatially unreasonable predictions. After obtaining initial keypoints through the improved YOLOv8-pose model, it is essential to introduce a posterior verification mechanism based on prior knowledge to mitigate the impact of individual keypoint misdetections or localization errors on subsequent measurement accuracy in complex scenarios. To this end, this paper leverages the inherent spatial structural priors among rail fastener components to construct a quantifiable evaluation metric, termed spatial constraint error, for assessing the overall geometric consistency and credibility of the detected keypoint clusters.
To quantify the degree of agreement between the detected reference keypoints and the inherent geometric structure of the fastener, this paper defines a spatial constraint error . This error is composed of the following three geometric deviation components, which collectively constrain the keypoint cluster from two aspects: directional consistency and positional symmetry:
Directional Constraint Deviation
: Measures the angular deviation between the straight line
defined by keypoints
and
, and the straight line
defined by keypoints
and
. This deviation is quantified by the absolute value of its sine function, and its calculation formula is defined as:
Directional Constraint Deviation : Measures the angular deviation between the straight line defined by keypoints and , and the straight line defined by keypoints and . Correspondingly, this deviation is represented by the absolute value of its sine function, and its calculation method is identical to Equation (6) and will not be reiterated here.
Normalized Positional Constraint Deviation
: Measures the difference in perpendicular distances from keypoint
to straight lines
and
. To eliminate the influence of image capture scale and maintain dimensional consistency with the previously mentioned dimensionless deviation components
and
, this distance difference is divided by the length
of the line segment determined by keypoints
and
, resulting in a dimensionless ratio. Its calculation formula is:
where
, and
are calculated as follows:
The calculation method for is consistent with Equation (8) and will not be reiterated here.
Ultimately, the overall spatial constraint error
is defined as the weighted sum of the aforementioned three dimensionless components:
After the keypoint detection model outputs the keypoint information, the reference keypoint positions are validated using the above formulas. When the final spatial constraint error is less than the specified threshold, the detected keypoint information is considered credible, and the next step is initiated. Otherwise, the keypoint information is deemed unreliable, the image is flagged accordingly, and clip pose detection is abandoned for this instance.
After verifying the credibility of the reference keypoints through spatial constraint error, the same logic is applied to validate the target keypoints (i.e., the keypoints on the clip). The spatial constraint error of the target keypoints is composed of the following two geometric deviation components, aiming to assess the rationality of the target keypoints:
Directional Constraint Deviation : Measures the angular deviation between the straight line defined by keypoints and on the clip, and the straight line defined by keypoints and . Correspondingly, this deviation is represented by the absolute value of its sine function, and its calculation method is identical to Equation (6) and will not be reiterated here.
Normalized Positional Constraint Deviation : Measures the absolute value of the difference in perpendicular distances from keypoint to straight lines and . To eliminate scale effects and maintain dimensional consistency with , this distance difference is normalized by dividing it by the line segment length . The calculation method is identical to Equation (7) and will not be reiterated here.
Here, the calculation methods for , , and are identical to the point-to-line distance formula and point-to-point distance formula provided earlier and will not be repeated here.
Ultimately, the overall spatial constraint error
is defined as the weighted sum of the aforementioned two dimensionless components:
The system verifies the geometric consistency of the target keypoints. Specifically, it calculates their spatial constraint error . If is below the preset threshold , the set of keypoints is deemed reliable, and the system proceeds with the subsequent clip pose calculation. If is greater than or equal to , clip pose detection for this frame is abandoned, and the anomaly is recorded for further analysis. In cases where keypoints are missing, detection is similarly abandoned and recorded.
To convert pixel measurements in the image into physically meaningful dimensions, the image scale must be determined. This study utilizes the prior knowledge of the fixed physical dimension of the soleplate’s long side for scale conversion. Given that the actual length
of the soleplate’s long side is approximately 110 mm, and its corresponding pixel distance in the image is the distance
between reference keypoints
and
, the image’s scale factor
(unit: mm/pixel) can be calculated as follows:
This scale factor serves as the foundation for all subsequent geometric measurements, enabling the conversion of values expressed in pixel units—such as displacement and distance—into actual metric units (millimeters). Thereby, it facilitates the quantitative detection of clip offset and deflection.
2.6. Clip Pose Calculation
After acquiring the credibility-verified keypoints, this study precisely quantifies the pose state of the clip from three dimensions: deflection angle, lateral (X-axis) displacement, and longitudinal (Y-axis) displacement. The specific calculation methods are as follows.
(1) Calculation of Clip Deflection Angle
The deflection angle of the clip is characterized by the average value of the angle between the line segments connecting its end keypoints (
and
) and the baseline segments (
and
), so as to eliminate potential errors from unilateral measurements. The angles (
and
) between the baseline segments defined by reference keypoints (
and
) and the clip segments defined by clip keypoints (
and
) are calculated, respectively. The final clip deflection angle
is obtained by averaging these two angles. The calculation formulas are as follows:
where
is calculated as follows:
The calculation method for is consistent with Equation (14) and will not be reiterated here.
(2) Calculation of Clip X-axis Direction Displacement
The X-axis displacement of the clip is used to detect the overall lateral slippage of the clip. By selecting a keypoint
located in the middle section of the clip, the perpendicular distances
and
from this point to the two baseline segments
and
are calculated. The average of the difference between these two distances is then computed, and subsequently converted into a physical displacement using the scale factor
:
where the calculation formulas for
and
are identical to the point-to-line distance formula (i.e., Equations (6) and (7)) provided earlier and will not be repeated here.
(3) Calculation of Clip Y-axis Displacement
The Y-axis displacement of the clip is used to evaluate its longitudinal movement perpendicular to the rail direction. This is achieved by comparing the average distance from the clip’s end keypoints
and
to the baseline
with the average distance from the reference component points
and
to the clip line
. The difference between these values represents the longitudinal displacement in pixel units, which is then converted to physical displacement through scale transformation:
where the calculation methods for
,
,
, and
are the same as the point-to-line distance formulas (i.e., Equations (6) and (7)) described earlier and will not be repeated here.
2.7. Model Training Configuration
The experiments were conducted under Windows 10 using CUDA 12.1 and PyTorch 2.4.1. The hardware setup included an Intel Core i7-12700K CPU (Intel, Santa Clara, CA, USA) and an NVIDIA RTX 3090 GPU (NVIDIA, Santa Clara, CA, USA). During training, key hyperparameters were configured as follows: 500 total epochs; an early stopping patience of 50 epochs to avoid overfitting; a batch size of 16; an initial learning rate of 0.0001; and a weight decay coefficient set to 0.0005.The hyperparameters related to keypoint verification were determined based on validation set performance as follows: the weight coefficients , , and for the reference keypoint spatial constraint error were set to 0.4, 0.4, and 0.2, respectively; the weight coefficients and for the target keypoint spatial constraint error were both set to 0.5; and the spatial constraint error thresholds and for the keypoints were set to 0.1.
3. Experiments and Results Analysis
3.1. Keypoint Detection Evaluation Metrics
The evaluation mechanism for keypoint detection tasks differs from traditional object detection. It typically employs Object Keypoint Similarity (OKS) to measure model performance. OKS comprehensively evaluates localization accuracy by calculating the normalized distance between predicted keypoints and their ground truth counterparts. The specific calculation is defined as follows:
In the equation, represents the distance between the i-th predicted keypoint and its corresponding ground truth keypoint, denotes the scale factor for point , is the normalization factor for keypoint type i, and is an indicator function validating the effectiveness of the keypoint.
On this basis, the Average Precision (AP) can be estimated by setting different OKS thresholds. Specifically, AP is calculated as the average precision across multiple OKS thresholds (typically from 0.50 to 0.95 with a step size of 0.05) and is regarded as the core evaluation metric for keypoint detection. The calculation of keypoint Average Precision is as follows:
P represents the position of a specific keypoint in the keypoint list, T denotes the OKS threshold, m indicates the total number of keypoints, and represents the similarity between the predicted keypoint location and the ground truth keypoint location.
This paper employs Precision (P), Recall (R), and Average Precision at IoU threshold from 0.5 to 0.95 (AP@0.5:0.95) as evaluation metrics for keypoint recognition accuracy. To comprehensively assess the model’s efficiency in practical deployment, computational complexity (Floating Point Operations (FLOPs)) and parameter count (Parameters) are also introduced as evaluation indicators.
3.2. Ablation Study
The improved YOLOv8-pose model integrates the GAM module, SPPF-attention module, and Wise-IoU loss function into the baseline model. To validate the rationality and effectiveness of these improvements, an ablation study was designed and conducted to evaluate model performance. The validation results are presented in
Table 2.
Based on a systematic analysis of the ablation experimental results presented in
Table 2, the following conclusions can be drawn:
Firstly, all proposed improvement modules are verified to be independently effective. Compared to the baseline model (Exp. 1), integrating the GAM module into the model’s neck (Exp. 2) yielded the most significant performance improvement, increasing AP and Recall by 1.8% and 5.0%, respectively. This is primarily attributed to the crucial role of the GAM module during the feature fusion stage: it adaptively optimizes multi-scale features from the backbone network through channel and spatial attention mechanisms, thereby enhancing the representational capacity of the fused features. This mechanism effectively improves the model’s perception of keypoints in complex backgrounds, particularly enhancing the recall capability for challenging samples. The improved SPPF-Attention module (Exp. 3) increased AP by 1.3%. By integrating multi-scale receptive fields and applying attention weighting, it effectively strengthened the model’s ability to extract fastener features at different scales. The Wise-IoU loss function (Exp. 4), by dynamically adjusting regression loss weights, improved bounding box localization quality, thereby providing higher-quality regions of interest for keypoint detection and resulting in a 0.5% AP gain.
Secondly, the modules exhibit a significant synergistic enhancement effect. When GAM and SPPF-Attention are combined (Exp. 5), the AP improvement reaches 3.2%, exceeding the sum of their individual improvements (3.1%). This demonstrates that performing feature enhancement separately in the backbone network and the feature fusion network can achieve a “1 + 1 > 2” positive effect. Furthermore, combining WIoU with the aforementioned structural improvements (Exp. 6, 7) also shows additional performance gains, indicating that the optimized loss function collaborates effectively with the enhanced network architecture.
Ultimately, the complete model incorporating all improvements (Exp. 8) achieves the best performance, with AP, Precision, and Recall reaching 77.5%, 85.1%, and 84.5%, respectively. This represents a 3.6 percentage point improvement in AP over the baseline model, fully validating the effectiveness of the overall proposed scheme. It is noteworthy that the performance gains come with a moderate increase in model complexity—the complete model’s Giga Floating Point Operations (GFLOPs) and parameter count increased by 12.6% and 25.0%, respectively, compared to the baseline. Considering the stringent accuracy requirements for rail fastener detection, this computational cost is reasonable and acceptable for industrial applications.
In summary, the ablation study systematically verifies the effectiveness of the individual improvement modules and their synergistic interactions, demonstrating that the final complete model achieves optimal comprehensive detection performance at a reasonable computational cost.
3.3. Performance Comparison of Different Detection Models
To comprehensively evaluate the performance of the proposed method, this study selected advanced pose estimation models covering different design paradigms and positioning as comparison baselines. These include single-stage detectors such as YOLOv5s-Pose, YOLOv7-tiny-Pose, and YOLOv8s-Pose, the lightweight LitePose, and the high-precision benchmark HigherHRNet. All models were trained and tested on the same rail fastener keypoint dataset, with detailed results presented in
Table 3.
From the perspective of model performance comparison, the proposed method demonstrates clear advantages within the YOLO series. While maintaining the efficiency characteristic of single-stage detectors, our method achieves the best detection accuracy in its class. Compared to YOLOv7-tiny-Pose, which also belongs to lightweight design, our method shows a 16.2 percentage point improvement in the mAP metric. When compared to the robust YOLOv8s-pose baseline, our method also achieves a 3.6 percentage point gain in mAP. These results fully demonstrate the effectiveness of the improvement scheme comprising the introduced GAM attention module, the enhanced SPPF + Attention structure, and the Wise-IoU loss function.
In terms of the balance between accuracy and efficiency, the proposed method exhibits outstanding comprehensive competitiveness. Compared to LitePose, which is specifically optimized for mobile deployment, our method leads by 11.9 percentage points in mAP. Although this comes with increased computational resource requirements, it provides the necessary performance guarantee for high-precision industrial inspection. Notably, the comparison with the high-precision benchmark HigherHRNet shows that while our method lags by only 1.9 percentage points in mAP, it substantially reduces the number of parameters and computational load by 49.3% and 29.0%, respectively. This indicates that our method achieves detection performance comparable to top-tier models with significantly lower model complexity, offering superior cost-effectiveness in industrial deployment scenarios.
From a practical application standpoint, the proposed method holds clear practical value in industrial settings. Experimental results demonstrate that our method achieves an excellent balance across three critical dimensions: accuracy, speed, and model complexity. It not only significantly outperforms real-time detection models of the same type but also closely approaches the accuracy upper limit of computation-intensive models. This combination of high accuracy and efficiency makes our method particularly suitable for industrial vision applications such as online monitoring of rail fastener conditions and automated inspection, where both algorithmic performance and inference speed are strictly required.
Systematic comparative experiments validate that the improved YOLOv8-pose model proposed in this paper delivers excellent comprehensive performance in the task of rail fastener keypoint detection, achieving an ideal balance between accuracy and efficiency, thereby providing a reliable technical solution for related applications in the industrial field.
3.4. Visualization and Analysis of Results
To intuitively demonstrate the performance of the proposed method, this section presents a comparative analysis using two sets of visualization results. The first set highlights the advantage of our method in quantitatively detecting “implicit” defects, while the second set comprehensively showcases the method’s detection performance across different scenarios and provides an objective analysis of its current limitations.
(1) Comparison between Object Detection Method and the Proposed Method
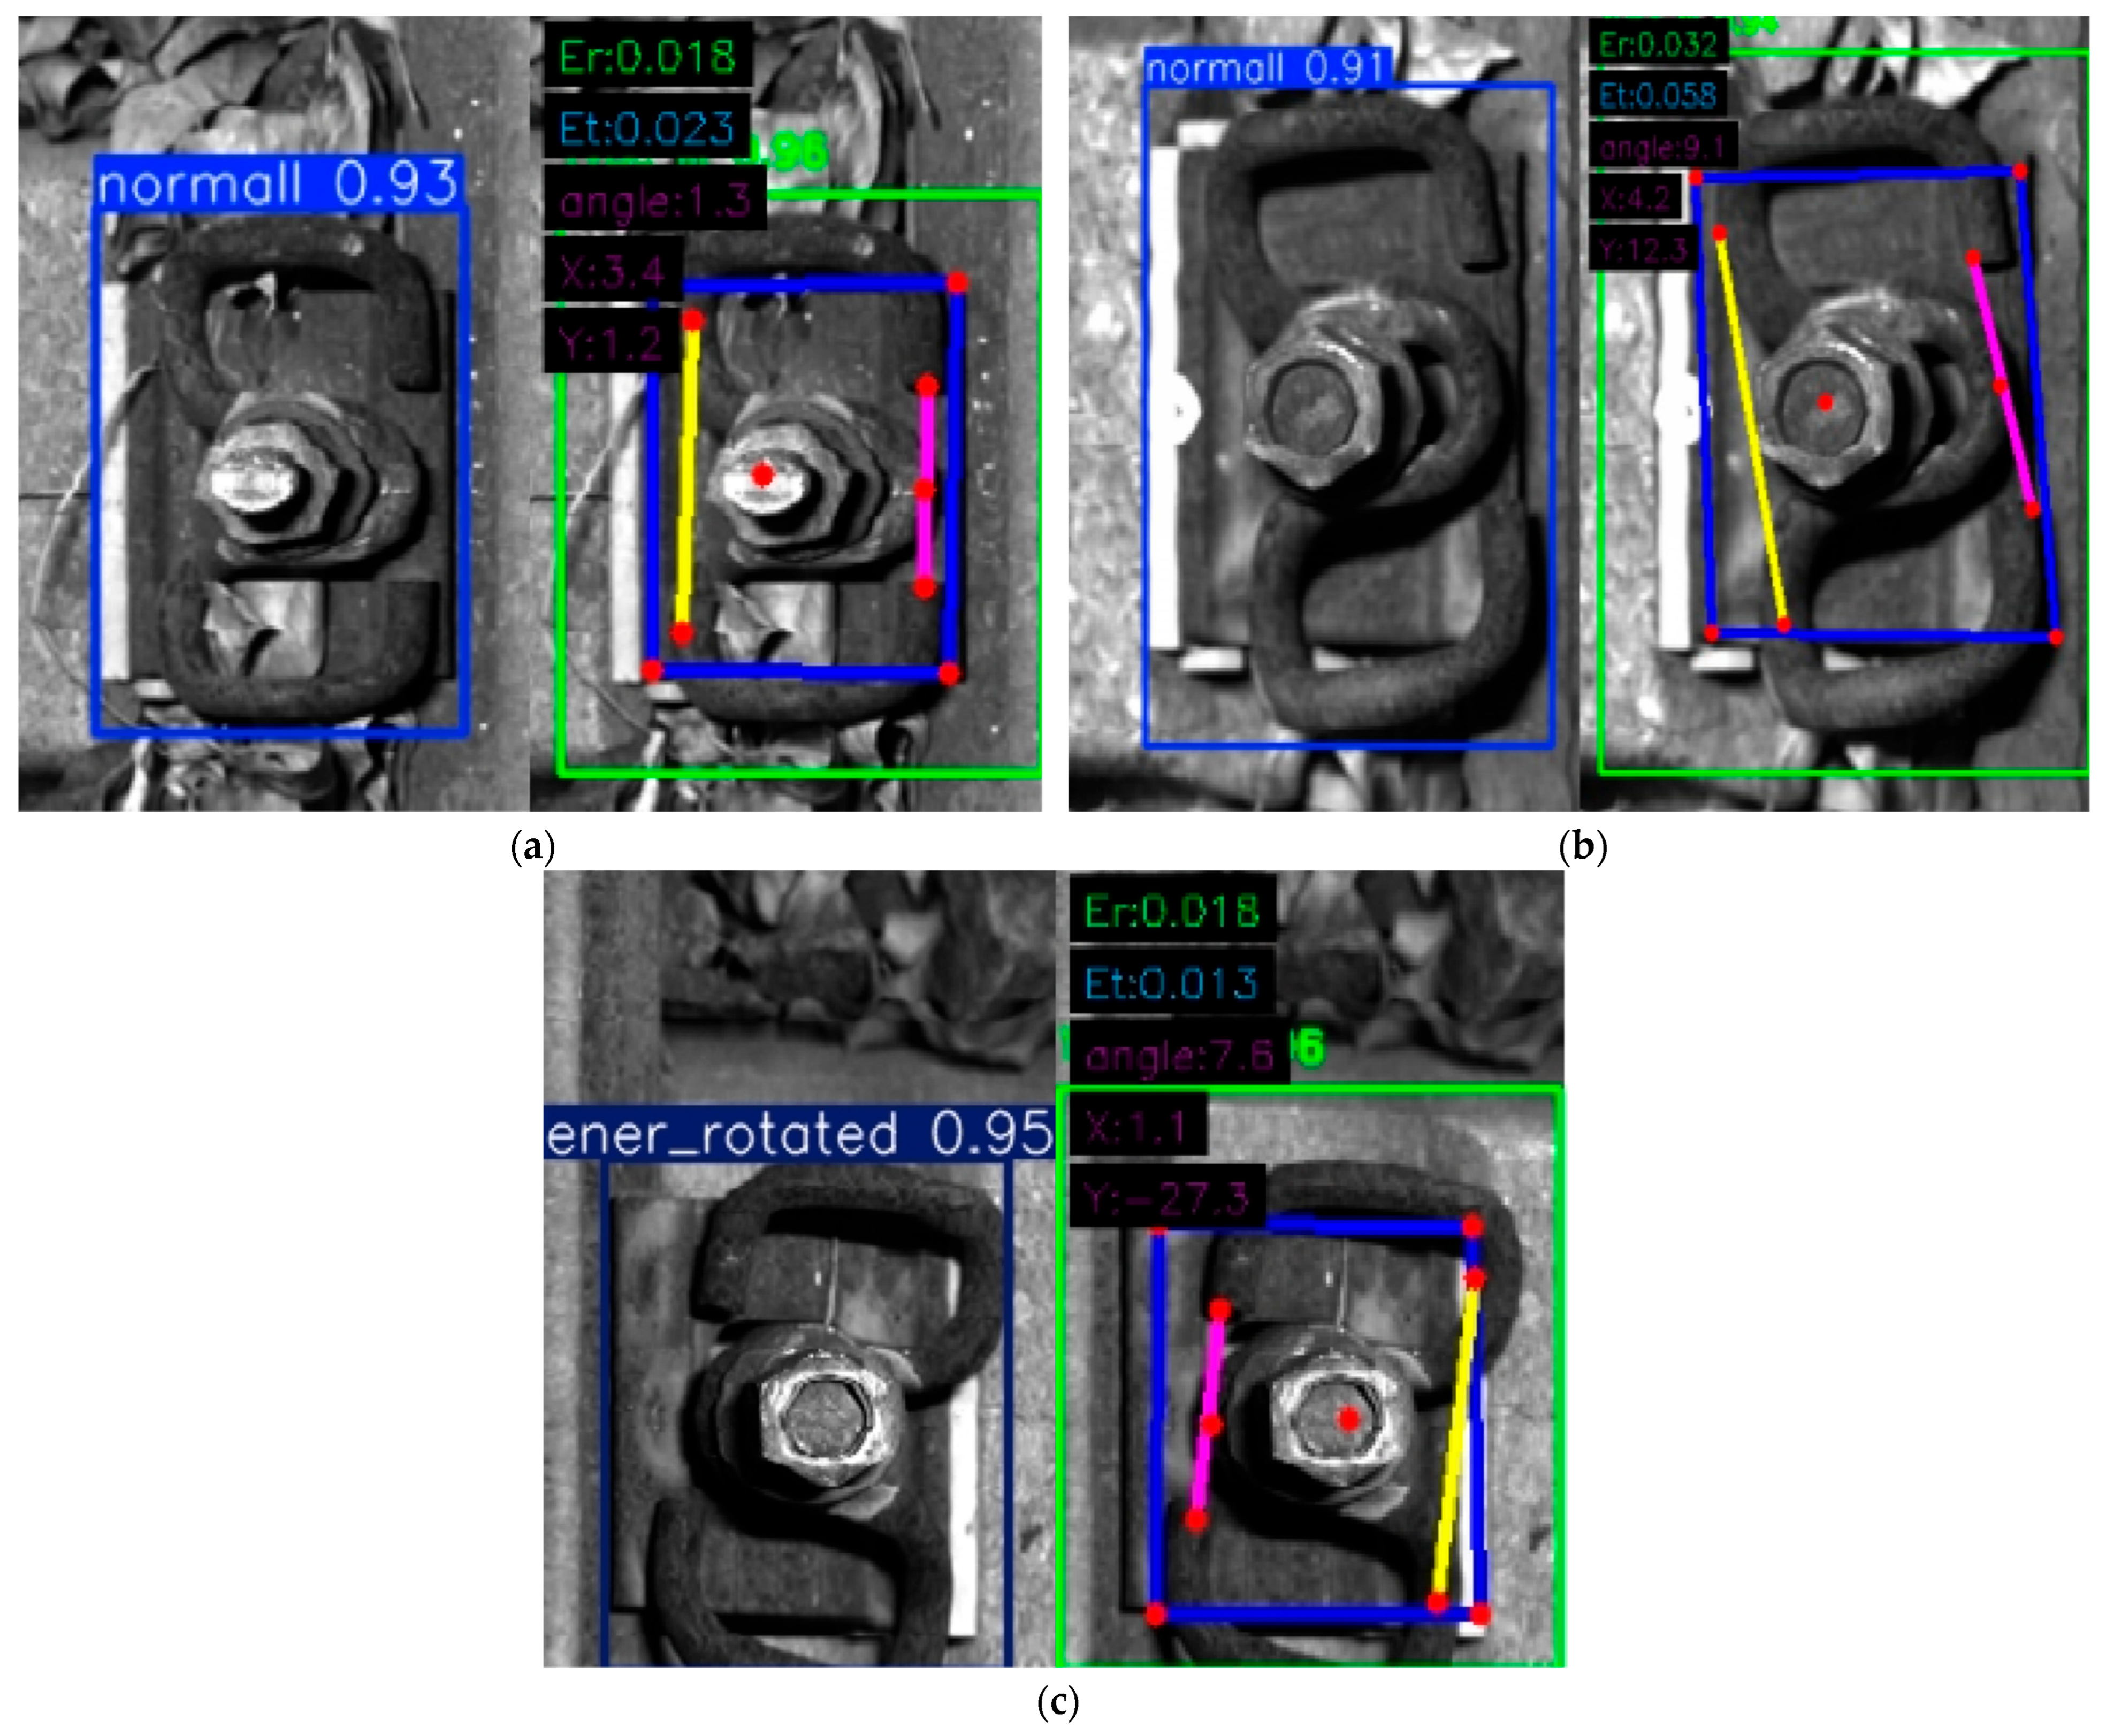
To emphasize the advantage of our method in identifying and quantifying “implicit” defects, a qualitative comparison was conducted with a traditional object detection model based on YOLOv8, designed for fastener state classification (“normal”, “fastener_rotated”). This comparative model represents a common technical approach currently used to address such problems. The comparison results, shown in
Figure 9, clearly reveal the fundamental differences between the two types of methods in terms of detection granularity and sensitivity.
Scenario 1: Consistent Judgment in Normal State (
Figure 9a).
For the fastener in normal condition, the traditional object detection model correctly classified it as “normal”. Our method also correctly identified it as normal, but its advantage lies in providing rich quantitative data: detecting a clip deflection angle of 1.3°, and X and Y-axis displacements of 3.4 mm and 1.2 mm, respectively. These specific values not only confirm the normal state of the fastener but, more importantly, provide data support for establishing a quantitative baseline of fastener health status, achieving a leap from qualitative judgment to quantitative description.
Scenario 2: Missed Detection vs. Accurate Capture of Minor Defects (
Figure 9b).
The clip in this set of images already exhibits visible pose anomalies (10° deflection, 5 mm X-displacement, 10 mm Y-displacement). However, due to its inherent classification paradigm, the traditional object detection model struggled to perceive such continuous, subtle morphological changes, incorrectly classifying it as “normal”, resulting in a serious missed detection. In stark contrast, our method successfully localized the keypoints and output quantitative results of 9.1° angular deflection, 4.2 mm X-axis displacement, and 12.3 mm Y-axis displacement, accurately revealing the presence and extent of the defect. This case strongly demonstrates the unparalleled sensitivity of our method in detecting “implicit” defects compared to traditional methods.
Scenario 3: Qualitative Judgment vs. Quantitative Analysis of Obvious Defects (
Figure 9c).
When the clip pose anomaly is very pronounced (10° deflection, 20 mm Y-displacement), the traditional object detection model could make the correct qualitative judgment, identifying it as “fastener_rotated”. Our method also accurately identified it as abnormal and output measured values of 7.8° angular deflection, 1.1 mm X-axis displacement, and 21.3 mm Y-axis displacement. It is worth noting that there are minor errors between our method’s measurements and the ground truth, which are within the acceptable range for industrial vision measurement. This case shows that when facing obvious defects, while maintaining a high detection rate, the core value of our method lies in its ability to provide precise quantitative data that can guide maintenance decisions, whereas the traditional method can only offer a vague conclusion of “abnormality present”. In summary, this comparative experiment fully confirms the advantages of our method: it not only avoids the missed detection of minor defects inherent in traditional methods but also elevates the detection results from binary classification (yes/no) to precise geometric parameter measurement, laying a solid technical foundation for achieving precise maintenance and condition prediction of rail fasteners.
(2) Analysis of Detection Performance and Limitations of the Proposed Method
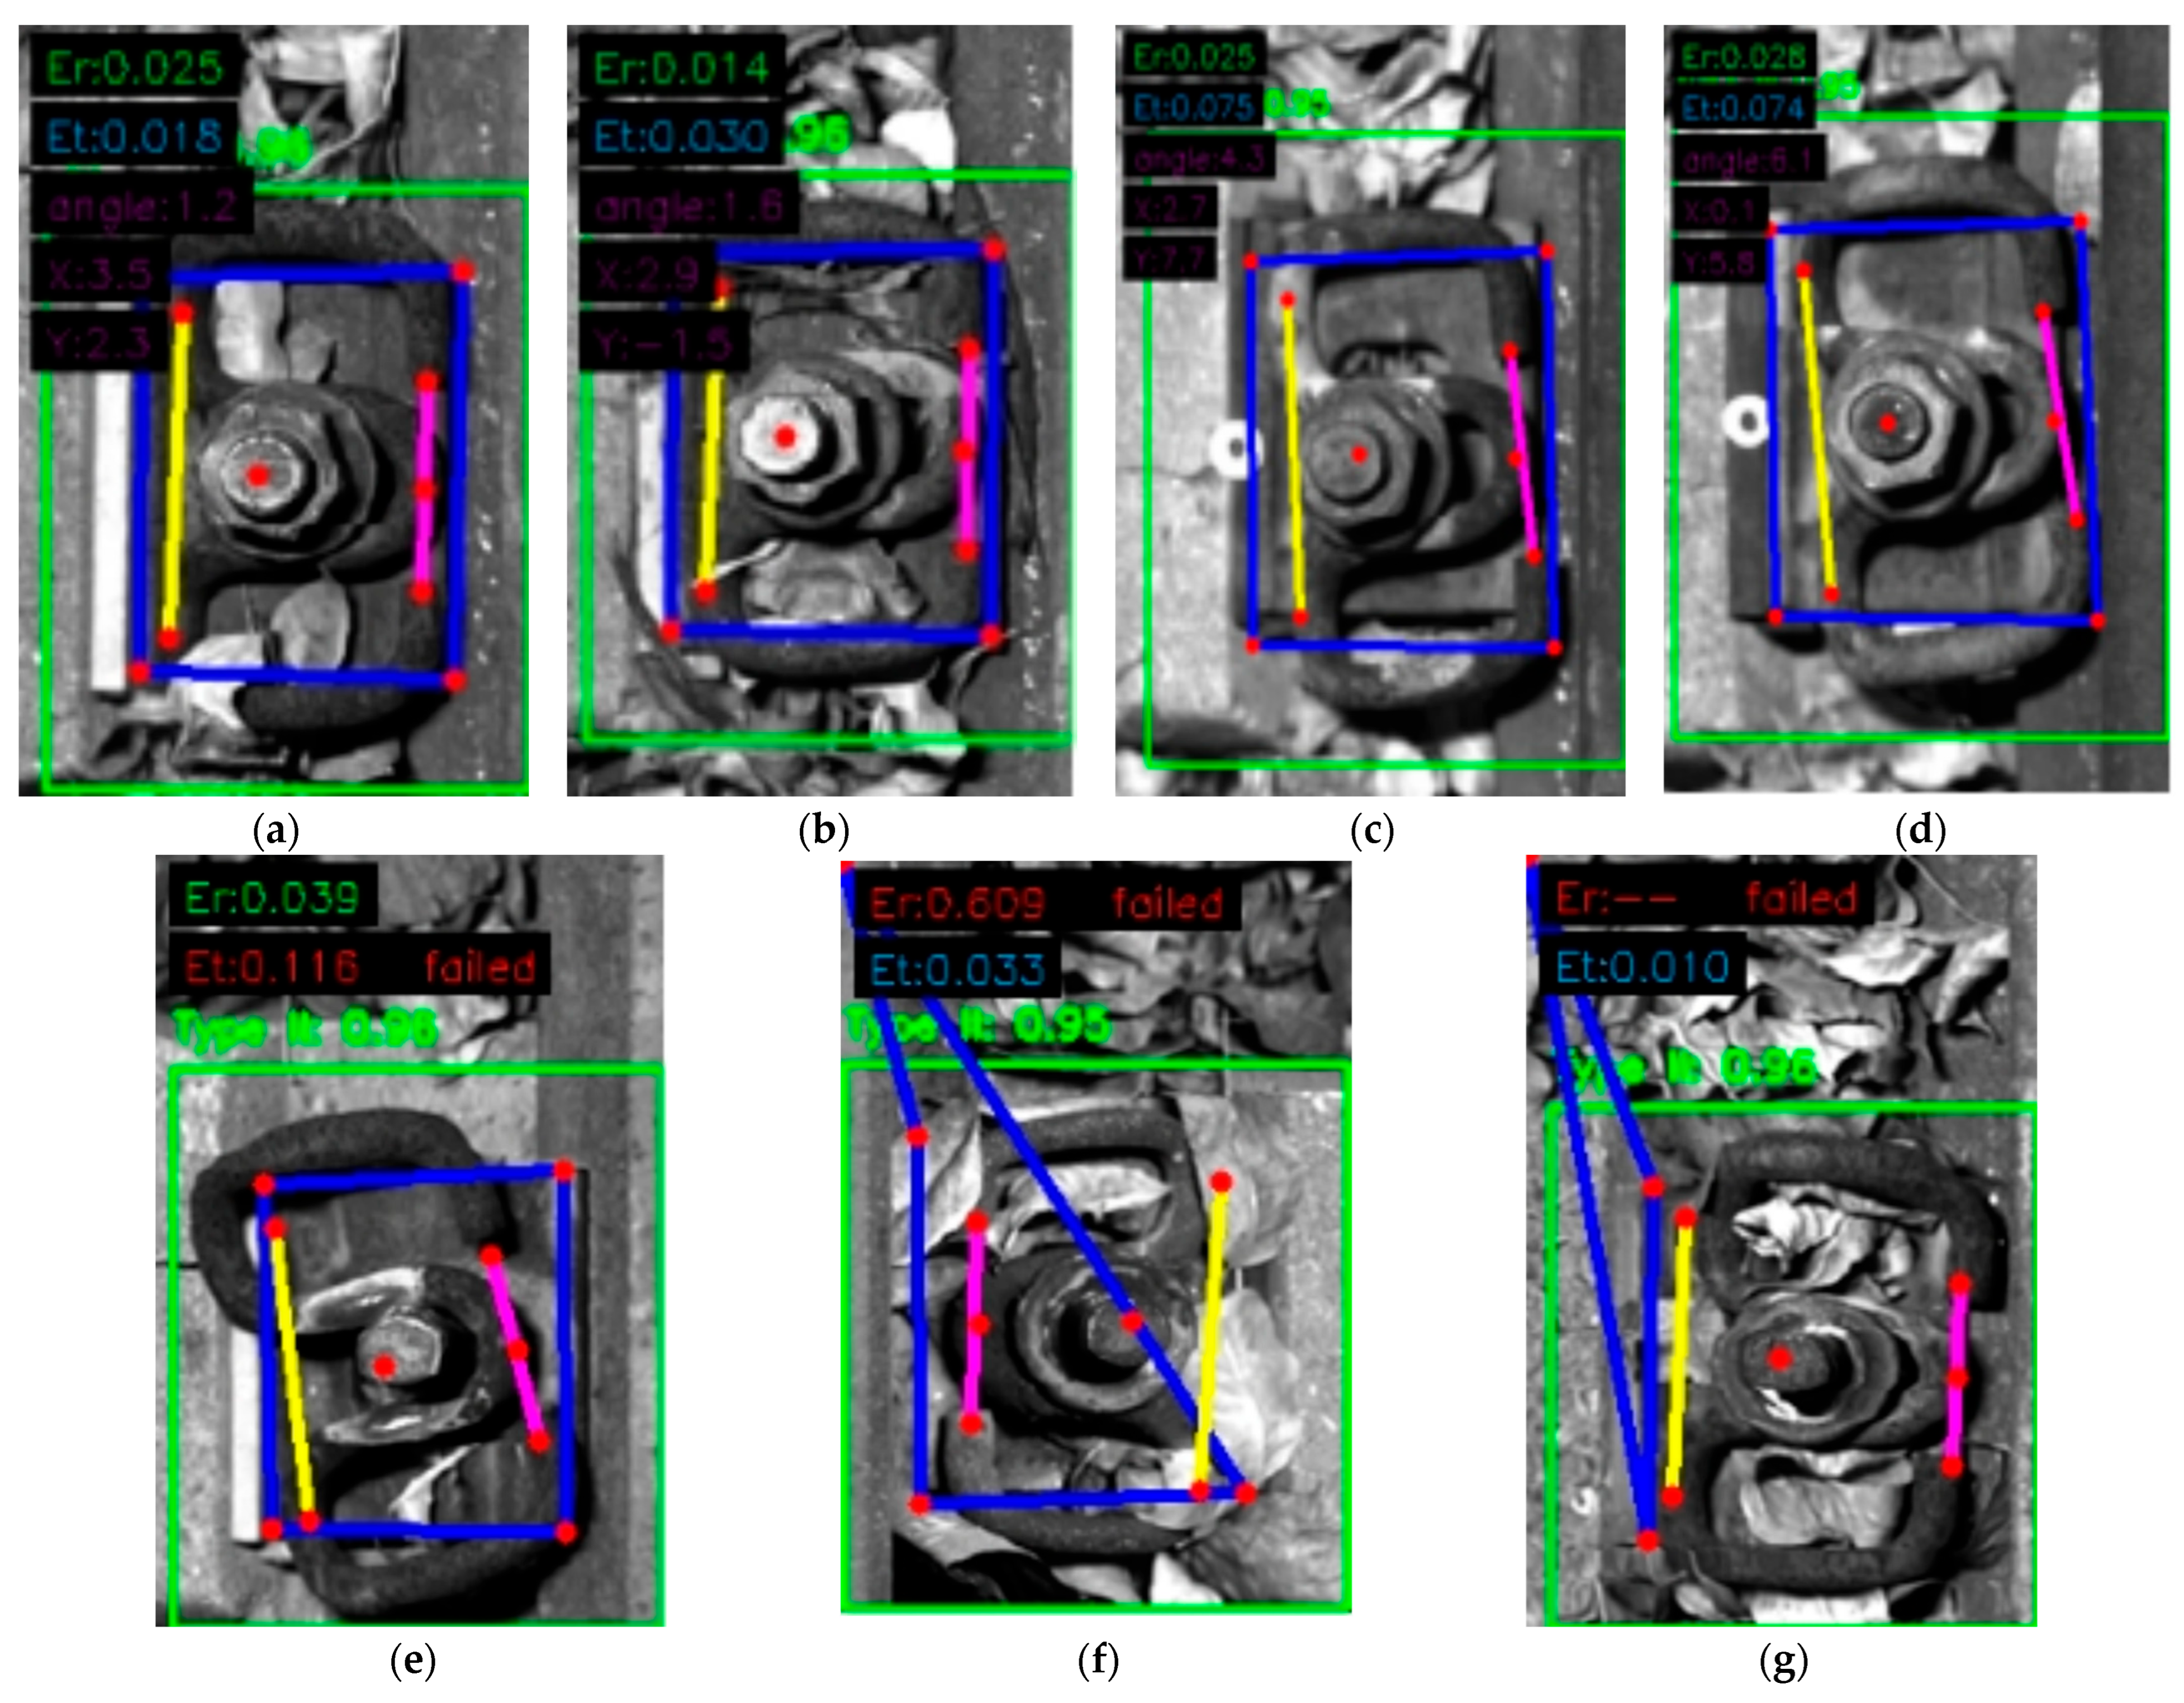
To comprehensively evaluate the performance boundaries of the proposed method in practical scenarios, we selected seven representative images from the test set for visual analysis. The results are shown in
Figure 10.
Figure 10a–d present successful detection cases, while
Figure 10e–g illustrate the limitations of the method under specific conditions.
As shown in
Figure 10a–d, the proposed method demonstrates excellent detection performance across various scenarios with good clip visibility:
For fasteners with normal clip poses (
Figure 10a,b), the quantitative parameters output by our method are (θ = 1.2°, ΔX = 3.5 mm, ΔY = 3.3 mm) and (θ = 1.6°, ΔX = 2.9 mm, ΔY = 1.5 mm), respectively. These values all fall within the normal fluctuation range, validating the measurement reliability of the method under stable conditions and providing data support for establishing a quantitative baseline of fastener health status.
For fasteners with apparent defects, the method similarly exhibits precise quantitative capabilities: As shown in
Figure 10c, the method detected a significant deflection of θ = 4.3° in the clip. Furthermore, in
Figure 10d, the method completely output the pose parameters for a compound defect (θ = 6.1°, ΔX = 5.1 mm, ΔY = 5.8 mm), accurately reflecting the spatial pose of the clip under coupled deflection and displacement conditions.
These successful cases demonstrate that the proposed framework, integrating keypoint detection with spatial constraint verification, effectively distinguishes between normal and abnormal states while achieving stable and reliable quantitative detection of varying clip pose changes.
However, the method exhibits certain limitations under specific conditions:
Verification failure due to keypoint localization deviation (
Figure 10e): When keypoint 9 shows significant localization deviation, the calculated spatial constraint error for target keypoints reaches Er = 0.116, exceeding the preset threshold of 0.1. In such cases, the verification mechanism automatically flags this detection as unreliable and suspends pose calculation, demonstrating the module’s capability to filter low-quality detections.
Keypoint absence caused by occlusion (
Figure 10f,g): When the clip is partially or completely obscured by foreign materials like ballast or snow, the model fails to detect a complete keypoint set. As shown in (
Figure 10f) with 3 missing keypoints and (
Figure 10g) with 5 missing keypoints, the system directly categorizes these instances as detection failures.
These limitations delineate the performance boundaries of the current method, showing that its effectiveness depends heavily on the visibility of critical clip components and the precision of initial keypoint detection. Future work will focus on enhancing the model’s feature reasoning capacity under occluded conditions and improving the verification mechanism’s fault tolerance to broaden the method’s applicability.