Article

The Data-Driven Optimization of Parcel Locker Locations in a Transit Co-Modal System with Ride-Pooling Last-Mile Delivery

College of Urban Transportation and Logistics, Shenzhen Technology University, Shenzhen 518118, China
*
Author to whom correspondence should be addressed.
Appl. Sci. 2025, 15(9), 5217; https://doi.org/10.3390/app15095217
Submission received: 6 March 2025 / Revised: 19 April 2025 / Accepted: 24 April 2025 / Published: 7 May 2025
(This article belongs to the Section Transportation and Future Mobility)

Abstract

:
Integrating passenger and parcel transportation via transit (also known as transit co-modality) has been regarded as a potential solution to sustainable transportation, in which well-planned locations for parcel lockers are crucial for transferring parcels from transit to last-mile delivery vehicles. This paper proposes a data-driven optimization framework on parcel locker locations in a transit co-modal system, where last-mile delivery is realized via a ride-pooling service that pools passengers and parcels using the same fleet of vehicles. A p-median model is proposed to solve the problem of optimal parcel locker locations and matching between passengers and parcel lockers. We use the taxi trip data and the candidate parcel locker location data from Shenzhen, China, as inputs to the proposed p-median model. Given the size of the dataset, an optimization framework based on random sampling is then developed to determine the optimal parcel locker locations according to each candidate’s frequency of being selected in the sample. The numerical results are given to show the effectiveness of the proposed optimization framework, explore its properties, and perform sensitivity analyses on the key model parameters. Notably, we identify five types of optimal parcel location based on their ranking changes according to the maximum number of planned parcel locker locations, which suggests that planners should carefully determine the optimal number of candidate locations for parcel locker deployment. Moreover, the results of sensitivity analyses reveal that the average passenger detour distance is positively related to the density of passenger demand and is negatively impacted by the number of selected locations. We also identify the minimum distance between any pair of selected locations as an important factor in location planning, as it may significantly affect the candidates’ rankings.

1. Introduction

Due to growing concerns regarding global climate change and the need for sustainable development within transportation systems, there has been a consistent push to optimize transport resources to accommodate human and goods transportation. The recent focus has been on merging passenger and freight transportation, a concept that allows for space sharing in single vehicles, like buses, trains, and trams, for both passengers and freight. Frequently referred to as “urban co-modality” in various studies [1,2,3,4,5], this solution has the potential to decrease the demand for freight transport vehicles, ease traffic congestion, enhance service vehicle utilization rates, and ultimately provide environmental benefits such as reducing emissions [6,7,8,9].
Co-modality has long been applied in the transportation sector for decades. Early applications can be found in long-haul transportation modes with sufficient capacities, such as air, rail, and waterborne transportation. However, realizing co-modality via other urban transport modes, such as transit and private vehicles, has not received enough attention until recent years. For example, DHL piloted a system in Schwerin, Germany, where trams and vans were combined to reduce traffic congestion and emissions [10]. Similarly, the Vert-Che-Voux system in Paris utilizes boats and bikes to deliver parcels, demonstrating how alternative modes of transport can complement each other in dense urban areas [11]. Another notable example is Daimler’s concept of combining vans and drones, which aims to enhance last-mile delivery flexibility in hard-to-reach locations [12]. In China, major cities like Beijing and Shenzhen have also launched pilot schemes of integrating passenger and parcel movements via metro systems [13]. As evidenced by the previous studies, introducing co-modality in urban transit systems could bring additional benefits, including reliability and ridership enhancement [14,15,16], extra revenue [17], and more employment [18]. Moreover, urban transit services are ideally suited for implementing co-modality because of their large transport capacities and established infrastructure, such as bus and metro stations, which enhance their potential for mass freight transport, while maintaining low construction and operating costs.
Despite the advantages of co-modality in transit services, challenges arise as most transit lines are fixed or constructed underground (e.g., metro lines), preventing transit vehicles from performing last-mile deliveries. In city logistics, last-mile deliveries refer to the final step in the logistics process, where goods are transported from a distribution center or warehouse to the end customers. This segment is particularly crucial in city logistics due to its complexity and high costs, which can account for up to 53% of the total shipping expenses [19]. Therefore, additional service providers are needed to complete last-mile delivery in transit co-modal systems. As suggested by the previous studies and practical applications, these service providers can be (1) crowdsourced workers who transport freight on foot or by non-motorized vehicles, such as shared bikes and e-scooters [20]; (2) taxis and ride-sourcing vehicles [21]; and (3) robots or autonomous vehicles [22,23,24,25]. Among these last-mile delivery service providers, the ride-sourcing vehicles, which provide flexible door-to-door and prompt ride services to travelers, have shown their great potential in reshaping the way we travel. Like the transit co-modality system, one possible way for the ride-sourcing vehicles to perform last-mile delivery is to integrate last-mile delivery with passengers’ trips, leading to a so-called ride-pooling service with passenger–parcel integration (herein, we use “parcel” to refer to freight). Such integration can yield several advantages. Firstly, it can increase the utilization rate of ride-sourcing vehicles. Secondly, it might make ride-pooling services with parcels more appealing to passengers. On the one hand, passengers’ privacy is better maintained since they share their rides not with strangers, but with parcels, which could be particularly attractive to those who value their privacy during shared rides. Additionally, passengers might experience less detour time compared to ride-pooling with other passengers, given that parcels can endure extended detour routes, so passengers can be given priority for pick-up or drop-off, while being pooled with the parcels.
In order to realize last-mile delivery in the transit co-modal system through ride-pooling services that pool passengers and parcels into the same service vehicles, a critical issue is the proper planning of parcel locker locations, which aligns with the problem of “freight hub location design” for integrated passenger–parcel transportation. These parcel lockers (or hubs) provide temporary storage for parcels following transit transportation and before their collection by ride-sourcing vehicles. The planning objective may be flexible, depending on whom (passengers or parcels) we aim to serve primarily. Despite the previous studies on the freight hub location problem in co-modal systems, we rarely see any research conducted in the context of leveraging ride-pooling services to perform last-mile delivery (see Section 2 for a review of the related literature). Therefore, it remains unclear how to optimally plan parcel locker locations for the transit co-modal systems with ride-pooling last-mile delivery and what the key factors are that affect the planning results.
To fill the research gaps, this paper proposes a data-driven optimization framework for determining the optimal parcel locker locations in a transit co-modal market, in which last-mile delivery is provided by integrating parcels transportation with ride-sourcing passengers. While there are multiple use cases of parcel lockers (e.g., business-to-consumer and consumer-to-consumer parcel lockers), we focus on the location optimization of parcel lockers that provide temporary storage for parcels. The location optimization problem is formulated as a p-median model. We use the trip data extracted from a Shenzhen taxi trip dataset and the location data of candidate parcel lockers as inputs to the proposed p-median model to perform city-wide optimization. To strike a balance between computational efficiency and solution quality, the proposed optimization framework applies a random sampling method to the considered data. Random samples are generated, each containing a subset of trips of the whole trip dataset. The p-median model is then solved for each sample, and the optimal locations of the parcel lockers are finally determined based on each candidate location’s frequency of being selected among all the samples. Numerical experiments are conducted to examine the effectiveness of the proposed optimization framework and explore the effects of crucial model parameters on the optimization outcome. Furthermore, we propose a ranking-based classification for the candidate locations based on the experiment results, through which policy implications are provided.
The contributions of this paper are summarized as follows.
  • We develop an optimization framework based on random sampling to determine the optimal parcel locker locations in a transit co-modal system incorporating ride-pooling services to perform last-mile delivery;
  • We propose a ranking-based classification for the candidate parcel locker locations, classifying the candidate locations into five types and offering policy implications;
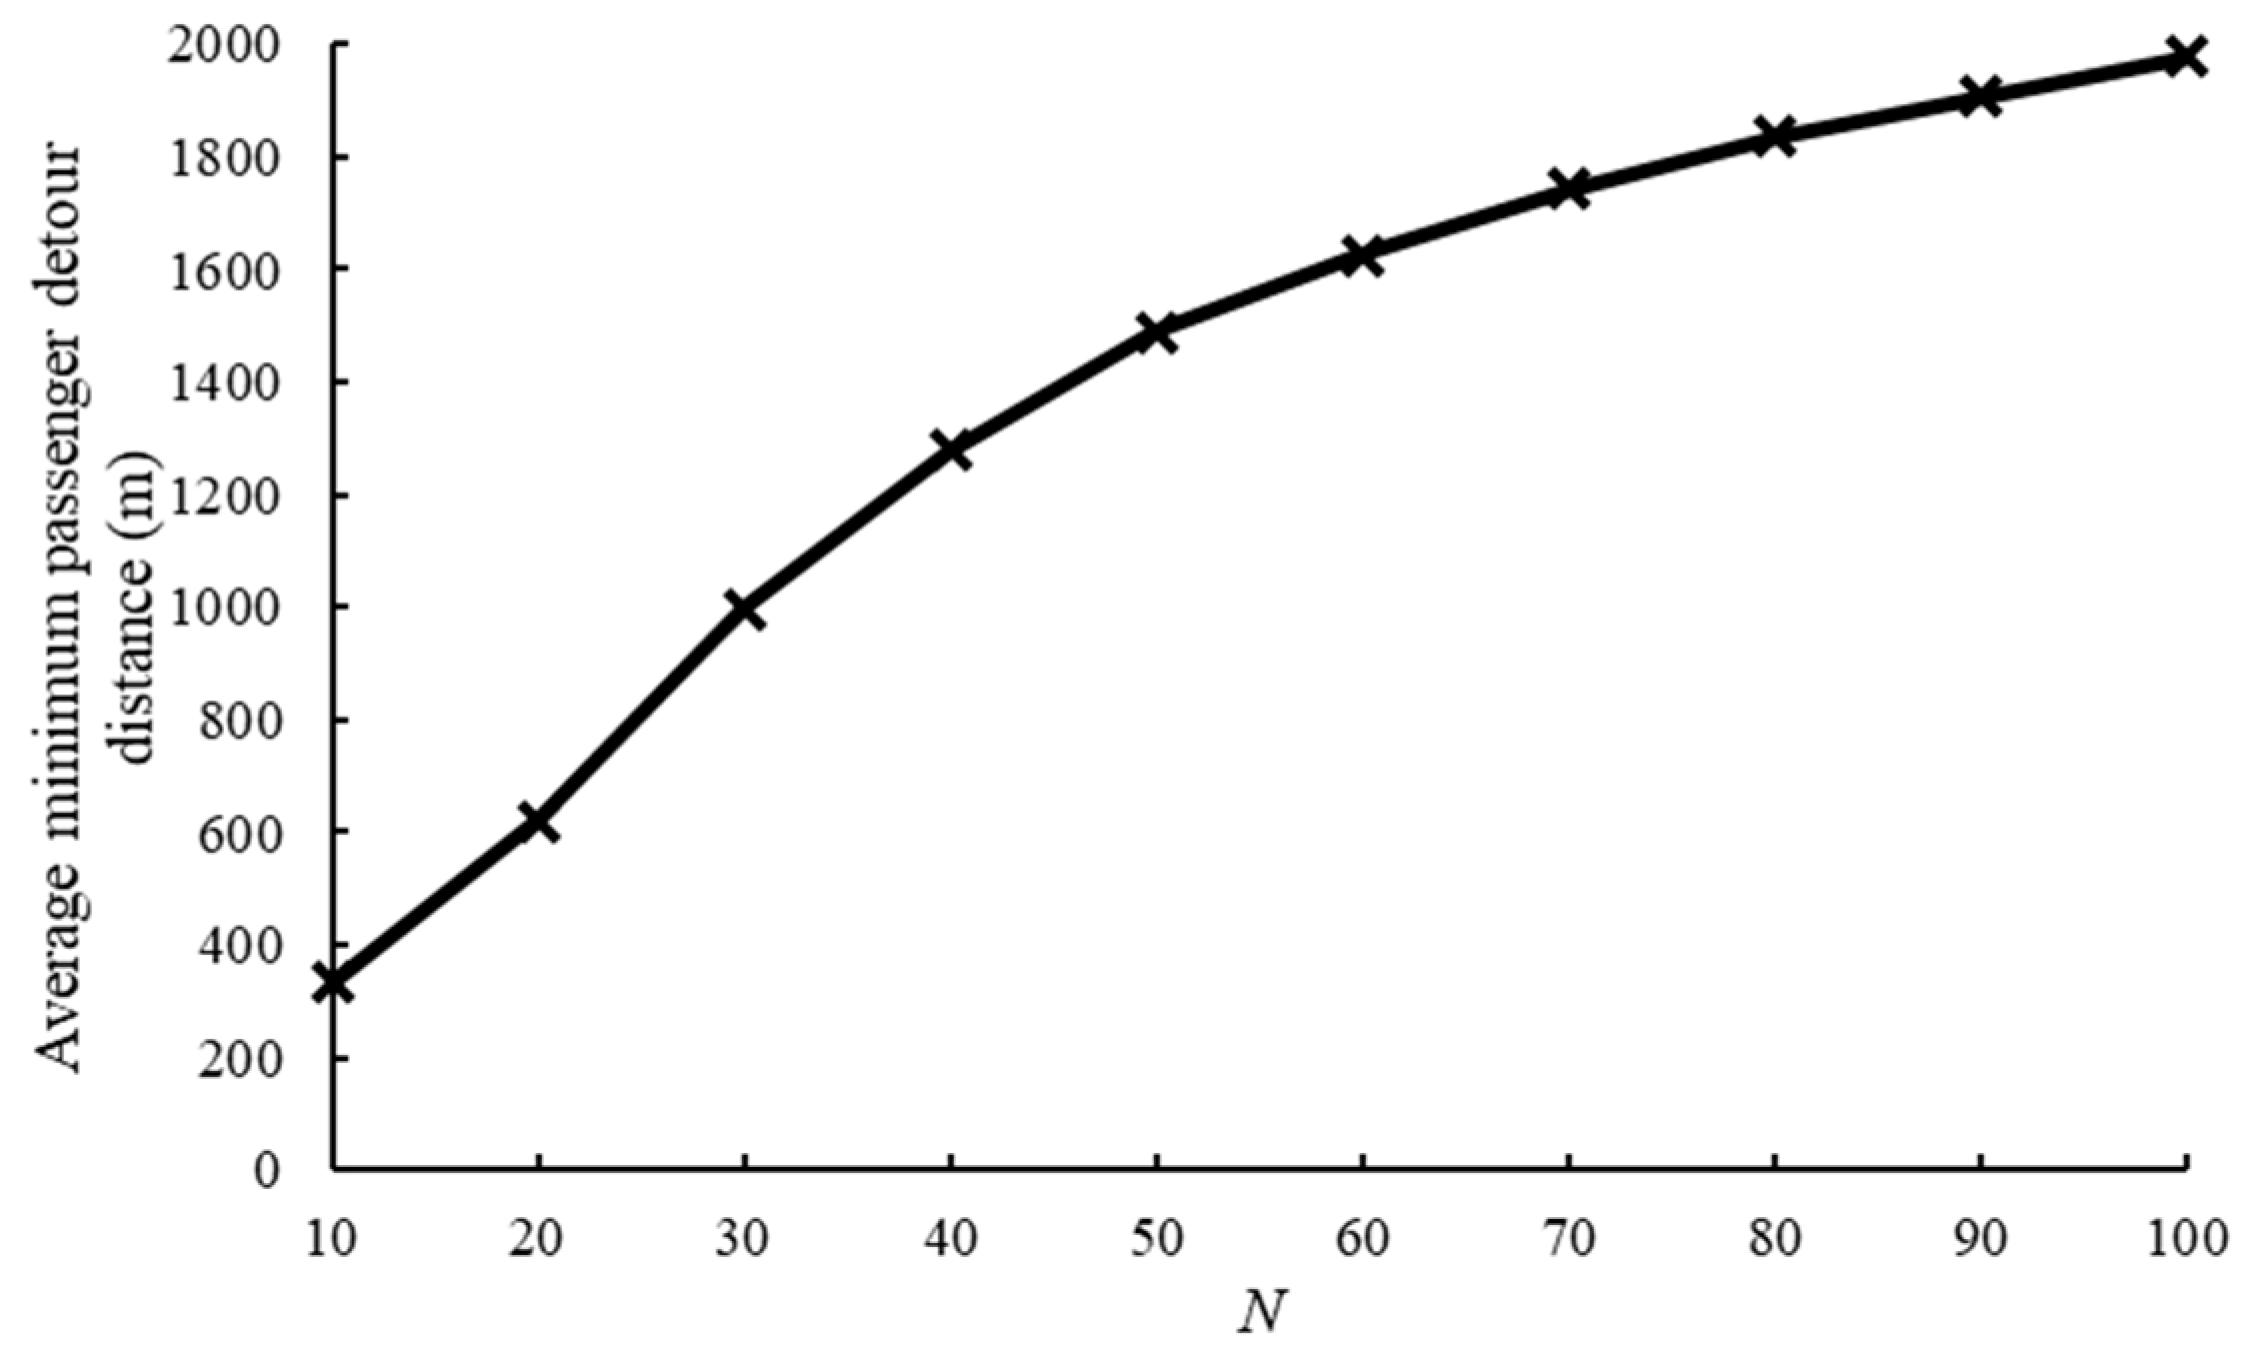
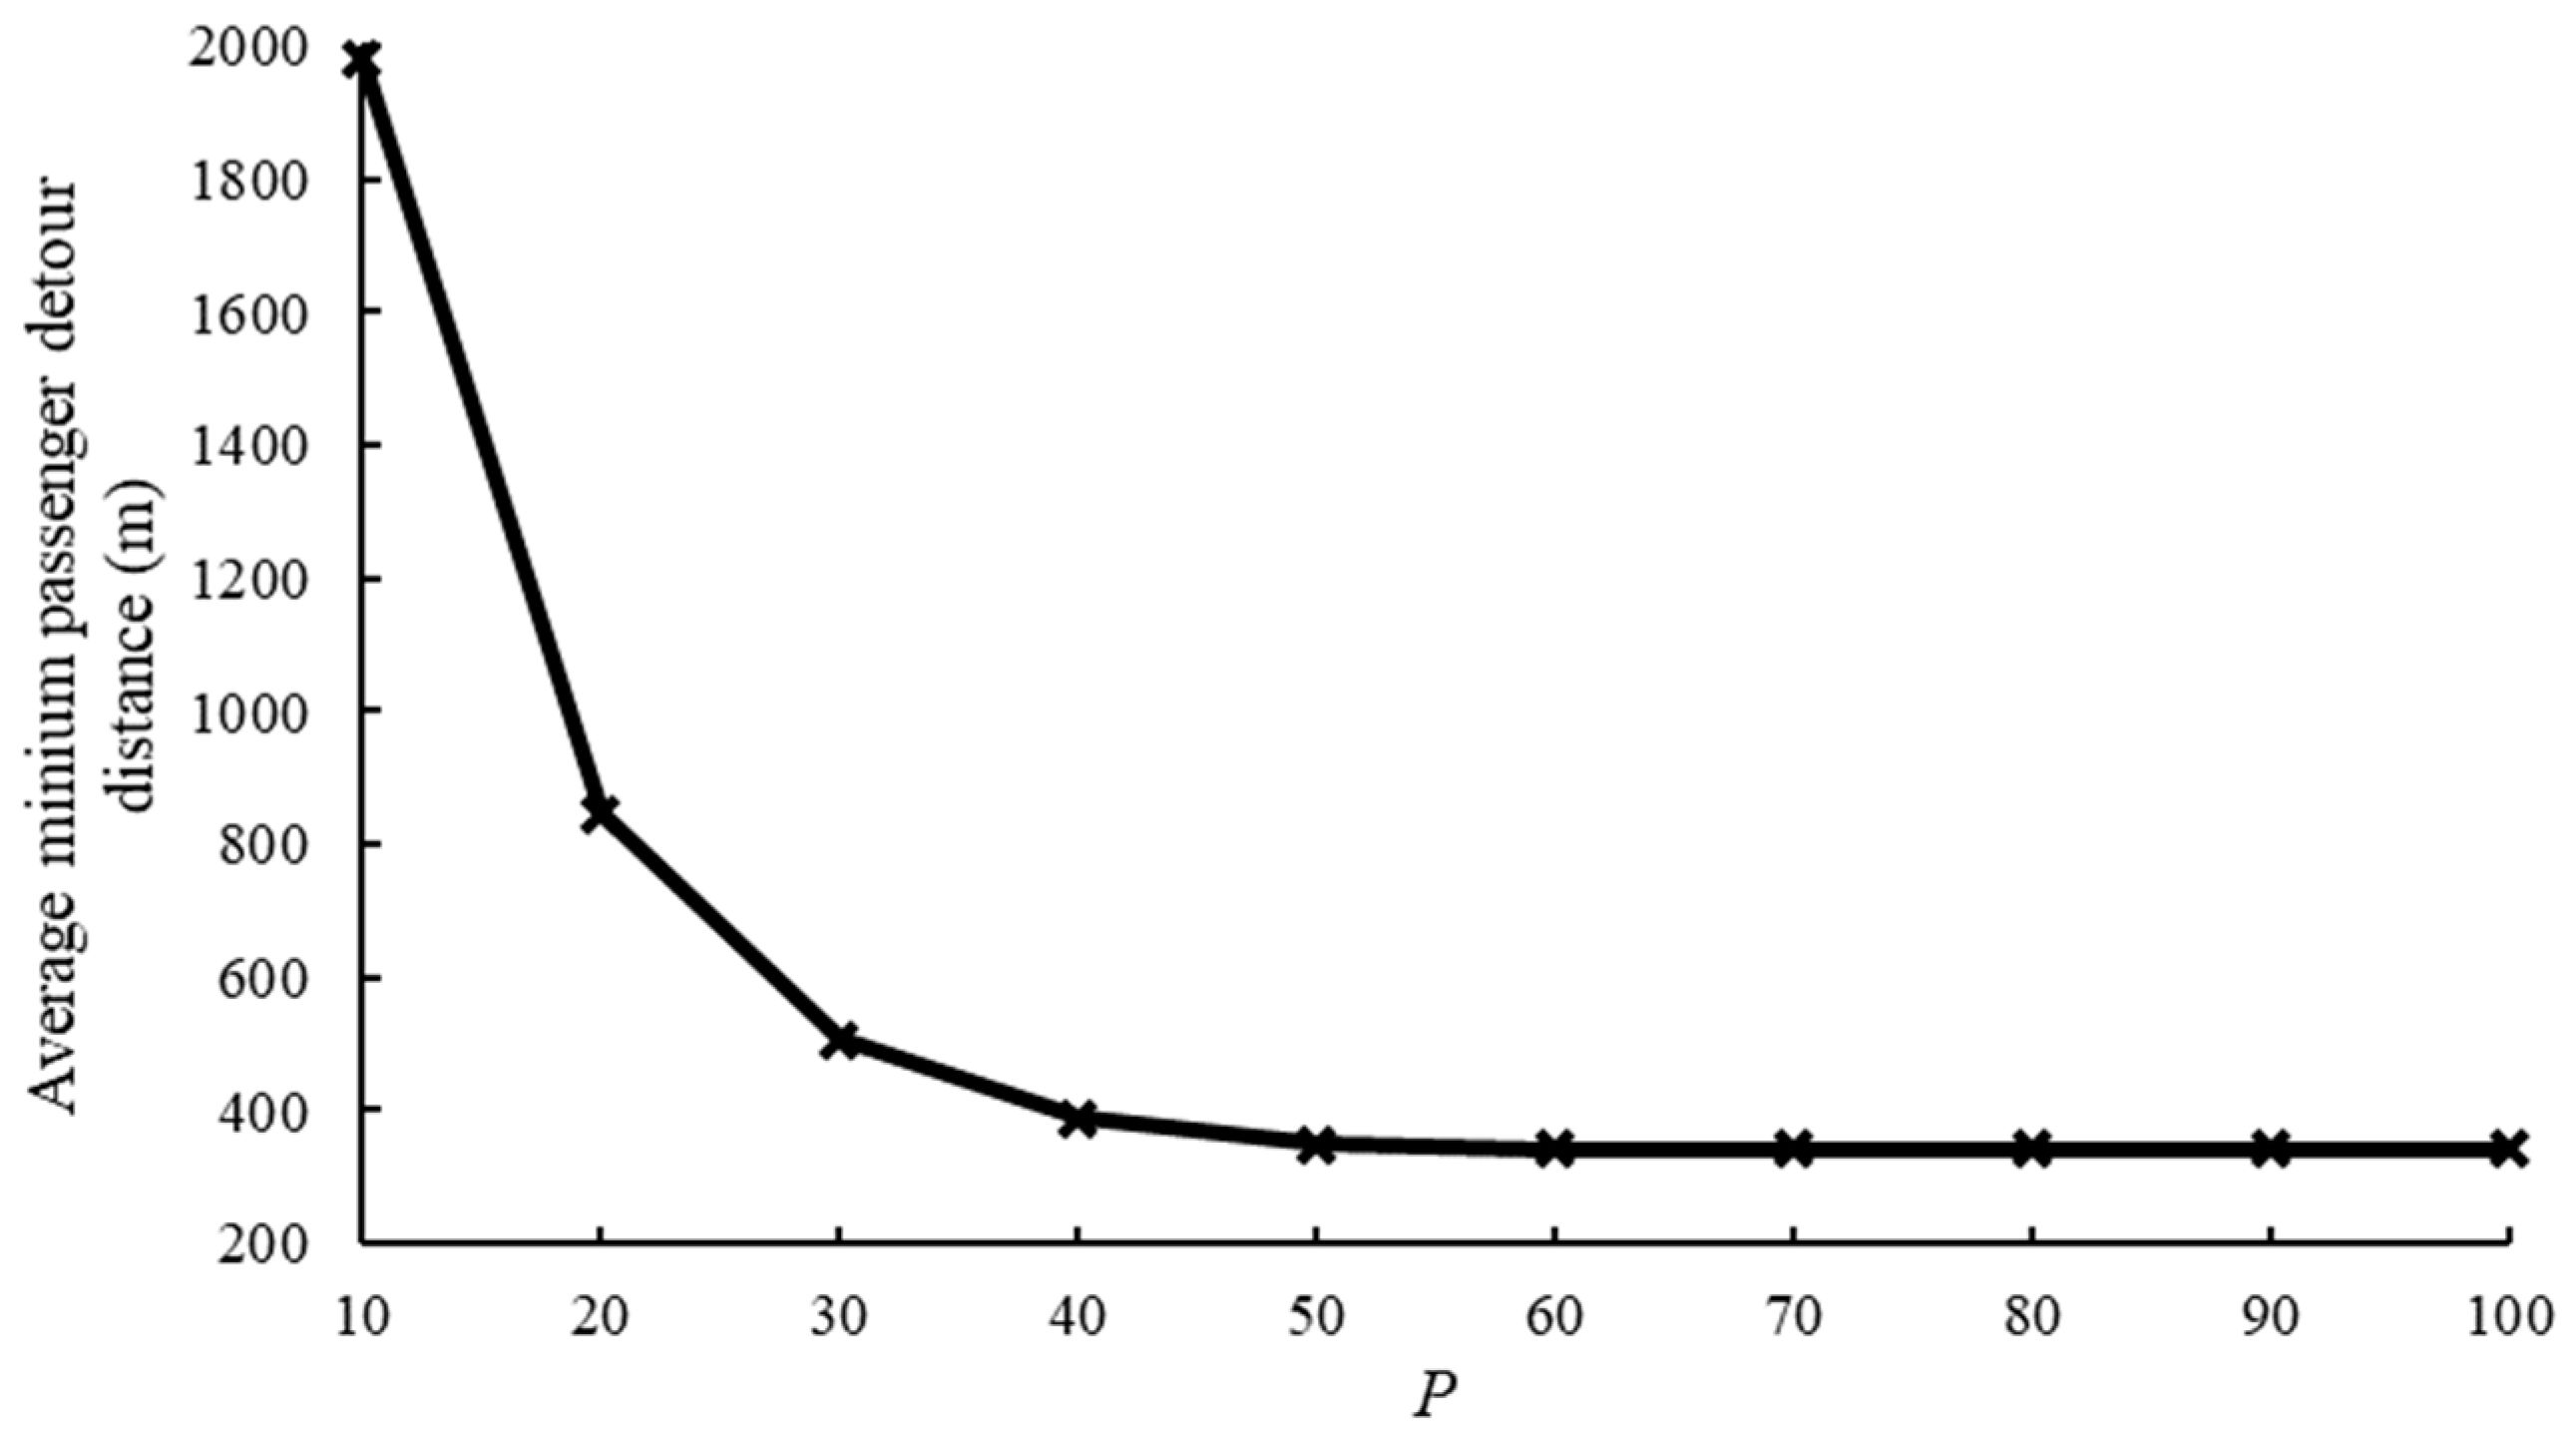
  • We discover that the average minimum detour distance of ride-pooling passengers can be positively affected by the density of ride-pooling demand and negatively impacted by the number of selected locations, thereby providing insights into the planning of parcel locker locations.
The remainder of the paper is organized as follows. Section 2 reviews the existing literature related to this study. Section 3 specifies the scenario design for the ride-pooling service with passenger–parcel integration considered in this study. Section 4 develops the p-median model that solves the location planning problem of parcel lockers. Section 5 establishes the optimization framework for parcel locker locations. Section 6 presents the numerical experiments. Finally, Section 7 concludes this paper.

2. Literature Review

In terms of integrated passenger–parcel transportation, the most recent reviews were conducted by the authors of [9,26,27]. We refer the readers to the above works for a comprehensive overview of the studies on integrated passenger–parcel transportation.
For the freight hub location problem in co-modal transit systems, seeking a well-planned freight hub location remains a critical technical challenge in the field, and the solution is expected to minimize potential conflicts between passengers and freight [26]. Notable studies on this problem include the following. [28] proposed an underground logistics network planning method using the metro system in Nanjing, China, as an example. The optimal locations of underground depots and ground terminals were determined through a mixed integer programming model. While this study considered the freight transportation from underground metro lines to ground delivery, last-mile delivery was not explicitly modeled, and the type of delivery vehicle was not specified. [29] formulated a location model to determine the distribution hubs for a metro-integrated logistics system that incorporates couriers as first/last-mile service providers. The couriers were assumed to deliver goods to clients using motorcycles or small trucks. [30] developed a hub-and-spoke structure for a multimodal passenger-and-package sharing service, in which the packages were transported between hubs via the metro, and the first/last-mile delivery between the hubs and the customers was performed by trucks and taxis. A p-hub median model and a p-hub assignment model were formulated to optimize the hub locations. [31] studied the optimal location of a freight transfer hub that minimizes the expected delivery distance between the hub and all customers, in which the authors considered the location of a single transfer hub in the system and the conventional (small) vehicles for last-mile delivery. The problem was formulated as a mixed linear program and solved by a heuristic algorithm. [32] envisioned a public transport-based crowd-shipping service with backup transfers, in which express delivery demands were fulfilled by crow-shippers and public transports, with zero-emission vehicles (e.g., electric vans) providing the transfer services between public transport connection points if necessary. The authors adopted a scenario-based two-stage stochastic programming approach to formulate the envisioned service and to optimize the location where a connection was provided between public transit lines.
None of the studies mentioned above explicitly considered ride-pooling for first/last-mile delivery. Only [30] considered taxis as spoke transport that connects freight hubs with parcel senders and receivers and investigated how the proportion of taxi drivers willing to carry packages may impact the system’s performance. Nonetheless, the authors did not consider pooling taxi passengers with packages, where passengers may need to detour to cater to package delivery. As a result, their hub location model did not count for the taxi passengers’ travel costs, which is plausible in the context of separately transporting packages with idle vehicles, but may be flawed if we allow for the two parties to share their trips.
Pooling passengers and parcels with on-demand ride service vehicles has gained attention from researchers recently. A large body of the related literature focuses on the route planning of service vehicles and mainly deals with developing mathematical models and solution algorithms for models (see a more detailed and comprehensive review in [33]). As a pioneer study, [21] investigated the so-called share-a-ride problem in a taxi market with pooled passengers and parcels. They developed a mixed-integer linear program for the problem and considered a freight insertion problem to reduce computational complexity. [22] extended the share-a-ride problem to consider the use of autonomous vehicles equipped with parcel lockers and developed a mixed-integer linear program to solve the optimal vehicle routing strategies. [34] considered passenger–parcel pooling in a way that parcels can be transported to their destination in a multi-hop manner, i.e., parcels can be trans-shipped between different service vehicles before they arrive at their destinations. They proposed a distributed model-free deep reinforcement learning algorithm to determine the optimal vehicle dispatching policy. [23] developed a mixed-integer linear program to optimize the routing of a fleet of shared autonomous vehicles among a set of randomly generated trip requests of both passengers and parcels. [24] investigated passenger–parcel pooling in an autonomous vehicle intelligent system. The authors attempted to optimize the routing and loading strategies of the autonomous vehicles so that the total system operation cost was minimized. A mixed-integer linear program was proposed and solved with the Lagrangian dual decomposition method. [35] optimized the service vehicle routing and passenger–parcel matching in a ride-pooling market. The authors explicitly considered two types of service vehicle, i.e., conventional ride-pooling service vehicles to serve both passengers and parcels, and electric motorcycles tailored to transport parcels only. Moreover, the parcels were classified according to their sizes and urgency. A two-level lexicographic multi-objective optimization model was developed, and then divided into a set of small-scale subproblems for solving.
Apart from the above studies that primarily focused on service vehicle routing, we also notice another stream of simulation-based studies aiming to evaluate the implementational effects of passenger–parcel pooling services. For example, [36] developed a static optimization model to evaluate the effects of two types of passenger–parcel pooling strategies using real-world vehicle scheduling and logistics data from Munich, Germany. The two investigated scenarios differ in service vehicles’ pick-up and drop-off sequences, while serving passengers and parcels. The results obtained in this study were further validated by [37], in which a simulation framework was proposed to evaluate the performances of the two service scenarios with temporal and spatial dynamic demands. [25] conducted a simulation-based study to investigate the effects of passenger–parcel pooling with a fleet of autonomous and modular vehicles. The simulation results demonstrated that the additional demand for parcel transport barely affects the waiting time of passengers if the flee size is large. [38] conducted simulation-based pricing analysis on the integrated passenger–parcel transportation by e-hailing taxis.
This literature review reveals the existence of the following research gaps. Firstly, none of the existing studies on the parcel locker location problem in transit co-modal systems considered ride-pooling services for last-mile delivery, in which the travel costs of ride-pooling passengers should be taken into consideration to ensure the practicability of integrating ride-pooling passengers with parcel delivery. Secondly, it remains unclear what the key factors are that affect the optimal parcel locker locations.

3. Scenario Design for the Ride-Pooling Services with Passenger–Parcel Integration

We give a necessary introduction to the scenario design of the ride-pooling services with passenger–parcel integration before we dive into the detailed formulation of the parcel locker location planning problem. In the existing literature, ride-pooling services with passenger–parcel integration usually take place between a ride-pooling passenger and no less than one parcel(s). When a passenger is ride-pooled with more than one parcel, he/she may have to spend more time picking up/dropping off the parcels, which may further lower the passengers’ willingness to participate in integration and add to model complexity. Therefore, we only consider the case where a passenger and a parcel are pooled into a ride.
There are various service scenario designs of passenger–parcel integration in ride-pooling services, which can be distinguished according to the pick-up and drop-off sequences of the pooled passengers and parcels. For example, in [37], two ride-pooling service scenarios were classified based on the routing sequence of the service vehicles, which are termed moderate integration and full integration. Figure 1a,b provides a simple illustration of these two scenarios. Moderate integration stipulates that the passenger does not deviate from his/her trip path from the origin to the destination due to picking up or dropping off the parcel. This means that although the passenger and the parcel are integrated into the same service vehicle, their trip paths do not overlap. Full integration, however, relaxes the non-overlapping constraint and allows for the service vehicle to detour to pick up or drop off the parcel while the passenger is onboard. That being said, one should be aware that passengers under full integration may experience extra detour time if the vehicle drops off the parcel first, and then the passengers. Therefore, to give priority to passengers so as to sustain their willingness to get involved in such an integrated service mode, we adapt full passenger–parcel integration, but require that the service vehicle routing follows the sequence of passenger origin, parcel origin, passenger destination, and parcel destination (as illustrated in Figure 1b). Such a requirement guarantees that passengers are not fully compromised on parcel delivery in terms of routing and is expected to strike a balance between the costs of passenger travel and parcel delivery.
The usage and operational model of parcel lockers can also have significant impacts on the functionality of the integrated service. Parcel lockers can be categorized into several types based on their use case. For instance, business-to-consumer parcel lockers are deployed by retailers and e-commerce companies for curbside pick-up or in-store package collection, enhancing customer convenience. Consumer-to-consumer parcel lockers support peer-to-peer exchange in re-commerce or community-based transactions, addressing need for secure, centralized drop-off/pick-up points. In terms of operational models for parcel lockers, two commonly seen models are the open locker and the closed locker systems. An open locker system allows for multiple delivery service providers to use the same locker infrastructure, promoting shared access and reducing redundancy [39]. In contrast, a closed locker system is typically operated by a single logistics provider or retailer, serving only their specific customers [40]. The parcel lockers considered in this study refer to those providing temporary storage to the parcels and are exclusively owned by the integrated service provider.

4. The p-Median Model for Planning Parcel Locker Locations

In the proposed service scenario, it is critical to properly locate the parcel lockers and to designate each passenger to a location to pick up parcels. Suppose the ride-pooling market has N passengers and M candidate locations for parcel lockers, we let i I = { 1 , 2 , , N } and j J = { 1 , 2 , , M } be the indices for ride-pooling passengers and candidate locations for the parcel lockers, where I and J further denote the set of passengers and the candidate parcel locker locations. We assume there is an exogenously given number of parcel locker locations to be selected, which is assumed to be a constant parameter denoted as P . Then, the planner chooses P locations where the parcel lockers are to be deployed among M candidates, such that the overall detour distance experienced by N passengers for picking up the parcels is minimized. Therefore, matching between the passengers and the parcel locker locations needs to be simultaneously determined while choosing P locations, without which the overall passenger detour distance cannot be obtained. Moreover, since we lack the historical data on urban parcel deliveries, it is assumed that there are always enough parcels at any parcel locker j J to be pooled with the passengers.
In light of the above setting, we adapt the well-known p-median model (also known as the p-Hub median model) [41,42] to formulate the parcel locker location planning problem. The p-median model is a fundamental optimization framework used in location analysis and facility planning, in which “p” represents the predefined number of facilities to be located. Moreover, we notice that there are other commonly used location planning models that have different objectives compared with those of the p-median model. For example, the p-center model aims to locate “p” facilities to minimize the maximum cost between any OD pair [43,44]; the hub maximal covering problem aims to locate a set of hubs such that the total flows between all the OD pairs can be maximized [45]. In this paper, since our goal is to determine the optimal placement of parcel lockers to minimize the total detour distance between the passengers and the designated parcel lockers, the p-median model is considered to be an appropriate choice and is hence adopted. The p-median model for parcel locker location planning (denoted as PM) is formulated as follows:
min x i j , y j   Z = i I j J x i j d i j
s.t.
j J y j = P
x i j y j ,   i I ,   j J
j J x i j = 1 ,   i I
x i j , y j { 0 , 1 } ,   i I ,   j J
Objective function (1) is to minimize the total passenger detour distance Z by determining the values of the two binary variables x i j and y j , where x i j equals 1 if passenger i is pooled with a parcel stored at location j , and 0 otherwise. y j equals 1 if a parcel locker is installed at location j , and 0 otherwise. d i j is the detour distance experienced by passenger i if he/she is pooled with a parcel stored at location j . The computation of d i j is illustrated in Figure 2 below. There are three nodes in Figure 2 denoted as nodes A, B, and C. Let nodes A and B be the trip origin and destination of passenger i , respectively, and C is the parcel locker location j . l A C ,   l C B ,   and   l A B stand for the travel distances from A to C, from C to B, and from A to B. Then, we have d i j = l A C + l C B l A B .
Constraint (2) requires that the number of selected candidate parcel locker locations be equal to P , which, as mentioned above, is assumed to be pre-determined in this paper. Normally, P is no more than M to ensure that the model is realistic. Constraint (3) stipulates that passenger i can be pooled with a parcel stored at location j only if j is selected. Constraint (4) indicates that each passenger is assigned to one location only. Constraint (5) defines the variable domains.
Again, we note that in PM, we do not consider whether there are any parcels available at the parcel lockers since we lack the parcel delivery data. Technically, such a consideration can be modeled by introducing a linear constraint i x i j C j ,   j J to PM, in which C j is the parameter representing the number of parcels stored at parcel locker j . Moreover, the PM formulation implicitly treats all the passengers as being willing to share their trips with the parcels. Such an assumption can be relaxed by introducing multiple user classes into the model, in which there can be a class of sharing-reluctant passengers who are not willing to share their rides.

5. An Optimization Framework for Parcel Locker Locations with Randomly Sampled Passenger Trip Data

This study utilizes real-world data as inputs to the proposed PM model, which could make the number of decision variables large and the model computationally inefficient to solve. Therefore, an optimization framework based on random sampling is proposed. Section 5.1 and Section 5.2 introduce the Shenzhen taxi trip data and the candidate parcel location data, respectively. Section 5.3 presents details of the proposed optimization framework.

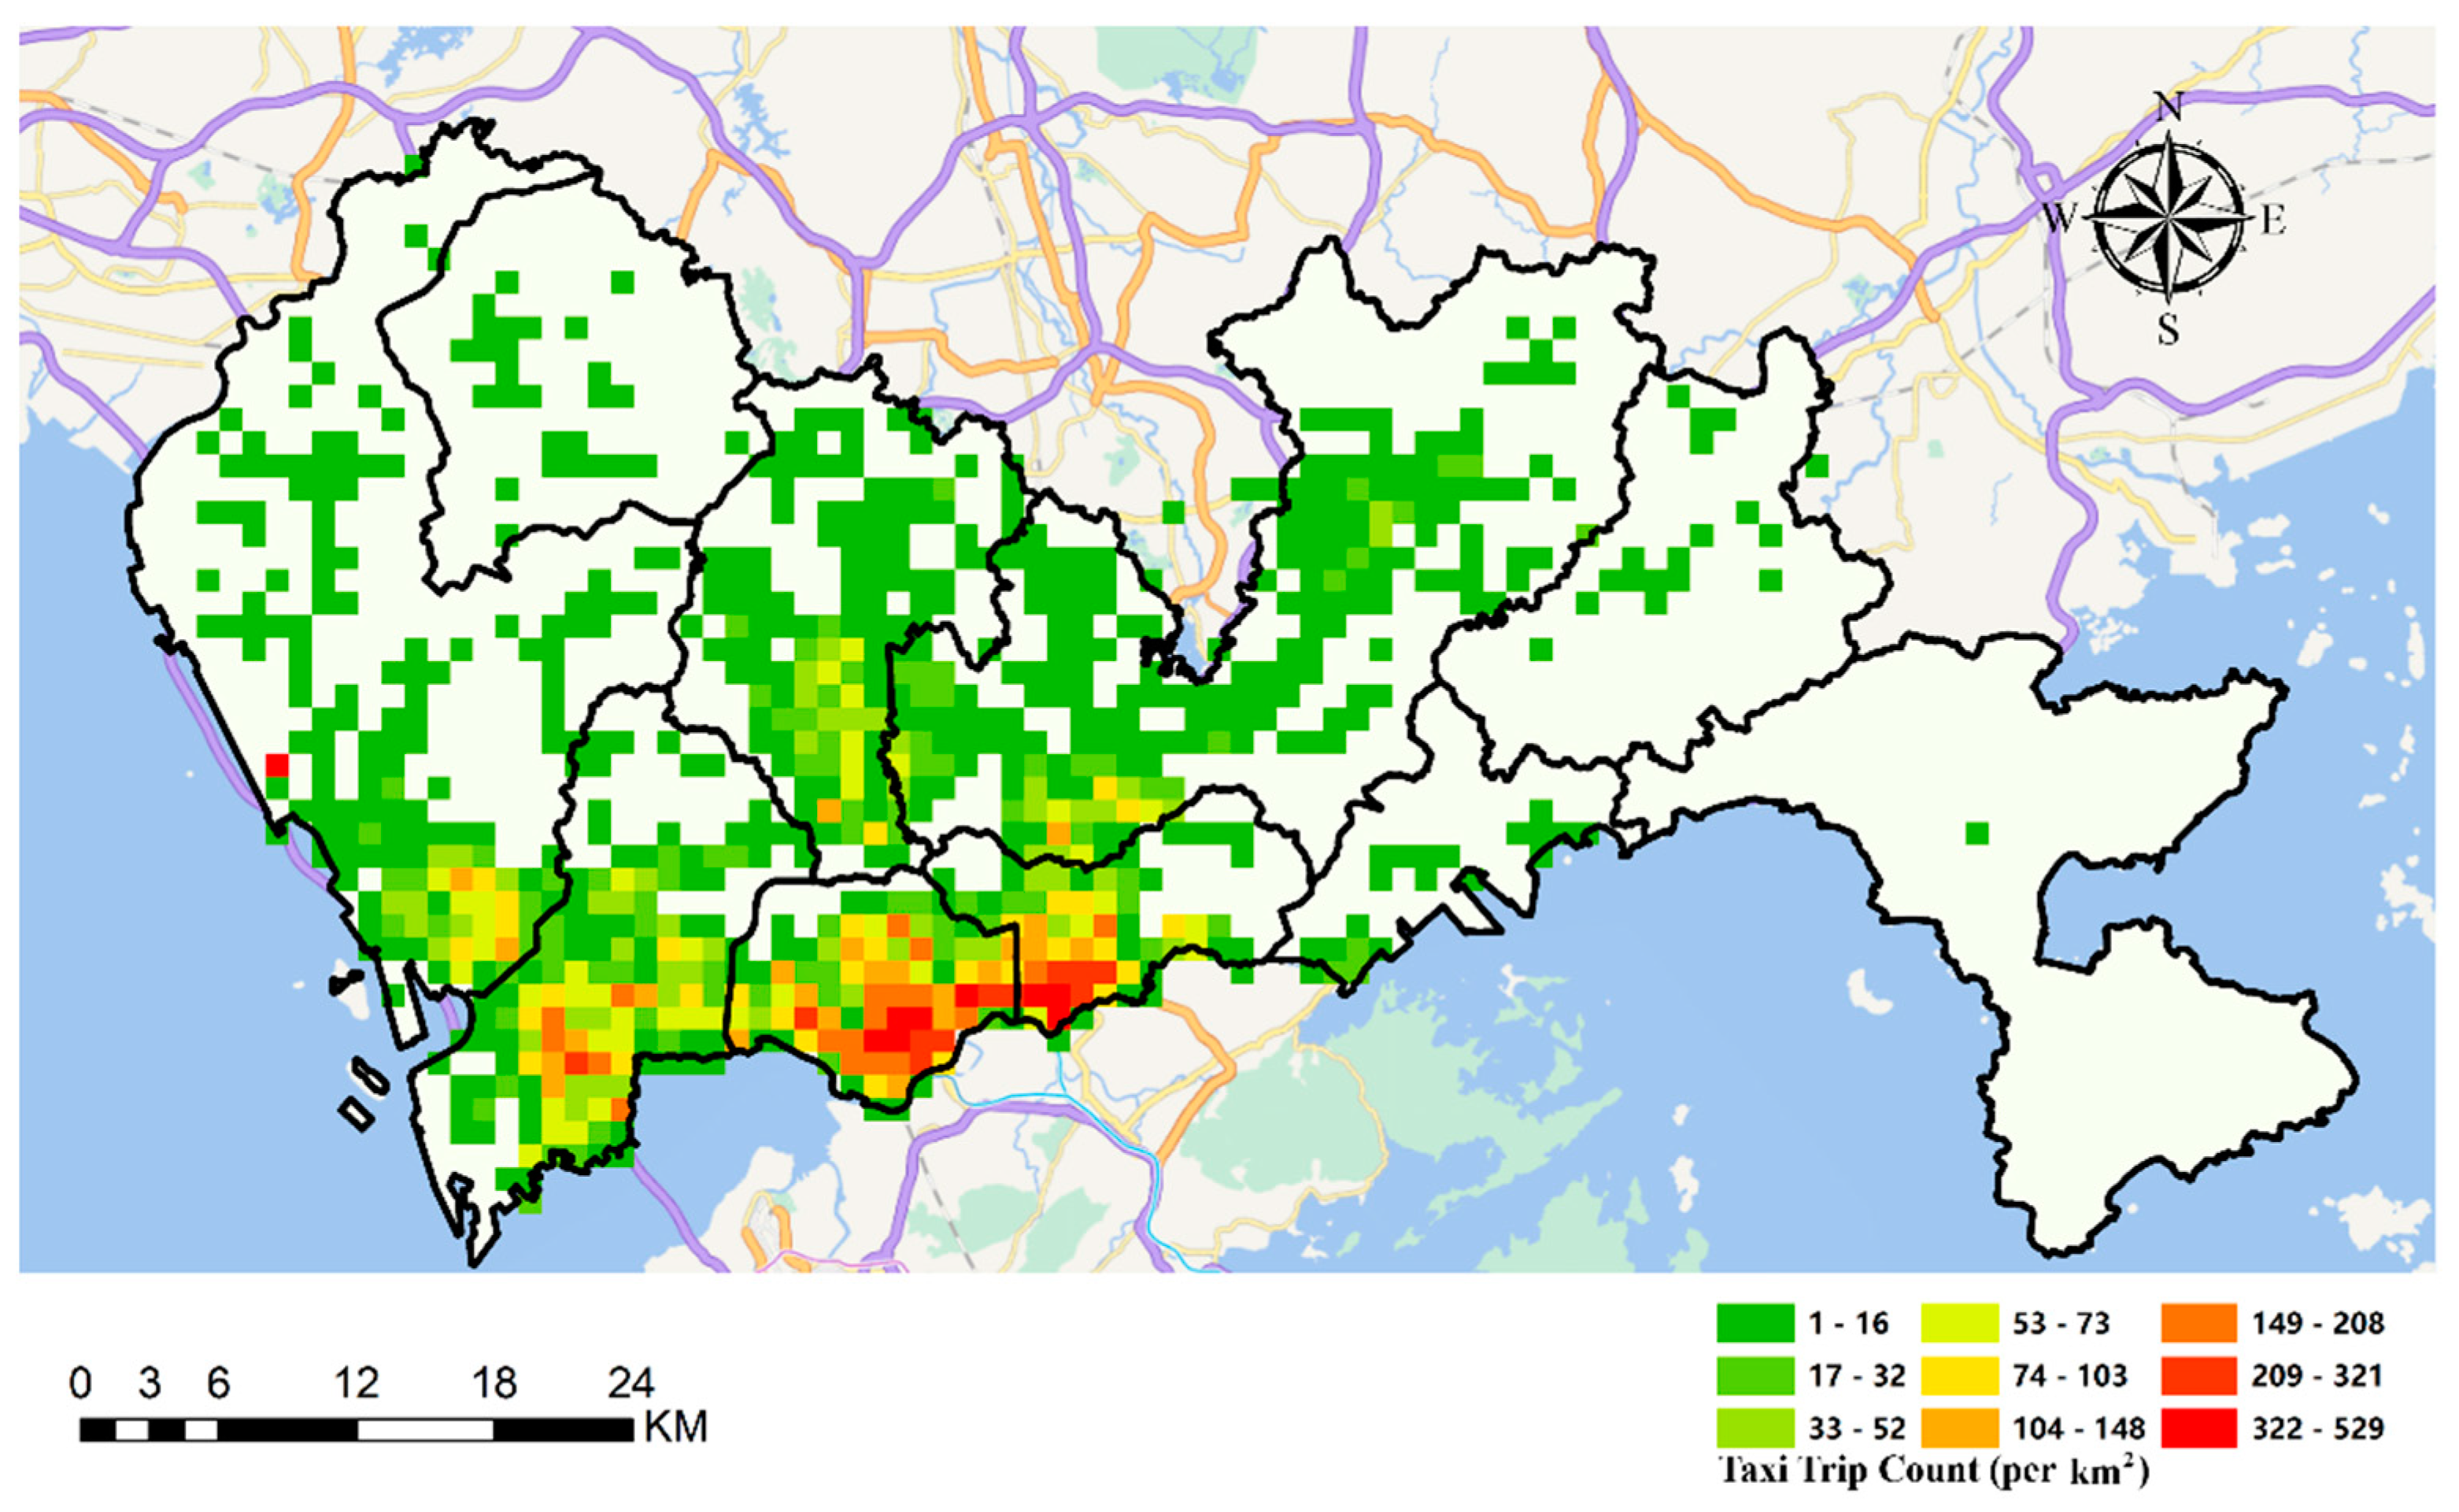
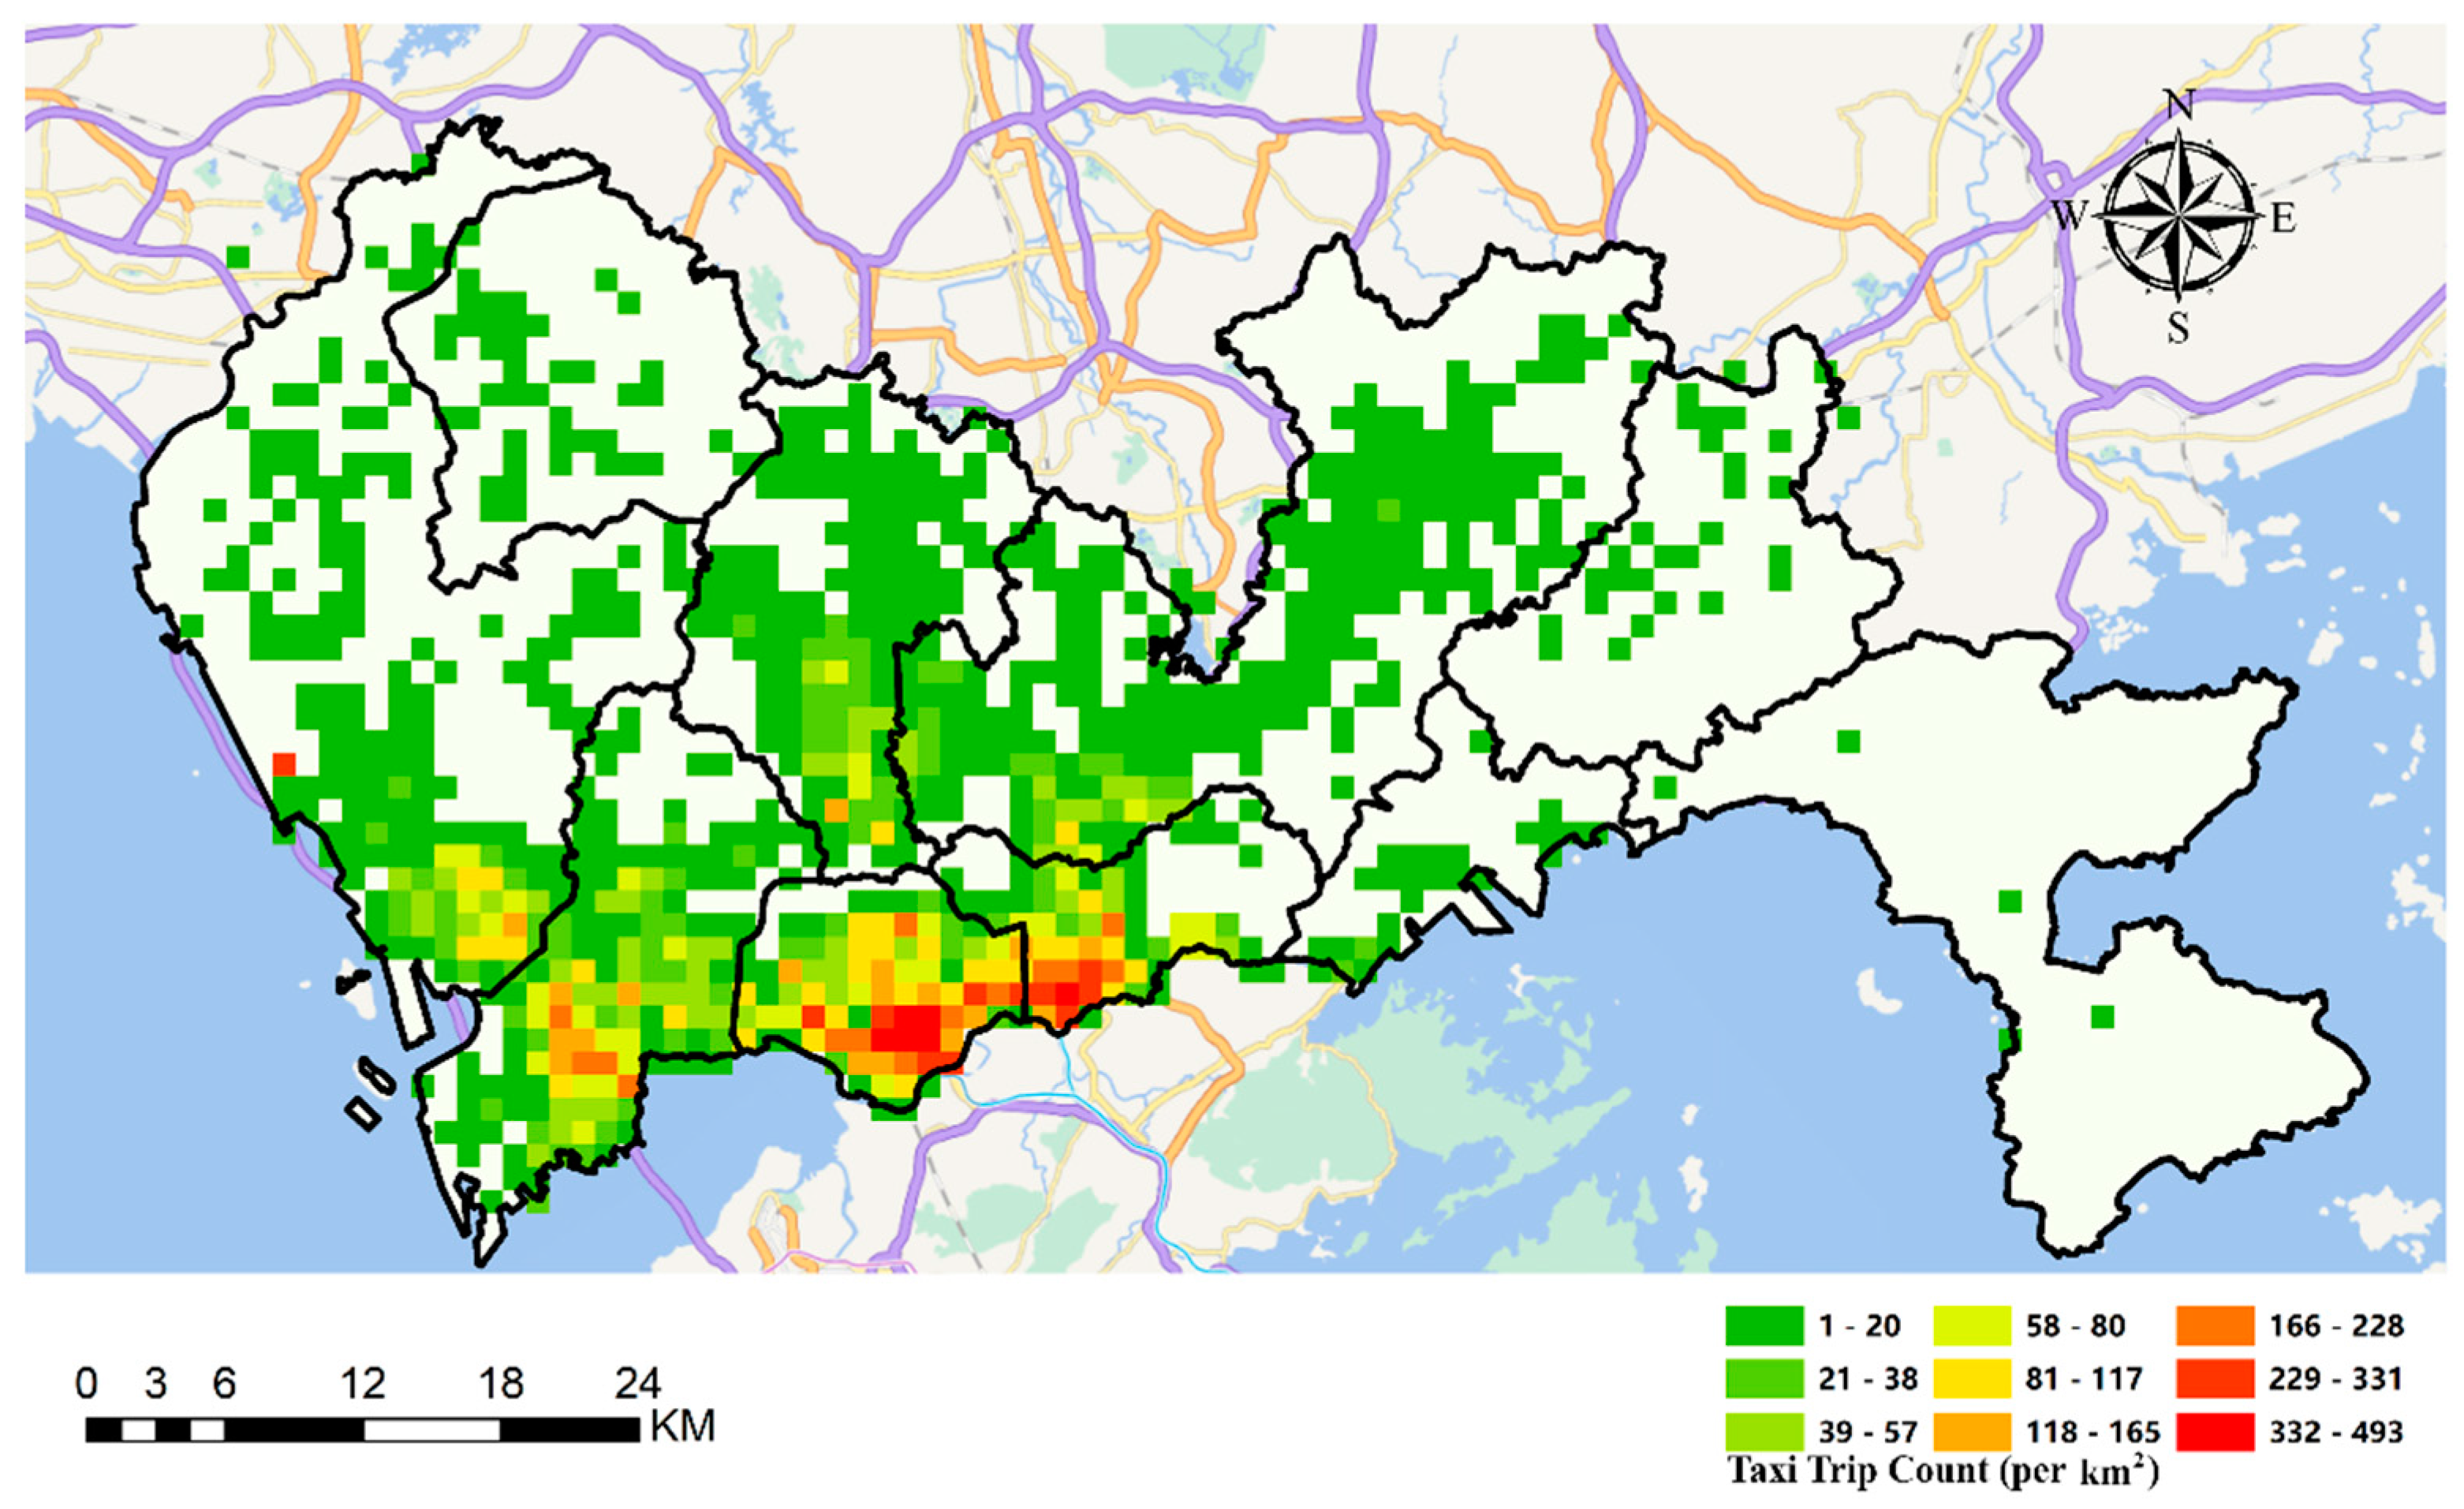
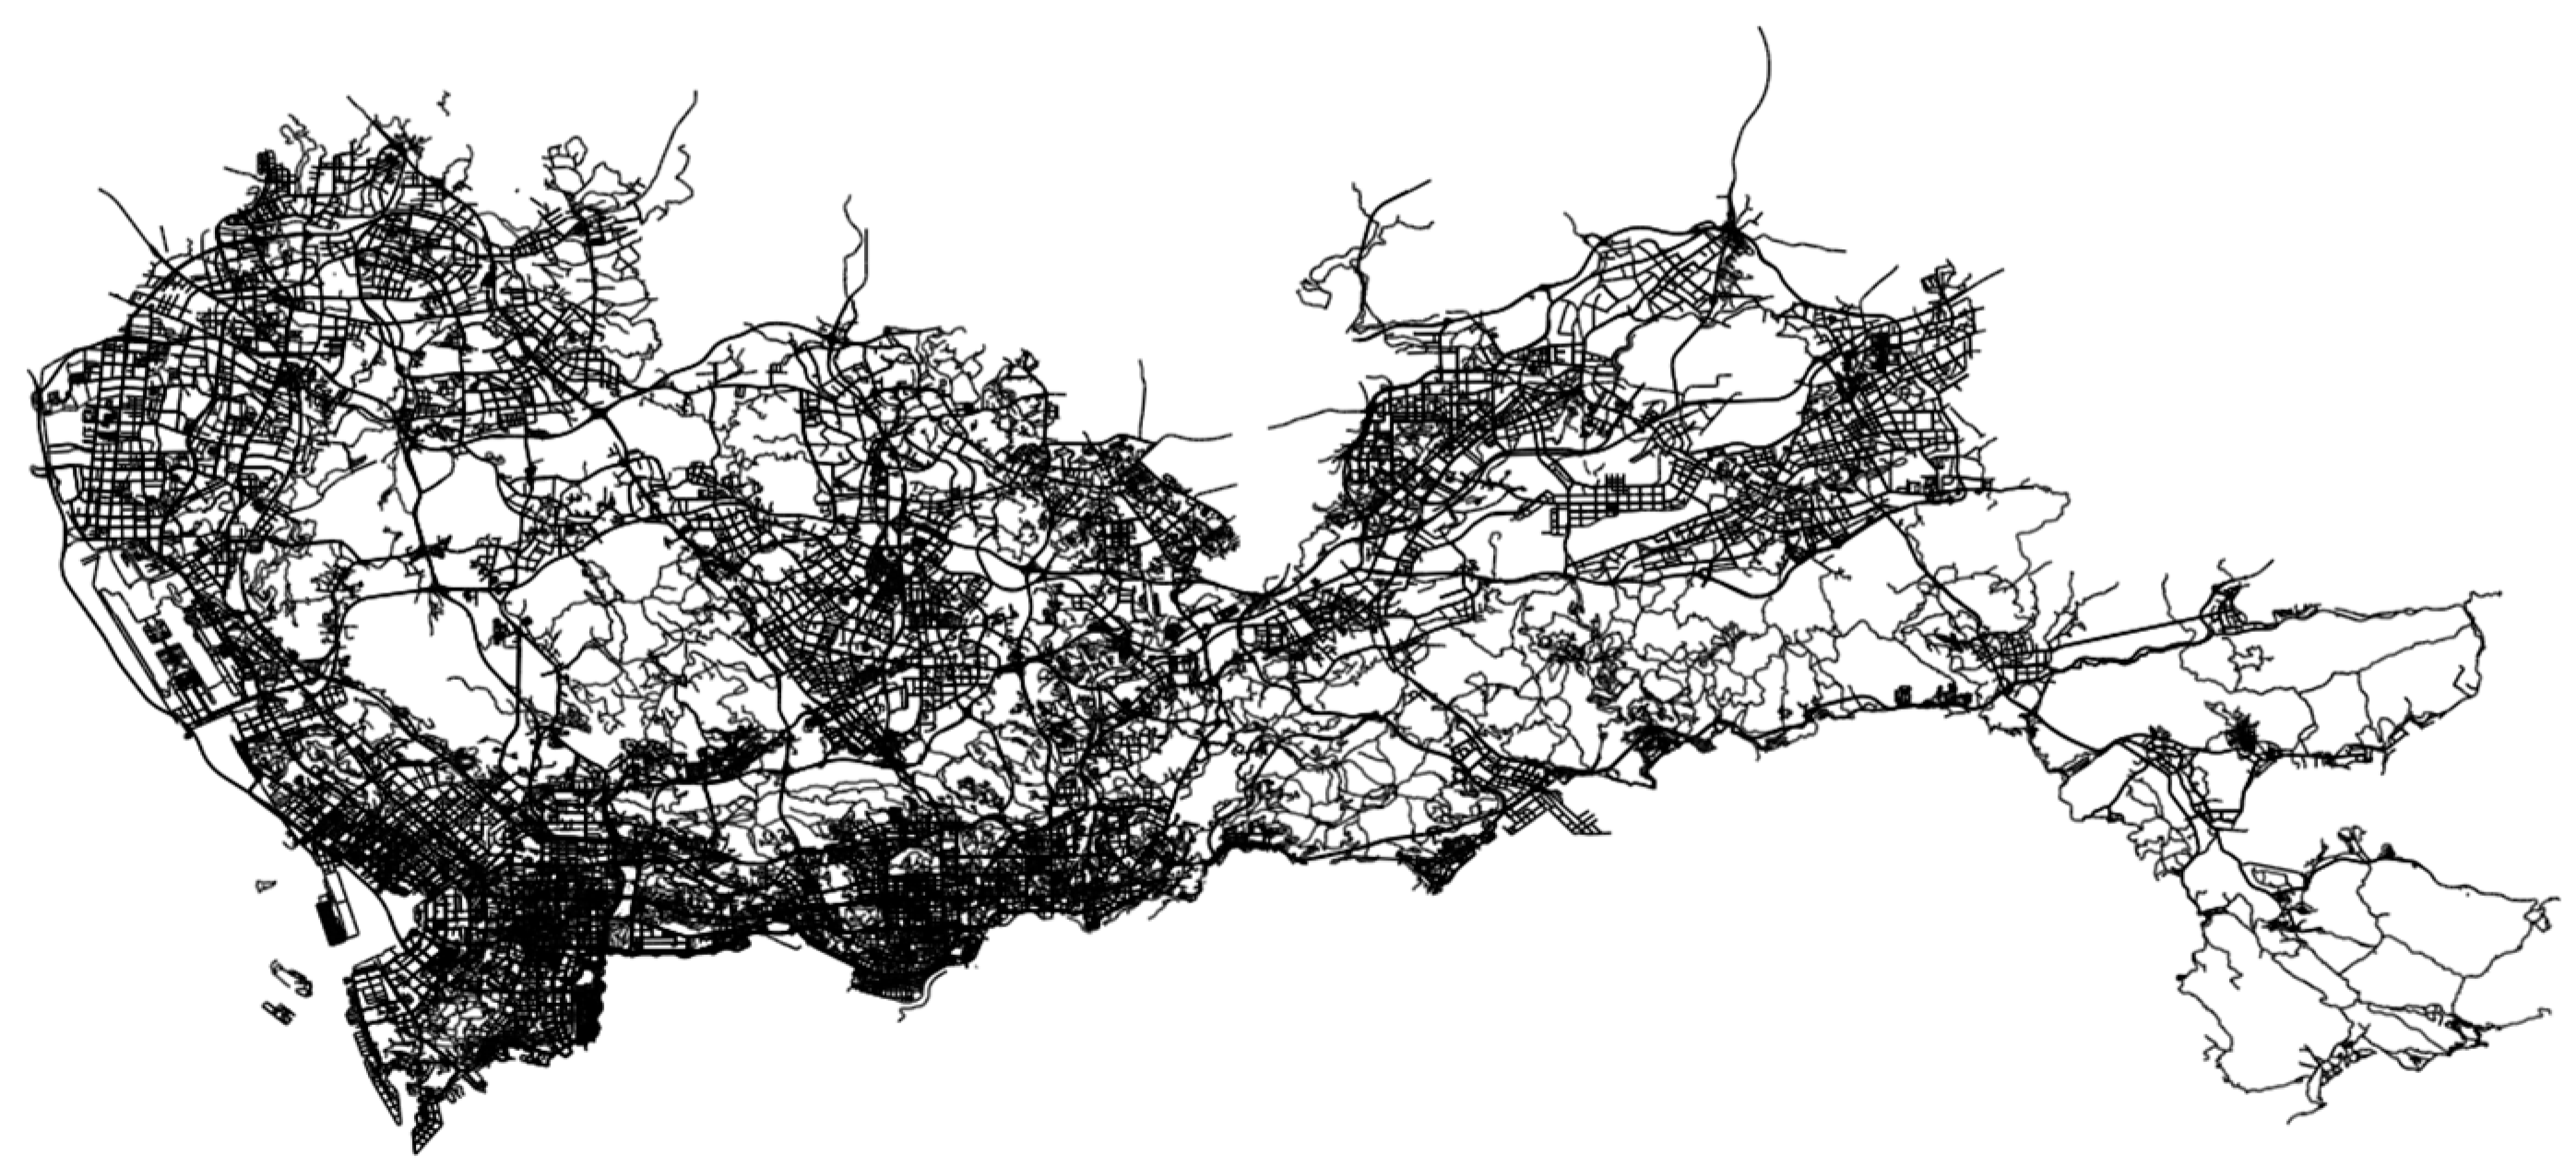
5.1. The Shenzhen Taxi Trip Data

This study uses the taxi trip data from Shenzhen, China, as the input for the developed optimization framework. Shenzhen is one of the major cities of China, located on the southern border of the country. According to the local census data [46], the city had a permanent population of approximately 17.68 million and covered an area of 1997 square kilometers at the end of 2023. The high population density, extensive urban mobility, and well-developed infrastructure have laid a solid foundation for the implementation of co-modality in the city. The taxi dataset was recorded on 1 September 2019 (Sunday), capturing 26,698 taxi trips serviced by 13,631 taxis, all within the hour from 18:00:00 to 19:00:00 (We thank Shenzhen Urban Transport Planning Center Co., Ltd. for providing the data.). Due to data availability, we have adopted such a one-hour taxi dataset as a proxy for passengers’ demand for ride-pooling services. We acknowledge the importance of having a set of virtual ride-sourcing demand data that covers other time periods of the day (i.e., morning, noon, and night), other days of the week (especially workdays), and some special events and holidays. As such, the optimization framework can further account for demand variations across different time frames, thereby providing more nuanced insights and improving the generalizability of the findings. In the considered dataset, each trip record is assumed to represent an intended passenger for ride-pooling services and includes the following information (see Table 1):
  • The anonymized taxi plate number;
  • The start time of the trip;
  • The longitude and the latitude (both in GPS coordinates) of the trip origin and destination.
We then show the spatial distribution of the origins and destinations of all 26,698 trips in Figure 3 and Figure 4, respectively. The figures reveal a clear concentration of taxi trips in the downtown areas of Shenzhen, particularly in the southern part of the city, where trip generation and attraction are significantly higher. In contrast, the rural regions, such as those in the eastern and northwestern parts of the city, exhibit much lower demand. Additionally, the patterns of trip origins and destinations closely mirror each other, indicating the consistent flow of people within these densely populated urban zones.

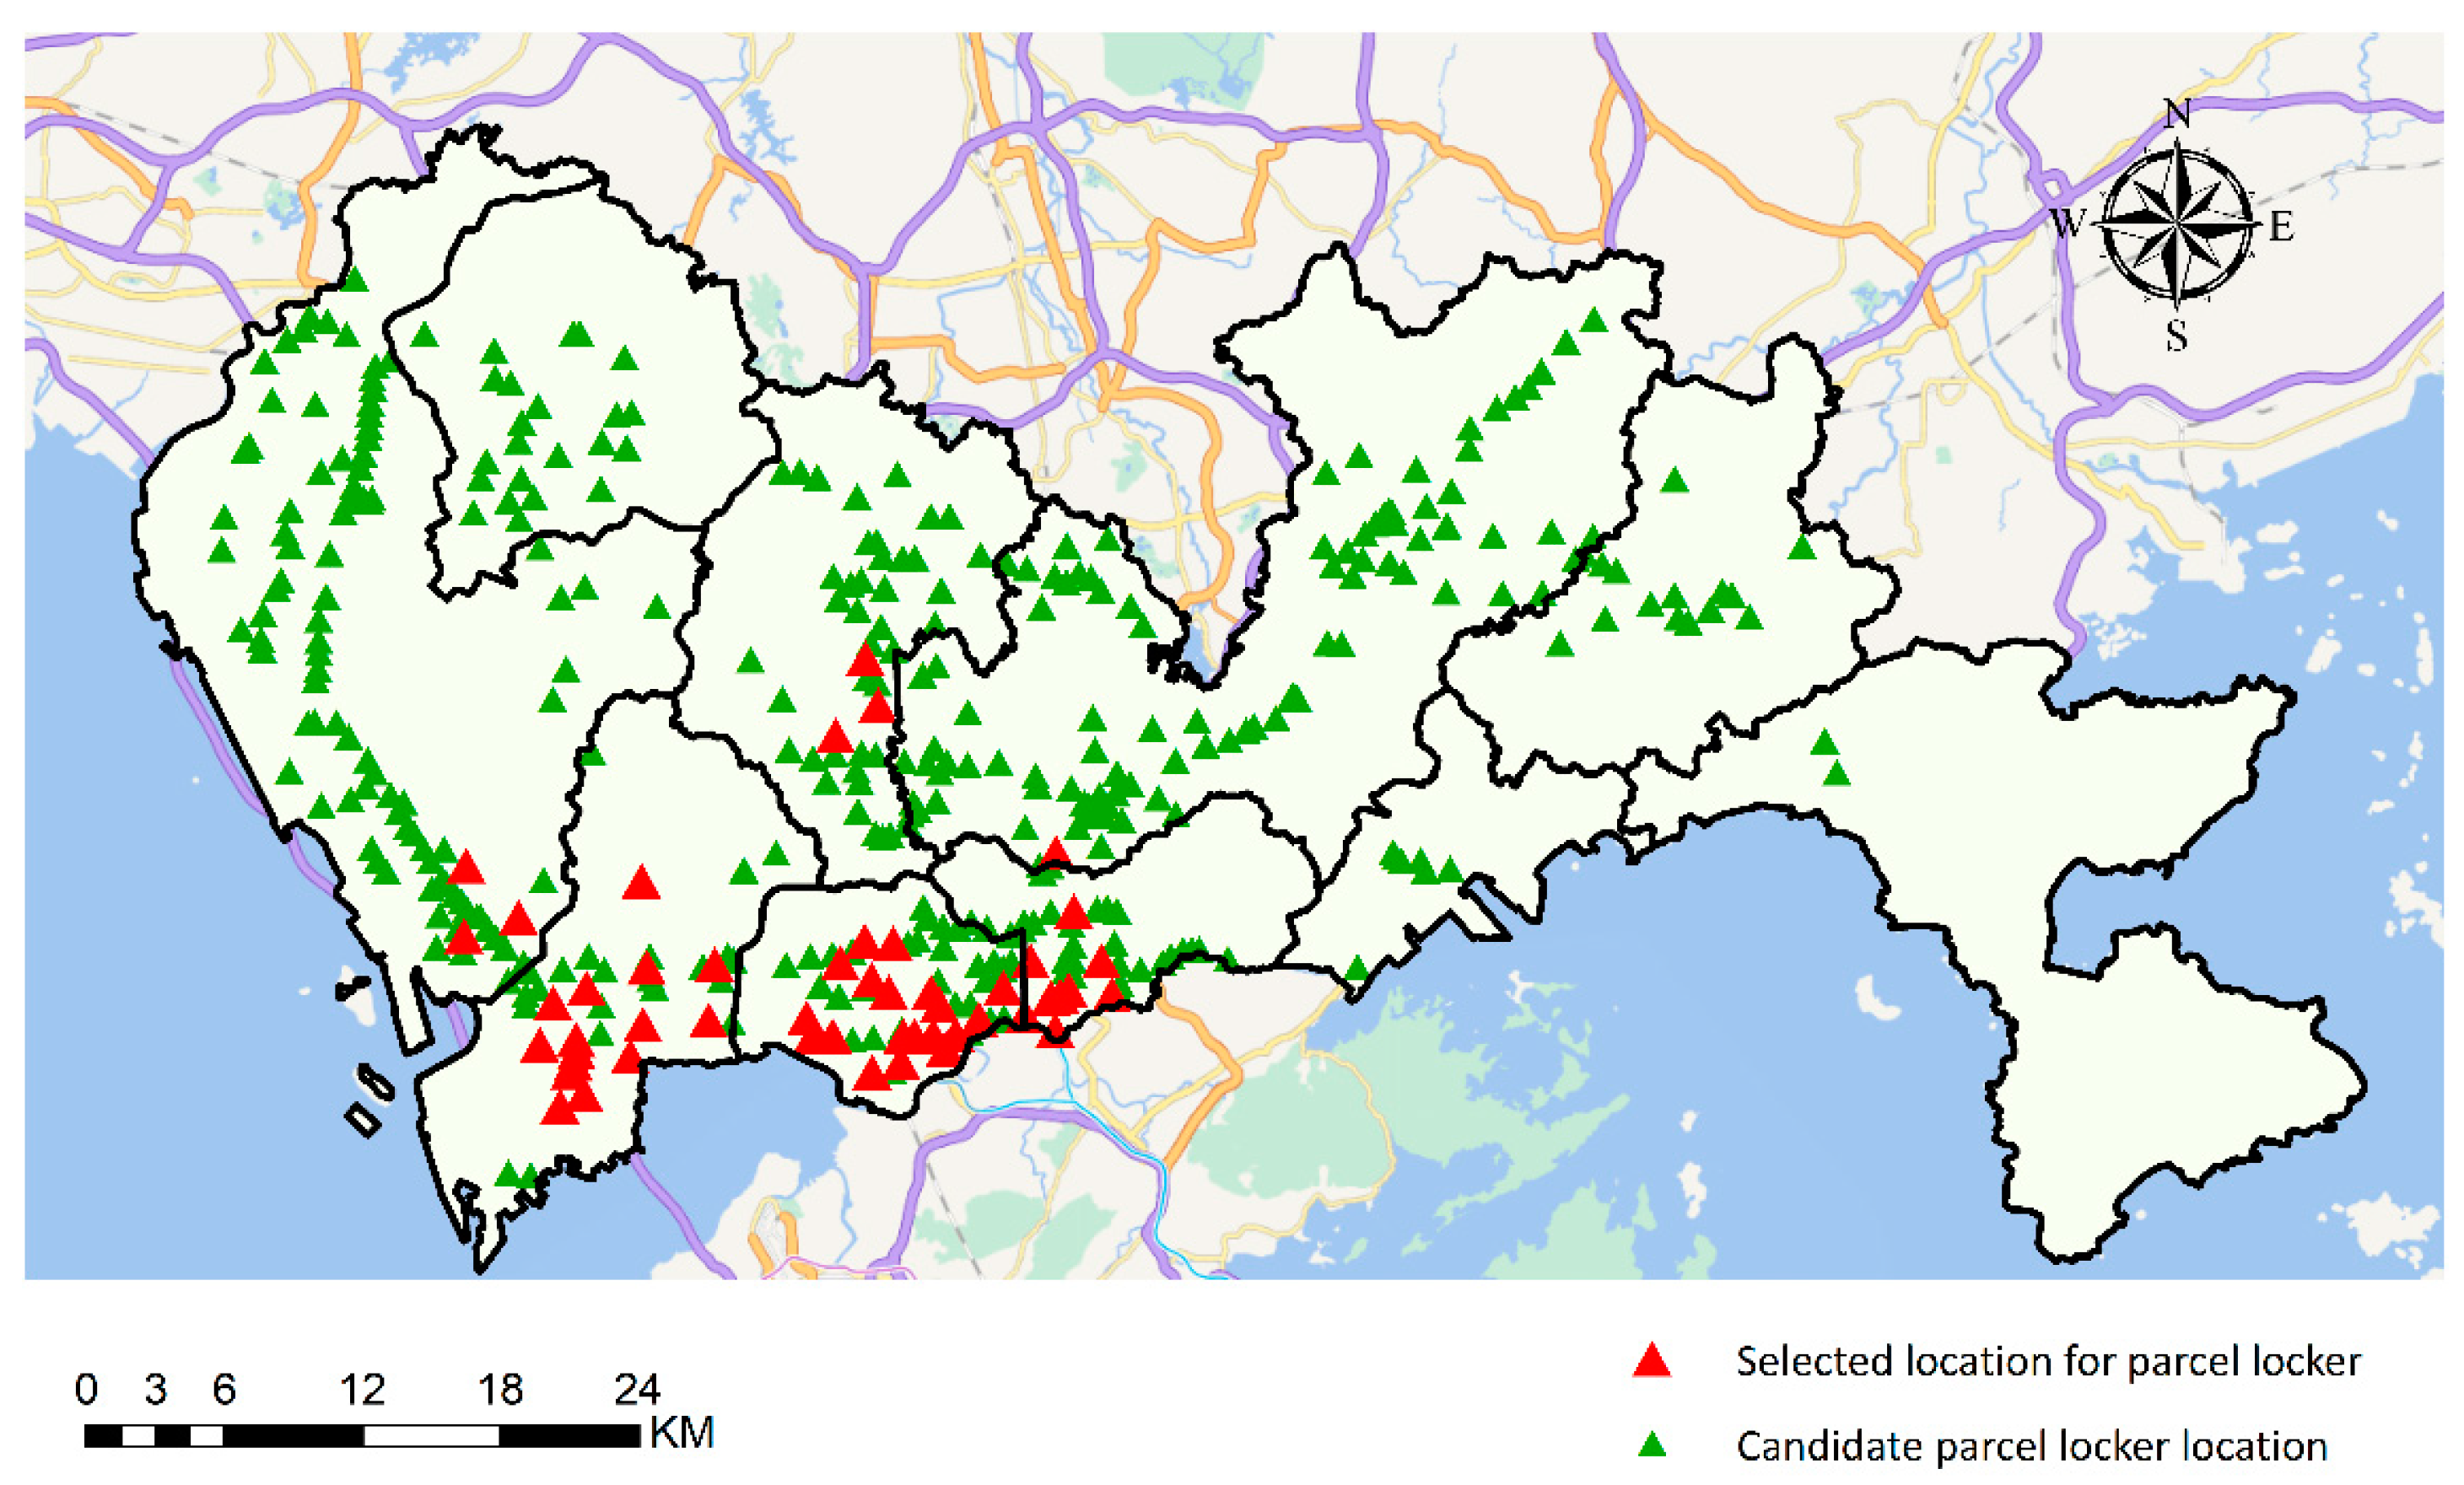
5.2. The Candidate Parcel Locker Location Data

To identify the candidate locations for parcel lockers, we began by extracting the names of all the bus/metro stations in Shenzhen from an open dataset provided by the Transport Bureau of Shenzhen Municipality [47,48], which contains 573 metro stations and approximately 5700 bus stations. Then, we filtered the stations according to the demand distribution, as shown in Figure 3 and Figure 4, ultimately selecting 421 stations as candidate locations to streamline computational complexity. The precise coordinates (longitude and latitude) of the locations were obtained using the longitude and latitude query services provided by Baidu Map [49]. The spatial distribution of these candidate parcel locker locations closely aligns with the patterns of trip origin and destination, as depicted in Figure 3, Figure 4 and Figure 5.

5.3. The Optimization Framework for Parcel Locker Locations

We attempt to use the taxi trip data and the candidate parcel locker location data as inputs to solve the optimal solution to the proposed PM model. However, given the NP-hard nature of the p-median models, the computational time needed to obtain the global optimal solution increases exponentially with the number of decision variables. Inputting all 26,698 trips into the model would result in a number of 26,698 × 421 + 421 = 11,240,279 (421 is the number of candidate locations) decision variables, which is computationally inefficient. Therefore, we propose an optimization framework based on random sampling. The core idea of this framework is to randomly select N trips from the 26,698 trips as inputs to the PM model and solve for the optimal solution, which contains the information of the selected candidate locations (the optimized y j ) and passenger–locker matching (the optimized x i j ). Random selection is repeated for a pre-determined number of times (denoted as S ), and the total frequency for each candidate parcel locker location to be matched with passengers among all the selections is calculated. These frequencies are then used to rank the candidate locations, with the top P locations chosen as the final output of the optimization framework. The detailed steps of the optimization framework are shown in Table 2. For a clearer presentation, we also present the steps of the optimization framework in the flowchart in Figure 6.
We note that since the proposed optimization framework is based on random sampling, the computational time needed to solve the PM model for a sample is, without doubt, shorter than that needed to solve the PM model using all the trip requests as inputs. Therefore, the optimal solution outputted by the optimization framework can be seen as an approximation to the “real solution”, i.e., the optimal solution obtained by using all the trip requests as inputs to the PM model. One should see that if the samples are not properly generated, the optimal solution obtained by the optimization framework may deviate from the real solution. It therefore remains a question of how to balance the computational time and the gap between the optimal solutions.

6. Numerical Experiments

This section presents the numerical results of the proposed optimization framework and discusses implications. Section 6.1 introduces the setup of the experiments. Section 6.2 presents an overview of the results of the proposed optimization framework. Section 6.3 showcases the effectiveness of the proposed optimization framework, and Section 6.4 presents sensitivity analyses of the key factors that may impact the optimization results.

6.1. Experimental Setup

The computation of passenger detour distance d i j was performed on a pre-generated road network of Shenzhen, which comprises 411,056 nodes and 447,248 edges (see Figure 7). We mapped each passenger’s trip origin and destination, as well as the locations of the candidate parcel lockers, to the nearest nodes within this network, so that the minimum travel distance between any pair of nodes involved in the computation of d i j can be easily obtained by calling upon the Dijkstra algorithm [50] to search for the shortest path. After obtaining d i j , the proposed PM model was solved using the Gurobi 11.0 Python package with an academic license.

6.2. Illustrative Example of the Result of the Proposed Optimization Framework

We begin by showcasing the results of the proposed optimization framework using N = 100 and P = 50 as examples. The random selection of ride requests was performed S = 2000 times, resulting in 200,000 trips in total, which means that each trip in the dataset can appear in around 7.5 of the selections on average. After 2000 selections were completed, the corresponding matrices of d i j were then computed, and the resulting PM models were solved.
Figure 8 shows the distribution of the minimized total passenger detour distance (denoted as Z min herein) for the 2000 selections. By conducting both the Kolmogorov–Smirnov test and the Shapiro–Wilk test, we verify that Z min follows a normal distribution. The detailed test statistics can be found in Appendix A, in which we also verify the normality of the density distribution of Z min when N = 50, 60, 70, 80, and 90, given P = 50 .
Figure 9 shows the total frequency of being matched with passengers for all the candidate parcel locker locations among 2000 selections in descending order. The x-axis tells the rankings of all the candidates (from 1 to 421), revealing that the most frequently selected candidate was paired with over 7000 passengers. Figure 9 also indicates that 113 locations have been matched with fewer than ten passengers, with 76 of these locations having no matches at all. We then plot P = 50 selected locations for the parcel lockers in Figure 10 (represented by the red triangles), which mainly locate in the downtown areas of the city.

6.3. Effectiveness of the Proposed Optimization Framework

In this section, we examine the effectiveness of the proposed optimization framework by accessing the level of consistency (LOC, denoted as Ω s ) between the optimal locations identified by (1) the optimization framework and (2) the PM model for a specific selection s S . The value of Ω s is determined as follows. First, we define two vectors A s = a j s , j J and A = a j , j J . a j s equals 1 if candidate j is matched with at least one passenger ( i I s x i j s > 0 ) in the optimal solution for selection s , and 0 otherwise; a j equals 1 if candidate j is selected by the optimization framework as one of the optimal locations, and 0 otherwise. Then, Ω s can be expressed as follows:
Ω s = j J 1 a j s a j P
One should see from Equation (6) that Ω s [ 0 , 1 ] . A larger Ω s indicates a higher LOC, which means that the optimal locations obtained by the proposed optimization framework align more closely with those selected by the PM model in selection s .
We computed Ω s under N P combinations, where ( N , P ) = (100,50), (90,40), (80,40), (70,30), (60,30), and (50,20) for a broad coverage of parameters, and hence this represents a more comprehensive analysis. For all N P combinations, S was set to 2000.
Table 3 displays the mean, maximum, minimum, and standard deviation of Ω s across all the 2000 selections for each N P combination. Interestingly, we can observe that the mean of Ω s increases as N and P grow, despite a slight drop from 0.313 to 0.296 as ( N , P ) changes from (50,20) to (60,30). In practice, the mean LOC indicates the overall performance of the optimal parcel locations determined by the optimization framework. The overall upward trend suggests that as the passenger demand for ride-pooling and the number of locations grow, the performance of the proposed optimization framework improves, with more locations selected by the framework aligning with the optimal locations in the random selections. The performance improvement can also be supported by the changes in the maximum, minimum, and standard deviation of Ω s . Both the maximum and minimum values of Ω s increase as ( N , P ) shifts from (50,20) to (100,50). While the maximum Ω s shows a relatively modest and fluctuating increase from 0.600 to 0.680, the minimum Ω s experiences a dramatic rise, nearly sevenfold, from 0.05 to 0.340. The sharp rise in the minimum Ω s suggests that when both the number of randomly selected trips and the planned number of locations are sparse, the optimal locations can vary significantly between different selections. This variation is further evidenced by the decreasing standard deviation of Ω s as ( N , P ) increases from (50,20) to (100,50). As N and P continue to grow, it is anticipated that the performance of the proposed optimization framework will further improve.

6.4. A Ranking-Based Classification of Candidate Parcel Locker Locations

We continue to explore the properties of the proposed optimization framework by examining how candidate locations’ rankings change in response to varying P , based on which we propose a ranking-based classification of the candidate parcel locker locations. We are particularly interested in how the ranking of a candidate location change as P increases within the same set of samples. To see this, we set N = 100 and performed sample generation S = 2000 times. Then, we let P vary from 10 to 100 at an interval of 10 to simulate the increasing locker locations density. For each resulting N P combination, we ran the proposed optimization framework and recorded the rankings of all the 421 candidate locations. Based on the results, we classified all the candidate locations into five types according to how their rankings changed as P increased, namely (I) the stable candidates, (II) the rising candidates, (III) the falling candidates, (IV) the concave candidates, and (V) the convex candidates. To avoid a cumbersome presentation, we select two representatives from each type of candidate and present their ranking changes against P in Table 4. We remind the readers that the candidate indices listed in the first column of Table 4 serve solely as identifiers and are not indicative of their ranking.
It is noteworthy that the rankings of all the listed candidates in Table 4 tend to stabilize as P 60 . This is because as more locations are permitted to be selected in the PM model, each passenger is increasingly likely to be matched with a location that minimizes their detour distance. In fact, one can tell from the formulation of the PM model that the optimal location for every passenger is deterministic if all the candidates can be selected (i.e., P = 421 ) and is not affected by the other passengers since we did not consider capacitated parcel lockers and the queuing time for parcel pick-up. The only situation in which a passenger is not matched with his/her optimal location is when that location is excluded from the optimal solution to the PM model due to the limited P . Therefore, we also note that the classification we discuss in this section is based on the pre-stabilized rankings of the candidates (i.e., we only observe the ranking trends when P 60 ), as the discussion would be meaningless if all the rankings were stabilized.
To facilitate our analyses, we introduce two terms for each candidate j J , namely (1) the frequency that candidate j appears in the optimal solutions across the S selections (denoted as f j ) and (2) the average number of passengers matched with candidate j across the S selections if j is selected (denoted as m j ). Then, the total frequency for candidate j to be selected across the S selections can be expressed as f j m j .
It is important to note that the reasons behind the emergence of the five types of candidate location are less straightforward since the change in the ranking of candidate j , as P increases, is jointly resulted from both the change in its ranking and that in the other candidates’ rankings, which are further determined by the changes in f j and m j (and thus f j m j ). For example, if the ranking of candidate j rises (e.g., see candidates 81 and 139 in Table 4), more locations can be selected due to the increase in P , and j appears in the optimal solutions to the PM model in more samples. By contrast, the falling ranking of candidate j (e.g., see candidates 99 and 193 in Table 4) may imply that although j is not the optimal location to many passengers in the samples, it is selected as a compromise when the value of P is small. As P keeps increasing, fewer passengers are matched with j , and hence its ranking drops. Rather than diving into the reasoning behind the five types of candidate, we can draw implications from the classification itself.
Firstly, planners should carefully determine the optimal number of candidate locations for parcel locker deployment, recognizing that there exists a threshold value for P . In our example, this threshold value is 60, below which the rankings of the candidates are affected by the deployed parcel lockers, while surpassing this threshold scarcely alters the candidate rankings, but certainly increases the parcel locker deployment costs. Selecting more locations beyond the threshold may not substantially reduce the passengers’ detour times, but will likely contribute to higher costs. Furthermore, it is clear that the threshold value is dependent on the spatial distribution of both trip demand and the potential parcel locker locations. This signifies that the proposed optimization framework can be used to quantify the threshold for any given set of trips and candidate locations.
Secondly, the necessity of choosing an appropriate P arises not only from the presence of the threshold, but also from the fact that the optimally selected locations may vary as P changes. From a temporal perspective, if the parcel lockers are deployed in batches (i.e., P gradually increases as time elapses), then there are either newly included or abandoned locations as P increases. Two instances can be found in Table 4. Candidate 139 (type II) is not selected until P 40 , while candidate 137 (type V) is always selected, except when P = 20 . Therefore, if P gradually increases from 10 to 50 in several periods, candidate 139 is only opened when P equals 40 and 50, and candidate 137 needs to be temporarily shut down when P = 20 .

6.5. Sensitivity Analyses

This section investigates the impacts of three factors, namely (1) the sample size N , (2) the number of selected candidate locations P , and (3) the minimum distance between any two selected candidates (denoted as R ), on key dependent variables. Specifically, Section 6.5.1 examines the effects of N and P on the average minimum passenger detour distance, and Section 6.5.2 explores the impacts of R on the rankings of the candidate locations obtained by the proposed optimization framework.

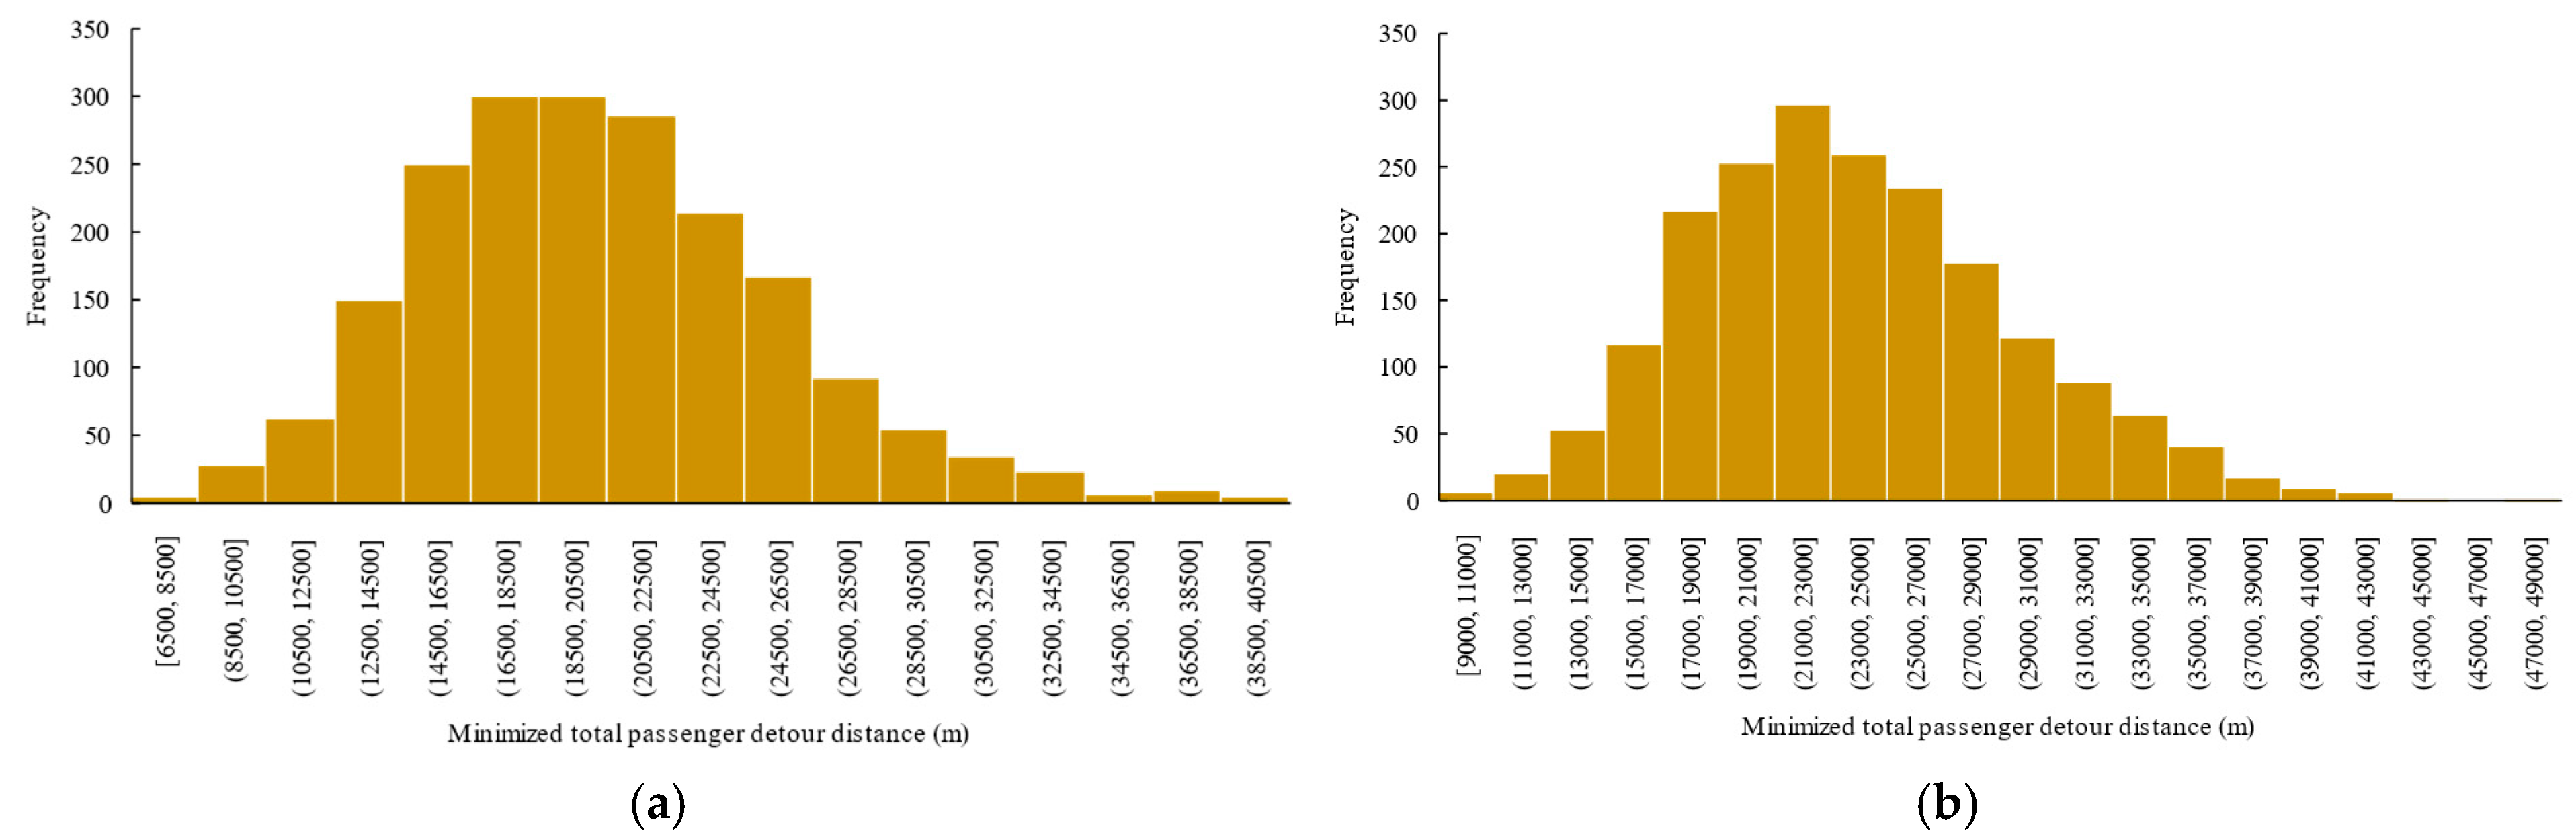
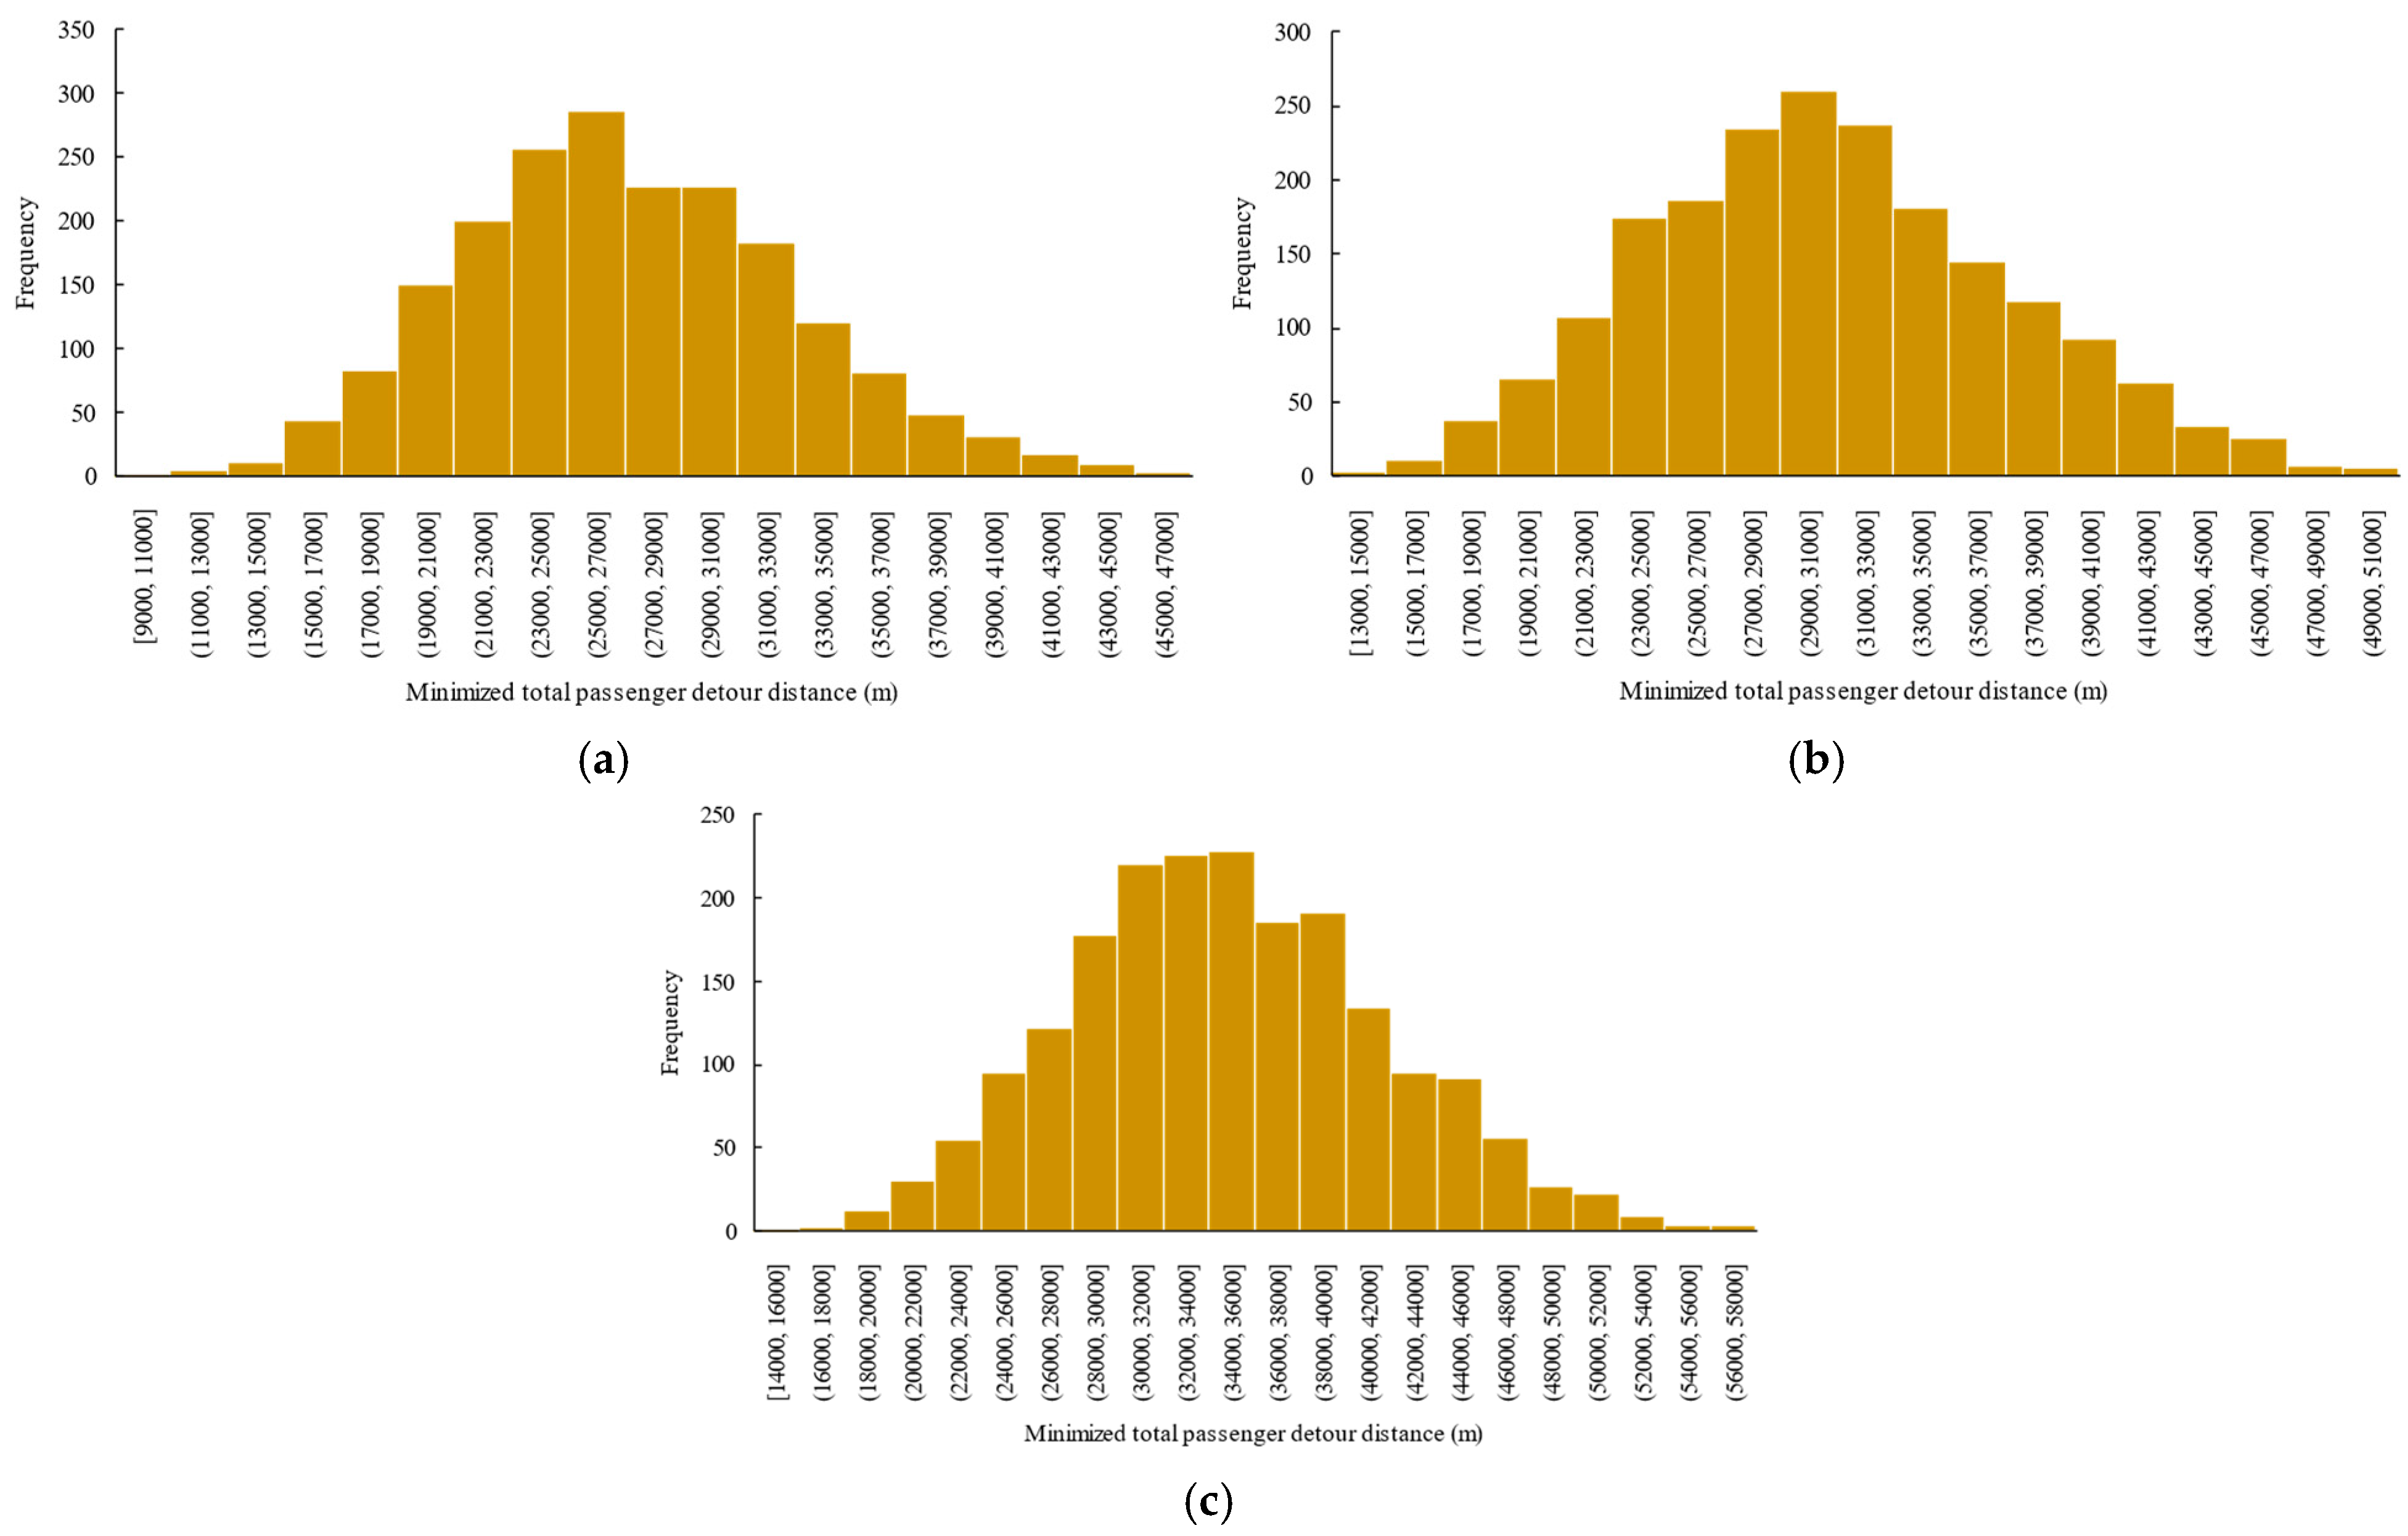
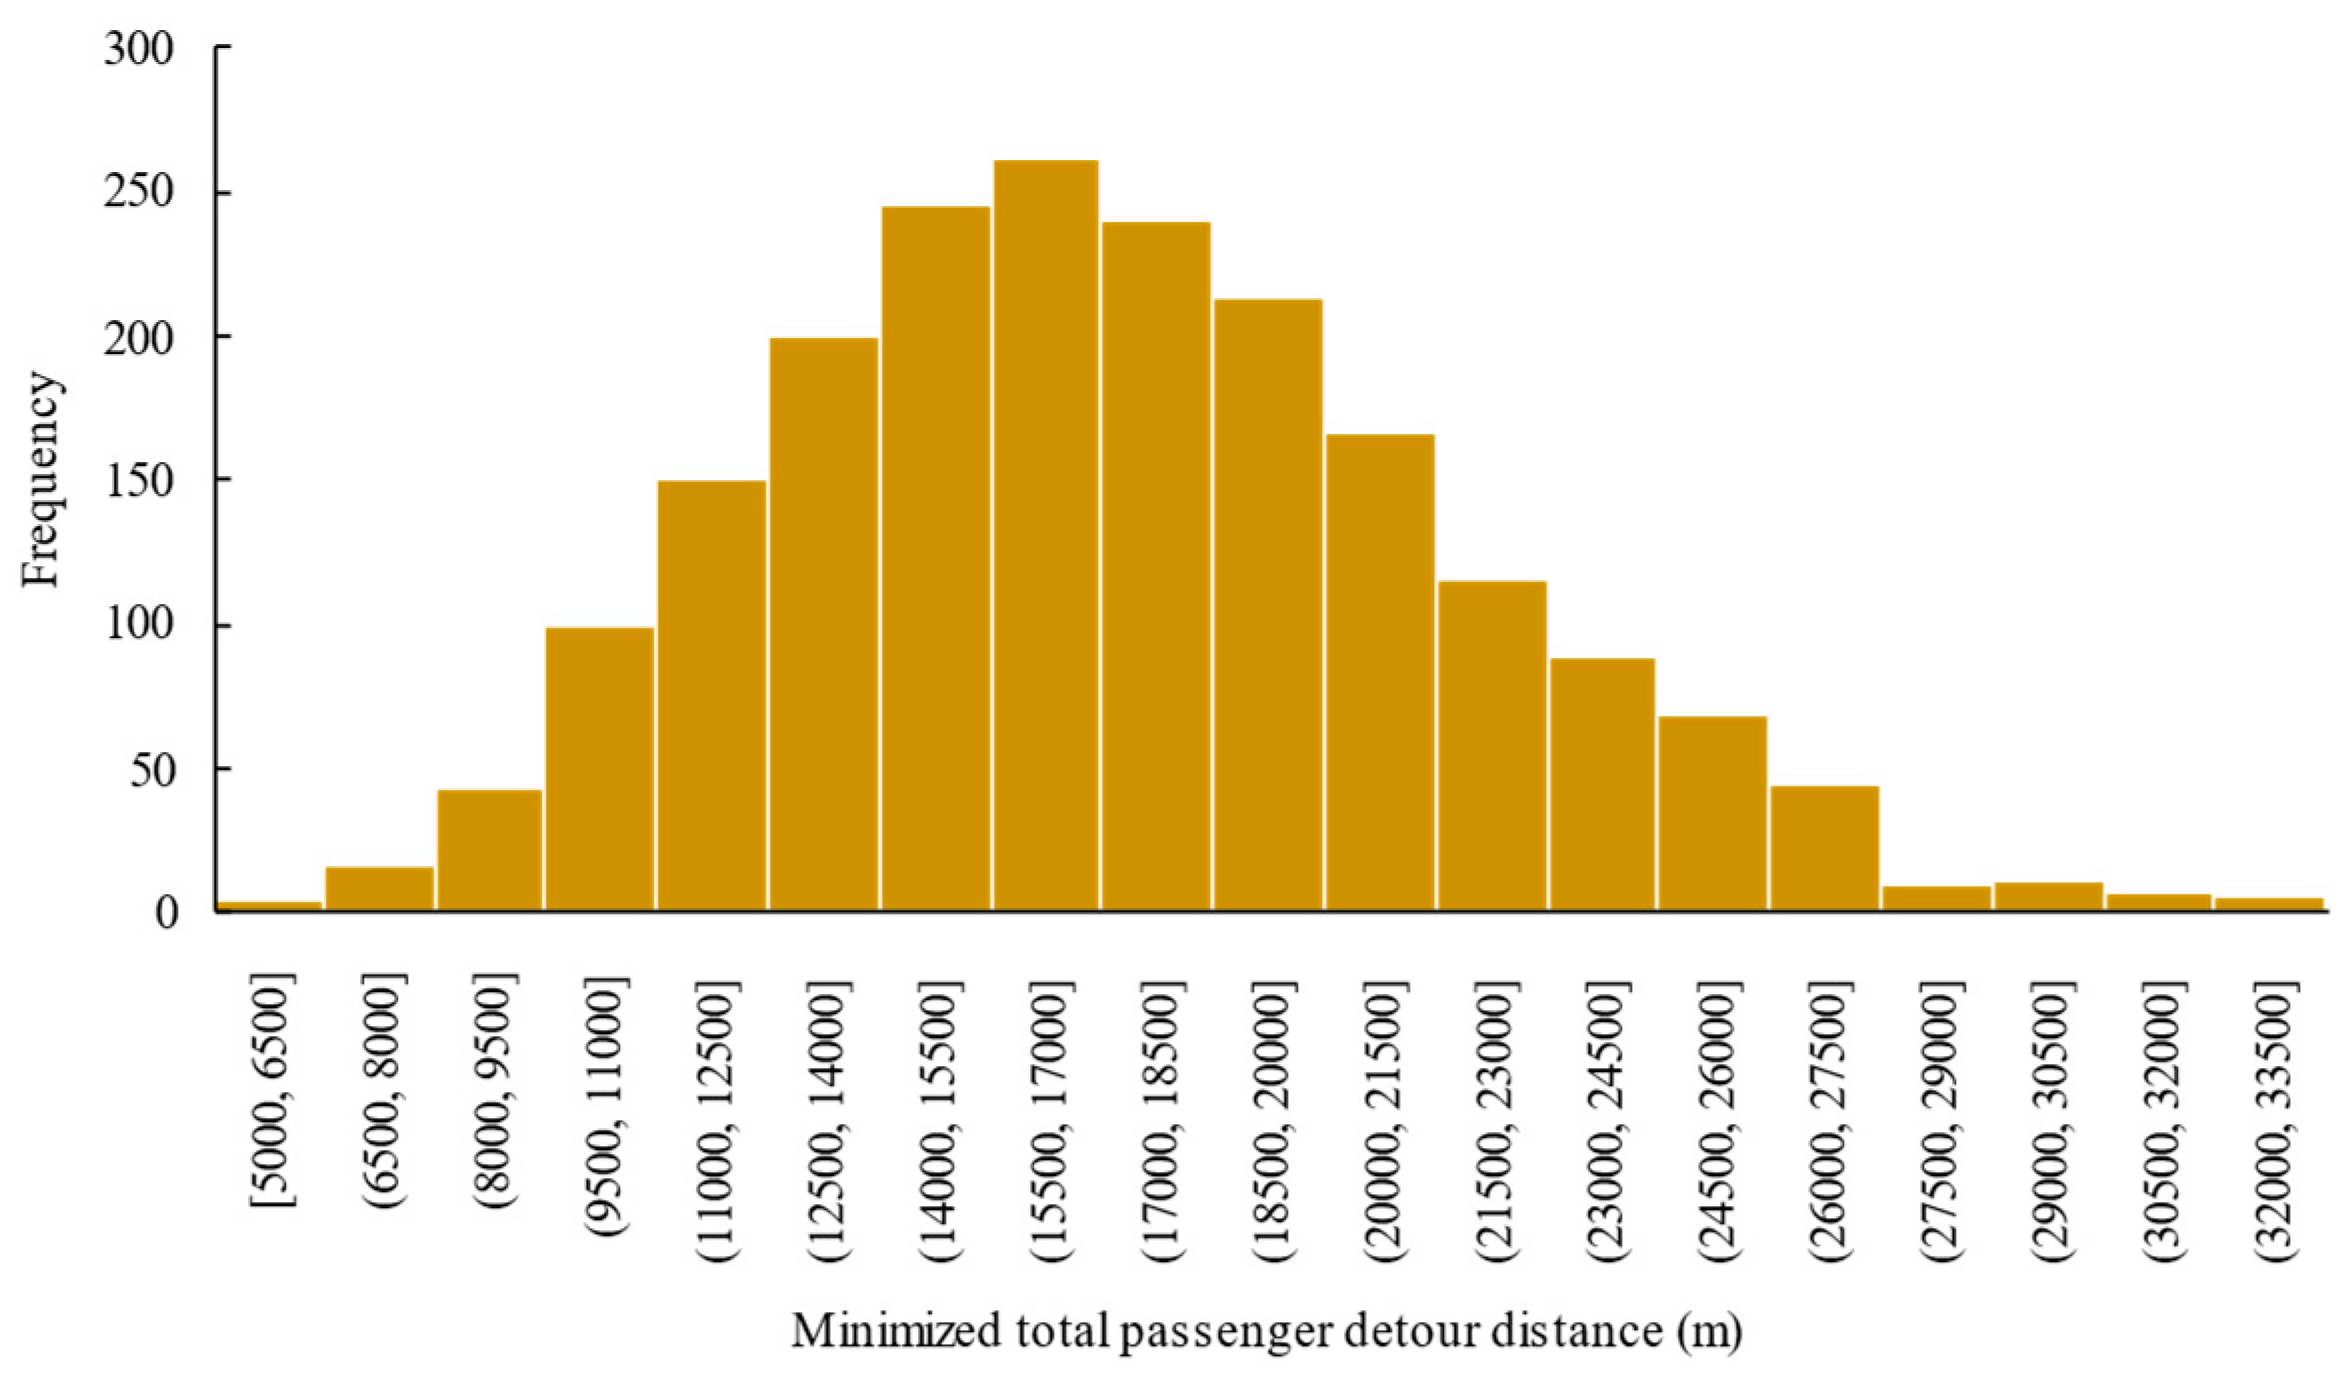
6.5.1. The Average Minimum Passenger Detour Distance

The average minimum passenger detour distance, denoted as Z ¯ min , is the sum of the minimized total detour distance Z min incurred by all the passengers in each selection weighted by the selection time S under a given N P combination. To separately investigate the impacts of N and P , we created a series of N P combinations, with either one fixed, and the other varied. Specifically, we fixed P = 10 and let N vary from 10 to 100 at an interval of 10 to test the effects of N , while N was fixed to 10 and P ranged from 10 to 100 for investigating the impacts of P . The results are depicted in Figure 11 and Figure 12, respectively.
Figure 11 and Figure 12 show distinct trends of the average minimum passenger detour distance as a function of N and P . In general, we observe that Z ¯ min increases with N and decreases with P . On the one hand, the positive effect of N on Z ¯ min can be explained by the fact that P = 10 indicates a very sparse city-wide distribution of parcel locker locations, so that the marginal requests are likely to have longer detour distances than the existing ones when N increases. On the other hand, the decrease in Z ¯ min displayed in Figure 12 is relatively intuitive because when the number of parcel locker locations is small, many passengers are pooled with sub-optimal parcel locker locations with longer detour distances. As more parcel lockers become available, passengers can be pooled with locations offering shorter detour distances, leading to a reduction in the average detour distance. The curve flattens as P continues to rise because more passengers are matched with a location with the minimum detour distance and need to move to the newly added location. This further implies that a threshold for P exists for a given sample size N , exceeding which is cost-ineffective as it contributes little to lowering the average passenger detour distance, while potentially increasing the parcel locker deployment costs.

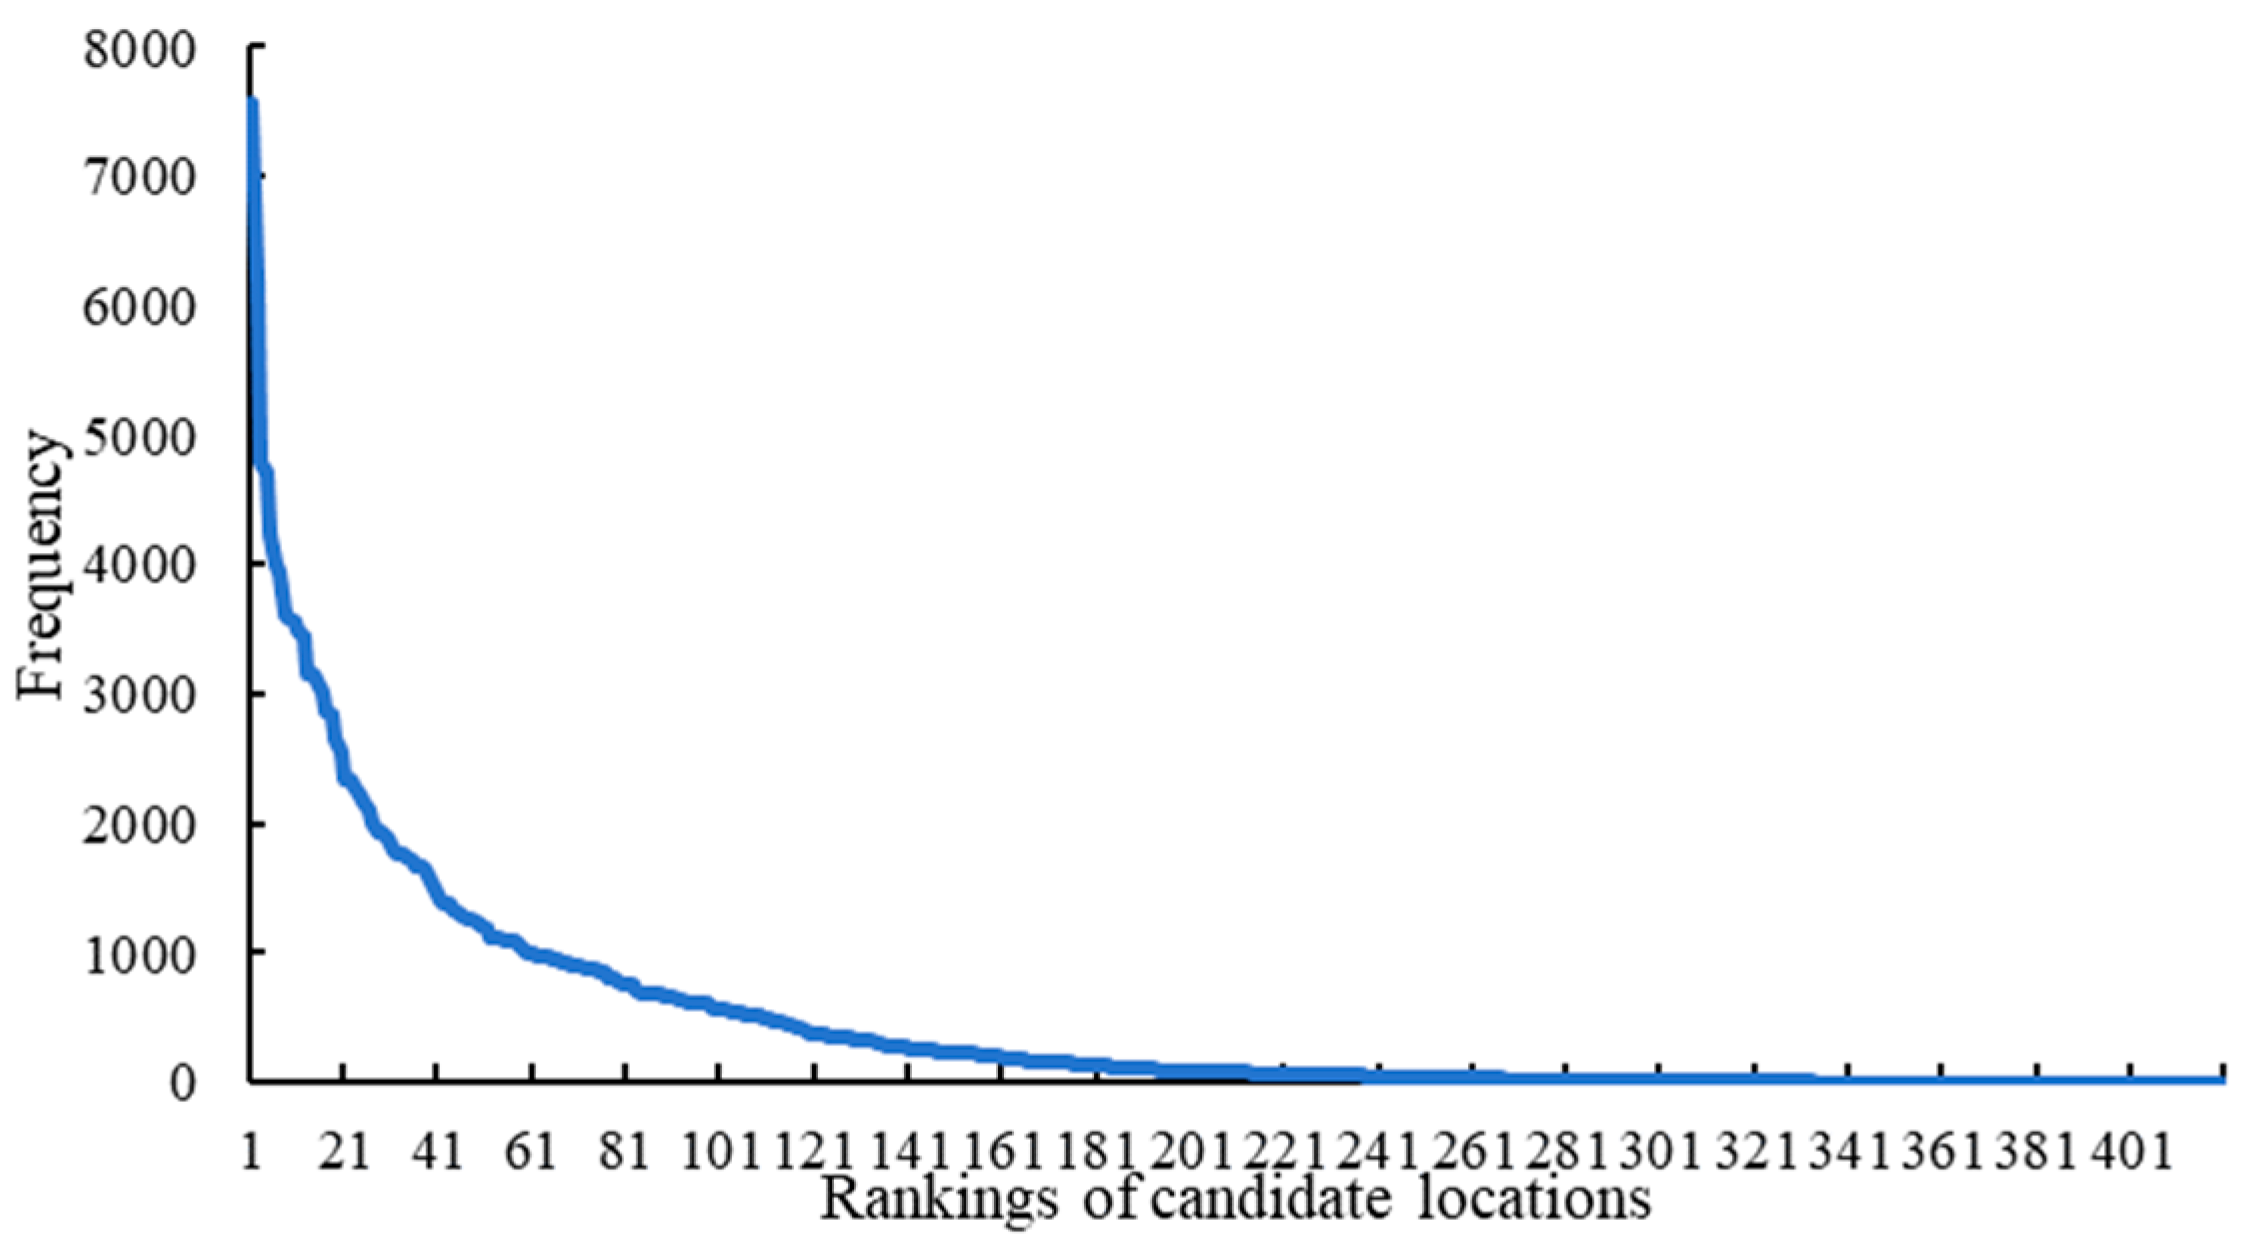
6.5.2. The Rankings of Candidate Locations

Introducing the minimum distance R between any pair of selected candidate locations (indexed with j and j ) is equivalent to adding the following non-linear constraint into the PM model:
y j y j R j j R ,   j , j J   and   j j
The parameter R j j stands for the Euclidean distance between locations j and j . The constraint can be linearized by defining an auxiliary variable z j j and replacing Constraint (7) with the following set of linear constraints:
z j j y j ,   j , j J   and   j j
z j j R j j R ,   j , j J   and   j j
z j j { 0 , 1 } ,   j , j J   and   j j
With Constraints (8)–(11), we set ( N , P ) = ( 100 , 10 ) , (100,50), and (100,90), and used the same sample set ( S = 2000 ) that appeared in Section 6.4 as inputs to the optimization framework. Note that the ranking results obtained in Section 6.4 are equivalent to those obtained with R = 0 since we did not specify R in Section 6.4. For each N P combination, we let R vary from 1 km to 4 km at an interval of 1 km, and the corresponding rankings for all the candidates were obtained. To avoid a redundant presentation, we consider the rankings of the ten most frequently chosen candidates when R = 0 under each N P combination and present their ranking changes against R in Table 5.
Table 5 reveals that when P is relatively small, the rankings of the candidates in the table remain stable until R is sufficiently large. For example, all the rankings remain unchanged when P = 10 and R < 3 . As P grows, more candidates become ranking-sensitive to R . It is worth noting that we failed to obtain the rankings of stations when P = 90 and R = 4 (N/A is displayed) since the PM model cannot have any feasible solution. The change in ranking sensitivity is clearly due to the increase in the density of parcel lockers (i.e., the increase in P ). In most cases, increasing R does not impact the optimal solution when P is small since the constraints are automatically guaranteed by the sparse distribution of parcel lockers. By contrast, a dense distribution of parcel lockers (i.e., P is large) implies that it is more likely for a chosen candidate location to violate Constraints (8)-(11), and it is therefore excluded. As a result, when R keeps increasing, we notice that fewer of the ten candidates remain in the top ten rankings as P increases, with the number decreasing from 9 to 6, and finally to 4.

7. Conclusions

This paper proposes an optimization framework for the planning of parcel locker locations in a transit co-modal system that leverages the on-demand ride-pooling services for last-mile delivery. The parcels are assumed to be transported via the transit system, stored in the selected parcel lockers, and then delivered to their final destinations by sharing a fleet of on-demand ride-pooling vehicles with passengers. To prioritize passenger convenience while enabling efficient passenger–parcel pooling, the routing sequence for a combined passenger–parcel ride is designed to follow the order of passenger origin, parcel origin, passenger destination, and parcel destination. A p-median model that minimizes the average passenger detour time is developed to solve the optimal locations of parcel lockers and optimal matching between the passengers and the parcel lockers. The taxi trip data and the candidate location data for parcel lockers in Shenzhen, China, are used as inputs to the p-median model. In view of the scale of the dataset, an optimization framework based on random sampling is then developed to determine the optimal parcel locker locations according to each candidate’s frequency of being selected in the sample.
We conducted numerical experiments to evaluate the effectiveness of the proposed optimization framework, explore its properties, and perform sensitivity analyses on the key model parameters. The results demonstrate that the optimal parcel locker locations selected by the proposed optimization framework align with up to 70% of the locations chosen by the samples, and the percentage keeps growing as more trips are included in the samples. Moreover, we discover that the candidate parcel locker locations can be classified into five types according to the changes in their rankings of being selected, namely (1) stable, (2) rising, (3) falling, (4) concave, and (5) convex. While the reasons for the emergence of the five candidate types may be complicated, we suggest some policy implications for the planners to carefully identify candidate types and determine the number of selected locations properly. Last, but not least, the results of sensitivity analyses reveal that the average passenger detour distance is positively related to the density of passenger demand and is negatively impacted by the number of selected locations. Moreover, we also identify the minimum distance between any pair of selected locations as an important factor in location planning, as it may significantly affect the candidates’ rankings. Our proposed optimization framework and the implications derived from the numerical experiments are expected to be used by service providers who wish to integrate ride-pooling service with the transit co-modal systems to plan parcel locker locations.
We acknowledge that this paper has several limitations, which can be addressed through future studies. For example, we only consider the trip demand in one hour due to data availability, which may lead to biased optimization results because of the variability in trip demand at different times of the day and on weekdays and weekends. More robust results can be expected from future studies that include data from other time periods. In addition, the pure random sampling method adopted in the optimization framework may also lead to biased optimization results. Other sampling techniques, such as those that account for the spatial and temporal distributions of the trip demand, can be further applied to generate the samples for the optimization framework. Last, but not least, our model only considers integrating ride-pooling passengers with single parcels, while the case of multiple parcels warrants further investigation. Follow-up studies can be conducted by extending the PM model to account for multiple parcels.

Author Contributions

Conceptualization, Z.L. and B.L.; methodology, Z.L. and B.L.; software, Z.L.; validation, Z.L.; formal analysis, Z.L. and B.L.; investigation, Z.L.; resources, B.L.; data curation, Z.L.; writing—original draft preparation, Z.L.; writing—review and editing, Z.L. and B.L.; visualization, Z.L.; supervision, B.L.; project administration, B.L.; funding acquisition, B.L. All authors have read and agreed to the published version of the manuscript.

Funding

The work described in this paper was partially supported by a grant from the National Natural Science Foundation of China (72201176), a grant from the Shenzhen Science and Technology Program (Grant No. RCBS20221008093247074), a grant from the Department of Education of Guangdong Province (2022KCXTD027), the Shenzhen UAV Test Public Service Platform and Low-altitude Economic Integration and Innovation Research Center (No. 29853MKCJ202300205), and the Guangdong University Engineering Technology Research Center for Precision Components of Intelligent Terminal of Transportation Tools (No. 2021GCZX002).

Institutional Review Board Statement

Not applicable.

Informed Consent Statement

Not applicable.

Data Availability Statement

The original contributions presented in the study are included in the article, further inquiries can be directed to the corresponding author.

Conflicts of Interest

The authors declare no conflict of interest.

Appendix A

This appendix presents the results of the normality test of the minimized total passenger detour distance Z min corresponding to various N P combinations, where the sample size N was set to P = 50 and the number of parcel locker locations was set to N = 50, 60, 70, 80, 90, and 100, respectively. We conducted the Kolmogorov–Smirnov test and the Shapiro–Wilk test for each N P combination, and the results are shown in Table A1. The density distributions of Z min when N = 60, 70, 80, 90, and 100 are also given in Figure A1 and Figure A2.
Table A1. Results of normality tests of Z min .
N
Kolmogorov–Smirnov TestShapiro-Wilk Test
Test Statisticp-ValueTest Statisticp-Value
500.033<0.0010.990<0.001
600.033<0.0010.984<0.001
700.043<0.0010.985<0.001
800.034<0.0010.994<0.001
900.028<0.0010.994<0.001
1000.028<0.0010.996<0.001
Figure A1. Density distribution of Z min against sample size N: (a) N = 60 ; (b) N = 70 .
Applsci 15 05217 g0a1
Figure A2. Density distribution of Z min against sample size N: (a) N = 80 ; (b) N = 90 ; (c) N = 100 .
Applsci 15 05217 g0a2

References

  1. Taniguchi, E.; Thompson, R.G. City Logistics: Mapping the Future, 1st ed.; CRC Press: Boca Raton, FL, USA, 2014. [Google Scholar]
  2. Ronald, N.; Yang, J.; Thompson, R.G. Exploring Co-Modality Using On-Demand Transport Systems. Transp. Res. Procedia 2016, 12, 203–212. [Google Scholar] [CrossRef]
  3. Ma, M.; Zhang, F.; Liu, W.; Dixit, V. A game theoretical analysis of metro-integrated city logistics systems. Transp. Res. B 2022, 156, 14–27. [Google Scholar] [CrossRef]
  4. Ma, M.; Zhang, F.; Liu, W.; Dixit, V. Can urban co-modality benefit both users and operators? SSRN Electron. J. 2023. Available online: http://papers.ssrn.com/sol3/papers.cfm?abstract_id=4404702 (accessed on 14 April 2025). [CrossRef]
  5. Ma, M.; Zhang, F.; Liu, W.; Dixit, V. On urban co-modality: Non-cooperative and cooperative games among freight forwarder, carrier and transit operator. Transp. Res. C 2023, 153, 104243. [Google Scholar] [CrossRef]
  6. Kikuta, J.; Ito, T.; Tomiyama, I.; Yamamoto, S.; Yamada, T. New subway-integrated city logistics system. Procedia Soc. Behav. Sci. 2012, 39, 476–489. [Google Scholar] [CrossRef]
  7. De Langhe, K. The importance of external costs for assessing the potential of trams and trains for urban freight distribution. Res. Transp. Bus. Manag. 2017, 24, 114–122. [Google Scholar] [CrossRef]
  8. Bruzzone, F.; Cavallaro, F.; Nocera, S. The integration of passenger and freight transport for first-last mile operations. Transp. Policy 2021, 100, 31–48. [Google Scholar] [CrossRef]
  9. Zhu, S.; Bell, M.G.H.; Schulz, V.; Stokoe, M. Co-modality in city logistics: Sounds good, but how? Transp. Res. A 2023, 168, 103578. [Google Scholar] [CrossRef]
  10. Why Every Minute Matters for Efficient Last-Mile Logistics. Available online: https://www.moverlog.com/blog/every-minute-matters-efficient-last-mile-logistics (accessed on 10 April 2025).
  11. Making Every Step Count: Last-Mile Logistics for City Centres. Available online: https://urbact.eu/making-every-step-count-last-mile-logistics-city-centres (accessed on 10 April 2025).
  12. Daimler, Startup Design Drone-Facilitated Parcel Delivery Van. Available online: https://www.supplychaindive.com/news/daimler-drone-delivery-van/425982/ (accessed on 10 April 2025).
  13. Underground Express: The Quiet Rise of Subway Couriers in China. Available online: https://dialogue.earth/en/business/underground-express-the-quiet-rise-of-subway-couriers-in-china/ (accessed on 10 April 2025).
  14. Trentini, A.; Mahléné, N. Toward a shared urban transport system ensuring passengers & goods cohabitation. TeMA-J. Land Use Mobil. Environ. 2010, 3, 39–44. [Google Scholar]
  15. Arvidsson, N.; Givoni, M.; Woxenius, J. Exploring last mile synergies in passenger and freight transport. Built Environ. 2016, 42, 523–538. [Google Scholar] [CrossRef]
  16. Guo, X.; Wang, D.Z.; Wu, J.; Sun, H.; Zhou, L. Mining commuting behavior of urban rail transit network by using association rules. Phys. A 2020, 559, 125094. [Google Scholar] [CrossRef]
  17. Hu, W.; Dong, J.; Hwang, B.-G.; Ren, R.; Chen, Y.; Chen, Z. Using system dynamics to analyze the development of urban freight transportation system based on rail transit: A case study of Beijing. Sustain. Cities Soc. 2020, 53, 101923. [Google Scholar] [CrossRef]
  18. Van Duin, R.; Wiegmans, B.; Tavasszy, L.; Hendriks, B.; He, Y. Evaluating new participative city logistics concepts: The case of cargo hitching. Transp. Res. Procedia 2019, 39, 565–575. [Google Scholar] [CrossRef]
  19. What Is Last Mile? A Complete Guide to Last Mile Delivery & Logistics. Available online: https://fareye.com/what-is-last-mile-delivery (accessed on 10 April 2025).
  20. Wicaksono, S.; Lin, X.; Tavasszy, L.A. Market potential of bicycle crowdshipping: A two-sided acceptance analysis. Transp. Res. A 2022, 45, 100660. [Google Scholar] [CrossRef]
  21. Li, B.; Krushinsky, D.; Reijers, H.A.; Van Woensel, T. The share-a-ride problem: People and parcels sharing taxis. Eur. J. Oper. Res. 2014, 238, 31–40. [Google Scholar] [CrossRef]
  22. Beirigo, B.A.; Schulte, F.; Negenbor, R.R. Integrating people and freight transportation using shared autonomous vehicles with compartments. FAC-PapersOnLine 2018, 51, 392–397. [Google Scholar] [CrossRef]
  23. Van der Tholen, M.; Beirigo, B.A.; Jovanova, J.; Schulte, F. The share-a-ride problem with integrated routing and design decisions: The case of mixed-purpose shared autonomous vehicles. In Computational Logistics; Springer: Cham, Switzerland, 2021; pp. 347–361. [Google Scholar]
  24. Zhang, S.; Markos, C.; Yu, J.J.Q. Autonomous vehicle intelligent system: Joint ride-sharing and parcel delivery strategy. IEEE Trans. Intell. Transp. Syst. 2022, 23, 18466–18477. [Google Scholar] [CrossRef]
  25. Meinhardt, S.; Schlenther, T.; Martins-Turner, K.; Maciejewski, M. Simulation of on-demand vehicles that serve both person and freight transport. Procedia Comput. Sci. 2022, 201, 398–405. [Google Scholar] [CrossRef]
  26. Cheng, R.; Jiang, Y.; Nielsen, O.A. Integrated people-and-goods transportation systems: From a literature review to a general framework for future research. Transp. Rev. 2023, 45, 997–1020. [Google Scholar] [CrossRef]
  27. Derse, O.; Van Woensel, T. Integrated people and freight transportation: A literature review. Future Transp. 2024, 4, 1142–1160. [Google Scholar] [CrossRef]
  28. Dong, J.; Hu, W.; Yan, S.; Ren, R.; Zhao, X. Network planning method for capacitated metro-based underground logistics system. Adv. Civ. Eng. 2018, 2018, 6958086. [Google Scholar] [CrossRef]
  29. Zhao, L.; Li, H.; Li, M.; Sun, Y.; Hu, Q.; Mao, S.; Li, J.; Xue, J. Location selection of intra-city distribution hubs in the metro-integrated logistics system. Tunn. Undergr. Space Technol. 2018, 80, 246–256. [Google Scholar] [CrossRef]
  30. Ji, Y.; Zheng, Y.; Zhao, J.; Shen, Y.; Du, Y. A multimodal passenger-and-package sharing network for urban logistics. J. Adv. Transp. 2020, 2020, 6039032. [Google Scholar] [CrossRef]
  31. Azcuy, I.; Agatz, N.; Giesen, R. Designing integrated urban delivery systems using public transport. Transp. Res. E 2021, 156, 102525. [Google Scholar] [CrossRef]
  32. Kizil, K.U.; Yildiz, B. Public transport-based crowd-shipping with backup transfers. Transp. Sci. 2022, 57, 174–196. [Google Scholar] [CrossRef]
  33. Mourad, A.; Puchinger, J.; Chu, C. A survey of models and algorithms for optimizing shared mobility. Transp. Res. B 2019, 123, 323–346. [Google Scholar] [CrossRef]
  34. Manchella, K.; Umrawal, A.K.; Aggarwal, V. FlexPool: A distributed model-free deep reinforcement learning algorithm for joint passengers and goods transportation. IEEE Trans. Intell. Transp. Syst. 2021, 22, 2035–2047. [Google Scholar] [CrossRef]
  35. Zhan, X.; Szeto, W.Y.; Wang, Y. The ride-hailing sharing problem with parcel transportation. Transp. Res. E 2023, 172, 103073. [Google Scholar] [CrossRef]
  36. Fehn, F.; Engelhardt, R.; Bogenberger, K. Ride-parcel-pooling—Assessment of the potential in combining on-demand mobility and city logistics. In Proceedings of the 2021 IEEE International Intelligent Transportation Systems Conference, Indianapolis, IN, USA, 19–22 September 2021. [Google Scholar]
  37. Fehn, F.; Engelhardt, R.; Dandl, F.; Bogenberger, K.; Busch, F. Integrating parcel deliveries into a ride-pooling service—An agent-based simulation study. Transp. Res. A 2023, 169, 103580. [Google Scholar] [CrossRef]
  38. Ji, Y.; Zhao, M.; Zheng, Y.; Shen, Y.; Du, Y. Urban passenger-and-package sharing transportation by e-hailing taxis: A simulation-based pricing analysis in Shanghai. Transp. Policy 2024, 156, 138–151. [Google Scholar] [CrossRef]
  39. Finding the Perfect Fit: Open vs. Closed Parcel Locker Networks. Available online: https://www.milytech.com/blog/open-vs-closed-parcel-locker-networks (accessed on 10 April 2025).
  40. Open or Closed Networks? Let’s Talk Parcel Lockers. Available online: https://www.ipc.be/services/markets-and-regulations/e-commerce-market-insights/e-commerce-articles/parcel-lockers-2022 (accessed on 10 April 2025).
  41. Hakimi, S.L. Optimum locations of switching centers and the absolute centers and medians of a graph. Oper. Res. 1964, 12, 450–459. [Google Scholar] [CrossRef]
  42. Hakimi, S.L. Optimum distribution of switching centers in a communication network and some related graph theoretic problems. Oper. Res. 1965, 13, 462–475. [Google Scholar] [CrossRef]
  43. Campell, J.F. Integer programming formulations of discrete hub location problems. Eur. J. Oper. Res. 1994, 72, 387–405. [Google Scholar] [CrossRef]
  44. Kara, B.Y.; Tansel, B.C. On the single-assignment p-hub center problem. Eur. J. Oper. Res. 2000, 125, 648–655. [Google Scholar] [CrossRef]
  45. Qu, B.; Weng, K. Path relinking approach for multiple allocation hub maximal covering problem. Comput. Math. Appl. 2009, 57, 1890–1894. [Google Scholar] [CrossRef]
  46. Shenzhen Statistical Yearbook. 2024. Available online: http://tjj.sz.gov.cn/ (accessed on 10 April 2025).
  47. List of Bus Lines and Stops in Shenzhen. Available online: http://jtys.sz.gov.cn/jtzx/wycx/gjcx/gjfw/content/post_11492052.html (accessed on 10 April 2025).
  48. Information of Shenzhen Metro Lines. Available online: http://jtys.sz.gov.cn/zwgk/ztzl/ggqsydw/jt/dt/ywxx/dtxlxx/content/post_11086812.html (accessed on 10 April 2025).
  49. Longitude and Latitude Query. Available online: https://api.map.baidu.com/lbsapi/getpoint/index.html (accessed on 10 April 2025).
  50. Ke, J.; Zheng, Z.; Yang, H.; Ye, J. Data-driven analysis on matching probability, routing distance and detour distance in ride-pooling services. Transp. Res. C 2021, 124, 102922. [Google Scholar] [CrossRef]
Figure 1. Illustration of moderate and full passenger–parcel integration: (a) moderate passenger–parcel integration; (b) full passenger–parcel integration.
Applsci 15 05217 g001
Figure 2. Illustration of passenger detour distance d i j .
Applsci 15 05217 g002
Figure 3. Spatial distribution of taxi trip origins.
Applsci 15 05217 g003
Figure 4. Spatial distribution of taxi trip destinations.
Applsci 15 05217 g004
Figure 5. Spatial distribution of candidate parcel locker locations.
Applsci 15 05217 g005
Figure 6. A flowchart of the proposed optimization framework.
Applsci 15 05217 g006
Figure 7. The road network of Shenzhen.
Applsci 15 05217 g007
Figure 8. Distribution of minimized total passenger detour distance among 2000 selections.
Applsci 15 05217 g008
Figure 9. The total frequency of being matched with passengers for all the candidate parcel locker locations.
Applsci 15 05217 g009
Figure 10. The spatial distribution of the selected locations of the parcel lockers obtained by the optimization framework.
Applsci 15 05217 g010
Figure 11. Average minimum passenger detour distance against N.
Applsci 15 05217 g011
Figure 12. Average minimum passenger detour distance against P.
Applsci 15 05217 g012
Table 1. The Shenzhen taxi trip data.
Trip IDTaxi Plate Number (Anonymized)Start TimeOrigin LongitudeOrigin LatitudeDestination LongitudeDestination Latitude
1******18:00:00113.88119522.56668113.86140422.603367
2******18:00:00113.90388522.516727113.9107222.539614
26,698******18:59:05114.0534222.5356114.1218222.567995
Note: ****** refers to the anonymized taxi plate number.
Table 2. Detailed steps of the proposed optimization framework.
The Optimization Framework for Parcel Locker Locations
Step 1: Initialization
Generate sample size N , selection time S , and the required number of parcel locker locations P .
Step 2: Random sampling and optimization
For each selection s { 1 , 2 , , S } :
Randomly choose N ride requests from the trip dataset to form the passenger set I s ;
For each passenger i I s :
Compute the detour distance d i j for passenger i I s if being pooled with candidate location j J ;
Looking for the optimal solution ( x s , y s ) to the proposed PM model with d i j ( i I s , j J ) and P as model parameters, in which x s = [ x i j s ] and y s = [ y j s ] are the vectors of optimized x i j and y j   ( i I s , j J ) , respectively.
Step 3: Output the optimal parcel locker locations
Define vector f = s S i I s x i j s , j J , sort the elements in f in descending order and output the top P elements and the corresponding candidate locations as the final locations for the parcel lockers.
Table 3. Information of LOC Ω s in different cases.
( N , P )
MeanMaximumMinimumStandard Deviation
(50,20)0.3130.6000.0500.081
(60,30)0.2960.5000.0670.061
(70,30)0.3950.6670.1670.069
(80,40)0.4590.6500.2500.060
(90,40)0.4590.6500.2750.060
(100,50)0.5120.6800.3400.053
Table 4. Five types of candidate locations according to their rankings against P.
Candidate IndexP
102030405060708090100
Type I: Stable
872111222222
1383223444433
Type II: Rising
8147161112889888
139107694735222020202020
Type III: Falling
997192324273028282727
193561622252626262828
Type IV: Concave
14652172125334242424242
194191087111616161515
Type V: Convex
1378212016141414141414
1587912910495787373727370
Table 5. Ranking changes in candidate locations against R.
Candidate IndexR (km)
01234
P = 10
8011112
87222936
13833336
14044421
19355544
4766669
9977757
13788873
1679991210
14110101088
P = 50
471154726
872222275
14133434
138481373
51543623
1406102612
967586458
81891555
149966191
801011799
P = 90
4711230N/A
872224N/A
138371143N/A
14143410N/A
515432N/A
96658612N/A
140710271N/A
81891651N/A
14996685N/A
9510258827N/A
Disclaimer/Publisher’s Note: The statements, opinions and data contained in all publications are solely those of the individual author(s) and contributor(s) and not of MDPI and/or the editor(s). MDPI and/or the editor(s) disclaim responsibility for any injury to people or property resulting from any ideas, methods, instructions or products referred to in the content.

