Article

The Effect of Industrial Byproducts Fly Ash and Quartz Powder on Cement Properties and Environmental Benefits Analysis

1
Faculty of Civil Engineering and Mechanics, Jiangsu University, Zhenjiang 212013, China
2
Department of Architectural Engineering, Kangwon National University, Chuncheon-si 24341, Republic of Korea
*
Author to whom correspondence should be addressed.
Appl. Sci. 2025, 15(9), 5093; https://doi.org/10.3390/app15095093
Submission received: 3 April 2025 / Revised: 27 April 2025 / Accepted: 29 April 2025 / Published: 3 May 2025
(This article belongs to the Section Civil Engineering)

Abstract

:
Using industrial byproducts to replace cement is an important way to reduce carbon emissions from the cement industry. In this study, the effects of two industrial byproducts, fly ash (FA) and quartz powder (QZ), as supplementary cementitious materials (SCMs) on the macroscopic properties and microstructure of cement-based materials were experimentally investigated. The results of the compressive strength and ultrasonic pulse velocity experiments showed that QZ significantly mitigated the decrease in strength and ultrasonic pulse velocity caused by the reduction in cement dosage in the early stage. Moreover, the 28-day compressive strength of the FA group was comparable to that of the control group, and regression analysis indicated a negligible effect of FA addition on 28-day compressive strength. X-ray diffraction and Fourier transform infrared spectroscopy experiments showed that QZ can promote the hydration reaction in the early stage. Scanning electron microscopy images revealed that a layer of hydration products can form on the surface of FA after 28 days of hydration. Hydration heat experiments indicated that FA significantly reduces the release of hydration heat, while QZ promotes the formation of ettringite through nucleation effects in the early stage of hydration, thereby accelerating the release of hydration heat. Thermogravimetric analysis after 28 days showed that the amount of hydration products and calcium hydroxide produced decreased with the addition of cementitious materials. Finally, the use of FA and QZ was analyzed for carbon emissions and energy consumption. The results showed that using these two cementitious materials significantly reduces carbon dioxide emissions and energy consumption.

1. Introduction

The carbon emissions associated with concrete primarily originate from cement production [1,2,3]. The carbon dioxide emissions associated with the production of 1 kg of cement are approximately 0.8–1 kg [1,4,5]. Carbon dioxide emissions from cement production account for approximately 7–10% of global carbon dioxide emissions [5,6,7,8,9]. To reduce carbon emissions in the cement industry, some researchers propose using industrial byproducts with pozzolanic properties either as alternative materials in cement production or as partial cement replacements in concrete [10,11]. The use of supplementary cementitious materials (SCMs) not only reduces carbon dioxide emissions but also enables the production of cement products with high mechanical properties and good durability indices [9,12,13,14]. These SCMs can serve as pozzolanic materials or fillers, among other roles [15]. Pozzolanic materials, such as fly ash (FA), undergo a pozzolanic reaction with calcium hydroxide (CH) produced during cement hydration [16], generating additional calcium silicate hydrate (C-S-H) and other hydration products [15,17]. The additional C-S-H fills pores by promoting pore refinement and cementitious matrix thickening. Non-pozzolanic, high-fineness inorganic materials like quartz powder (QZ) create a filler effect. They directly fill small pores in the cement slurry and, through physical action, promote early cement hydration, densifying the cementitious matrix [18,19]. They also provide nucleation and growth sites for hydration products [20,21].
FA is one of the residues produced by coal-fired power generation and heating and is captured by electrostatic precipitators or bag filters before flue gas emission. The widespread use of FA in cement and concrete primarily depends on its fineness, chemical composition, phase composition, and pozzolanic activity. Meanwhile, QZ is a processing byproduct of quartzite [22], with its main crystalline component being silicon dioxide (SiO2). QZ is widely used in the building materials industry. It can be used as a filling material, a strength-enhancing material, and a raw material that improves the strength, wear resistance, and durability of cement and concrete during manufacturing [23].
Research on the mechanisms of FA and QZ in cementitious materials is extensive. For example, Bayrak et al. compared the effects of QZ and metakaolin in geopolymers. They found that replacing fine aggregates with metakaolin increased strength by 86%, while QZ replacement resulted in a 42% increase. This indicates that different SCMs have varying effects on cementitious material properties [24]. Xuan et al. studied the application of QZ in carbonation curing, revealing that small-sized QZ particles exhibit beneficial effects on cement hydration and macroscopic properties, while larger QZ particles promote carbonation curing. This work confirms QZ’s potential to enhance CO2 capture in cement-based materials [22]. Venkitasamy et al. investigated the mechanism of FA influence in heavyweight concrete, concluding that 15% FA replacement yields early compressive strength comparable to the control group. For higher levels of FA and slag replacements, prolonged curing time is required to achieve the desired strength levels [25]. Ke et al. used FA, red mud, and calcium carbide slag as raw materials to prepare full solid waste cementitious materials. The results showed that when sufficient calcium carbide slag is present, adding FA can significantly enhance the long-term strength of specimens [26].
Compared to prior studies, the innovations of this study are as follows. First, while some researchers have focused on using multiple SCMs to reduce cement usage and carbon emissions, this study analyzes the synergistic effects and carbon emission changes of FA and QZ in cementitious systems. Second, it uses regression analysis to quantitatively evaluate the strength changes in cement-based materials with QZ and FA. Third, unlike most previous studies that only focus on macro-properties, this study also assesses the evolution of micro-structures and refines the correlation between macro-properties and micro-structures.
Considering a mixture of FA and QZ, this study investigated the mortar specimens and paste samples, including compressive strength (selecting the dosages of FA and QZ as independent variables, 28-day compressive strength as dependent variable to establish a regression analysis model), ultrasonic pulse velocity (UPV), heat of hydration, X-ray diffraction (XRD), Fourier transform infrared spectroscopy (FTIR), thermogravimetric (TGA), and scanning electron microscopy (SEM). Based on the analysis of these experimental results, the macroscopic properties and microstructure of the samples, as well as the correlation between the experimental data, were discussed.

2. Materials and Methods

2.1. Materials

This study evaluates the effect of partial cement replacement with FA and QZ on the properties of cement-based materials. It uses Ordinary Portland Cement (OPC), sand, water, FA, and QZ as raw materials to prepare mortar specimens and paste samples. OPC was purchased from Jiangsu Helin Cement Co., Ltd., Jiangsu, China. The specific surface area of cement was 3870 cm2/g. The FA is first-grade FA with a specific surface area of 4150 cm2/g. QZ comes from Lingshou County, China. It uses the experimental standard sand produced by Xiamen ISO Company, China, and the tap water from the laboratory.
Table 1 shows the OPC, QZ, and FA oxide contents measured by an X-ray fluorescence spectrometer (XRF). Figure 1 shows the particle size distribution (PSD) curve of the raw materials. The median particle sizes of OPC, FA, and QZ are 13, 5.8, and 7.64 μm, respectively. The OPC, QZ, and FA densities measured according to ASTM C188-17 [27] are 3.15, 2.65, and 2.55 g/cm3, respectively. Figure 2 shows the XRD test results of OPC, QZ, and FA. The main components of FA are silica and mullite. According to the ASTM C618 [28] standard, the calcium oxide content of FA is less than 10%, which can be classified as class F fly ash.

2.2. Mixing Ratio and Sample Preparation

Table 2 shows the proportions of FA and QZ in single-doped, double-doped, and undoped combinations. To ensure the optimal performance of cement products, the proportion of cement replacement by industrial waste SCM should be limited to 40% [29]. To explore the correlation between the addition of FA and QZ and the 28-day compressive strength, five additional mortar specimens were designed. Mix the ingredients to make mortar specimens with a size of 40 mm × 40 mm × 160 mm and paste samples with 40 mm × 40 mm × 40 mm. The specimens were cured for 24 h under standard curing conditions, removed from the mold after forming, and placed in a standard room for further curing.

2.3. Experimental Methodology

2.3.1. Mortar Flexural and Compressive Strength Test

A universal testing machine with a compressive strength loading rate of 2400 N/s was used. The flexural strength of the mortar specimens was tested using 40 mm × 40 mm × 160 mm specimens, and the broken specimens were further subjected to compressive strength tests. The specimens were cured in the standard curing box for 1 day, 3 days, 7 days, and 28 days. The average strength of the six mortar specimens was reported.

2.3.2. UPV Test

The UPV test was carried out on the mortar specimens cured for 1 day, 3 days, 7 days, and 28 days using a non-metallic ultrasonic detection analyzer. The size of the tested mortar specimen is 40 mm × 40 mm × 160 mm. The UPV values of three specimens are tested, and the average value is calculated as the test result.

2.3.3. Heat of Hydration Test

The calorimetric test experiment of the hydration kinetics of the paste was carried out using an American TA TAMAIR 8-channel isothermal calorimeter (TA Instruments, headquartered in New Castle, DE, USA), and the temperature was controlled at 20 °C. First, the raw materials were mixed according to the selected mix ratio. Then, 10.0 g of the uniformly stirred paste was placed in a small bottle and quickly transferred to the corresponding channel of the calorimeter. The heat flow and accumulated heat were measured for 72 h. To reduce the influence of ambient heat on the samples, the room temperature was maintained at 20 °C during the entire sample preparation process.

2.3.4. Microscale Tests

XRD, FTIR, and TGA analyses were performed on the paste samples on the 1st and 28th days of curing, respectively. The sample was taken from the paste in small pieces, soaked in isopropanol for at least 7 days to stop hydration, and dried in a vacuum desiccator for 24 h. Subsequently, the samples were ground into powder and passed through a 45 μm sieve.
X-ray diffractometer identified the crystal phase composition of the paste sample’s hydration products (Shimadzu Corporation, Kyoto, Japan). The Cu Kα radiation was applied at a current of 40 mA, a voltage of 40 KV, a 2θ range of 5–80°, and a scanning time of 30 min.
FTIR was used to analyze the changes in chemical bonds. Before each measurement, a background scan was performed using a ZnSe diamond crystal. Each sample was scanned 16 times in the 400–4000 cm−1 range with a resolution of 0.4 cm−1.
The hydration products and CH contents were determined by TGA and its first derivative (DTG). The test was conducted using a thermogravimetric analyzer (NETZSCH, Selb, Germany) in a nitrogen (N2) atmosphere with a 15 °C/min heating rate from room temperature to 800 °C.

2.3.5. SEM

The microstructure of the paste sample was analyzed by field emission scanning electron microscopy (TESCAN, Brno, Czech Republic). Small pieces of the paste sample that had been cured for 28 days were soaked in isopropanol for 7 days to stop hydration. After hydration stopped, the pieces were dried in an oven at 80 °C for 24 h. A thin layer of gold was plated before the experiment to give the sample good conductivity. Microscopic analysis was carried out at an accelerating voltage of 15.0 kV.

3. Results and Discussion

3.1. Compressive Strength

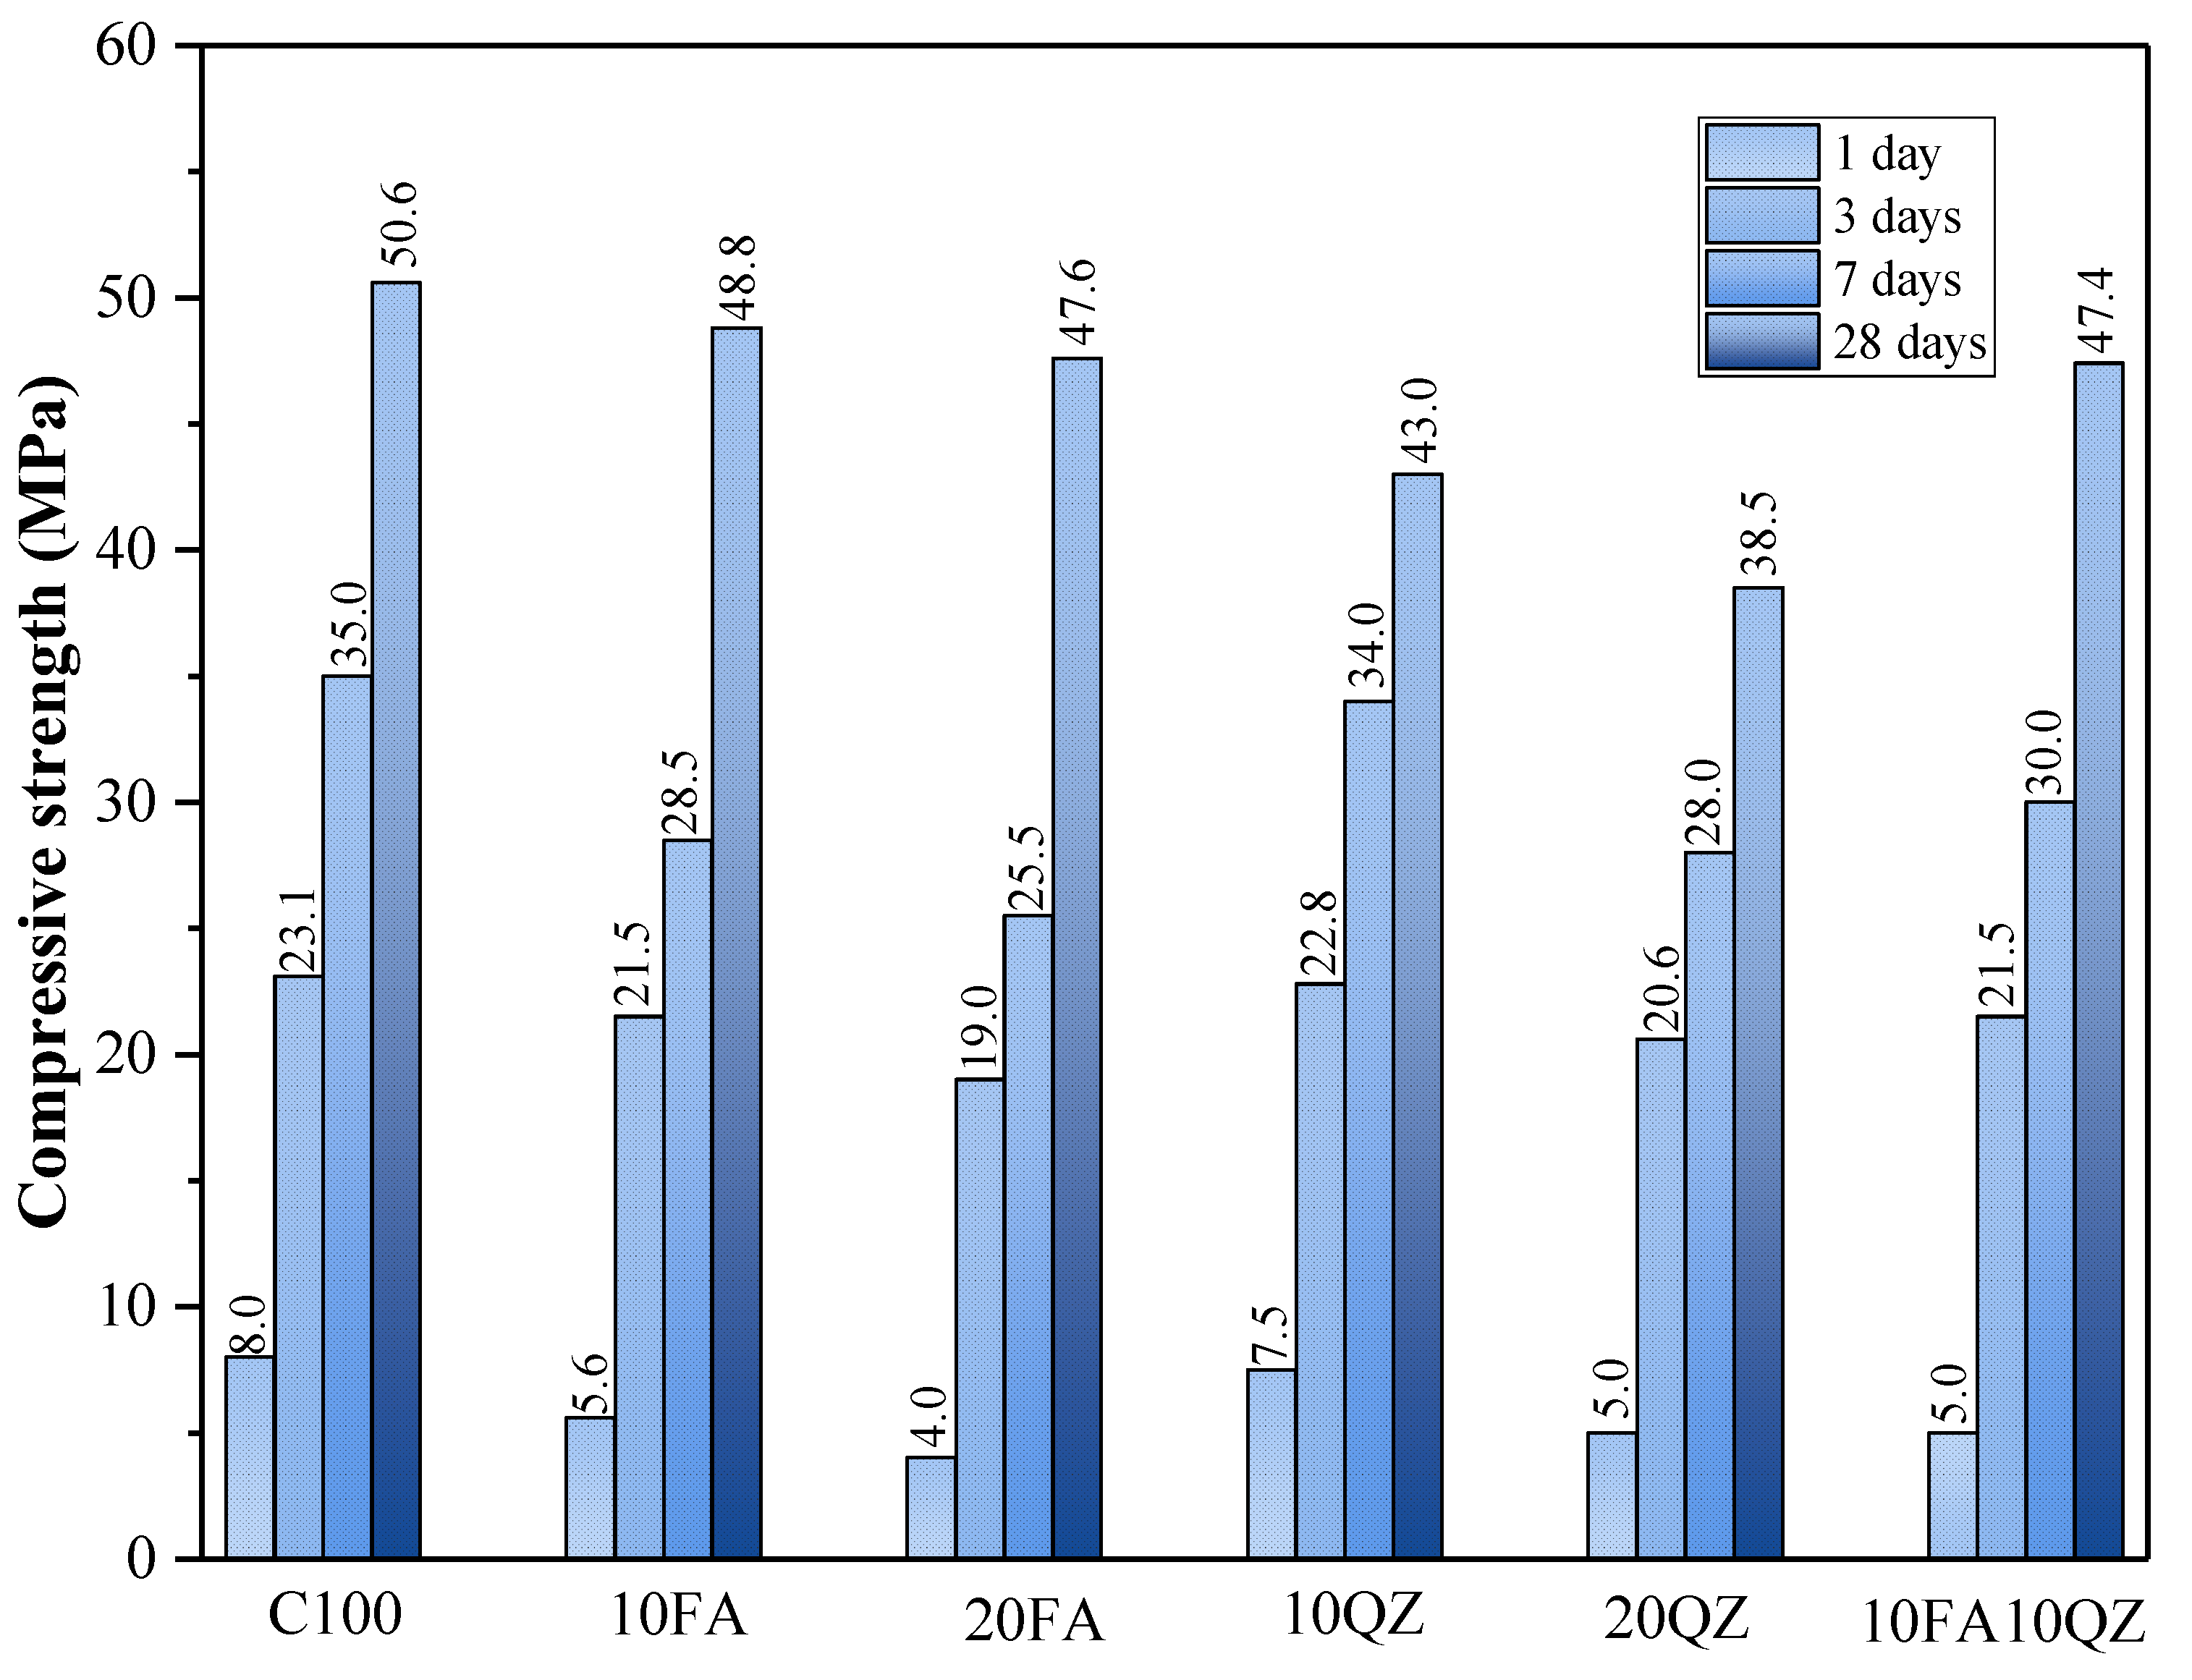
Figure 3 shows the compressive strength test results of the mortar specimens at 1, 3, 7, and 28 days. The compressive strength increases as the curing period increases. The use of SCMs mainly affects cement hydration through dilution, filling, and nucleation effects [30]. When the curing age was 1, 3, and 7 days, the compressive strength of the mortar specimens decreased with the increase in QZ and FA substitution. However, the compressive strength of the QZ group was higher than that of the FA group. The main reason is that QZ and FA have low initial reaction activity [31]. Therefore, the dilution effect increases the effective water–cement ratio of the mixed mortar, speeding up the cement reaction rate [32] and negatively impacting the formation of compressive strength [
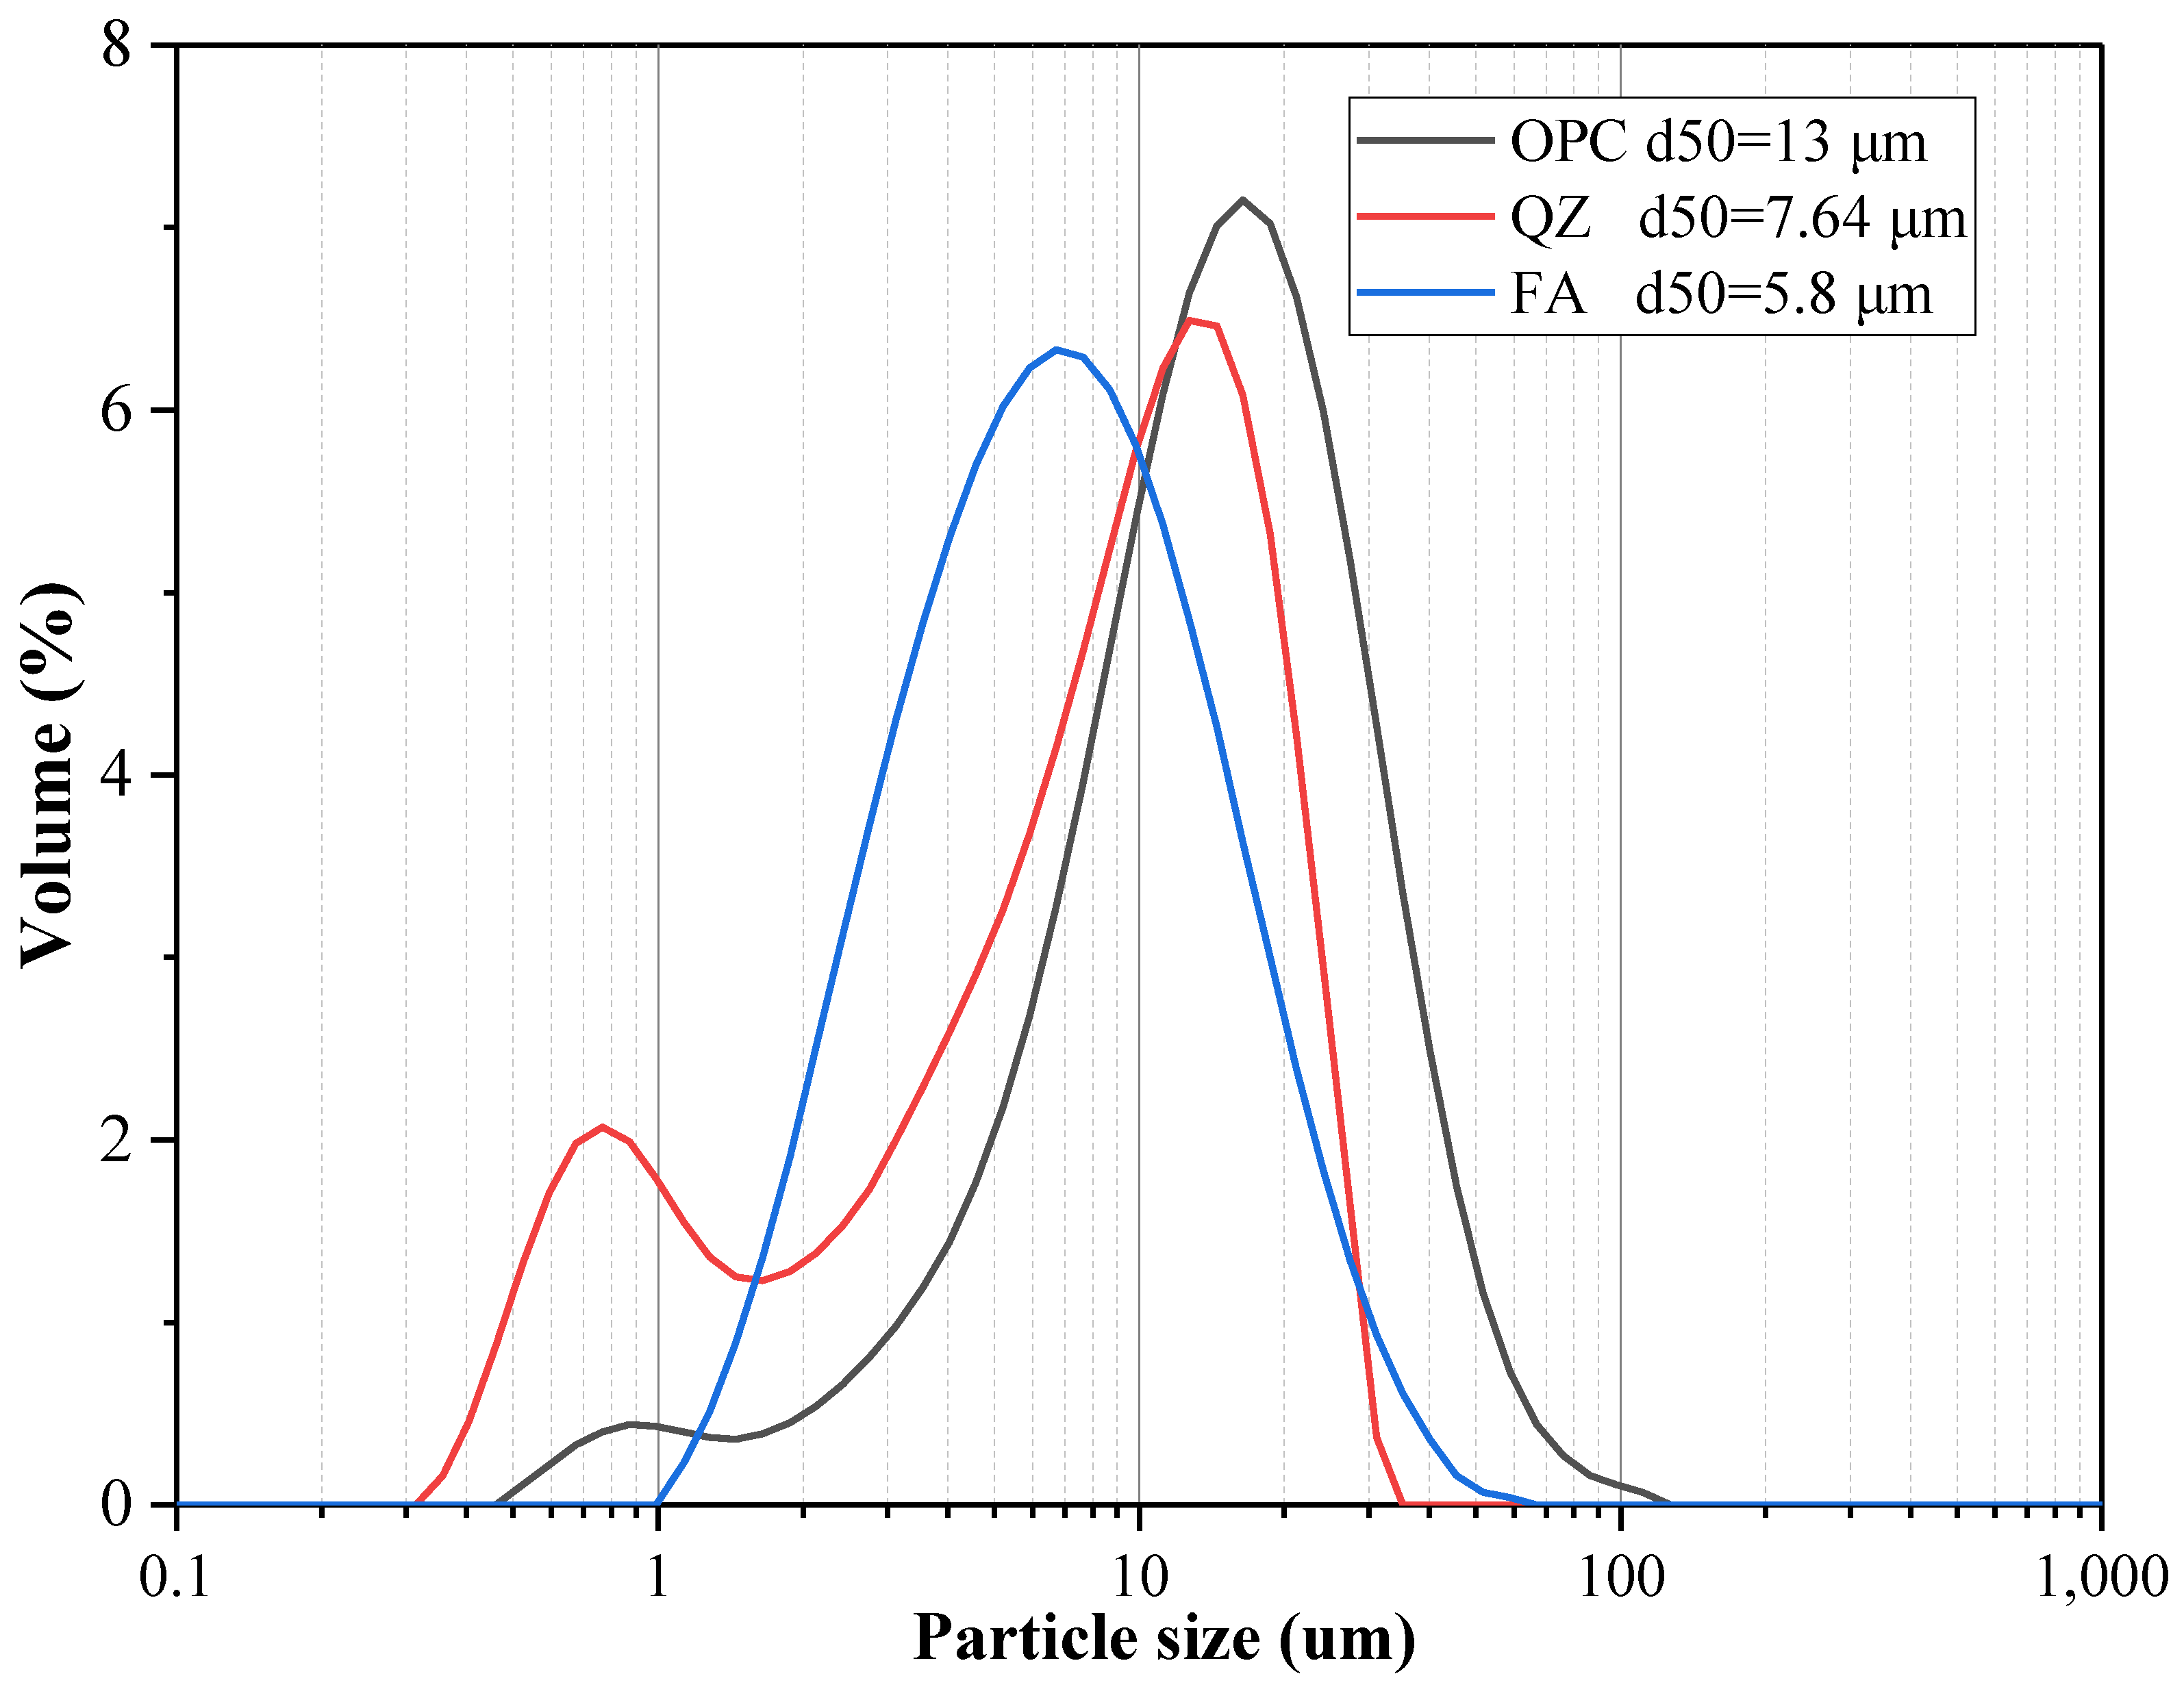
33]. The difference in compressive strength mainly depends on the strength of the filling and nucleation effects. The particle size distribution of QZ has a finer range of particle size distribution than that of FA. The finer particle size makes the nucleation effect of QZ more significant than that of FA. In addition, finer QZ can fill finer pores, making the internal structure of the mixed mortar denser at an early stage, thereby obtaining higher compressive strength than the FA group.
During the initial stage, FA has low reactivity, which hardly accelerates the formation of early compressive strength [31]. In addition, FA also reduces the hydration rate, which delays the process of the mixed mortar turning into a solid, thus affecting early compressive strength [34]. FA accelerates cement strength development mainly in the late stage [35]. When the curing age reached 28 days, the compressive strength of 10FA, 20FA, and 10FA10QZ increased rapidly and reached a level comparable to that of the control group. The following is a summary that explains the reasons behind the results: First, when the curing age is reached, the pozzolanic effect of FA is activated. This means that Al2O3 and SiO2 in FA can react with CH to produce substances such as C-S-H. The gel produced by the pozzolanic effect can fill the capillaries in the concrete and thus effectively accelerate the formation of strength [36,37]. Secondly, the secondary hydration products of FA adhere to its surface, making the surface of FA rough, improving the interface with cement, and optimizing the overall mechanical properties of cement materials. When the curing time is prolonged beyond 28 days, the mechanical strength and durability properties of the test specimens continue to exhibit incremental improvements, attributed to the characteristic delayed pozzolanic reactivity of FA [38].
The compressive strength values of the 10FA10QZ group at all stages achieved satisfactory results. This group can improve strength through the filling and nucleation effects of QZ in the early stage and through the secondary hydration reaction of FA in the late stage. In the same reaction system, these two SCMs can demonstrate their respective advantages at different ages and jointly accelerate the consolidation of cement strength.
To quantitatively describe the relationship between the addition of FA and QZ and the 28-day compressive strength (Table 3), a quadratic polynomial model was constructed using regression analysis, with the general form as follows:
y = a0 + a1x1 + a2x2 + a11x12 + a22x22 + a12x1x2 + ε
In the model, the dependent variable y is the dependent variable representing the 28-day compressive strength. x 1 and x 2 represent the proportions of FA and QZ, and k represents the number of independent variables. a 0 is the intercept term, a i are the linear coefficients, a i i are the quadratic coefficients, a i j is the interaction coefficient, and ε represents the random error in the estimated model.
Experimental data were collected from various mix proportion combinations and analyzed using the Minitab (version 20) platform to estimate the coefficients of the model. The resulting model is expressed as follows:
y = 50.701 − 0.166x1 + 0.866x2 + 0.00006x12 + 0.01206x22 + 0.0604x1x2 + ε
The F and p values were calculated to evaluate the significance of the model and its coefficients. Typically, model terms with p-values below 0.05 are significant, while those above 0.05 are not. The coefficient of determination, R 2 , measures how well the quadratic polynomial equation fits the data, with values closer to 1 indicating a better fit. Model testing (Table 4 and Table 5) revealed a p value of less than 0.001, confirming that the quadratic polynomial model effectively describes the relationship between FA and QZ content and 28-day compressive strength. The R 2 value of 99.08% further confirms the model’s good fit to the data. In the analysis of the various terms in the model, the linear term of QZ and the interaction term between FA and QZ are found to be significant (0.001 for QZ, 0.001 for FA×QZ). This indicates that the dosage of QZ and the interaction between FA and QZ have a significant impact on the 28-day compressive strength of concrete. However, the linear and quadratic terms of FA are not statistically significant in the model (0.198 for FA, 0.992 for FA2). This suggests that within a substitution range of 20%, the substitution of cement with FA has little effect on the 28-day compressive strength of concrete. In other words, within this dosage range, the incorporation of FA does not significantly promote or inhibit strength development.

3.2. UPV

UPV is a non-destructive testing method for concrete quality commonly used in practical engineering [39]. The porosity of the material mainly affects compressive strength, while the main influencing factors of UPV include Young’s modulus, Poisson’s ratio, and density. 
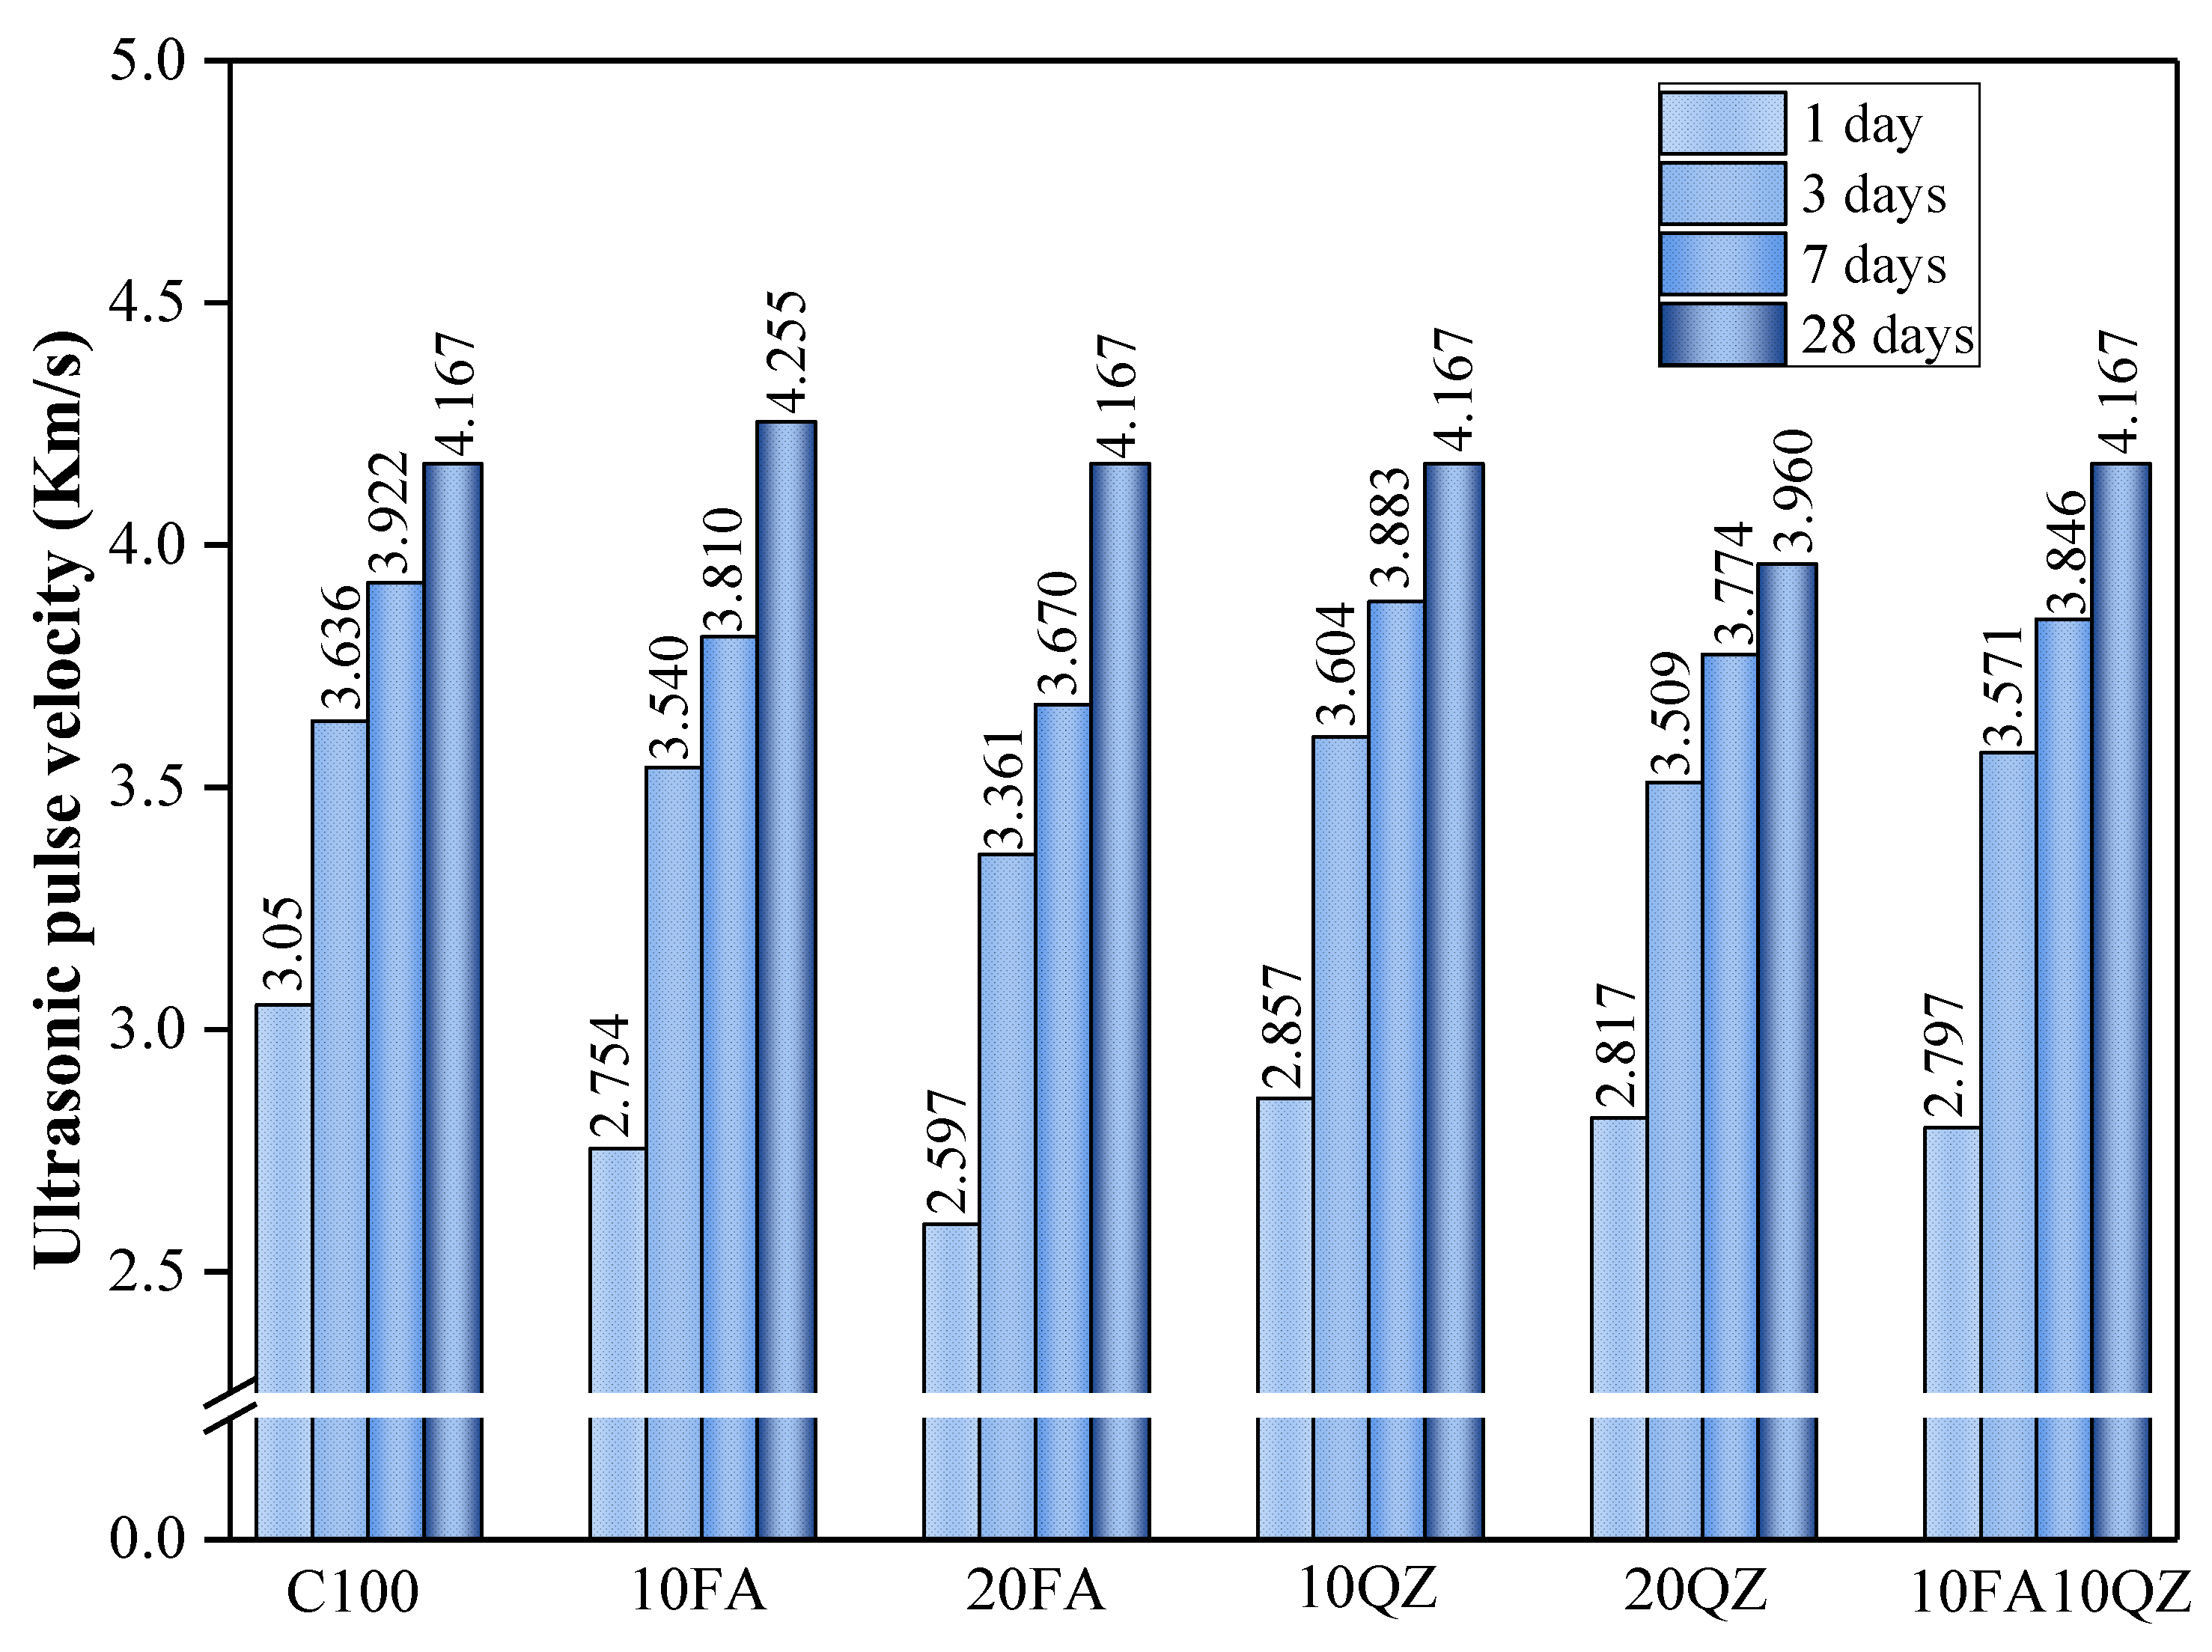
Figure 4 shows the UPV test results of mortar specimens of each component.
The highest UPV values for C100 were obtained at 1, 3, and 7 days of hydration, with values of 3050, 3636, and 3738 m/s, respectively. The early UPV value decreased significantly with the increase in QZ and FA substitution. For example, when the curing age was 1 day, the UPV value decreased by 14.9% with a 20% FA content. While with a 20% QZ content, the UPV value decreased by 7.6%. QZ exhibits physical effects (nucleation effect and filling effect) in the early stage of hydration, accelerating cement hydration [18,22,40]. However, the UPV value of the QZ group was still lower than that of the control group in the early stage. This is due to the reduction in cement mass and the insufficient physical effect of QZ to compensate for the negative effect caused by the reduction in the amount of cement used.
The UPV value of the QZ group at 28 days was lower than that of the other groups, possibly because QZ’s filling and nucleation effects accelerated the hydration reaction mainly in the early stage. Additionally, QZ has a different pozzolanic reaction compared to FA in the late stage, resulting in a lack of apparent improvement in porosity [41].
In the early stage, the FA group’s UPV value is low, and in the late stage, the UPV value becomes significantly higher. As the curing time increased, the UPV value of the FA group eventually became equivalent to that of the control group. This may be due to the low reactivity of FA in the early stage, which limits its ability to facilitate the growth of hydration products. However, the secondary hydration effect increases the number of secondary hydration products as the curing period increases, densifying the internal structure of the mixed mortar and increasing the UPV value. It is important to note that the 10FA10QZ group exhibits higher strength and UPV values both in the early and late stages of development. When these two materials are used in combination, QZ enhances strength through its filling and nucleation effects in the early stages, while FA’s secondary hydration reaction contributes to strength gain in the later stages. This synergistic effect allows both binder materials to leverage their respective advantages at different ages, thereby collectively promoting the development of cement strength.
Factors that affect the UPV value, such as the amount of hydration products and pore size, also have a crucial impact on compressive strength [
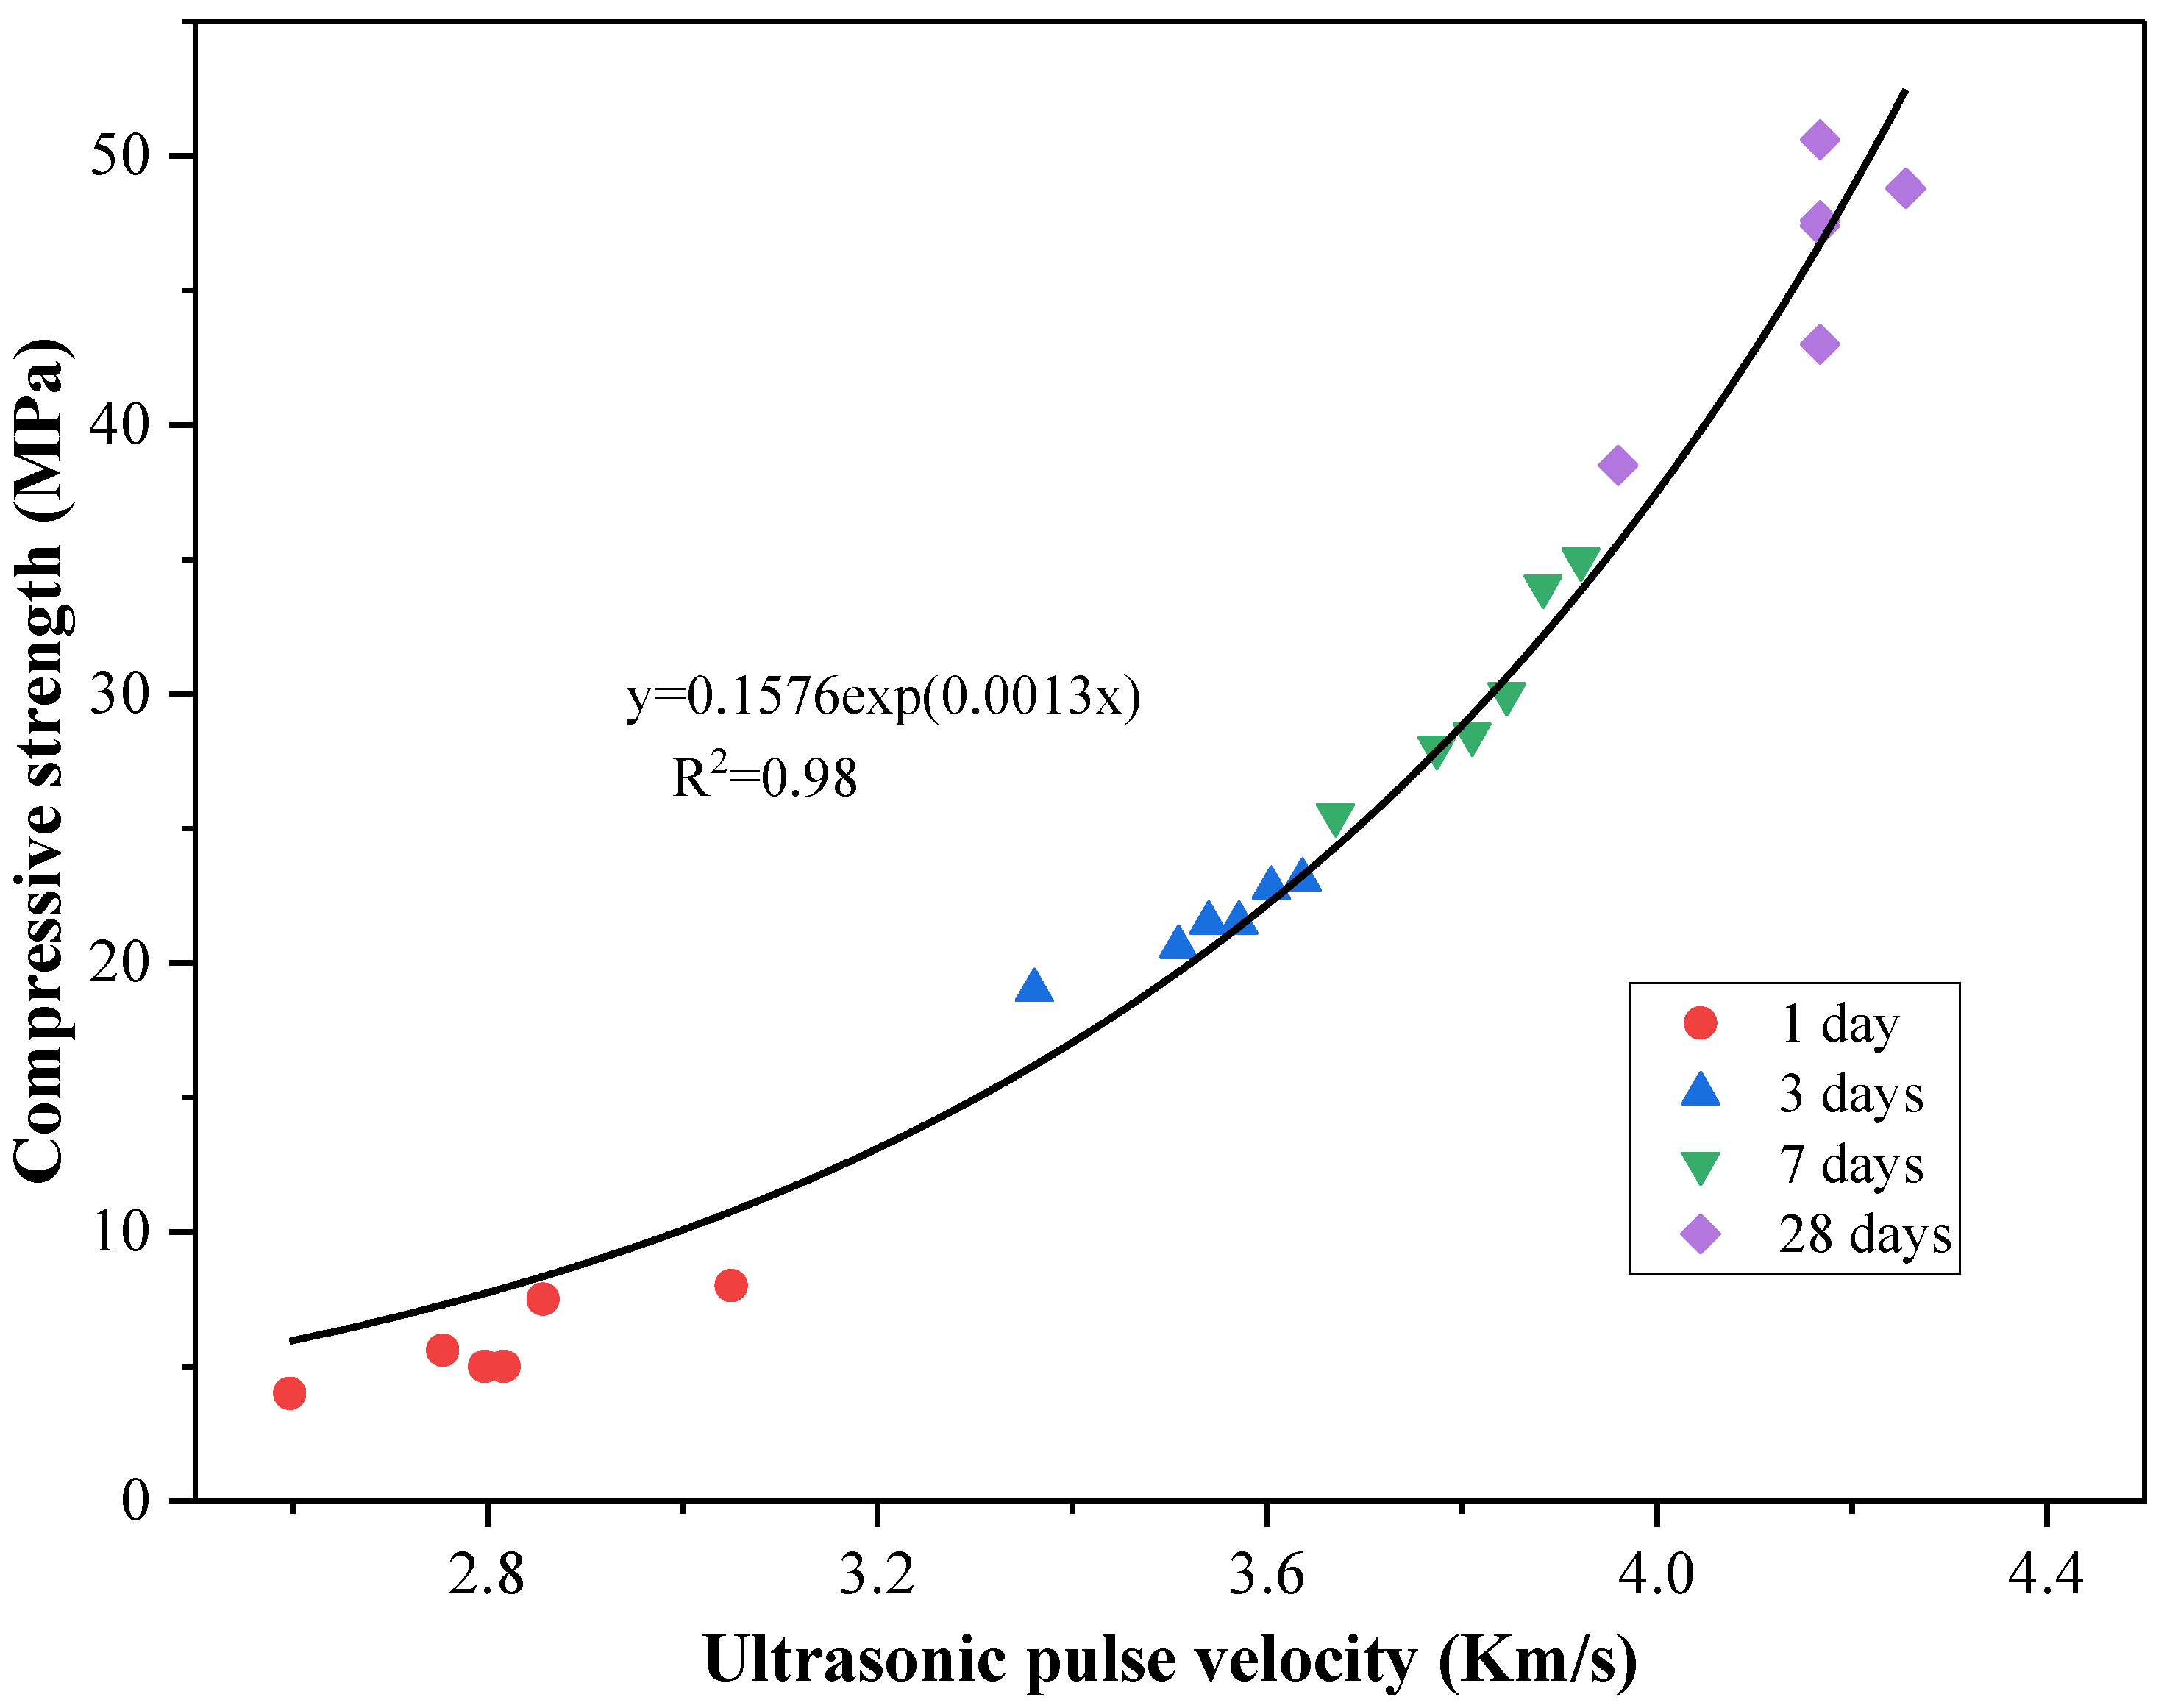
42]. As the hydration products increase and the capillary pores are filled, the UPV value and strength increase during the hydration process. Therefore, UPV is applicable in engineering to evaluate and predict the compressive strength of concrete. Previous studies have revealed a strong correlation between UPV and compressive strength, with an exponential relationship [42,43]. In this study, we performed a fitting of the trend of UPV and compressive strength variation over time. As shown in Figure 5, the relationship between UPV and the compressive strength of the mixed mortar is presented, with an R2 value of 0.98 for the 28-day compressive strength. It should be noted that the trend lines for other time points in the figure are only intended to illustrate the overall data variation trend and have not been subject to formal regression modeling or statistical validation.

3.3. Heat of Hydration

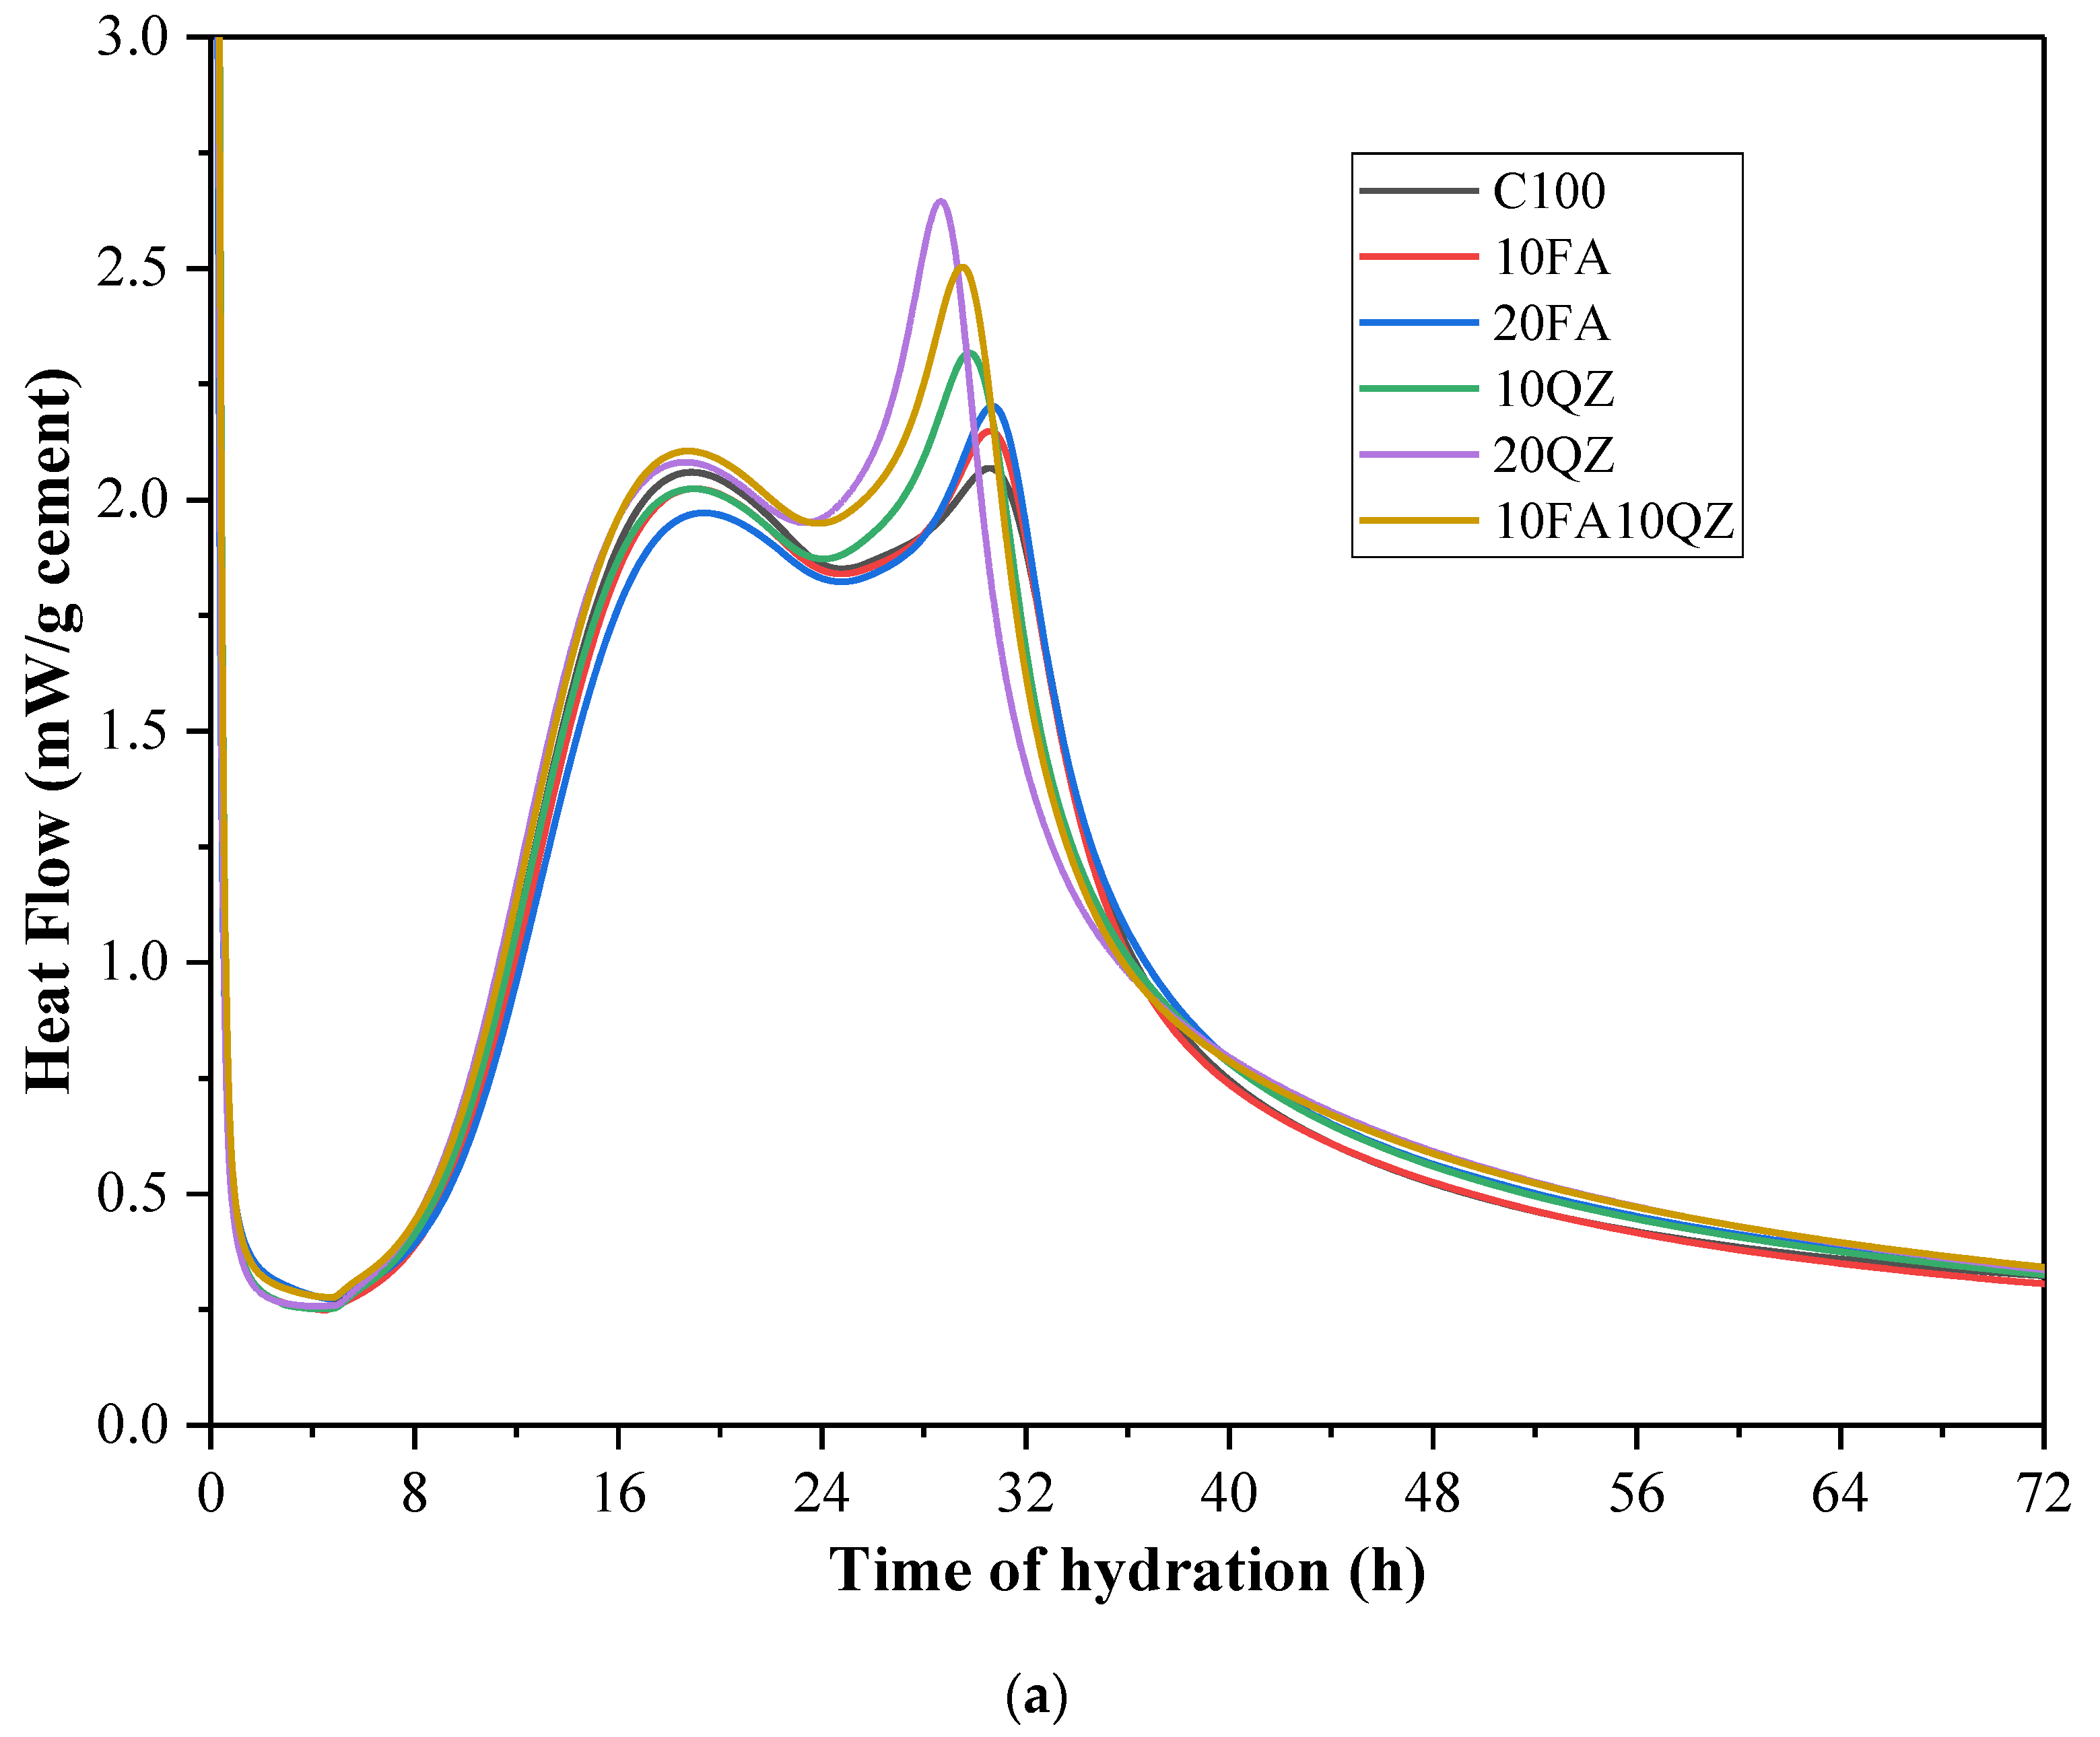
Figure 6a shows the heat flow curve of the hydration heat of the paste sample over 3 days. The exothermic curve exhibits two peaks in the acceleration stage: the first peak is attributed to the rapid dissolution and hydration of C3S [44], during which the reaction mainly produces C-S-H and CH. The second exothermic peak is attributed to the reaction of the C3A hydration products with gypsum to form ettringite (AFt) [44,45].
An analysis of Figure 6a shows that as more QZ is added, the time when the second heat flow peak appears gradually advances [30,46,47]. This is because the physical effects of QZ (nucleation effect and dilution effect) accelerate cement hydration [34]. In this experiment, QZ particles smaller than 1 μm are present. It is possible that QZ particles in the range of 0 to 1 μm act as nucleation sites to accelerate hydration. Some scholars believe that nucleation is more evident in finer QZ [40,48].
Figure 6b shows the experimental results of the cumulative hydration heat, revealing that as the QZ and FA content increases, the cumulative hydration heat decreases. This is primarily due to the reduction in cement content. Additionally, the low reactivity of SCMs reduces the cumulative hydration heat. Figure 6b also shows that when the amount of the mixture is the same, the cumulative hydration heat for 3 days of the sample with QZ addition is significantly higher than that of the sample with FA addition. This is because QZ accelerates the hydration reaction of cement through a more substantial physical effect, thereby generating more heat. The 3-day cumulative hydration heat of the 10FA10QZ group was almost the same as that of the 20QZ group. This indicates that the accelerating effect of QZ is limited and will not continue to increase with the increase in QZ content.
During the cement’s dissolution and hydration reaction, heat is released, and the hydration products produced are the main reason for the increase in compressive strength [44]. Figure 6c shows the experimental results of compressive strength and cumulative hydration heat of mortar after 1 day and 3 days. The results show that the compressive strength and the cumulative hydration heat have an excellent linear relationship, with R2 = 0.988. It should be noted that this linear relationship is based on the fitting of experimental data and primarily applies to early-age strength development (1 to 3 days). This is similar to the results obtained by other researchers [44].
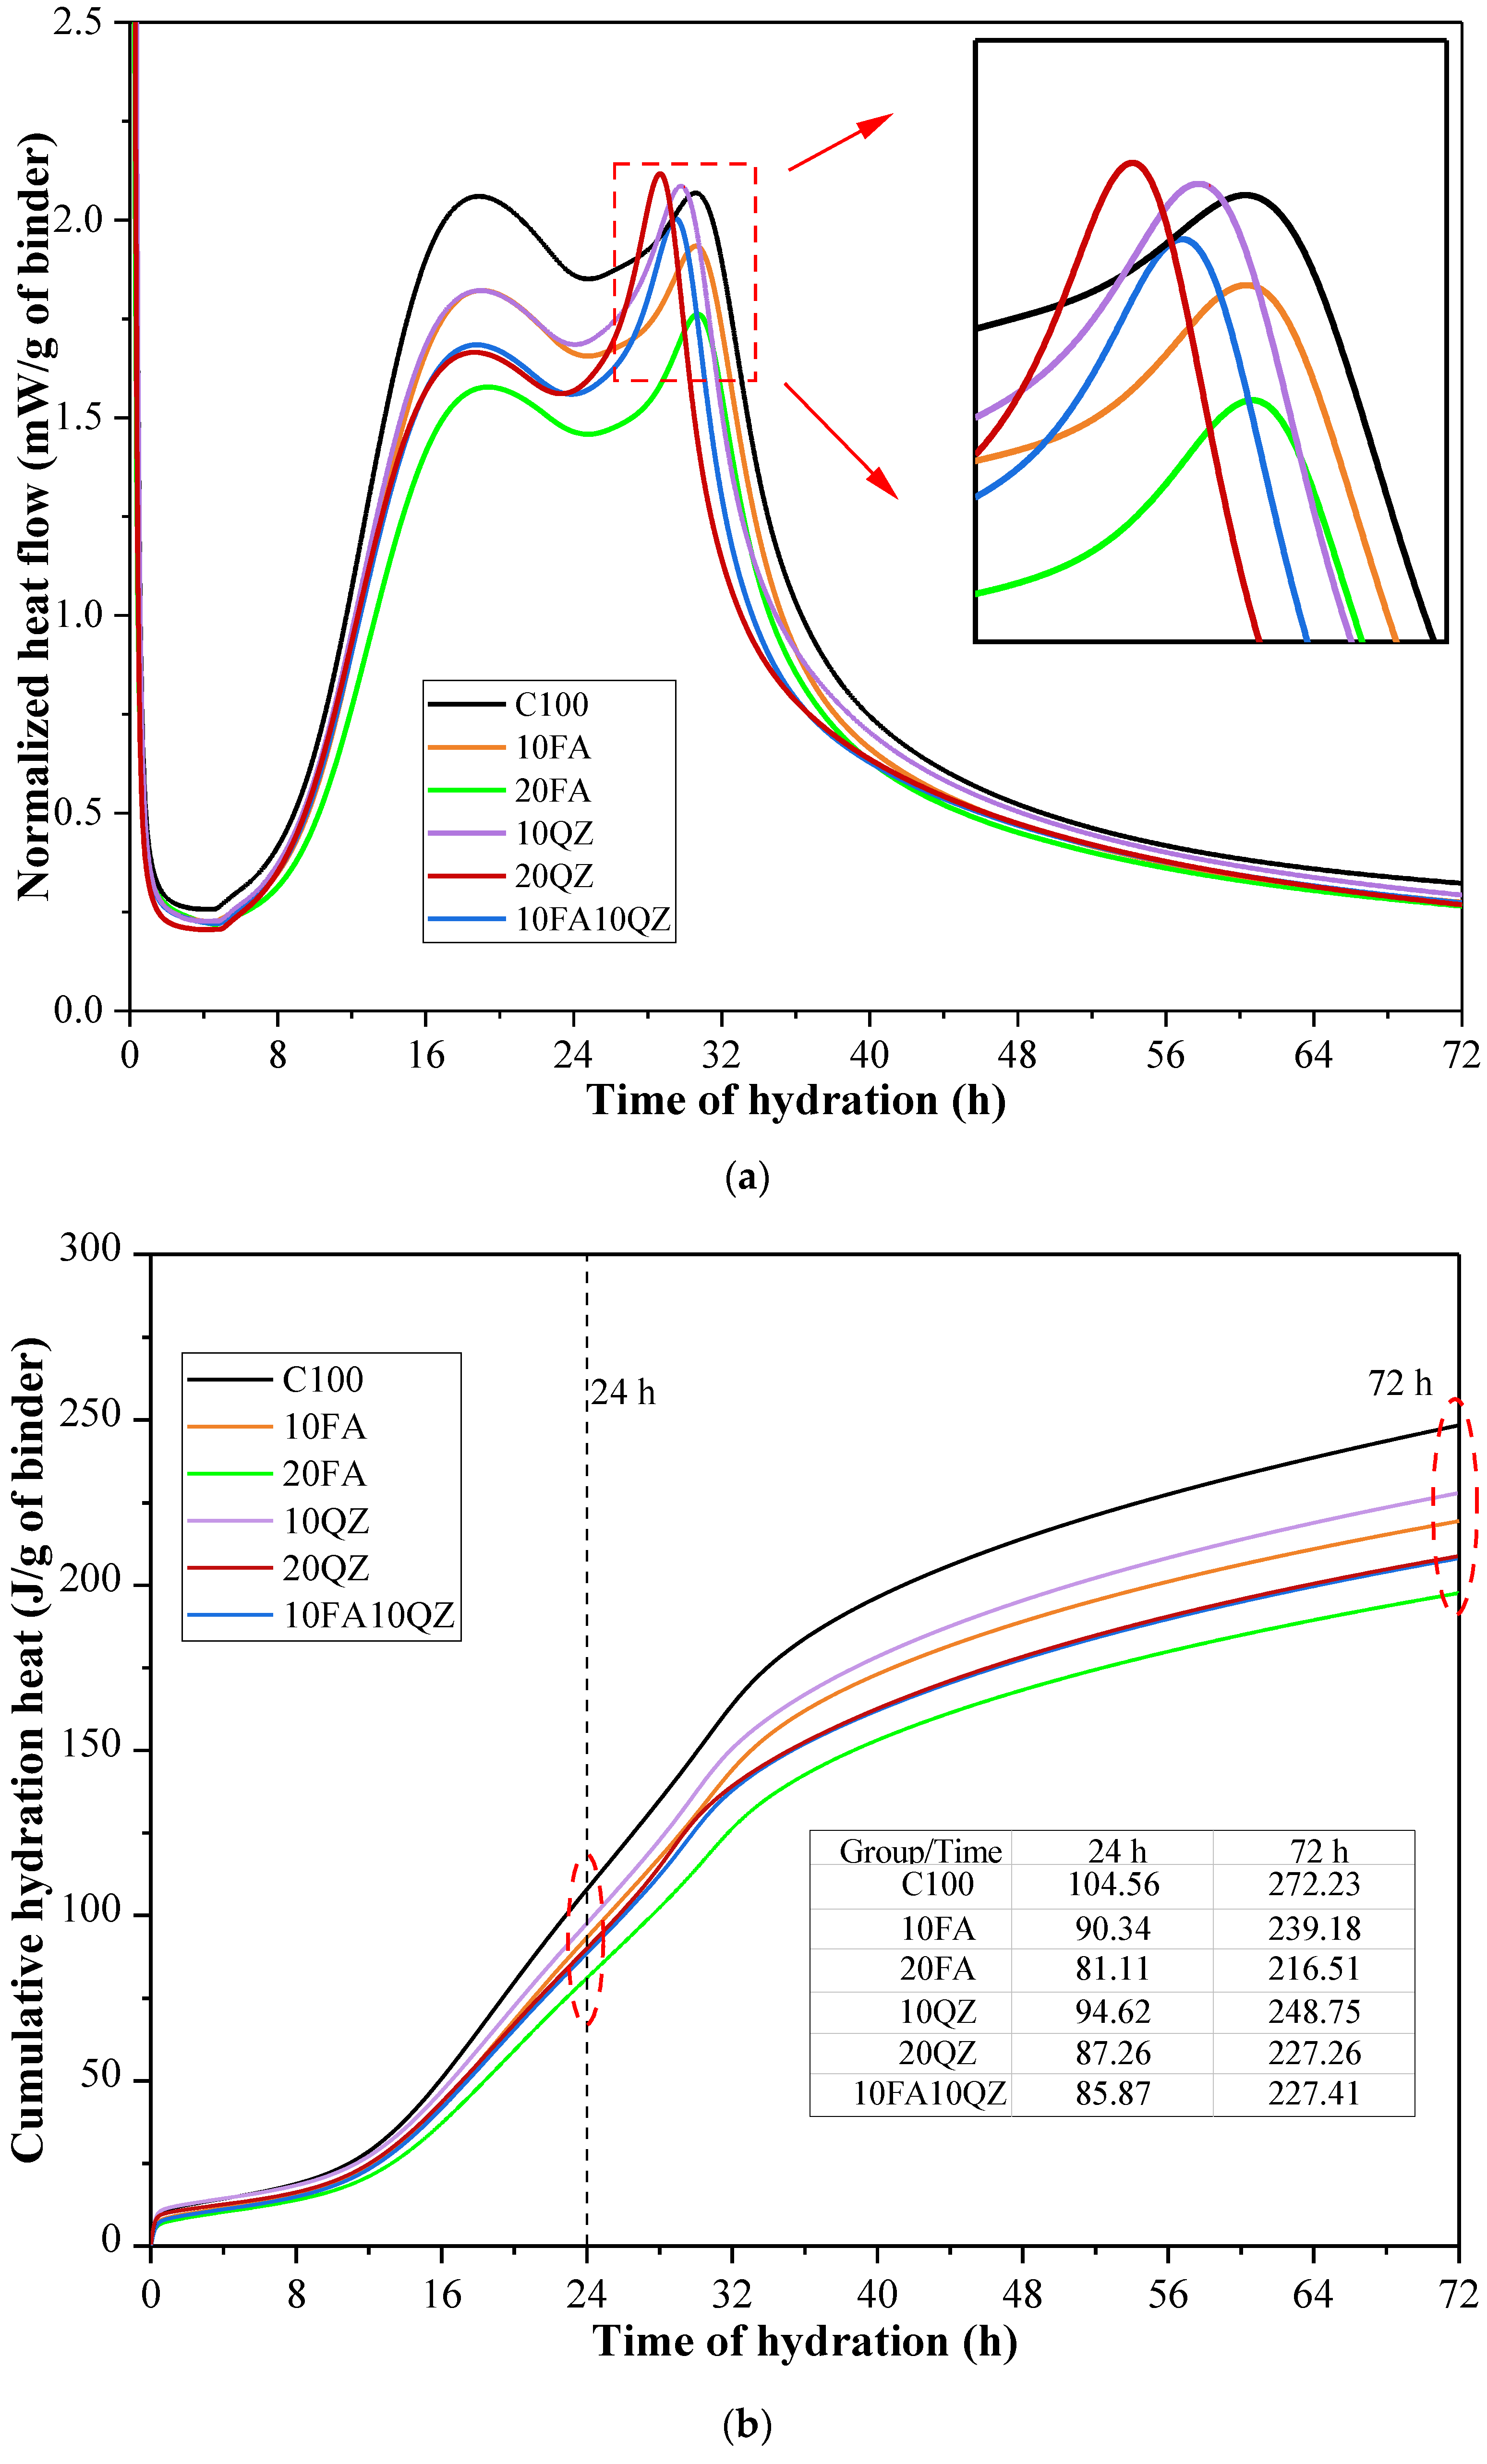
Figure 7a,b show the heat flow and cumulative hydration heat curves after normalizing cement mass fraction, respectively. Among these results, the cement mass fraction of sample C100 is 100%; the cement mass fraction of samples 10FA and 10QZ is 90%; and the cement mass fraction of samples 20FA, 20QZ, and 10FA10QZ is 80%. By studying Figure 7a, it can be observed that the C3A hydration heat peak of the sample with QZ added is higher than that of the control. According to previous studies, QZ hardly undergoes chemical reactions [22]. Therefore, this can be attributed to the nucleation and filling effects of QZ, which enhance the hydration reaction of cement. Specifically, QZ particles act as nucleation sites, promoting the formation of AFt. The reaction equation is shown in Equation (3):
[ A l ( O H ) 4 ] + 3 ( S O 4 ) 2 + 6 ( C a ) 2 + a q . C 6 A S 3 H 32
The AFt generated by the reaction can stick to the tiny QZ particles, thus accelerating its formation. Additionally, from the FTIR experimental results of the 1-day sample in Section 3.7, the group with added QZ showed stronger Al-OH absorption peaks at 1 day, indicating more AFt formation.
Figure 8a,b show the sample’s peak value of hydration heat flow and the corresponding peak data, respectively. The figures show that after part of the cement is replaced by FA, the arrival time of the first and the second peaks is delayed, and the peak intensity is reduced. This may be because FA reduces the hydration rate [34]. Unlike FA, when QZ replaces part of cement, it mainly affects the second peak, making the peak appear earlier and the peak intensity higher. This may be because QZ can enhance the hydration reaction of cement through the nucleation effect.

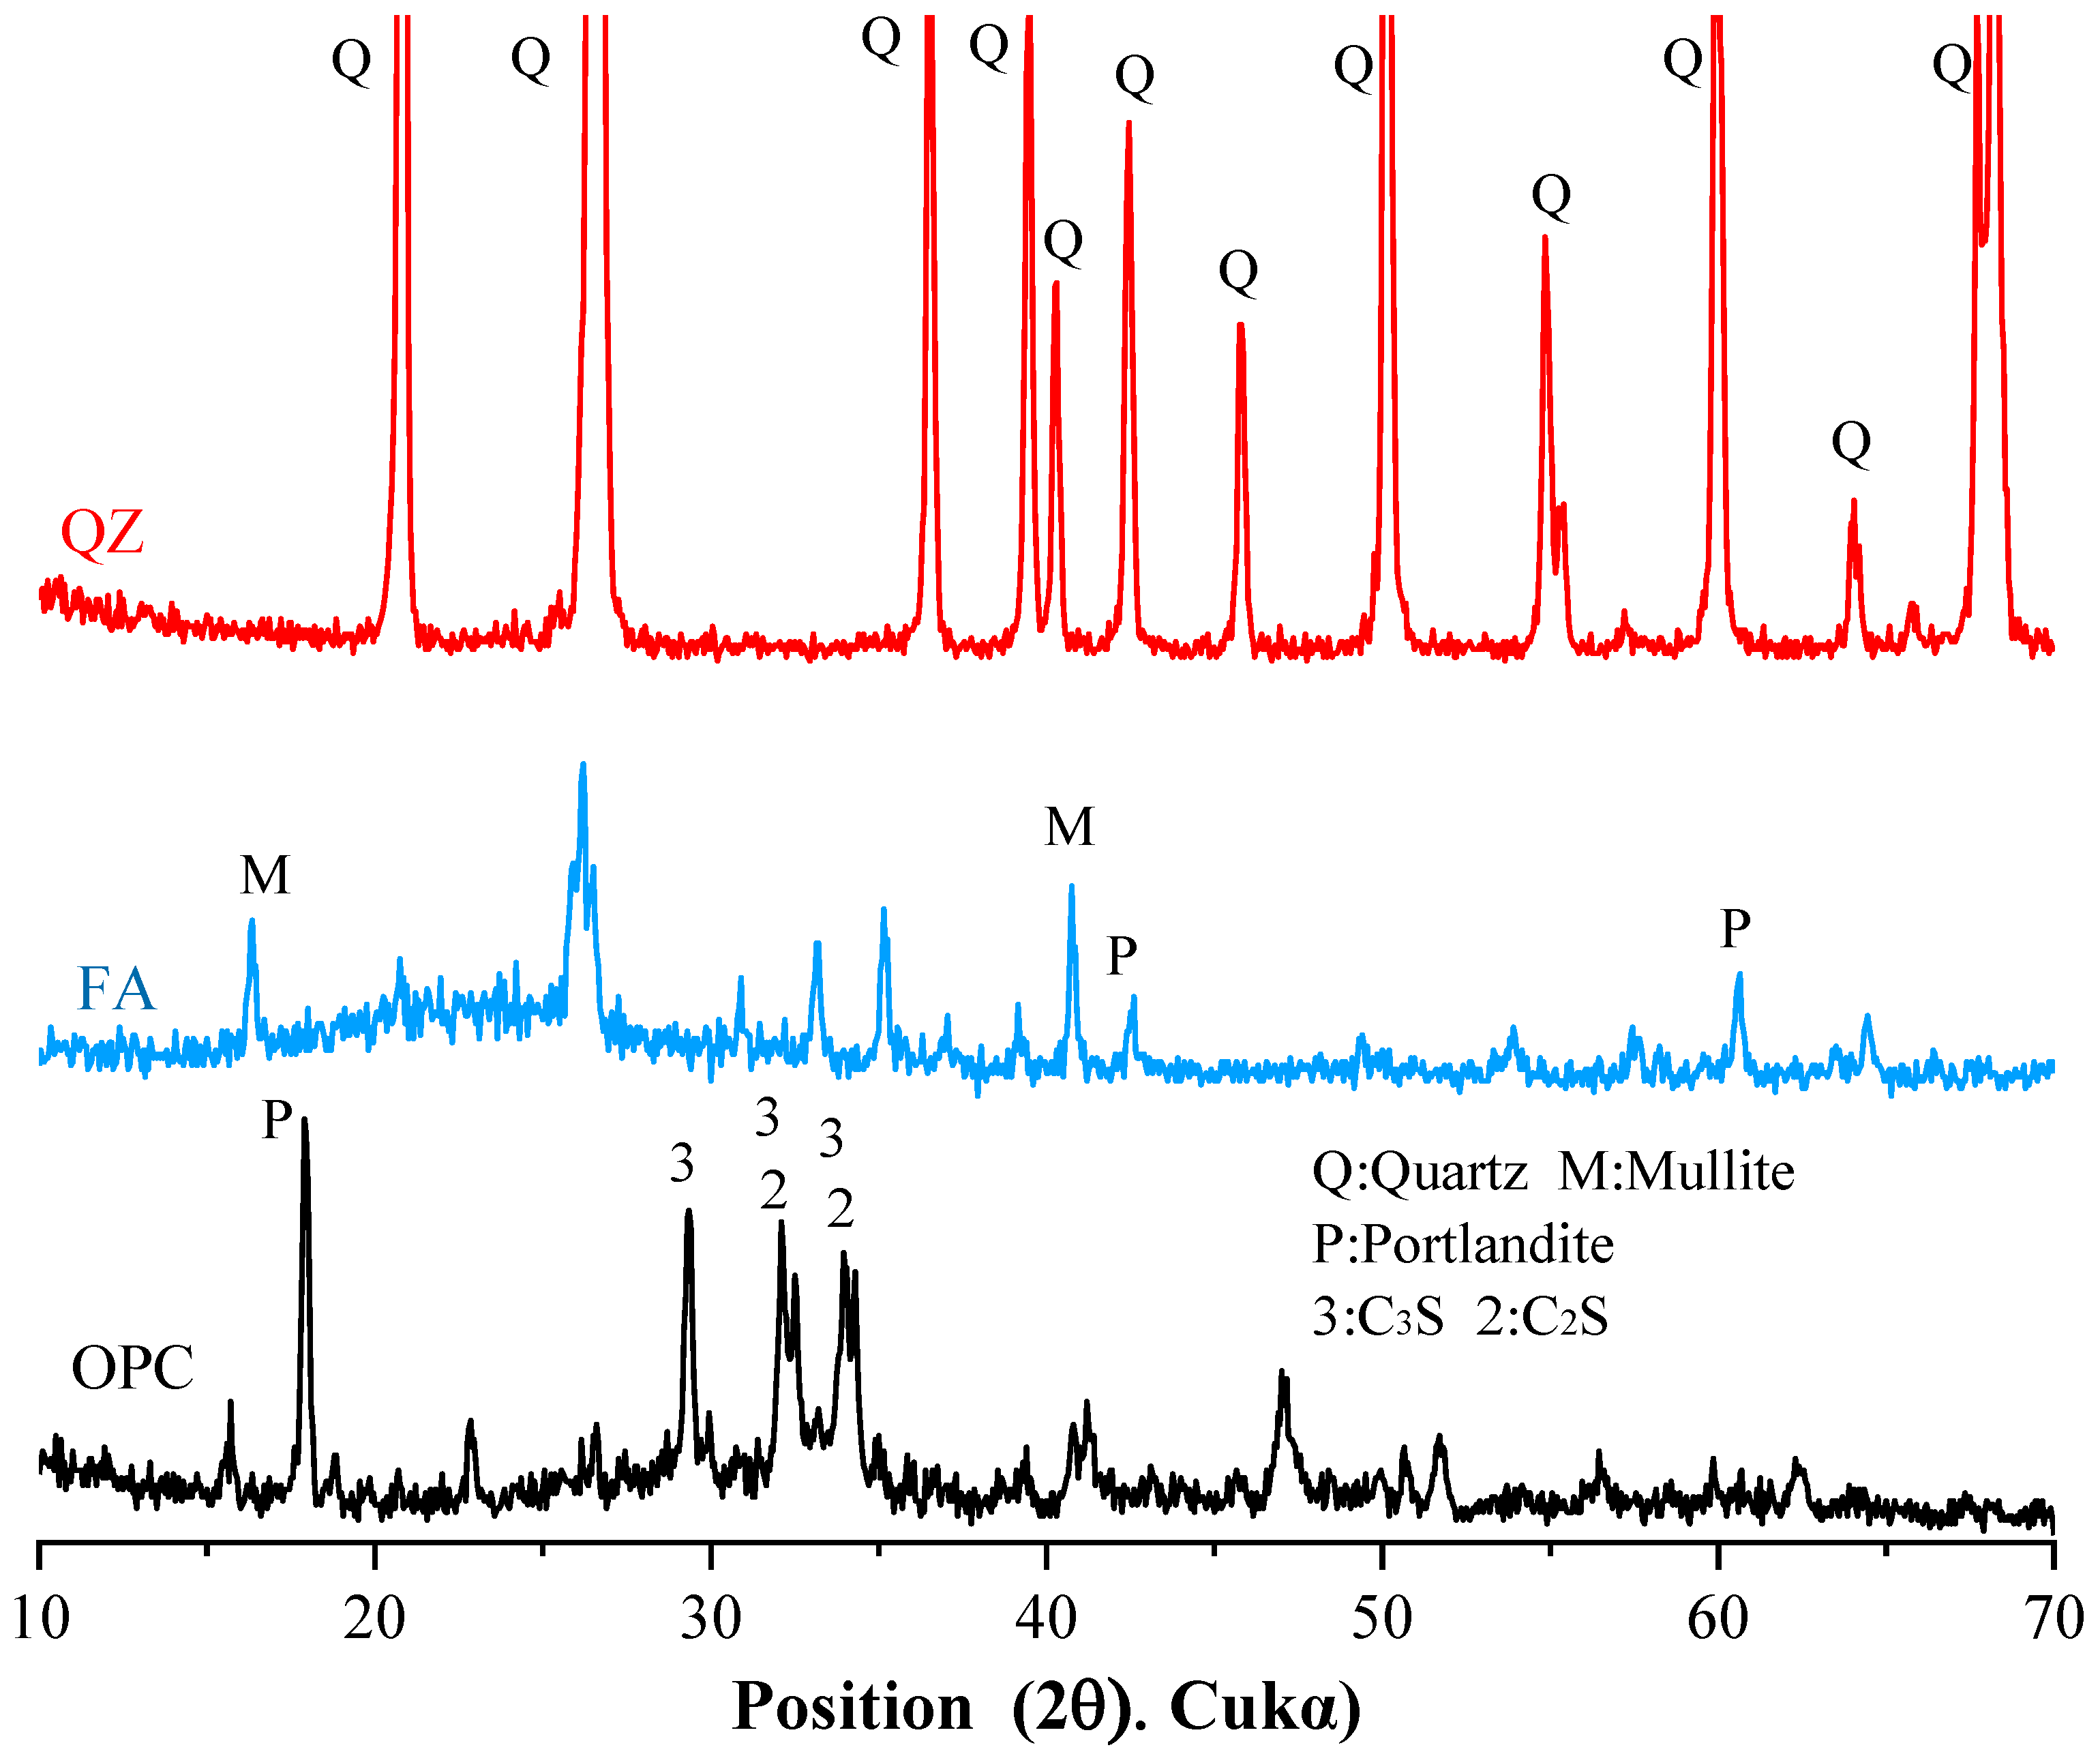
3.4. X-Ray Diffraction Analysis

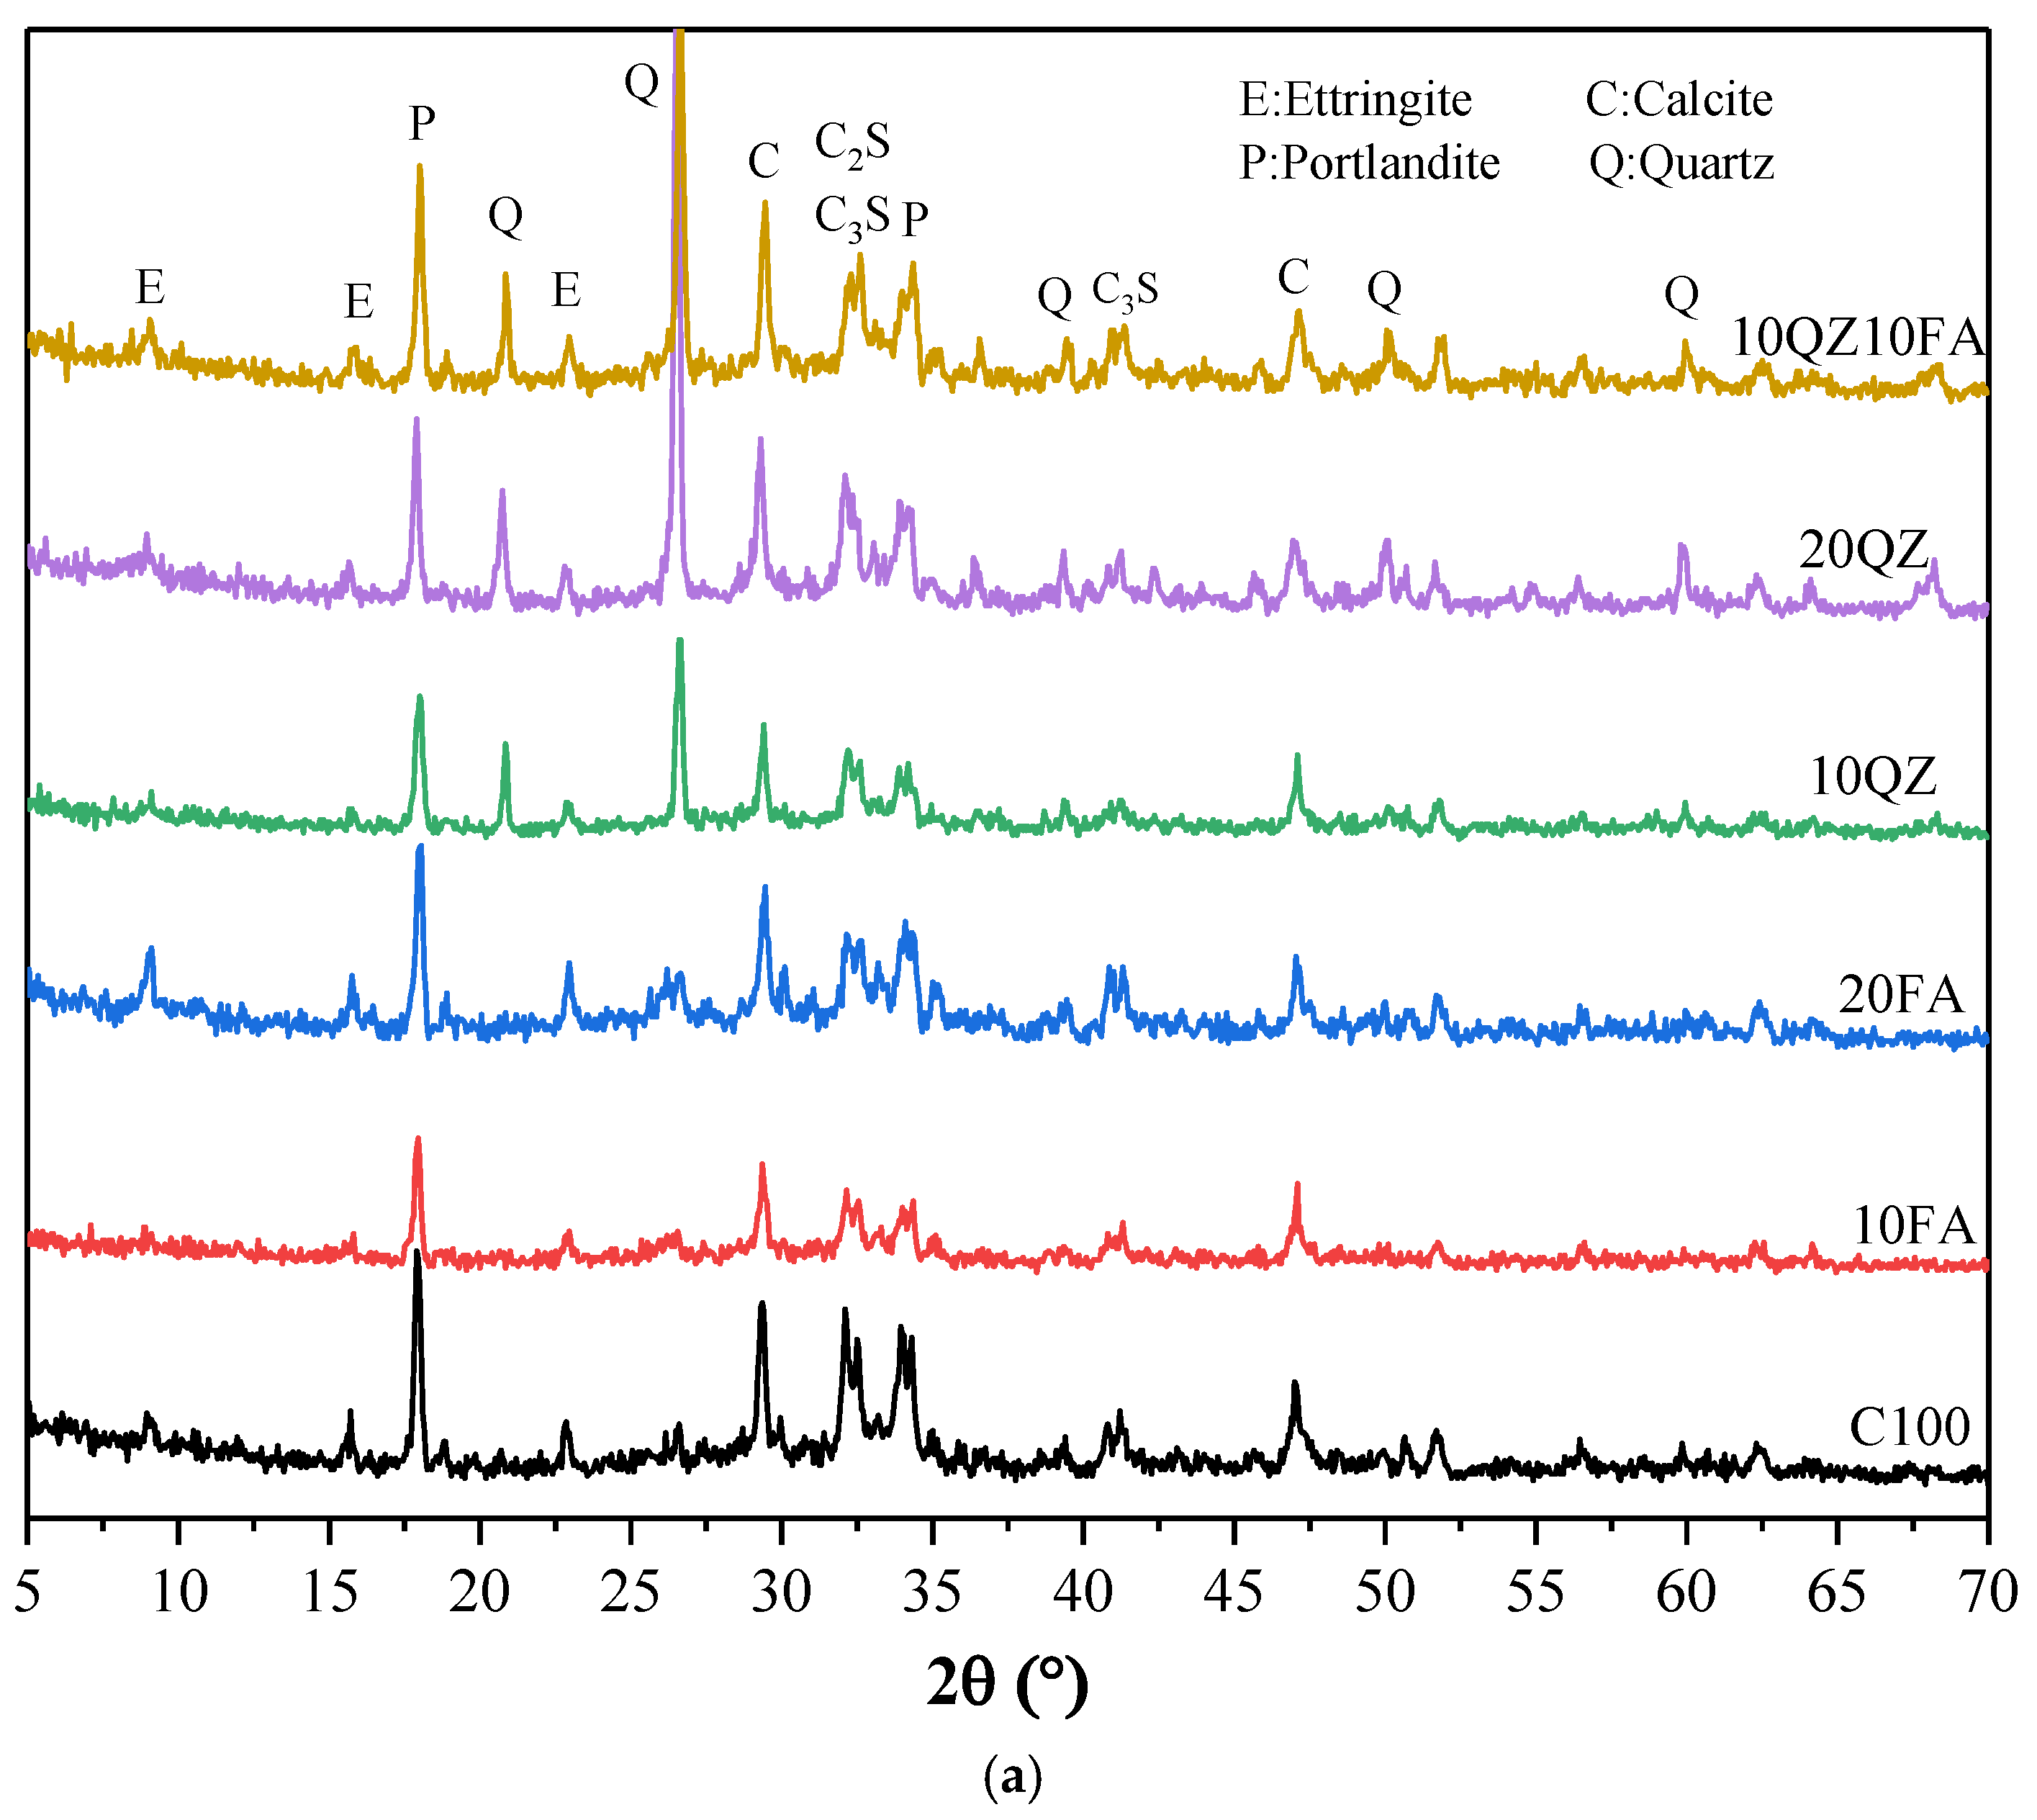
Figure 9a shows the XRD test results of all samples on Day 1. The figure indicates that the main products of the cement’s hydration reaction are AFt, Portlandite, and Monocarboaluminate. Additionally, calcium carbonate was detected from the limestone in the cement used.
Figure 9a shows that the quartz peak is pronounced with the addition of the QZ component. By comparing the XRD spectrum of the raw material QZ, it can be determined that these quartz peaks originate from QZ. In addition, the figures show the peaks of C3S and C2S. This is because the hydration reaction is still incomplete, and the mixture still contains unreacted C3S and C2S. A comparison of XRD patterns of the various samples in the figure shows that except for the quartz peak of the added QZ component, which is apparent, the types of other reaction products are similar. This indicates that the addition of FA and QZ only changes the content of hydration products but does not change the type of hydration products.
Figure 9b shows the XRD test results of all samples after 28 days. Comparing Figure 9a,b shows that the peak value of AFt decreases from 1 day to 28 days because AFt is converted into a more stable AFm. In addition, the peak values of C3S and C2S decreased because after 28 days of hydration, the C3S and C2S in the reactants were consumed, and other hydration products were generated. The figure also shows that the intensity of the quartz peak has no noticeable change, which indicates that QZ is an inert material and has difficulty chemically reacting with cement components. Finally, as the curing time increased from 1 day to 28 days, the diffraction peak of monoaluminate was observed, while the peak intensity of calcium carbonate weakened, indicating that calcium carbonate was consumed. This is because the calcium carbonate in the mixture reacted with aluminate to form monoaluminate [49]; the reaction equation is shown in Equation (4):
C H + C C + H + A C 3 A · C C · H 12
where C H is portlandite, C C is calcium carbonate, H is water, and A is the aluminum phase in cement.

3.5. FTIR

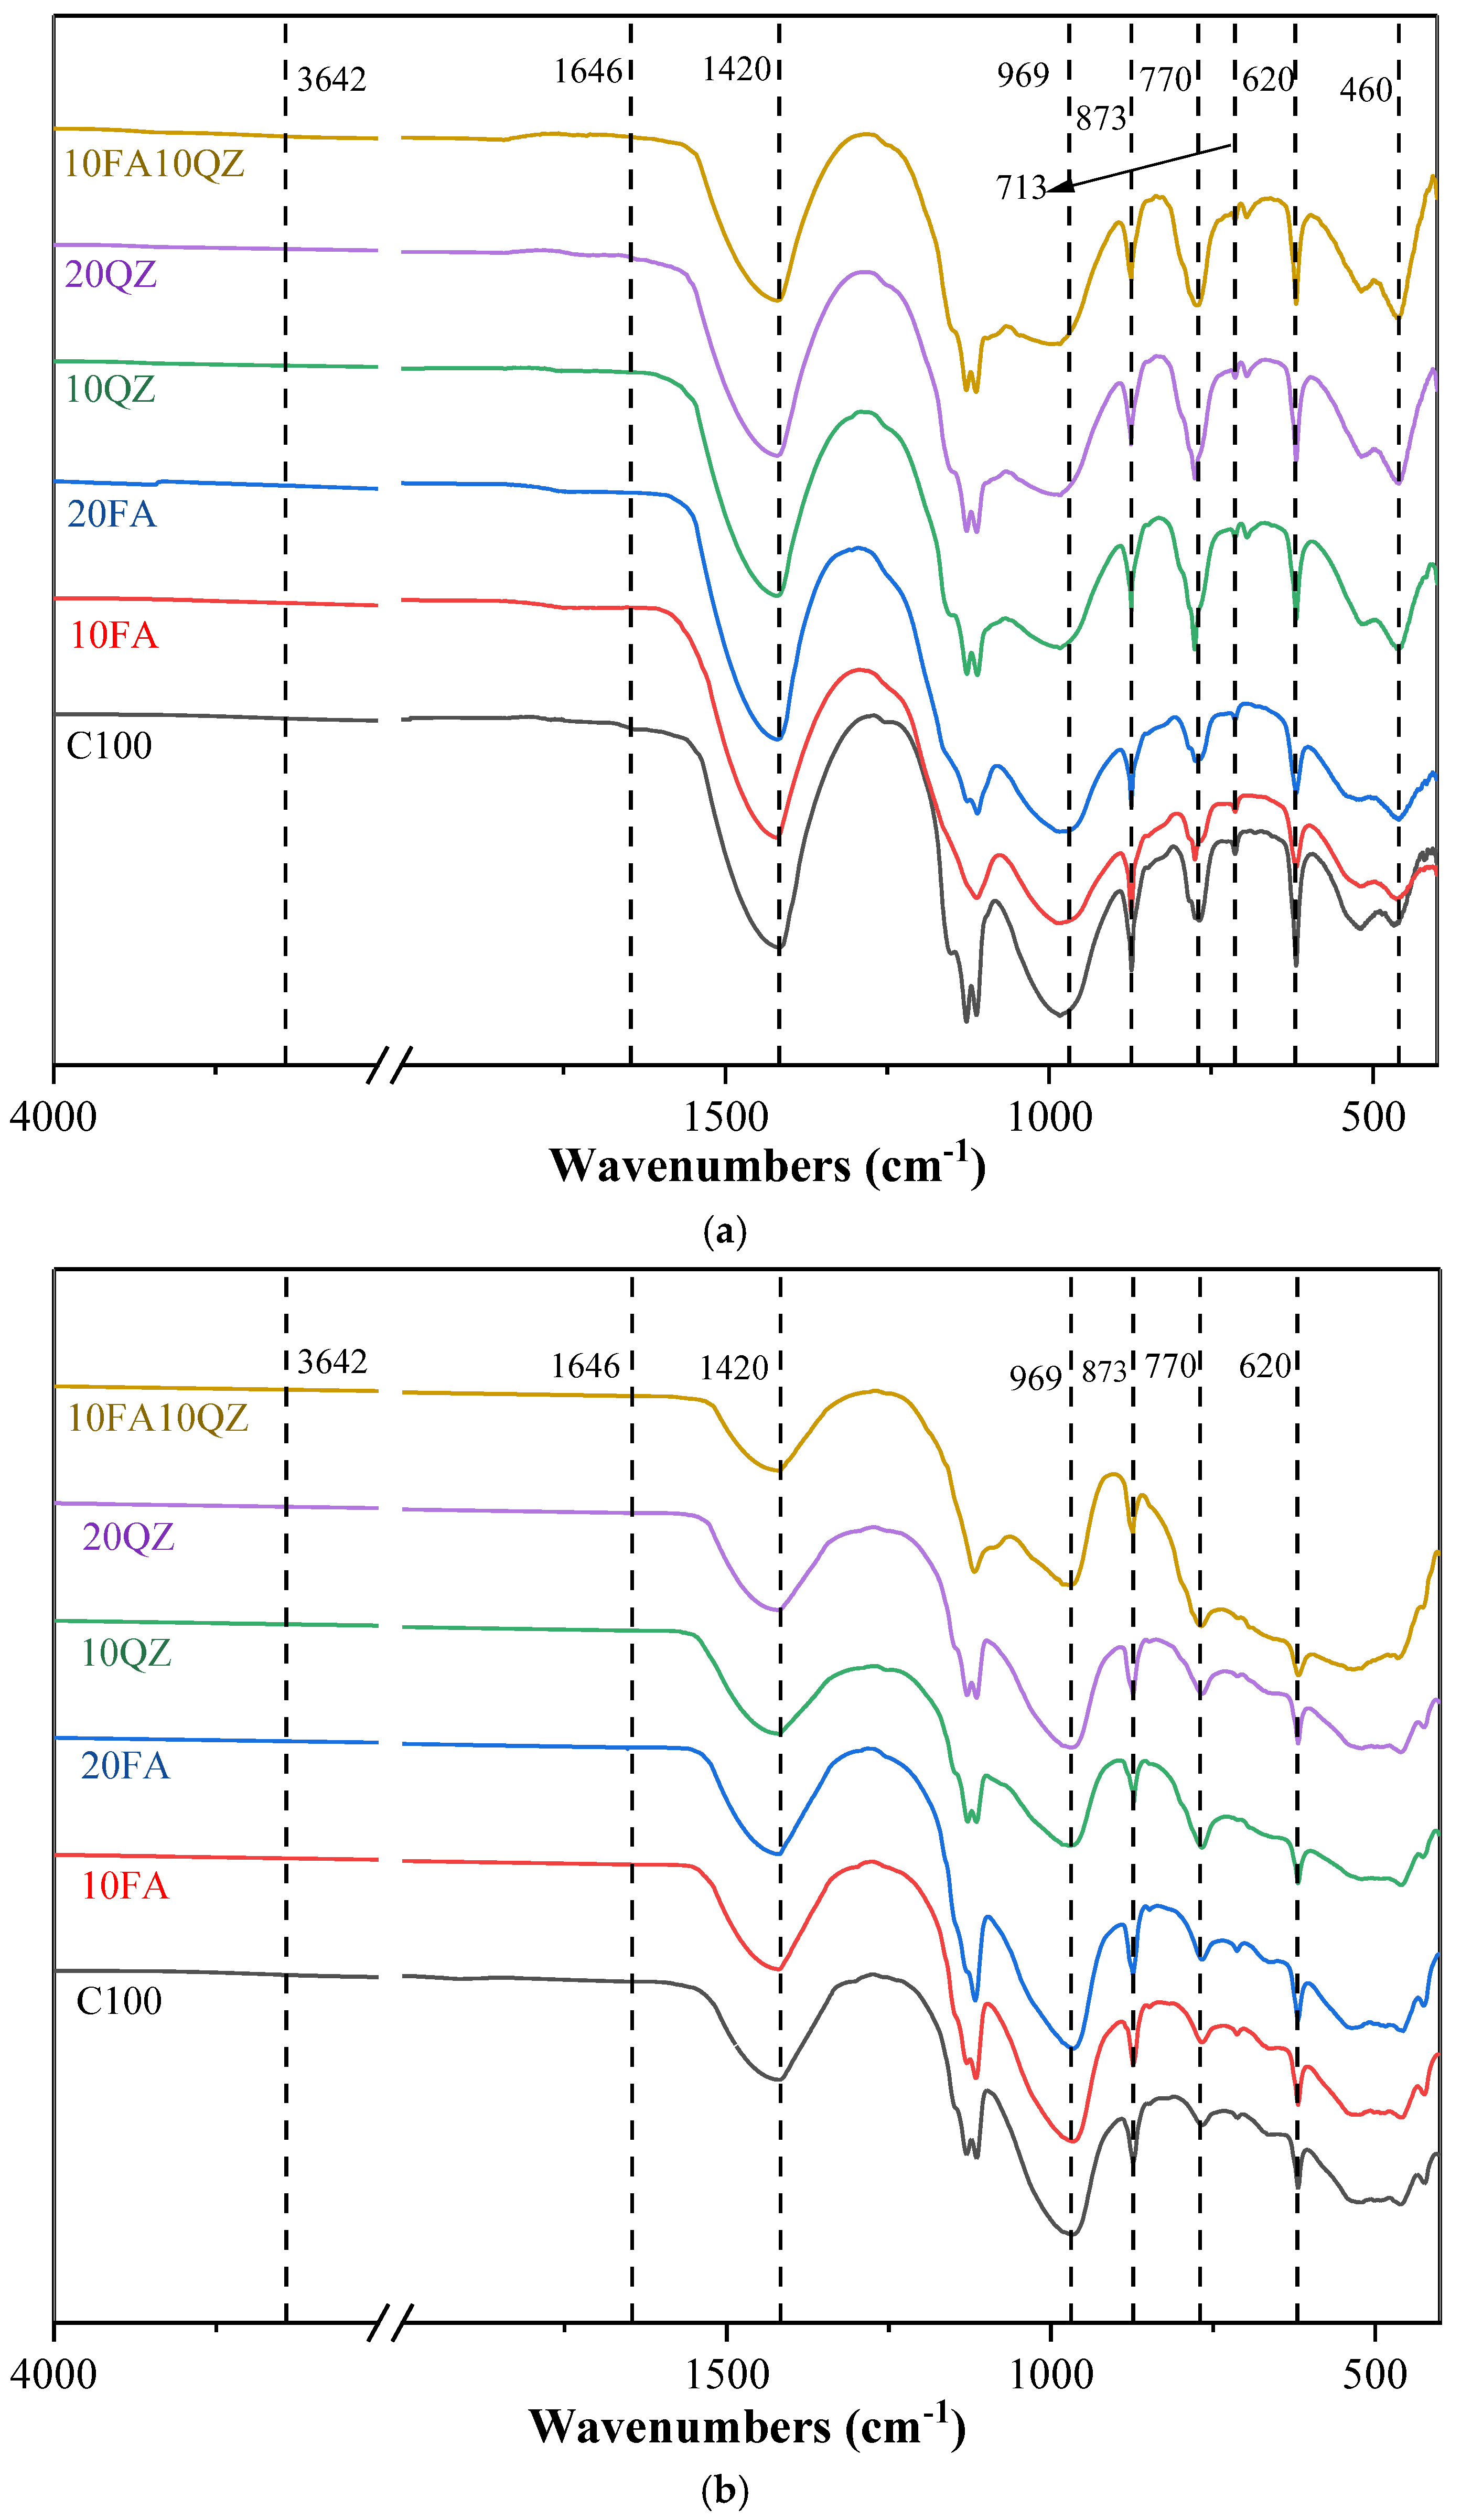
Figure 10a,b show the FTIR spectra of all cement paste samples at 1 day and 28 days of age, respectively. The absorption peaks around 3640 cm−1 and 1650 cm−1 in the high wavenumber region are caused by the asymmetric stretching vibration of the H-O bond in free water [50]. The absorption peak caused by the asymmetric stretching vibration of the C-O bond (CO32−) is observed around 1420 cm−1. The absorption peaks at 873 and 713 cm−1 are attributed to the bending vibration of CO32− [51]. The absorption peak in the wavenumber range of 997–937 cm−1 corresponds to the stretching vibration of the Si-O chemical bond in C-S-H [52]. The absorption peak at around 770 cm−1 corresponds to the bending vibration of the Al-OH chemical bond [53]. The absorption peaks around 620 cm−1 and 470 cm−1 correspond to the Si-O asymmetric stretching vibration of QZ [52]. The absorption peak at around 420 cm−1 corresponds to the asymmetric stretching vibration of the Ca-O chemical bond [52].
Study Figure 10a found that as the QZ and FA content increased, the intensity of the C-O absorption peak decreased. This is because the absorption peak of C-O in the sample mainly originates from the limestone added to the cement, while QZ and FA do not contain limestone. Additionally, by comparing Figure 10a,b, it is observed that the intensity of the C-O bond absorption peak decreases significantly as the curing time increases from 1 day to 28 days. This is attributed to the reaction of calcium carbonate in the cement mixture with aluminate, which consumes calcium carbonate. This trend is similar to that observed in the XRD pattern.
For samples with a curing time of 1 day, the intensity of the Si-O bond absorption peak in C-S-H at 969 cm−1 decreases with the increase in QZ and FA substitution. This is because the cement is replaced by QZ and FA, which reduces the content of early hydration products and decreases the absorption peak intensity of the Si-O chemical bond in hydrated calcium silicate. As the curing age increases from 1 day to 28 days, the intensity of the asymmetric stretching vibration peak of Si-O in the FA group rises, indicating that as the secondary hydration of FA proceeds, additional hydration products such as C-S-H are produced. Moreover, the bending vibration of the Al-OH chemical bond was observed at around 770 cm−1. When the hydration process lasted for 1 day, the crystalline hydration products of C3A in the sample reacted with gypsum to generate AFt; hence, a large amount of Al-OH chemical bonds was detected. The peak intensity of the group with QZ added here is more significant. This is because QZ can provide additional nucleation points for AFt, promoting the generation of AFt. This is also reflected in the hydration heat flow curve. As the QZ content increases, the exothermic peak of AFt generation also increases.

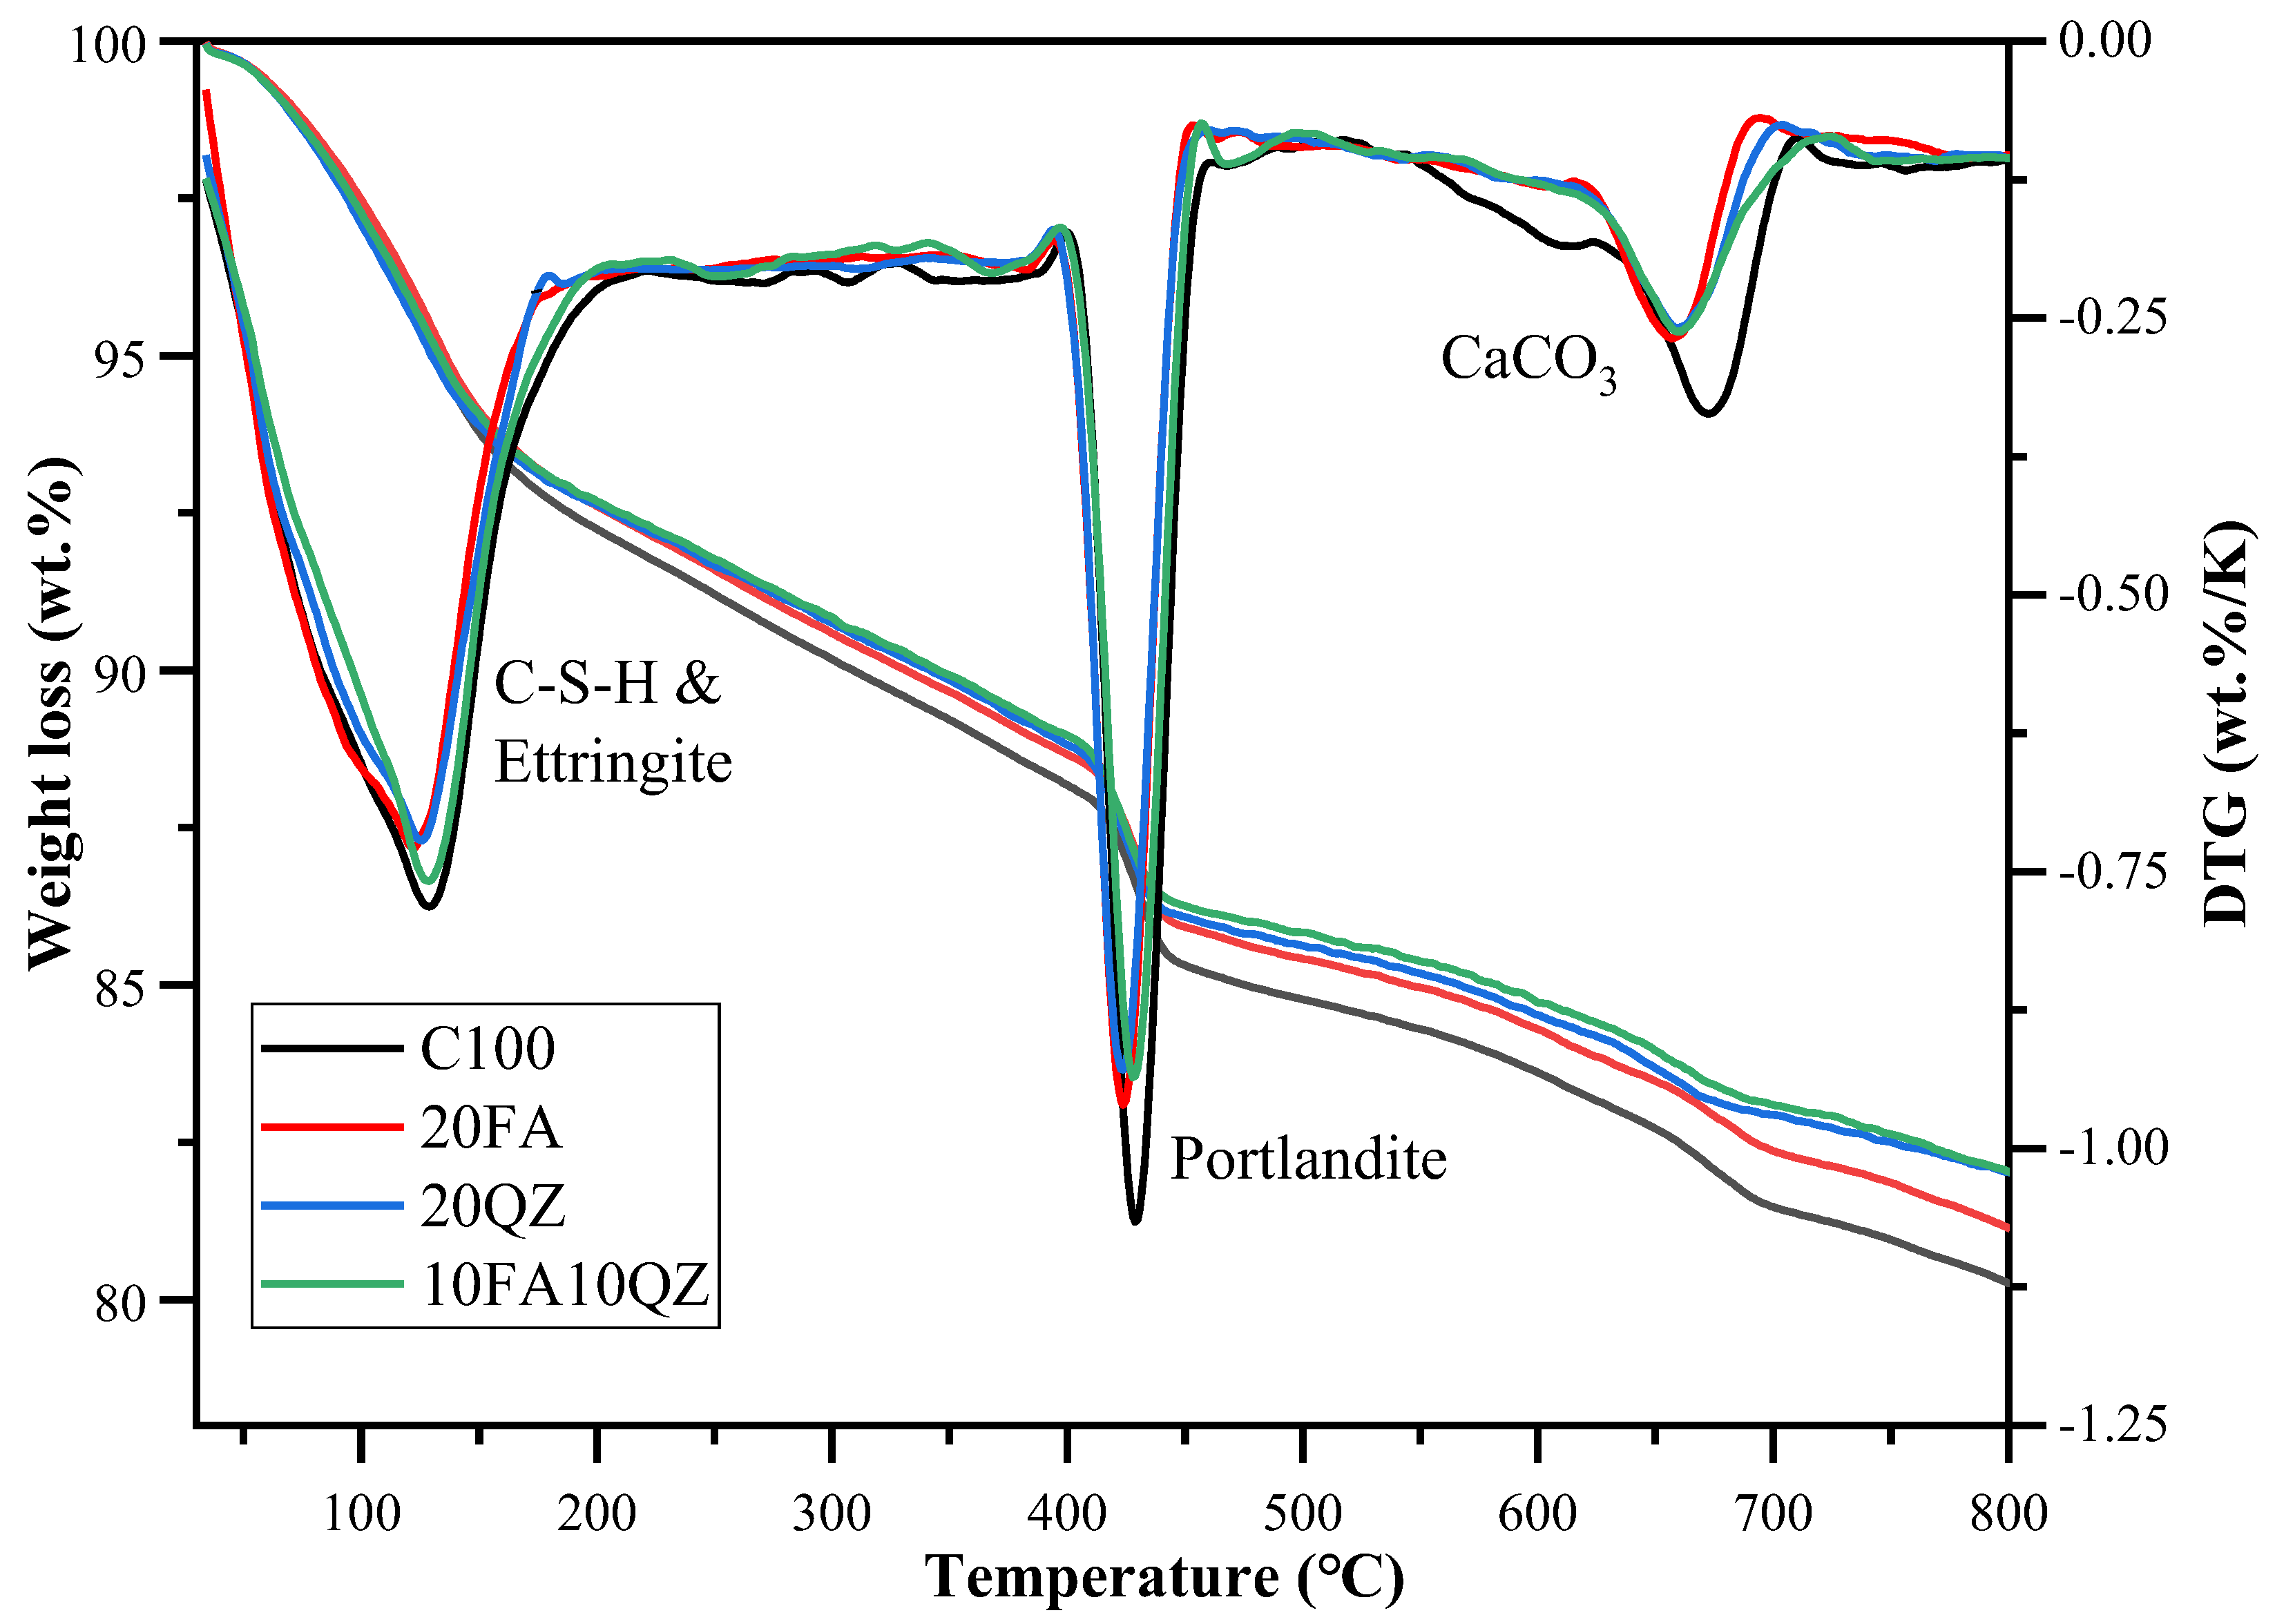
3.6. Thermogravimetric

Figure 11 shows the TG and DTG curves of the paste samples of C100, 20FA, 20QZ, and 10FA10QZ at 28 days. The mass loss of these samples mainly occurred at three temperature stages: 1. The low-temperature peak (120–300 °C) is due to the dehydration of C-S-H and AFt. 2. The medium-temperature peak (400–500 °C) is related to the decomposition of CH. 3. The high-temperature peak (500–800 °C) is related to the decomposition of calcium carbonate [44]. The percentage of chemically bound water and CH was calculated based on the weight loss data.
In the first stage, the mass loss is caused by the dehydration of C-S-H and AFt in the sample. When QZ is used to replace cement, the intensity of the dehydration peak decreases, mainly due to the reduction in OPC content and hydration products. It was further found that when FA is used to replace cement, the decomposition mass increases at this temperature, indicating that the secondary hydration reaction of FA produces additional hydration products.
In the second stage, mass loss is caused by CH decomposition. The content of CH in the paste was determined using Weerdt [54] and the formula in Equation (5):
C H = W 400 W 500 W 550 × 74 18 × 100 %
where W 400 , W 500 , and W 550 are the sample masses at 400, 500, and 550 °C, respectively. Table 3 shows the calculated mass percentage of CH in the paste samples at 28 days. According to the results, as SCMs are added, the mass fraction of CH gradually decreases, which is also confirmed by the XRD experiment. This is because the hydration product of C3S and C2S in OPC is CH, and the content of C3S and C2S decreases after OPC is replaced. In addition, CH and FA will undergo a secondary hydration reaction, which will also consume a portion of CH, thus reducing the CH content in the 20FA and 10FA10QZ groups.
The third stage is the mass loss peak caused by the decomposition of calcium carbonate. The decomposition peak appearing here mainly originates from the limestone in the cement. The decomposition peak of calcium carbonate decreased significantly with the use of the two SCMs. This is because FA and QZ do not contain calcium carbonate, so the decomposition peak of calcium carbonate decreases as OPC is replaced.
Weerdt [54] calculated the chemically bound water content in the paste samples using the method of Equation (6):
W t = W 40 W 550 W 550 × 100 %
W 40 and W 550 represent the mass measured by TGA at 40 and 550 °C, and W t is the calculated chemically bound water content. The calculation results are shown in Table 6. The bound water content is high to low in the order of C100, 20FA group, 10FA10QZ group, and 20QZ group. This is because the amount of OPC used in the experimental groups is the same, and the final content of chemically bound water will depend on the reactivity and reaction products of FA and QZ. The reactivity of QZ is much lower than that of FA, and it can only react with CH in cement to produce a small amount of C-S-H [55]. For the FA group, because FA has pozzolanic activity, as the curing age increases, the number of secondary hydration products increases, and the final content of chemically bound water will also increase.
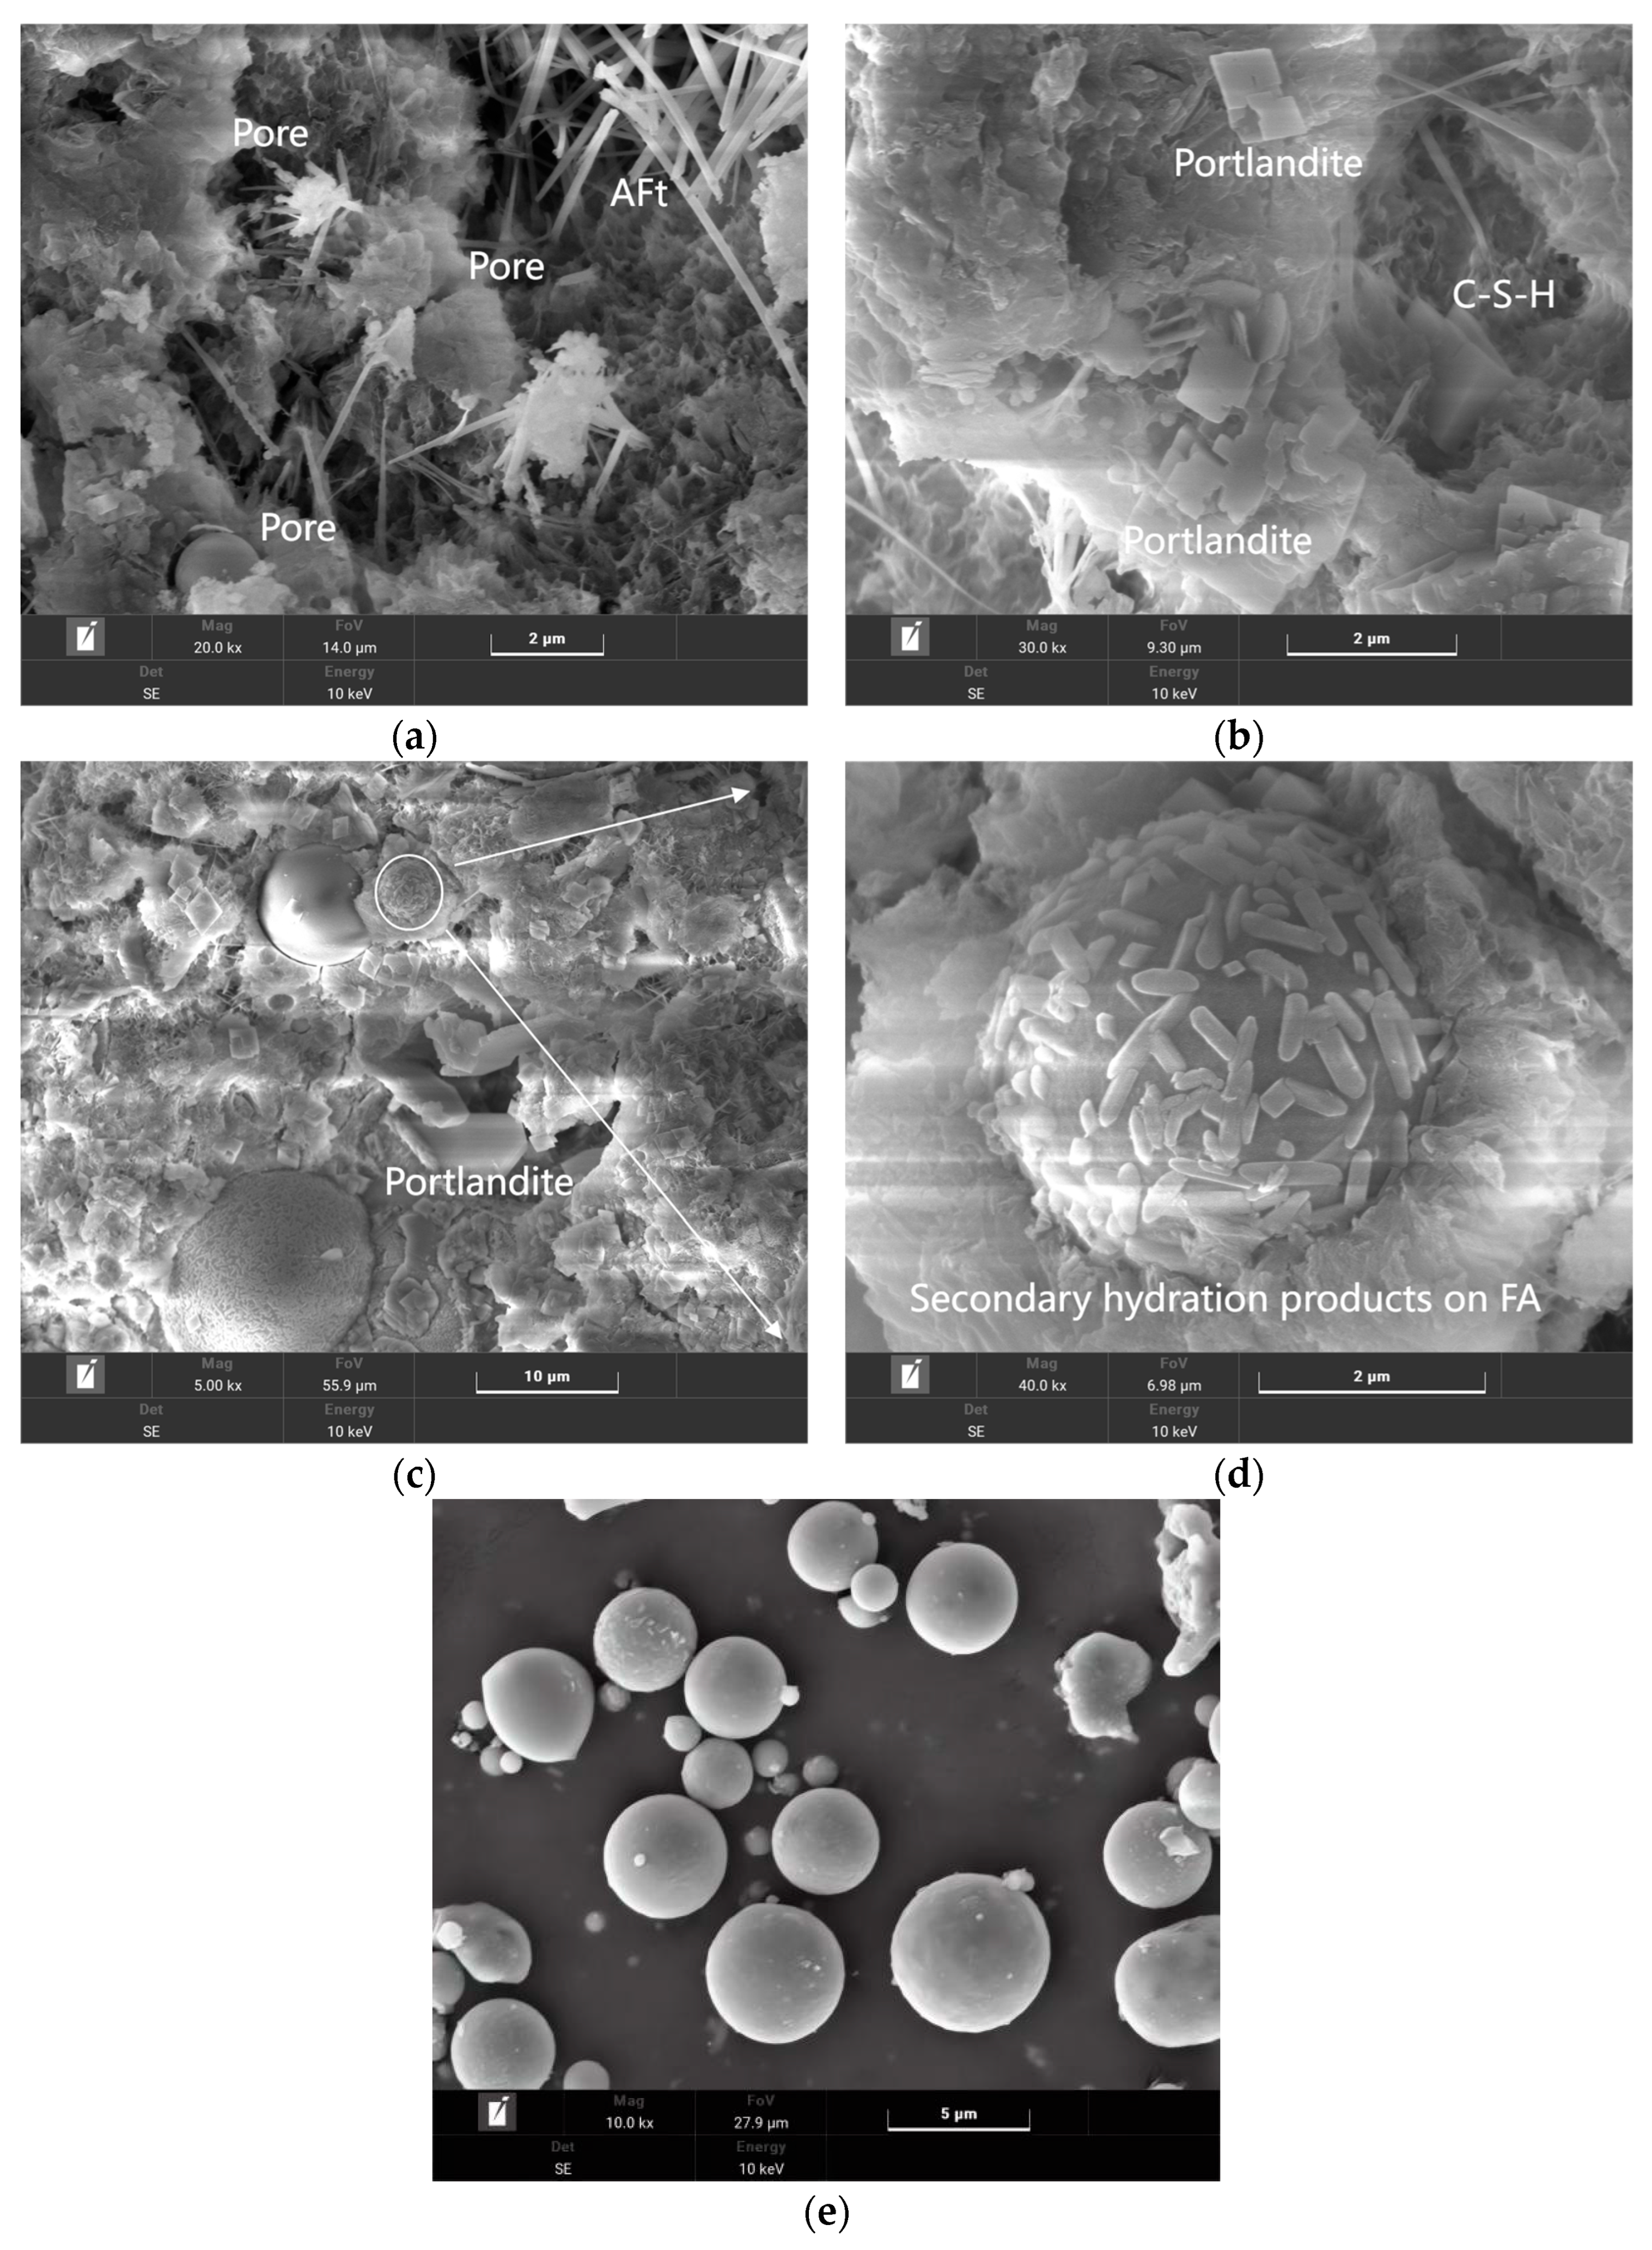
3.7. Microstructure

Figure 12 shows the SEM test results of the 28-day sample. In Figure 12a, common hydration products such as needle-shaped AFt, lamellar CH, and granular C-S-H can be observed. These hydration products fill the pores inside the cement, promoting the development of strength. Comparing Figure 12a,b, it is evident that the OPC group is denser than the QZ group. This is because in the late hydration stage, the hydration degree of QZ is low, and using QZ to replace cement will reduce the cement clinker, resulting in a decrease in hydration products, which makes the QZ group have more pores. This explains why the late-stage strength and UPV values of the QZ group are lower than those of the control group.
Figure 12c shows the group with FA content of 20% by weight of cement, and Figure 12e shows the original appearance of FA. The spherical shape of FA acts as a ball bearing in cement, which can increase the fluidity of mortar. It can also be observed that its surface is smooth, which may result in the hydration products not being easily attached. Figure 12d is a partially enlarged view of Figure 12c. As the curing age increases to 28 days, the secondary hydration reaction of FA proceeds, and hydration products precipitate on the surface of FA particles. This increases the amount of hydration products and roughens the FA surface, improving the interface between FA and cement matrix.

3.8. CO2 Emissions Calculation

CO2 is the main greenhouse gas that causes global warming, and reducing carbon emissions is one of the world’s most pressing issues today. Cement production results in significant CO2 emissions, and using SCMs can reduce CO2 emissions. Therefore, this study calculated and analyzed the CO2 emissions and energy consumption for producing one cubic meter of mortar. The calculation only considered the CO2 emissions under the mix ratio in this experiment, ignoring the CO2 emissions generated during transportation and mixing. Table 7 shows the material mass required to produce one cubic meter of experimental mortar, Table 8 shows the carbon footprint and energy consumption per unit mass of raw materials used in this experiment [6,23,56], and Table 9 shows the calculation results of carbon emissions and energy consumption. Equation (5) limits the total volume of each concrete component (OPC, FA, QZ, sand, water) to 1 m3 [57]:
i = 1 n m i ρ i = 1
where ρ i represents the raw material density, m i is the raw material unit volume density (kg/m3), n = 5, and i represents each component in the raw material mixture (OPC, FA, QZ, sand, water).
According to Equations (8) and (9):
C O 2 P = 1 n C O 2 m i
M J P = 1 n M J m i
The CO2 emissions and energy consumption per unit volume were calculated, where “CO2P” is the CO2 emissions per cubic meter of mortar and mi is the mass of each raw material per unit mass (tons) of mortar mix. “CO2” is the CO2 emission factor of the raw material (CO2kg/kg). “MJP” is the energy consumption of one cubic meter of mortar, and “MJ” is the energy release factor of the raw material (MJ/kg).
The results in Table 9 show that with the addition of SCMs, the CO2 emissions and energy consumption per unit volume of mortar have decreased significantly. The 20FA group had the most significant reduction in carbon emissions and energy consumption, 17.47% and 13.58%, respectively.
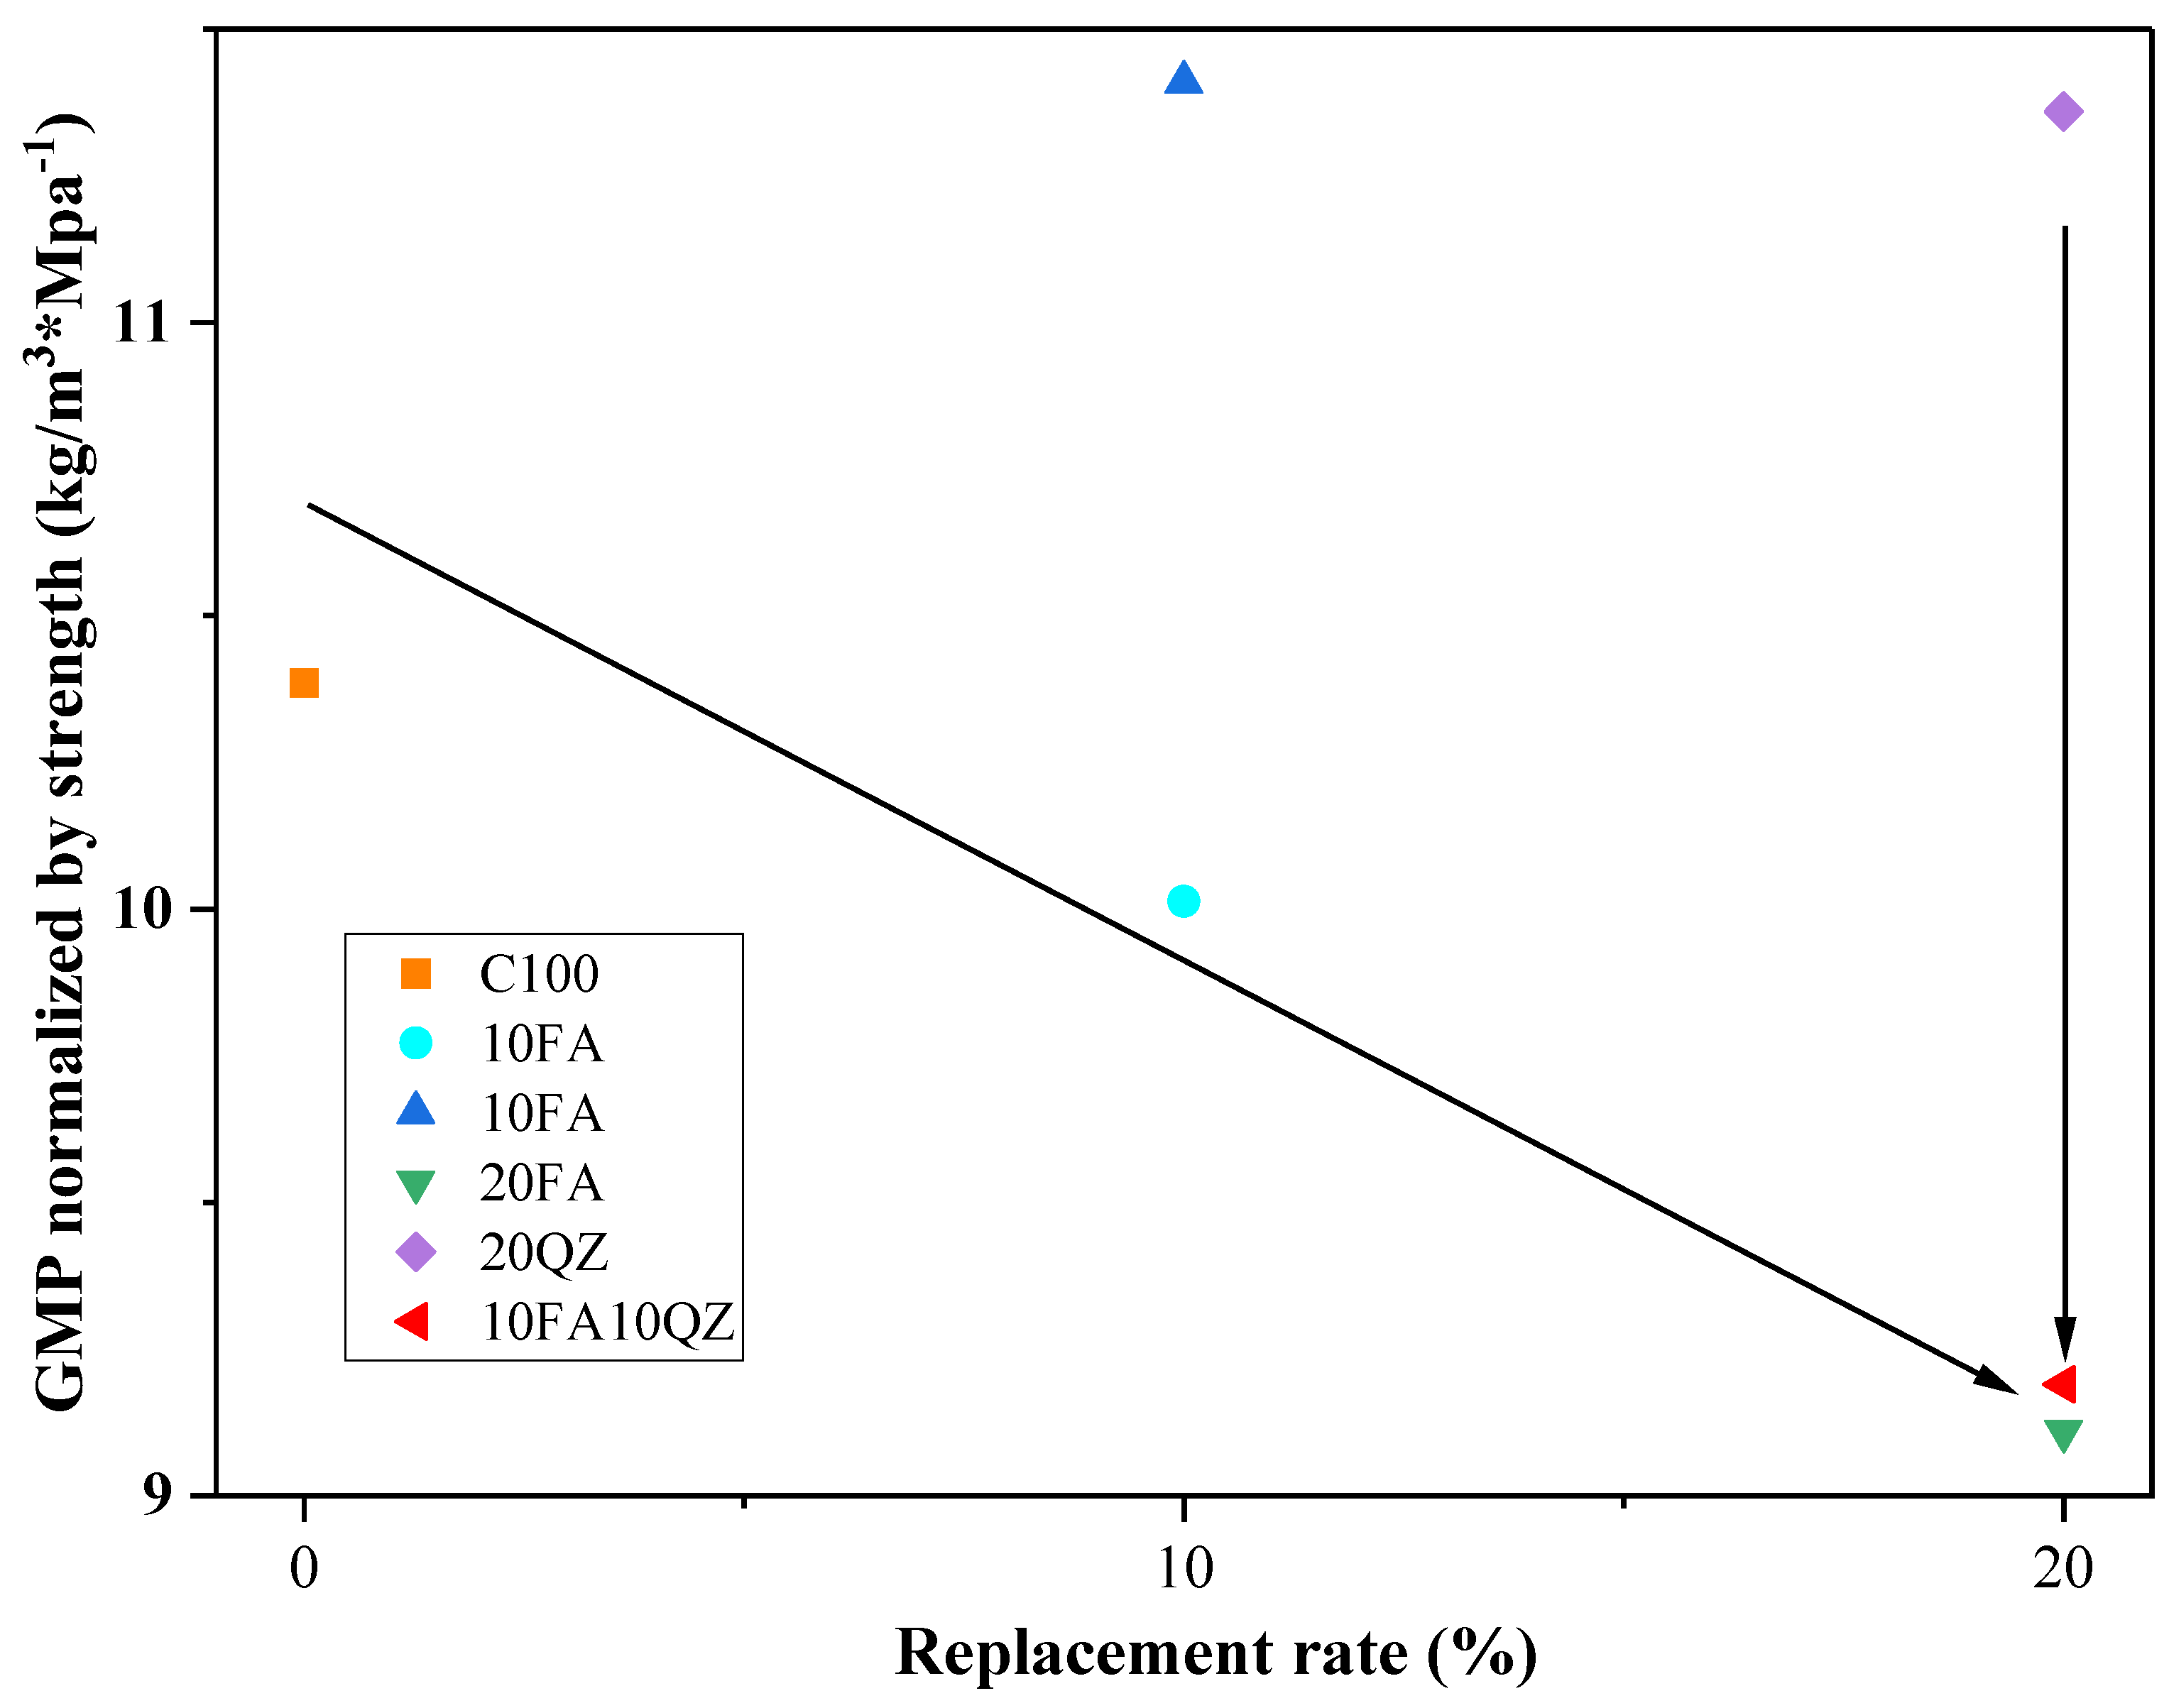
In actual engineering applications, while considering the reduction in CO2 emissions, we should also consider the changes in cement mix proportions and the changes in cement product strength that will result. According to Equation (8) [6], the 28-day compressive strength of each group of sample mortar is normalized to CO2 emissions:
E C O 2 = C O 2 P F 28
E C O 2 is the CO2 emission per unit compressive strength of 28 days (kg·CO2/MPa), F 28 is the compressive strength of the mortar sample after 28 days of curing, and C O 2 P is the calculated CO2 emission per unit volume. As shown in Figure 13, compared with the QZ group, the FA group significantly reduces CO2 emissions per unit compressive strength. This is mainly because the FA group has a higher 28-day compressive strength and lower CO2 emissions. The 10FA10QZ group showed a relatively good result in these data: 9.19 kg·CO2/MPa.

4. Conclusions

This paper discusses the effects of adding QZ or FA on cement curing. The influence is primarily achieved through the physical effects of QZ (including the filling and nucleation effects) and the secondary hydration reaction of FA.
  • The compressive strength and UPV test results show that after replacing cement with FA, the early compressive strength and UPV value of the mortar specimen will decrease. However, after replacing cement with QZ, the mortar specimen’s early compressive strength and UPV value will increase relatively. Compared with QZ, FA is more suitable for improving the compressive strength and UPV value of mortar specimens in the late stage, and the regression analysis model also arrives at a similar conclusion. This is mainly related to the early nucleation effect of QZ and FA’s late secondary hydration effect;
  • The results from the hydration heat flow experiment show that after part of the cement is replaced by QZ, the time to reach the second hydration peak is shorter, and the peak value is higher. This is mainly because the nucleation effect of QZ accelerates the hydration rate of cement. The results from the cumulative hydration heat test show that the cumulative hydration heat of the samples decreases as more QZ and FA are added because of lesser cement content;
  • No new substances were produced in the sample during the XRD and FTIR experiments after FA and QZ partially replaced the cement. In addition, the XRD and FTIR experiments also show that calcium carbonate exists in the sample, and it reacts with aluminate to form monocarbonate aluminate;
  • The TG test results show that the chemically bound water content in the sample decreases after FA and QZ partially replace the cement. This is mainly because the cement content decreases when it is replaced by FA and QZ, resulting in a decrease in the number of hydration products in the sample;
  • SEM images show that after 28 days, as FA is added, additional hydration products are attached to the particle surface of the sample. These additional hydration products can improve the interface between FA and cement, which is attributed to the pozzolanic reaction of FA;
  • Carbon emission and energy consumption analysis showed that using both FA and QZ cementitious materials can significantly reduce CO2 emissions and energy consumption. However, when the correlation between compressive strength and CO2 emissions was considered comprehensively, the FA experimental group showed better results than the QZ group.
This paper conducted a feasibility study for the large-scale and high-value utilization of FA and QZ, providing a promising solution for reducing the environmental impact of concrete without compromising its performance. However, there are also several areas for improvement in this study: 1. The regression model was developed based on a relatively small dataset. In future research, the volume of data should be increased, and the data should be divided into separate training and testing sets. 2. The environmental assessment method is relatively simple. Future research should consider more factors, such as workability and cost, to conduct a comprehensive evaluation.

Author Contributions

Validation, Y.M. and Y.L.; formal analysis, Y.M. and Y.L.; investigation, Y.M.; resources, Y.M.; data curation, Y.M. and Y.L.; writing—original draft preparation, Y.M.; writing—review and editing, Y.L., Y.Z., Z.W., Z.Z., X.W. and G.Z.; supervision, G.Z.; project administration, Z.W.; funding acquisition, G.Z. All authors have read and agreed to the published version of the manuscript.

Funding

This work was supported by the Senior Talent Foundation of Jiangsu University [grant no. JDKQ20240404] and the Natural Science Research of Jiangsu Higher Education Institutions of China [grant no. 24KJB410002].

Institutional Review Board Statement

Not applicable.

Informed Consent Statement

Not applicable.

Data Availability Statement

Data will be made available upon request.

Conflicts of Interest

The authors declare that they have no known competing financial interests or personal relationships that could have appeared to influence the work reported in this paper.

References

  1. Gartner, E.; Hirao, H. A review of alternative approaches to the reduction of CO2 emissions associated with the manufacture of the binder phase in concrete. Cem. Concr. Res. 2015, 78, 126–142. [Google Scholar] [CrossRef]
  2. Hong, W.Y. A techno-economic review on carbon capture, utilisation and storage systems for achieving a net-zero CO2 emissions future. Carbon Capture Sci. Technol. 2022, 3, 100044. [Google Scholar] [CrossRef]
  3. Rupasinghe, M.; Nicolas, R.S.; Mendis, P.; Sofi, M.; Ngo, T. Investigation of strength and hydration characteristics in nano-silica incorporated cement paste. Cem. Concr. Compos. 2017, 80, 17–30. [Google Scholar] [CrossRef]
  4. Li, X.; Ma, W.; Li, S.; Hou, S.; Chen, Y.; Wen, X.; Dan, J.; Huang, J.; Lv, Y. Study on the properties and carbon footprint of low heat cement clinker prepared by recycled concrete powder and calcium carbide slag. Constr. Build. Mater. 2024, 441, 137542. [Google Scholar] [CrossRef]
  5. Gao, T.; Shen, L.; Shen, M.; Chen, F.; Liu, L.; Gao, L. Analysis on differences of carbon dioxide emission from cement production and their major determinants. J. Clean. Prod. 2015, 103, 160–170. [Google Scholar] [CrossRef]
  6. Yang, B.; Han, Y.; Kong, Z.; Wang, X.-Y. Effect of waste oyster shell powder on the micro- and macroproperties and sustainable performance of cement-based materials. J. Build. Eng. 2024, 92, 109800. [Google Scholar] [CrossRef]
  7. Nie, S.; Zhou, J.; Yang, F.; Lan, M.; Li, J.; Zhang, Z.; Chen, Z.; Xu, M.; Li, H.; Sanjayan, J.G. Analysis of theoretical carbon dioxide emissions from cement production: Methodology and application. J. Clean. Prod. 2022, 334, 130270. [Google Scholar] [CrossRef]
  8. Kakasor Ismael Jaf, D.; Abdulrahman, P.I.; Mohammed, A.S.; Kurda, R.; Qaidi, S.M.; Asteris, P.G. Machine learning techniques and multi-scale models to evaluate the impact of silicon dioxide (SiO2) and calcium oxide (CaO) in fly ash on the compressive strength of green concrete. Constr. Build. Mater. 2023, 400, 132604. [Google Scholar] [CrossRef]
  9. Chaudhury, R.; Sharma, U.; Thapliyal, P.C.; Singh, L.P. Low-CO2 emission strategies to achieve net zero target in cement sector. J. Clean. Prod. 2023, 417, 137466. [Google Scholar]
  10. Mo, L.; Zhang, F.; Panesar, D.K.; Deng, M. Development of low-carbon cementitious materials via carbonating Portland cement–fly ash–magnesia blends under various curing scenarios: A comparative study. J. Clean. Prod. 2017, 163, 252–261. [Google Scholar] [CrossRef]
  11. Kovačević, M.; Lozančić, S.; Nyarko, E.K.; Hadzima-Nyarko, M. Application of Artificial Intelligence Methods for Predicting the Compressive Strength of Self-Compacting Concrete with Class F Fly Ash. Materials 2022, 15, 4191. [Google Scholar] [CrossRef] [PubMed]
  12. Li, P.; Gao, X.; Wang, K.; Tam, V.W.; Li, W. Hydration mechanism and early frost resistance of calcium sulfoaluminate cement concrete. Constr. Build. Mater. 2020, 239, 117862. [Google Scholar] [CrossRef]
  13. Chen, X.; Gruyaert, E.; Li, J. Modelling the effect of coarse recycled concrete aggregate on compressive strength of Portland cement concrete using volume fraction-based approach. Constr. Build. Mater. 2021, 309, 125159. [Google Scholar] [CrossRef]
  14. Zhang, D.; Zhang, S.; Huang, B.; Yang, Q.; Li, J. Comparison of mechanical, chemical, and thermal activation methods on the utilisation of recycled concrete powder from construction and demolition waste. J. Build. Eng. 2022, 61, 105295. [Google Scholar] [CrossRef]
  15. Juenger, M.C.G.; Siddique, R. Recent advances in understanding the role of supplementary cementitious materials in concrete. Cem. Concr. Res. 2015, 78, 71–80. [Google Scholar] [CrossRef]
  16. Zhang, G.-Y.; Wang, J.; Zheng, Y.; Wang, Z.; Wang, X.-Y. Perforated cenospheres used to enhance the engineering performance of high-performance cement-slag-limestone ternary binder. Constr. Build. Mater. 2024, 455, 139084. [Google Scholar] [CrossRef]
  17. Jamil, M.; Kaish, A.; Raman, S.; Zain, M. Pozzolanic contribution of rice husk ash in cementitious system. Constr. Build. Mater. 2013, 47, 588–593. [Google Scholar] [CrossRef]
  18. Berodier, E.; Scrivener, K.; Scherer, G. Understanding the Filler Effect on the Nucleation and Growth of C-S-H. J. Am. Ceram. Soc. 2014, 97, 3764–3773. [Google Scholar] [CrossRef]
  19. Ramezanianpour, A.M.; Hooton, R.D. A study on hydration, compressive strength, and porosity of Portland-limestone cement mixes containing SCMs. Cem. Concr. Compos. 2014, 51, 1–13. [Google Scholar] [CrossRef]
  20. Land, G.; Stephan, D. The influence of nano-silica on the hydration of ordinary Portland cement. J. Mater. Sci. 2011, 47, 1011–1017. [Google Scholar] [CrossRef]
  21. Bouasker, M.; Mounanga, P.; Turcry, P.; Loukili, A.; Khelidj, A. Chemical shrinkage of cement pastes and mortars at very early age: Effect of limestone filler and granular inclusions. Cem. Concr. Compos. 2008, 30, 13–22. [Google Scholar] [CrossRef]
  22. Xuan, M.-Y.; Guo, R.; Lin, R.-S.; Wang, X.-Y. Mechanism of fineness and content of quartz powder on the improvement of carbonation curing efficiency. Cem. Concr. Compos. 2024, 150, 105570. [Google Scholar] [CrossRef]
  23. Liu, Y.; Jing, R.; Yan, P. Improving environmental efficiency of ultra-high-performance concrete (UHPC) through appropriate application of ultrafine quartz powder. J. Sustain. Cem. -Based Mater. 2022, 12, 941–950. [Google Scholar] [CrossRef]
  24. Bayrak, B.; Mostafa, S.A.; Öz, A.; Tayeh, B.A.; Kaplan, G.; Aydın, A.C. The effect of clinker aggregate on acid resistance in prepacked geopolymers containing metakaolin and quartz powder in the presence of ground blast furnace slag. J. Build. Eng. 2023, 69, 106290. [Google Scholar] [CrossRef]
  25. Venkitasamy, V.; Santhanam, M.; Rao, B.; Balakrishnan, S.; Kumar, A. Mechanical and durability properties of structural grade heavy weight concrete with fly ash and slag. Cem. Concr. Compos. 2024, 145, 105362. [Google Scholar] [CrossRef]
  26. Ke, G.; Li, Z.; Jiang, H. Study on long-term solidification of all-solid waste cementitious materials based on circulating fluidized bed fly ash, red mud, carbide slag, and fly ash. Constr. Build. Mater. 2024, 427, 136284. [Google Scholar] [CrossRef]
  27. ASTM C188-17; Standard Test Method for Density of Hydraulic Cement. ASTM International: West Conshohocken, PA, USA, 2017.
  28. ASTM C618; Standard specification for coal fly ash and raw or calcined natural pozzolan for use in concrete. ASTM International: West Conshohocken, PA, USA, 2003.
  29. Nukah, P.D.; Abbey, S.J.; Booth, C.A.; Nounu, G. Mapping and synthesizing the viability of cement replacement materials via a systematic review and meta-analysis. Constr. Build. Mater. 2023, 405, 133290. [Google Scholar] [CrossRef]
  30. Bentz, D.P.; Ferraris, C.F.; Jones, S.Z.; Lootens, D.; Zunino, F. Limestone and Silica Powder Replacements for Cement: Early-Age Performance. Cem. Concr. Compos. 2017, 78, 43–56. [Google Scholar] [CrossRef]
  31. Uzal, B.; Turanlı, L.; Yücel, H.; Göncüoğlu, M.; Çulfaz, A. Pozzolanic activity of clinoptilolite: A comparative study with silica fume, fly ash and a non-zeolitic natural pozzolan. Cem. Concr. Res. 2010, 40, 398–404. [Google Scholar] [CrossRef]
  32. Wang, X.-Y. Effect of fly ash on properties evolution of cement based materials. Constr. Build. Mater. 2014, 69, 32–40. [Google Scholar] [CrossRef]
  33. Wang, C.; Yu, Q.; Zhan, B.; Gao, P.; Guo, B.; Chu, Y.; Chen, Y.; Bian, P. Activity quantification and assessment of recycled concrete powder based on the contributions of the dilution effect, physical effect and chemical effect. J. Clean. Prod. 2024, 442, 140918. [Google Scholar] [CrossRef]
  34. Lawrence, P.; Cyr, M.; Ringot, E. Mineral admixtures in mortars. Cem. Concr. Res. 2003, 33, 1939–1947. [Google Scholar] [CrossRef]
  35. Wang, A.; Zhang, C.; Sun, W. Fly ash effects. Cem. Concr. Res. 2004, 34, 2057–2060. [Google Scholar] [CrossRef]
  36. Deschner, F.; Winnefeld, F.; Lothenbach, B.; Seufert, S.; Schwesig, P.; Dittrich, S.; Goetz-Neunhoeffer, F.; Neubauer, J. Hydration of Portland cement with high replacement by siliceous fly ash. Cem. Concr. Res. 2012, 42, 1389–1400. [Google Scholar] [CrossRef]
  37. Uysal, M. The influence of coarse aggregate type on mechanical properties of fly ash additive self-compacting concrete. Constr. Build. Mater. 2012, 37, 533–540. [Google Scholar] [CrossRef]
  38. Zhang, J.; Lv, T.; Han, Q.; Zhu, Y.; Hou, D.; Dong, B. Effects of fly ash on MgO-based shrinkage-compensating cement: Microstructure and properties. Constr. Build. Mater. 2022, 339, 127648. [Google Scholar] [CrossRef]
  39. Petro, J.T.; Kim, J. Detection of delamination in concrete using ultrasonic pulse velocity test. Constr. Build. Mater. 2011, 26, 574–582. [Google Scholar] [CrossRef]
  40. Yang, B.; Liu, Y.; Wang, X.Y. A Hydration Model to Evaluate the Properties of Cement-Quartz Powder Hybrid Concrete. Materials 2024, 17, 2769. [Google Scholar] [CrossRef]
  41. Tavares, L.R.C.; Junior, J.F.T.; Costa, L.M.; Bezerra, A.C.d.S.; Cetlin, P.R.; Aguilar, M.T.P. Influence of quartz powder and silica fume on the performance of Portland cement. Sci. Rep. 2020, 10, 21461. [Google Scholar] [CrossRef]
  42. Bogas, J.A.; Gomes, M.G.; Gomes, A. Compressive strength evaluation of structural lightweight concrete by non-destructive ultrasonic pulse velocity method. Ultrasonics 2013, 53, 962–972. [Google Scholar] [CrossRef]
  43. Demirboğa, R.; Türkmen, İ.; Karakoç, M.B. Relationship between ultrasonic velocity and compressive strength for high-volume mineral-admixtured concrete. Cem. Concr. Res. 2004, 34, 2329–2336. [Google Scholar] [CrossRef]
  44. Han, Y.; Lin, R.; Wang, X.-Y. Sustainable mixtures using waste oyster shell powder and slag instead of cement: Performance and multi-objective optimization design. Constr. Build. Mater. 2022, 348, 128642. [Google Scholar] [CrossRef]
  45. Liu, F.; Wang, J.; Qian, X.; Hollingsworth, J. Internal curing of high performance concrete using cenospheres. Cem. Concr. Res. 2017, 95, 39–46. [Google Scholar] [CrossRef]
  46. Long, J.; Yang, K.; Wang, S.; Xu, L.; Yang, Z.; Ye, C.; Luo, J.; Wu, K.; Zhang, L. New insights into the contribution of quartz powder byproduct from manufactured sand to the performance of cementitious materials. J. Therm. Anal. Calorim. 2023, 148, 4105–4117. [Google Scholar] [CrossRef]
  47. Lin, R.-S.; Wang, X.-Y.; Zhang, G.-Y. Effects of Quartz Powder on the Microstructure and Key Properties of Cement Paste. Sustainability 2018, 10, 3369. [Google Scholar] [CrossRef]
  48. Land, G.; Stephan, D. Controlling cement hydration with nanoparticles. Cem. Concr. Compos. 2015, 57, 64–67. [Google Scholar] [CrossRef]
  49. Zhang, G.-Y.; Oh, S.; Han, Y.; Lin, R.-S.; Wang, X.-Y. Using perforated cenospheres to improve the engineering performance of limestone-calcined clay-cement (LC3) high performance concrete: Autogenous shrinkage, strength, and microstructure. Constr. Build. Mater. 2023, 406, 133467. [Google Scholar] [CrossRef]
  50. Nguyen, H.-A.; Chang, T.-P.; Shih, J.-Y.; Chen, C.-T. Influence of low calcium fly ash on compressive strength and hydration product of low energy super sulfated cement paste. Cem. Concr. Compos. 2019, 99, 40–48. [Google Scholar] [CrossRef]
  51. Lin, R.-S.; Lee, H.-S.; Han, Y.; Wang, X.-Y. Experimental studies on hydration–strength–durability of limestone-cement-calcined Hwangtoh clay ternary composite. Constr. Build. Mater. 2021, 269, 121290. [Google Scholar] [CrossRef]
  52. de Oliveira, A.M.; Oliveira, A.P.; Vieira, J.D.; Junior, A.N.; Cascudo, O. Study of the development of hydration of ternary cement pastes using X-ray computed microtomography, XRD-Rietveld method, TG/DTG, DSC, calorimetry and FTIR techniques. J. Build. Eng. 2023, 64, 105616. [Google Scholar] [CrossRef]
  53. Fernández-Carrasco, L.; Vázquez, E. Reactions of fly ash with calcium aluminate cement and calcium sulphate. Fuel 2009, 88, 1533–1538. [Google Scholar] [CrossRef]
  54. De Weerdt, K.; Ben Haha, M.; Le Saout, G.; Kjellsen, K.; Justnes, H.; Lothenbach, B. Hydration mechanisms of ternary Portland cements containing limestone powder and fly ash. Cem. Concr. Res. 2011, 41, 279–291. [Google Scholar]
  55. Yao, G.; Cui, T.; Zhang, J.; Wang, J.; Lyu, X. Effects of mechanical grinding on pozzolanic activity and hydration properties of quartz. Adv. Powder Technol. 2020, 31, 4500–4509. [Google Scholar]
  56. Chiaia, B.; Fantilli, A.P.; Guerini, A.; Volpatti, G.; Zampini, D. Eco-mechanical index for structural concrete. Constr. Build. Mater. 2014, 67, 386–392. [Google Scholar] [CrossRef]
  57. Chen, T.; Bai, M.; Gao, X. Carbonation curing of cement mortars incorporating carbonated fly ash for performance improvement and CO2 sequestration. J. CO2 Util. 2021, 51, 101633. [Google Scholar] [CrossRef]
Figure 1. Particle size distributions of OPC, QZ, and FA.
Applsci 15 05093 g001
Figure 2. XRD patterns of OPC, QZ, and FA.
Applsci 15 05093 g002
Figure 3. Compressive strength results.
Applsci 15 05093 g003
Figure 4. UPV test results.
Applsci 15 05093 g004
Figure 5. Relationship between compressive strength and UPV.
Applsci 15 05093 g005
Figure 6. Hydration heat results: (a) heat flow curves; (b) cumulative hydration heat; (c) relationship between the cumulative heat of hydration and the compressive strength after curing for 1 and 3 days.
Applsci 15 05093 g006aApplsci 15 05093 g006b
Figure 7. (a) Hydration heat flow development normalized by cement mass fraction (b) according to the quality fraction of cement cumulative heat of hydration.
Applsci 15 05093 g007aApplsci 15 05093 g007b
Figure 8. (a) Time to reach the main peak; (b) peak intensity.
Applsci 15 05093 g008
Figure 9. XRD patterns of the blended pastes at (a) 1 day and (b) 28 days.
Applsci 15 05093 g009aApplsci 15 05093 g009b
Figure 10. FTIR spectra. (a) 1 day and (b) 28 days.
Applsci 15 05093 g010
Figure 11. Weight loss (%) registered by thermal analysis data: thermogravimetry—TG (left) and differential thermogravimetry—DTG (right) of the pastes studied at the ages of 28 days.
Applsci 15 05093 g011
Figure 12. SEM image at 28 d. (a) 20QZ, (b) C100, (c) 20FA, (d) 20FA, (e) FA.
Applsci 15 05093 g012
Figure 13. Strength-normalized CO2 emissions versus the SCMs replacement rate.
Applsci 15 05093 g013
Table 1. Chemical composition of the materials.
Materials\OxideCaOSiO2Al2O3Fe2O3MgONa2OK2OSO3LOl
OPC60.2021.585.002.113.780.580.132.314.31
QZ\99.430.180.12\\\\0.27
FA6.4056.0025.806.001.50\\0.803.50
Table 2. Sample mixtures.
GroupOPCFAQZSandWaterW/B
PasteC10010000\500.5
10FA90100\500.5
20FA80200\500.5
10QZ90010\500.5
20QZ80020\500.5
10FA10QZ801010\500.5
MortarC10010000200500.5
10FA90100200500.5
20FA80200200500.5
10QZ90010200500.5
20QZ80020200500.5
10FA10QZ801010200500.5
5FA9550200500.5
15FA85150200500.5
5QZ9505200500.5
15QZ85015200500.5
5FA5QZ9055200500.5
Table 3. Compressive strength results.
GroupC1005FA10FA15FA20FA5QZ10QZ15QZ20QZ5FA5QZ10FA10QZ
Strength50.649.848.84847.646.8434038.548.347.4
Table 4. Coefficients and test results.
ItemCoefficientF Valuep Value
Constant50.701105.75<0.001
FA−0.166−1.480.198
QZ−0.866−7.740.001
FA×FA0.000060.010.992
QZ×QZ0.012062.240.075
FA×QZ0.06046.470.001
Table 5. Model fit indices.
MeanS.D.Min Max R 2 R 2 (Adjusted) R 2 (Predicted)F Valuep Value
46.253.9838.5050.6099.08%98.16%77.15%107.62<0.001
Table 6. CH content and bound water content.
GroupC10020FA20QZ10QZ10FA
CH (%)16.6215.0815.2215.16
Wt (%)18.3817.6816.2417.15
Table 7. The quality of each raw material in one cubic meter.
GroupOPC (kg)FA (kg)QZ (kg)Sand (kg)Water (kg)
MortarC100618.25001236.50309.12
10FA553.8661.5401230.82307.70
20FA490.07122.5201225.19306.30
10QZ554.37061.601231.94307.99
20QZ490.970122.741227.42306.85
10FA10QZ490.5261.3161.311226.30306.57
Table 8. Carbon footprint and energy emission of raw materials used in this investigation.
Raw MaterialsOPCFAQZSandWater
GWP (CO2kg/kg)0.8600.0230.010
Energy emission (MJ/kg)2.45100.8200.5390.20
Table 9. Carbon consumption and energy consumption of raw materials used in this investigation results.
GroupC10010FA20FA10QZ20QZ10QZ10FA
CO2 (kg)525.51488.63433.71490.49437.38435.52
Energy consumption (MJ)2243.632082.461938.972134.892026.961974.83
Disclaimer/Publisher’s Note: The statements, opinions and data contained in all publications are solely those of the individual author(s) and contributor(s) and not of MDPI and/or the editor(s). MDPI and/or the editor(s) disclaim responsibility for any injury to people or property resulting from any ideas, methods, instructions or products referred to in the content.

