3.1. Compressive Strength
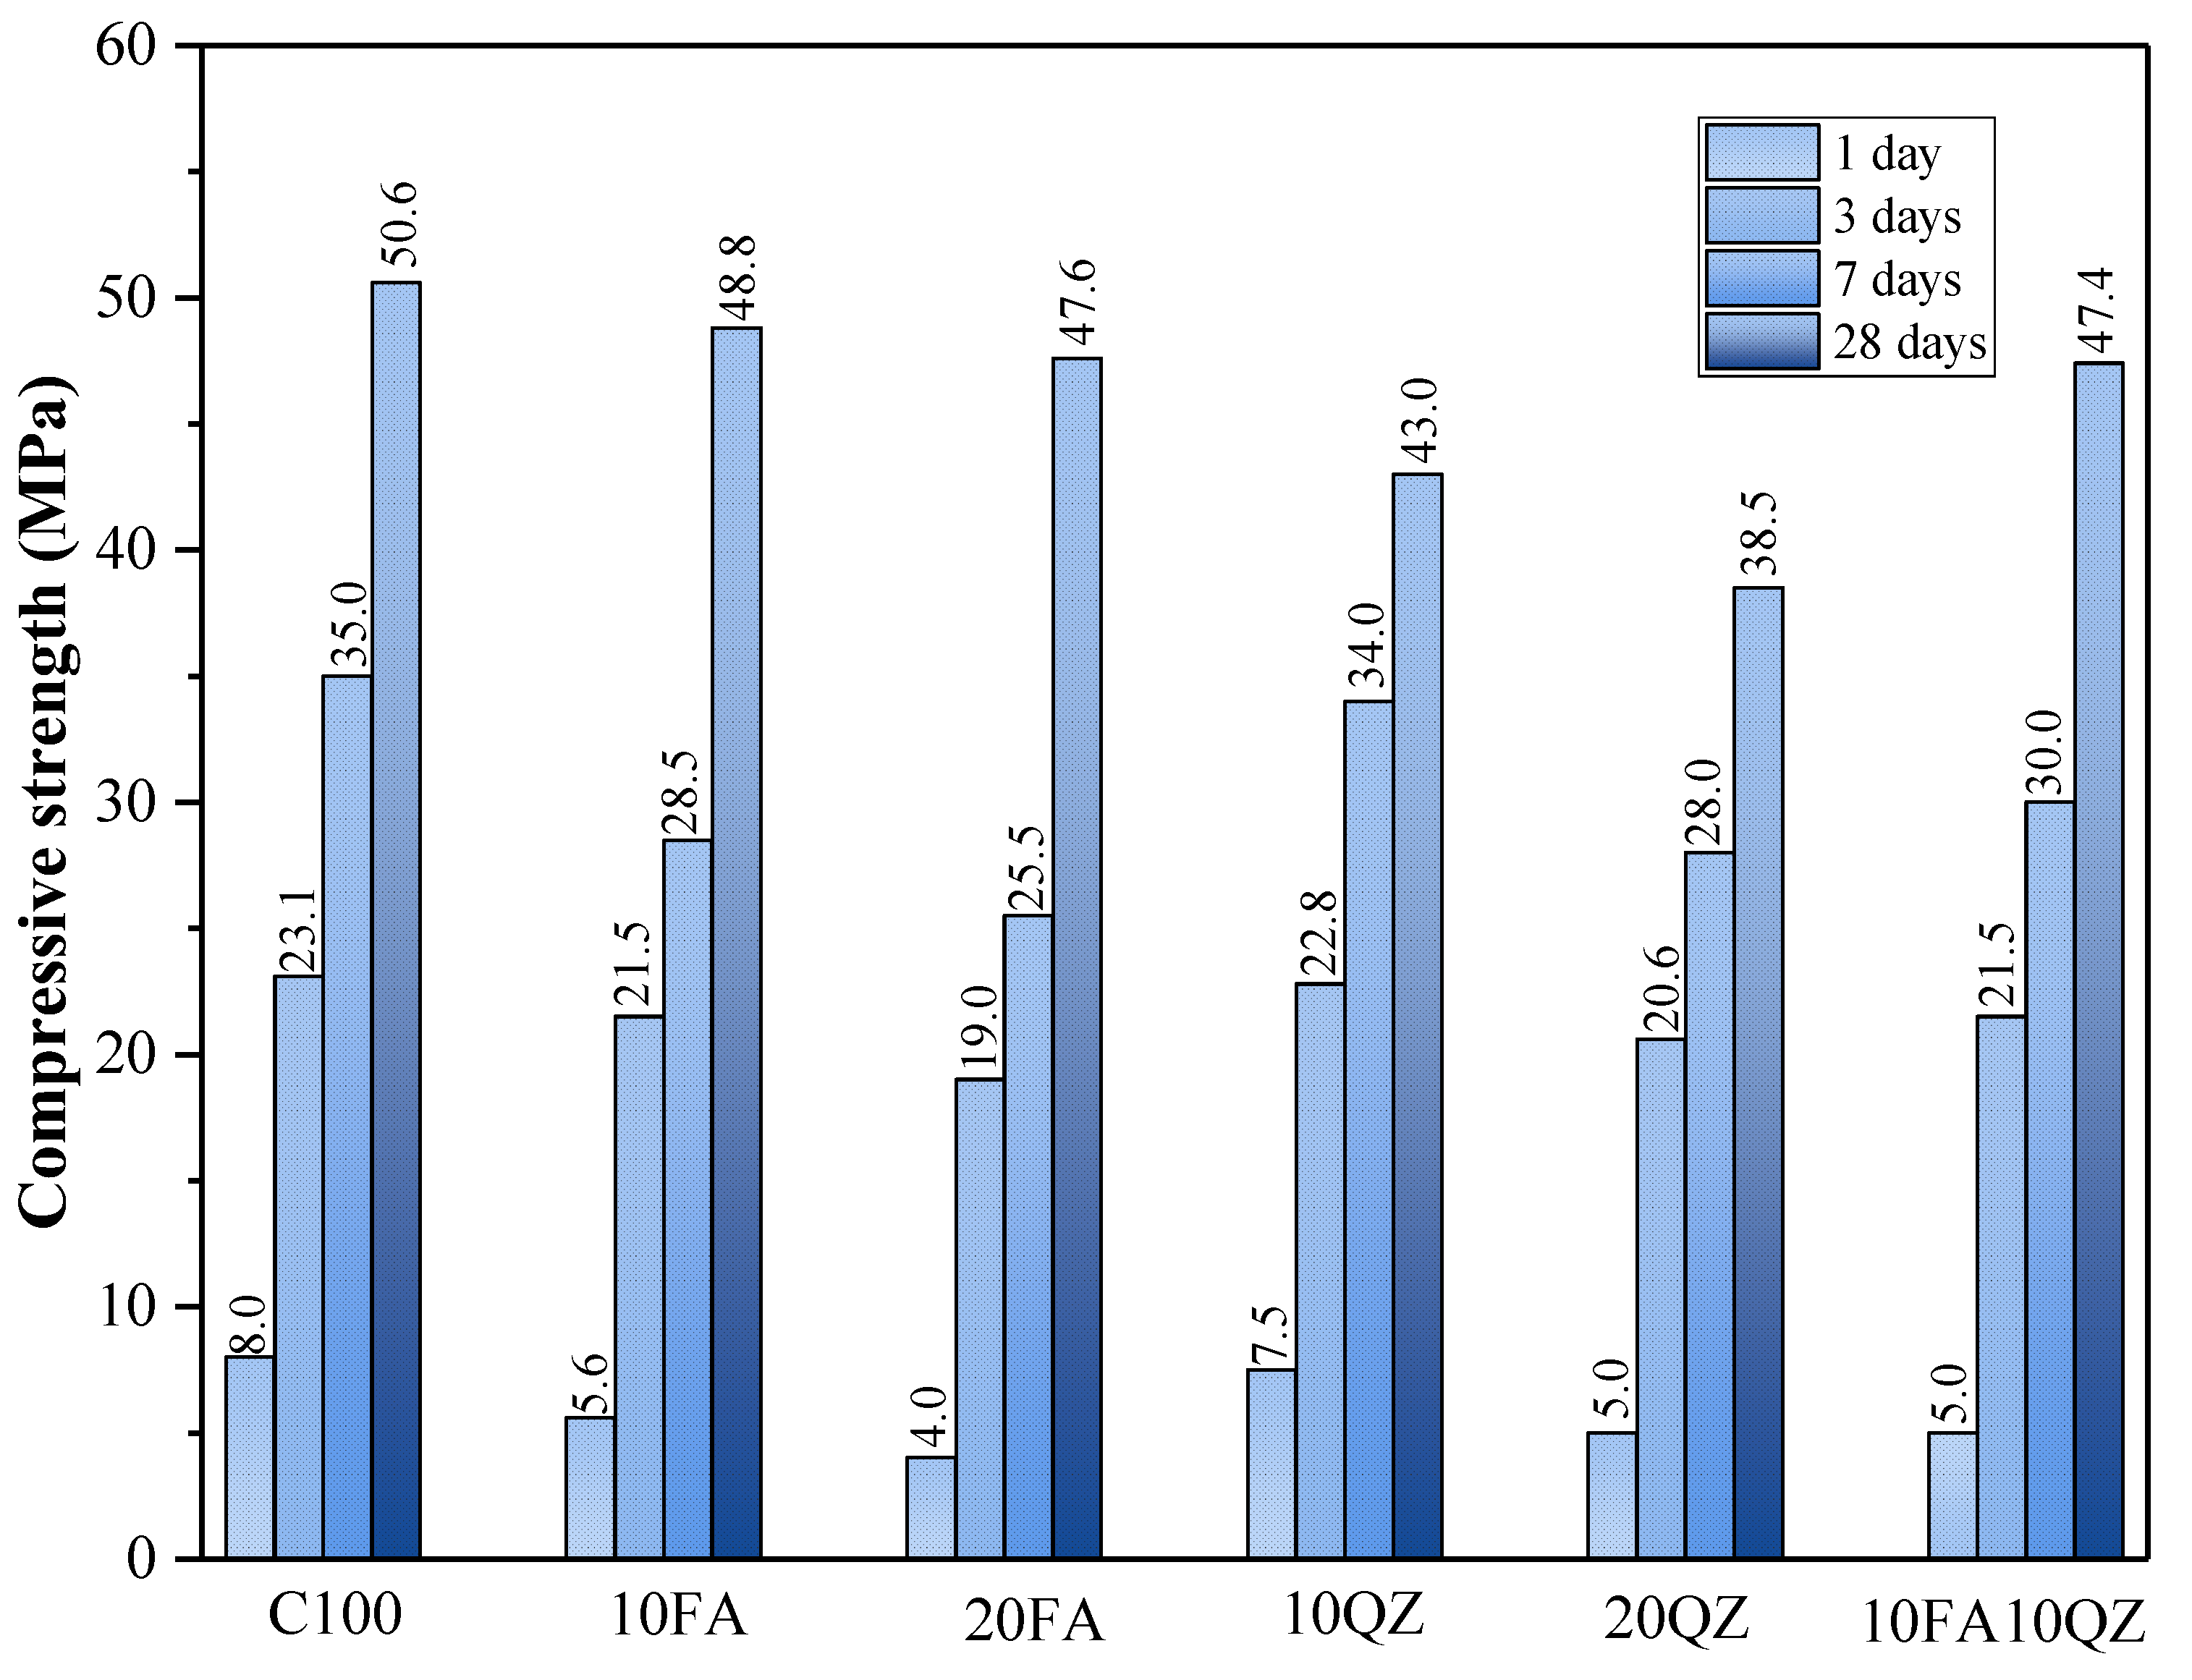
Figure 3 shows the compressive strength test results of the mortar specimens at 1, 3, 7, and 28 days. The compressive strength increases as the curing period increases. The use of SCMs mainly affects cement hydration through dilution, filling, and nucleation effects [
30]. When the curing age was 1, 3, and 7 days, the compressive strength of the mortar specimens decreased with the increase in QZ and FA substitution. However, the compressive strength of the QZ group was higher than that of the FA group. The main reason is that QZ and FA have low initial reaction activity [
31]. Therefore, the dilution effect increases the effective water–cement ratio of the mixed mortar, speeding up the cement reaction rate [
32] and negatively impacting the formation of compressive strength [
33]. The difference in compressive strength mainly depends on the strength of the filling and nucleation effects. The particle size distribution of QZ has a finer range of particle size distribution than that of FA. The finer particle size makes the nucleation effect of QZ more significant than that of FA. In addition, finer QZ can fill finer pores, making the internal structure of the mixed mortar denser at an early stage, thereby obtaining higher compressive strength than the FA group.
During the initial stage, FA has low reactivity, which hardly accelerates the formation of early compressive strength [
31]. In addition, FA also reduces the hydration rate, which delays the process of the mixed mortar turning into a solid, thus affecting early compressive strength [
34]. FA accelerates cement strength development mainly in the late stage [
35]. When the curing age reached 28 days, the compressive strength of 10FA, 20FA, and 10FA10QZ increased rapidly and reached a level comparable to that of the control group. The following is a summary that explains the reasons behind the results: First, when the curing age is reached, the pozzolanic effect of FA is activated. This means that Al
2O
3 and SiO
2 in FA can react with CH to produce substances such as C-S-H. The gel produced by the pozzolanic effect can fill the capillaries in the concrete and thus effectively accelerate the formation of strength [
36,
37]. Secondly, the secondary hydration products of FA adhere to its surface, making the surface of FA rough, improving the interface with cement, and optimizing the overall mechanical properties of cement materials. When the curing time is prolonged beyond 28 days, the mechanical strength and durability properties of the test specimens continue to exhibit incremental improvements, attributed to the characteristic delayed pozzolanic reactivity of FA [
38].
The compressive strength values of the 10FA10QZ group at all stages achieved satisfactory results. This group can improve strength through the filling and nucleation effects of QZ in the early stage and through the secondary hydration reaction of FA in the late stage. In the same reaction system, these two SCMs can demonstrate their respective advantages at different ages and jointly accelerate the consolidation of cement strength.
To quantitatively describe the relationship between the addition of FA and QZ and the 28-day compressive strength (
Table 3), a quadratic polynomial model was constructed using regression analysis, with the general form as follows:
In the model, the dependent variable is the dependent variable representing the 28-day compressive strength. and represent the proportions of FA and QZ, and represents the number of independent variables. is the intercept term, are the linear coefficients, are the quadratic coefficients, is the interaction coefficient, and represents the random error in the estimated model.
Experimental data were collected from various mix proportion combinations and analyzed using the Minitab (version 20) platform to estimate the coefficients of the model. The resulting model is expressed as follows:
The
and
values were calculated to evaluate the significance of the model and its coefficients. Typically, model terms with
p-values below 0.05 are significant, while those above 0.05 are not. The coefficient of determination,
, measures how well the quadratic polynomial equation fits the data, with values closer to 1 indicating a better fit. Model testing (
Table 4 and
Table 5) revealed a
p value of less than 0.001, confirming that the quadratic polynomial model effectively describes the relationship between FA and QZ content and 28-day compressive strength. The
value of 99.08% further confirms the model’s good fit to the data. In the analysis of the various terms in the model, the linear term of QZ and the interaction term between FA and QZ are found to be significant (0.001 for QZ, 0.001 for FA×QZ). This indicates that the dosage of QZ and the interaction between FA and QZ have a significant impact on the 28-day compressive strength of concrete. However, the linear and quadratic terms of FA are not statistically significant in the model (0.198 for FA, 0.992 for FA
2). This suggests that within a substitution range of 20%, the substitution of cement with FA has little effect on the 28-day compressive strength of concrete. In other words, within this dosage range, the incorporation of FA does not significantly promote or inhibit strength development.
3.2. UPV
UPV is a non-destructive testing method for concrete quality commonly used in practical engineering [
39]. The porosity of the material mainly affects compressive strength, while the main influencing factors of UPV include Young’s modulus, Poisson’s ratio, and density.
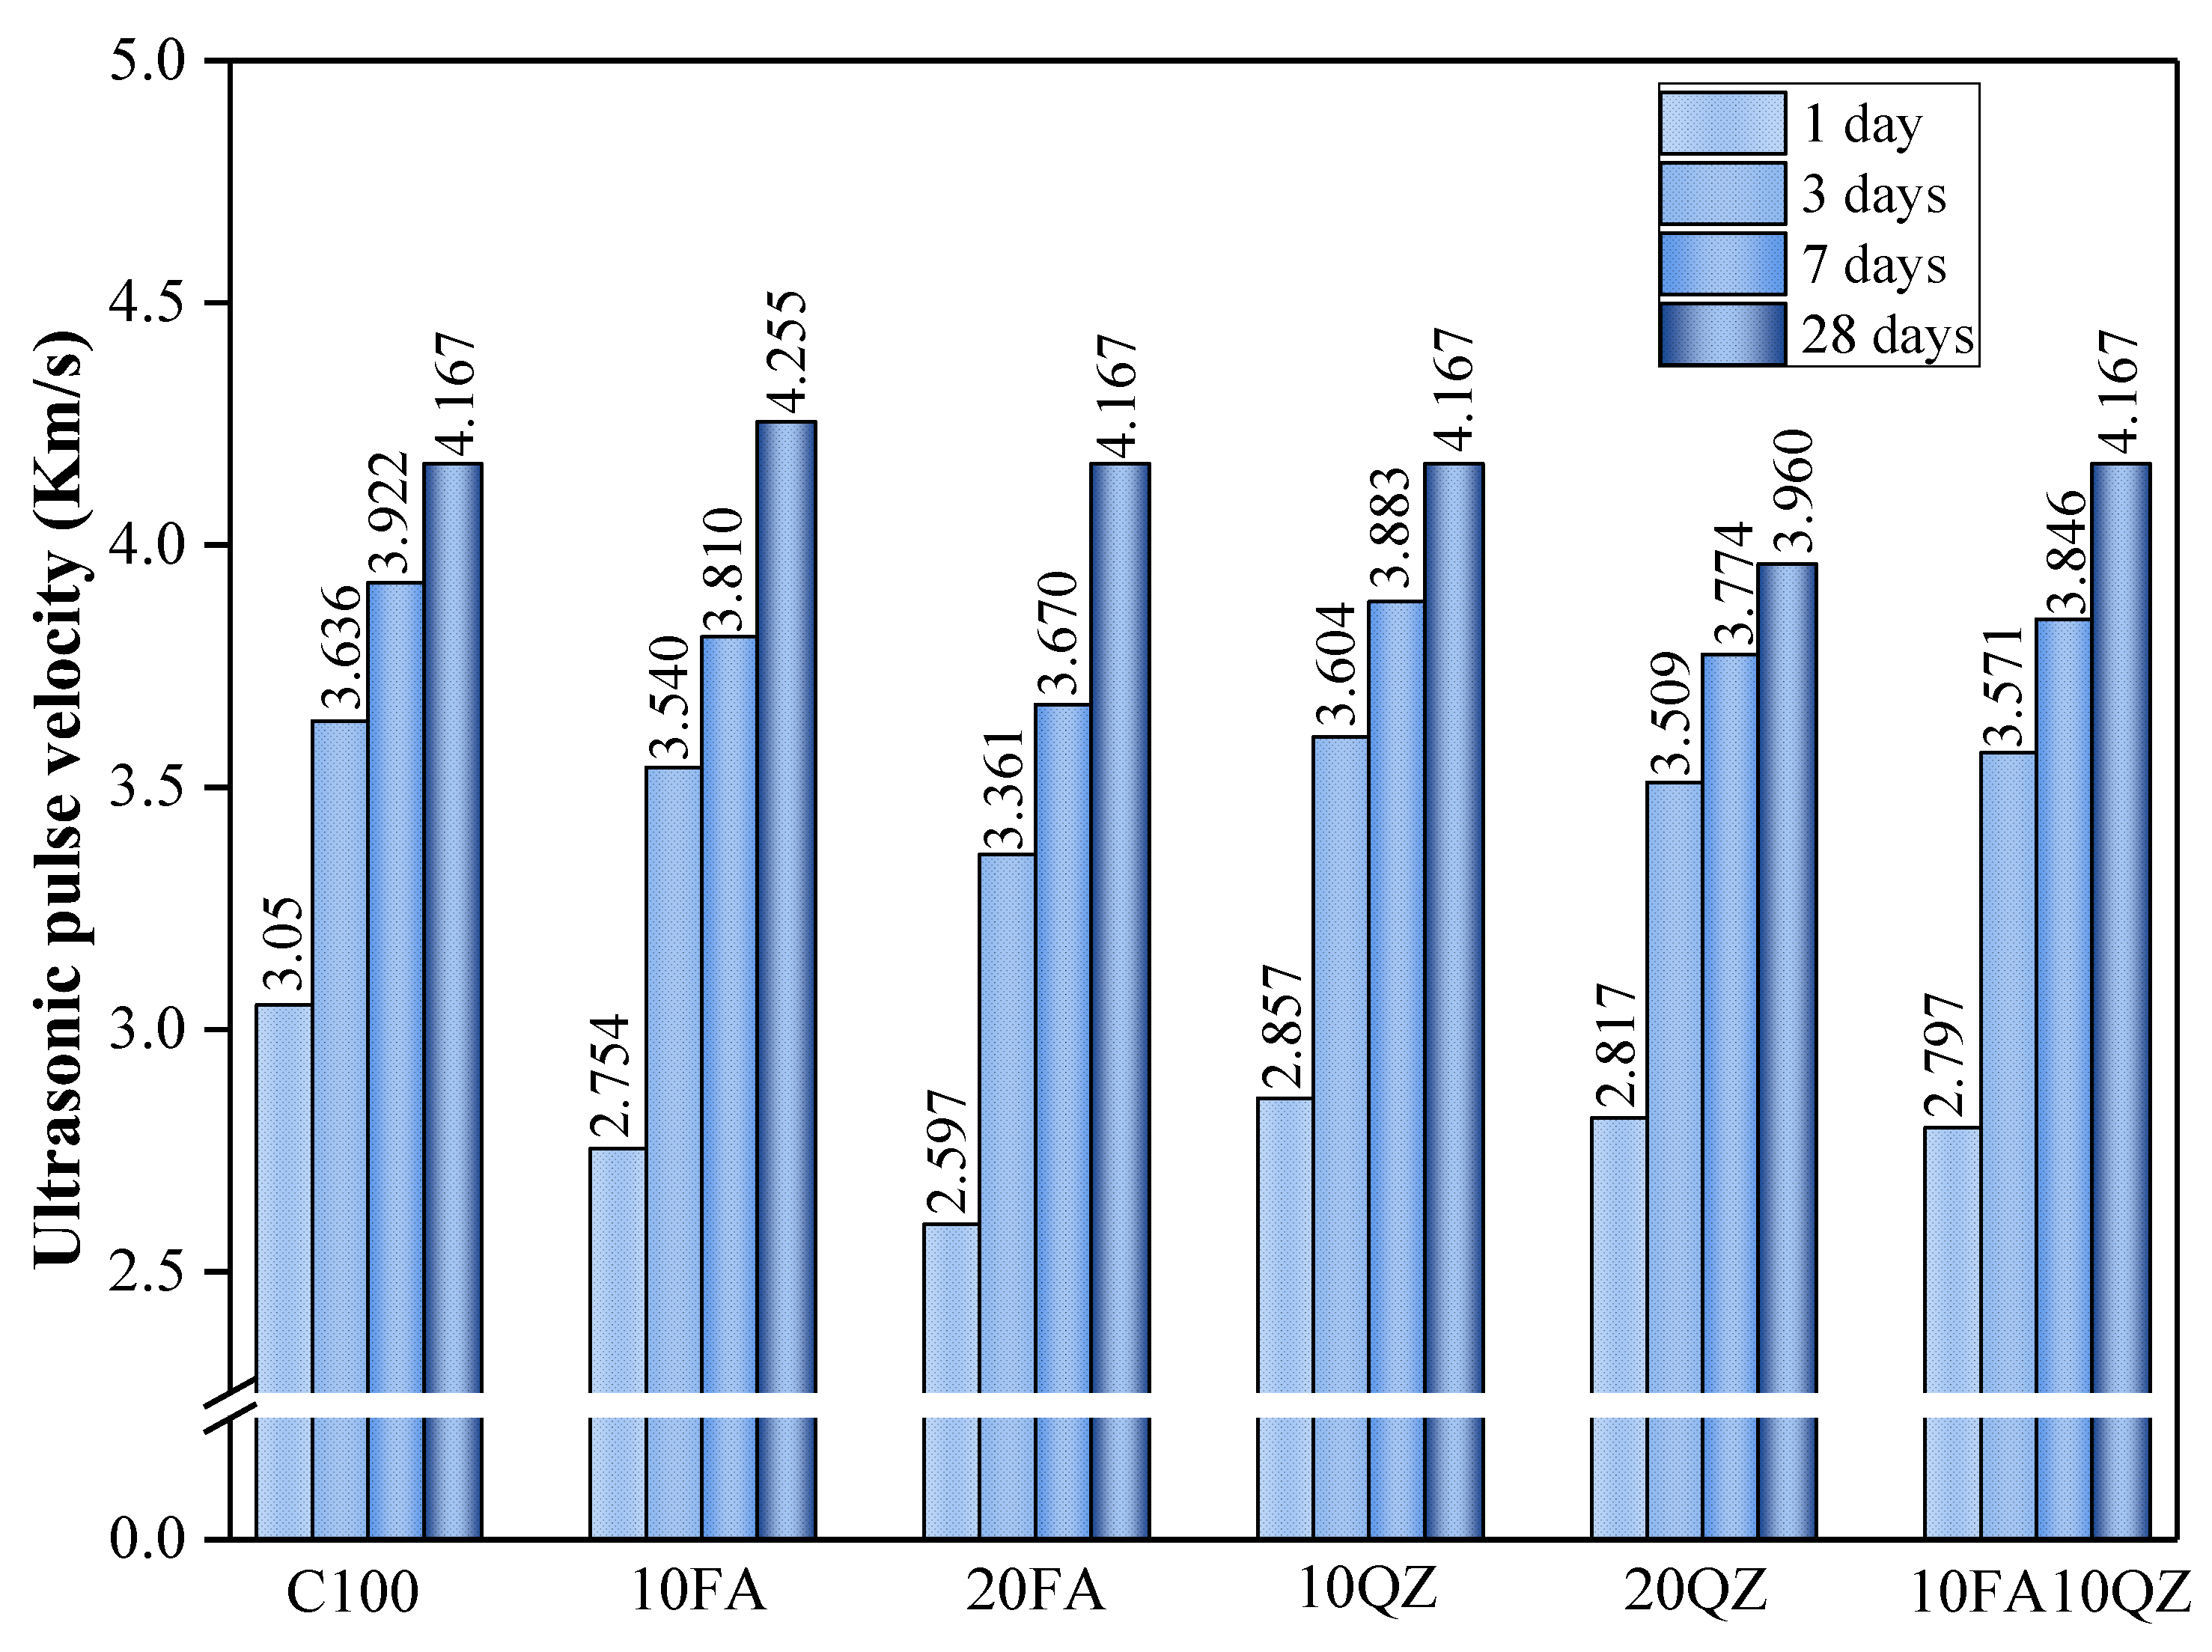
Figure 4 shows the UPV test results of mortar specimens of each component.
The highest UPV values for C100 were obtained at 1, 3, and 7 days of hydration, with values of 3050, 3636, and 3738 m/s, respectively. The early UPV value decreased significantly with the increase in QZ and FA substitution. For example, when the curing age was 1 day, the UPV value decreased by 14.9% with a 20% FA content. While with a 20% QZ content, the UPV value decreased by 7.6%. QZ exhibits physical effects (nucleation effect and filling effect) in the early stage of hydration, accelerating cement hydration [
18,
22,
40]. However, the UPV value of the QZ group was still lower than that of the control group in the early stage. This is due to the reduction in cement mass and the insufficient physical effect of QZ to compensate for the negative effect caused by the reduction in the amount of cement used.
The UPV value of the QZ group at 28 days was lower than that of the other groups, possibly because QZ’s filling and nucleation effects accelerated the hydration reaction mainly in the early stage. Additionally, QZ has a different pozzolanic reaction compared to FA in the late stage, resulting in a lack of apparent improvement in porosity [
41].
In the early stage, the FA group’s UPV value is low, and in the late stage, the UPV value becomes significantly higher. As the curing time increased, the UPV value of the FA group eventually became equivalent to that of the control group. This may be due to the low reactivity of FA in the early stage, which limits its ability to facilitate the growth of hydration products. However, the secondary hydration effect increases the number of secondary hydration products as the curing period increases, densifying the internal structure of the mixed mortar and increasing the UPV value. It is important to note that the 10FA10QZ group exhibits higher strength and UPV values both in the early and late stages of development. When these two materials are used in combination, QZ enhances strength through its filling and nucleation effects in the early stages, while FA’s secondary hydration reaction contributes to strength gain in the later stages. This synergistic effect allows both binder materials to leverage their respective advantages at different ages, thereby collectively promoting the development of cement strength.
Factors that affect the UPV value, such as the amount of hydration products and pore size, also have a crucial impact on compressive strength [
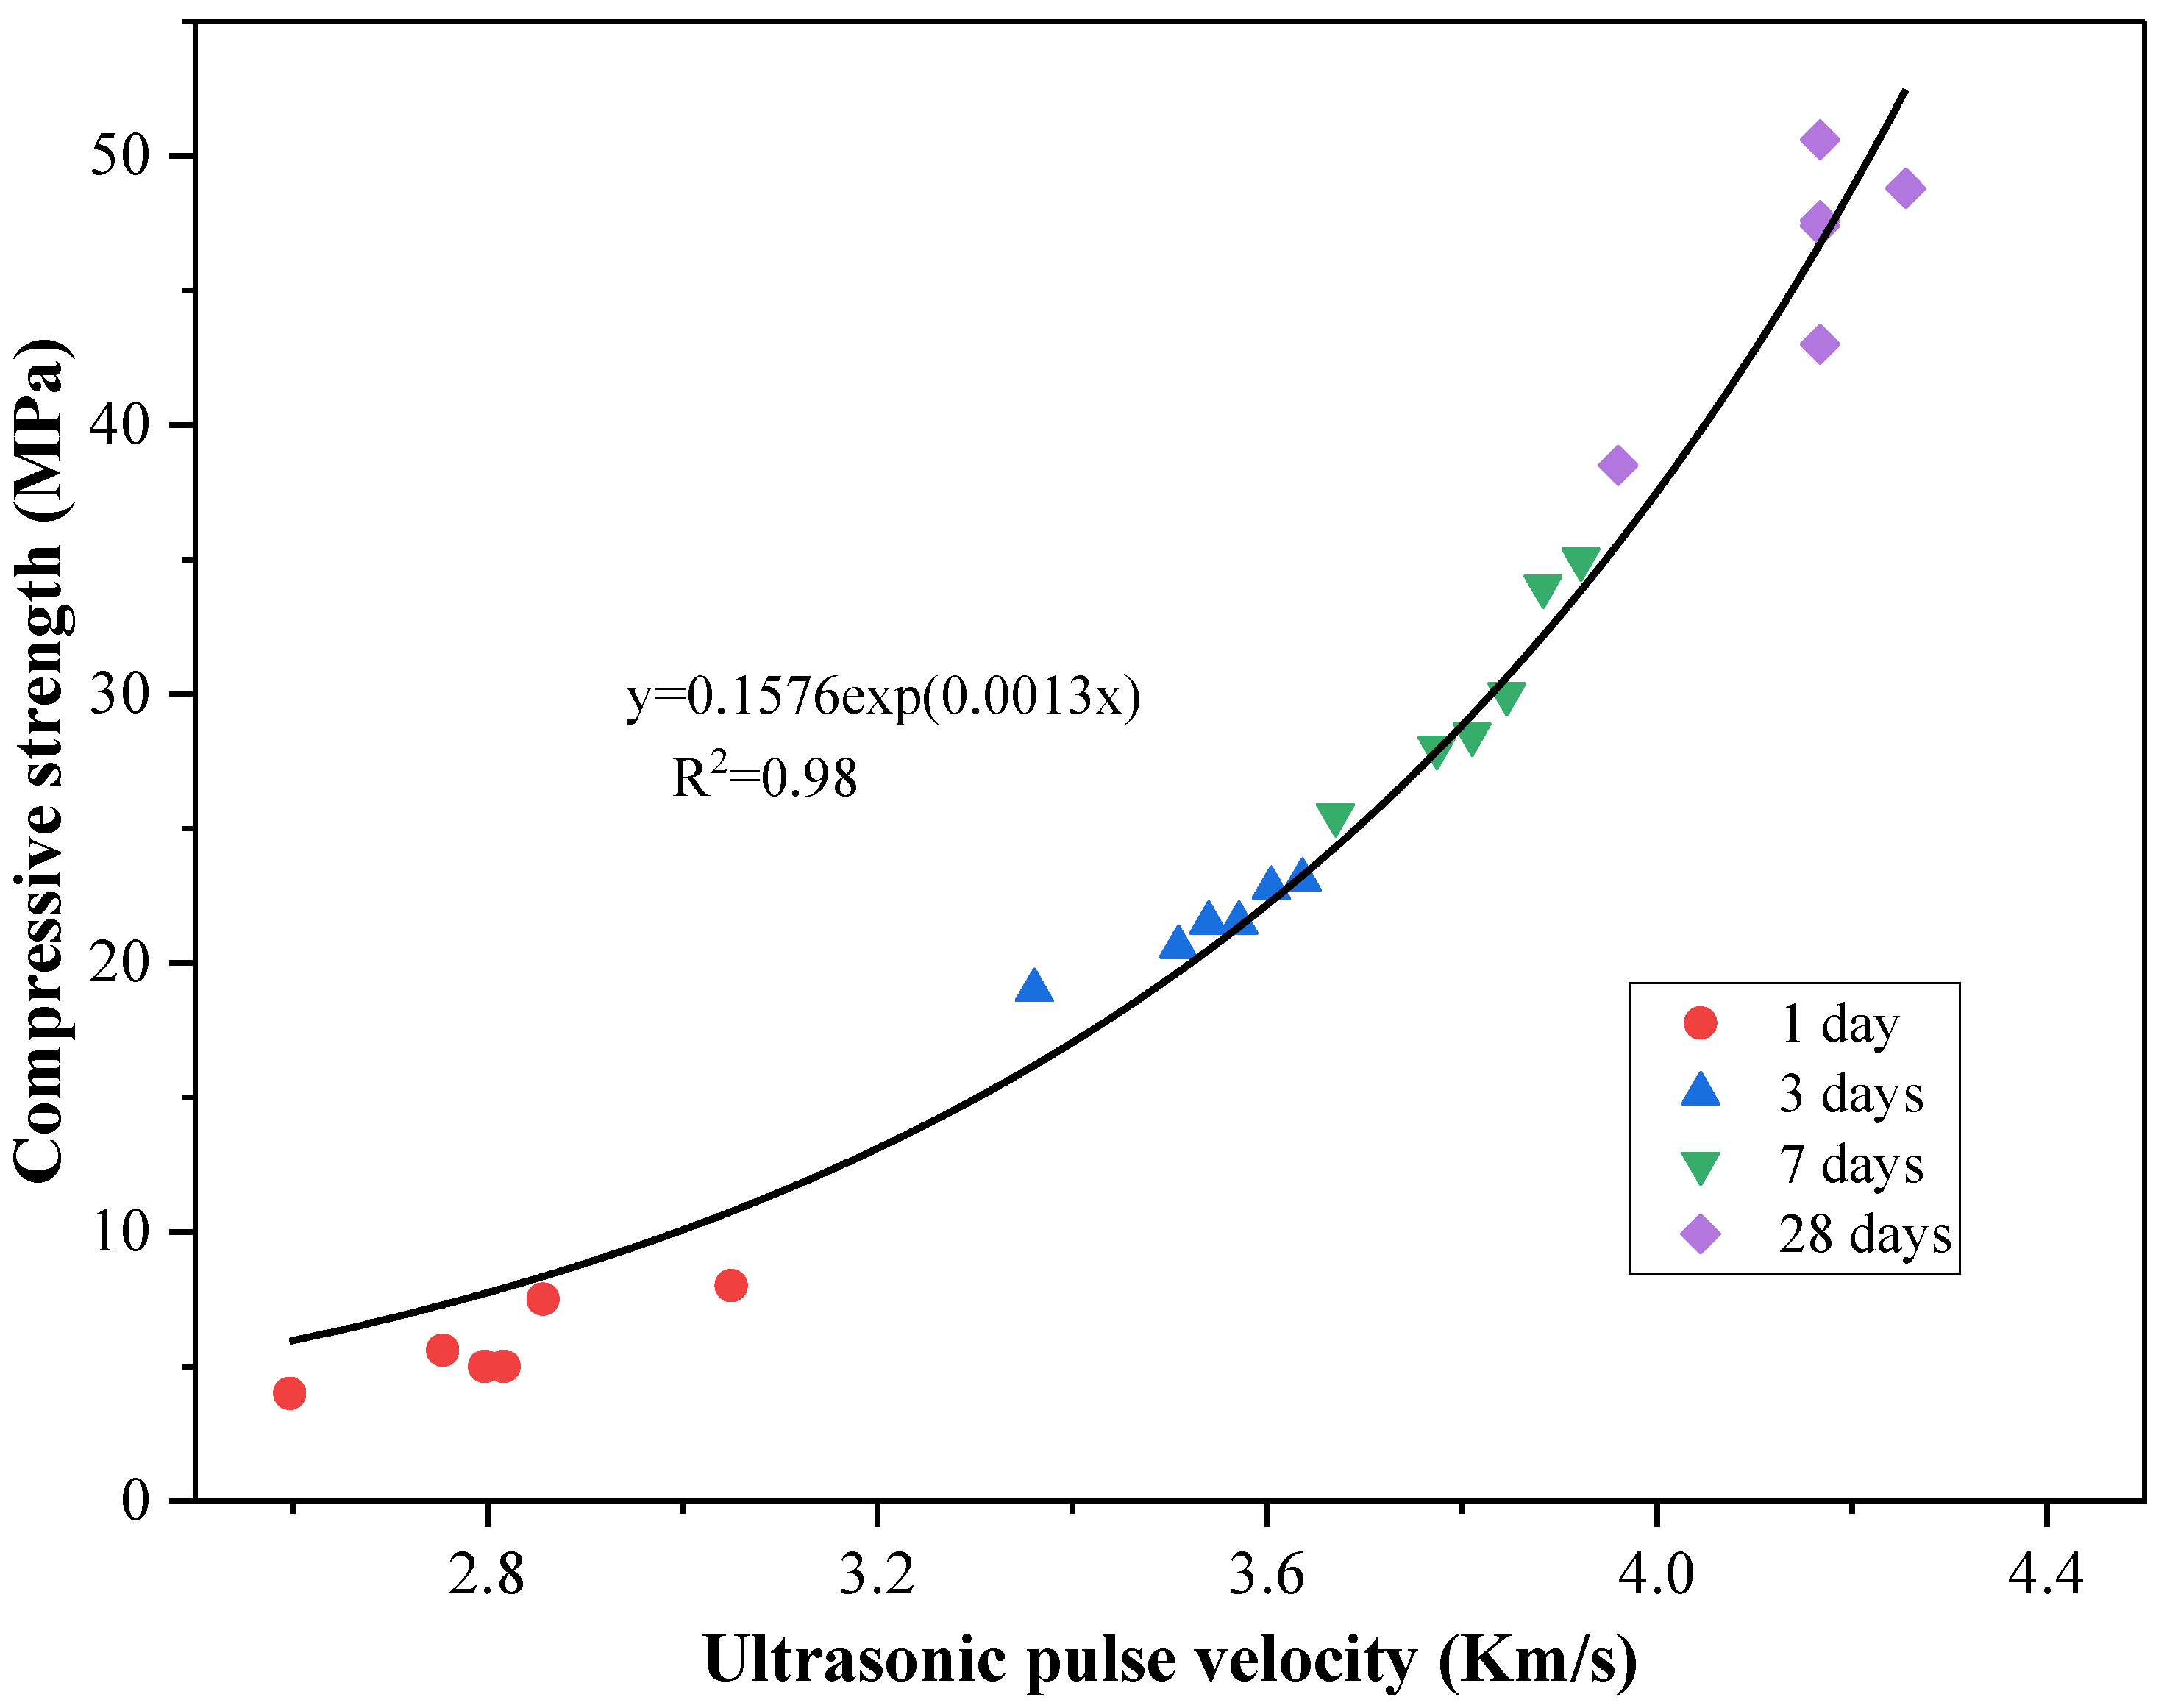
42]. As the hydration products increase and the capillary pores are filled, the UPV value and strength increase during the hydration process. Therefore, UPV is applicable in engineering to evaluate and predict the compressive strength of concrete. Previous studies have revealed a strong correlation between UPV and compressive strength, with an exponential relationship [
42,
43]. In this study, we performed a fitting of the trend of UPV and compressive strength variation over time. As shown in
Figure 5, the relationship between UPV and the compressive strength of the mixed mortar is presented, with an R
2 value of 0.98 for the 28-day compressive strength. It should be noted that the trend lines for other time points in the figure are only intended to illustrate the overall data variation trend and have not been subject to formal regression modeling or statistical validation.
3.3. Heat of Hydration
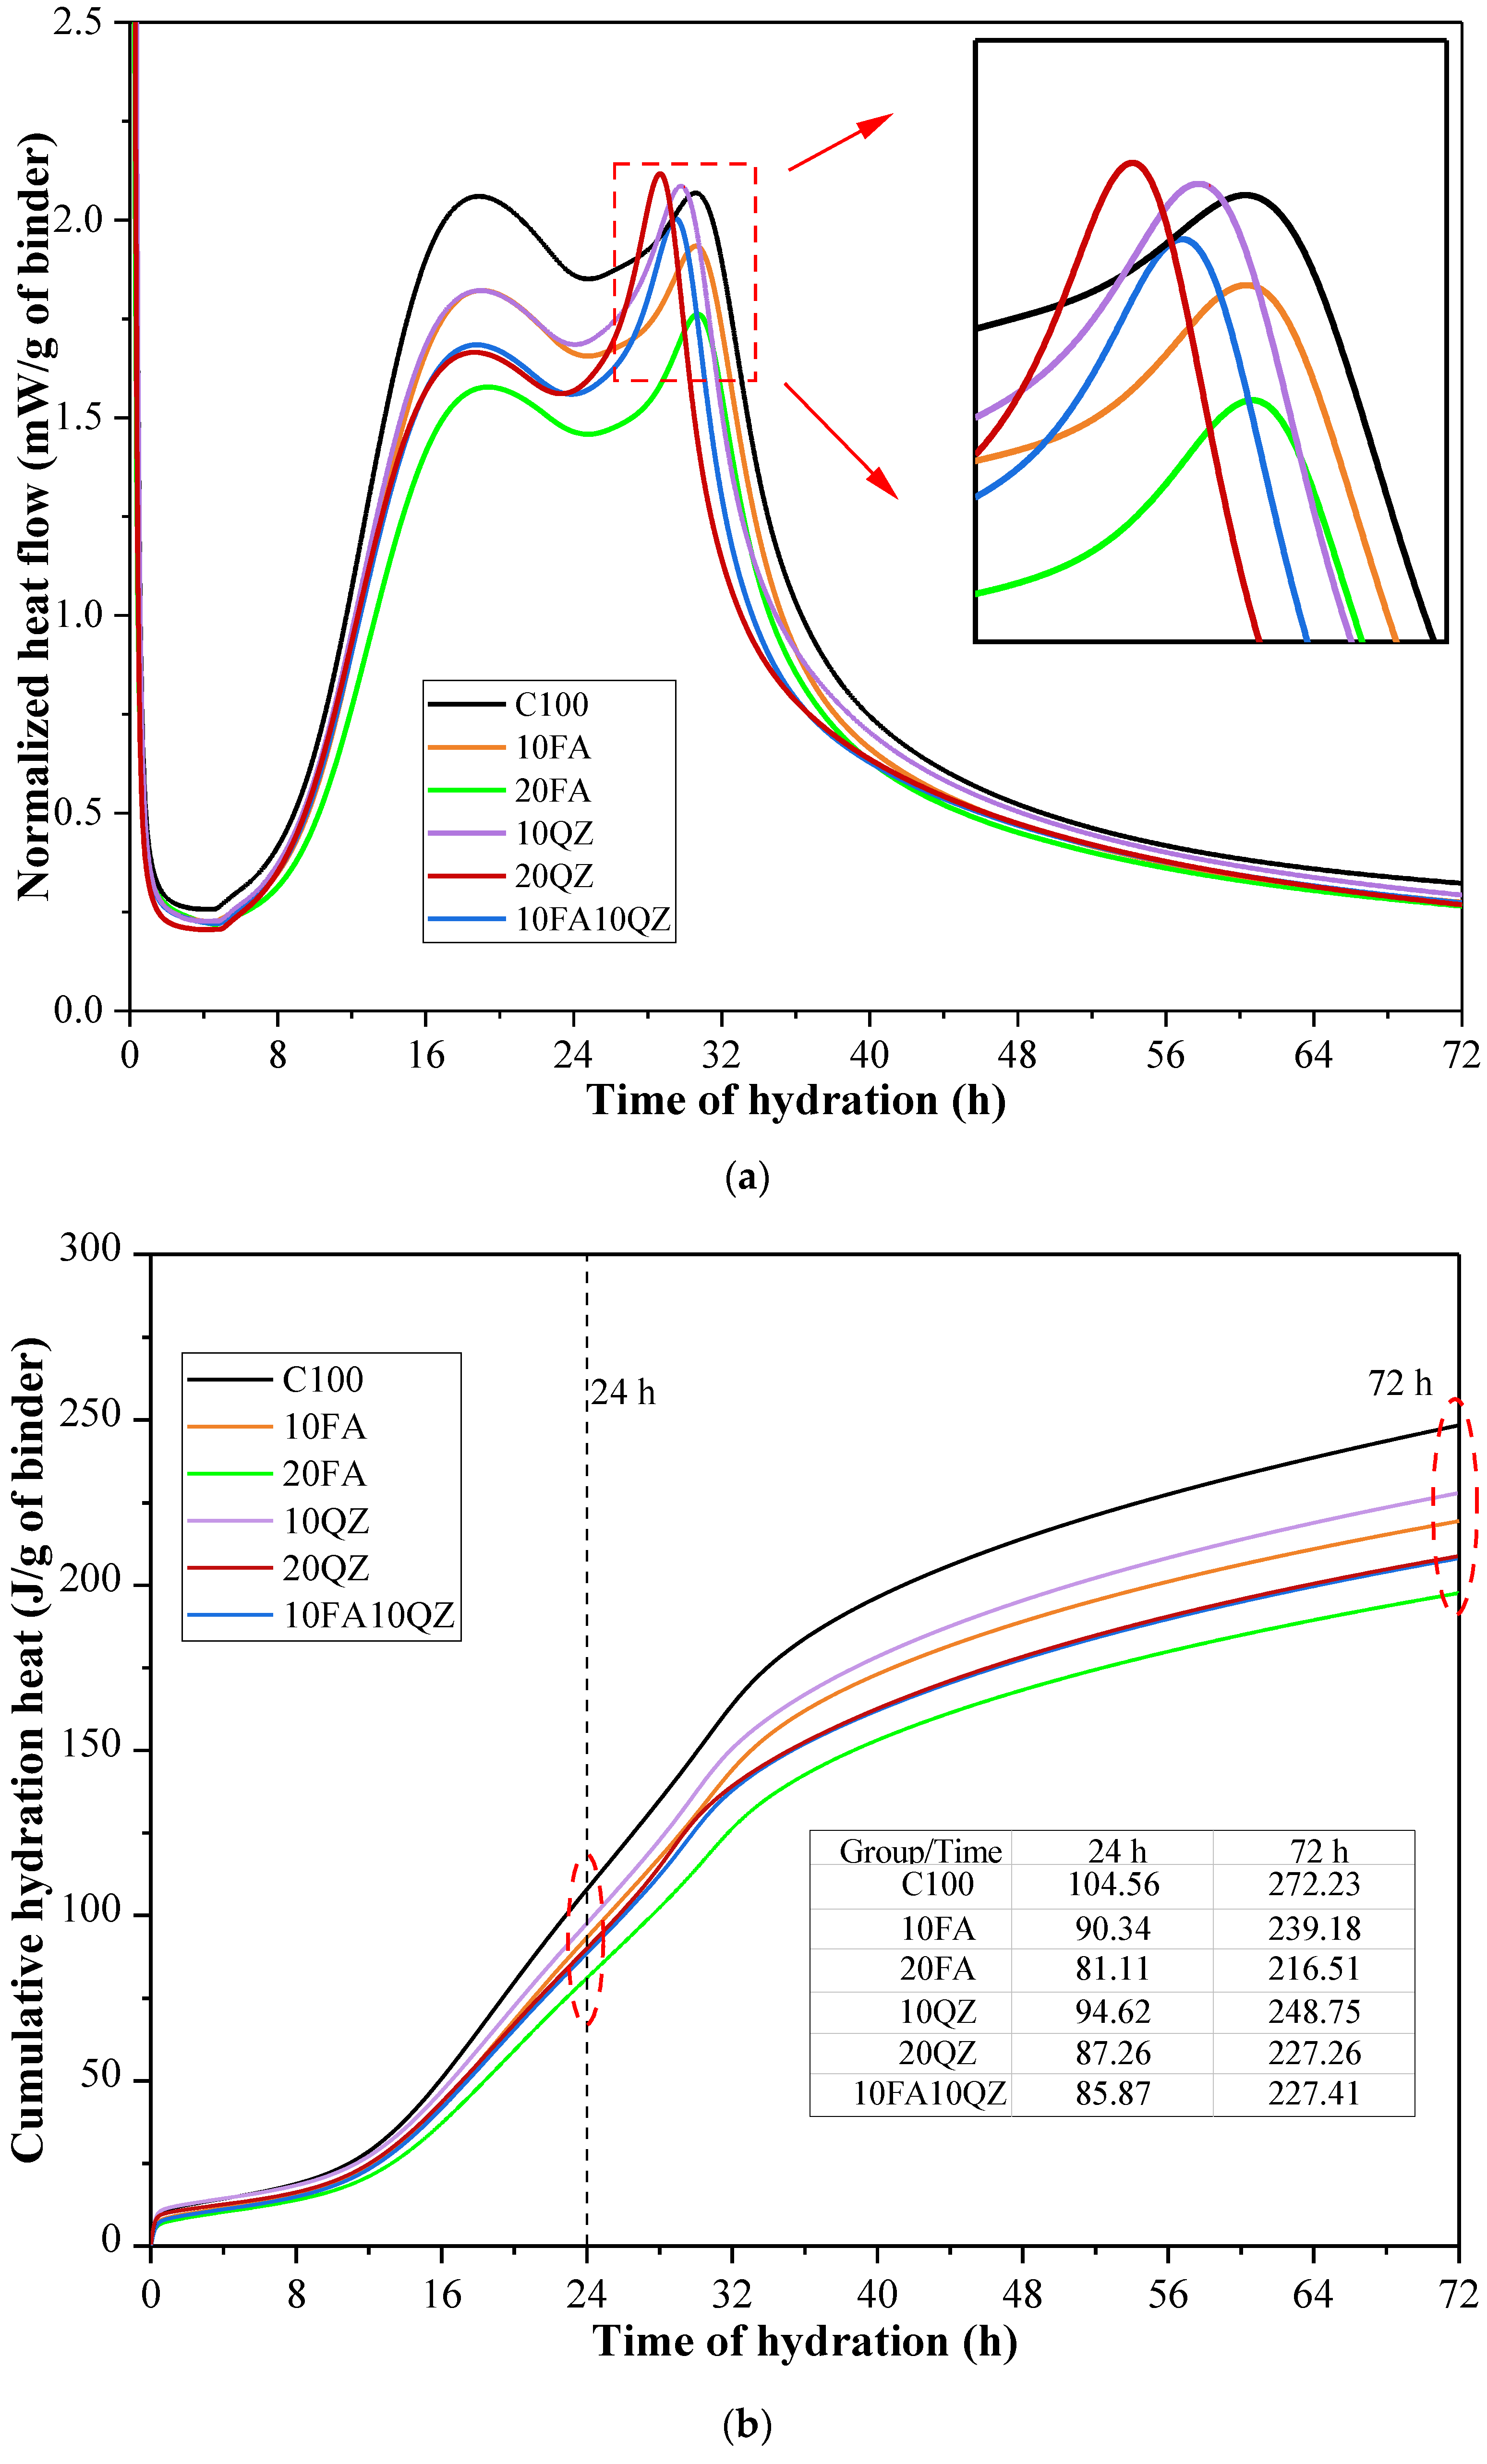
Figure 6a shows the heat flow curve of the hydration heat of the paste sample over 3 days. The exothermic curve exhibits two peaks in the acceleration stage: the first peak is attributed to the rapid dissolution and hydration of C
3S [
44], during which the reaction mainly produces C-S-H and CH. The second exothermic peak is attributed to the reaction of the C
3A hydration products with gypsum to form ettringite (AFt) [
44,
45].
An analysis of
Figure 6a shows that as more QZ is added, the time when the second heat flow peak appears gradually advances [
30,
46,
47]. This is because the physical effects of QZ (nucleation effect and dilution effect) accelerate cement hydration [
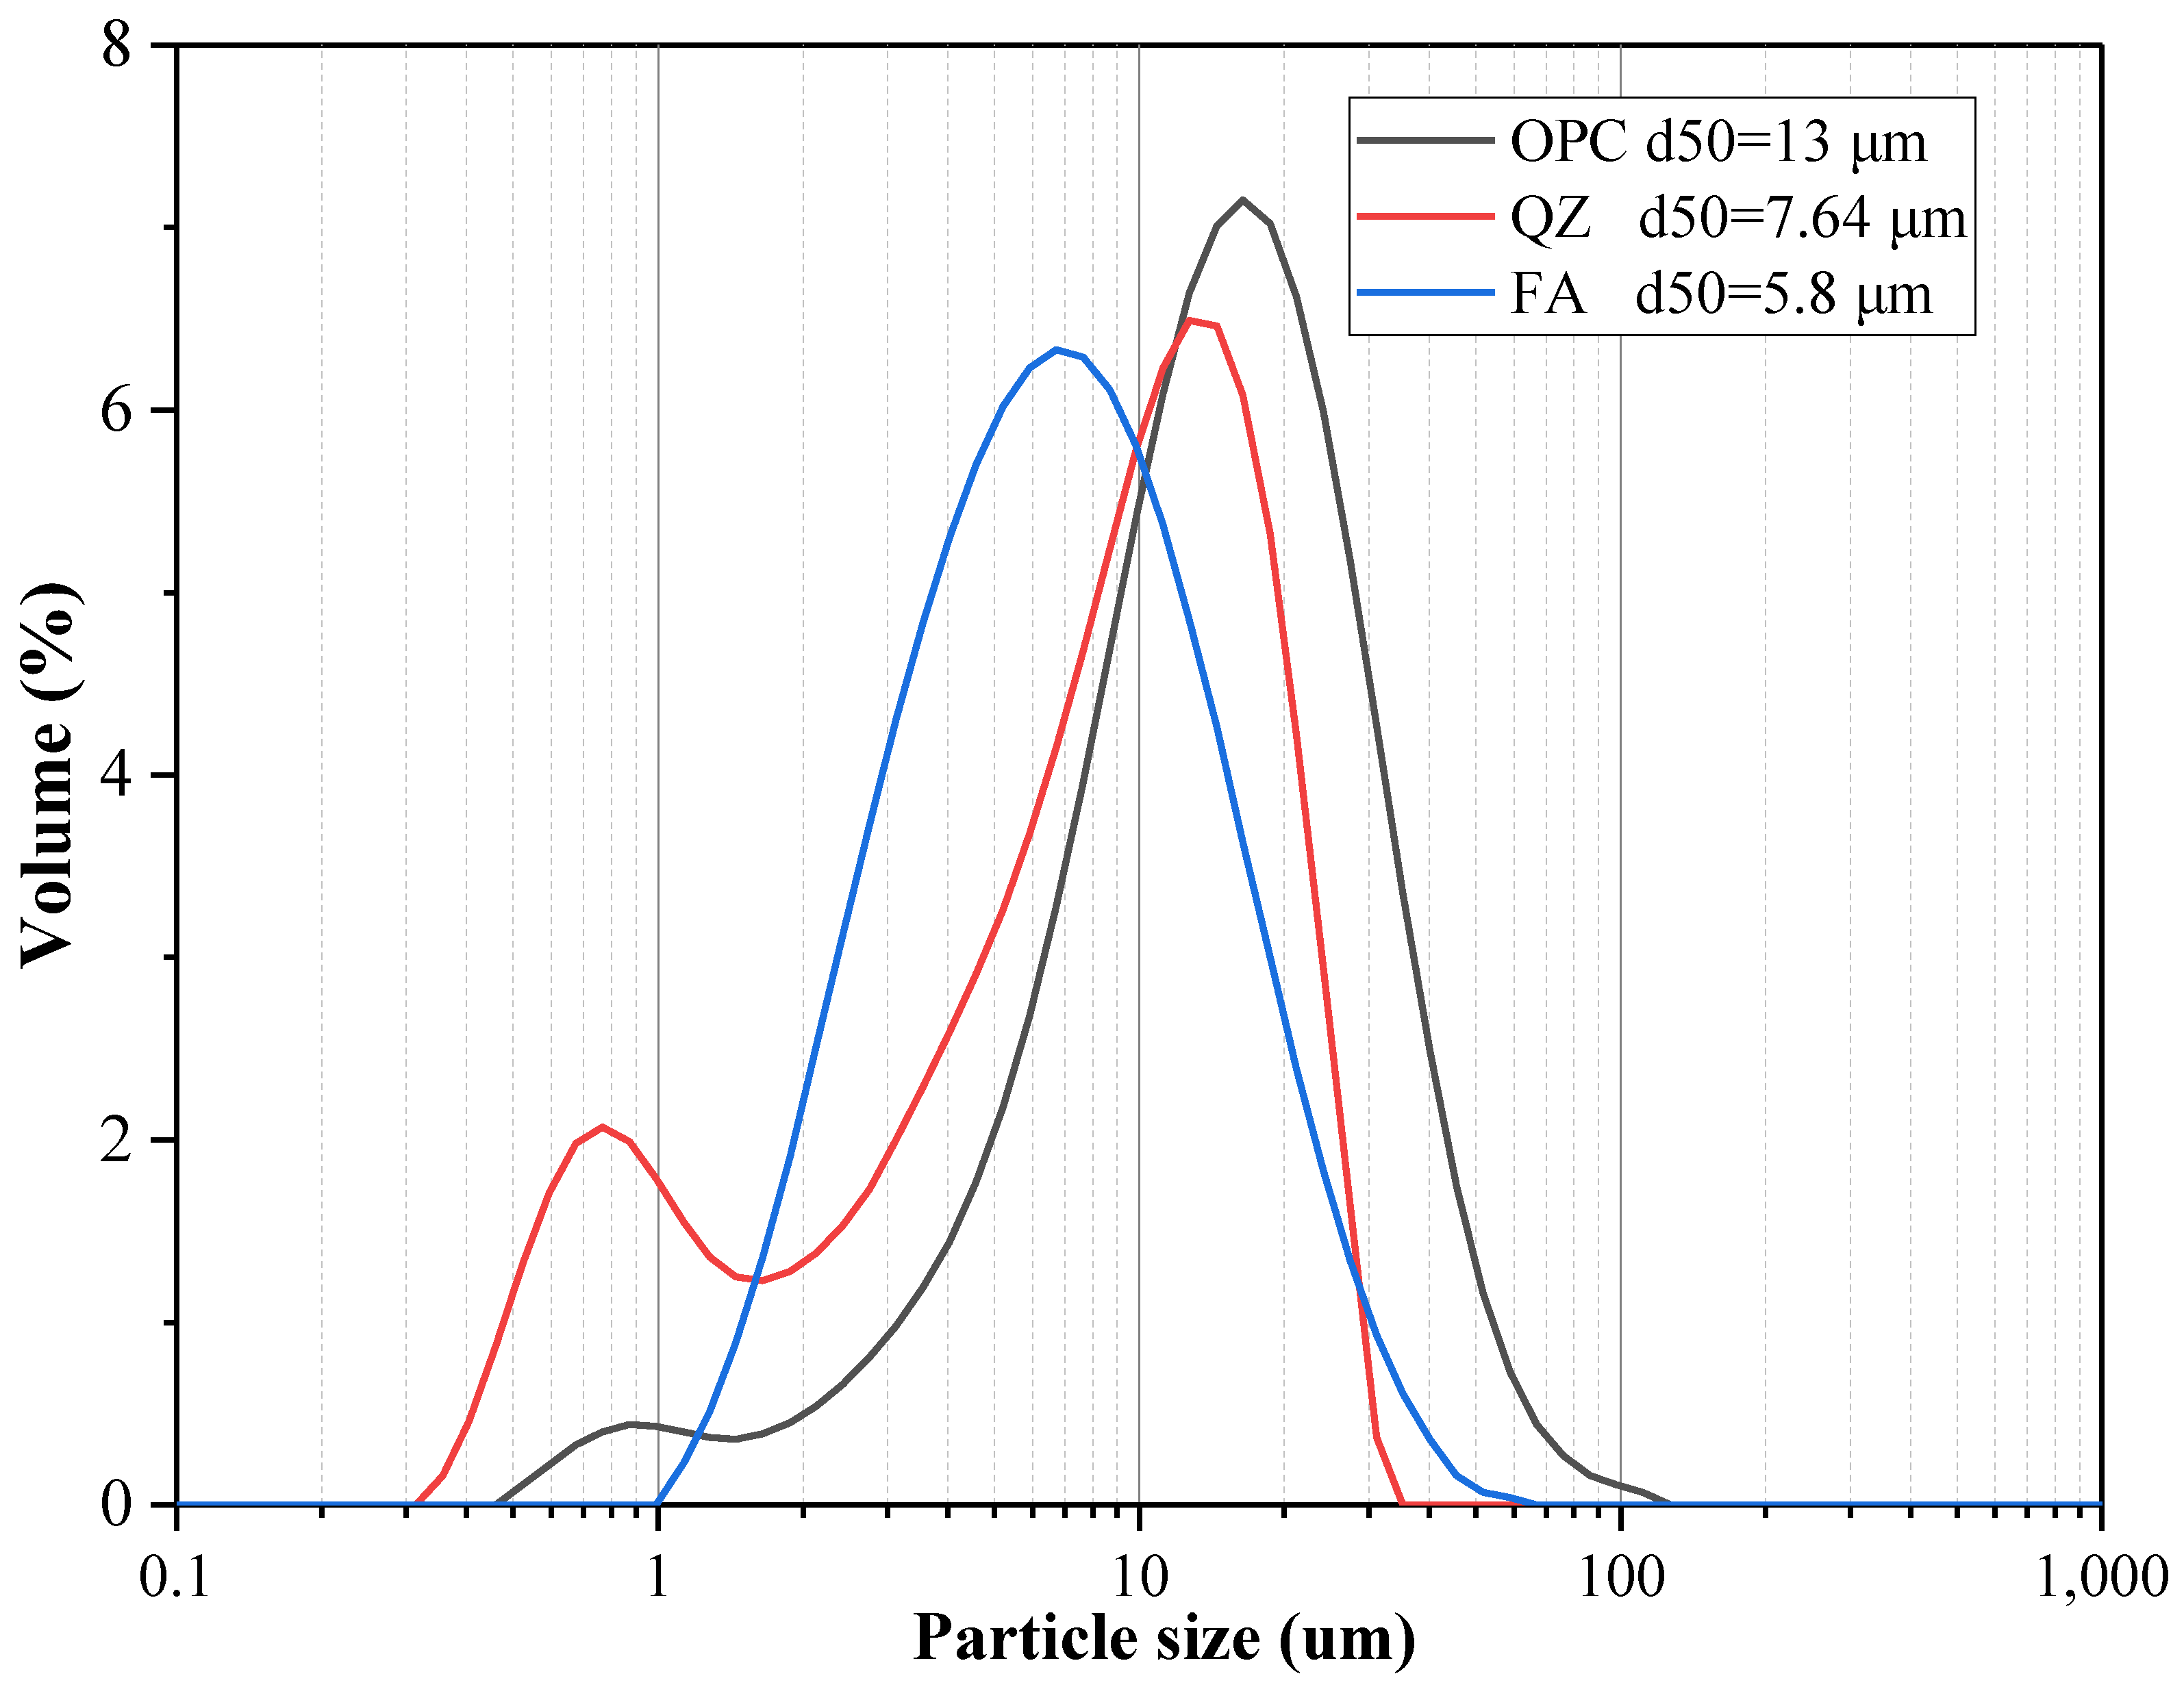
34]. In this experiment, QZ particles smaller than 1 μm are present. It is possible that QZ particles in the range of 0 to 1 μm act as nucleation sites to accelerate hydration. Some scholars believe that nucleation is more evident in finer QZ [
40,
48].
Figure 6b shows the experimental results of the cumulative hydration heat, revealing that as the QZ and FA content increases, the cumulative hydration heat decreases. This is primarily due to the reduction in cement content. Additionally, the low reactivity of SCMs reduces the cumulative hydration heat.
Figure 6b also shows that when the amount of the mixture is the same, the cumulative hydration heat for 3 days of the sample with QZ addition is significantly higher than that of the sample with FA addition. This is because QZ accelerates the hydration reaction of cement through a more substantial physical effect, thereby generating more heat. The 3-day cumulative hydration heat of the 10FA10QZ group was almost the same as that of the 20QZ group. This indicates that the accelerating effect of QZ is limited and will not continue to increase with the increase in QZ content.
During the cement’s dissolution and hydration reaction, heat is released, and the hydration products produced are the main reason for the increase in compressive strength [
44].
Figure 6c shows the experimental results of compressive strength and cumulative hydration heat of mortar after 1 day and 3 days. The results show that the compressive strength and the cumulative hydration heat have an excellent linear relationship, with R
2 = 0.988. It should be noted that this linear relationship is based on the fitting of experimental data and primarily applies to early-age strength development (1 to 3 days). This is similar to the results obtained by other researchers [
44].
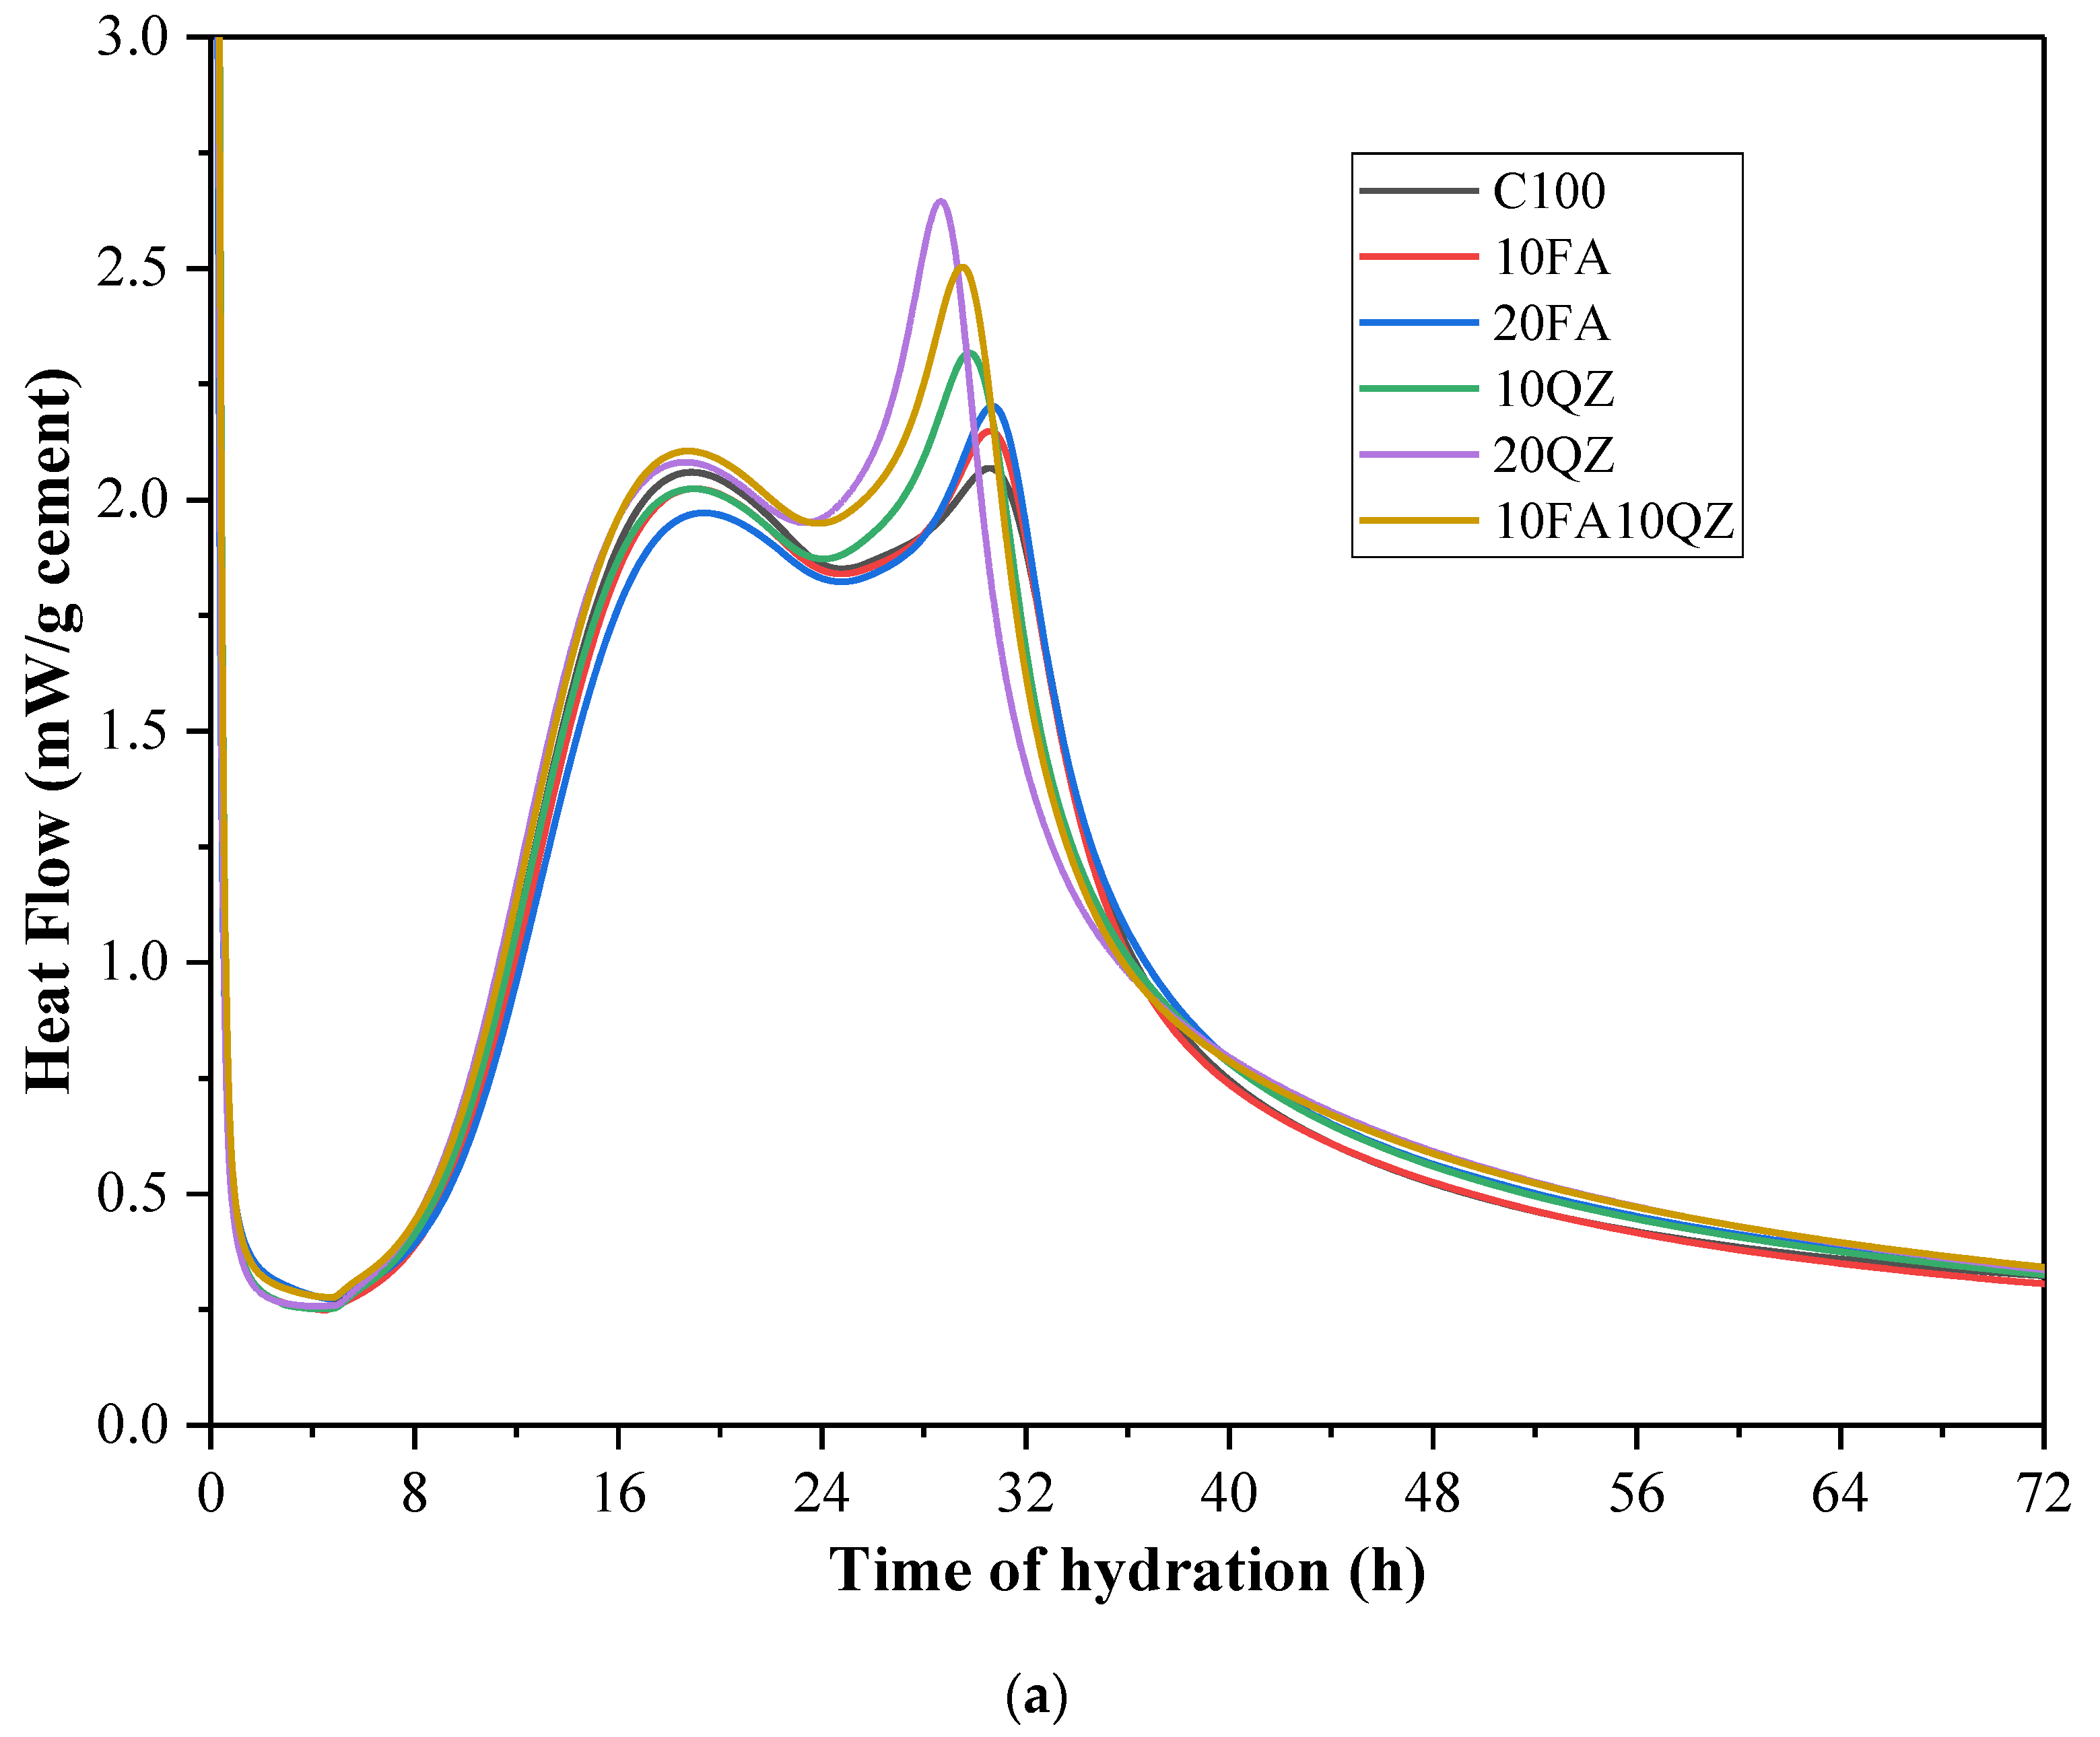
Figure 7a,b show the heat flow and cumulative hydration heat curves after normalizing cement mass fraction, respectively. Among these results, the cement mass fraction of sample C100 is 100%; the cement mass fraction of samples 10FA and 10QZ is 90%; and the cement mass fraction of samples 20FA, 20QZ, and 10FA10QZ is 80%. By studying
Figure 7a, it can be observed that the C
3A hydration heat peak of the sample with QZ added is higher than that of the control. According to previous studies, QZ hardly undergoes chemical reactions [
22]. Therefore, this can be attributed to the nucleation and filling effects of QZ, which enhance the hydration reaction of cement. Specifically, QZ particles act as nucleation sites, promoting the formation of AFt. The reaction equation is shown in Equation (3):
The AFt generated by the reaction can stick to the tiny QZ particles, thus accelerating its formation. Additionally, from the FTIR experimental results of the 1-day sample in
Section 3.7, the group with added QZ showed stronger Al-OH absorption peaks at 1 day, indicating more AFt formation.
Figure 8a,b show the sample’s peak value of hydration heat flow and the corresponding peak data, respectively. The figures show that after part of the cement is replaced by FA, the arrival time of the first and the second peaks is delayed, and the peak intensity is reduced. This may be because FA reduces the hydration rate [
34]. Unlike FA, when QZ replaces part of cement, it mainly affects the second peak, making the peak appear earlier and the peak intensity higher. This may be because QZ can enhance the hydration reaction of cement through the nucleation effect.
3.4. X-Ray Diffraction Analysis
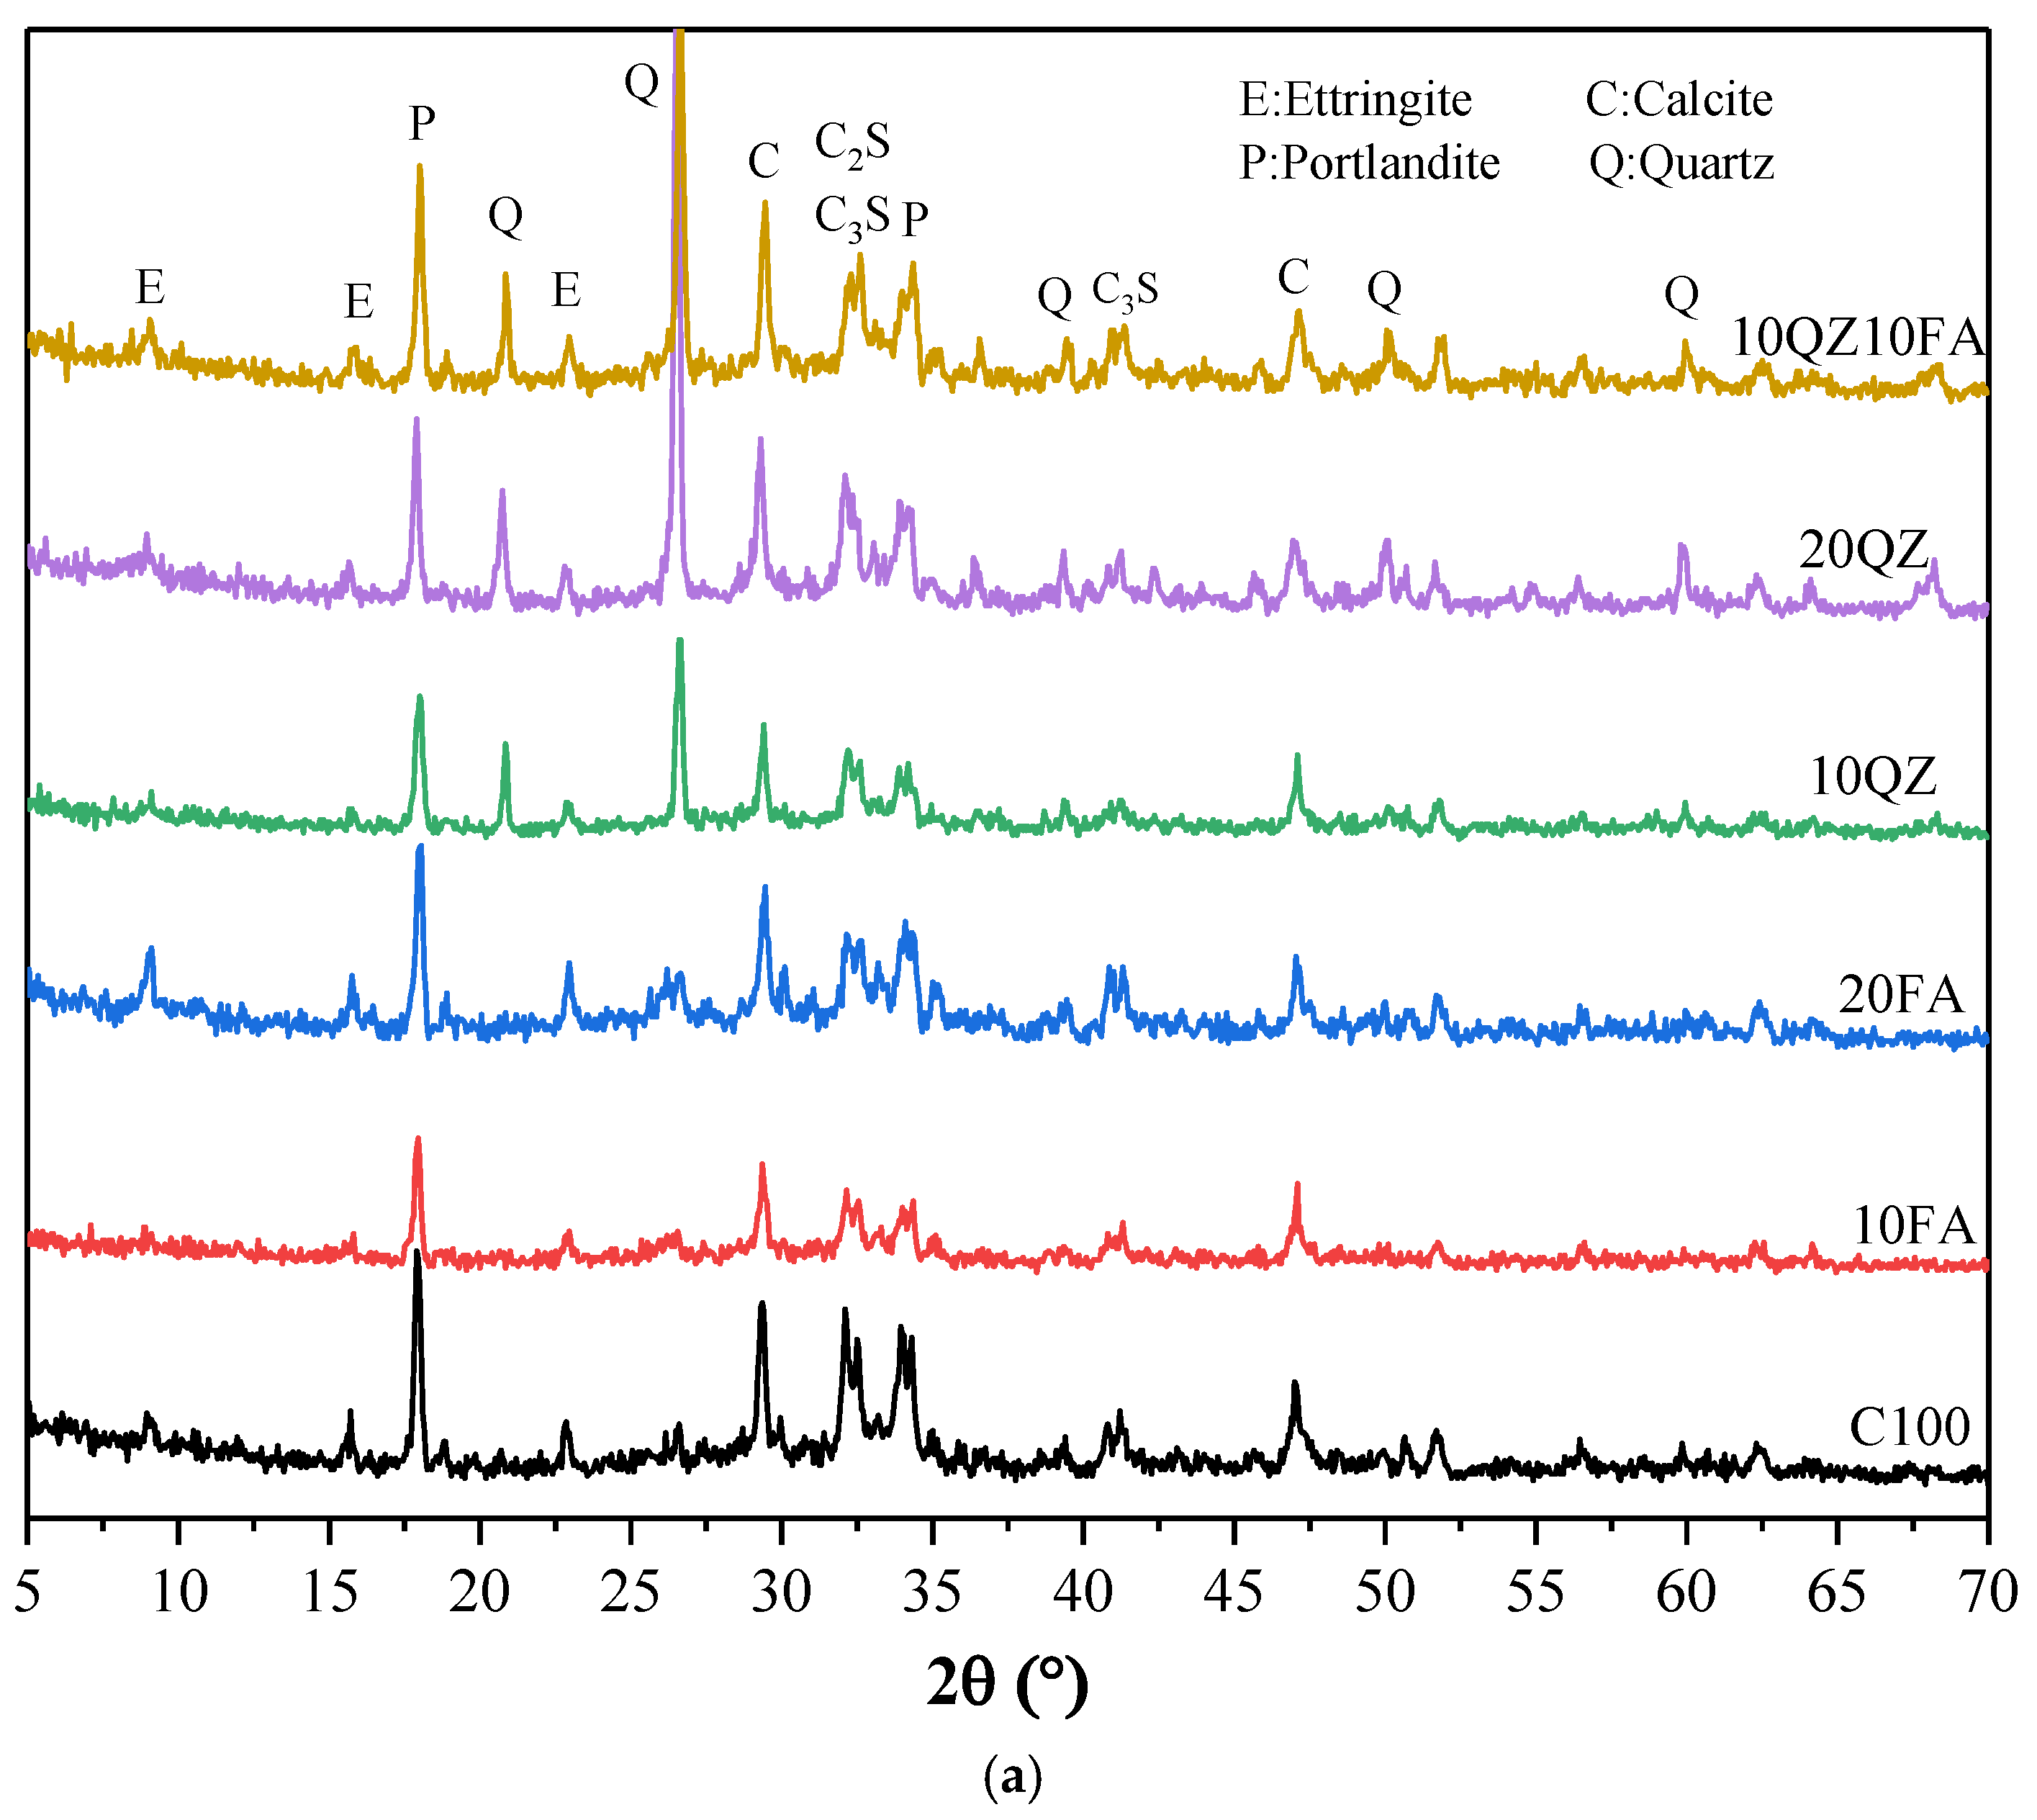
Figure 9a shows the XRD test results of all samples on Day 1. The figure indicates that the main products of the cement’s hydration reaction are AFt, Portlandite, and Monocarboaluminate. Additionally, calcium carbonate was detected from the limestone in the cement used.
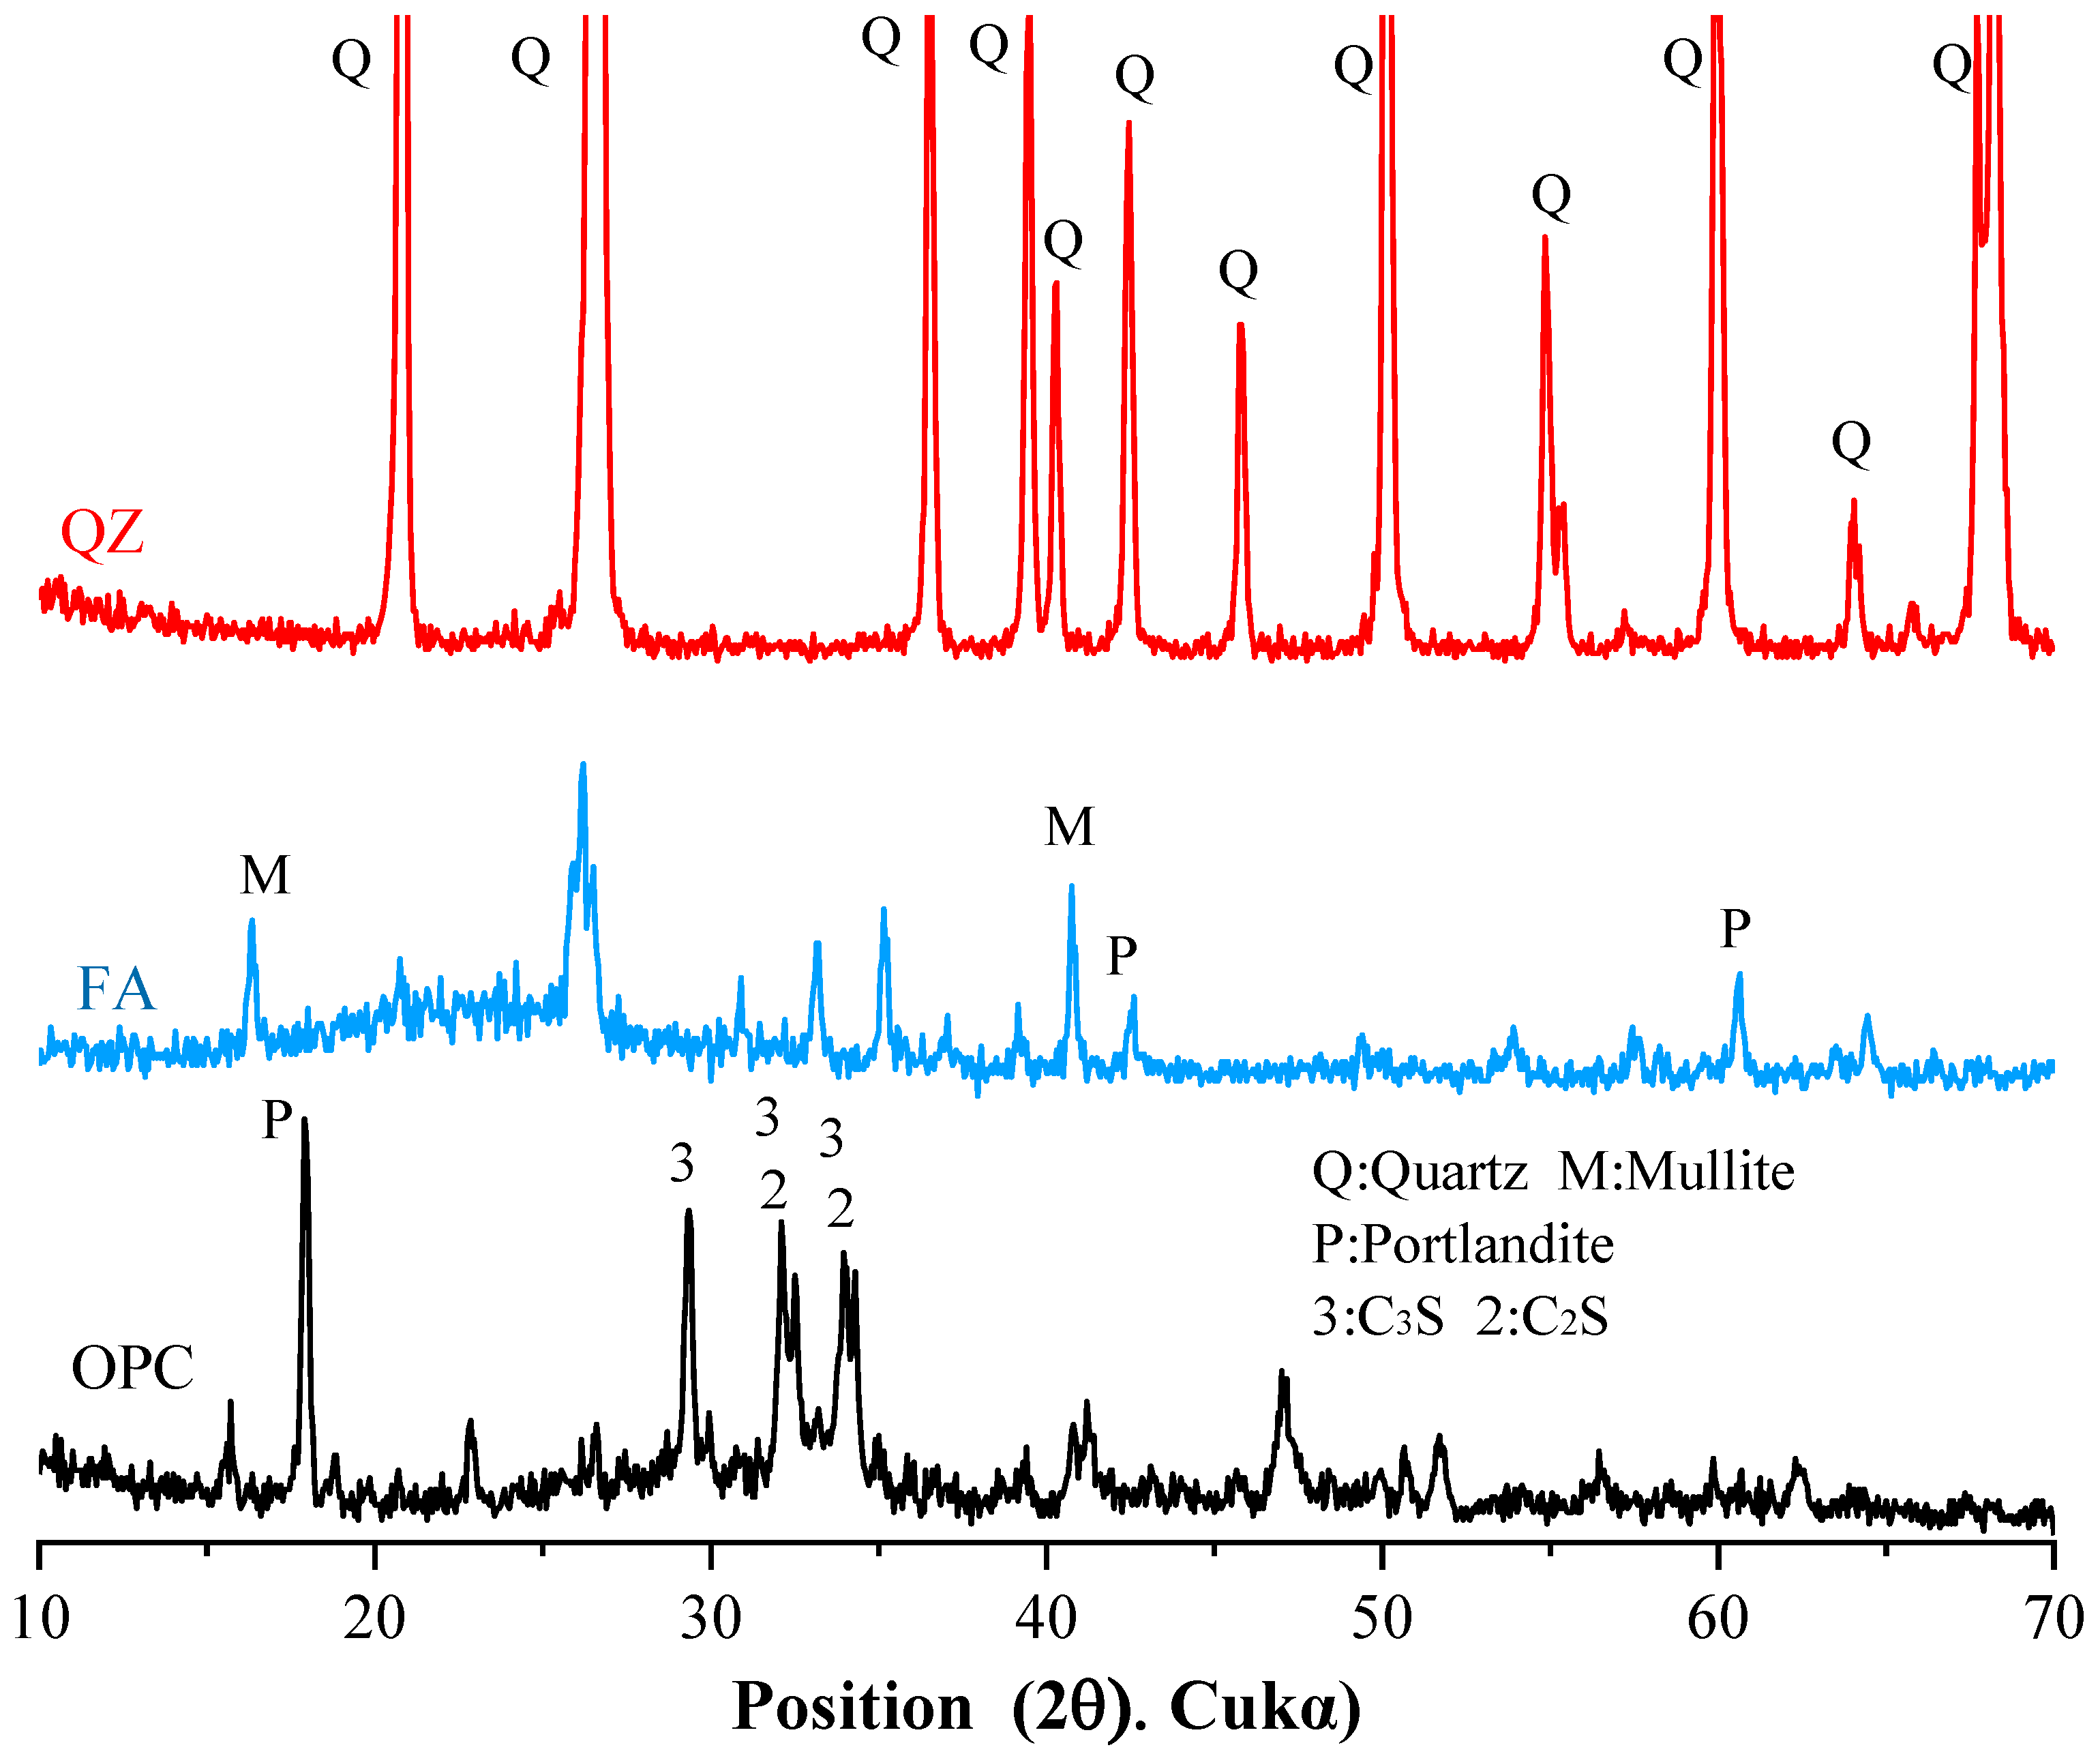
Figure 9a shows that the quartz peak is pronounced with the addition of the QZ component. By comparing the XRD spectrum of the raw material QZ, it can be determined that these quartz peaks originate from QZ. In addition, the figures show the peaks of C
3S and C
2S. This is because the hydration reaction is still incomplete, and the mixture still contains unreacted C
3S and C
2S. A comparison of XRD patterns of the various samples in the figure shows that except for the quartz peak of the added QZ component, which is apparent, the types of other reaction products are similar. This indicates that the addition of FA and QZ only changes the content of hydration products but does not change the type of hydration products.
Figure 9b shows the XRD test results of all samples after 28 days. Comparing
Figure 9a,b shows that the peak value of AFt decreases from 1 day to 28 days because AFt is converted into a more stable AFm. In addition, the peak values of C
3S and C
2S decreased because after 28 days of hydration, the C
3S and C
2S in the reactants were consumed, and other hydration products were generated. The figure also shows that the intensity of the quartz peak has no noticeable change, which indicates that QZ is an inert material and has difficulty chemically reacting with cement components. Finally, as the curing time increased from 1 day to 28 days, the diffraction peak of monoaluminate was observed, while the peak intensity of calcium carbonate weakened, indicating that calcium carbonate was consumed. This is because the calcium carbonate in the mixture reacted with aluminate to form monoaluminate [
49]; the reaction equation is shown in Equation (4):
where
is portlandite,
is calcium carbonate,
is water, and
is the aluminum phase in cement.
3.5. FTIR
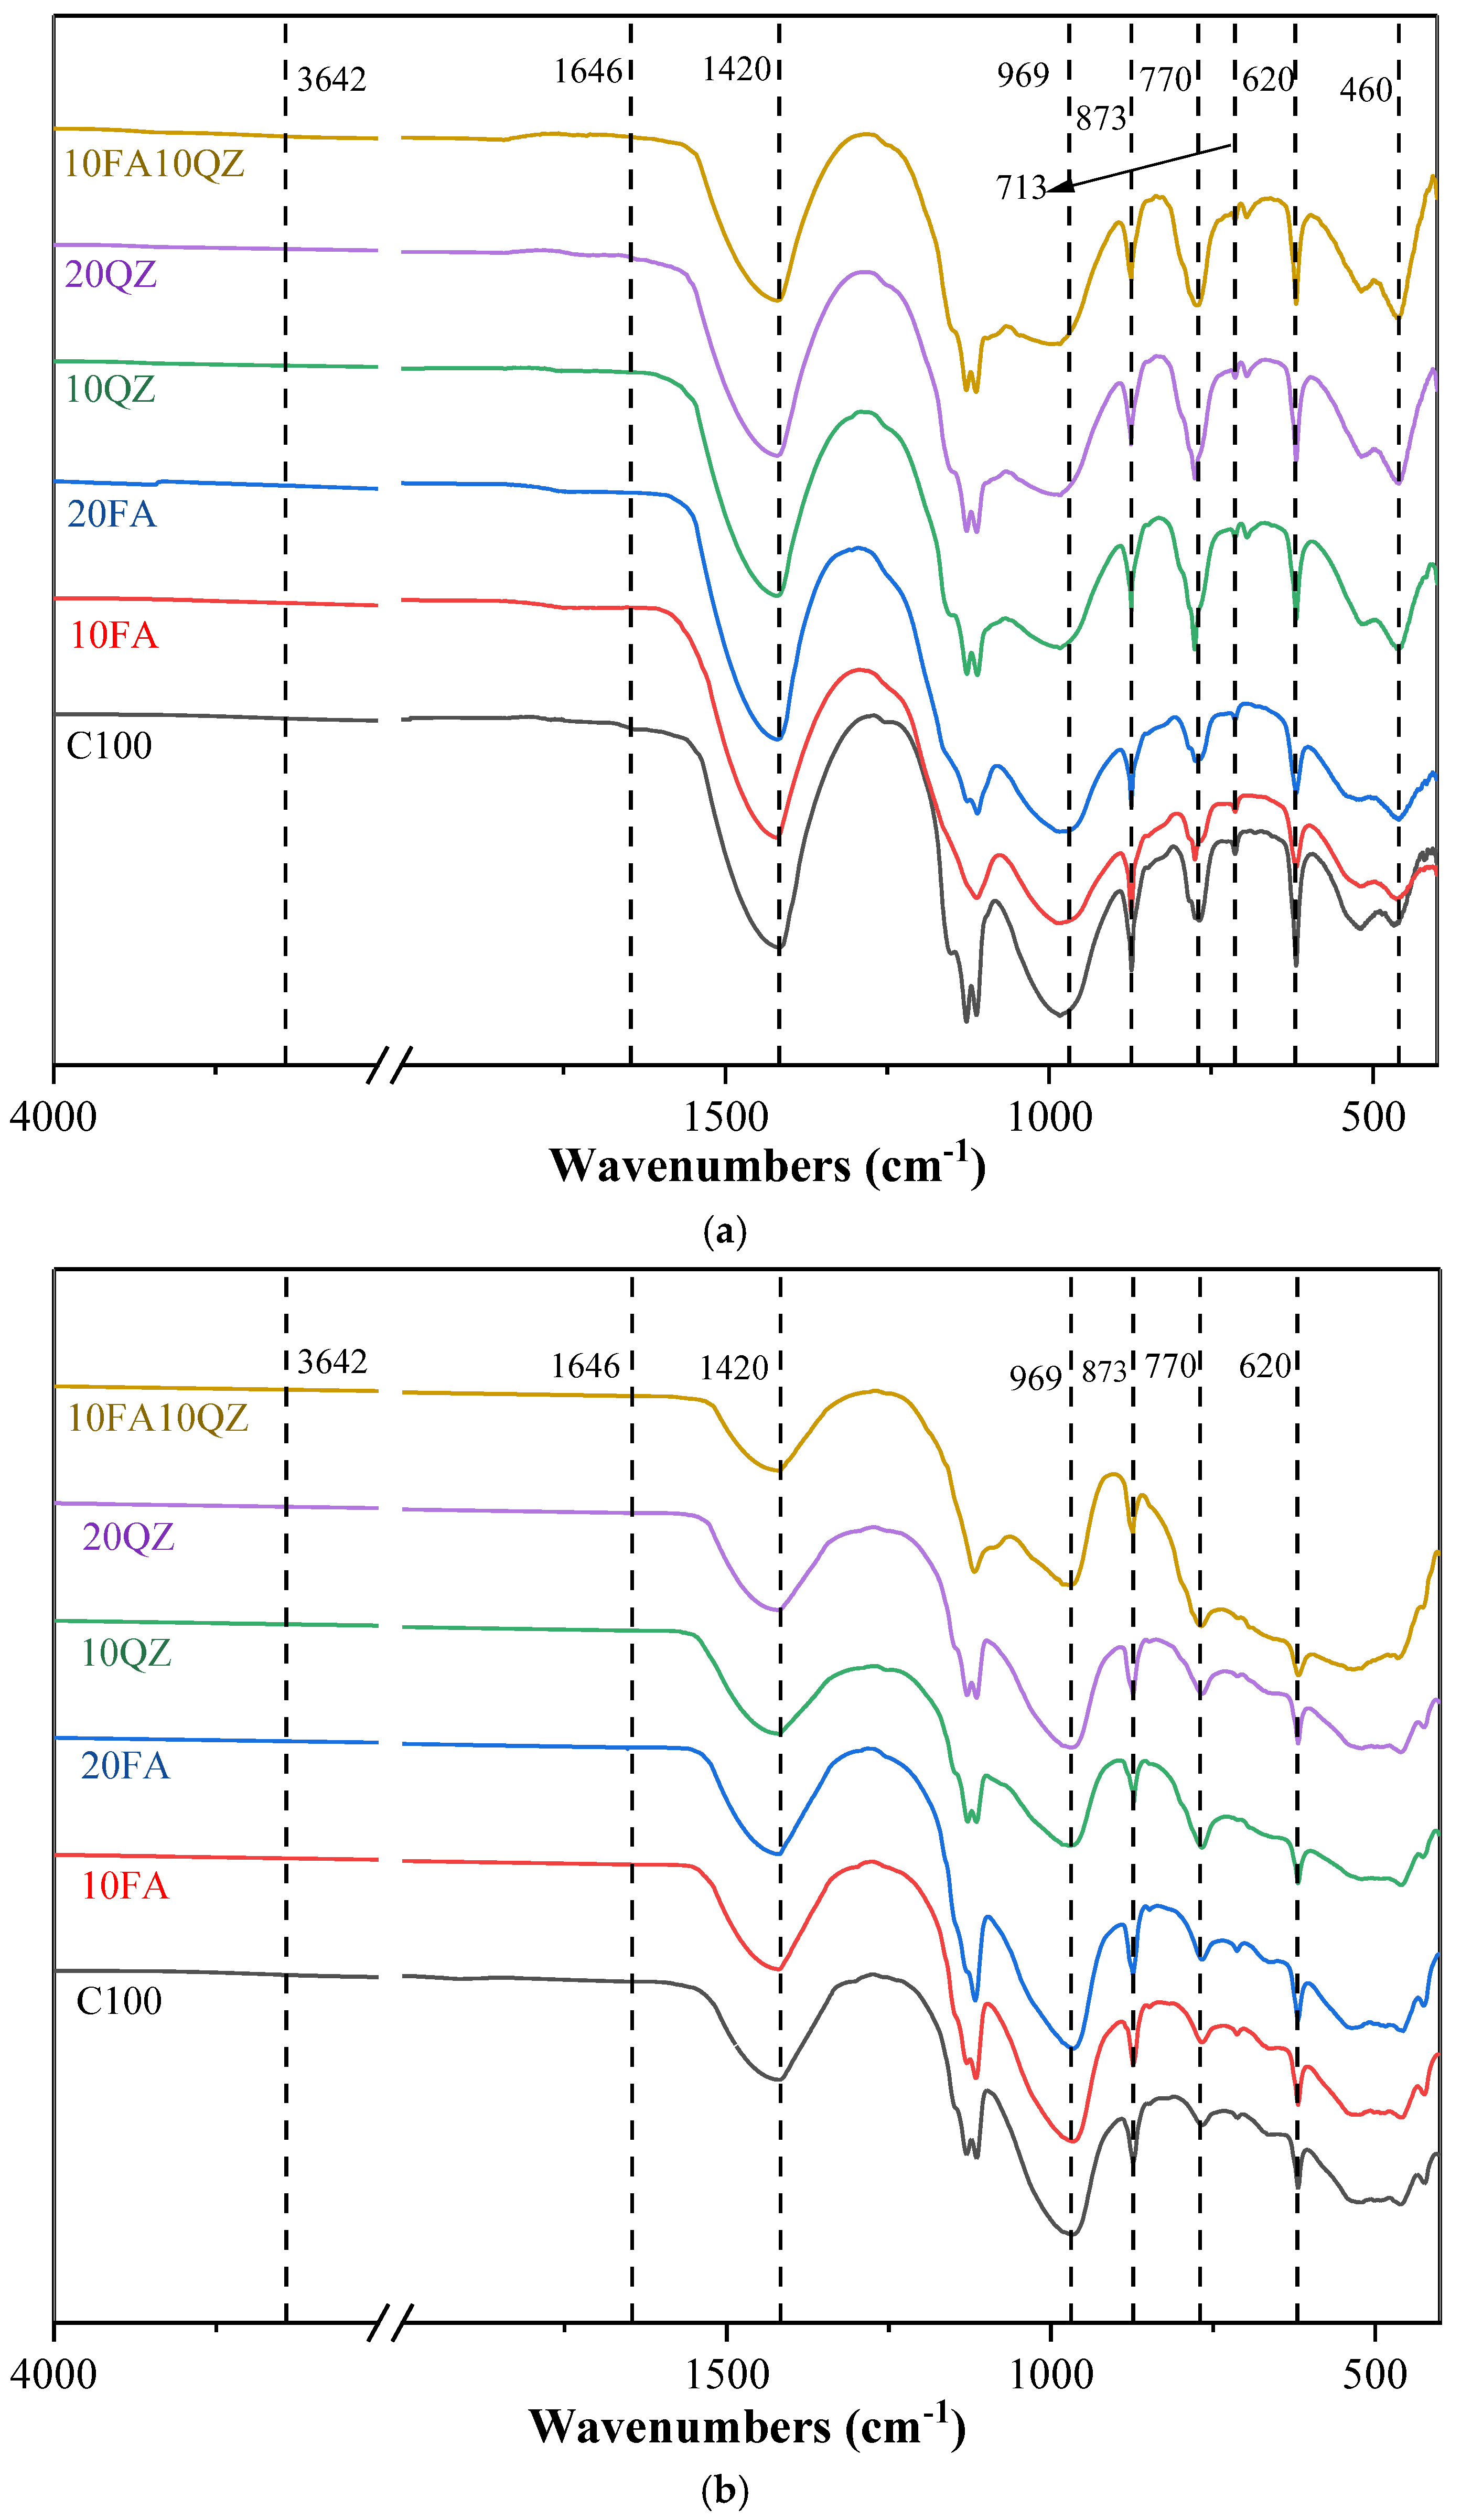
Figure 10a,b show the FTIR spectra of all cement paste samples at 1 day and 28 days of age, respectively. The absorption peaks around 3640 cm
−1 and 1650 cm
−1 in the high wavenumber region are caused by the asymmetric stretching vibration of the H-O bond in free water [
50]. The absorption peak caused by the asymmetric stretching vibration of the C-O bond (CO
32−) is observed around 1420 cm
−1. The absorption peaks at 873 and 713 cm
−1 are attributed to the bending vibration of CO
32− [
51]. The absorption peak in the wavenumber range of 997–937 cm
−1 corresponds to the stretching vibration of the Si-O chemical bond in C-S-H [
52]. The absorption peak at around 770 cm
−1 corresponds to the bending vibration of the Al-OH chemical bond [
53]. The absorption peaks around 620 cm
−1 and 470 cm
−1 correspond to the Si-O asymmetric stretching vibration of QZ [
52]. The absorption peak at around 420 cm
−1 corresponds to the asymmetric stretching vibration of the Ca-O chemical bond [
52].
Study
Figure 10a found that as the QZ and FA content increased, the intensity of the C-O absorption peak decreased. This is because the absorption peak of C-O in the sample mainly originates from the limestone added to the cement, while QZ and FA do not contain limestone. Additionally, by comparing
Figure 10a,b, it is observed that the intensity of the C-O bond absorption peak decreases significantly as the curing time increases from 1 day to 28 days. This is attributed to the reaction of calcium carbonate in the cement mixture with aluminate, which consumes calcium carbonate. This trend is similar to that observed in the XRD pattern.
For samples with a curing time of 1 day, the intensity of the Si-O bond absorption peak in C-S-H at 969 cm−1 decreases with the increase in QZ and FA substitution. This is because the cement is replaced by QZ and FA, which reduces the content of early hydration products and decreases the absorption peak intensity of the Si-O chemical bond in hydrated calcium silicate. As the curing age increases from 1 day to 28 days, the intensity of the asymmetric stretching vibration peak of Si-O in the FA group rises, indicating that as the secondary hydration of FA proceeds, additional hydration products such as C-S-H are produced. Moreover, the bending vibration of the Al-OH chemical bond was observed at around 770 cm−1. When the hydration process lasted for 1 day, the crystalline hydration products of C3A in the sample reacted with gypsum to generate AFt; hence, a large amount of Al-OH chemical bonds was detected. The peak intensity of the group with QZ added here is more significant. This is because QZ can provide additional nucleation points for AFt, promoting the generation of AFt. This is also reflected in the hydration heat flow curve. As the QZ content increases, the exothermic peak of AFt generation also increases.
3.6. Thermogravimetric
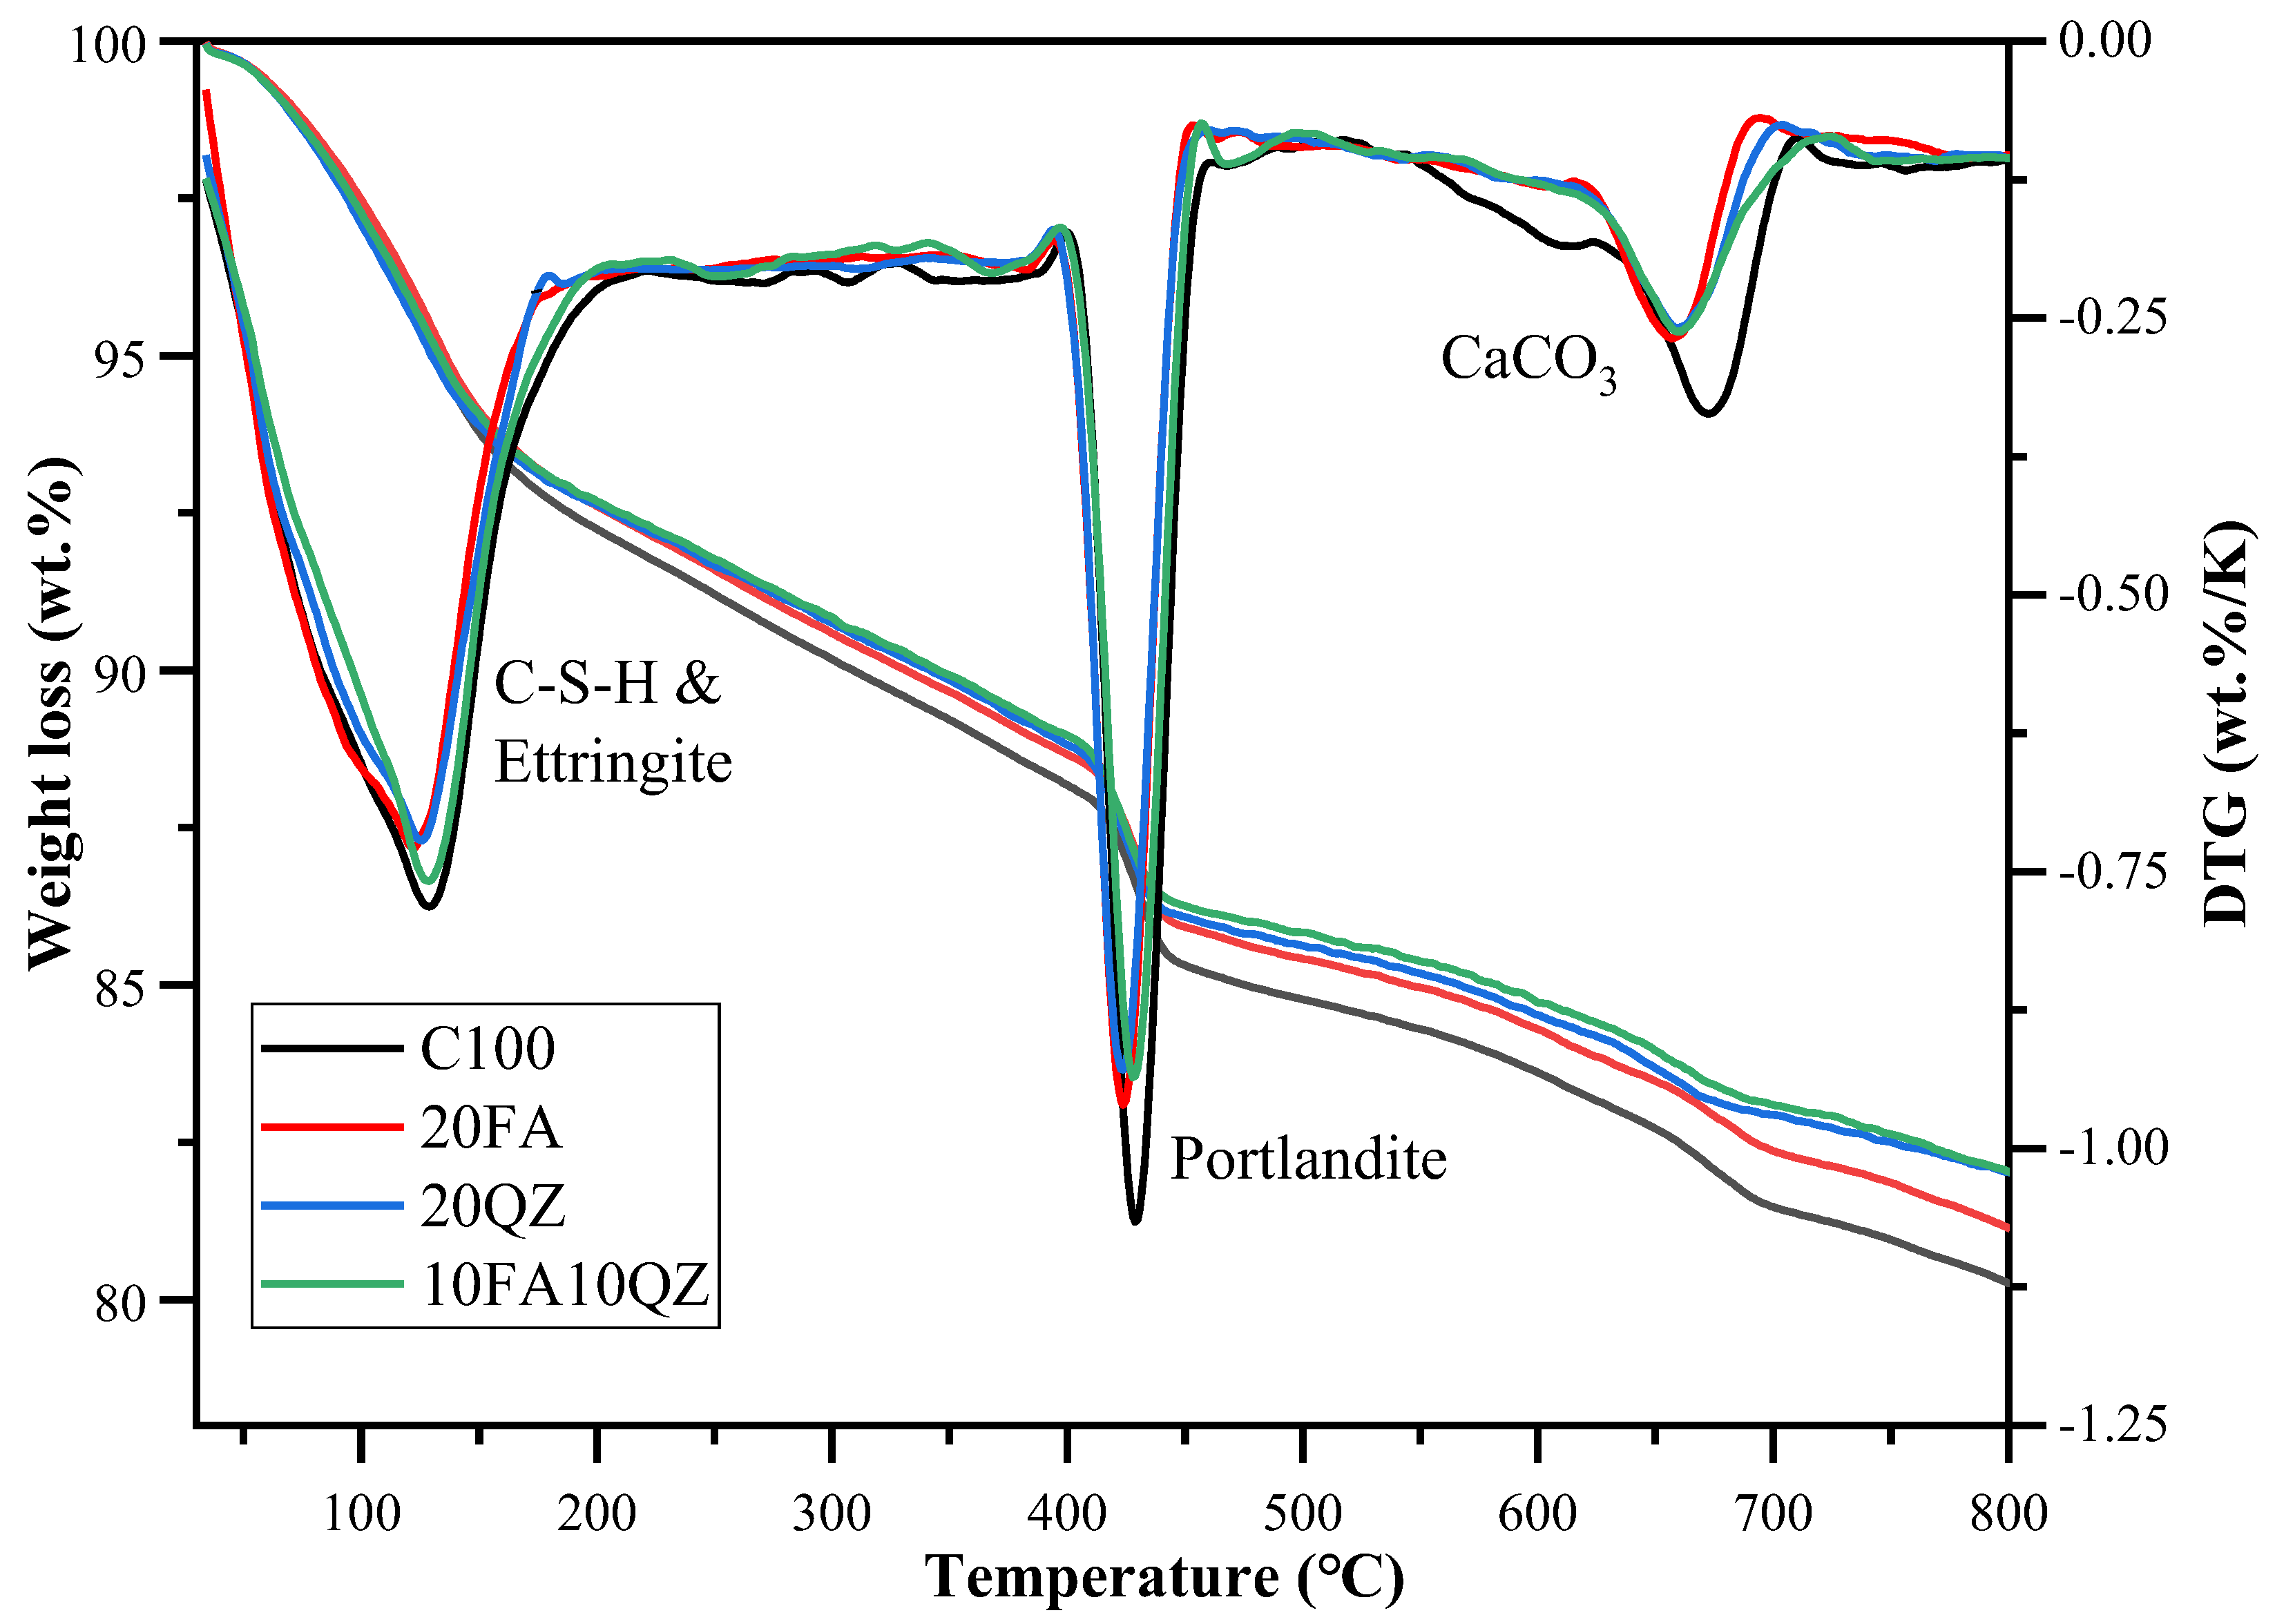
Figure 11 shows the TG and DTG curves of the paste samples of C100, 20FA, 20QZ, and 10FA10QZ at 28 days. The mass loss of these samples mainly occurred at three temperature stages: 1. The low-temperature peak (120–300 °C) is due to the dehydration of C-S-H and AFt. 2. The medium-temperature peak (400–500 °C) is related to the decomposition of CH. 3. The high-temperature peak (500–800 °C) is related to the decomposition of calcium carbonate [
44]. The percentage of chemically bound water and CH was calculated based on the weight loss data.
In the first stage, the mass loss is caused by the dehydration of C-S-H and AFt in the sample. When QZ is used to replace cement, the intensity of the dehydration peak decreases, mainly due to the reduction in OPC content and hydration products. It was further found that when FA is used to replace cement, the decomposition mass increases at this temperature, indicating that the secondary hydration reaction of FA produces additional hydration products.
In the second stage, mass loss is caused by CH decomposition. The content of CH in the paste was determined using Weerdt [
54] and the formula in Equation (5):
where
,
and
are the sample masses at 400, 500, and 550 °C, respectively.
Table 3 shows the calculated mass percentage of CH in the paste samples at 28 days. According to the results, as SCMs are added, the mass fraction of CH gradually decreases, which is also confirmed by the XRD experiment. This is because the hydration product of C
3S and C
2S in OPC is CH, and the content of C
3S and C
2S decreases after OPC is replaced. In addition, CH and FA will undergo a secondary hydration reaction, which will also consume a portion of CH, thus reducing the CH content in the 20FA and 10FA10QZ groups.
The third stage is the mass loss peak caused by the decomposition of calcium carbonate. The decomposition peak appearing here mainly originates from the limestone in the cement. The decomposition peak of calcium carbonate decreased significantly with the use of the two SCMs. This is because FA and QZ do not contain calcium carbonate, so the decomposition peak of calcium carbonate decreases as OPC is replaced.
Weerdt [
54] calculated the chemically bound water content in the paste samples using the method of Equation (6):
and
represent the mass measured by TGA at 40 and 550 °C, and
is the calculated chemically bound water content. The calculation results are shown in
Table 6. The bound water content is high to low in the order of C100, 20FA group, 10FA10QZ group, and 20QZ group. This is because the amount of OPC used in the experimental groups is the same, and the final content of chemically bound water will depend on the reactivity and reaction products of FA and QZ. The reactivity of QZ is much lower than that of FA, and it can only react with CH in cement to produce a small amount of C-S-H [
55]. For the FA group, because FA has pozzolanic activity, as the curing age increases, the number of secondary hydration products increases, and the final content of chemically bound water will also increase.
3.7. Microstructure
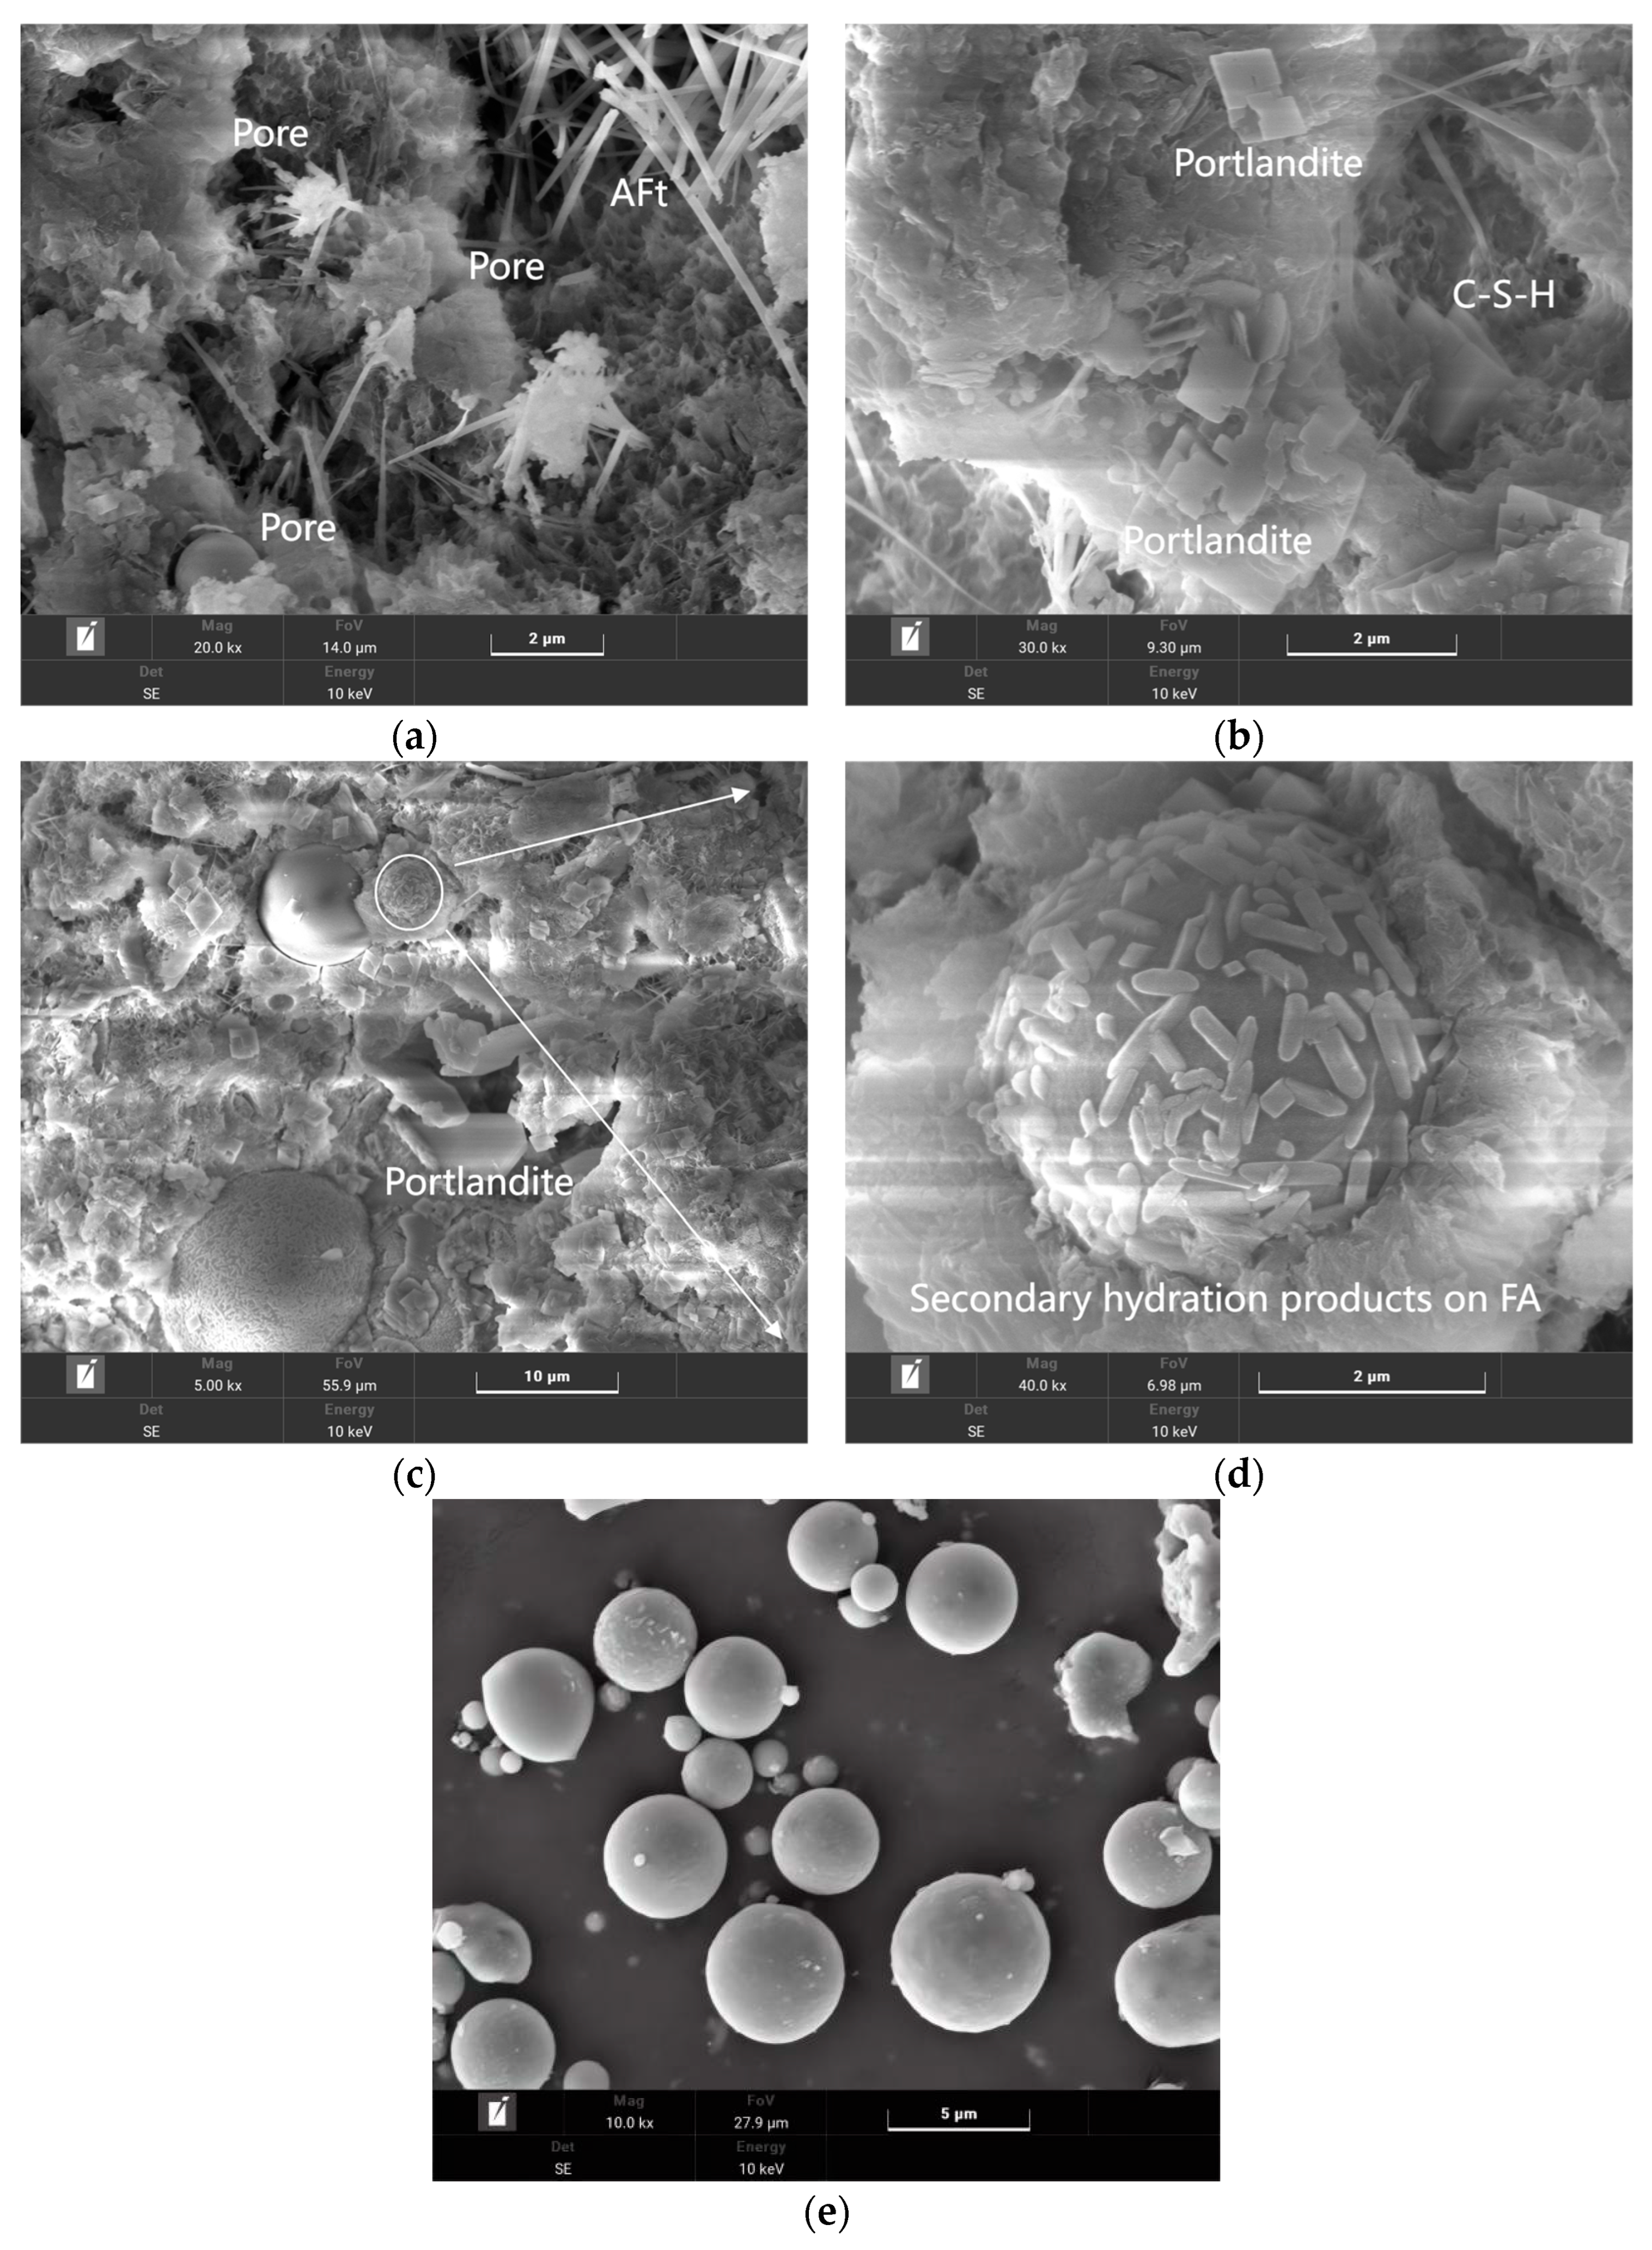
Figure 12 shows the SEM test results of the 28-day sample. In
Figure 12a, common hydration products such as needle-shaped AFt, lamellar CH, and granular C-S-H can be observed. These hydration products fill the pores inside the cement, promoting the development of strength. Comparing
Figure 12a,b, it is evident that the OPC group is denser than the QZ group. This is because in the late hydration stage, the hydration degree of QZ is low, and using QZ to replace cement will reduce the cement clinker, resulting in a decrease in hydration products, which makes the QZ group have more pores. This explains why the late-stage strength and UPV values of the QZ group are lower than those of the control group.
Figure 12c shows the group with FA content of 20% by weight of cement, and
Figure 12e shows the original appearance of FA. The spherical shape of FA acts as a ball bearing in cement, which can increase the fluidity of mortar. It can also be observed that its surface is smooth, which may result in the hydration products not being easily attached.
Figure 12d is a partially enlarged view of
Figure 12c. As the curing age increases to 28 days, the secondary hydration reaction of FA proceeds, and hydration products precipitate on the surface of FA particles. This increases the amount of hydration products and roughens the FA surface, improving the interface between FA and cement matrix.
3.8. CO2 Emissions Calculation
CO
2 is the main greenhouse gas that causes global warming, and reducing carbon emissions is one of the world’s most pressing issues today. Cement production results in significant CO
2 emissions, and using SCMs can reduce CO
2 emissions. Therefore, this study calculated and analyzed the CO
2 emissions and energy consumption for producing one cubic meter of mortar. The calculation only considered the CO
2 emissions under the mix ratio in this experiment, ignoring the CO
2 emissions generated during transportation and mixing.
Table 7 shows the material mass required to produce one cubic meter of experimental mortar,
Table 8 shows the carbon footprint and energy consumption per unit mass of raw materials used in this experiment [
6,
23,
56], and
Table 9 shows the calculation results of carbon emissions and energy consumption. Equation (5) limits the total volume of each concrete component (OPC, FA, QZ, sand, water) to 1 m
3 [
57]:
where
represents the raw material density,
is the raw material unit volume density (kg/m
3), n = 5, and
represents each component in the raw material mixture (OPC, FA, QZ, sand, water).
According to Equations (8) and (9):
The CO2 emissions and energy consumption per unit volume were calculated, where “CO2P” is the CO2 emissions per cubic meter of mortar and mi is the mass of each raw material per unit mass (tons) of mortar mix. “CO2” is the CO2 emission factor of the raw material (CO2kg/kg). “MJP” is the energy consumption of one cubic meter of mortar, and “MJ” is the energy release factor of the raw material (MJ/kg).
The results in
Table 9 show that with the addition of SCMs, the CO
2 emissions and energy consumption per unit volume of mortar have decreased significantly. The 20FA group had the most significant reduction in carbon emissions and energy consumption, 17.47% and 13.58%, respectively.
In actual engineering applications, while considering the reduction in CO
2 emissions, we should also consider the changes in cement mix proportions and the changes in cement product strength that will result. According to Equation (8) [
6], the 28-day compressive strength of each group of sample mortar is normalized to CO
2 emissions:
is the CO
2 emission per unit compressive strength of 28 days (kg·CO
2/MPa),
is the compressive strength of the mortar sample after 28 days of curing, and
is the calculated CO
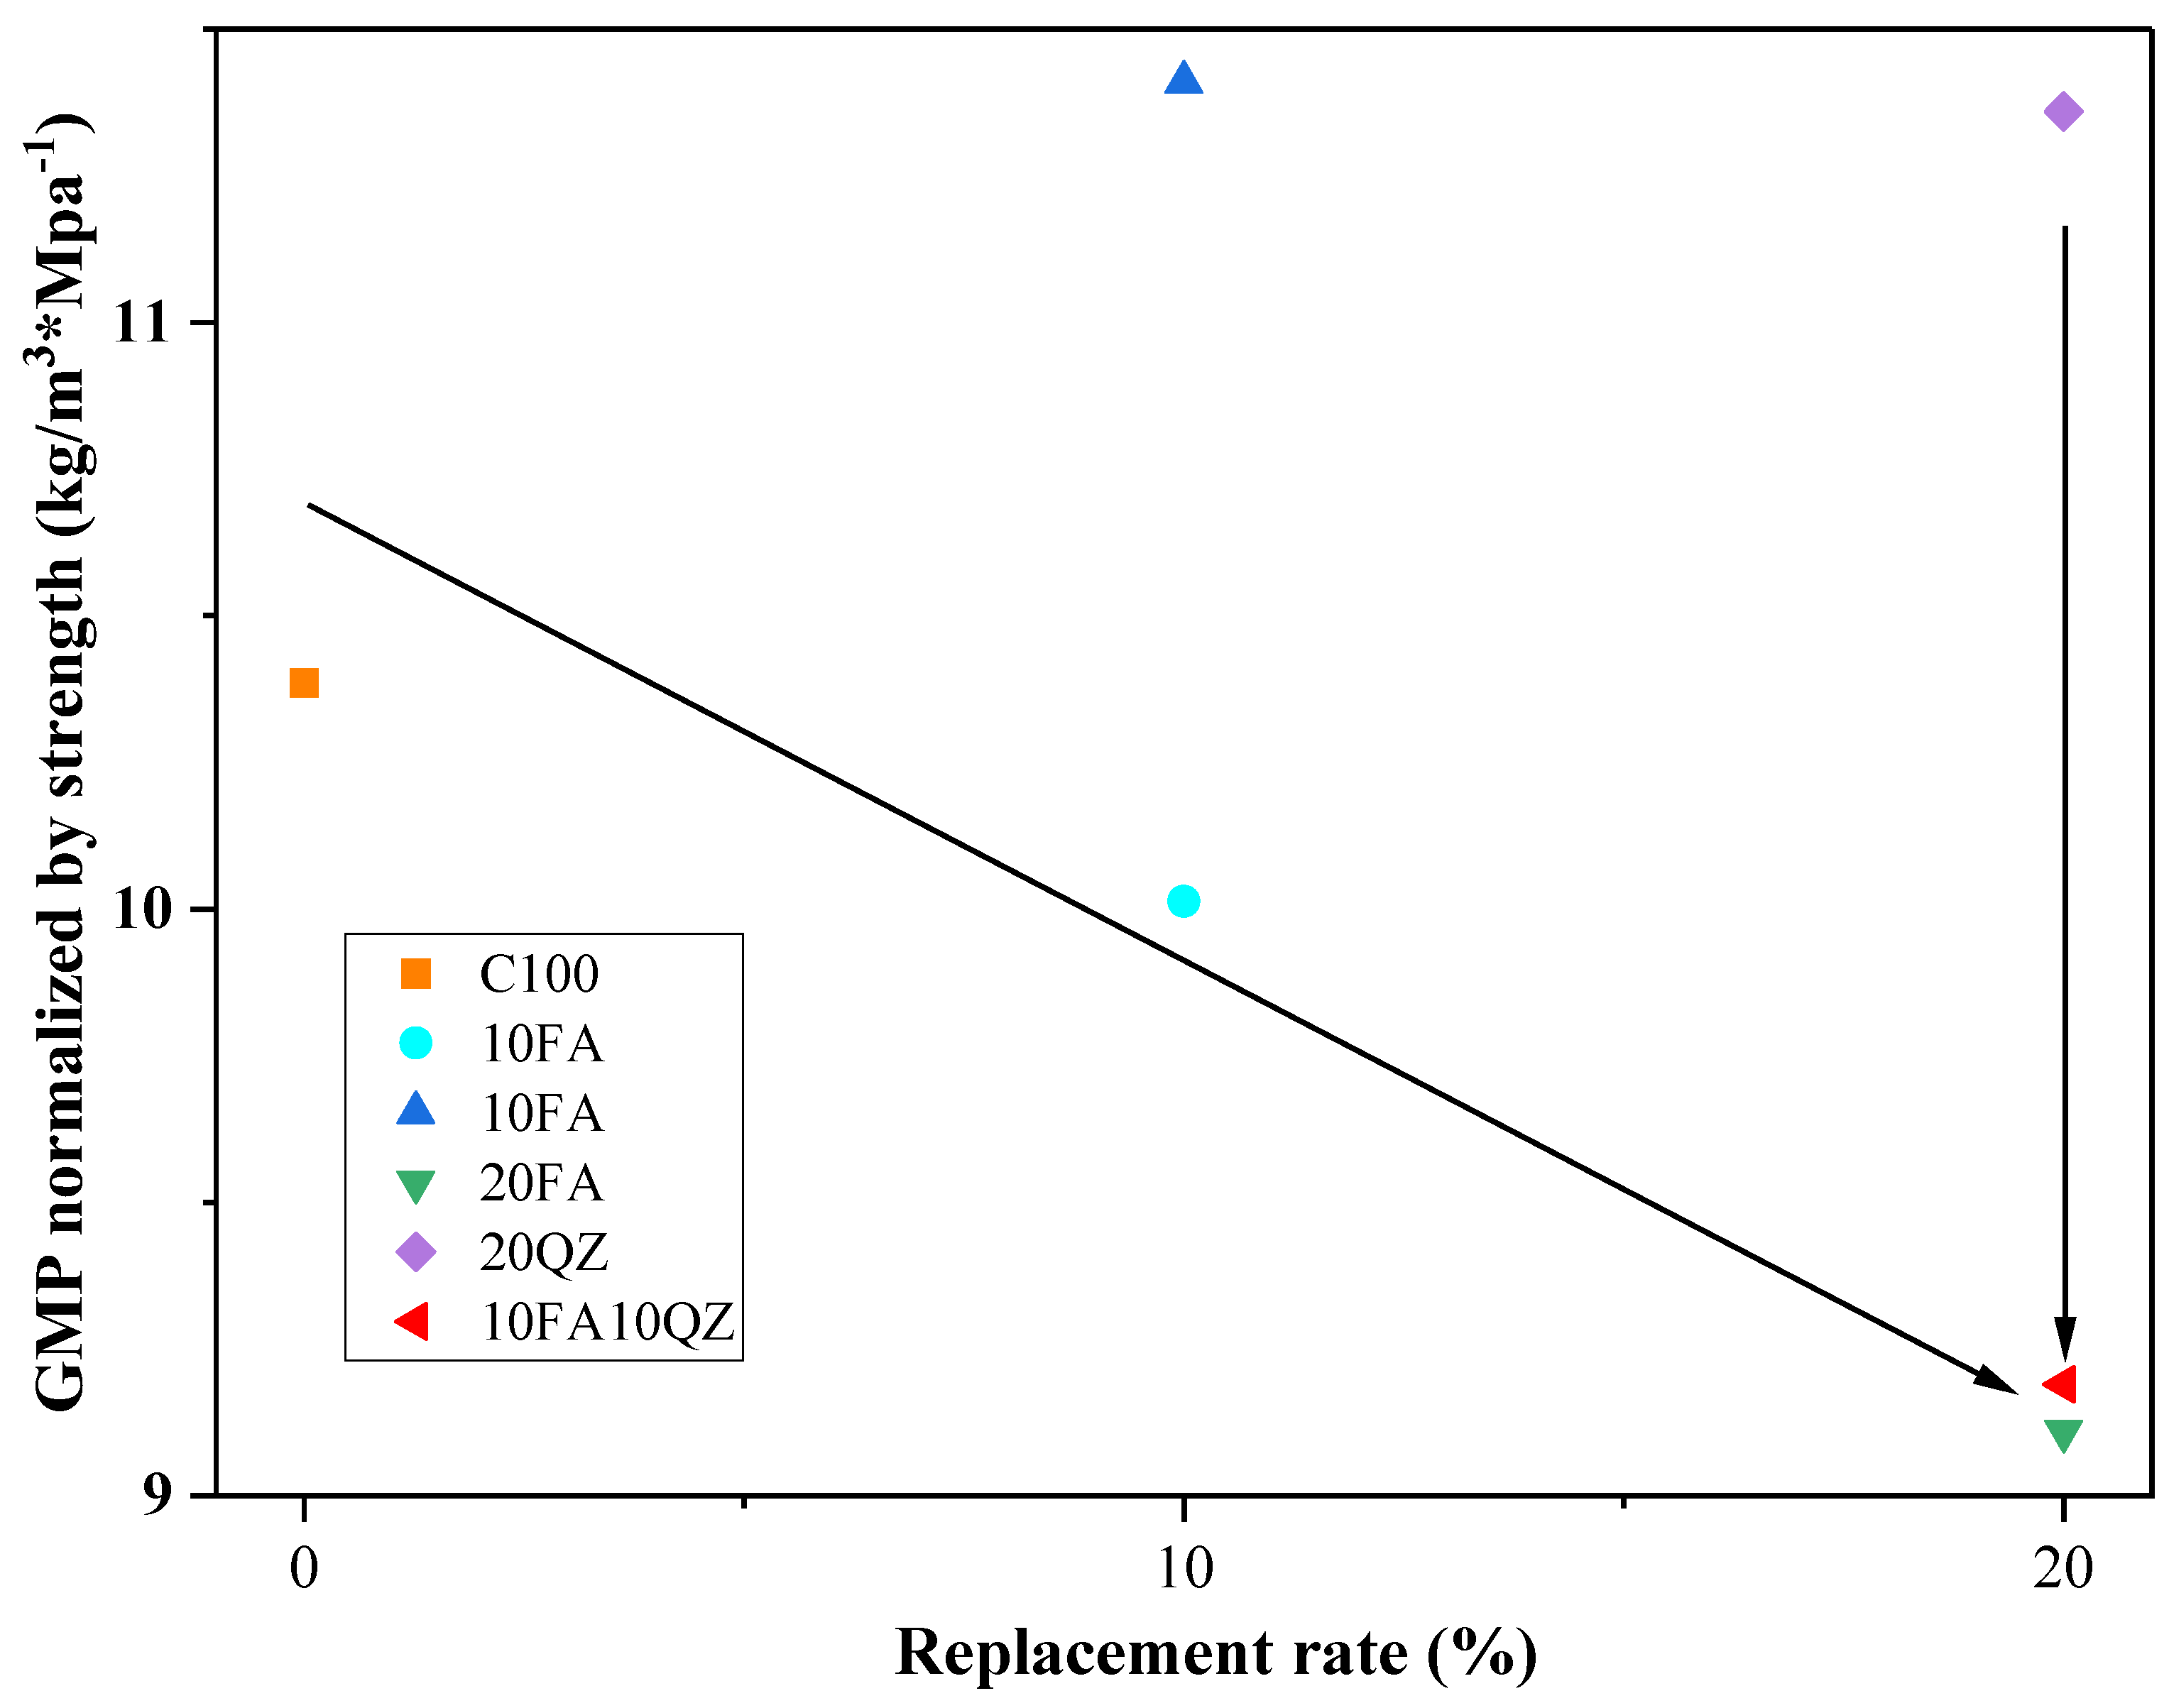
2 emission per unit volume. As shown in
Figure 13, compared with the QZ group, the FA group significantly reduces CO
2 emissions per unit compressive strength. This is mainly because the FA group has a higher 28-day compressive strength and lower CO
2 emissions. The 10FA10QZ group showed a relatively good result in these data: 9.19 kg·CO
2/MPa.
