
A Bird Vocalization Classification Method Based on Bidirectional FBank with Enhanced Robustness


Abstract
1. Introduction
- (1)
- We constructed the iWAVE wavelet threshold denoising method for bird vocalization, which adapts to determine the optimal decomposition levels, optimizes the threshold selection rule, and improves the threshold function. This method outperforms existing classical and improved techniques in most cases, thus supporting the wider application of wavelet-transform-based denoising.
- (2)
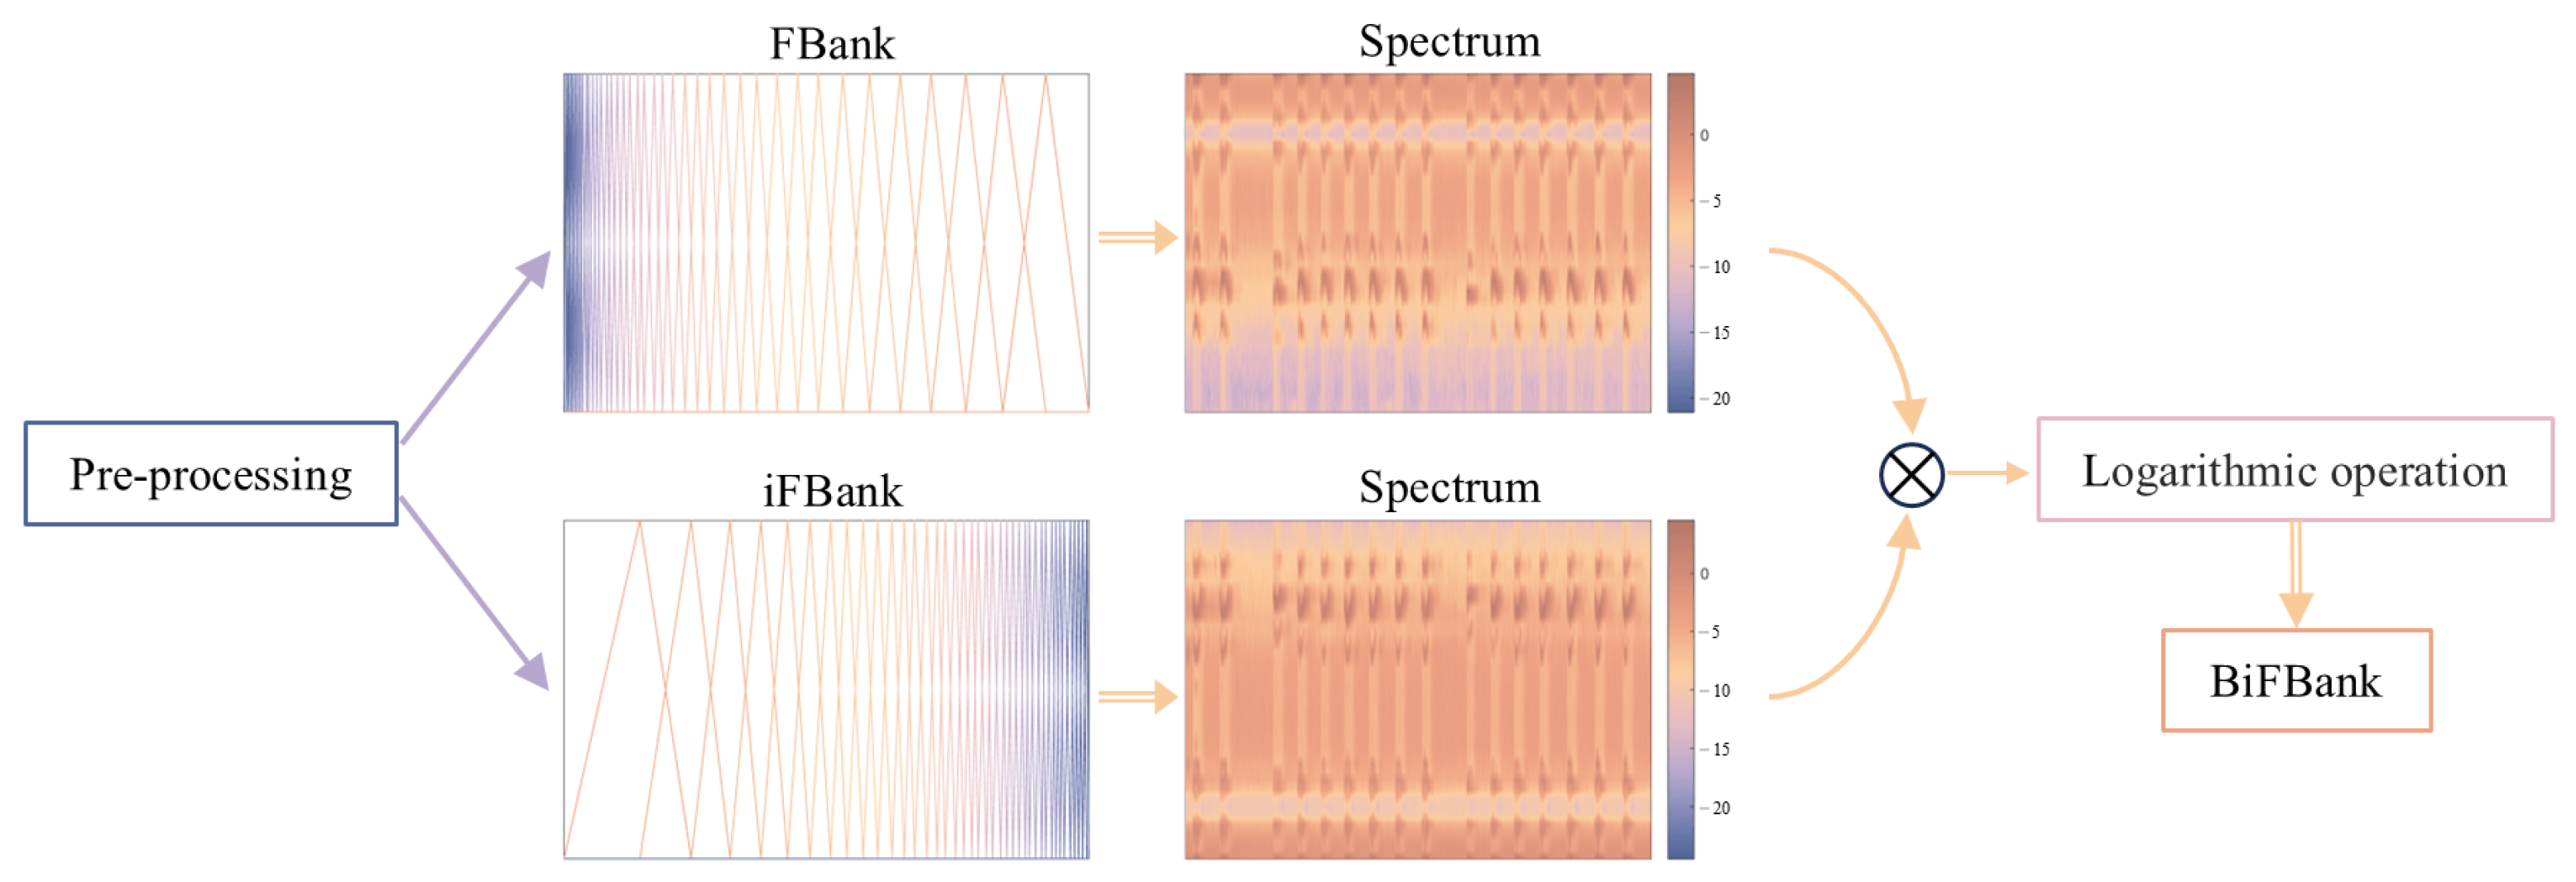
- We developed a horizontal linear fusion of FBank and iFBank to create BiFBank features, effectively integrating low-frequency and high-frequency information, reducing the loss of audio data, and making up for the shortcomings of traditional methods.
- (3)
- We demonstrated that FBank outperforms MFCC under the same conditions, providing researchers with a wider selection of features. The proposed iWAVE-BiFBank method achieves optimal performance and robustness on the tested features and compared with state-of-the-art methods.
2. Related Work
3. Dataset
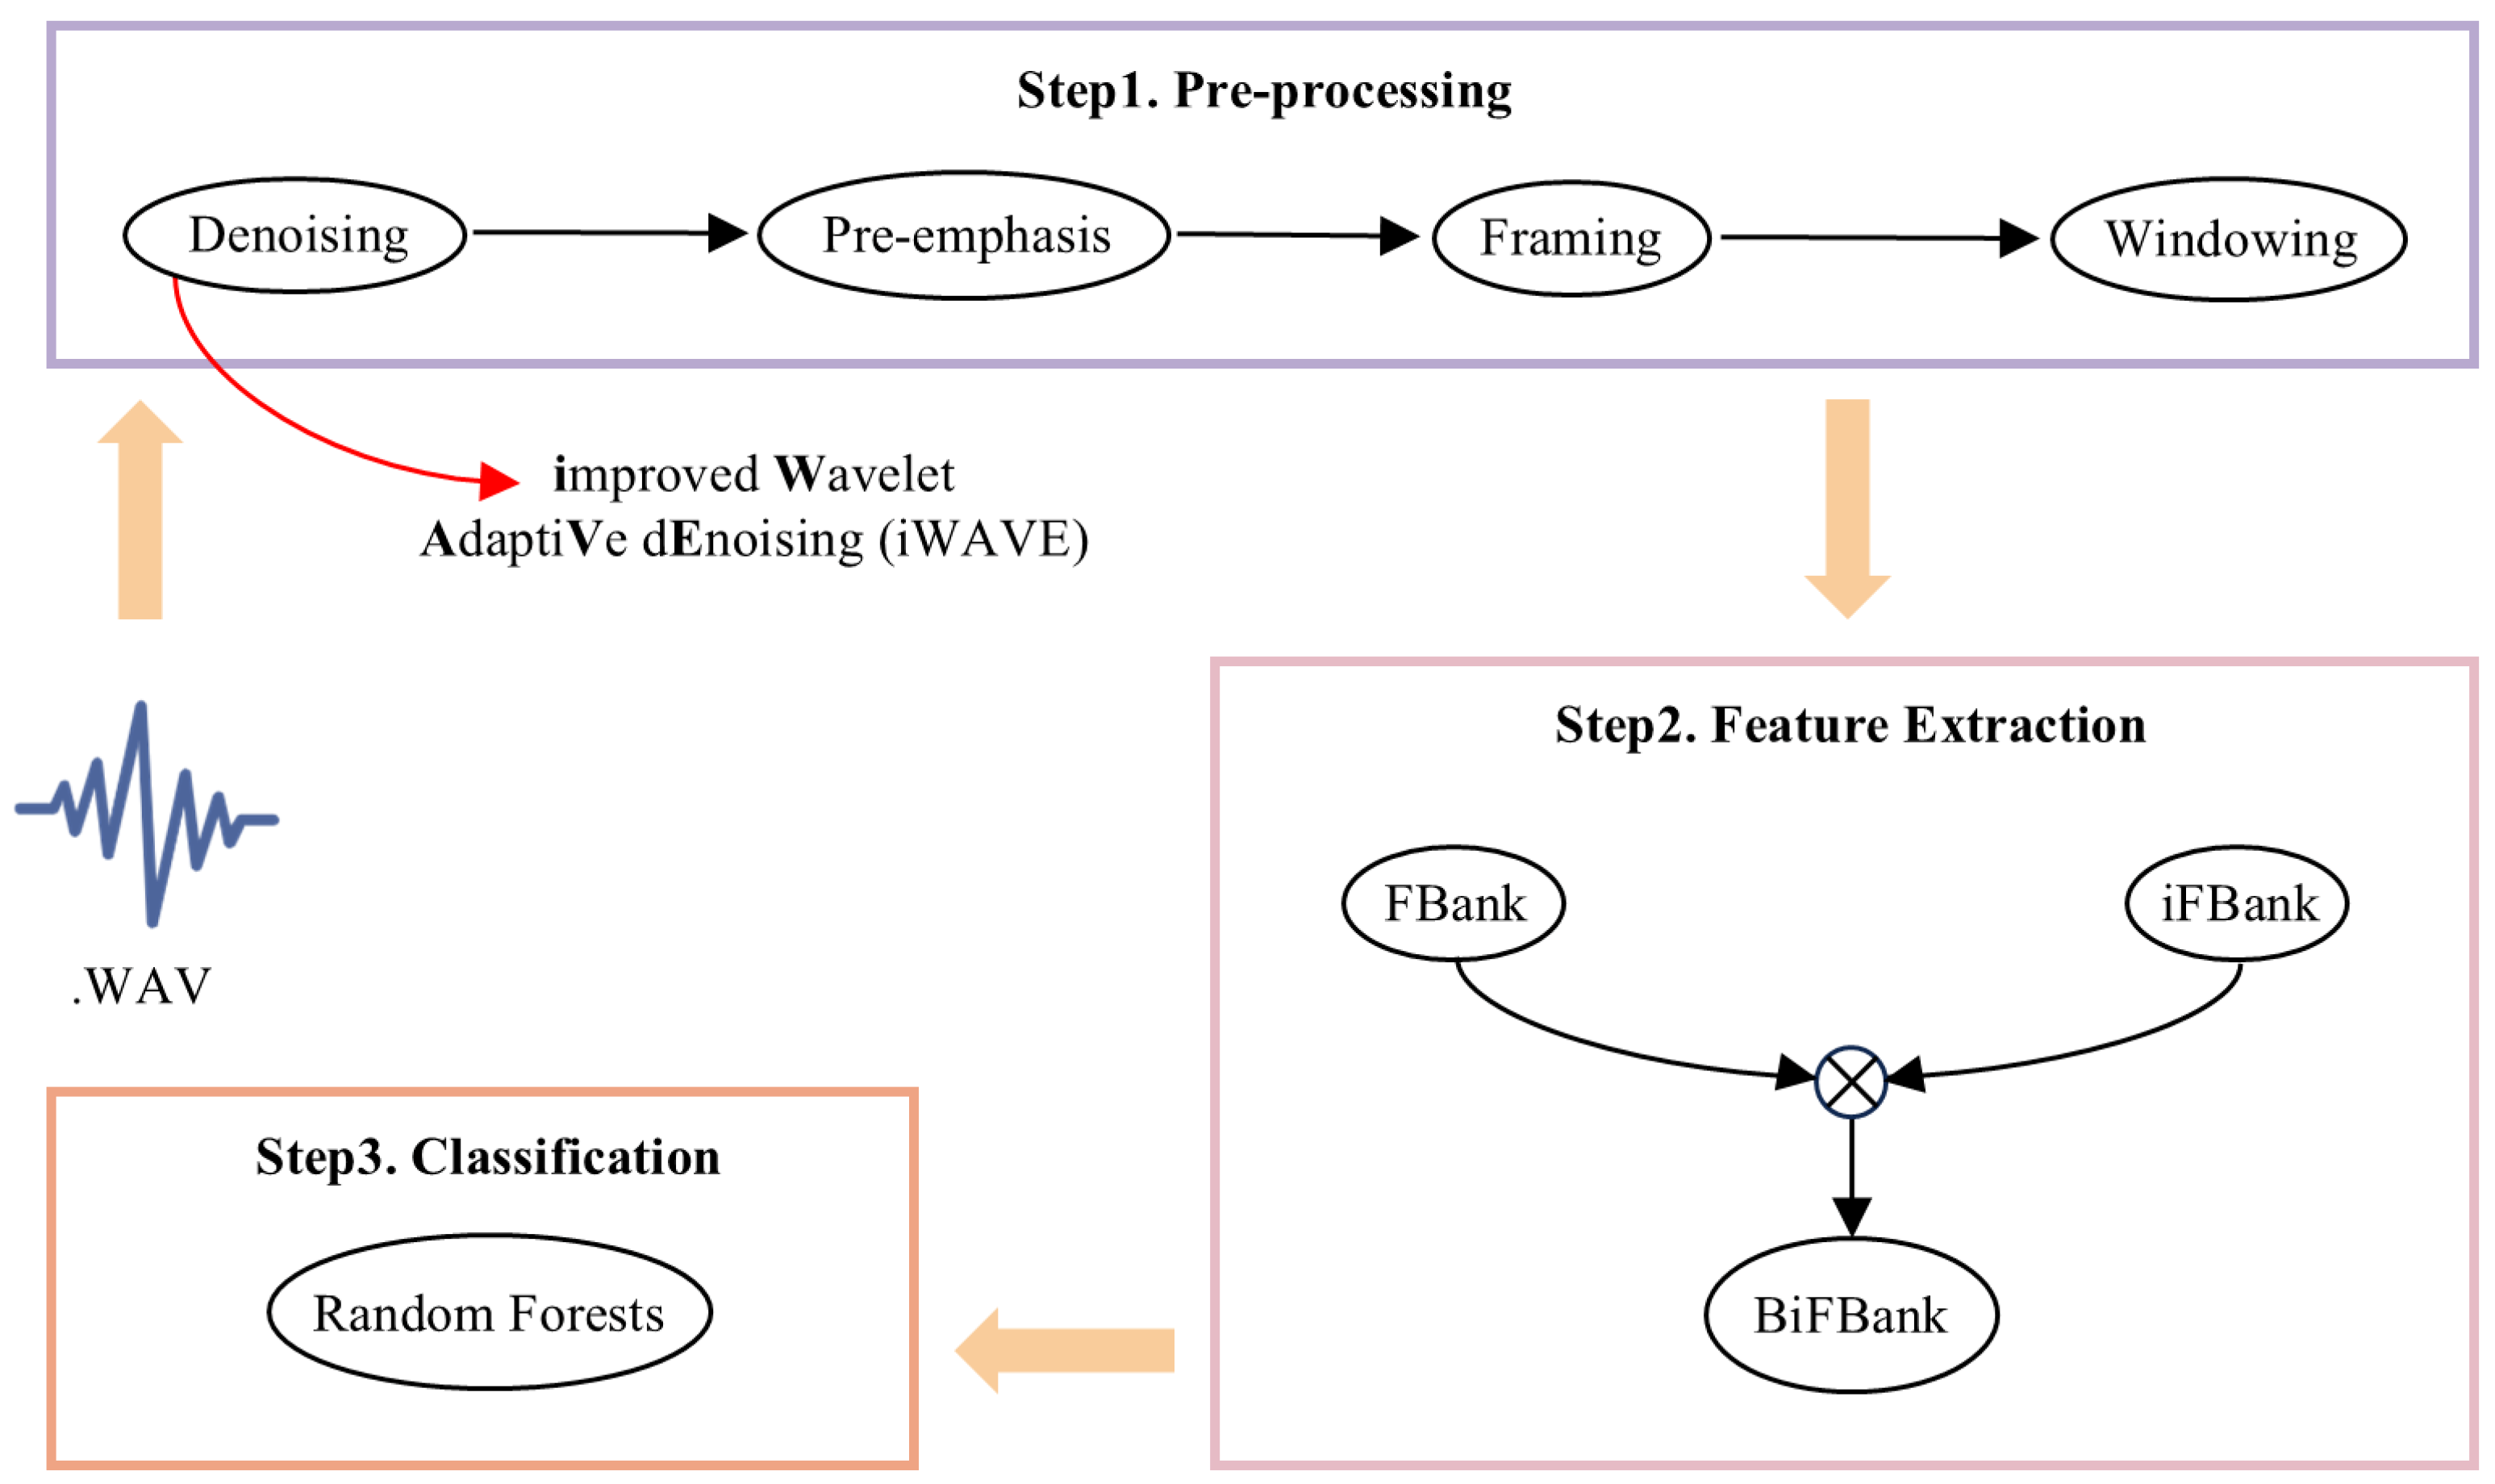
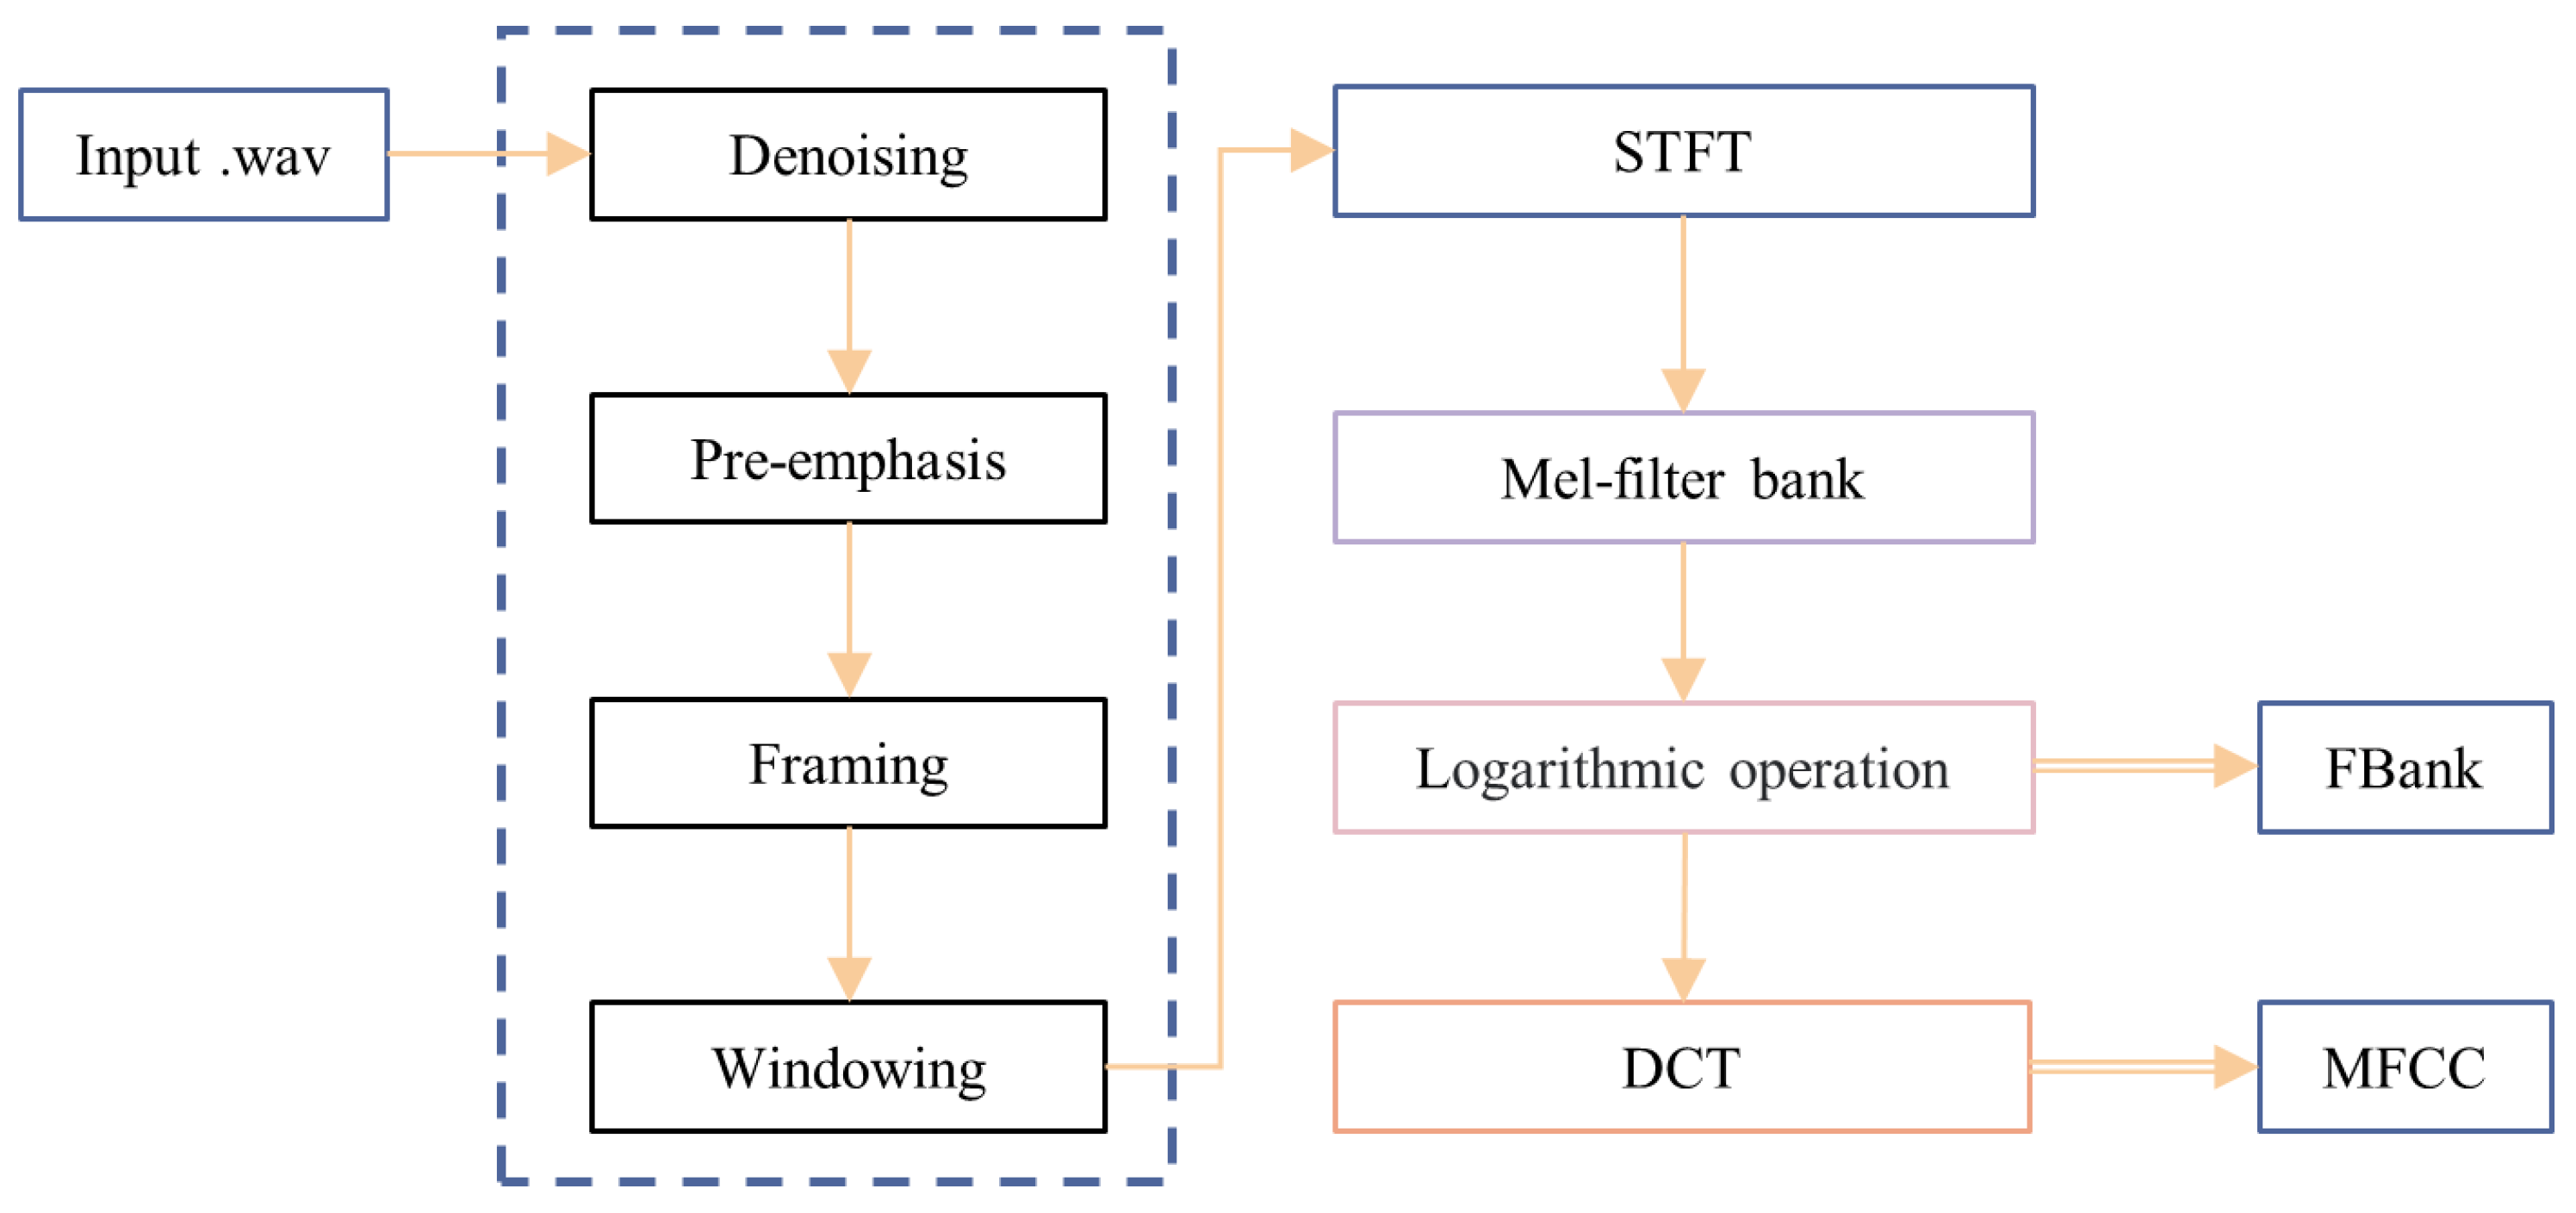
4. Research Methods
4.1. Improved Wavelet Adaptive Denoising
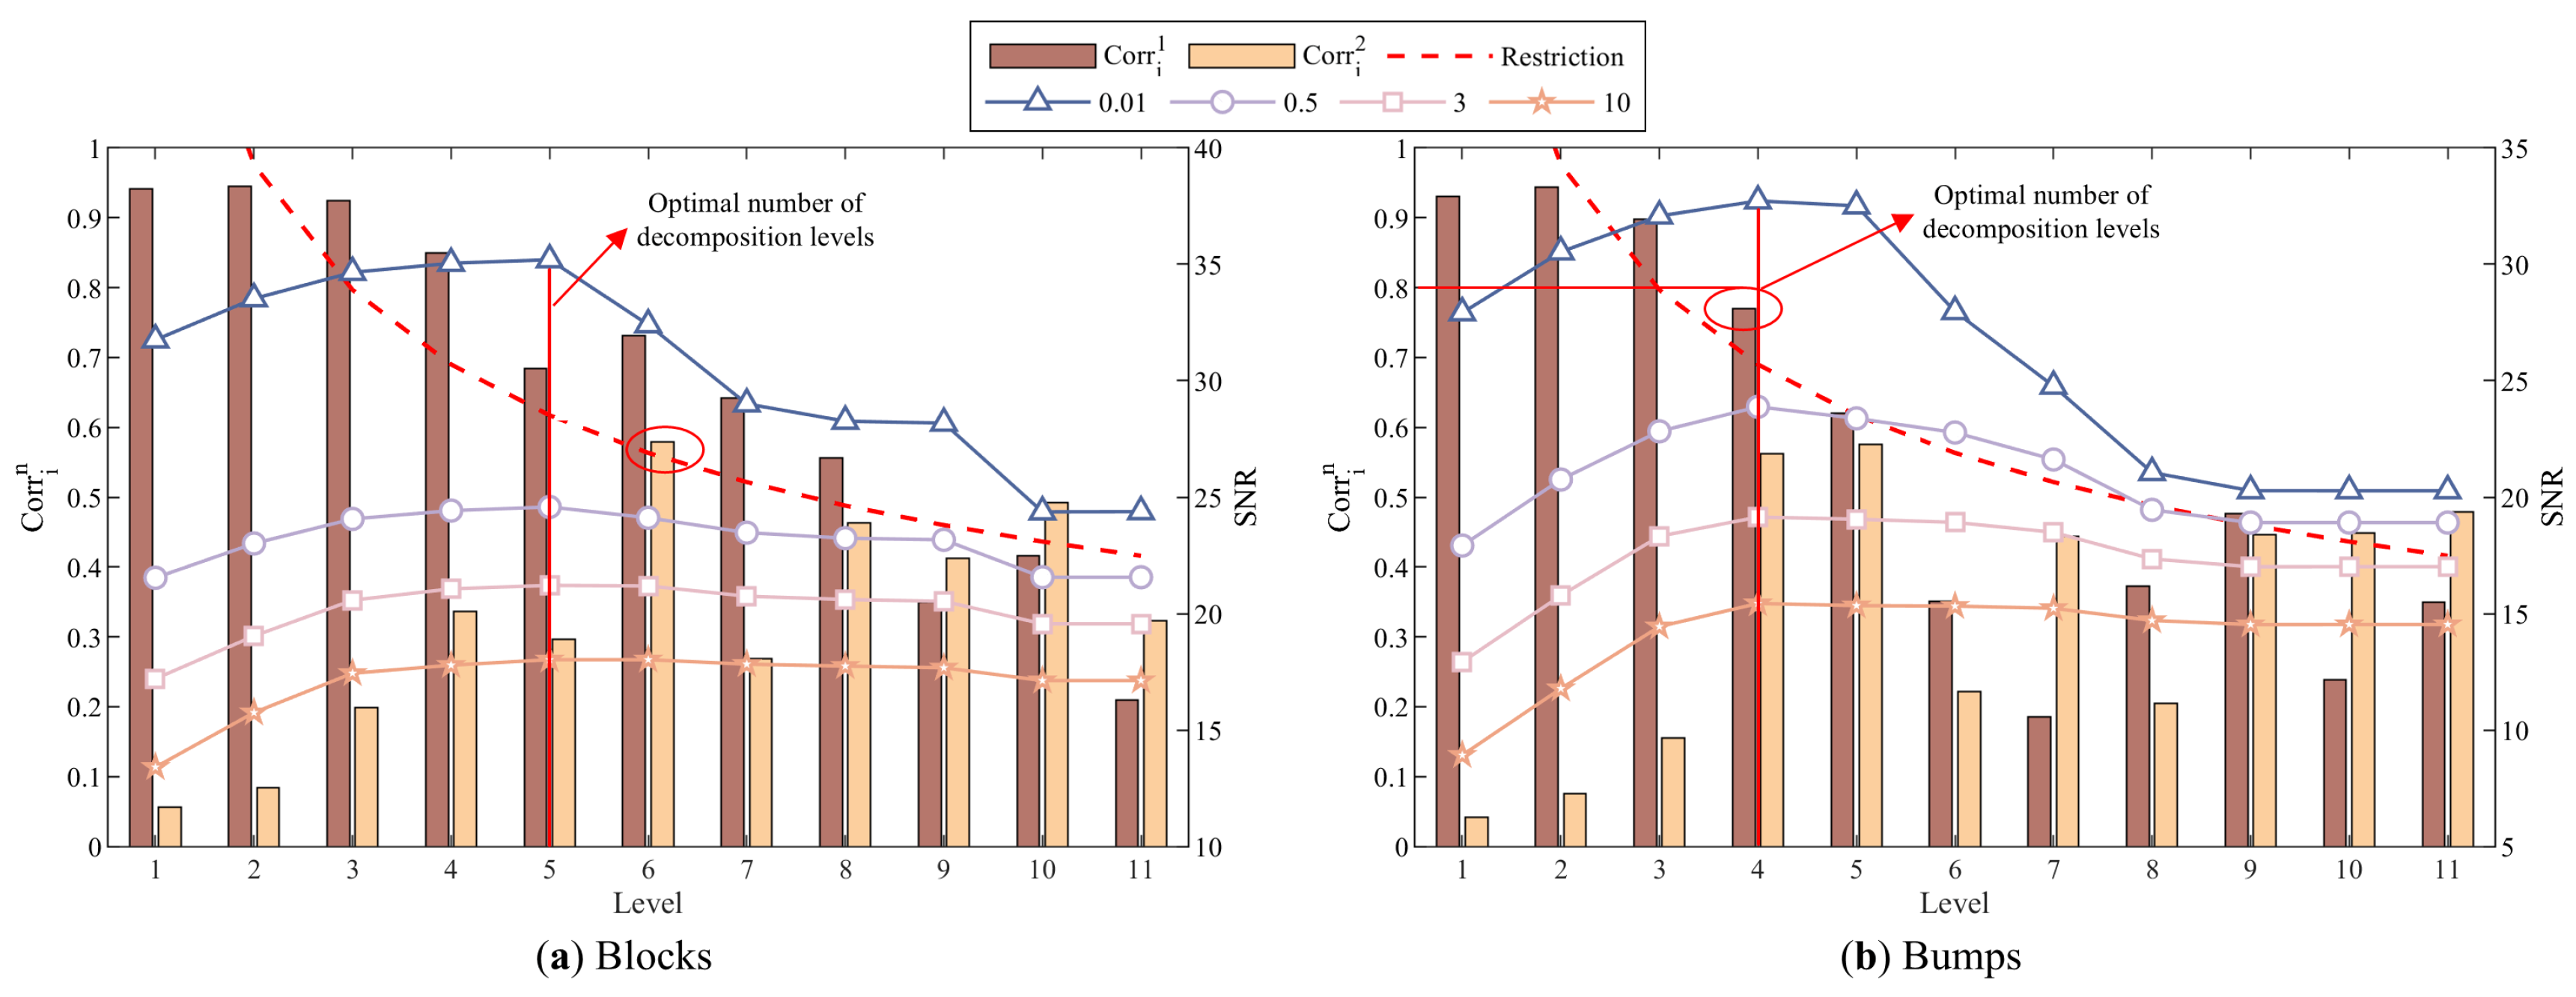
4.1.1. Adaptive Determination of Optimal Decomposition Level
4.1.2. Optimized Threshold Selection Rule
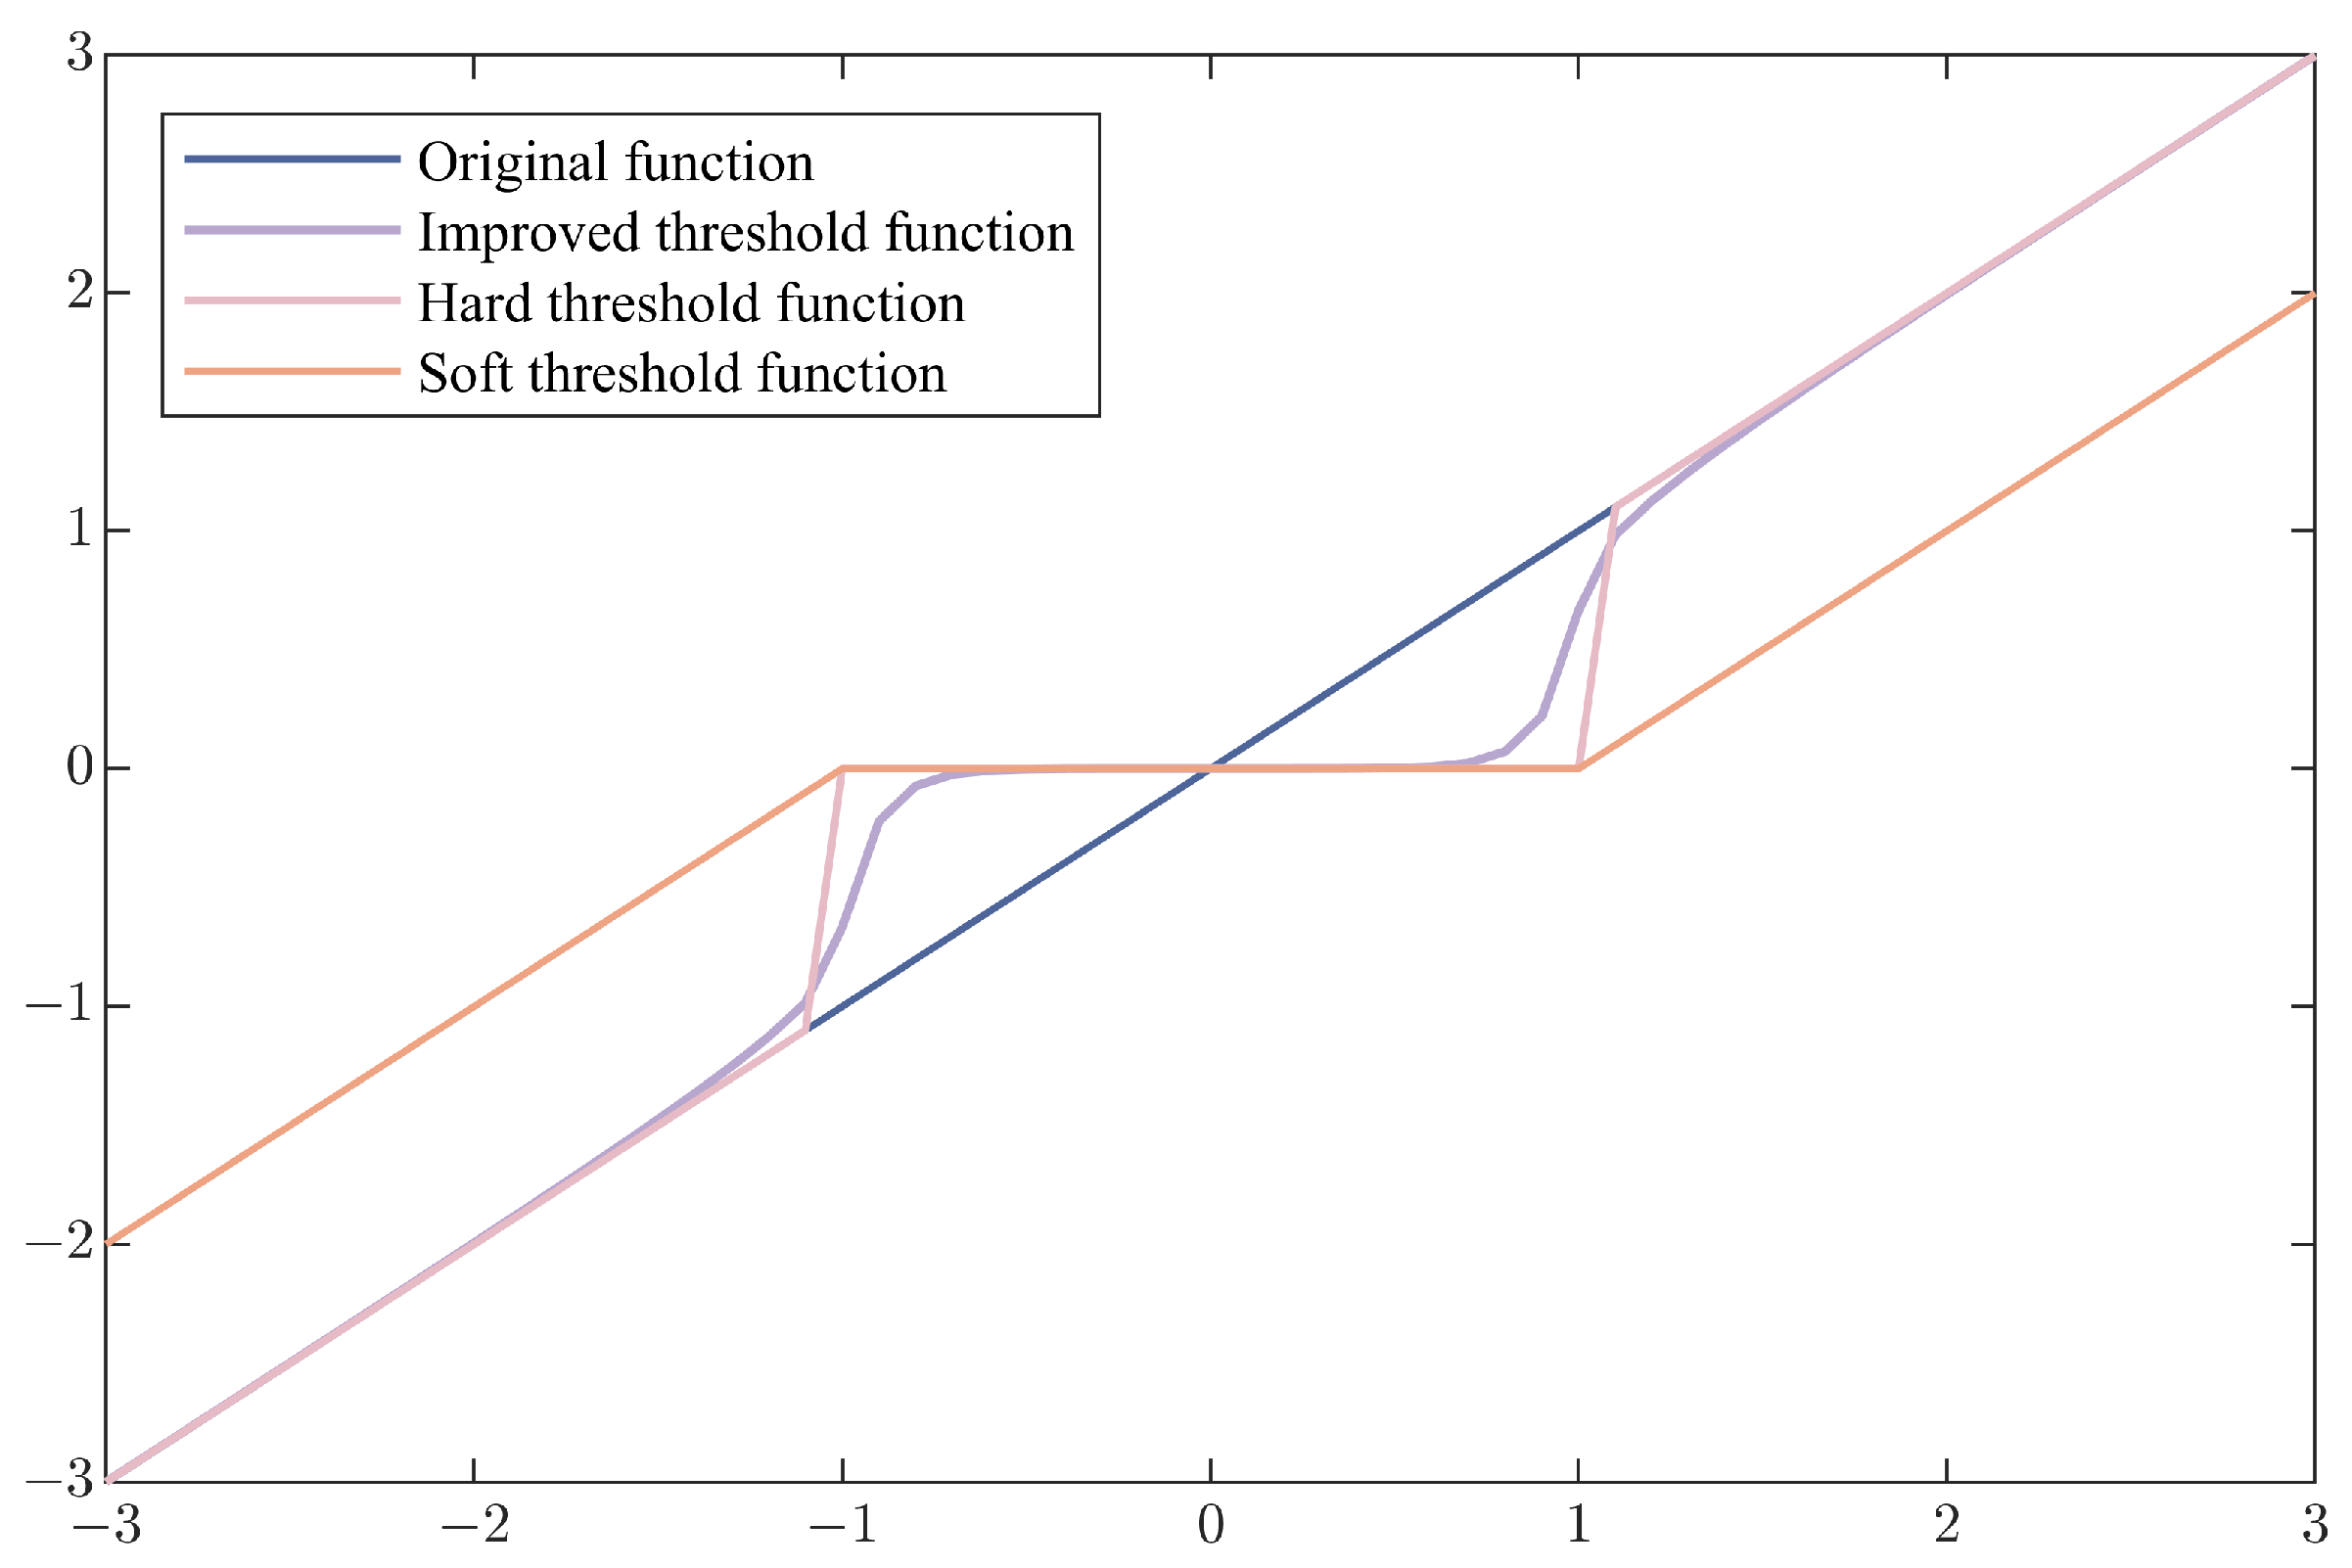
4.1.3. Improved Threshold Function
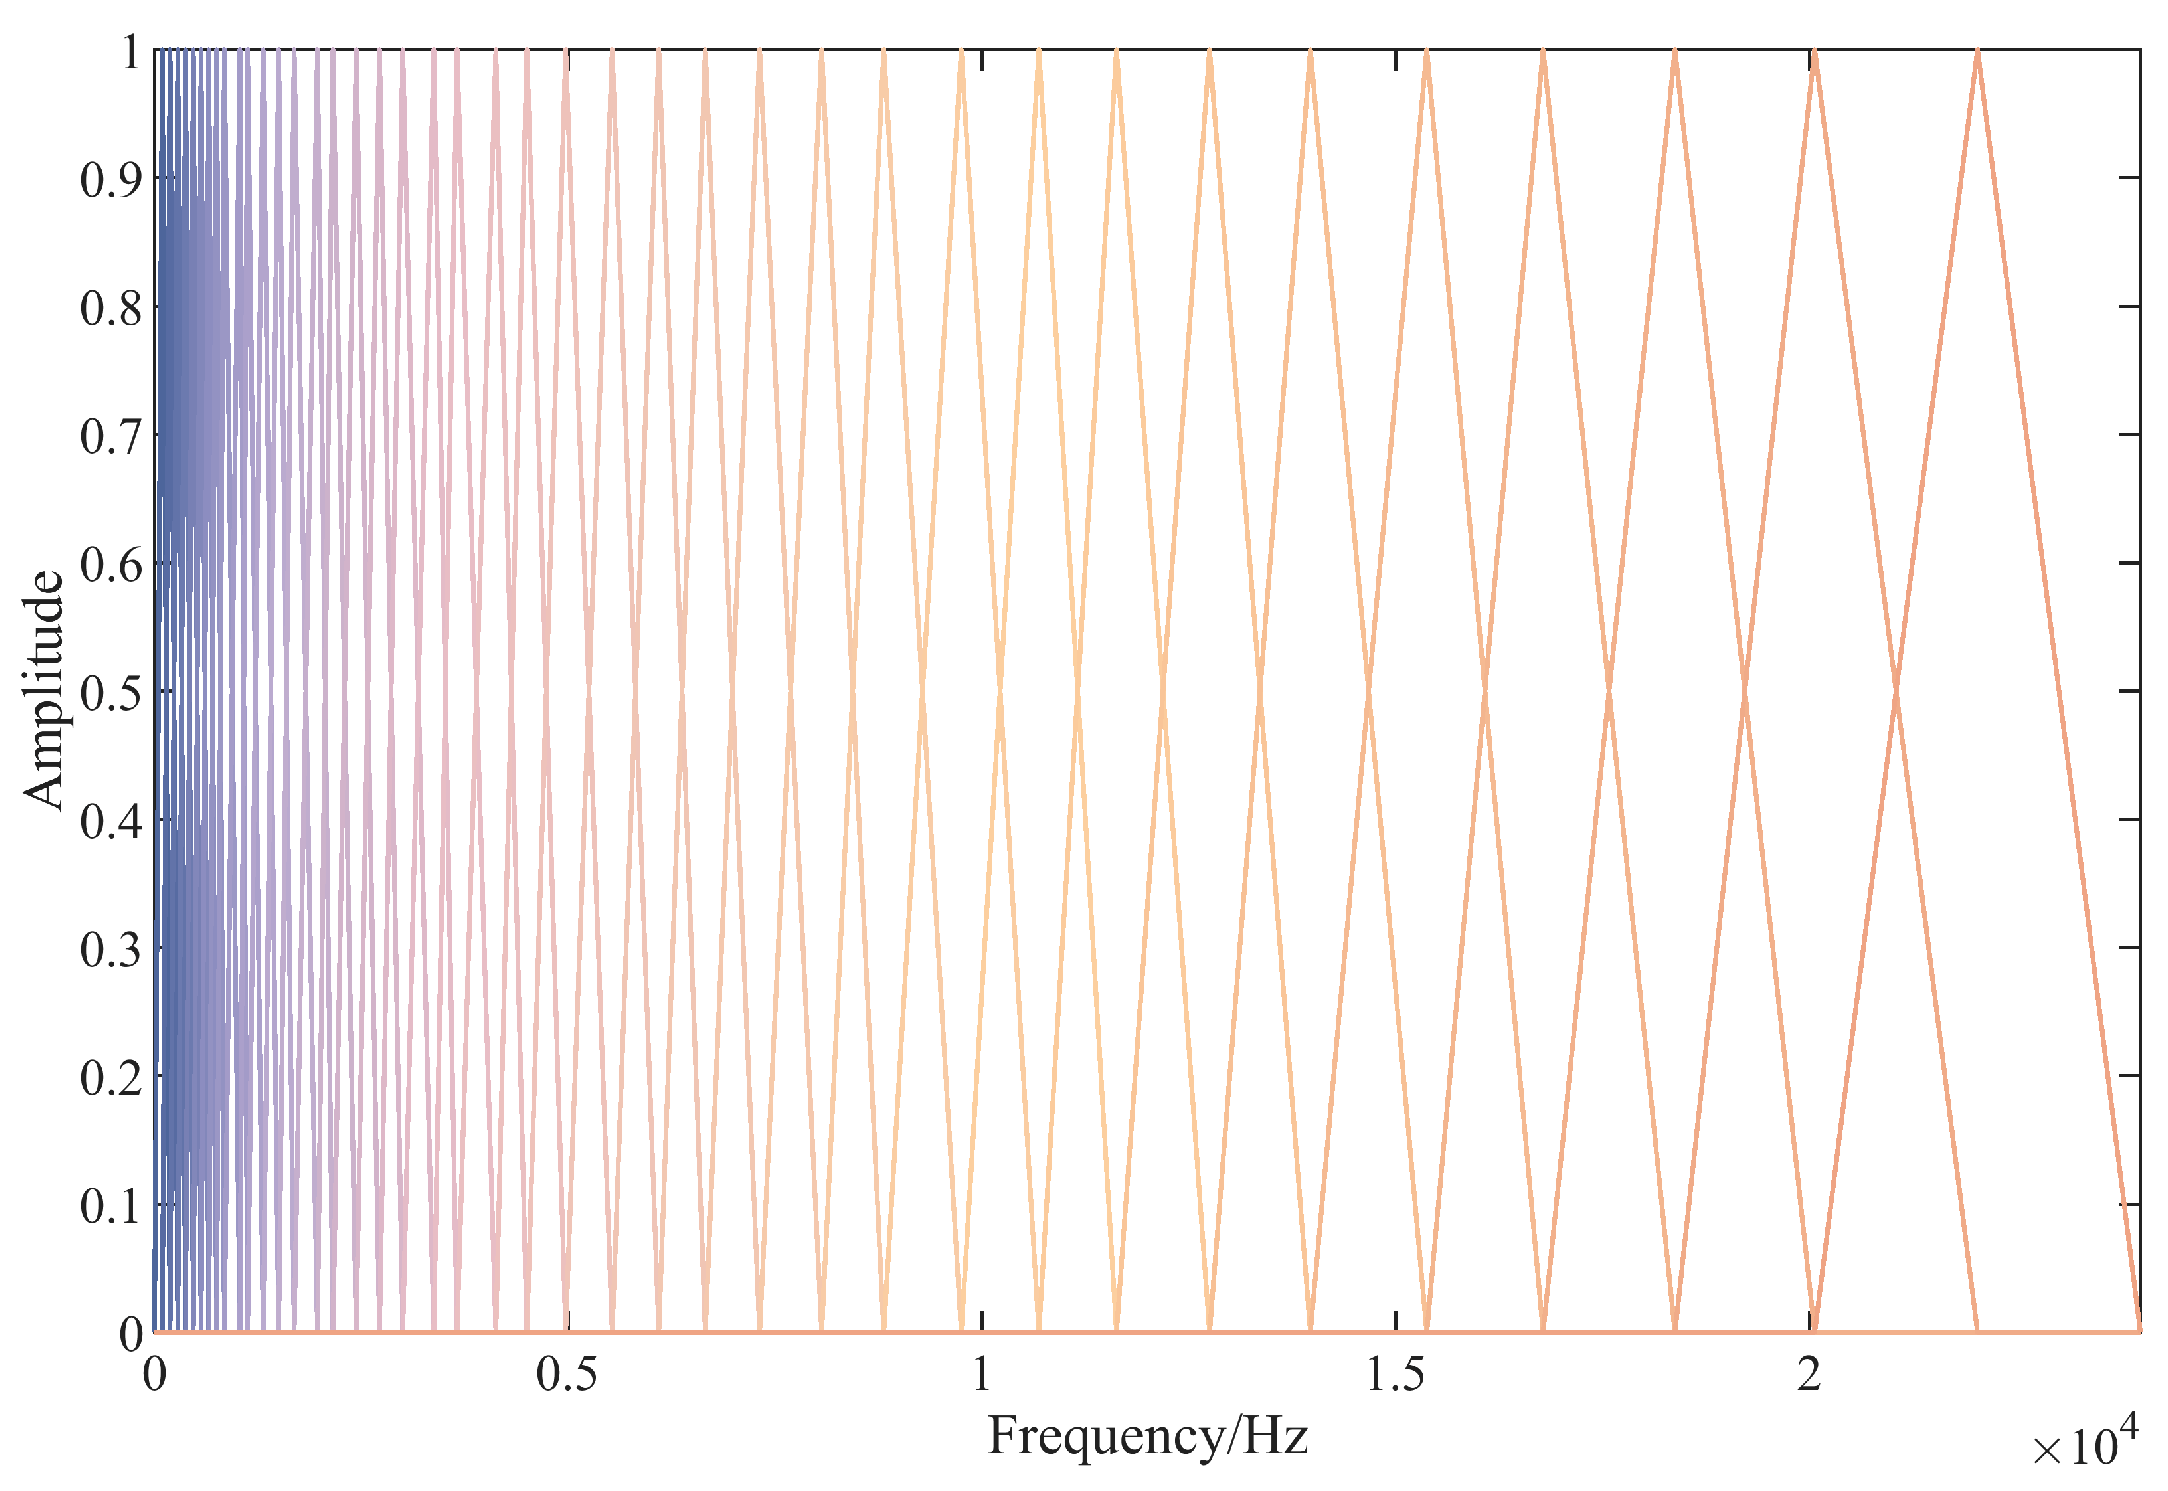
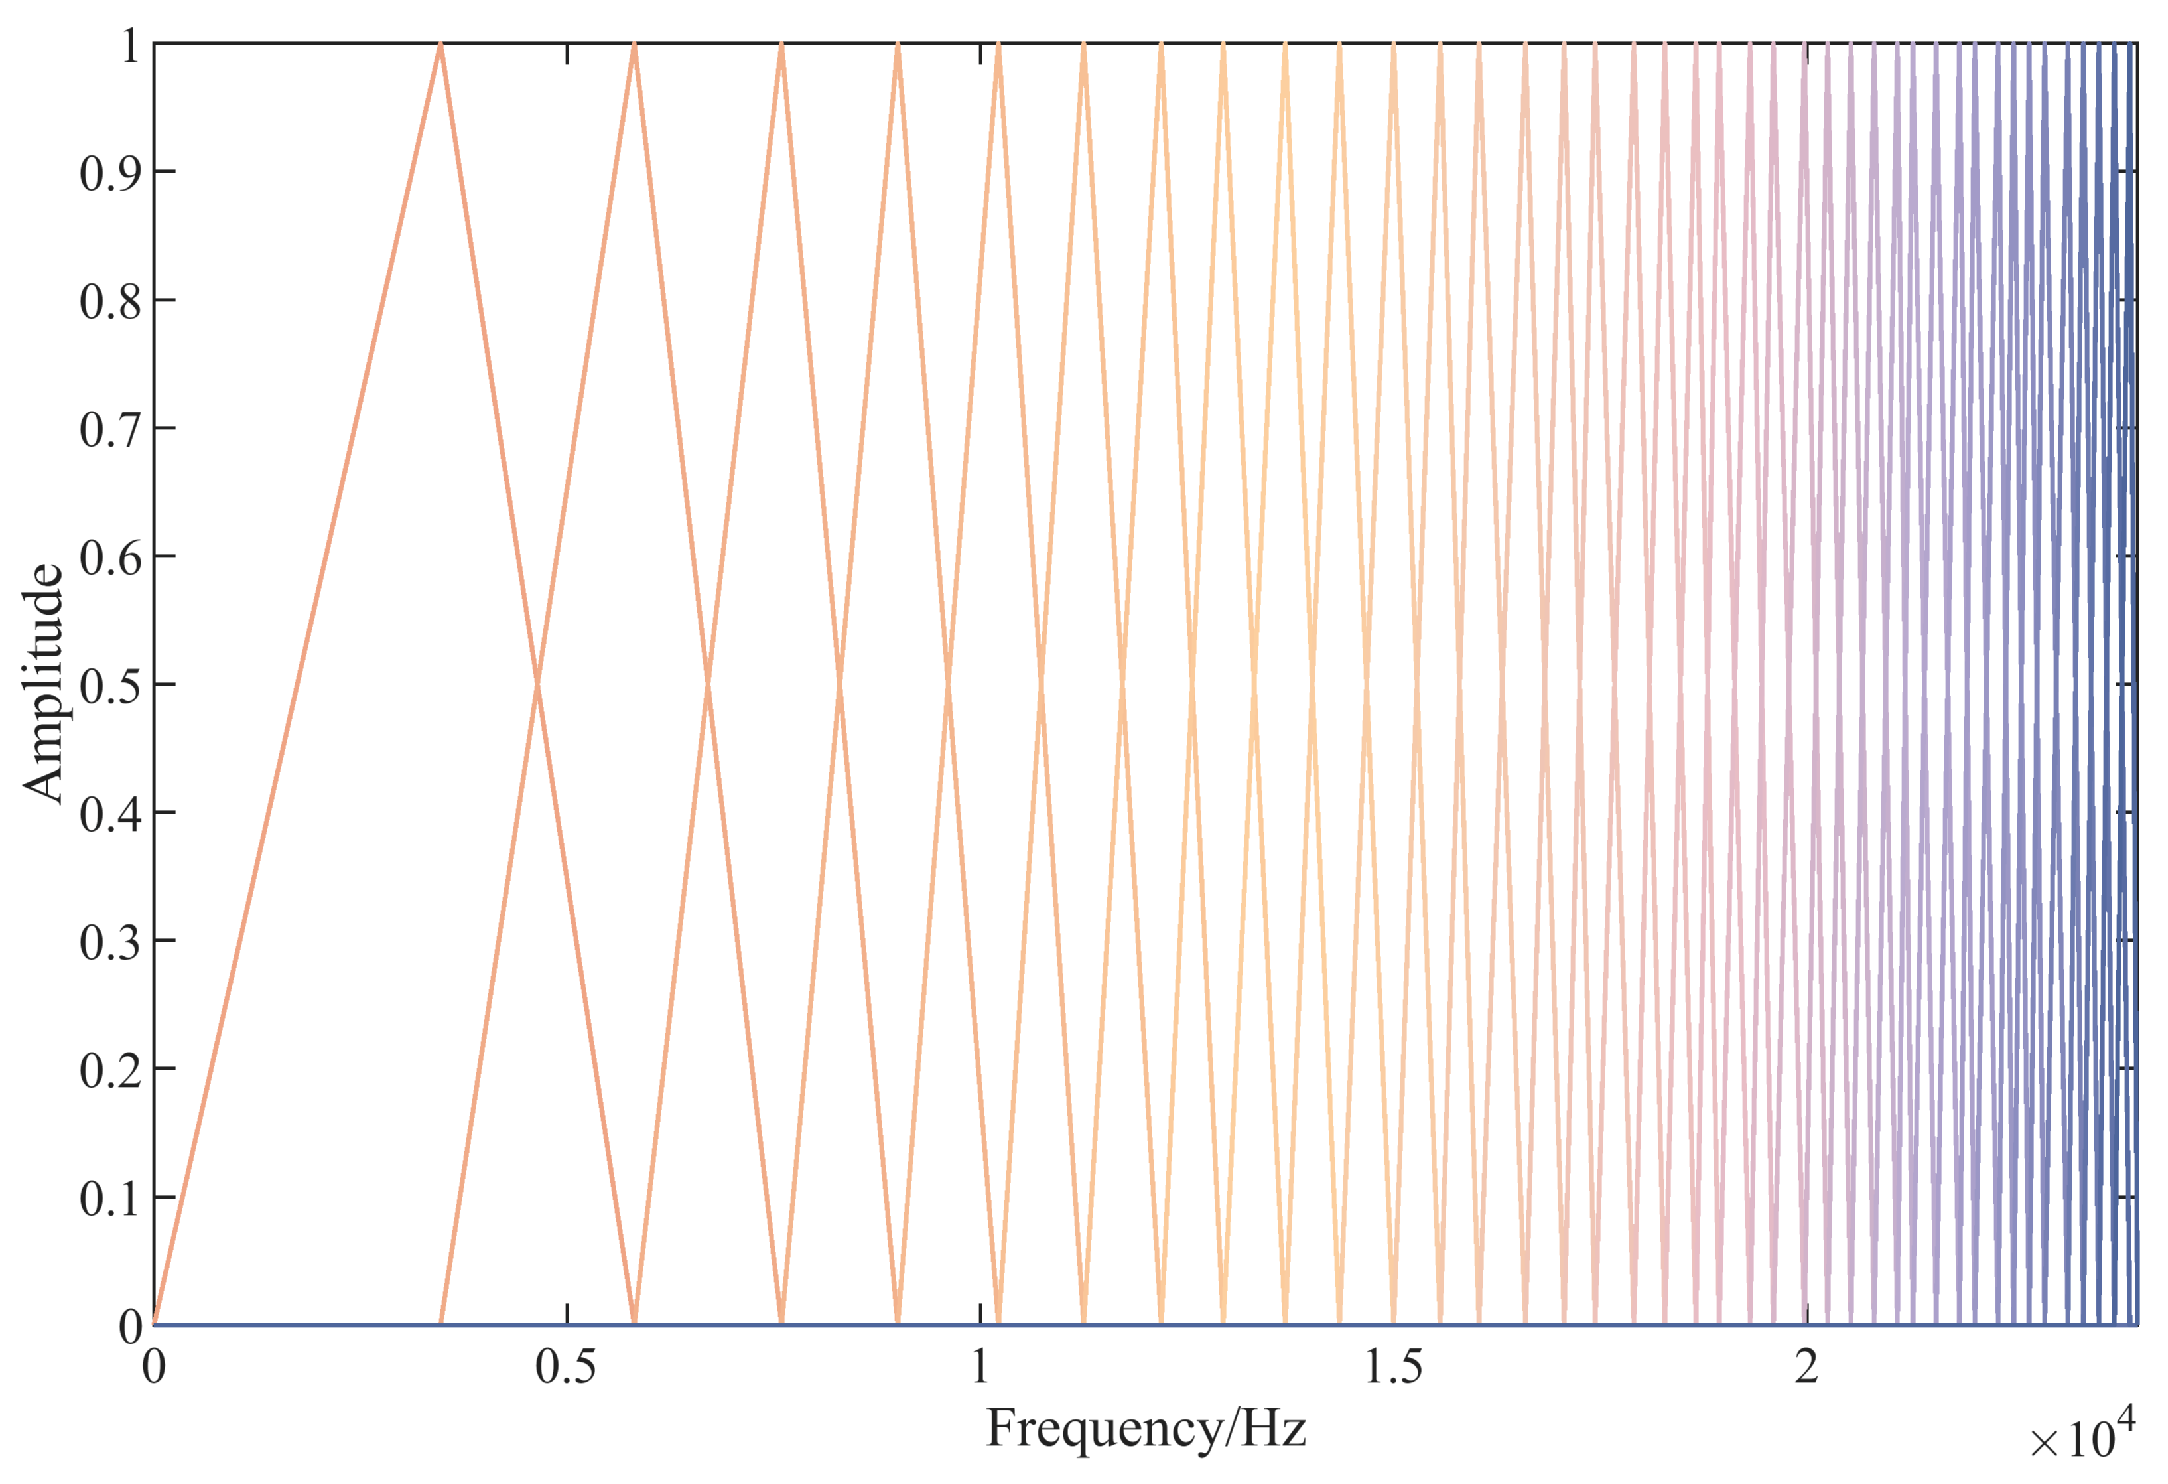
4.2. Bidirectional FBank Feature Extraction
4.2.1. FBank Feature Extraction
4.2.2. Inverse FBank Feature Extraction
5. Experiment and Result Analysis
5.1. Experimental Environment and Design
5.2. Evaluation System
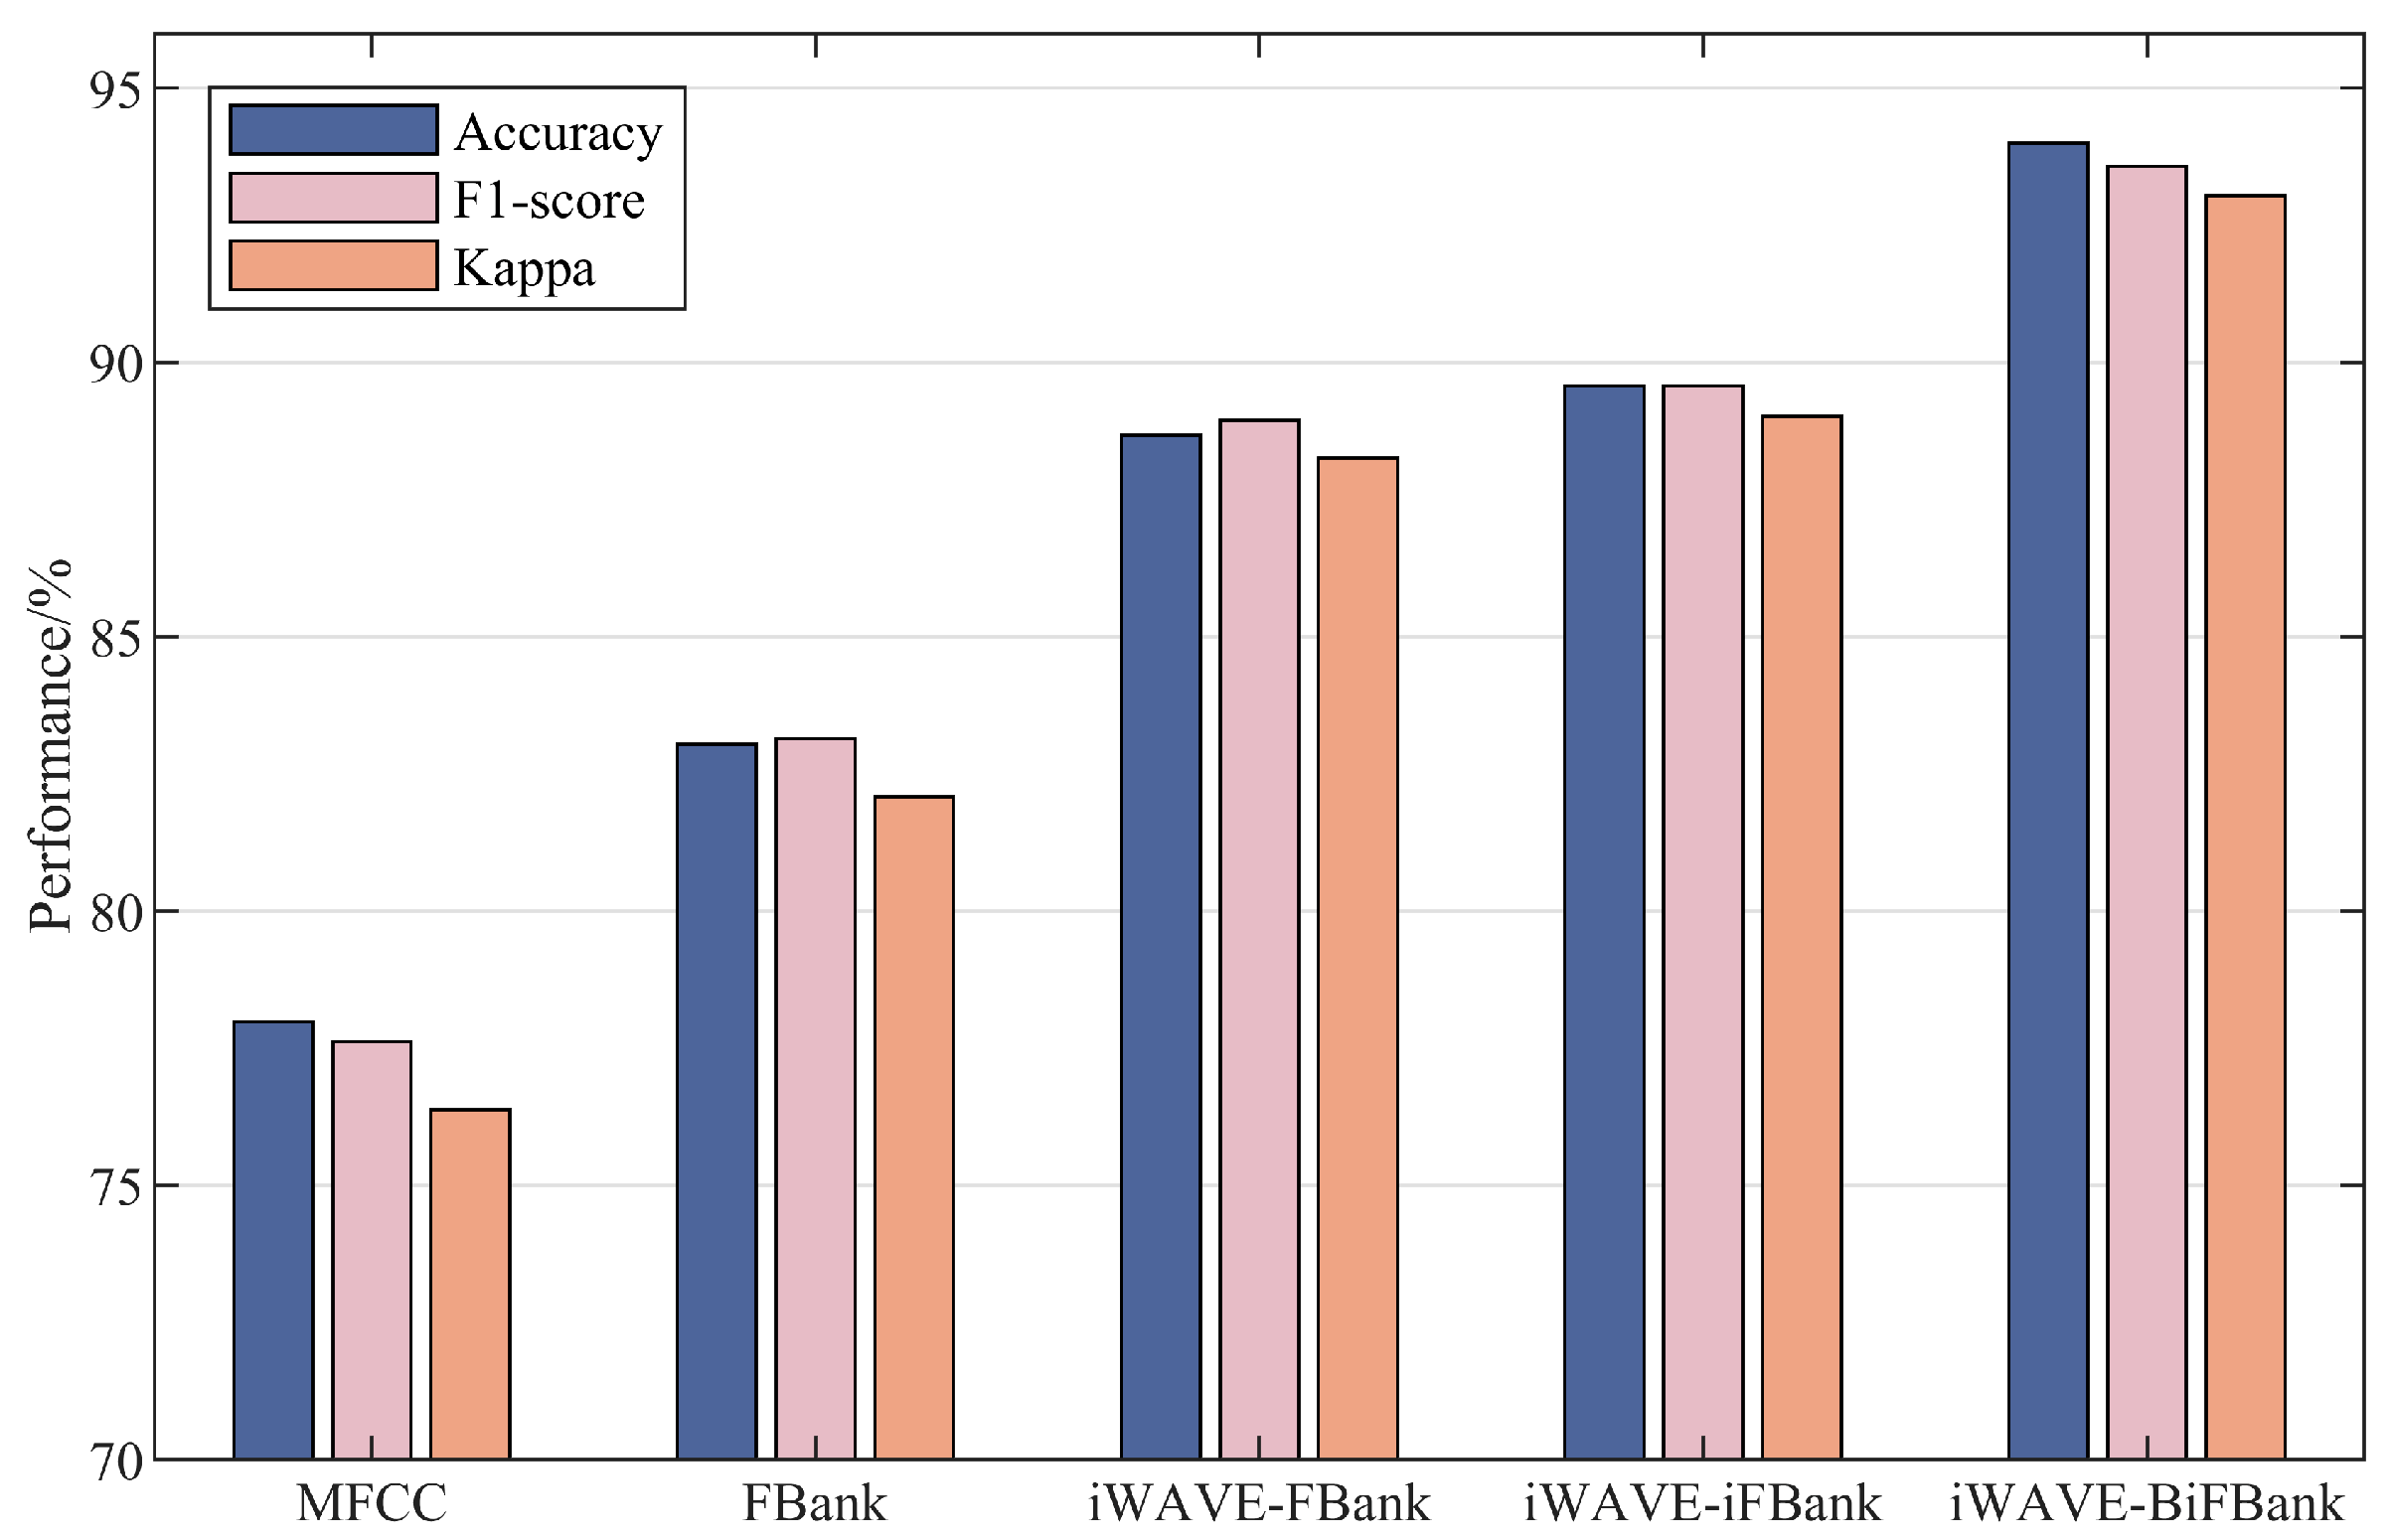
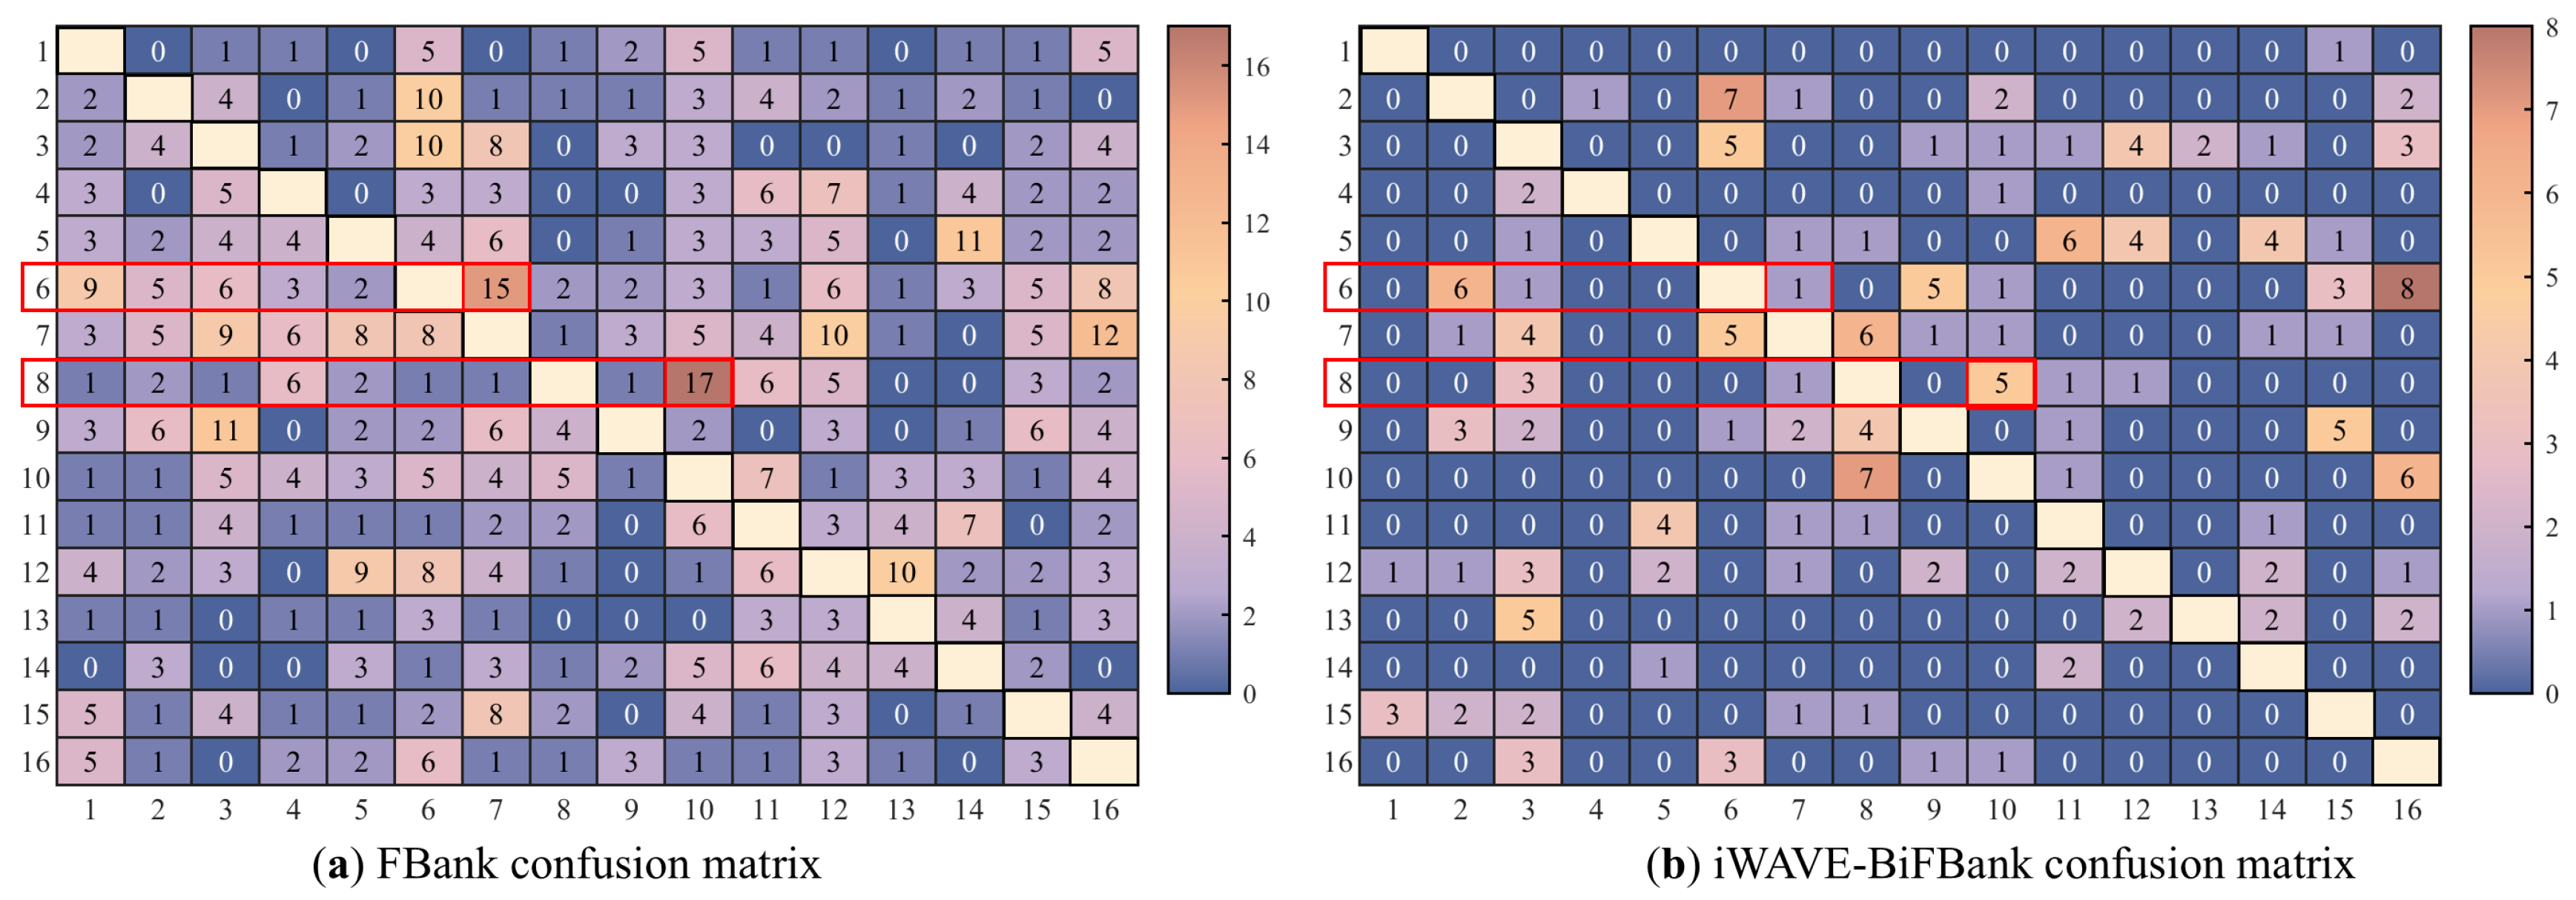
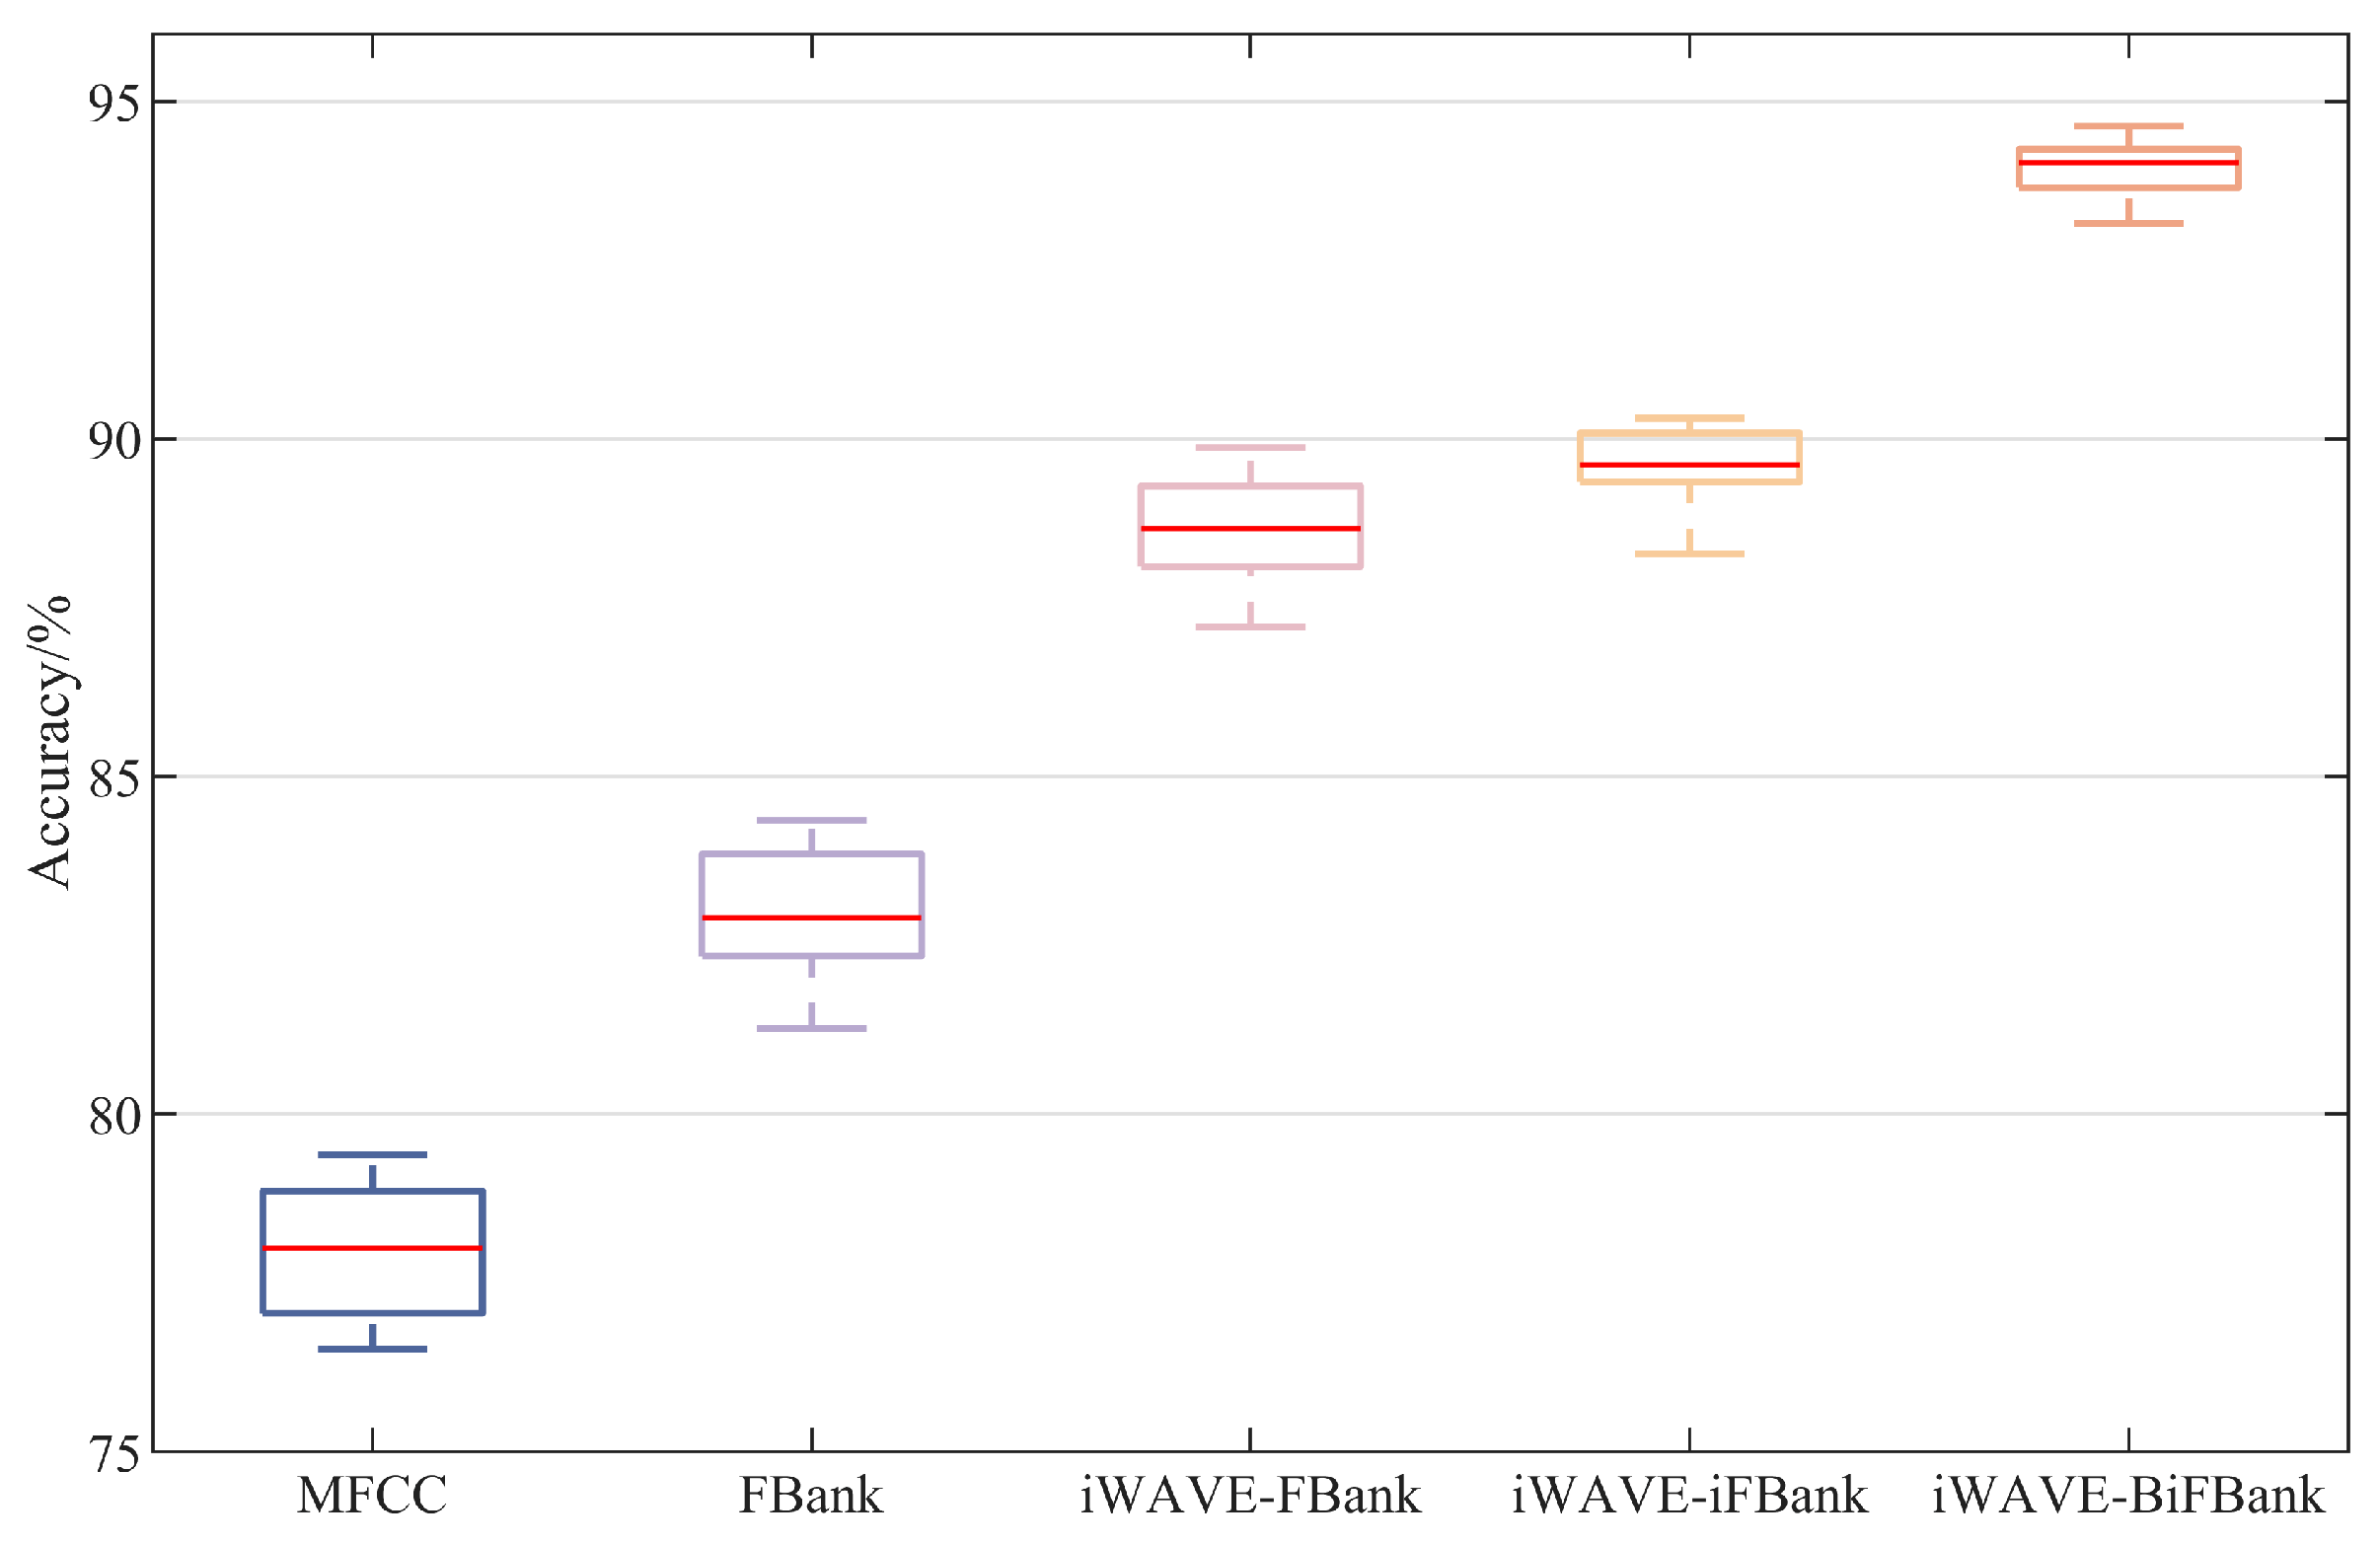
5.3. Result Analysis
- (1)
- Verification of the adaptive determination of the optimal decomposition level
- (2)
- Verification of the optimized threshold selection rule’s effectiveness
- (3)
- Verification of the improved threshold function’s effectiveness
5.4. Discussion
6. Limitations and Future Scope
- Choosing a more effective pre-emphasis method that is closer to the birdsong acoustic attenuation model rather than using a simple high-pass filter [51].
- Developing a method to separate overlapping vocalizations across the time domain, frequency domain, and spectrogram as well as attempting to recognize different bird vocalizations within overlapping audio.
- Exploring more handcrafted and deep-learning-based features and constructing a multi-feature fusion method to enhance the classification performance of bird vocalizations in future studies. In addition, experiments could be conducted with different acoustic datasets containing more species of birds as well as different animal species to enhance the generalization of the method.
7. Conclusions
Author Contributions
Funding
Institutional Review Board Statement
Informed Consent Statement
Data Availability Statement
Conflicts of Interest
References
- Xie, J.; Colonna, J.G.; Zhang, J. Bioacoustic signal denoising: A review. Artif. Intell. Rev. 2021, 54, 3575–3597. [Google Scholar]
- Zhao, Z.; Zhang, S.; Xu, Z.; Bellisario, K.; Dai, N.; Omrani, H. Automated bird acoustic event detection and robust species classification. Ecol. Inform. 2017, 39, 99–108. [Google Scholar]
- Xie, J.; Zhong, Y.; Zhang, J.; Liu, S.; Ding, C.; Triantafyllopoulos, A. A review of automatic recognition technology for bird vocalizations in the deep learning era. Ecol. Inform. 2023, 73, 101927. [Google Scholar]
- Liu, H.; Wang, W.; Xiang, C.; Han, L.; Nie, H. A de-noising method using the improved wavelet threshold function based on noise variance estimation. Mech. Syst. Signal Process. 2018, 99, 30–46. [Google Scholar]
- Bnou, K.; Raghay, S.; Hakim, A. A wavelet denoising approach based on unsupervised learning model. EURASIP J. Adv. Signal Process. 2020, 2020, 36. [Google Scholar]
- Usman, A.M.; Ogundile, O.O.; Versfeld, D. Review of Automatic Detection and Classification Techniques for Cetacean Vocalization. IEEE Access 2020, 8, 105181–105206. [Google Scholar]
- Xiong, Z.; Ramchandran, K.; Orchard, M.T.; Zhang, Y.Q. A comparative study of DCT- and wavelet-based image coding. IEEE Trans. Circuits Syst. Video Technol. 1999, 9, 692–697. [Google Scholar]
- Halidou, A.; Mohamadou, Y.; Ari, A.; Zacko, E. Review of wavelet denoising algorithms. Multimed. Tools Appl. 2023, 82, 41539–41569. [Google Scholar]
- Singh, A.K.; Bhushan, S.; Vij, S.; Goyal, D.B.; Bălaş, V.E.; Mukherjee, A.; Hugo, C.; Albuquerque, V.D.; Gupta, A.K. Analysis and Comparison of DCT- and DWT-Based Image Compression Techniques. In Information Management and Machine Intelligence, Proceedings of the ICIMMI 2019, Jaipur, India, 14–15 December 2019; Springer: Singapore, 2021; pp. 45–55. [Google Scholar]
- Mallat, S.G.; Peyré, G. A Wavelet Tour of Signal Processing: The Sparse Way; Elsevier/Academic Press: Amsterdam, The Netherlands, 2009. [Google Scholar]
- Goyal, B.; Dogra, A.; Agrawal, S.; Sohi, B.S.; Sharma, A. Image denoising review: From classical to state-of-the-art approaches. Inf. Fusion 2020, 55, 220–264. [Google Scholar]
- Donoho, D.L.; Johnstone, I.M.; Kerkyacharian, G.; Picard, D. Density estimation by wavelet thresholding. Ann. Stat. 1996, 24, 508–539. [Google Scholar]
- Liu, Y.; Bei, G.; Jiang, Z.; Meng, Q.; Shi, H. Adaptive Noise Reduction Algorithm for Chaotic Signals Based on Wavelet Packet Transform. J. Electron. Inf. Technol. 2023, 45, 3676–3684. [Google Scholar]
- Breiman, L. Random Forests. Mach. Learn. 2001, 45, 5–32. [Google Scholar]
- Silberberg, M.; Grecco, H.E. Binlets: Data fusion-aware denoising enables accurate and unbiased quantification of multichannel signals. Inf. Fusion 2024, 101, 101999. [Google Scholar]
- Xie, S.; Lu, J.; Liu, J.; Zhang, Y.; Lv, D.; Chen, X. Multi-view features fusion for birdsong classification. Ecol. Inform. 2022, 72, 101893. [Google Scholar]
- Gong, L.; Xie, S.; Zhang, Y.; Xiong, Y.; Wang, X.; Li, J. A Robust Feature Extraction Method for Sound Signals Based on Gabor and MFCC. In Proceedings of the 6th International Conference on Communication and Information Systems (ICCIS), Chongqing, China, 14–16 October 2022; IEEE: Piscataway, NJ, USA, 2022; Volume 2022, pp. 49–55. [Google Scholar]
- Chi, Y.; Cai, C.; Ren, J.; Xue, Y.; Zhang, N. Damage location diagnosis of frame structure based on wavelet denoising and convolution neural network implanted with Inception module and LSTM. Struct. Health Monit. 2024, 23, 57–76. [Google Scholar]
- Donoho, D.L.; Johnstone, I.M. Ideal spatial adaptation by wavelet shrinkage. Biometrika 1994, 81, 425–455. [Google Scholar]
- Donoho, D.L.; Johnstone, I.M. Adapting to Unknown Smoothness via Wavelet Shrinkage. J. Am. Stat. Assoc. 1995, 90, 1200–1224. [Google Scholar]
- Sardy, S. Minimax threshold for denoising complex signals with Waveshrink. IEEE Trans. Signal Process. 2000, 48, 1023–1031. [Google Scholar]
- Donoho, D.L. De-noising by soft-thresholding. IEEE Trans. Inf. Theory 1995, 41, 613–640. [Google Scholar]
- Bonet-Solà, D.; Alsina-Pagès, R.M. A Comparative Survey of Feature Extraction and Machine Learning Methods in Diverse Acoustic Environments. Sensors 2021, 21, 1274. [Google Scholar] [CrossRef]
- Andono, P.N.; Shidik, G.F.; Prabowo, D.P.; Pergiwati, D.; Pramunendar, R.A. Bird Voice Classification Based on Combination Feature Extraction and Reduction Dimension with the K-Nearest Neighbor. IJIES 2022, 15, 262–272. [Google Scholar]
- Andono, P.N.; Shidik, G.F.; Prabowo, D.P.; Yanuarsari, D.H.; Sari, Y.; Pramunendar, R.A. Feature Selection on Gammatone Cepstral Coefficients for Bird Voice Classification Using Particle Swarm Optimization. IJIES 2023, 16, 254–264. [Google Scholar]
- Sui, T.; Yang, F.; Wang, R.; Li, X.; Liu, F. Research on bird sound recognition based on deep learning. In Proceedings of the International Conference on Automation Control, Algorithm, and Intelligent Bionics (ACAIB 2023), Xiamen, China, 28–30 April 2023; Ladaci, S., Kaswan, S., Eds.; SPIE: Bellingham, WA, USA, 2023; Volume 31, p. 85. [Google Scholar]
- Peng, C.; Zhang, Y.; Lv, D.; Lv, D.; Huang, Q.; Xiong, Y. FGS-Net: A Mutual Feature Fusion Residual Network Based on FBank and Gabor-Sinc Spectrogram for Birdsong Classification. In Proceedings of the 2024 10th International Conference on Computer and Communications (ICCC), Chengdu, China, 13–16 December 2024; IEEE: Piscataway, NJ, USA, 2024; pp. 639–644. [Google Scholar]
- García-Rodríguez, I. Multispecies bird sound recognition using a fully convolutional neural network. Appl. Intell. 2023, 53, 23287–23300. [Google Scholar]
- Wang, Q.; Song, Y.; Du, Y.; Yang, Z.; Cui, P.; Luo, B. Hierarchical-taxonomy-aware and attentional convolutional neural networks for acoustic identification of bird species: A phylogenetic perspective. Ecol. Inform. 2024, 80, 102538. [Google Scholar]
- Liao, Z.; Hu, S.; Hou, R.; Liu, M.; Xu, P.; Zhang, Z. Automatic recognition of giant panda vocalizations using wide spectrum features and deep neural network. MBE 2023, 20, 15456–15475. [Google Scholar]
- Cui, L.; Wang, Z. Study on Voiceprint Recognition Based on Mixed Features of LFBank and FBank. Comput. Sci. 2022, 49, 211000194. [Google Scholar]
- Wu, J.; Li, P.; Wang, Y.; Lan, Q.; Wang, X.; Wang, Z. VFR: The Underwater Acoustic Target Recognition Using Cross-Domain Pre-Training with FBank Fusion Features. J. Mar. Sci. Eng. 2023, 11, 263. [Google Scholar] [CrossRef]
- Lu, J.; Zhang, Y.; Danjv, L.; Xie, S.; Fu, Y.; Dan, L. Improved Broad Learning System for Birdsong Recognition. Appl. Sci. 2023, 13, 11009. [Google Scholar] [CrossRef]
- Zheng, W. Power Quality Disturbance Signal Denoising Algorithm Based on Improved Wavelet Threshold. Appl. Switchg. 2021, 1, 28–33. [Google Scholar]
- Yi, T.H.; Li, H.N.; Zhao, X.Y. Noise Smoothing for Structural Vibration Test Signals Using an Improved Wavelet Thresholding Technique. Sensors 2012, 12, 11205–11225. [Google Scholar] [CrossRef]
- Zhang, J.; Zhong, Q.; Dai, Y. The determination of the threshold and the decomposition order in threshold de-noising method based on wavelet transform. Proc. CSEE 2004, 24, 118–140. [Google Scholar]
- Yang, H.; Cheng, Y.; Li, G. A denoising method for ship radiated noise based on Spearman variational mode decomposition, spatial-dependence recurrence sample entropy, improved wavelet threshold denoising, and Savitzky-Golay filter. Alex. Eng. J. 2021, 60, 3379–3400. [Google Scholar] [CrossRef]
- Wang, J.; Sun, Y.; Sun, S. Recognition of Muscle Fatigue Status Based on Improved Wavelet Threshold and CNN-SVM. IEEE Access 2020, 8, 207914–207936. [Google Scholar] [CrossRef]
- Fu, R.; Zhang, J.; Wang, R.; Xu, T. Improved Wavelet Thresholding Function and Adaptive Thresholding for Noise Reduction. In Proceedings of the 11th International Conference on Intelligent Computing and Wireless Optical Communications (ICWOC), Chongqing, China, 16–18 June 2023; IEEE: Piscataway, NJ, USA, 2023; pp. 25–30. [Google Scholar]
- Xie, B.; Xiong, Z.; Wang, Z.; Zhang, L.; Zhang, D.; Li, F. Gamma spectrum denoising method based on improved wavelet threshold. Nucl. Eng. Technol. 2020, 52, 1771–1777. [Google Scholar] [CrossRef]
- Srivastava, M.; Anderson, C.L.; Freed, J.H. A New Wavelet Denoising Method for Selecting Decomposition Levels and Noise Thresholds. IEEE Access 2016, 4, 3862–3877. [Google Scholar] [CrossRef] [PubMed]
- Tang, P.; Guo, B. Wavelet Denoising Based on Modified Threshold Function Optimization Method. J. Signal Process. 2017, 33, 102–112. [Google Scholar]
- Liu, F.; Shen, T.; Luo, Z.; Zhao, D.; Guo, S. Underwater target recognition using convolutional recurrent neural networks with 3-D Mel-spectrogram and data augmentation. Appl. Acoust. 2021, 178, 107989. [Google Scholar] [CrossRef]
- Daubechies, I. Orthonormal bases of compactly supported wavelets. Commun. Pure Appl. Math. 1988, 41, 909–996. [Google Scholar] [CrossRef]
- Zhang, Y.; Ding, W.; Pan, Z.; Qin, J. Improved Wavelet Threshold for Image De-noising. Front. Neurosci. 2019, 13, 39. [Google Scholar] [CrossRef]
- Pahuja, R.; Kumar, A. Sound-spectrogram based automatic bird species recognition using MLP classifier. Appl. Acoust. 2021, 180, 108077. [Google Scholar] [CrossRef]
- Ntalampiras, S. Bird species identification via transfer learning from music genres. Ecol. Inform. 2018, 44, 76–81. [Google Scholar] [CrossRef]
- Xie, S.; Zhang, Y.; Lv, D.; Xu, H.; Liu, J.; Yin, Y. Birdsongs recognition based on ensemble ELM with multi-strategy differential evolution. Sci. Rep. 2022, 12, 9739. [Google Scholar] [CrossRef] [PubMed]
- Wang, H.; Xu, Y.; Yu, Y.; Lin, Y.; Ran, J. An Efficient Model for a Vast Number of Bird Species Identification Based on Acoustic Features. Animals 2022, 12, 2434. [Google Scholar] [CrossRef] [PubMed]
- Kamarajugadda, R.; Battula, R.; Borra, C.R.; Durga, H.; Bypilla, V.; Reddy, S.S. Optimizing avian species recognition with MFCC features and deep learning models. Int. J. Inf. Tecnol. 2024, 16, 4621–4627. [Google Scholar] [CrossRef]
- Royle, J.A. Modelling sound attenuation in heterogeneous environments for improved bioacoustic sampling of wildlife populations. Methods Ecol. Evol. 2018, 9, 1939–1986. [Google Scholar] [CrossRef]


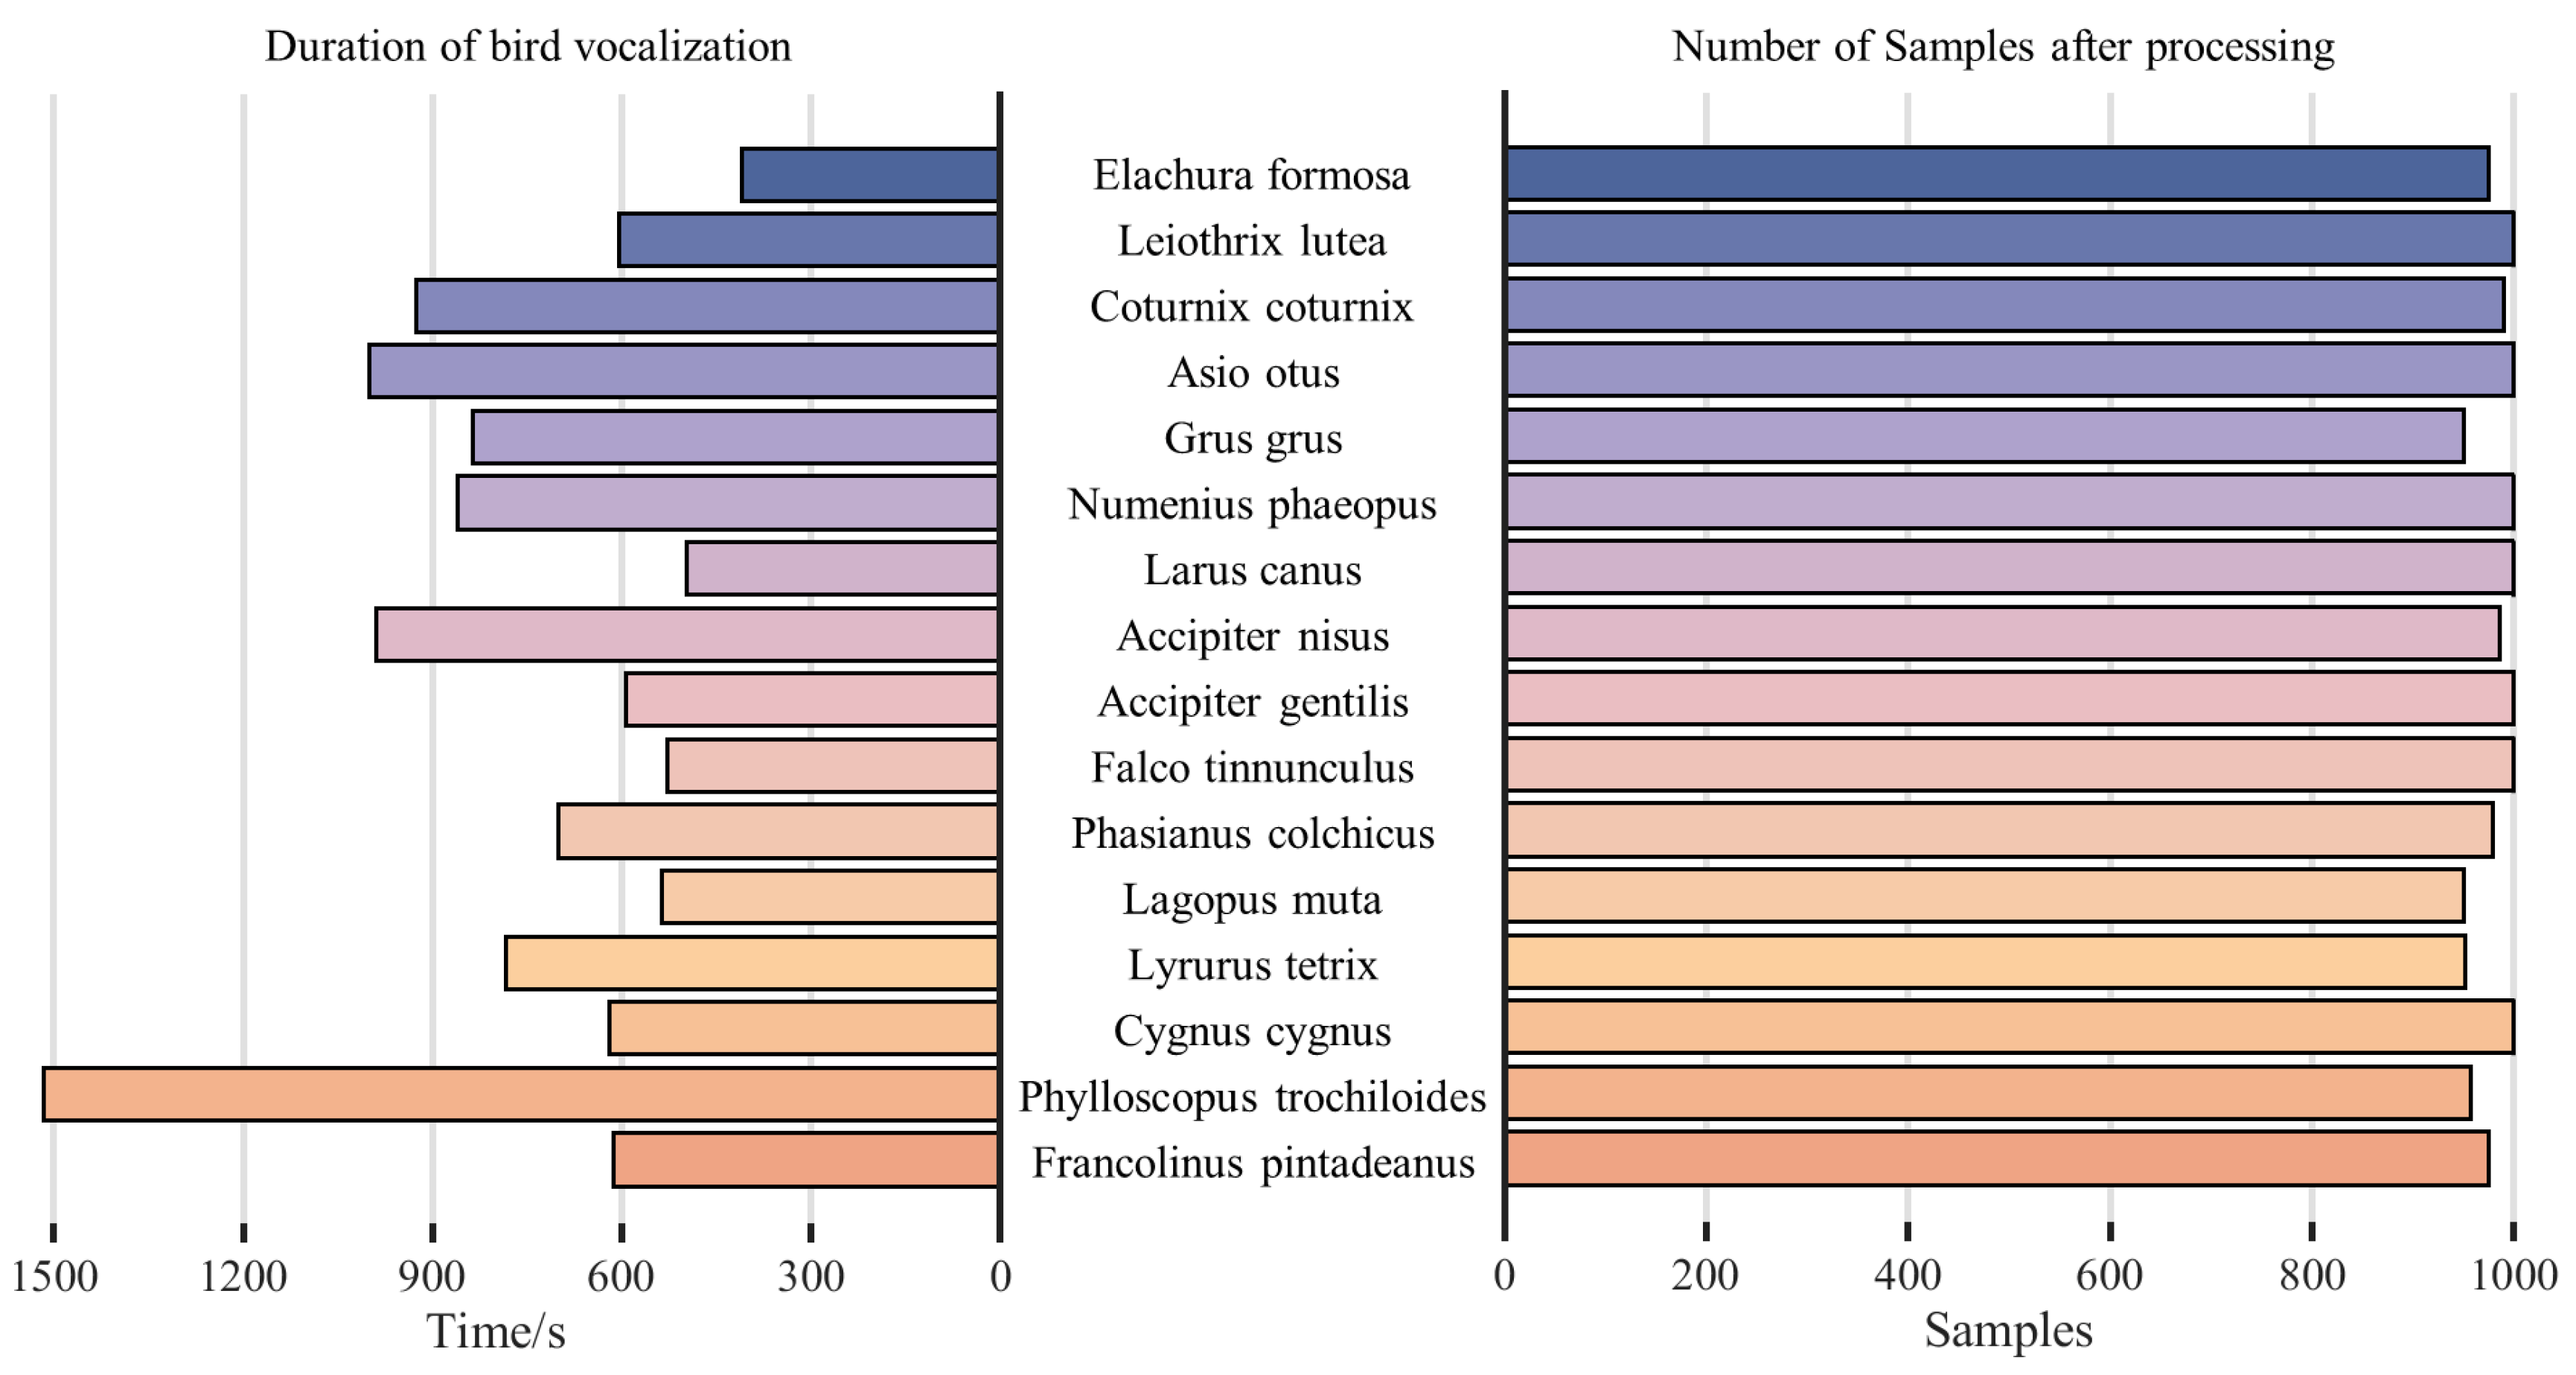
| ID | Latin Name | Number of Audio Recordings | Duration of Bird Vocalization (s) |
|---|---|---|---|
| 1 | Elachura formosa | 13 | 409.97 |
| 2 | Leiothrix lutea | 15 | 604.88 |
| 3 | Coturnix coturnix | 14 | 925.56 |
| 4 | Asio otus | 32 | 1001.03 |
| 5 | Grus grus | 19 | 835.76 |
| 6 | Numenius phaeopus | 30 | 860.62 |
| 7 | Larus canus | 11 | 497.83 |
| 8 | Accipiter nisus | 20 | 989.37 |
| 9 | Accipiter gentilis | 17 | 592.73 |
| 10 | Falco tinnunculus | 14 | 527.57 |
| 11 | Phasianus colchicus | 11 | 701.19 |
| 12 | Lagopus muta | 10 | 536.17 |
| 13 | Lyrurus tetrix | 8 | 784.16 |
| 14 | Cygnus cygnus | 15 | 619.89 |
| 15 | Phylloscopus trochiloides | 21 | 1516.88 |
| 16 | Francolinus pintadeanus | 13 | 612.85 |
| Name of Feature | Description |
|---|---|
| MFCC, FBank | Traditional features without denoising |
| iWAVE-FBank | Denoising method: iWAVE, feature extraction method: FBank |
| iWAVE-iFBank | Denoising method: iWAVE, feature extraction method: iFBank |
| iWAVE-BiFBank | Denoising method: iWAVE, feature extraction method: BiFBank |
| Object | Relevant Parameter Settings |
|---|---|
| Wavelet basis | sym3 [44] |
| MFCC, FBank, iFBank, BiFBank | randomSeed: 77, pre-emphasis parameter: 0.97, frame size: 512, frameshift: 256, overlap rate: 0.5, window: Hamming window, numFilters: 40, numMFCCcoefficients: 13 |
| RF [14] | numTrees: 100, maxDepth: 0, randomSeed: 0, numFeatures: |
| Threshold Selection Rule | Blocks | Bumps | ||||||
|---|---|---|---|---|---|---|---|---|
| 0.01 | 0.5 | 3 | 10 | 0.01 | 0.5 | 3 | 10 | |
| RigrSure [20] | 44.23 | 34.33 | 29.35 | 25.23 | 39.85 | 30.10 | 25.12 | 20.99 |
| MinMax [21] | 41.94 | 34.11 | 29.34 | 25.31 | 40.12 | 30.12 | 25.09 | 21.11 |
| Zheng [34] | 42.83 | 33.62 | 28.68 | 24.68 | 38.59 | 29.35 | 24.38 | 20.37 |
| Wang et al. [38] | 43.97 | 34.00 | 29.15 | 25.32 | 40.09 | 30.09 | 25.09 | 21.09 |
| Fu et al. [39] | 41.73 | 32.28 | 27.24 | 23.20 | 37.41 | 27.97 | 22.93 | 18.88 |
| Xie et al. [40] | 38.81 | 29.32 | 24.22 | 20.12 | 34.48 | 24.99 | 19.89 | 15.78 |
| Srivastava et al. [41] | 42.83 | 33.63 | 28.68 | 24.68 | 38.59 | 29.36 | 24.38 | 20.37 |
| Proposed Method | 44.02 | 34.35 | 29.40 | 25.42 | 39.86 | 30.11 | 25.12 | 21.12 |
| Threshold Function | Blocks | Bumps | ||||||
|---|---|---|---|---|---|---|---|---|
| 0.01 | 0.5 | 3 | 10 | 0.01 | 0.5 | 3 | 10 | |
| Hard-Threshold [19] | 35.76 | 24.30 | 19.98 | 17.66 | 32.71 | 24.26 | 19.87 | 15.70 |
| Soft-Threshold [20] | 28.43 | 21.87 | 18.21 | 16.26 | 27.52 | 20.50 | 16.21 | 13.48 |
| Proposed Method | 35.70 | 24.50 | 20.45 | 17.05 | 33.54 | 24.62 | 20.36 | 16.58 |
| Feature | Performance/% | ||||
|---|---|---|---|---|---|
| Accuracy(±SD) | F1 Score(±SD) | Kappa(±SD) | Precision(±SD) | Recall(±SD) | |
| MFCC | 77.98 ± 0.97 | 77.62 ± 0.77 | 76.38 ± 0.78 | 77.96 ± 0.72 | 77.84 ± 0.74 |
| FBank | 83.05 ± 0.93 | 83.14 ± 0.82 | 82.09 ± 0.86 | 83.18 ± 0.77 | 83.19 ± 0.82 |
| iWAVE-FBank | 88.67 ± 0.78 | 88.95 ± 0.42 | 88.26 ± 0.40 | 88.95 ± 0.32 | 88.93 ± 0.42 |
| iWAVE-iFBank | 89.58 ± 0.60 | 89.57 ± 0.45 | 89.02 ± 0.43 | 89.64 ± 0.42 | 89.62 ± 0.42 |
| iWAVE-BiFBank | 94.00 ± 0.44 | 93.57 ± 0.19 | 93.03 ± 0.20 | 93.54 ± 0.16 | 93.48 ± 0.19 |
| Study | Year | Method | Number of Bird Species | Performance/% |
|---|---|---|---|---|
| Ntalampiras [47] | 2018 | MFCC with hidden Markov model (HMM) -based RF | 10 | Accuracy: 92.5 |
| Pahuja et al. [46] | 2021 | STFT with multi-layer perceptron (MLP) | 8 | Accuracy: 96.1, Precision: 84.5, Recall: 82.6 |
| Xie et al. [48] | 2022 | MFCC with ensemble-optimized extreme learning machine (ELM) | 9 | Accuracy: 89.05 |
| Wang et al. [49] | 2022 | FBank and MFCC with long short-term memory (LSTM) | 264 | Accuracy: 74.94 |
| Andono et al. [25] | 2023 | Combined MFCC, GTCC, NB, KNN, NN, GMM, and PSO | 264 | Accuracy: 78.33 |
| Sui et al. [26] | 2023 | FBank with transformer model | 10 | Accuracy: 85.77 |
| García-Ordás et al. [28] | 2023 | FBank with full CNN | 17 | Accuracy: 85.71 |
| Wang et al. [29] | 2024 | 3D-FBank with Phylogenetic Perspective Neural Network (PPNN) | 500 | Accuracy: 89.95 |
| Kamarajugadda et al. [50] | 2024 | MFCC with CNN, LSTM, and VGGish | 5 | Accuracy: 87.37 |
| Proposed method | 2024 | iWAVE-BiFBank | 16 | Accuracy: 94.00, F1 score: 93.57, Kappa: 93.03, Precision: 93.54, Recall: 93.48 |
Disclaimer/Publisher’s Note: The statements, opinions and data contained in all publications are solely those of the individual author(s) and contributor(s) and not of MDPI and/or the editor(s). MDPI and/or the editor(s) disclaim responsibility for any injury to people or property resulting from any ideas, methods, instructions or products referred to in the content. |
© 2025 by the authors. Licensee MDPI, Basel, Switzerland. This article is an open access article distributed under the terms and conditions of the Creative Commons Attribution (CC BY) license (https://creativecommons.org/licenses/by/4.0/).
Share and Cite
Peng, C.; Zhang, Y.; Lu, J.; Lv, D.; Xiong, Y. A Bird Vocalization Classification Method Based on Bidirectional FBank with Enhanced Robustness. Appl. Sci. 2025, 15, 4913. https://doi.org/10.3390/app15094913
Peng C, Zhang Y, Lu J, Lv D, Xiong Y. A Bird Vocalization Classification Method Based on Bidirectional FBank with Enhanced Robustness. Applied Sciences. 2025; 15(9):4913. https://doi.org/10.3390/app15094913
Chicago/Turabian StylePeng, Chizhou, Yan Zhang, Jing Lu, Danjv Lv, and Yanjiao Xiong. 2025. "A Bird Vocalization Classification Method Based on Bidirectional FBank with Enhanced Robustness" Applied Sciences 15, no. 9: 4913. https://doi.org/10.3390/app15094913
APA StylePeng, C., Zhang, Y., Lu, J., Lv, D., & Xiong, Y. (2025). A Bird Vocalization Classification Method Based on Bidirectional FBank with Enhanced Robustness. Applied Sciences, 15(9), 4913. https://doi.org/10.3390/app15094913