1. Introduction
Shipping is the primary carrier of international logistics, with maritime transport accounting for more than 80% of global trade, strongly supporting the formation of the “world factory” and making economic globalization possible. In this context, effectively managing port and aviation activities has become key to enhancing efficiency, reducing costs, and increasing profitability in the port and shipping logistics industry.
However, public health events such as the spread of pandemics have not only brought unprecedented challenges to the global shipping industry, but also had a profound impact on the operation and development of cities. As centers of global economic, cultural, and social activities, cities heavily rely on the shipping system for their daily operations. The outbreak of public health events often leads to a significant reduction in shipping efficiency or even disruption, highlighting the instability and vulnerability of the shipping network. There has been widespread attention on how to establish effective cross-border risk warning systems within the shipping network, and improve the accuracy and relevance of risk assessments in the shipping industry.
Current research on risk propagation in networks remains a key focus. From a methodological perspective, existing studies are predominantly conducted on idealized networks with distinct structural features, exploring risk transmission mechanisms through network attributes. This study advances the field by investigating risk propagation across interconnected shipping networks, explicitly quantifying their coupling characteristics to strengthen practical applicability.
To address research gaps, this study develops a global air–maritime coupled network risk propagation model by integrating complex network theory with the improved SEIR-SEI model. The significance of this study lies in the following: (1) identifying limitations of dynamic propagation models in maritime networks and proposing an enhanced SEIR-SEI framework incorporating multiple influencing factors and transmission dynamics; (2) establishing a novel risk propagation model for globally interconnected air–sea transportation systems through complex network coupling, enabling systematic investigation of cross-modal risk transmission processes; (3) conducting empirical analyses on maritime networks across selected nations to reveal risk propagation patterns through dual perspectives of nodal inherent risks and transmission probabilities, demonstrating substantial practical implications; and (4) developing an integrated risk warning methodology that synthesizes intra-regional and cross-regional transmission mechanisms, providing a scientific foundation for constructing comprehensive risk prevention systems.
2. Literature Review
International trade, transportation, and regional economic development are inherently interconnected. A strong bidirectional relationship exists between international trade and transportation systems. Nguyen and Tongzon [
1] employed a vector autoregression (VAR) model to investigate the causal relationship between trade and the development of Australia’s transportation and logistics sector, whose primary markets include China, Japan, and the United States. Their findings revealed mutual reinforcement: trade drives transportation growth, and vice versa. This conclusion is corroborated by Chaisumpunsakul and Pholphirul [
2], who posit that trade fosters international integration and stimulates investments in transportation infrastructure, language proficiency, and technology—all critical enablers of transportation advancement. Alamá-Sabater et al. [
3] further validated this linkage, demonstrating that interregional trade across Spanish provinces benefits significantly from transportation networks.
Thus, advanced transportation systems serve as prerequisites for efficient resource allocation, specialized division of labor, and sustainable spatial organization of economic activities. Extensive empirical studies have examined transportation’s pivotal role in urban emergence, demographic shifts, and regional economic dynamics. For instance, Bosker and Buringh [
4] analyzed the spatial distribution of European cities over a millennium (800–1800 CE), concluding that proximity to navigable waterways or land routes fundamentally shaped urban development. Notably, most high-density, prosperous urban areas in modern Europe remain aligned with ancient Roman road networks [
5].
However, public health emergencies pose severe disruptions to transportation systems, escalating operational costs and triggering supply chain fractures, which inflict substantial economic losses on trade-dependent cities [
6]. To mitigate these impacts, this study focuses on risk propagation within global shipping networks—a critical transportation modality—to optimize resilience against public health crises.
In recent decades, scholars have conducted extensive research on the rules of risk propagation within networks. Li et al. [
7] examined the risk of delay propagation of container ships in shipping networks. They proposed an effective method for constructing a causal network for container ship delay propagation risks based on efficient multivariate transfer clipping. Additionally, many risk propagation studies have adopted epidemic models; Wang et al. [
8] considered the transfer of recurrent risks based on infectious disease models. By calculating risk equilibrium points, they concluded that risks could persist in supply chains over the long term. Moreover, Guo et al. [
9] developed a new fuzzy dynamic Bayesian network method to improve the accuracy of dynamic risk assessment and propagation. Li et al. [
10] innovatively introduced SoV (a method that starts from the causes of errors, considers the transmission and accumulation effects of errors in different processes, and uses mathematical analysis to describe this effect) into the study of quality risk propagation in the collaborative manufacturing supply chain network of complex products, proposing a method to identify key quality risk factors in supply chain networks based on the risk propagation effect. In multimodal transport networks, it is also necessary to explore the laws of risk propagation to mitigate cascading failures within the network. He et al. [
11] pioneered the integration of cascading failure theory into risk propagation analysis of multimodal transportation networks, aiming to unveil the intrinsic mechanisms of risk transmission. This approach provides a theoretical foundation for enhancing safety management in interconnected transportation systems. Guo et al. [
12] focused on multimodal transport networks and proposed a quantitative method based on improved percolation theory to explore the dynamics of risk transmission.
With the rapid development of complexity science, complex network theory has found wide application across various fields. The study of air transportation using complex network theory has also become a research hotspot. Feng et al. [
13] validated the use of a proposed causal inference algorithm based on system path isolation to analyze delay propagation in air transportation networks. Zhou et al. [
14], from the perspective of Bayesian network modeling, analyze the evolution of various causal and outcome events in different scenarios within the commercial air transport system and construct a resource investment optimization decision model to reduce commercial aviation safety risks. In the study of complex networks, it has been found that a few nodes play the role of “critical nodes”. These nodes have an irreplaceable role in network performance, often determining the structure and function of the network. Zekun et al. [
15] proposed a method for identifying critical conflict aircraft based on complex network theory and node deletion methods, which can identify key conflict points in an aircraft state network. Wandelt et al. [
16] developed a mixed integer programming model that can fully assess the robustness of individual flights and airports for airlines, providing an approximately optimal solution within an acceptable operational time. Shaw [
17] and Malighetti [
18] used the shortest path method and the fastest path method, respectively, to measure the connectivity of the air transportation network. Liu et al. [
19] and Sun [
20] studied the robustness of airline networks by proposing a route optimization algorithm and 12 attack strategies, respectively. Chandra et al. [
21] used a novel comprehensive framework for two-dimensional airspace sectorization, which integrates various methods for boundary design to find system-wide flow distribution on the network.
Due to its wide coverage, large transportation capacity, and low cost, maritime transport holds an irreplaceable position in modern cargo transportation. Moreover, with the deepening of globalization, the scale and complexity of the maritime network are continuously increasing. P. Kaluza et al. [
22], based on complex network theory, proposed global and regional container shipping networks, with analytical results indicating that these networks exhibit small-world and scale-free characteristics. Viljoen et al. [
23] conducted research on the hierarchical structure of maritime networks using complex network theory, revealing that maritime networks maintain an evolving state. Ducruet et al. [
24] studied the transportation networks of tankers, containers, and bulk carriers, concluding that small-scale deliberate attacks could significantly impact the integrity of container shipping networks. Guo et al. [
25] conducted an in-depth study on the spatial structure and vulnerability of the China–Yokohama–Korea shipping network, asserting that China’s main hub ports have the greatest impact on the stability of the China–Yokohama–Korea network. Mou et al. [
26] explored the spatial characteristics of the Maritime Silk Road shipping network, pointing out that the regional competitiveness of the container ship network is the strongest. Zhang et al. [
27], based on complex network theory and COLREs (navigational rules such as the collision regulations), constructed a complex network of maritime traffic conditions and proposed a new method to enhance the situational awareness capability of maritime traffic service operators, ultimately improving the performance of maritime traffic services. In addition to improving the transportation efficiency of maritime shipping, preventing the significant risks posed by potential maritime accidents during transportation is also of great significance. Ma et al. [
28] developed a directed and weighted complex network of human factors leading to maritime accidents, thereby providing valuable insights for understanding the mechanisms of human factors behind maritime accidents. Deng et al. [
29], using China maritime areas and major accident investigation reports as data sources, combined with complex network theory to construct a maritime accident risk network to analyze the network’s robustness, providing maritime managers with possibilities to adopt control measures to avoid accidents. Fan et al. [
30] constructed a dynamic maritime accident risk management framework for sea routes, which can dynamically consider the risk performance of maritime trade routes and identify key influencing factors during different time intervals.
Recent years have witnessed concentrated scholarly efforts in investigating risk propagation pathways in single-layer networks, with significant applications and theoretical advancements across disciplines. However, as research deepens, the inherent limitations of single-layer network models in characterizing risk transmission mechanisms have become progressively evident.
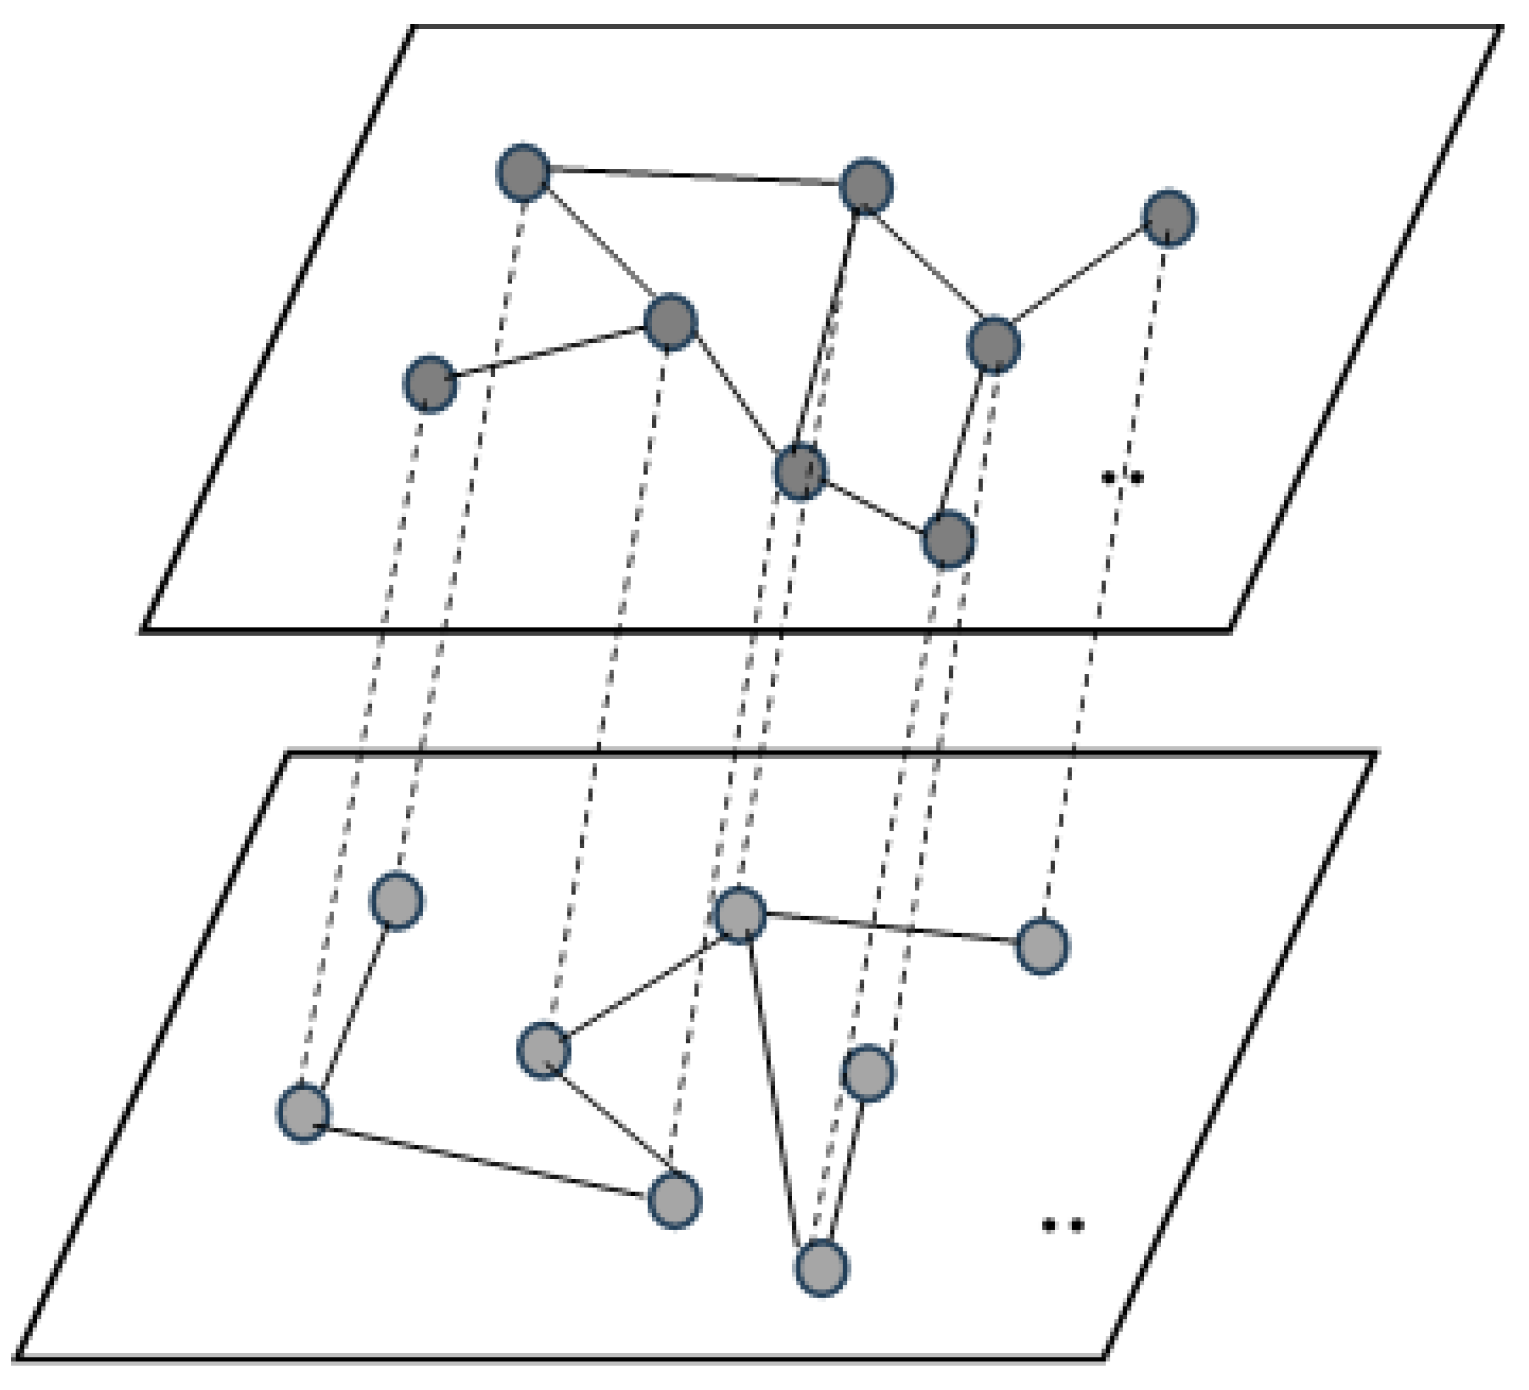
This has prompted an academic pivot toward multilayer complex networks, where researchers now systematically explore risk diffusion trajectories and impact magnitudes across interconnected layers [
31,
32,
33]. The emergence of multilayer frameworks stems from empirical realities: most real-world complex systems inherently comprise multiple interdependent subsystems. Multilayer networks formally characterize interconnections between these subsystems or network strata. Unlike conventional single-layer paradigms, multilayer architectures expand analytical dimensions through three critical innovations: (1) explicit modeling of cross-layer interactions and mapping relationships; (2) hierarchical integration of subsystem dynamics; and (3) multiscale representation of complex system behaviors [
34]. These structural enhancements enable superior modeling fidelity, particularly in simulating natural system complexities where traditional networks prove inadequate. The multilayer approach demonstrates unparalleled advantages in capturing emergent phenomena and cascading effects across network hierarchies [
35].
Current research predominantly focuses on risk propagation in single-modal air or maritime networks, while integrated analyses of multilayer risk transmission across coupled air–sea networks under public health emergencies remain understudied. To address this gap, this study develops a threefold framework: (1) an enhanced SEIR-SEI model integrating climatic, economic, and health factors to quantify inherent nodal risks through intra-regional and cross-border transmission mechanisms; (2) a global air–maritime coupled network model capturing synergistic risk interactions using complex network theory; and (3) an entropy-weighted TOPSIS evaluation system combining network metrics (clustering coefficient, centrality measures) to objectively prioritize critical nodes. Methodologically, entropy weighting [
36] eliminates subjective bias in parameter prioritization, while TOPSIS [
37] enables optimal trade-offs between conflicting metrics through multi-criteria decision-making. Simulation experiments reveal that risk propagation intensity depends on the combined effects of nodal vulnerability (inherent risks) and connectivity (transmission probabilities), with cross-modal coupling amplifying cascade effects compared to isolated network analyses. The study contributes mechanistic insights into maritime network risk dynamics, advances multilayer network modeling methodologies, and provides implementable tools for preemptive risk identification and resource allocation. Practically, these findings support the targeted hardening of critical transportation nodes and inform the development of dynamic early-warning systems, offering scientific foundations for cross-border emergency coordination in global health crises.
3. Design of Source Country Risk Propagation Model Based on Environmental Factors
3.1. Improved SEIR-SEI Transmission Model
Based on the human–mosquito transmission mechanism of mosquito-borne diseases such as dengue, considering climatic factors affecting mosquito population size, and expressing the mosquito transmission rate in terms of economic and health factors, this paper establishes the improved SEIR-SEI model as follows:
Here, denotes the susceptible population, denotes the exposed population, denotes the infected population, and denotes the recovered population. , , and represent the susceptible mosquitoes, exposed mosquitoes, and infected mosquitoes, respectively. is the transmission rate from infected mosquitoes to the susceptible population, which depends on the biting rate of mosquitoes, the probability of the vector transmitting the virus to the host, and the proportion of vectors to humans in a specific area. is the rate of transition from the exposed population to the infected population, and is the recovery rate from the infected population to the recovered population. is the transmission rate from the infected population to the susceptible mosquito population, which depends on the biting rate of mosquitoes and the probability of virus transmission from host to vector, but not on the proportion of vectors to hosts. is the rate of transition from the exposed mosquitoes to the infected mosquito population. represents the average daily temperature, represents the average daily relative humidity, represents the average wind speed, is the area of the region, represents economic factors, represents health factors, and is the mosquito population size.
3.2. Numerical Simulation
In order to analyze the inherent risks of different shipping nodes, this paper uses Python 2021.3.3 programming to simulate risk propagation within the shipping node areas. Additionally, this study incorporates economic and health indicators through GDP data sourced from the Wind Database and the Global Health Security Index obtained from the website (
https://www.ghsindex.org/ accessed on 11 August 2024.). Mosquito surveillance data and climatic parameters are derived from project-specific monitoring datasets, while mosquito-borne transmission rates are calculated based on established literature. All datasets undergo normalization to ensure comparability across heterogeneous variables. Taking the example of Chinese nodes, the parameters in the simulation are set as shown in
Table 1:
After conducting the simulation based on the above settings and the collected data, this section provides the results for the susceptible, latent, infected, and recovered populations within the nodes. The change in the number of recovered individuals over time and the comparison of the number of infected individuals with the number of infected mosquitoes over time are also examined.
Firstly,
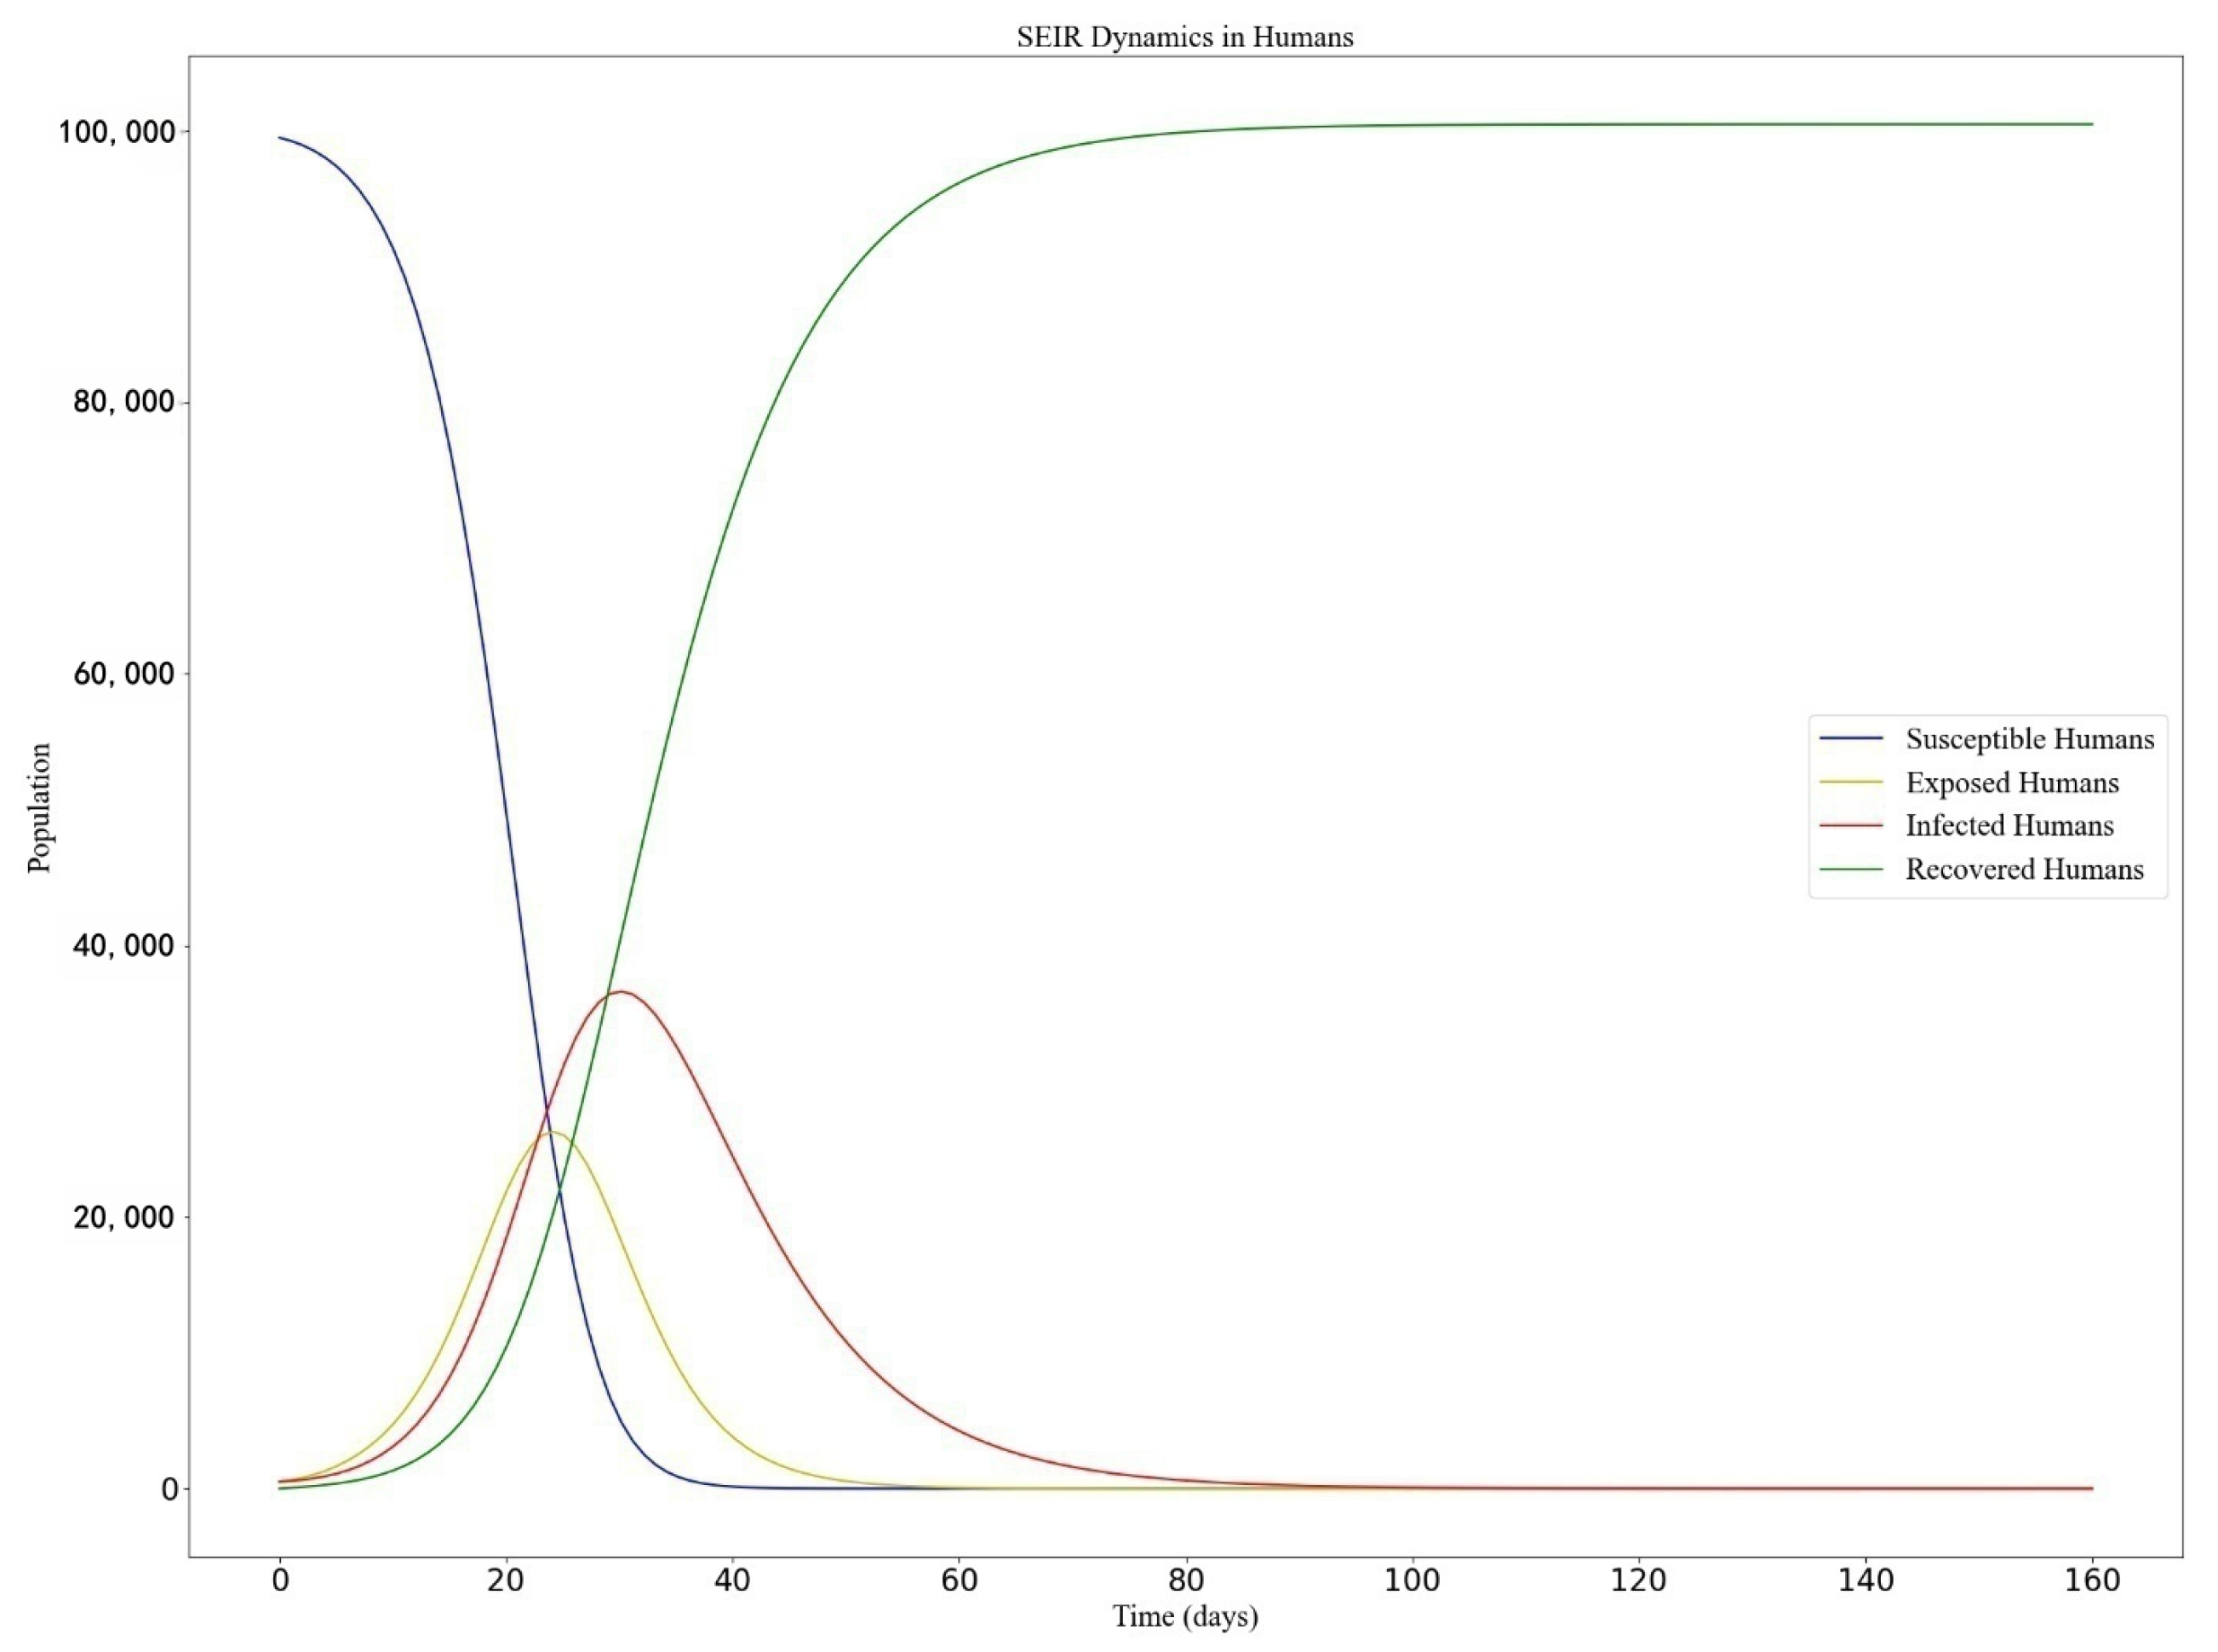
Figure 1 below shows the change in the number of susceptible, exposed, infected, and recovered individuals in the population over time. It can be seen that the number of infected people increases initially, reaches a peak at around 30 days, and then begins to decline. This is consistent with typical trends.
The S, E, I, and R curves represent the proportion of the population in the network in susceptible, exposed, infected, and recovered states at each time step during the simulation. In the figure above, the nodes in the S state show a decreasing trend because most of the susceptible population at the start will be infected or exposed after being bitten by infected mosquitoes until there are no infected nodes in the network, at which point the transmission stops. The curves for the E and I states both show a trend of rising first and then falling, and the curve for the E state reaches its peak before the I state curve. This is because there is a time lag from exposure to infection. The infected population will continue to spread after being bitten by mosquitoes, and the exposed and infected nodes eventually recover and are removed. Therefore, the R state curve shows a gradually rising trend and eventually levels off.
Figure 2 shows the comparison of the number of infected people and the number of infected mosquitoes over time. Although the trends of both are roughly similar, the number of infected mosquitoes remains higher throughout the simulation. The simulation results also show a lag between the infected population and the infected mosquitoes, which is also consistent with the transmission mechanism, meaning that an infected person needs to be bitten by mosquitoes to trigger an infection. This also illustrates the important role of vector mosquitoes in the transmission of mosquito-borne diseases like dengue.
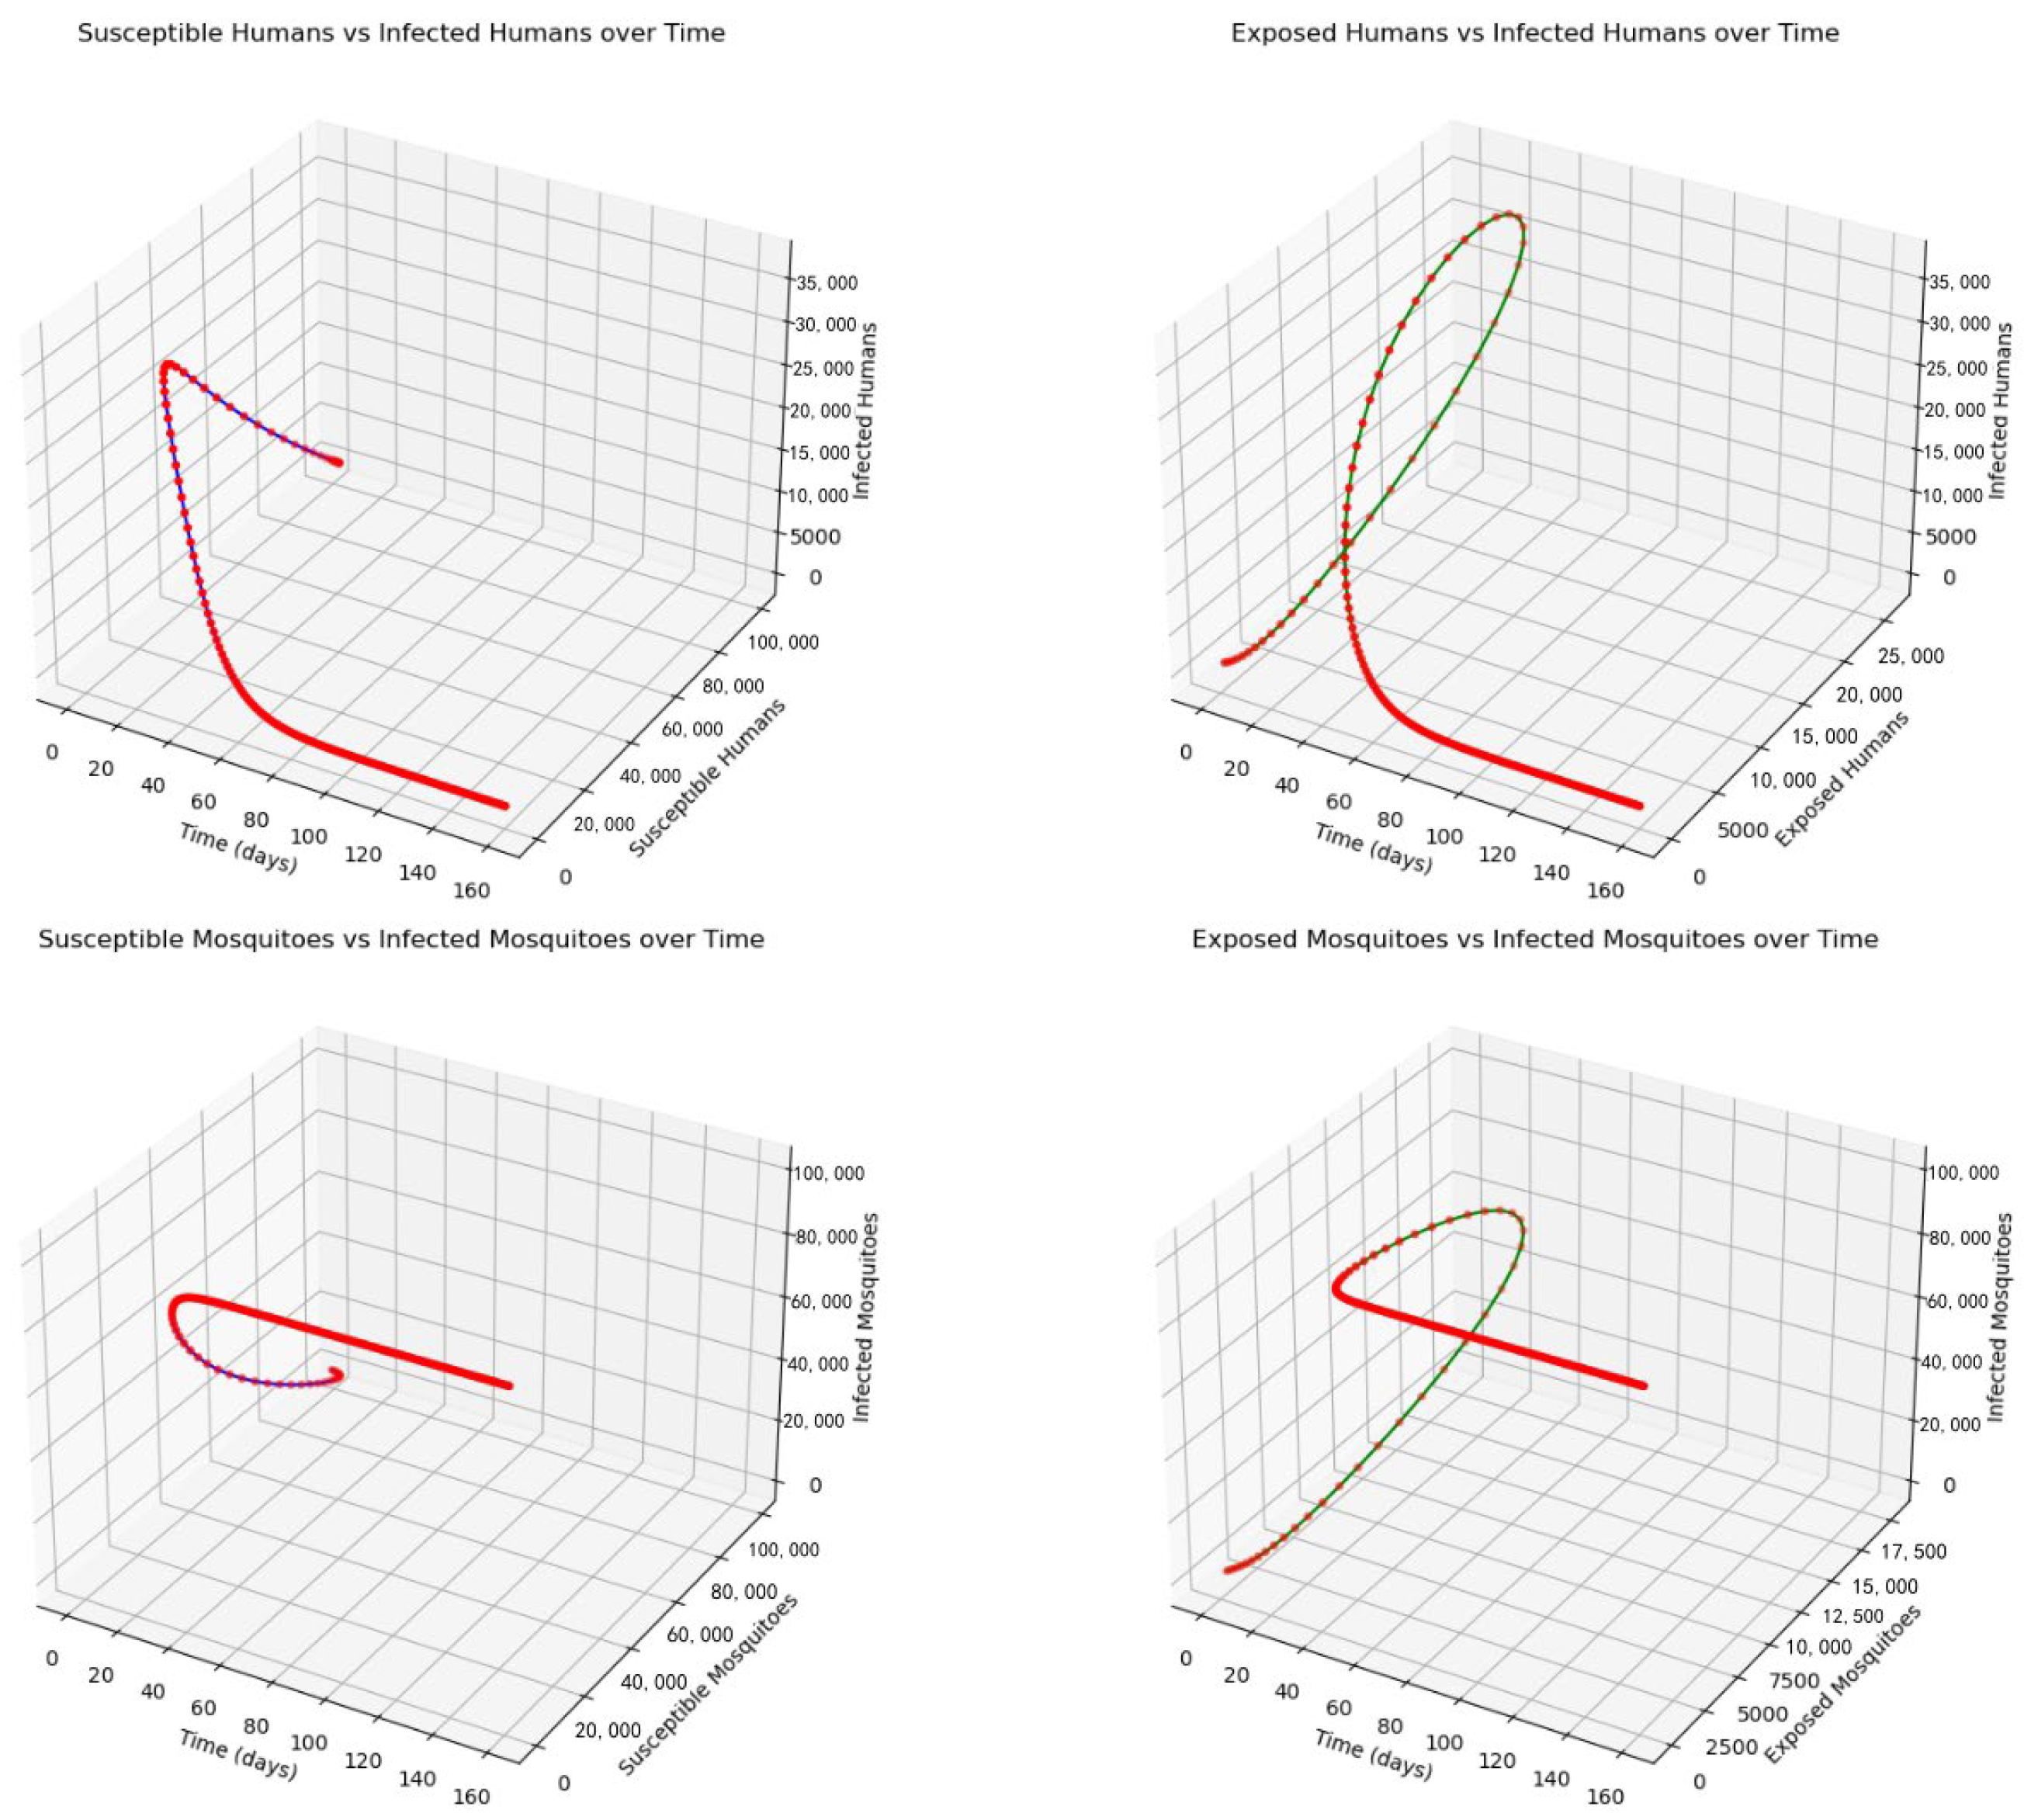
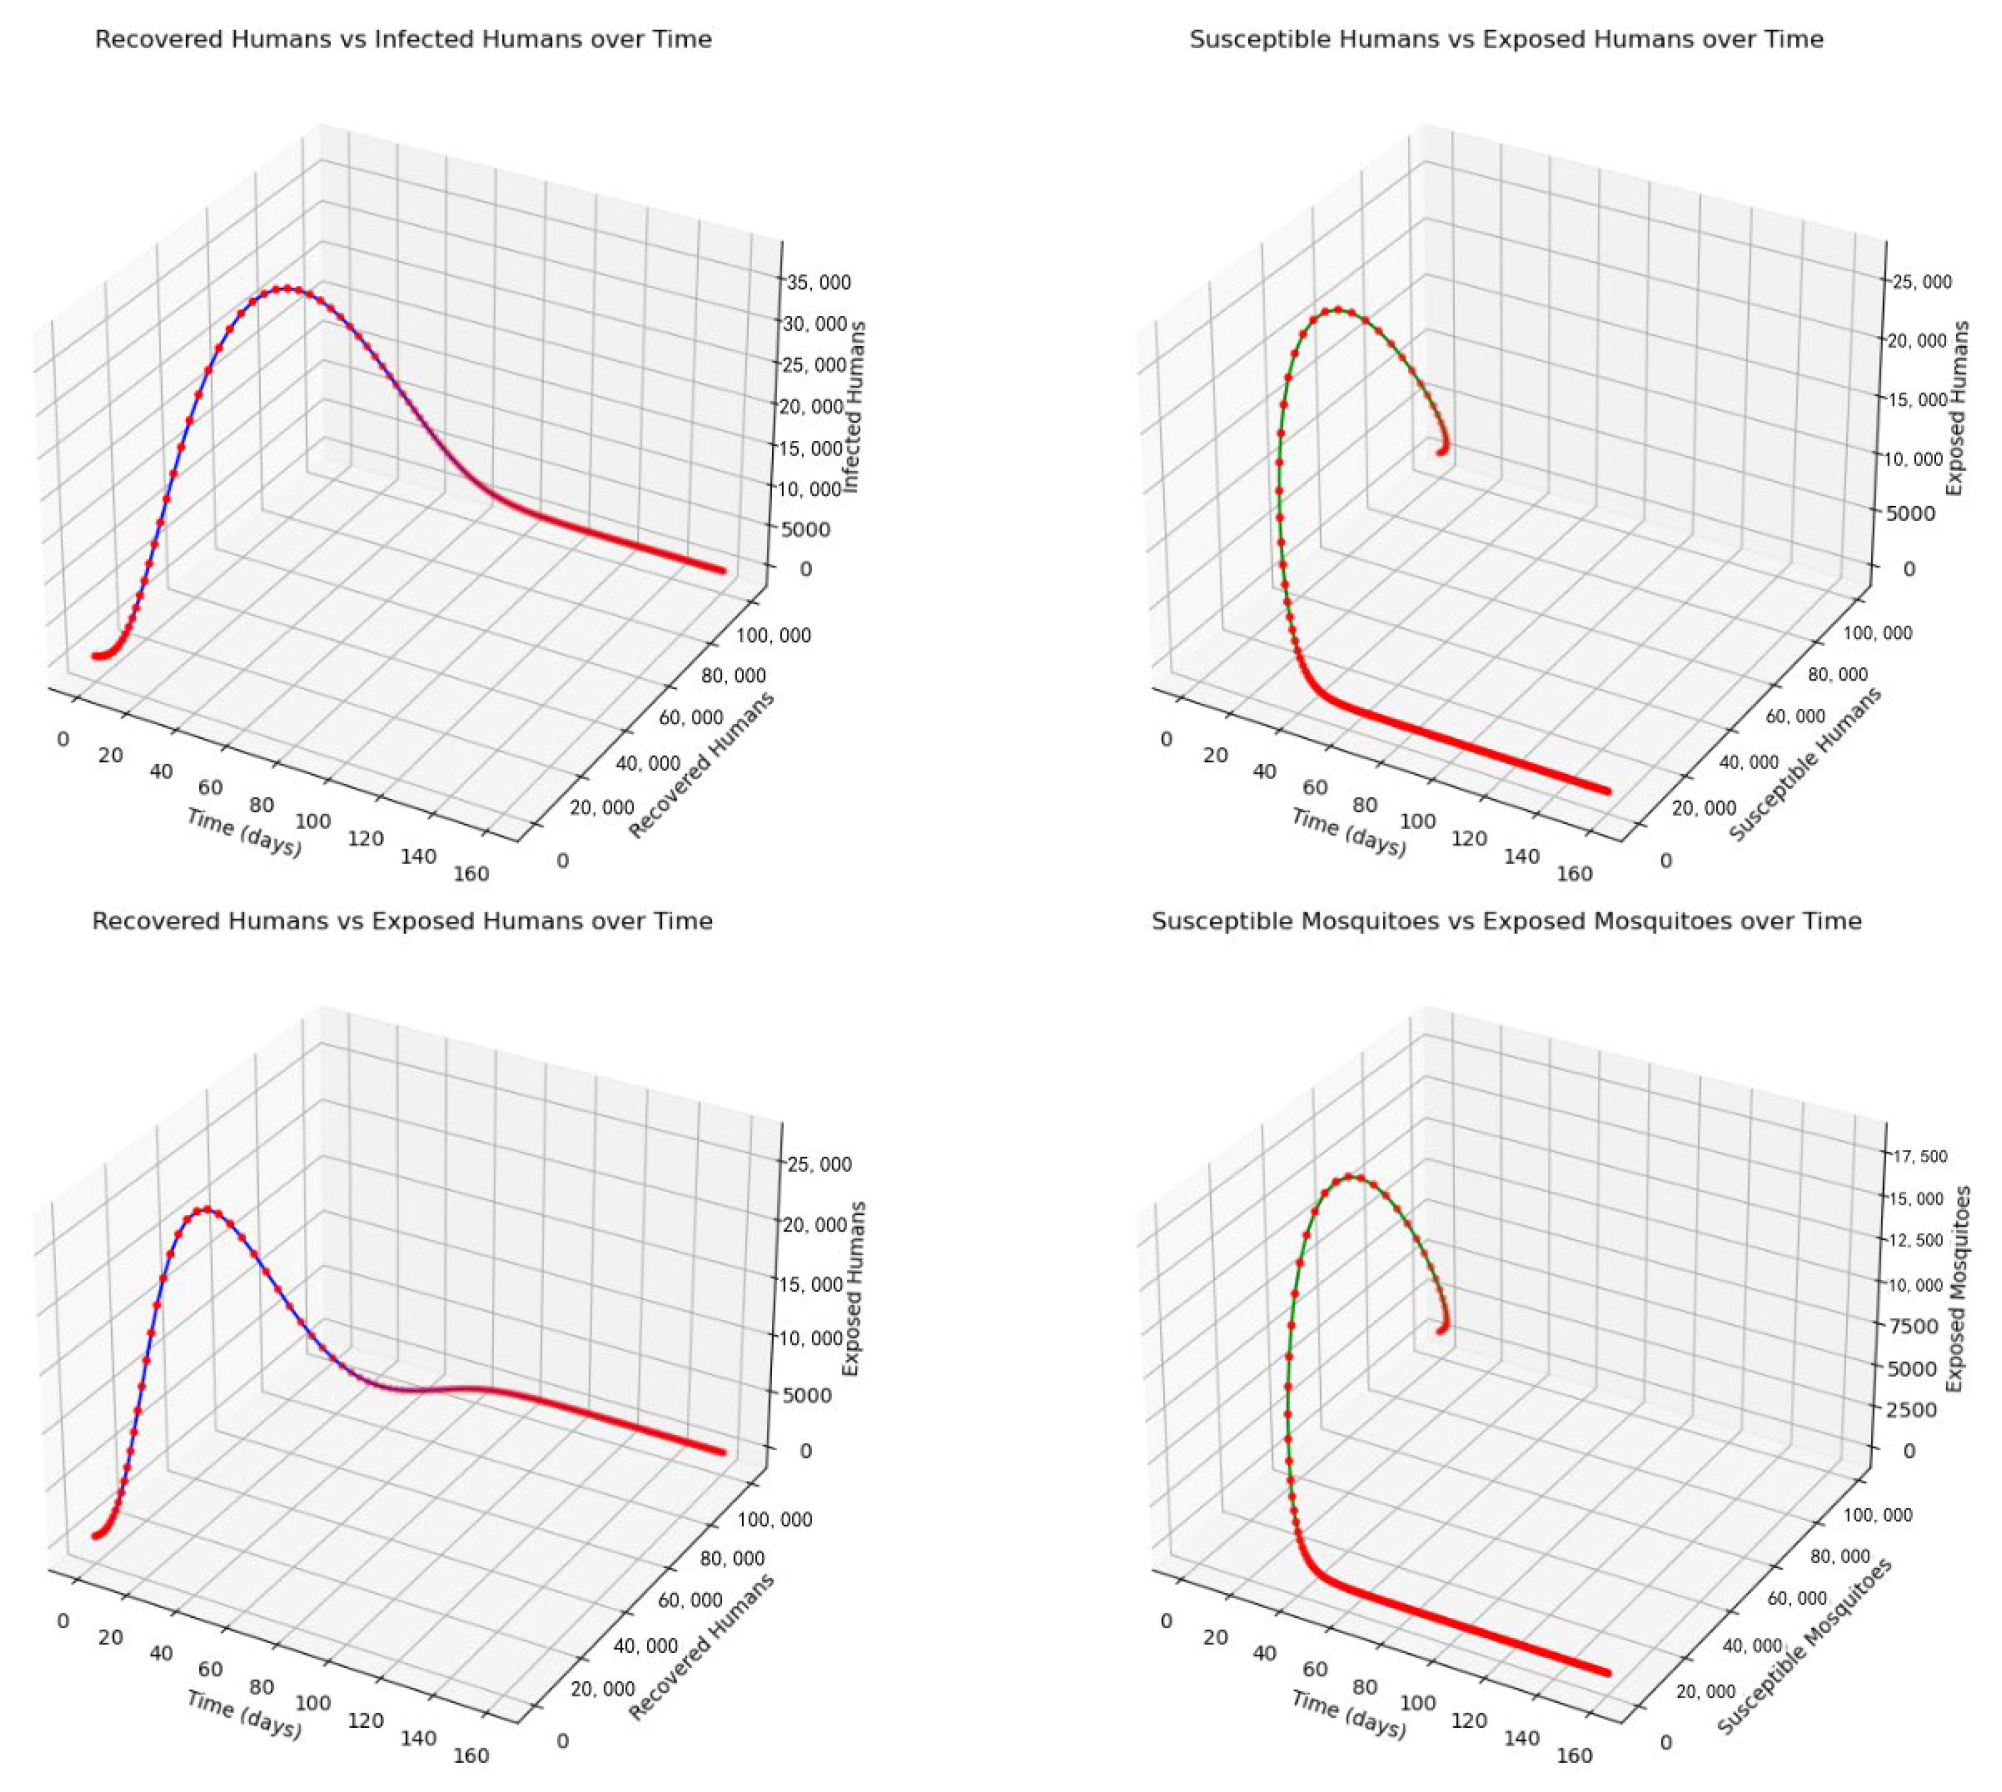
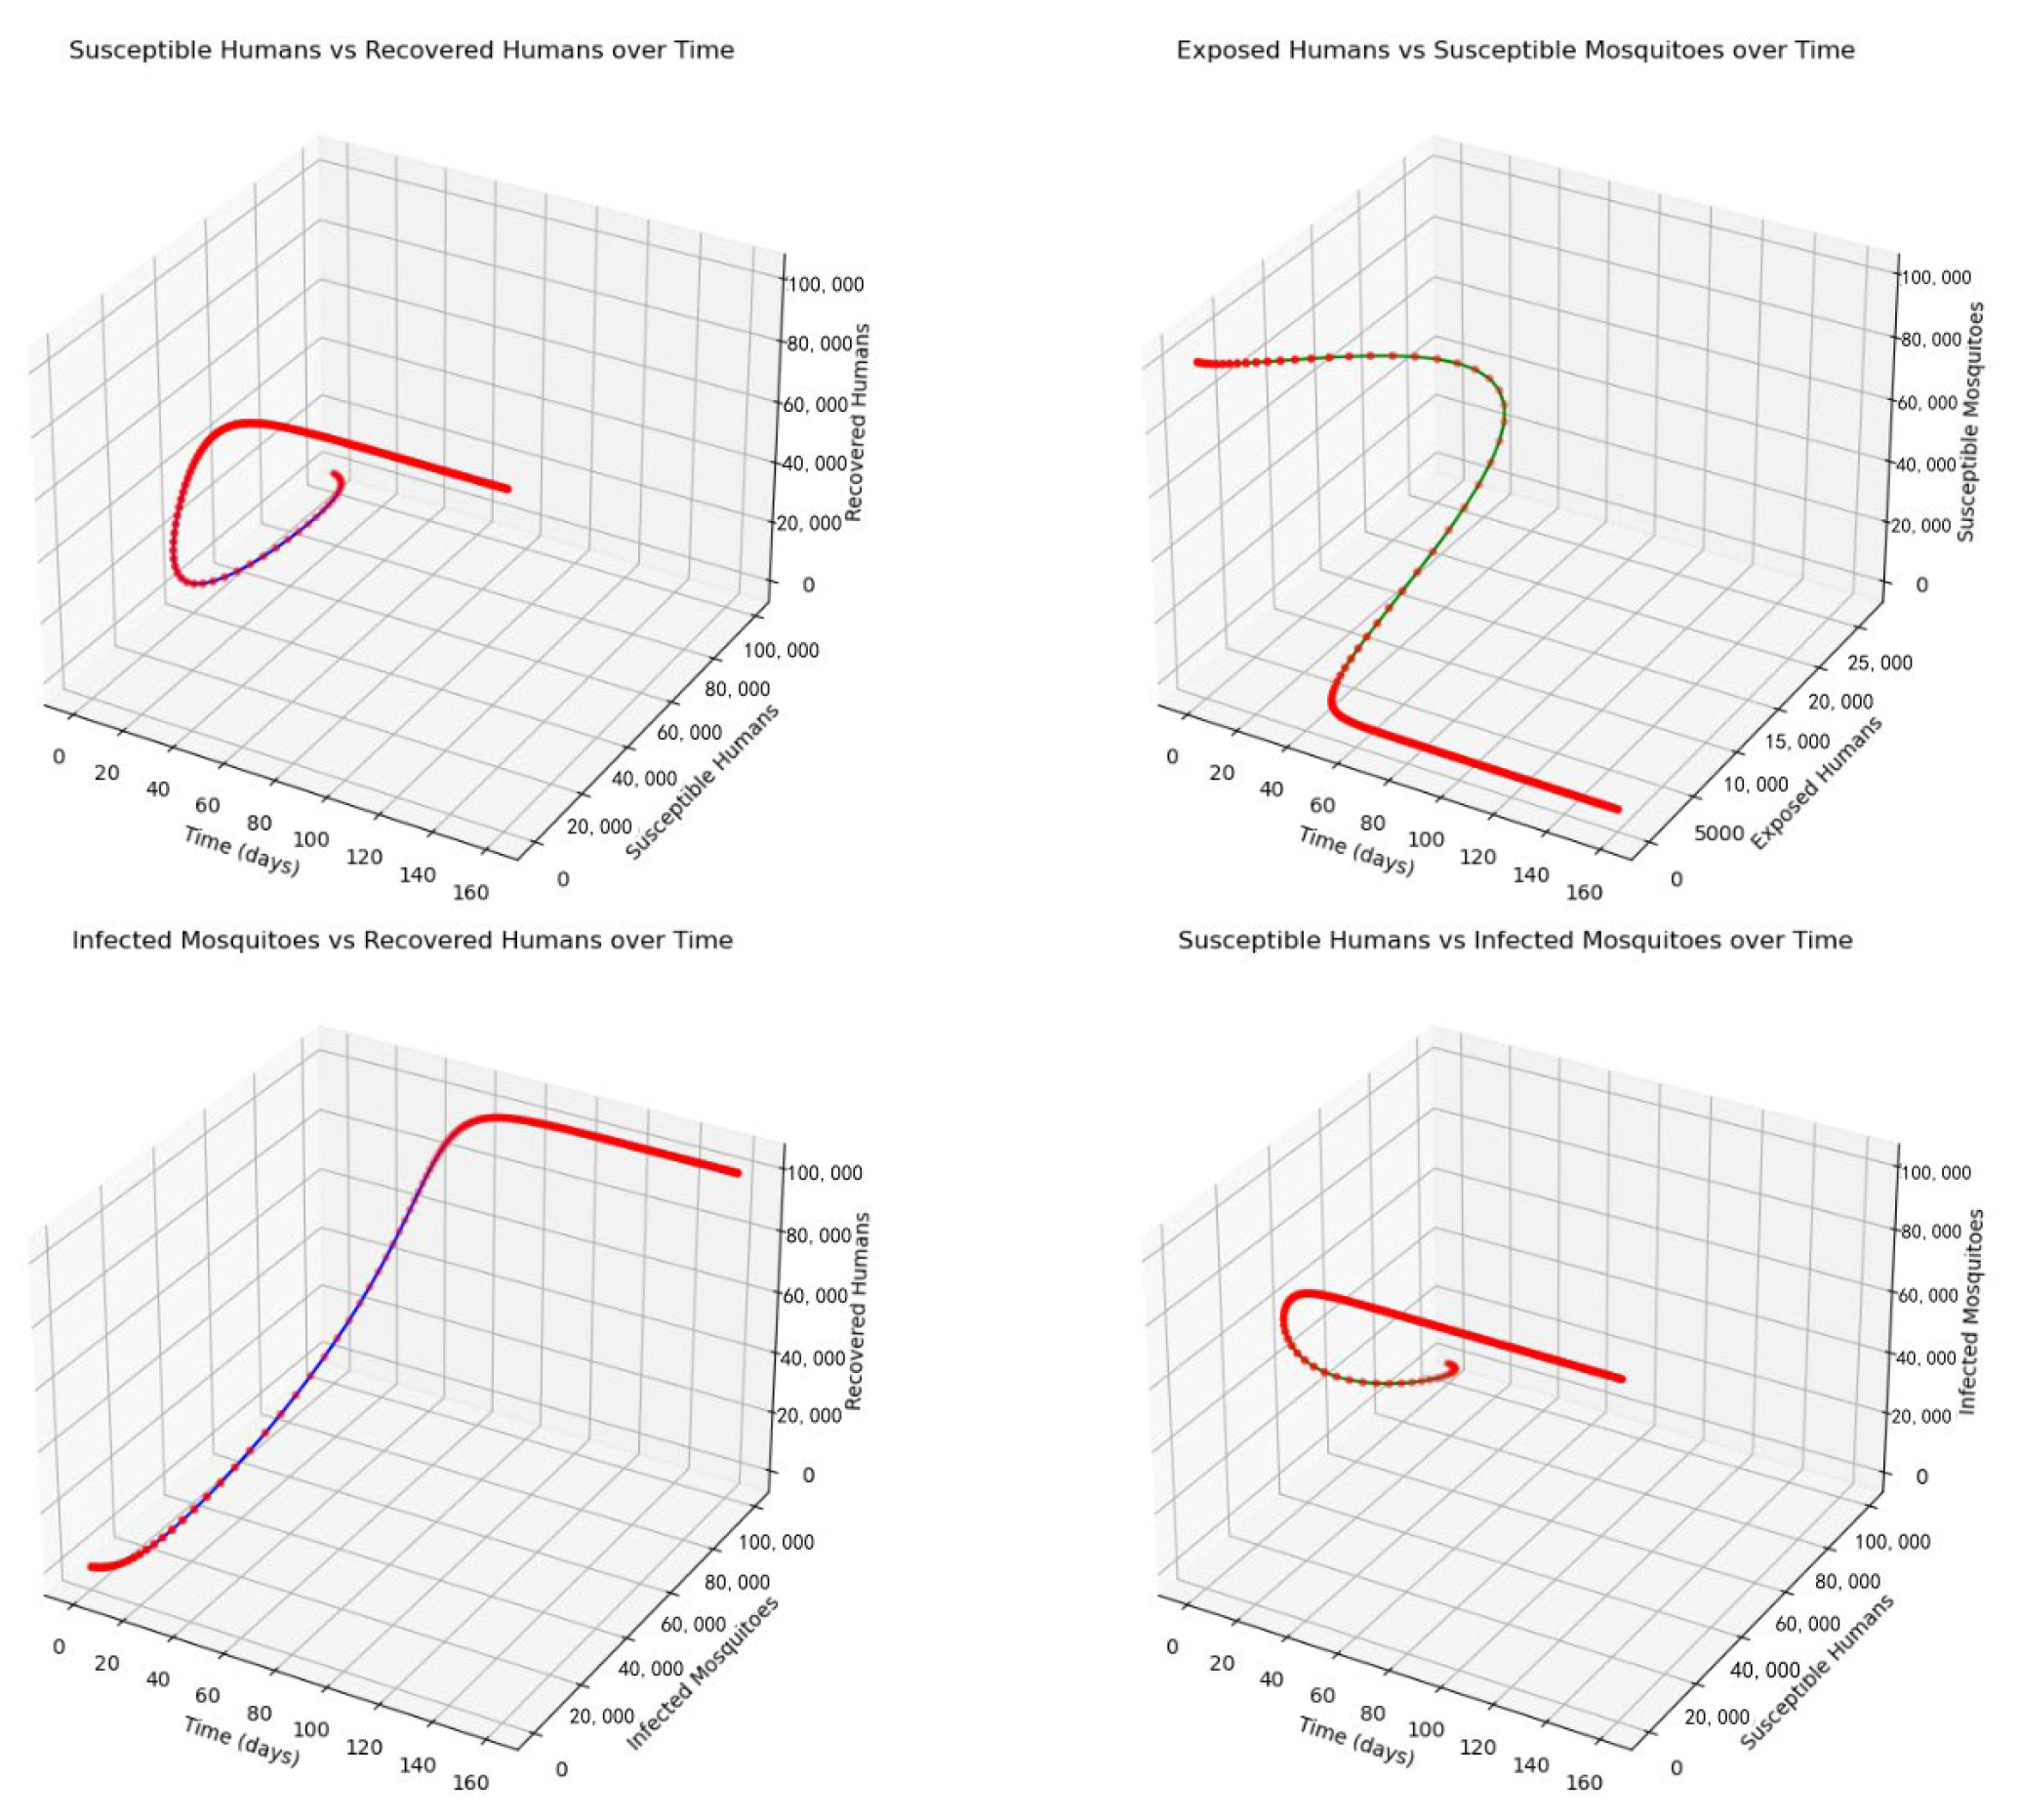
Figure 3,
Figure 4,
Figure 5,
Figure 6,
Figure 7 and
Figure 8, respectively, display the relationships over time between the susceptible population and the infected population, the latent population and the infected population, the susceptible mosquito population and the infected mosquito population, and the latent mosquito population and the infected mosquito population. From these, it can be observed that over time, the number of susceptible individuals decreases, while the number of infected individuals increases, reaching a peak before starting to decline, and the number of latent individuals gradually decreases over time. The number of susceptible and latent mosquitoes decreases over time, while the number of infected mosquitoes increases.
Different initial infection rates were set to explore the earliest stabilization time for the system, i.e., the time by which all have finally reached a recovery state. Initial infection rates were set at 1%, 2%, …, and 10% to simulate the system’s earliest stabilization time under different initial infection rates. The results, shown in
Figure 9 below, indicate that even with different initial infection rates, the system stabilizes at around 70 days, meaning the entire population within the system recovers.
The number of dengue cases obtained through simulations can be used to assess the inherent risk of shipping nodes. Meanwhile, in the construction of regional transmission models, the impacts of local climatic, economic, and health factors are considered, allowing for a more accurate measurement of the intra-regional risks at shipping nodes.
5. Shipping Network Node Ranking Based on Node Importance
Considering the availability of actual data, this paper collects data from the aviation passenger layer and maritime bulk cargo layer for calculations.
Node importance metrics can help determine the importance of nodes within the entire network. Using clustering coefficient, betweenness centrality, closeness centrality, degree centrality, and eigenvector centrality as metrics for evaluating node importance, we rank the importance of shipping network nodes based on the TOPSIS model modified by a weight extraction method. The main steps are as follows:
Step 1: Based on the metric data
, where
is the number of evaluation targets and
is the number of metrics, establish the original evaluation metric system matrix
:
Check whether there are negative numbers in the input matrix. If negative numbers are present, standardize them to a non-negative range, and denote the standardized matrix as
. The calculation formula is as follows:
Step 2: Calculate the information entropy of each index and compute the information utility value. Normalize the results to obtain the weight for each index. The formula for calculating information entropy is as follows:
Step 3: Compute the weight
based on the information extracted from each index to construct a weighted normalized matrix
.
Step 4: Calculate the maximum value
and the minimum value
, where
is the maximum value for each evaluation index, and
is the minimum value for each evaluation index.
Step 5: Calculate the closeness
of each node to the maximum and minimum values, where
. Each node is sorted according to the magnitude of the closeness value, with a larger value indicating that the node is more important.
Step 6: Calculate contribution .
Step 7: Calculate node mutual coupling importance.
Based on the above steps 1–5, calculate the importance of nodes in the aviation and maritime networks. Then, according to steps 6–7, calculate the node mutual coupling importance in the global aviation and maritime mutual coupling network.
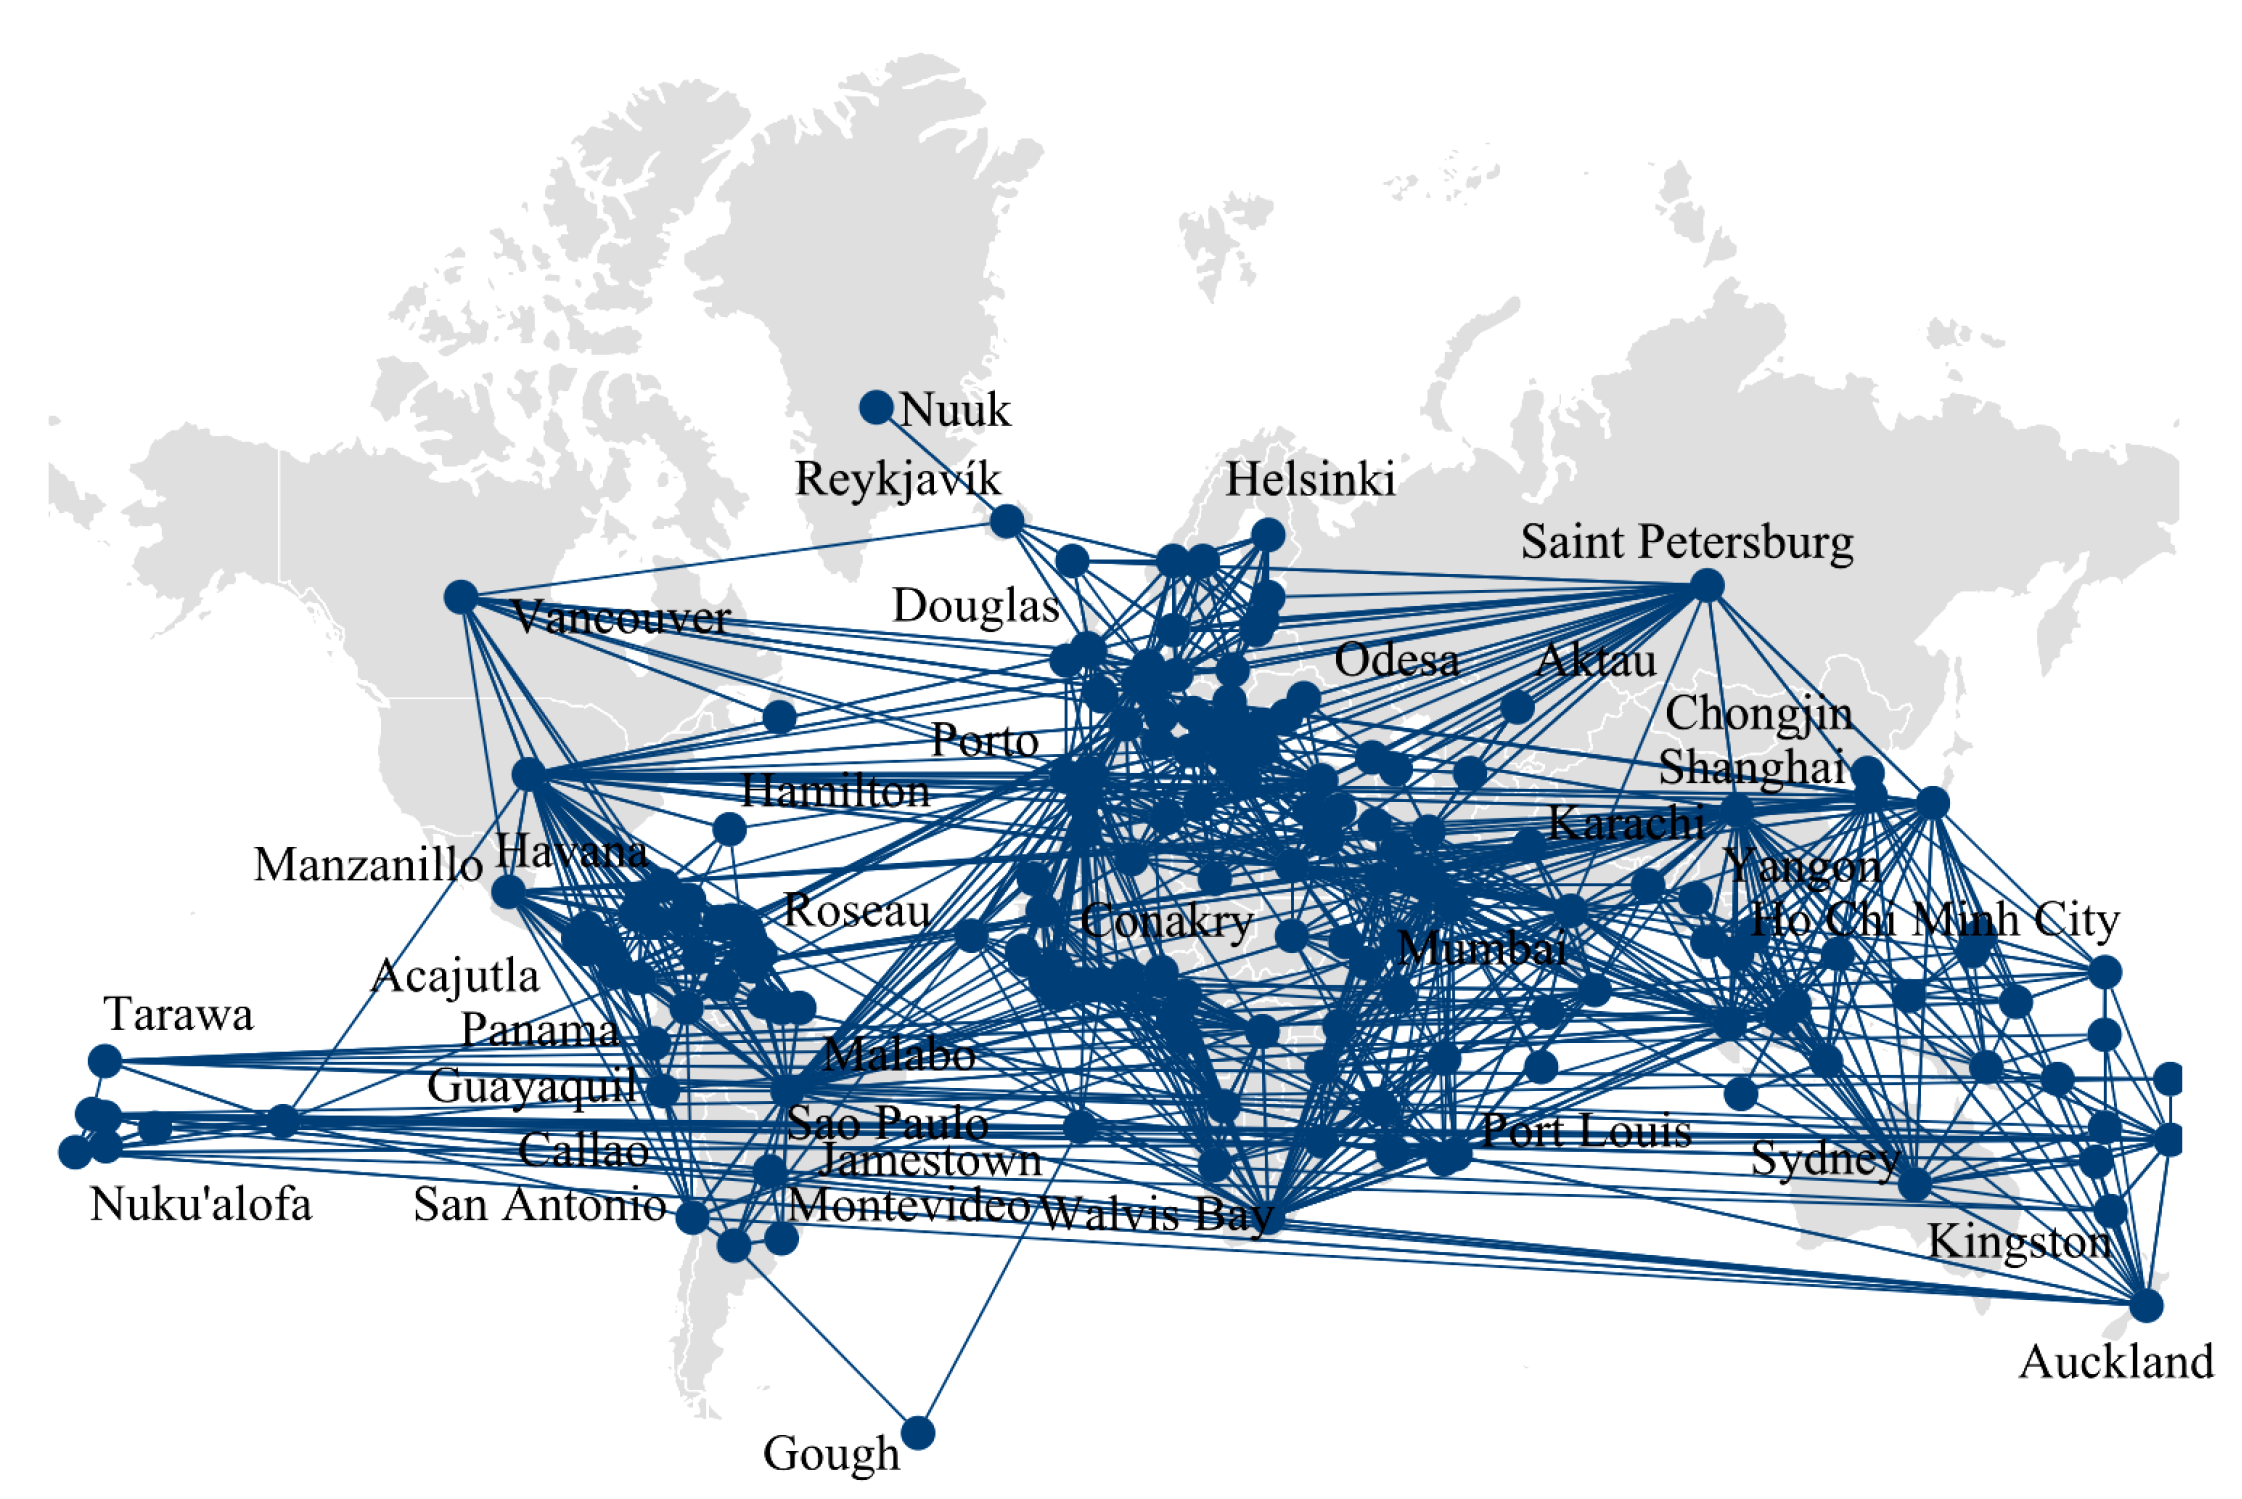
Similar to the air freight network, highly important country nodes in the maritime network, such as Hamburg, Istanbul, and Barcelona, also have a high degree of centrality and eigenvector centrality. This indicates that these cities are likely involved in international trade activities with most cities in the network via maritime transport, which also means that public health events are more likely to spread through these country nodes in the maritime network.
By combining the contribution of layer networks with the importance of nodes in layer networks, the importance of node coupling was calculated, as shown in the table above. In the aviation and maritime coupling network constructed in this article, the importance of node coupling in New York, London, and Hamburg ranks first, second, and third, respectively. In terms of network importance indicators, cities with high node coupling importance have a higher degree of centrality and eigenvector centrality in various layer networks. These cities engage in more trade activities with others through aviation and maritime routes, making public health events more likely to spread across the entire network through these highly coupling-important nodes, thus impacting the stability of the entire network. Therefore, in risk assessment, greater attention often needs to be given to these cities.
6. Simulation and Result Analysis
By selecting different transmission chains to simulate the risk propagation process, this study aims to control the final transmission risk from factors like transmission length. The article selects different nodes as risk starting points based on existing shipping data, with the endpoint consistently set as the Shanghai node. Simulations are carried out with an equal number of transmission chains but involving different nodes. Additionally, for the same starting point, different risk transmission chains are compared. The selected risk transmission chains and results are shown in
Table 7 below:
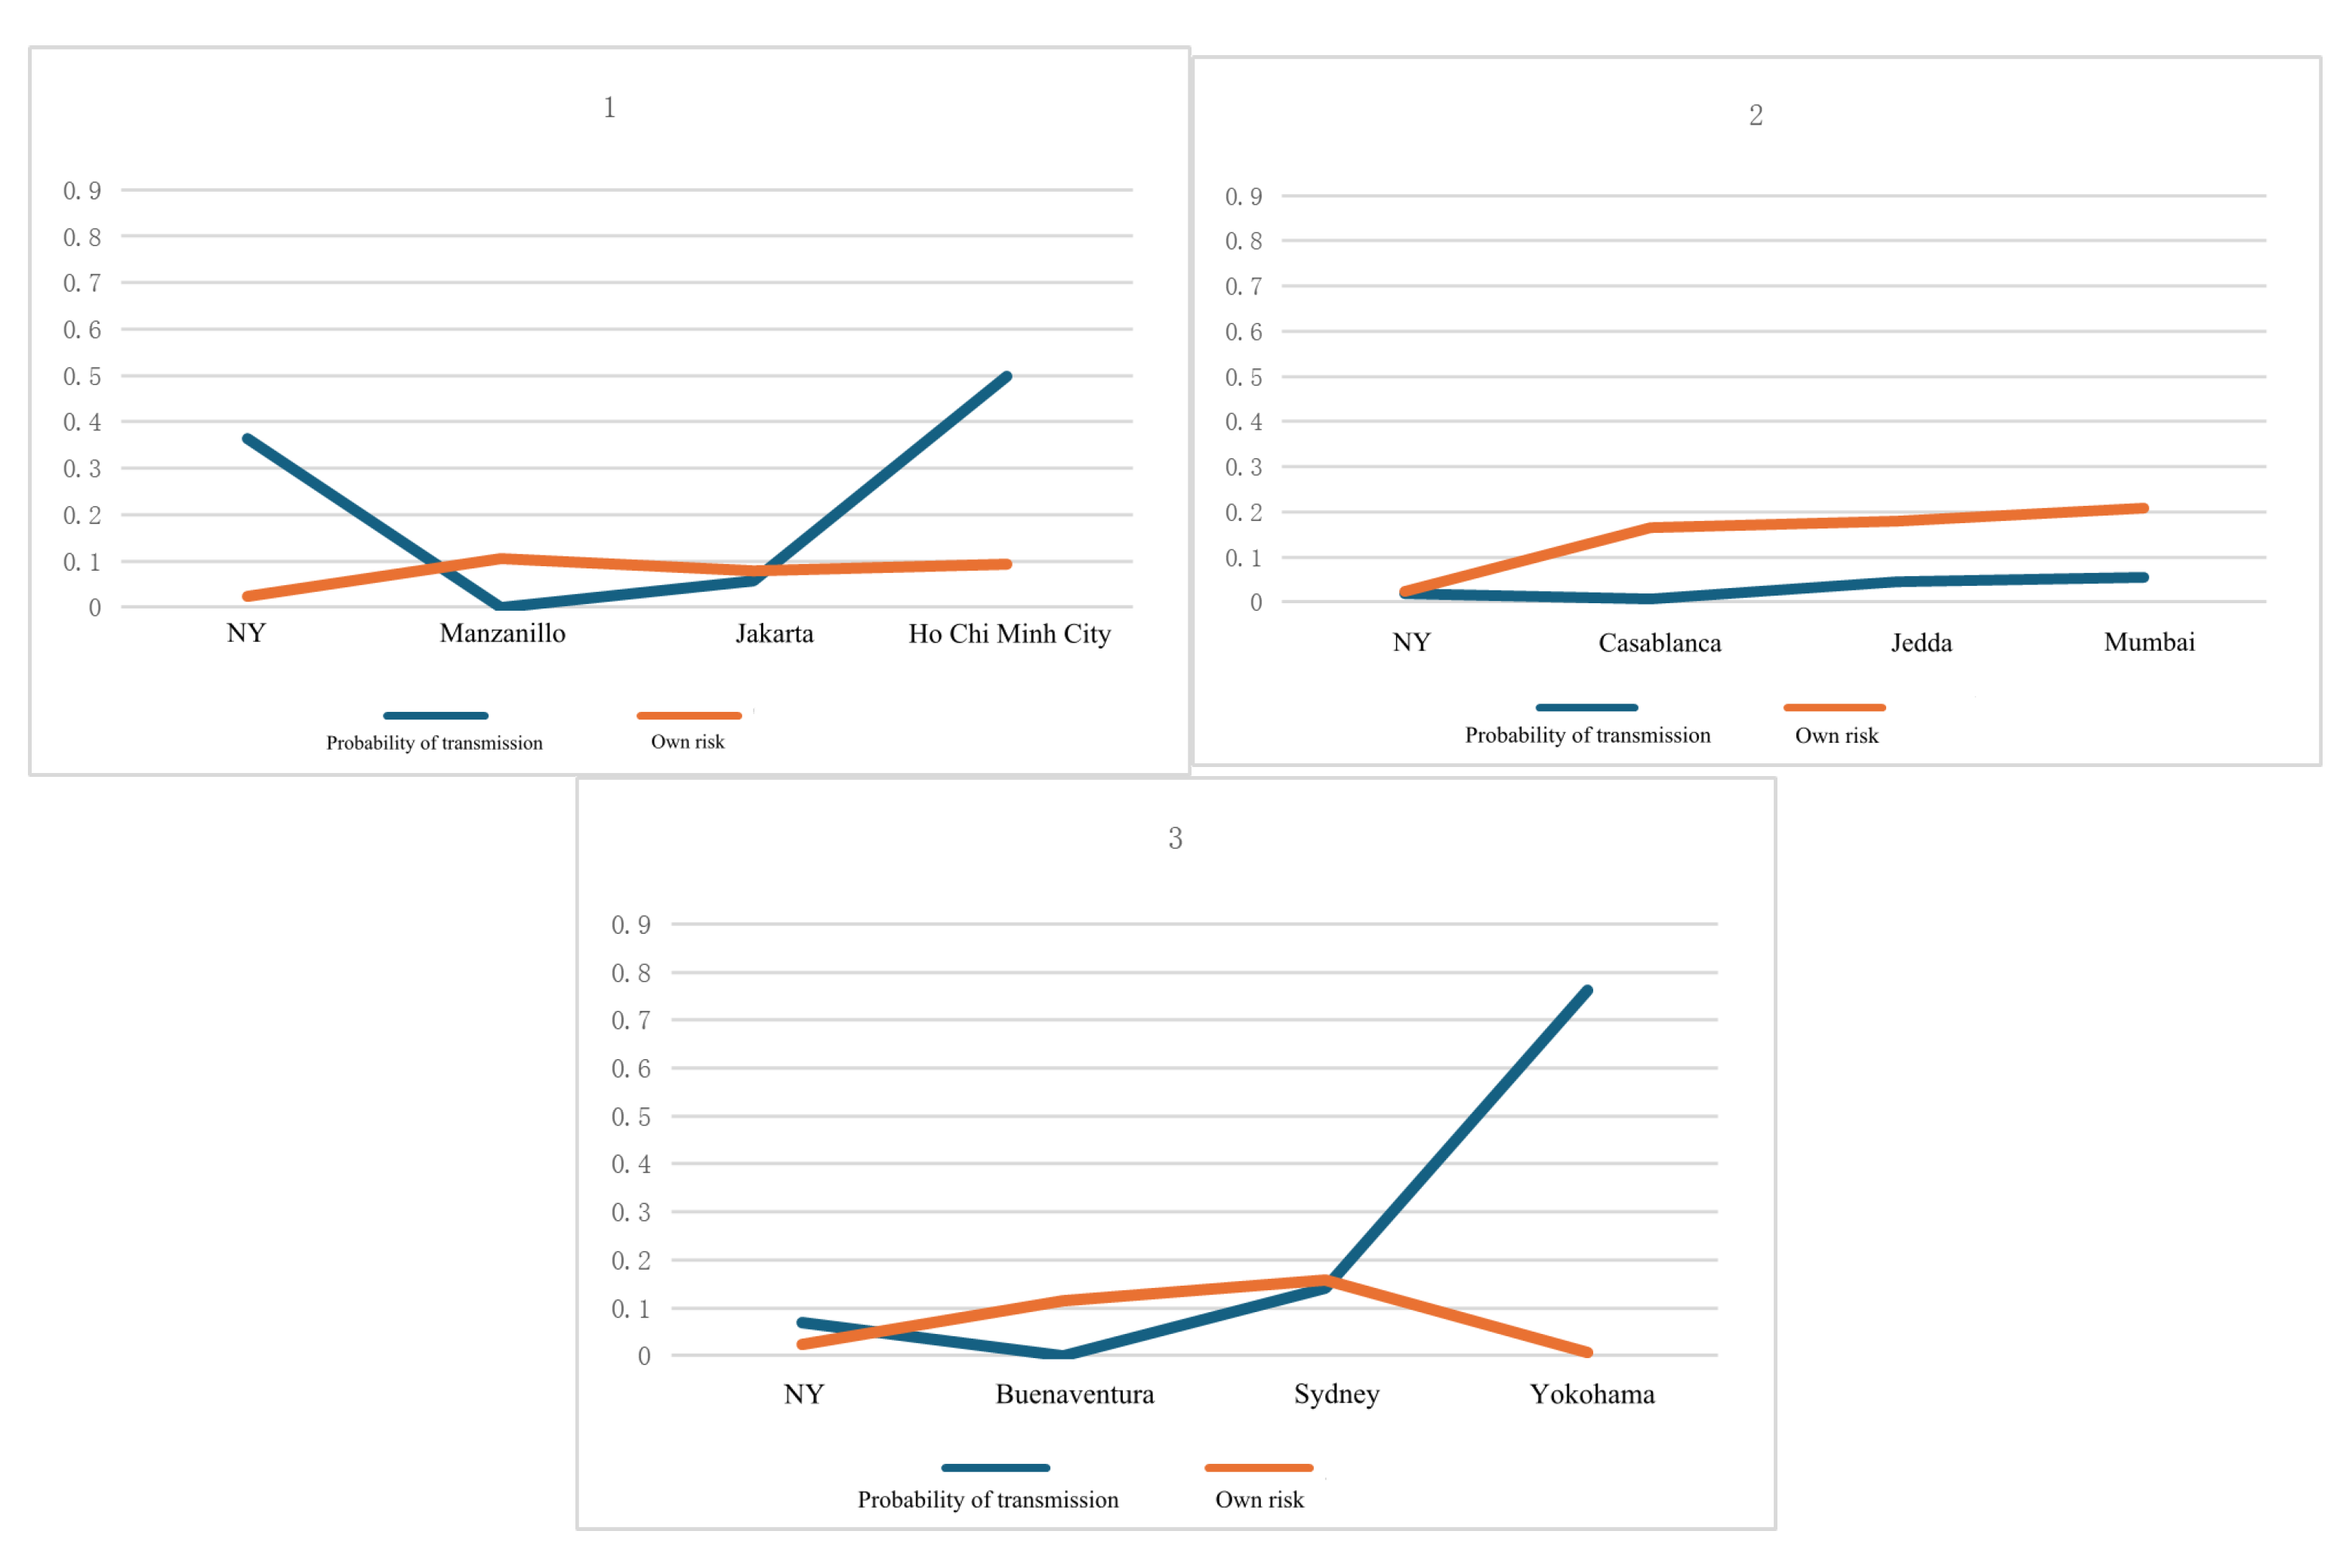
From the above results, it can be seen that with the same initial spread point and the same number of spread nodes, spreading through different nodes ultimately leads to different risks. This is specifically determined by the combination of the nodes’ own risks and the spreading probability. Taking the New York as an initial node example, the risk situation of three propagation chains is illustrated in
Figure 13:
The final risk values in the figure are 0.0593, 0.0211, 0.0292. In the first chart, the nodes through which the transmission passes have low individual risk, but due to the tight connections within the shipping network between nodes, the probability of transmission is high, resulting in a higher final risk. Compared to the first chart, the second chart has nodes with higher individual risk, but due to a lower network transmission probability, the risk value is lower. Compared to the first chart, the third chart has a lower transmission probability for initial nodes, so even though subsequent nodes have a high transmission probability, the resulting value is still lower. This indicates that the overall risk value is not only related to individual node risk but also to the transmission probability of nodes it passes through; both factors together determine the complex process of risk transmission.
Figure 14 shows the relationship between the average individual risk, average transmission probability, and final risk of the aforementioned transmission chains. The results demonstrate a positive correlation between final risk and both average individual risk and average transmission probability. This indicates that an increase in individual risk and transmission probability will lead to an increase in final risk. Individual risk is related to the node’s importance in the network, as well as climatic, economic, and health-related factors. It may become the starting point of risk transmission or a node in the transmission process, causing risk to spread to surrounding areas. Therefore, when the individual risk of a node increases, the final risk also increases. The transmission probability measures the closeness of connections in the shipping network. If a node has a high transmission probability, it can more easily connect with other nodes and spread risk. Consequently, when the transmission probability between nodes increases, the final risk also increases, both jointly determining the complex situation of public health events spreading in the shipping network.
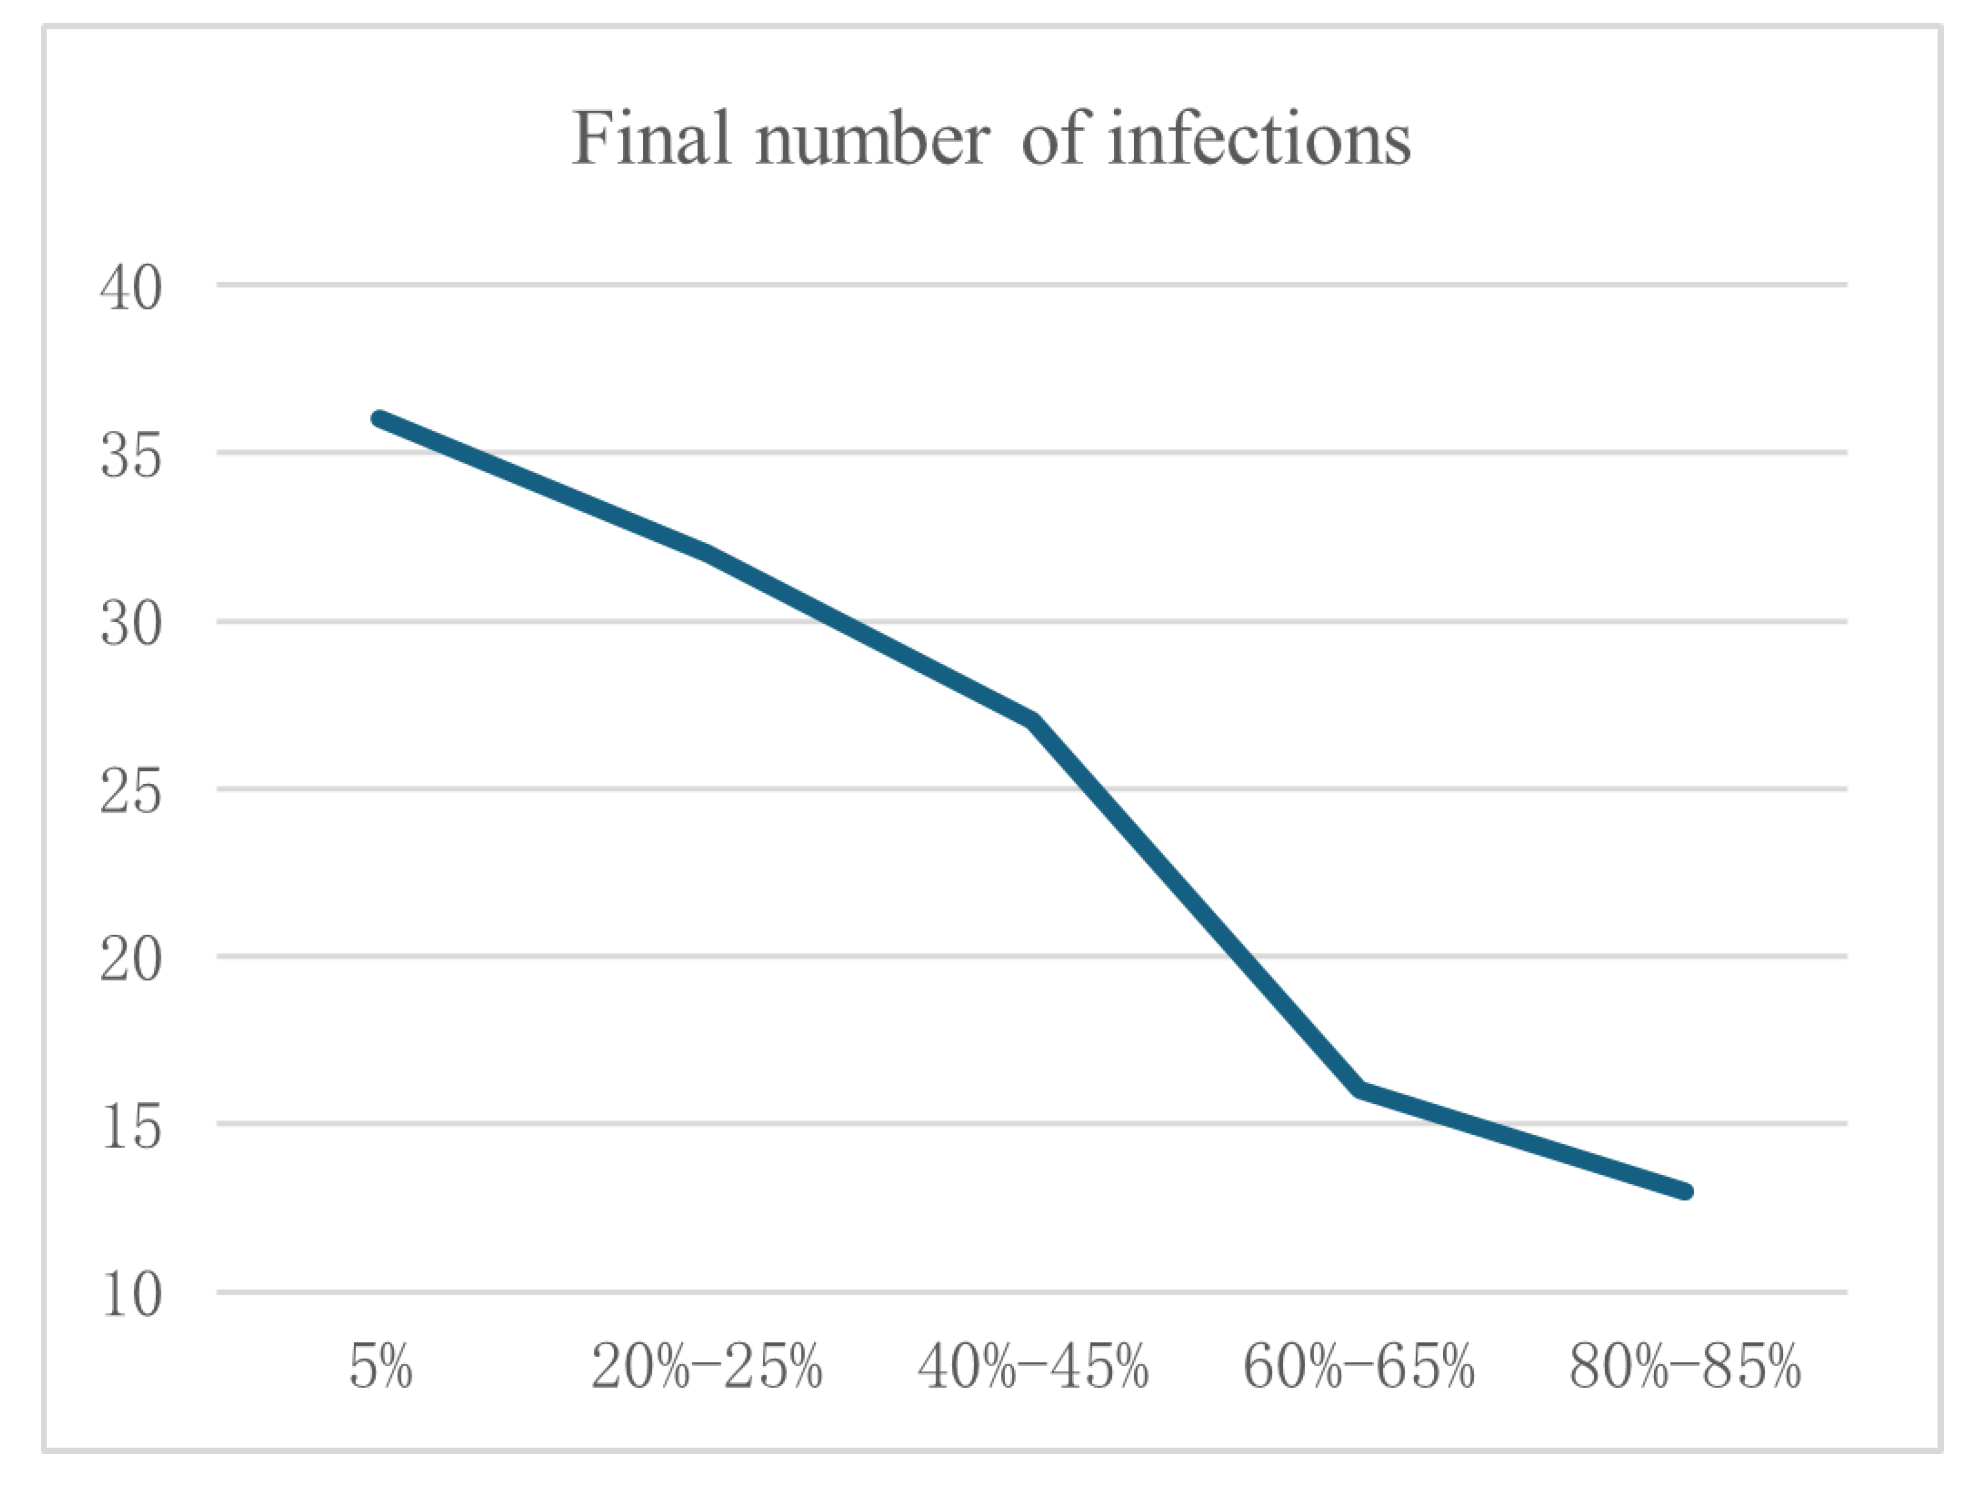
According to the ranking results of node mutual coupling importance, nodes ranked in the top 5%, 20–25%, 40–45%, 60–65%, and 80–85% are used as initial infection nodes. The simulation is run 100 times, and the average value is taken as the final number of infected nodes. The results are shown in
Figure 15:
According to the results, when the initial infection nodes are in the top 5%, the 20–25%, the 40–45%, the 60–65%, and the 80–85% of nodes, the numbers of infected nodes are 36, 32, 27, 16, and 13, respectively. It is evident that as the coupling importance of nodes decreases, the number of infected nodes shows a declining trend, meaning that the number of infected nodes is positively correlated with the coupling importance of the nodes. This also indicates the rationality of considering node coupling importance as a measure of the risk of the nodes within a network. Fan et al. [
39] analyzed nodal risks in power communication networks from perspectives of network structure and power services, quantifying the impact of node failures on network performance through nodal importance metrics. Meanwhile, Huang et al. [
40] revealed risk coupling evolution patterns via network topology indicators and identified critical risk factor nodes using network efficiency measurement methods. These studies collectively demonstrate that coupling relationships between nodes significantly influence network risks in complex systems, thereby substantiating the validity of nodal coupling importance as a metric for evaluating inherent node vulnerability.
7. Conclusions
This paper considers the mechanisms of risk transmission and early warning models within shipping node areas and the cross-border risk transmission models and early warning research under shipping networks, focusing on China’s maritime import risk warning methods and response mechanisms in the context of public health events.
By studying the mechanisms of risk transmission and early warning models within shipping node areas, we analyze the self-risk of each node. First, we examine the transmission mechanisms of mosquito-borne infectious diseases and analyze their influencing factors. Then, based on these influencing factors and transmission dynamics, we construct an improved SEIR-SEI model. The basic accuracy of the model is verified through mean-field analysis. The derived infection threshold confirms that the infection vector factor is not zero, meaning a vector is required for transmission, aligning with actual conditions. Finally, the approach uses simulation to determine the number of infections within the area, which is utilized to analyze the transmission risk within the region.
In the research on cross-border risk propagation models and early warning under shipping networks, the mechanism of cross-border risk propagation under shipping networks is first analyzed, explaining the process of cross-border propagation of public health events through passenger and freight transport. Then, a globally interconnected network of aviation and maritime shipping is constructed based on complex networks, and its network structure and attribute characteristics are analyzed. A global freight and passenger inter-coupled network node propagation risk model is developed, taking into comprehensive consideration the network’s clustering coefficient, betweenness centrality, closeness centrality, degree centrality, and eigenvector centrality. Finally, the cross-border risk propagation under the shipping network is analyzed through simulation. From the simulation results, it can be concluded that, firstly, selecting nodes with the same quantity but different node inter-coupling importance as the initial infection points shows that the number of infected nodes in the final network is positively correlated with the importance of nodes, verifying the rationality of using node inter-coupling importance as a measure of risk propagation. Secondly, by choosing different nodes as the starting point of risk and setting the endpoint as a Chinese node, with simulations through an equal number of, but different, nodes in the propagation chain, it is found that although the same number of nodes is passed, due to the different inherent risks of the nodes and the different probabilities of propagation between the nodes, the final risk presents differently. This verifies the rationale and importance of considering both internal regional risk propagation and cross-border risk propagation when studying overall input risks.
Thus, it provides multi-dimensional policy recommendations for establishing a sound input risk early warning mechanism, such as establishing a real-time tracking system based on border monitoring data and constructing a cross-border risk assessment model. This, in turn, helps to enhance the emergency response capabilities of the state and localities, minimize the risk of epidemic spread to the greatest extent possible, provide a scientific basis for national prevention and control strategies, and promote international cooperation and information sharing to jointly address the challenges brought about by public health incidents.


