Article

Experimental and Numerical Analysis of Freeze–Thaw-Induced Mechanical Degradation in the Coarse-Grained Soil of the Southeastern Qinghai–Xizang Plateau

1
College of Water Conservancy and Civil Engineering, Xizang Agriculture and Animal Husbandry University, Nyingchi 860000, China
2
Research Center of Civil, Hydraulic and Power Engineering of Xizang, Xizang Agriculture and Animal Husbandry University, Nyingchi 860000, China
3
School of Civil Engineering, Chongqing University, Chongqing 400044, China
*
Author to whom correspondence should be addressed.
Appl. Sci. 2025, 15(9), 4900; https://doi.org/10.3390/app15094900
Submission received: 2 April 2025 / Revised: 22 April 2025 / Accepted: 23 April 2025 / Published: 28 April 2025

Abstract

:
To investigate the effects of freeze–thaw (FT) cycles on the mechanical properties of coarse-grained soil in southeastern Xizang under different moisture contents, this study focuses on coarse-grained soil from a large landslide deposit in Linzhi City, Xizang. FT cycle tests, triaxial shear tests, and numerical simulations were employed to systematically examine the comprehensive impact of varying FT cycles, moisture content, and confining pressure on the soil’s mechanical characteristics. The results show that FT cycles significantly affect the stress–strain behavior of coarse-grained soil in southeastern Xizang. The degree of strain softening increased from approximately 11.6% initially to 31.2% after 15 FT cycles, with shear strength decreasing by an average of 31.8%. Specifically, cohesion decreased by 38% to 55% after 0 to 15 FT cycles, and the internal friction angle decreased by approximately 29% to 32%. Additionally, higher moisture content led to more pronounced strain softening and strength degradation, while increased confining pressure effectively mitigated these deteriorative effects. Numerical simulation results indicated that as moisture content increased from 7.6% to 11.6%, the number of FT cycles required to reach the critical instability state decreased from approximately 150 to 106, and finally to only 15, with the maximum equivalent plastic strain increasing from 0.20 to 2.47. The findings of this study provide key mechanical parameters for understanding the formation and evolution of FT landslide disasters in southeastern Xizang and lay a scientific foundation for the assessment and long-term prevention of cold-region geological hazards.

1. Introduction

The Qinghai–Xizang Plateau, as the largest modern permafrost distribution zone in the mid- and low-latitude regions globally, exhibits distinct geographical characteristics in its permafrost distribution [1,2]. According to statistics, China has the third-largest area of permafrost in the world, with the seasonal permafrost zone covering 5.14 million square kilometers [3,4]. The southeastern Xizang region, represented by Linzhi in Xizang, is a typical seasonal permafrost area. It is significantly influenced by extreme altitude gradients and marked diurnal temperature variations. Additionally, the region experiences substantial fluctuations in soil moisture content due to its distinct rainy season characteristics [5,6], undergoing frequent freeze–thaw (FT) cycles. This complex interplay of factors not only accelerates the deterioration of the mechanical properties of native soil and rock masses but also poses potential threats to regional engineering stability. In recent years, driven by the Belt and Road Initiative, southeastern Xizang has witnessed rapid expansion in the development of tourism and major transportation infrastructure [7]. However, the prevalent steep coarse-grained soil slopes and artificial slopes in the region are subjected to cyclic FT effects and severe moisture fluctuations over extended periods, leading to strength degradation, structural damage, and deformation failure—critical geotechnical challenges affecting engineering construction. Therefore, systematically investigating the mechanical evolution of coarse-grained soil under varying moisture conditions and FT cycles in southeastern Xizang holds significant practical engineering importance.
The influence mechanism of FT effects on soil’s physical properties has been well-established within theoretical frameworks. Extensive research has focused on parameters such as the permeability coefficient [8], void ratio [9], particle gradation [10], and electrical resistivity [11]. Chen et al. [8] conducted FT tests on aeolian soil–bentonite mixtures and found that an increasing number of FT cycles led to a decrease in the permeability coefficient while significantly increasing the compression coefficient ratio. Jiang [12] discovered that after experiencing FT cycles, the contact mode of particles in loose fine-grained till changed, and the denser the till, the more pronounced its volumetric contraction and performance deterioration. Liu et al. [13] performed a microstructural simulation analysis of claystone, confirming that FT effects increased the average pore size while reducing the specific surface area. Additionally, their microcomputer-computed tomography scanner seepage simulations revealed the relationship between permeability coefficients and microscopic crack evolution. Recent micromechanical investigations using micro-computed tomography (micro-CT) and discrete element modeling have further revealed that repeated FT cycling can disrupt inter-particle contacts, weaken cementation, and promote internal fracture propagation, ultimately leading to irreversible cohesion loss. These insights bridge microstructural evolution with macro-mechanical degradation. With the growing demand for cold-region infrastructure development, research on the mechanical behavior of soils under FT effects has gradually become a major focus in cold-region geotechnical engineering [14,15,16]. Yu et al. [9] conducted rock FT experiments to elucidate the relationship between FT damage mechanisms and micro-pore quantification, finding that the presence of large pores played a dominant role in strength degradation. Ling et al. [17] and Tian et al. [18] systematically examined the evolution of peak strength, residual strength, resilient modulus, and dynamic shear modulus in a CGM (cement–gravel mixture) under varying FT cycles and confining pressures through triaxial testing. They further proposed distinct evolution models applicable to seasonally cold regions.
Recent studies have made significant progress in understanding the FT effects on coarse-grained soils. Li et al. [19] conducted unidirectional frost heave tests and numerical analyses, revealing that coarse-grained soils containing fine particles exhibit significant frost heave under unrestricted water supply conditions. The degree of frost heave increases with higher water availability and finer particle content. Liu et al. [20] performed pore structure and uniaxial compression tests, finding that as the number of FT cycles increases, the porosity of coarse-grained soils gradually increases while their strength decreases. They developed a quantitative model linking pore structure to mechanical properties. Zhang et al. [21] investigated the strength variations of coarse-grained soils under low temperatures and variable confining pressures, proposing a strength criterion with broad applicability. Qu et al. [22] conducted resistivity and mechanical tests on coarse-grained soils from Mozhugongka, Xizang, revealing that with increasing FT cycles, resistivity gradually rises, while unconfined compressive strength, the deformation modulus, and the brittleness index significantly decline. These changes stabilize after seven to nine FT cycles. Wang et al. [23] used low-temperature triaxial compression tests to examine the nonlinear deformation behavior of frozen soils with varying coarse particle contents under FT cycles. They developed a binary medium constitutive model based on micromechanics, successfully predicting mechanical behavior from the microscopic to macroscopic scales. While previous studies have provided insights into the effects of FT cycles on the mechanical properties of coarse-grained soils, systematic research on the coupled effects of varying moisture conditions and FT cycles in southeastern Xizang remains limited. The underlying mechanisms of mechanical deterioration have yet to be fully elucidated. Furthermore, climate projections reported by the IPCC (2021) indicate that under global warming scenarios, alpine and marginal permafrost regions are likely to experience increased FT frequencies and greater thermal volatility, which will further aggravate soil degradation in seasonally frozen zones [24]. This context highlights the need to develop predictive, climate-adaptive geotechnical models.
Although previous studies have explored the effects of freeze–thaw cycles on the mechanical behavior of coarse-grained soils, several critical gaps remain. First, most existing research has focused on laboratory conditions under simplified environmental inputs, often overlooking the combined influence of seasonal permafrost, high-altitude climatic gradients, and monsoonal moisture fluctuations that are characteristic of the southeastern Qinghai–Xizang Plateau. Second, while the mechanical degradation trends of soils have been studied, limited attention has been given to region-specific parameterization and its integration into numerical slope models for assessing long-term stability. Moreover, the majority of prior work lacks the quantitative linkage between freeze–thaw-induced strength loss and progressive slope failure simulations.
To address these limitations, this study proposes an integrated approach combining systematic laboratory triaxial testing under variable moisture and confining pressures with numerical simulations using COMSOL Multiphysics, which embeds empirically derived degradation functions into slope-scale plastic strain evolution models. The novelty of this work lies in (1) the use of coarse-grained soil from a representative landslide mass in a climatically complex permafrost region; (2) the development of exponential models relating freeze–thaw cycles to cohesion and internal friction loss under different moisture levels; and (3) the application of these models to simulate the critical instability thresholds and failure modes of natural slopes subjected to progressive freeze–thaw damage. This combined experimental–numerical approach contributes to a more realistic and engineering-oriented understanding of FT-induced slope degradation in cold regions and provides a theoretical foundation for future hazard prevention, infrastructure resilience, and climate-adaptive geotechnical design.

2. Materials and Methods

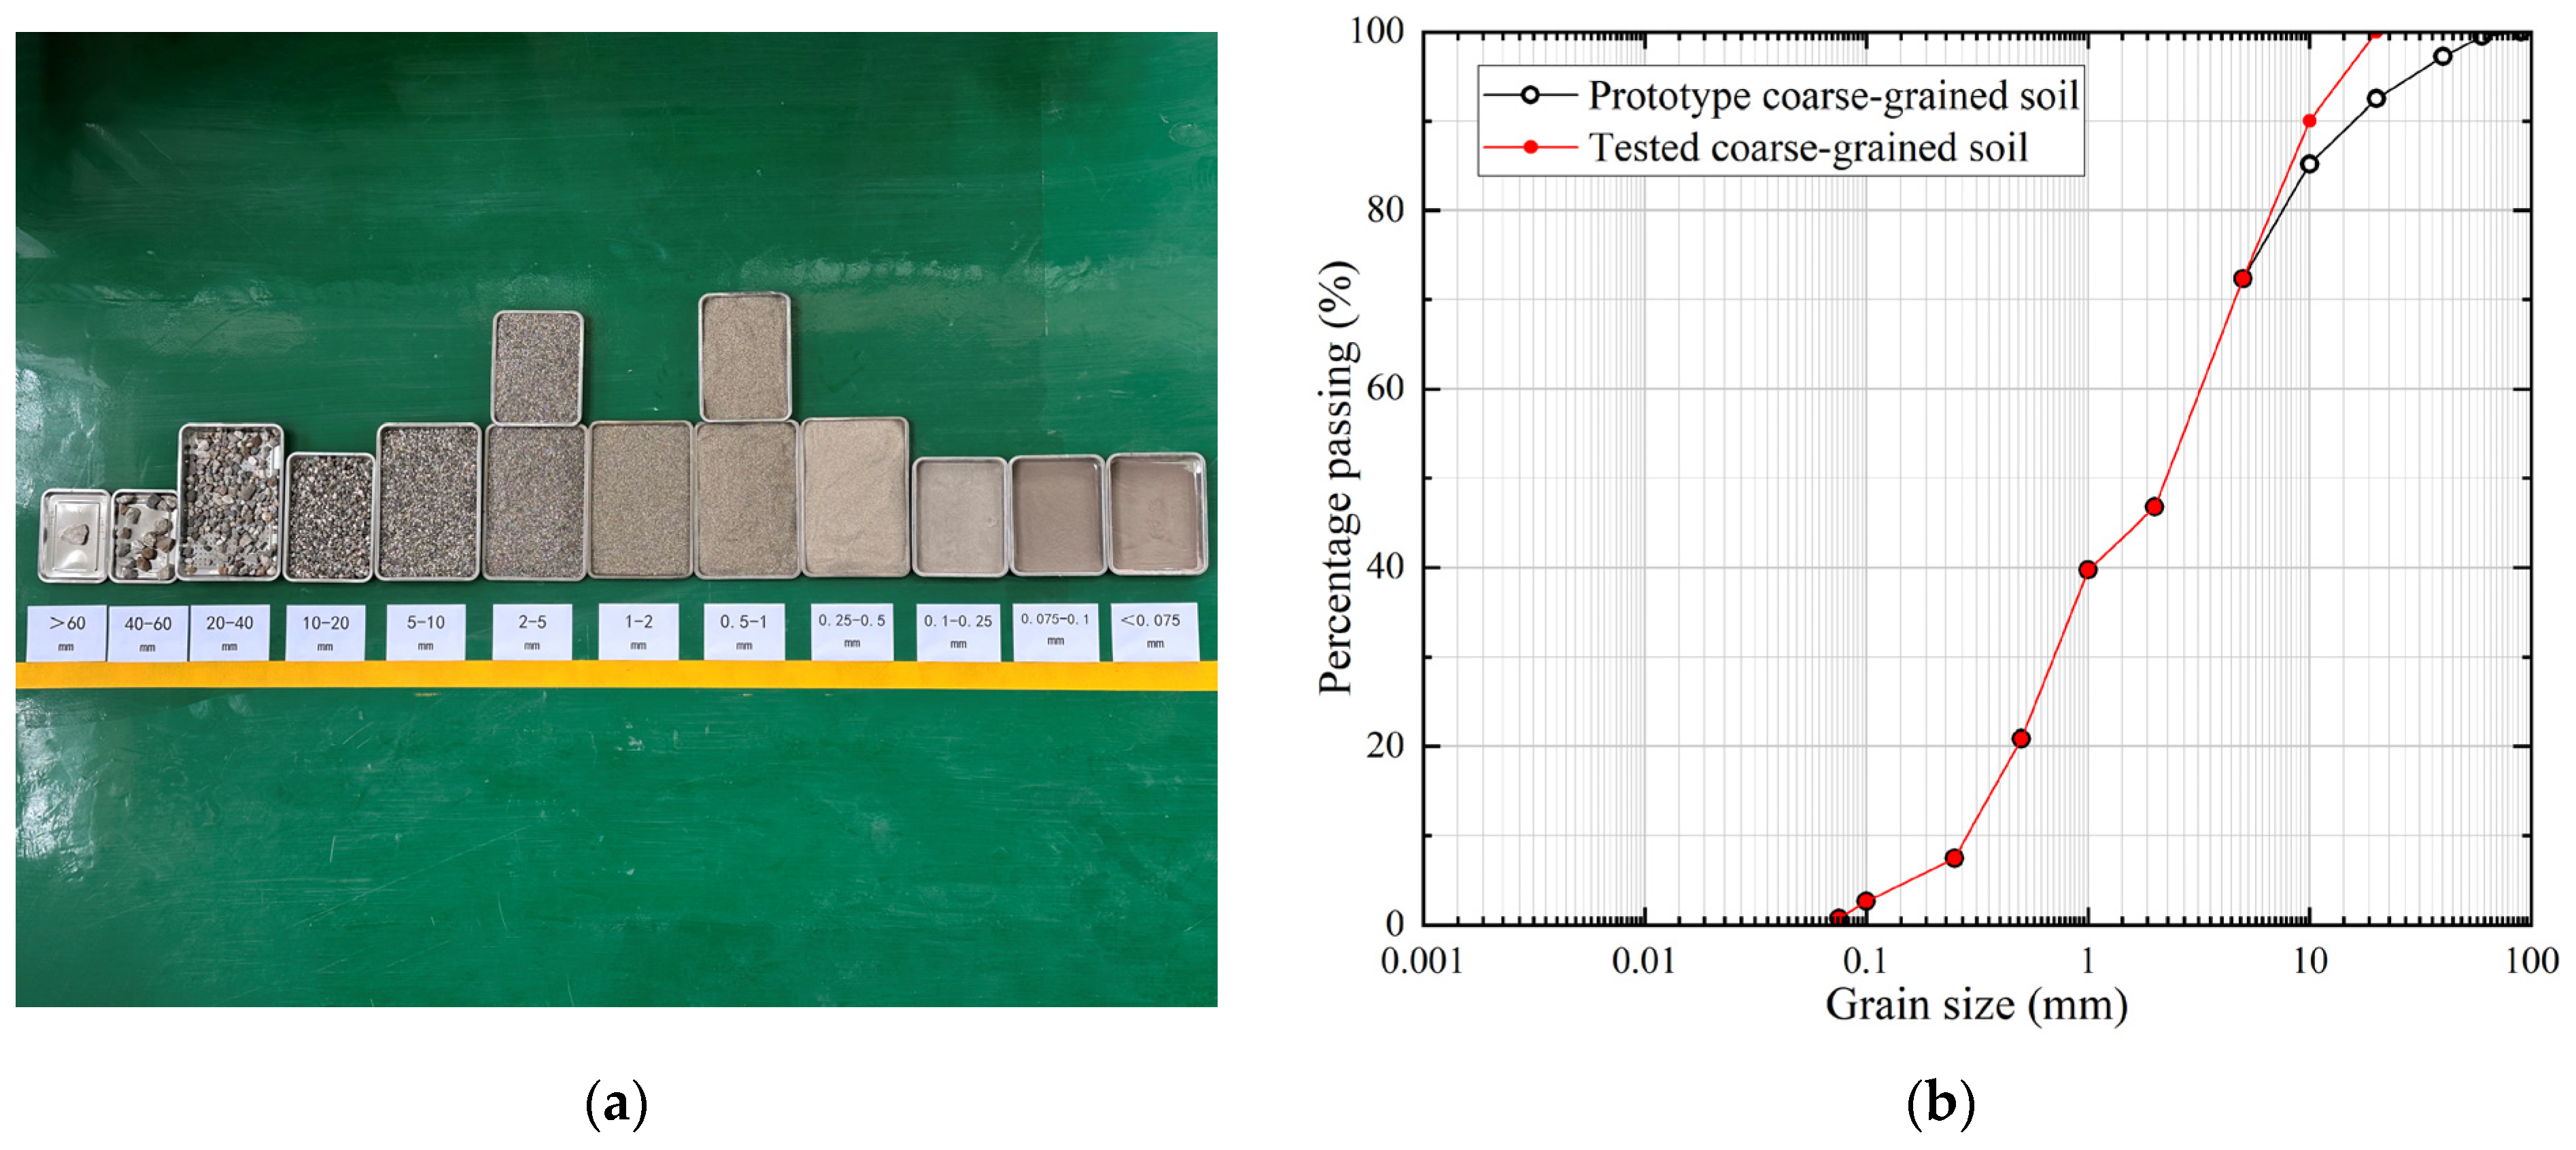
2.1. Sample Preparation
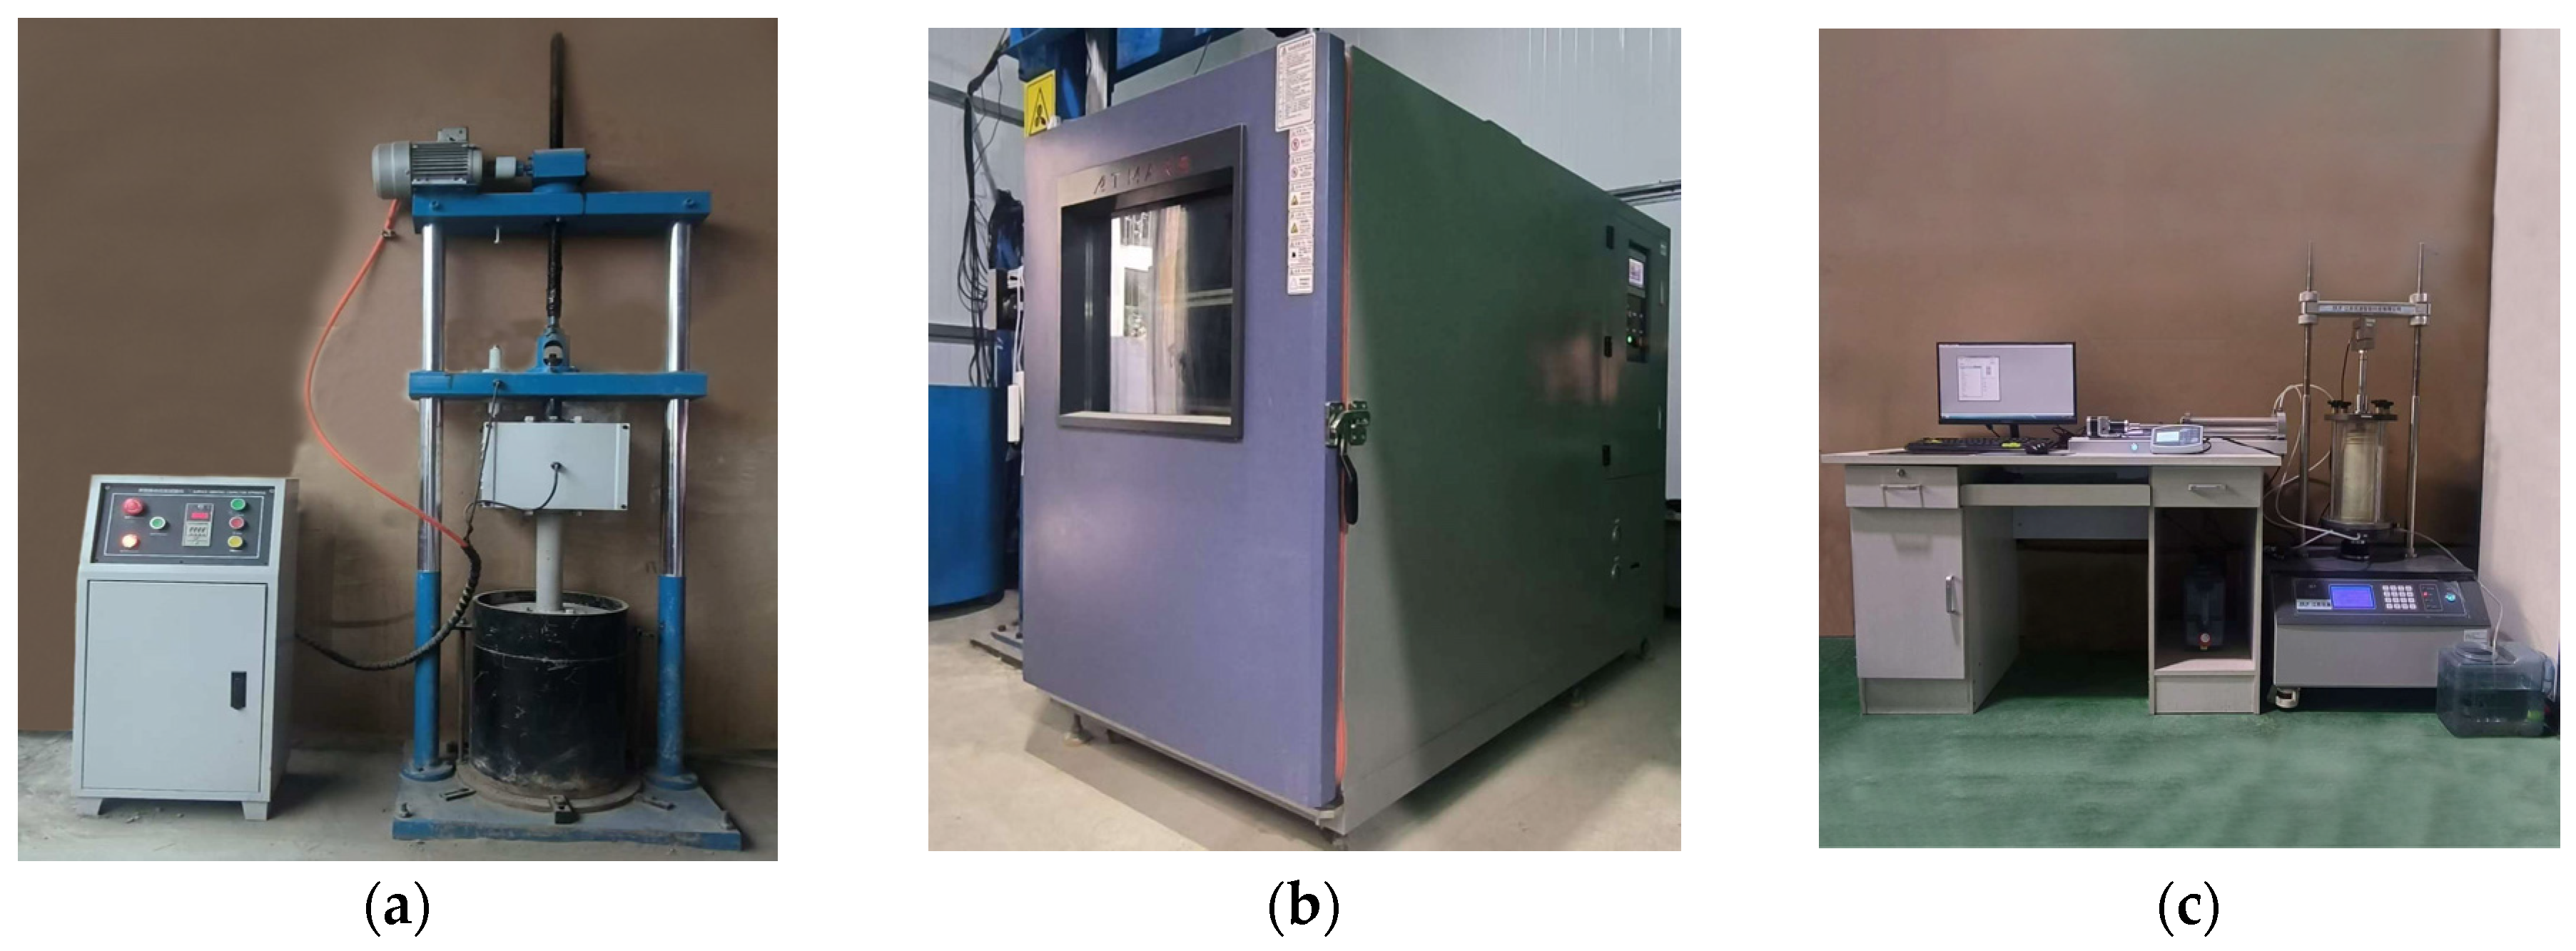
The soil samples used in this experiment were collected from a large landslide deposit in Linzhi, Xizang (30°10′4.07″ N, 94°56′37.04″ E). The samples primarily consist of fragmented rock, gravel, and fine-grained soil. The fundamental physical properties of the soil are listed in Table 1.
The experiment was conducted in strict accordance with the national standard “Standard for Soil Test Methods” (GB/T 50123-2019) [25]. The collected soil samples from the study area contain more than 50% coarse particles by total mass, classifying it as coarse-grained soil, which can be further subdivided as poorly graded gravel. The sieved sample is shown in Figure 1a. Due to the limitations of the testing equipment, particles exceeding the allowed particle size were removed or replaced with an equal volume, in accordance with national standards. The cumulative particle size distribution curves before and after treatment are shown in Figure 1b. The moisture contents of 9.6% and 11.6% represent wet-state conditions under typical seasonal rainfall and freeze–thaw water migration scenarios in the study region, based on regional geotechnical reports and prior in situ observations.
The experiment included three moisture content levels (7.6%, 9.6%, and 11.6%), four confining pressure levels (50 kPa, 100 kPa, 150 kPa, and 200 kPa), and six FT cycles (0, 1, 3, 6, 10, and 15 cycles). The test samples were prepared as follows. First, soil was weighed and mixed according to the specified particle size distribution. Distilled water was sprayed onto the dry soil to achieve the target moisture content, and the mixture was sealed in plastic film and left to equilibrate for 24 h. Next, the soil was weighed to ensure a dry density of 1.95 g/cm3 and compacted in five layers within a mold to form cylindrical specimens (101 mm in diameter and 210 mm in height). The specimens were then wrapped in plastic film to prevent moisture loss, maintaining a sealed FT environment without additional water supply or significant moisture dissipation. Finally, each specimen was labeled and prepared for FT cycle testing, as shown in Figure 2.

2.2. Test Methods

For each combination of moisture content, confining pressure, and FT cycle number, three parallel specimens were tested to ensure repeatability. The average values were reported and analyzed in this study.
  • FT Cycle Test
The FT cycles were conducted in an AH-1200A constant temperature and humidity chamber. The freezing temperature was set to −20 °C, while the thawing temperature was maintained at 20 °C. Each specimen underwent 12 h of freezing followed by 12 h of thawing, forming complete 24 h FT cycles. This process was repeated according to the designated number of FT cycles. All specimens were compacted into cylindrical molds before the FT treatment and underwent full freeze–thaw cycles under sealed conditions. After thawing, the specimens were tested in their intact post-cycled state without remolding.
2.
Triaxial Shear Test
After completing the predetermined number of FT cycles, the thawed specimens were subjected to unconsolidated undrained (UU) triaxial shear tests using a strain-controlled triaxial apparatus. The axial strain rate was set to 1.5 mm/min, and data acquisition was performed automatically at 2 s intervals. The equipment used in this test is shown in Figure 3.

3. Experimental Results and Analysis

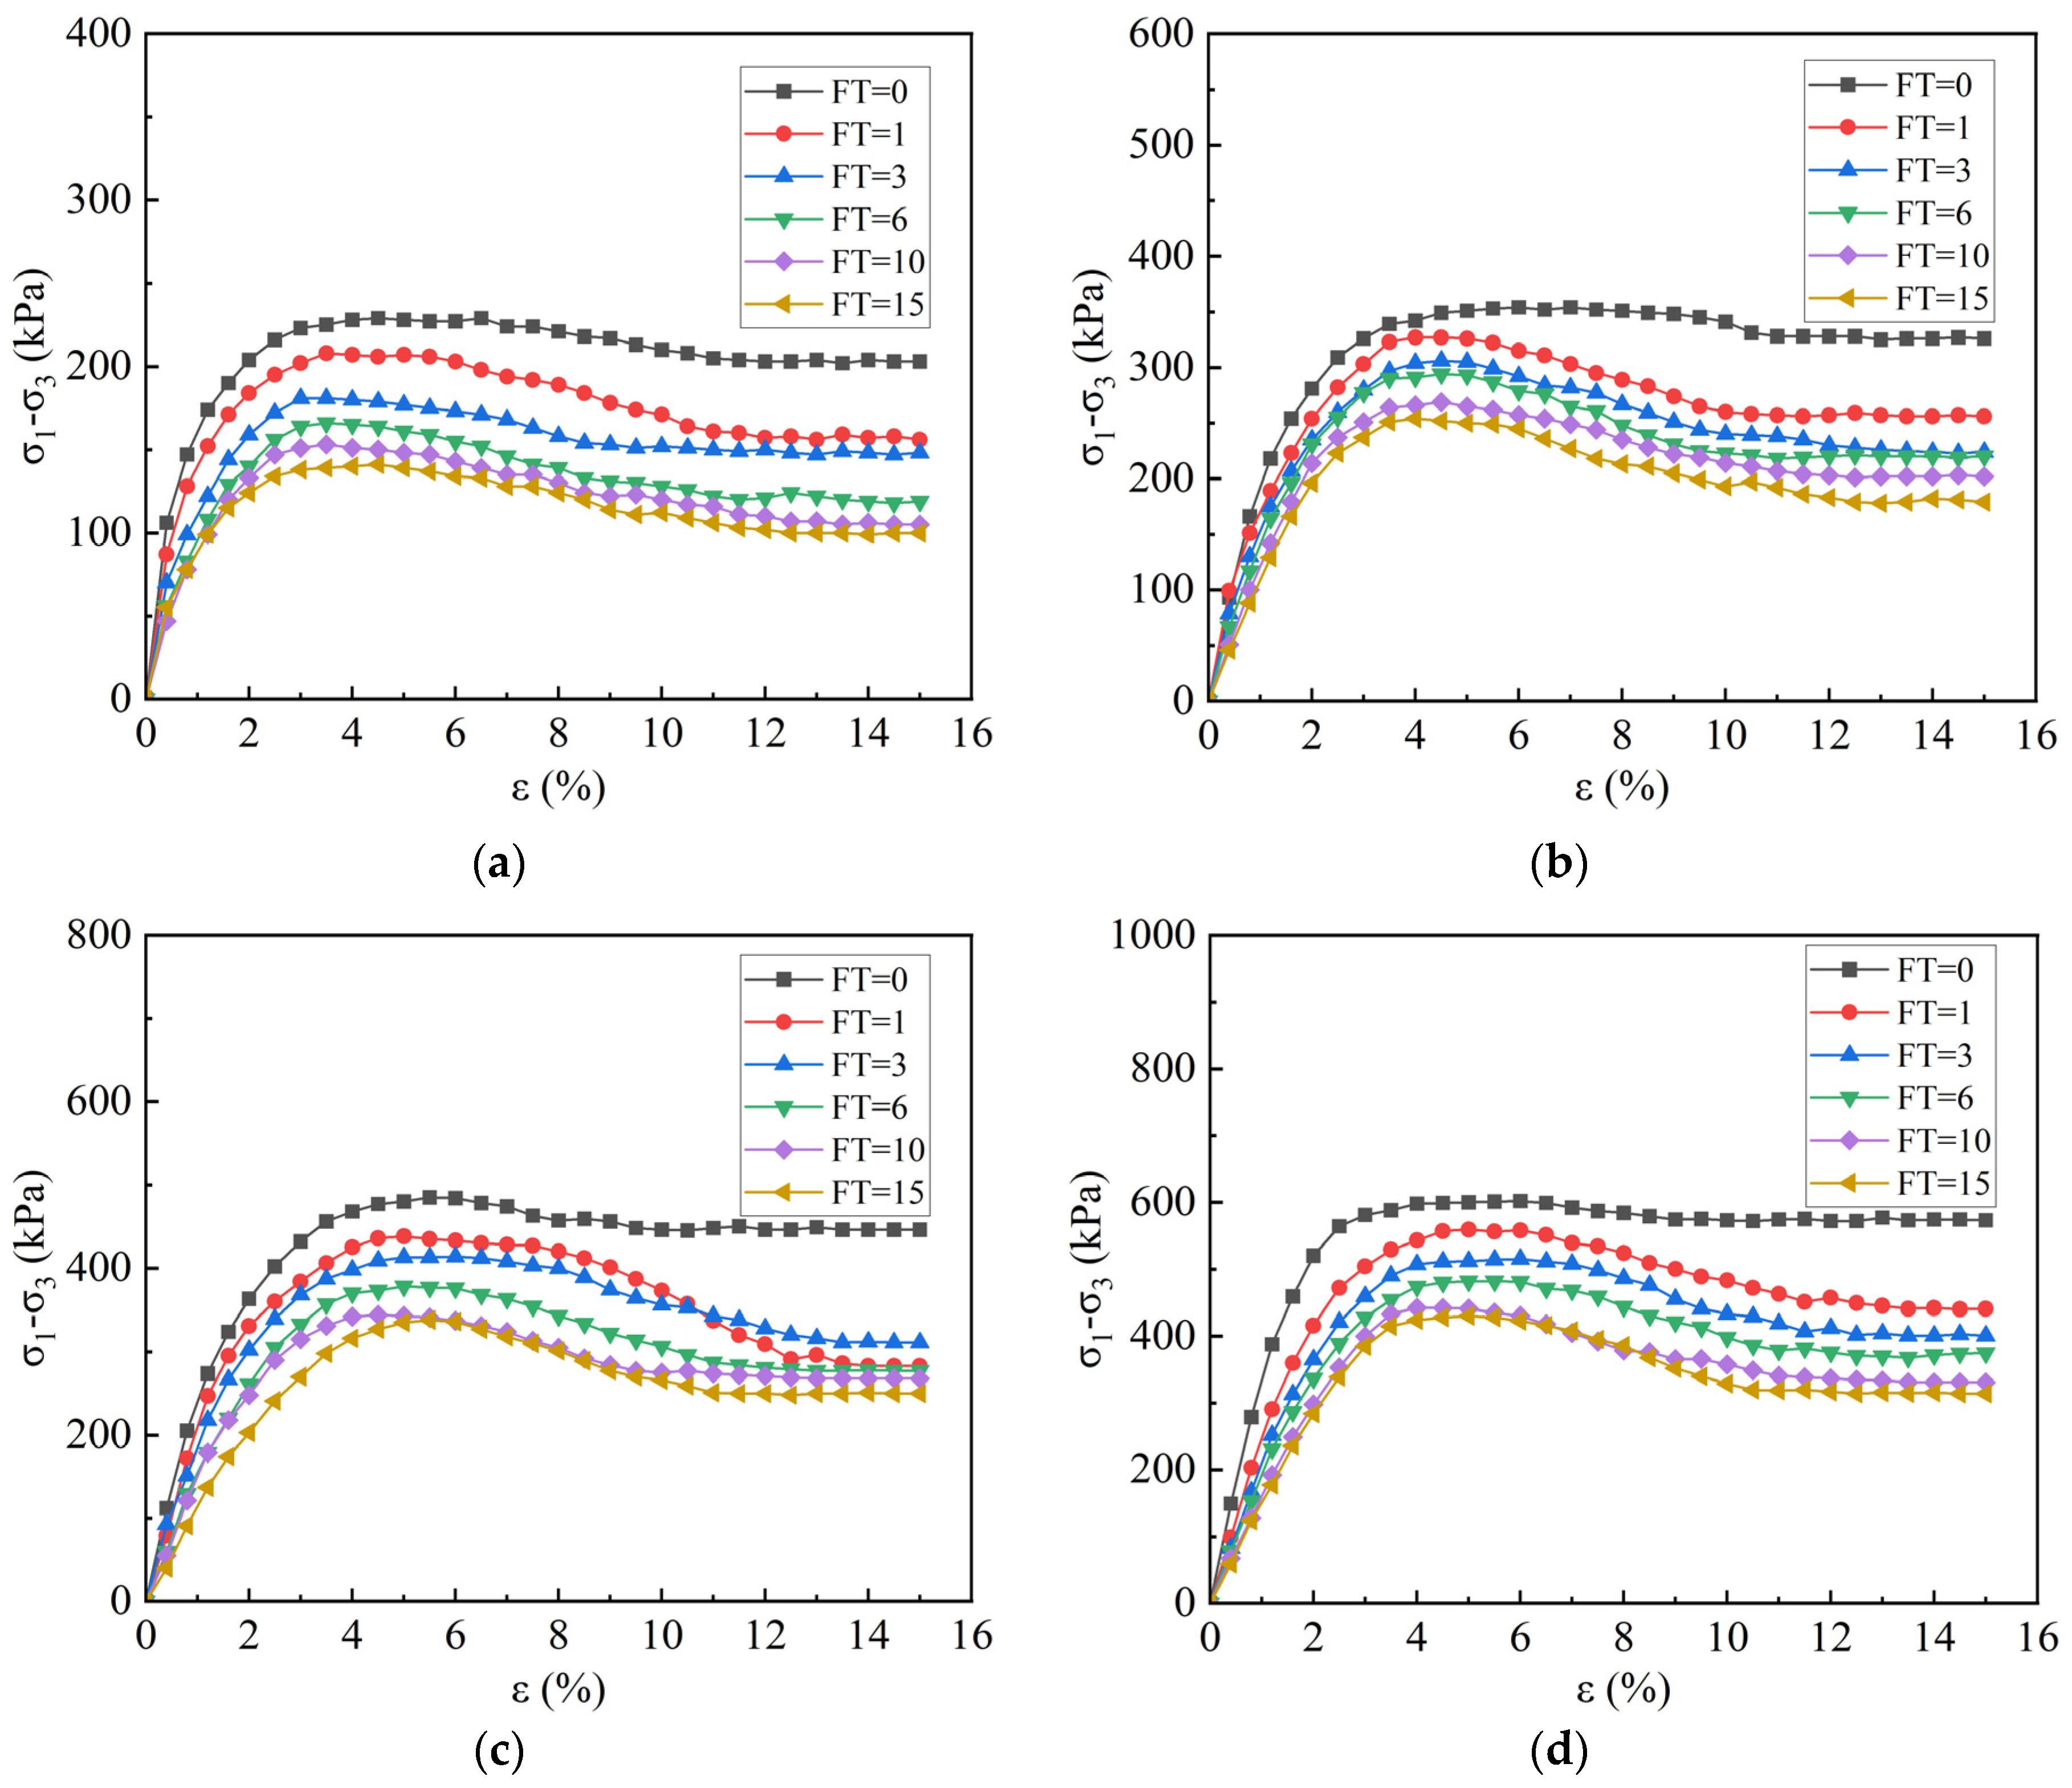
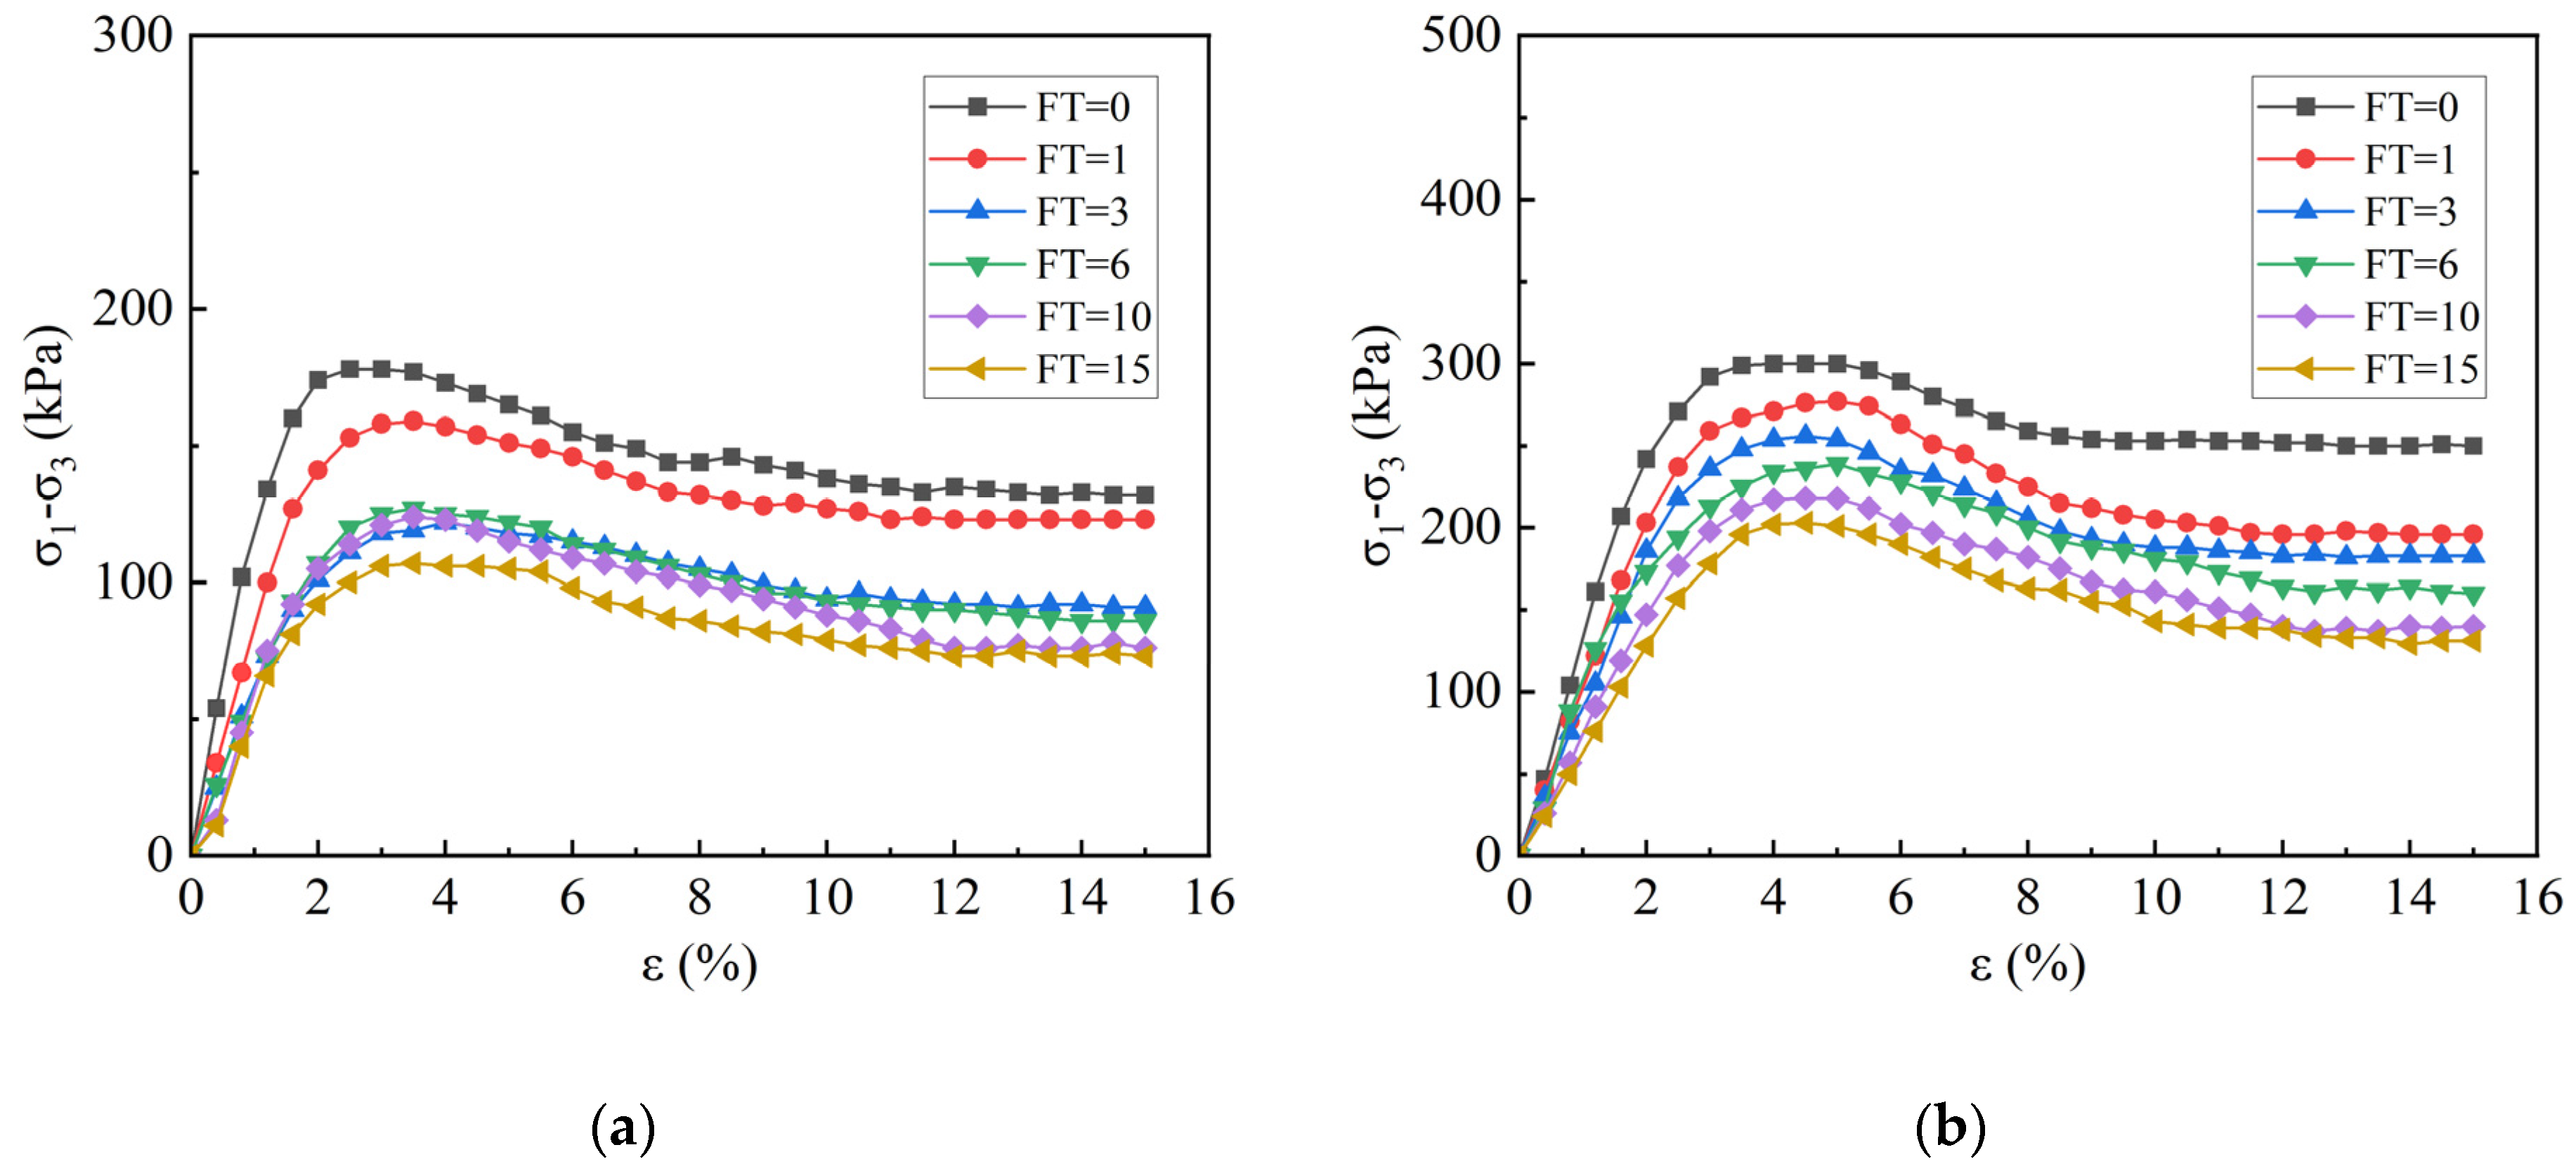
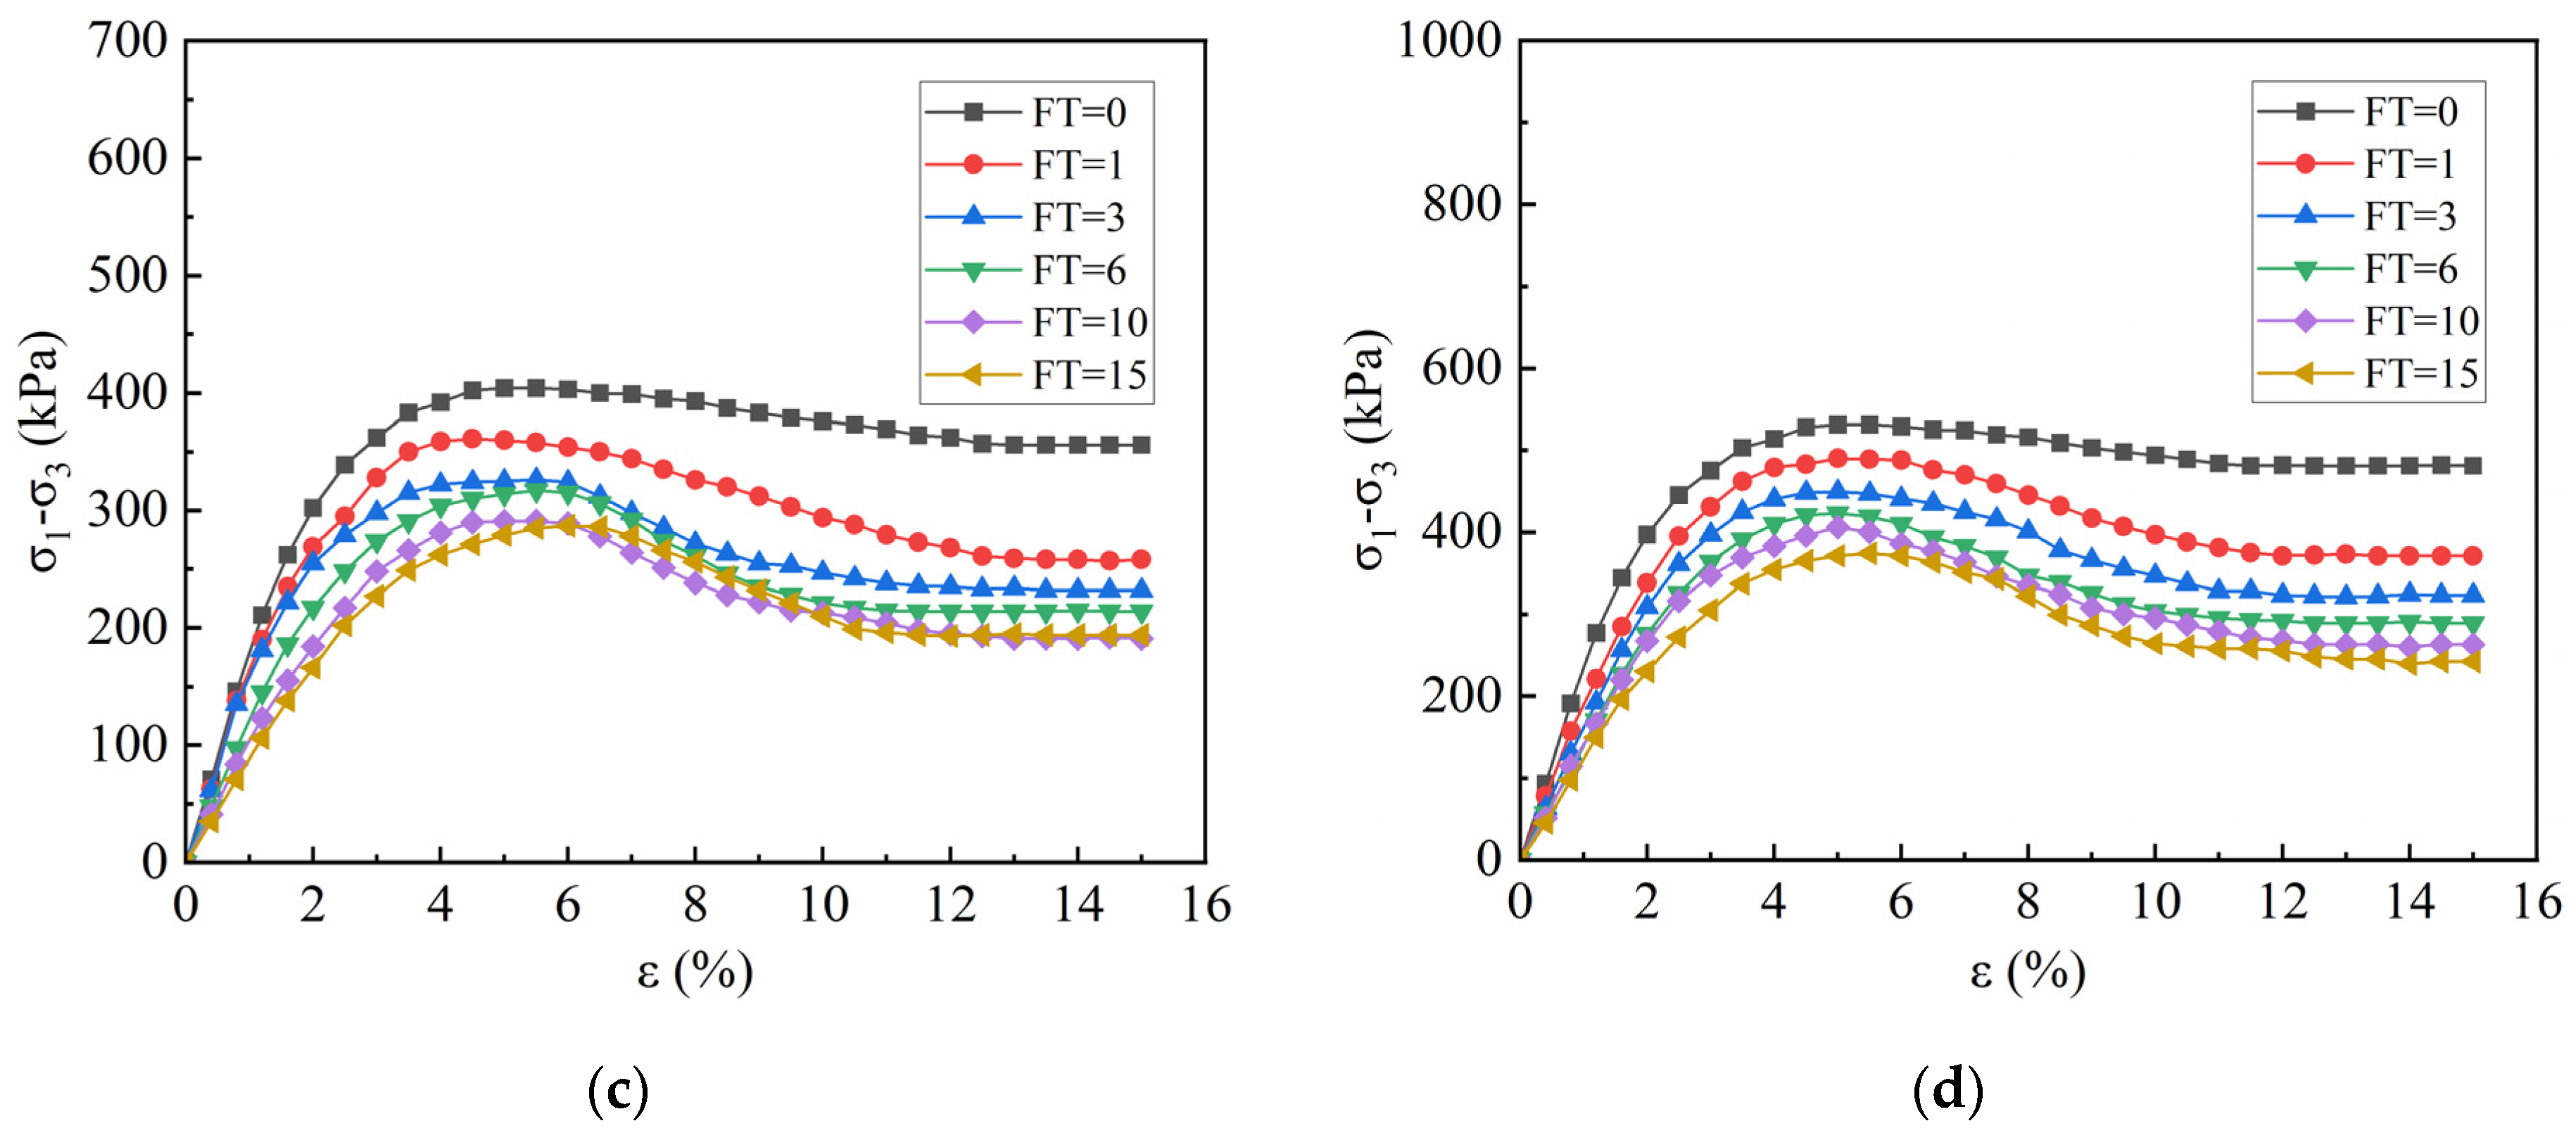
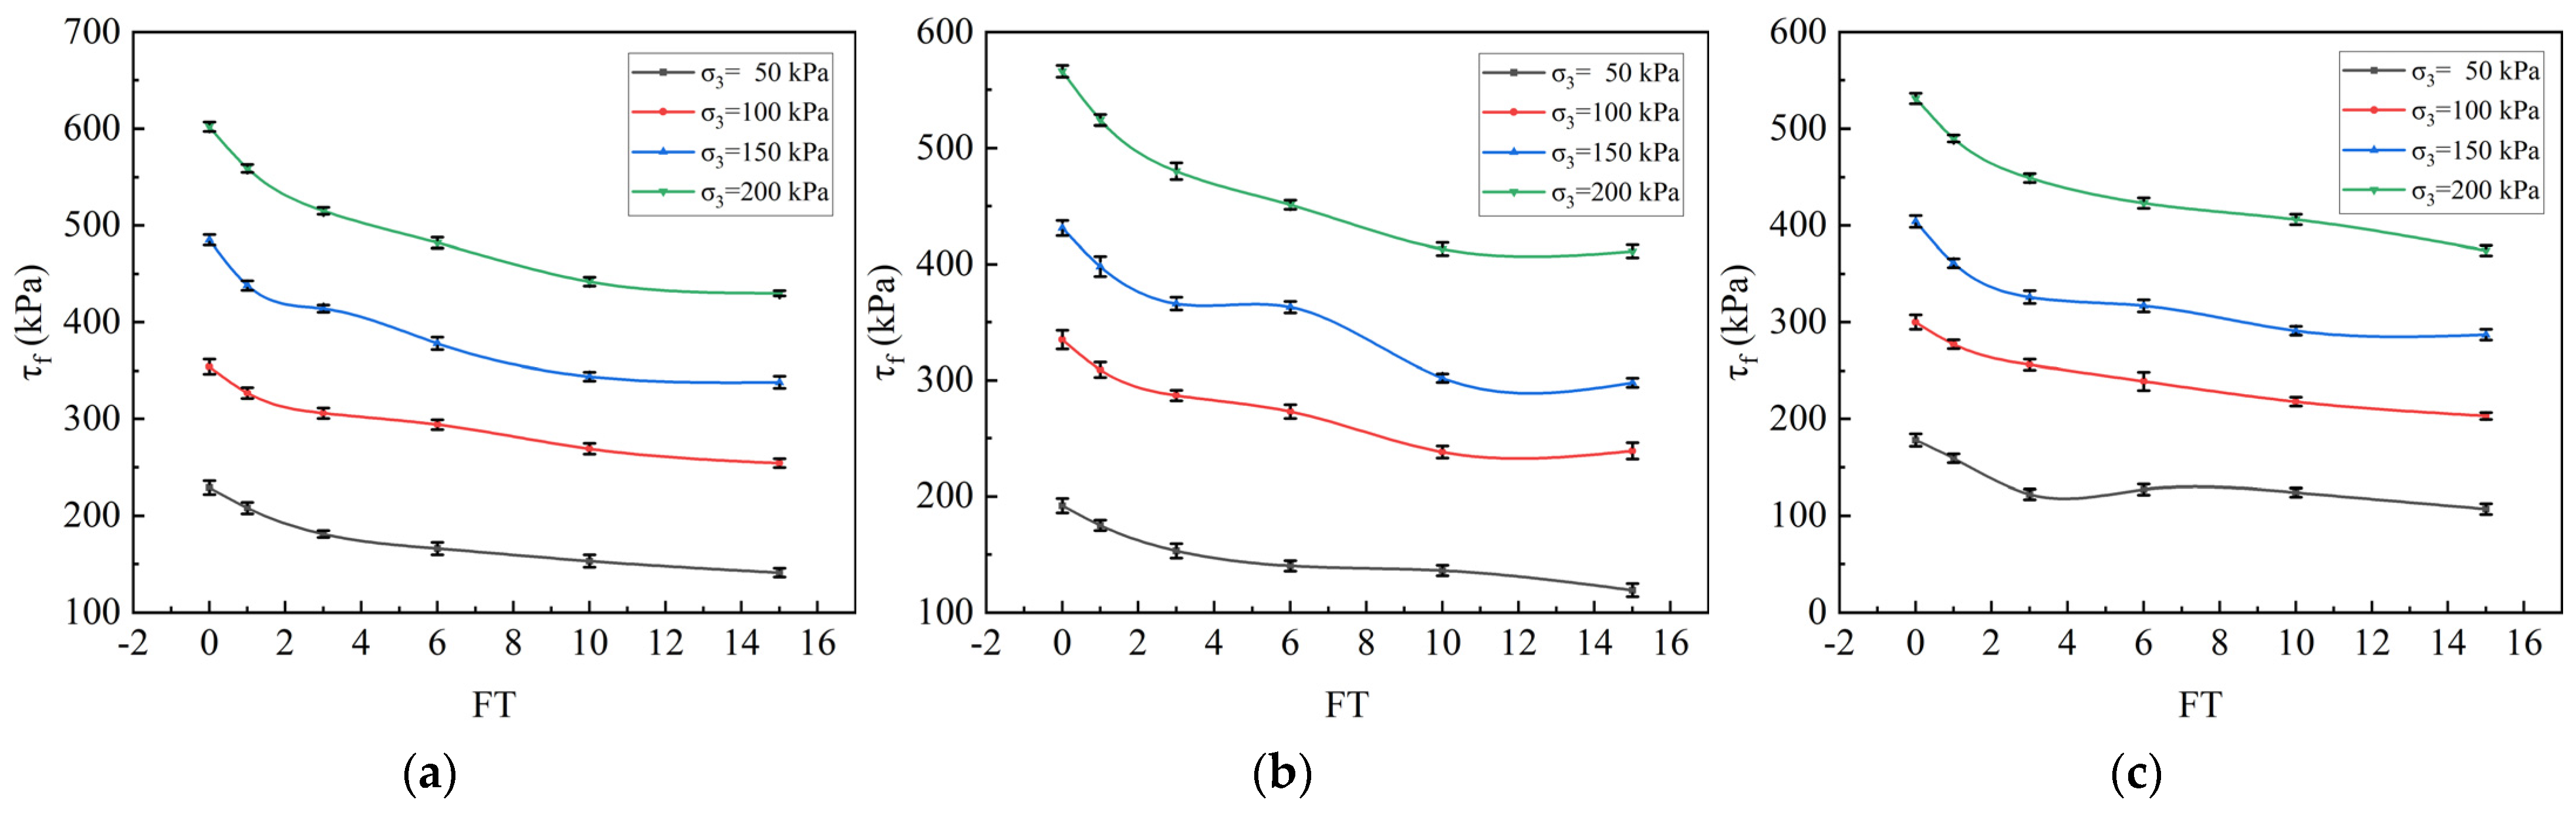
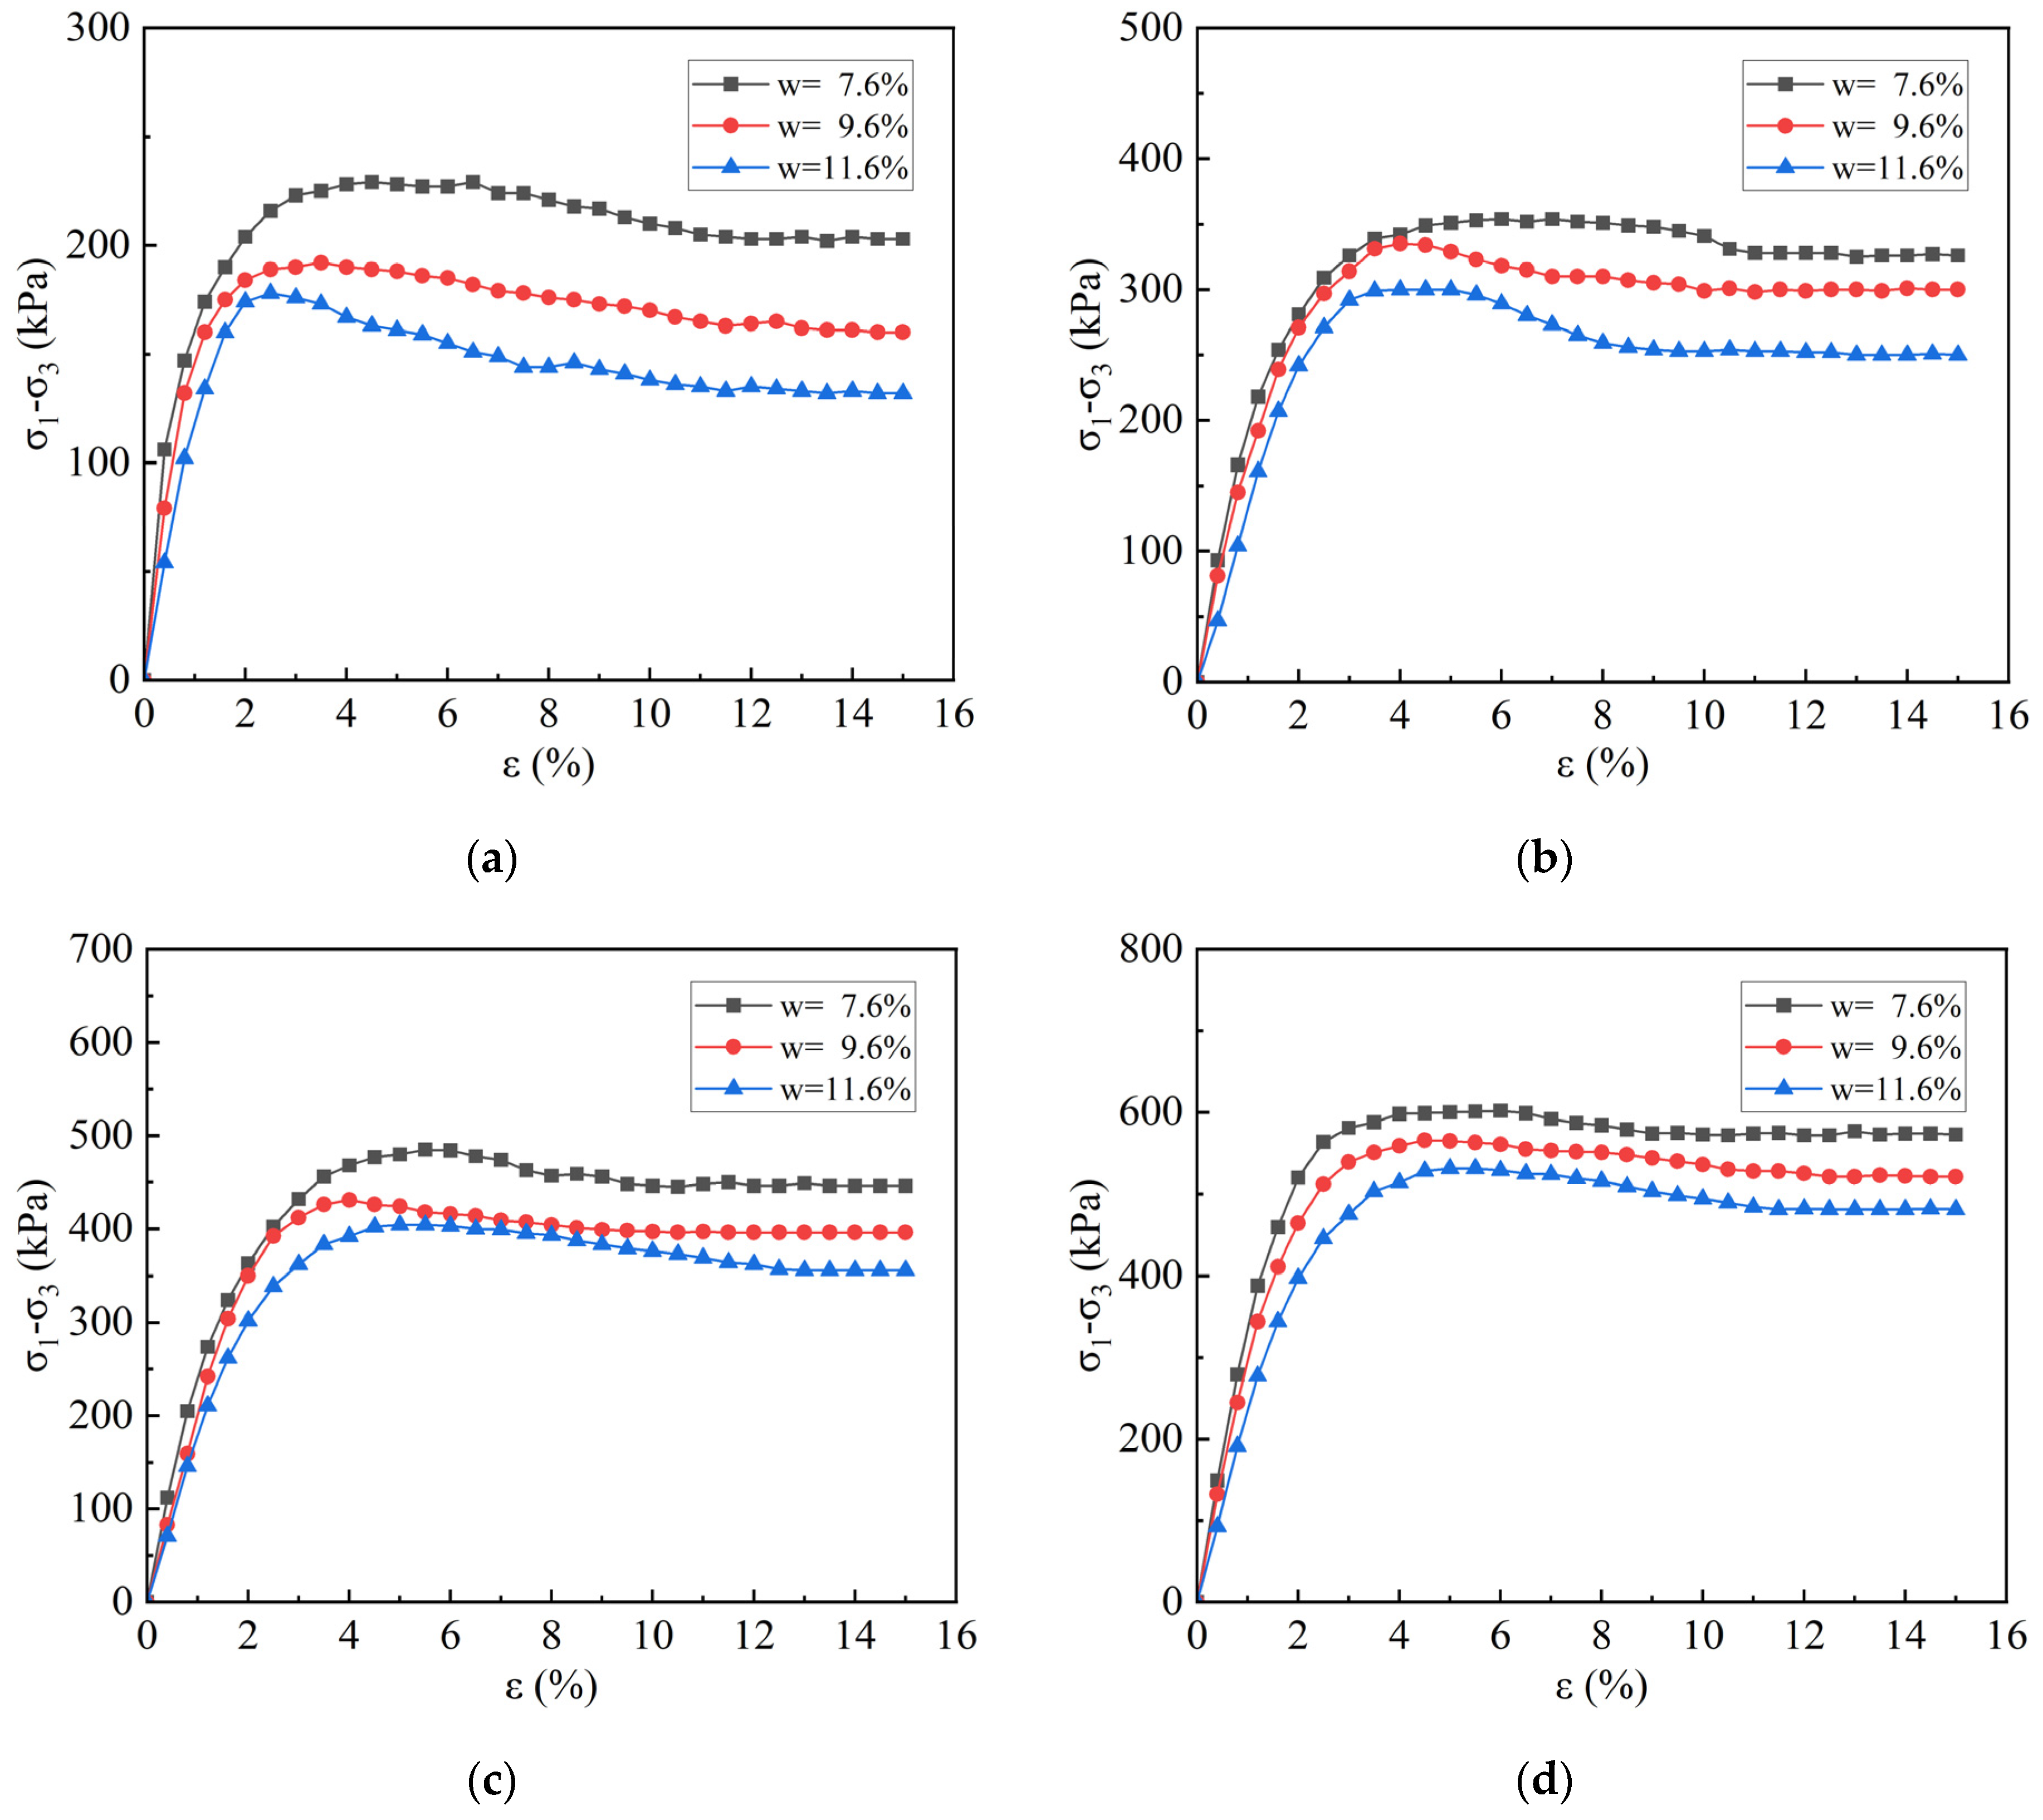
3.1. Effect of FT Cycles and Confining Pressure on the Mechanical Properties of Specimens

The stress–strain curves of coarse-grained soil from southeastern Xizang were plotted based on the results of unconsolidated undrained (UU) triaxial shear tests. These curves illustrate the effects of different confining pressures and FT cycles at moisture contents of 7.6%, 9.6%, and 11.6%, as shown in Figure 4, Figure 5 and Figure 6. In conventional triaxial tests, the relationship between deviator stress (σ1–σ3) and axial strain (ε) typically exhibits either strain softening or strain hardening behavior. In this study, all specimens displayed strain softening characteristics, where the deviator stress increased to a peak value and then gradually decreased with further axial strain.
The relatively high apparent cohesion observed (20–35 kPa) may be attributed to the presence of fines, moisture-induced suction, and initial static densification during sample preparation. Similar magnitudes have been reported for weakly cemented or well-graded coarse–fine mixtures in seasonally frozen soils.
Figure 4 shows the shear process of coarse-grained soil samples from the southeastern Xizangan Plateau with a moisture content of 7.6% under different confining pressures and FT cycles, specifically zero, one, three, six, ten, and fifteen cycles. All the samples exhibited strain softening behavior, with the degree of strain softening increasing as the number of FT cycles increased and decreasing with higher confining pressures.
Figure 5 and Figure 6 display the shear process of the same coarse-grained soil samples with moisture contents of 9.6% and 11.6%, respectively, under varying confining pressures and FT cycles. The strain softening trend observed is consistent with that in Figure 4. In Figure 4, Figure 5 and Figure 6, under identical experimental conditions, the average strain softening degree generally increased with the number of FT cycles from 0 to 15, as follows: 11.59% (FT = 0), 25.51% (FT = 1), 24.98% (FT = 3), 28.95% (FT = 6), 31.10% (FT = 10), and 31.21% (FT = 15). As confining pressure increased from 50 kPa to 200 kPa, the average strain softening degree gradually decreased, with values of 27.66% (σ3 = 50 kPa), 26.22% (σ3 = 100 kPa), 24.38% (σ3 = 150 kPa), and 23.31% (σ3 = 200 kPa). It is clear that compared to the samples that did not undergo FT cycles, those that did showed varying degrees of increased strain softening. After just one FT cycle, the samples exhibited significant strain softening. This is mainly due to the phase change of water during freezing, which causes an expansion in volume, weakening the connections and interlocking between soil particles. Additionally, pore spaces and micro-cracks expand, leading to structural damage to the soil, which cannot fully recover during the subsequent melting of the water. This increases the difficulty of reorienting the soil particles and reduces the residual strength, thereby increasing strain softening. With more FT cycles, the repeated phase change of water gradually deepens the damage to the soil. After 10 cycles, however, since the moisture content is fixed, the total amount of ice–water phase changes is limited, resulting in only minor structural and pore changes in the soil. The internal structure of the soil reaches a new balance, and the effect of FT cycles on the sample stabilizes, causing strain softening to level off [26].
When the soil undergoes shear failure, its stress–strain curve typically consists of five phases: compaction, elastic deformation, plastic deformation, strain softening, and instability failure. In the initial phase of the experiment, strain increases linearly and rapidly. Once the strain exceeds 1%, the curve enters a nonlinear stage, and the slope gradually decreases. Compared to finer-grained soils with higher cohesion, the elastic deformation phase of coarse-grained soil from the southeastern Xizangan Plateau primarily depends on the interlocking and static friction between soil particles, rather than cementation between agglomerates. Therefore, the elastic deformation phase is relatively short, quickly transitioning into the plastic deformation phase, where shear-induced weak zones and the interlocking and friction between soil particles (both static and dynamic friction) bear the applied stresses. As shown in Figure 4, Figure 5 and Figure 6, under identical experimental conditions, as the number of FT cycles increases, the slope of the stress–strain curve and the peak stress gradually decrease. For example, in Figure 4, the degree of peak stress reduction is as follows: 8.41% (from zero to one FT cycle), 8.19% (from one to three cycles), 6.83% (from three to six cycles), 8.41% (from six to ten cycles), and 4.47% (from ten to fifteen cycles). As confining pressure increases, both the initial slope and peak stress of the curve gradually increase, with peak stress rising by 67.35% (from 50 kPa to 100 kPa), 32.87% (from 100 kPa to 150 kPa), and 26.41% (from 150 kPa to 200 kPa). The gradual decrease in the slope of the curve as the FT cycles increase is partly due to the volume expansion of pore water during freezing, which enlarges the pores in the soil, increasing the distance between particles and making it easier for pore compaction and plastic deformation to occur during shearing. During the melting phase, the pore water becomes liquid, and due to factors such as gravity, the water migrates downward, causing redistribution. This results in a higher moisture content in the lower part of the sample, reducing the effective stress at the upper part of the sample during shearing. The excess moisture in the lower part further damages the soil during the next freezing cycle. Additionally, FT cycles cause larger soil particles to break and smaller particles to agglomerate, reducing the soil’s homogeneity and affecting its physical and mechanical properties. The reduction in peak stress is mainly due to the accumulation of irreversible structural damage caused by FT cycles, which decreases the soil’s resistance to deformation and failure [27]. After 10 FT cycles, the deformation and failure characteristics of the sample gradually stabilize. The increase in slope and peak stress as confining pressure increases is primarily due to the reduction in pore size between soil particles, increasing contact points, making the soil denser, and improving its resistance to deformation and failure.
The stress–strain curves of the samples all exhibit strain softening behavior, with the peak value of the curve being taken as the shear strength of the soil sample. The shear strength is plotted based on different FT cycle counts and confining pressures, as shown in Figure 7. Under the same experimental conditions, for samples with different moisture contents, the average shear strength reduction as the FT cycles increase from 0 to 15 is 38.78% (σ3 = 50 kPa), 29.75% (σ3 = 100 kPa), 30.04% (σ3 = 150 kPa), and 28.51% (σ3 = 200 kPa), with an average value of 31.77%. It can be seen that with the increase in FT cycles, the shear strength of the soil samples under different confining pressures fluctuates slightly but generally undergoes varying degrees of reduction. The most significant reduction occurs after one FT cycle, with the highest magnitude. As the FT cycles increase, the extent of reduction decreases, and after reaching 10 FT cycles, the reduction begins to stabilize. On the one hand, with the increase in FT cycles, the phase change of water within the soil disrupts its original structure, weakening the soil’s resistance to shear failure. On the other hand, the change in particle gradation during the FT process also leads to a decrease in the shear strength of the soil. Under the same experimental conditions, at a moisture content of 7.6%, the shear strength reduction as the confining pressure decreases from 200 kPa to 50 kPa is 61.96% (FT = 0), 62.79% (FT = 1), 64.85% (FT = 3), 65.56% (FT = 6), 65.38% (FT = 10), and 67.21% (FT = 15), with an average of 64.63%. For a moisture content of 9.6%, the shear strength reduction as the confining pressure decreases from 200 kPa to 50 kPa is 66.08% (FT = 0), 66.60% (FT = 1), 68.13% (FT = 3), 68.96% (FT = 6), 67.07% (FT = 10), and 71.05% (FT = 15), with an average of 67.98%. For a moisture content of 11.6%, the shear strength reduction s the confining pressure decreases from 200 kPa to 50 kPa is 66.48% (FT = 0), 67.55% (FT = 1), 72.83% (FT = 3), 69.98% (FT = 6), 69.46% (FT = 10), and 71.39% (FT = 15), with an average of 69.61%. It can be observed that, under the same experimental conditions, the shear strength of the samples with different moisture contents subjected to FT cycles increases with the increase in confining pressure and also increases with the number of FT cycles. This is because, when confining pressure increases, on the one hand, it compacts the samples, increasing the contact between soil particles, reducing the pore spaces and cracks, and tightening interlocking and bonding, thereby strengthening the sample’s structure and making failure less likely. On the other hand, the increase in confining pressure also enhances the stress state of the soil particles, increasing the resistance to shear failure behaviors such as particle sliding and overturning, thereby improving the sample’s performance in terms of deformation and failure.
Based on the results of the FT cycles and confining pressure triaxial tests, Mohr’s stress circle and failure envelope for the coarse-grained soil samples from the southeastern Xizangan region are plotted. The shear strength parameters (c and φ values) of the samples are calculated using the Mohr–Coulomb strength theory and are shown in Figure 8.
As shown in Figure 8, the cohesion and internal friction angle of coarse-grained soil samples from the southeastern Xizangan region exhibit fluctuations as the number of FT cycles increases from 0 to 15. However, both generally show a gradual decrease, with cohesion decreasing more significantly than the internal friction angle. After 10 FT cycles, these changes begin to stabilize. When the number of FT cycles is 0, the cohesion ranges from 20.17 kPa (w = 11.6%) to 33.92 kPa (w = 7.6%), with an average of 26.53 kPa. After one cycle, it ranges from 17.67 kPa (w = 11.6%) to 29.96 kPa (w = 7.6%), averaging 23.68 kPa. After three cycles, it ranges from 10.95 kPa (w = 11.6%) to 27.57 kPa (w = 7.6%), averaging 20.05 kPa. After six cycles, it ranges from 13.31 kPa (w = 11.6%) to 27.25 kPa (w = 7.6%), averaging 20.85 kPa. After 10 cycles, it ranges from 12.77 kPa (w = 11.6%) to 22.43 kPa (w = 7.6%), averaging 17.88 kPa. After 15 cycles, it ranges from 9.08 kPa (w = 11.6%) to 20.99 kPa (w = 7.6%), averaging 14.80 kPa. Over the course of 0 to 15 cycles, the cohesion decreases by 38.12% to 54.98%. It is evident that the increase in FT cycles significantly degrades the cohesion of the soil, with the degradation weakening as the number of cycles increases and stabilizing after 10 cycles.
The internal friction angle behaves similarly. When the number of FT cycles is 0, it ranges from 23.49° (w = 11.6%) to 25.34° (w = 7.6%), averaging 24.46°. After one cycle, it ranges from 21.30° (w = 11.6%) to 23.53° (w = 7.6%), averaging 22.52°. After three cycles, it ranges from 20.33° (w = 11.6%) to 22.20° (w = 7.6%), averaging 21.10°. After six cycles, it ranges from 18.43° (w = 11.6%) to 20.15° (w = 7.6%), averaging 19.45°. After 10 cycles, it ranges from 16.00° (w = 11.6%) to 19.66° (w = 7.6%), averaging 17.27°. After 15 cycles, it ranges from 16.05° (w = 11.6%) to 18.02° (w = 7.6%), averaging 17.04°. Over the course of 0 to 15 cycles, the internal friction angle decreases by 28.89% to 31.67%. The internal friction angle also gradually decreases with an increasing number of cycles, with the rate of decrease slowing after 10 cycles.
The deterioration of cohesion is partly due to the phase change of pore water during freezing, which increases the pore volume and particle spacing, weakening inter-particle interlocking. Additionally, FT cycles cause some coarse particles to break and fine particles to aggregate, reducing the bonding and interlocking between particles. Similarly, the decrease in internal friction angle is caused by changes in particle gradation, which reduce the soil’s heterogeneity and lower the friction coefficient [4]. The weakening of inter-particle interlocking also contributes to the decrease in the internal friction angle. After 10 FT cycles, both the cohesion and internal friction angle stabilize as the soil reaches a new equilibrium under a constant moisture content and the effects of FT cycles diminish over time.

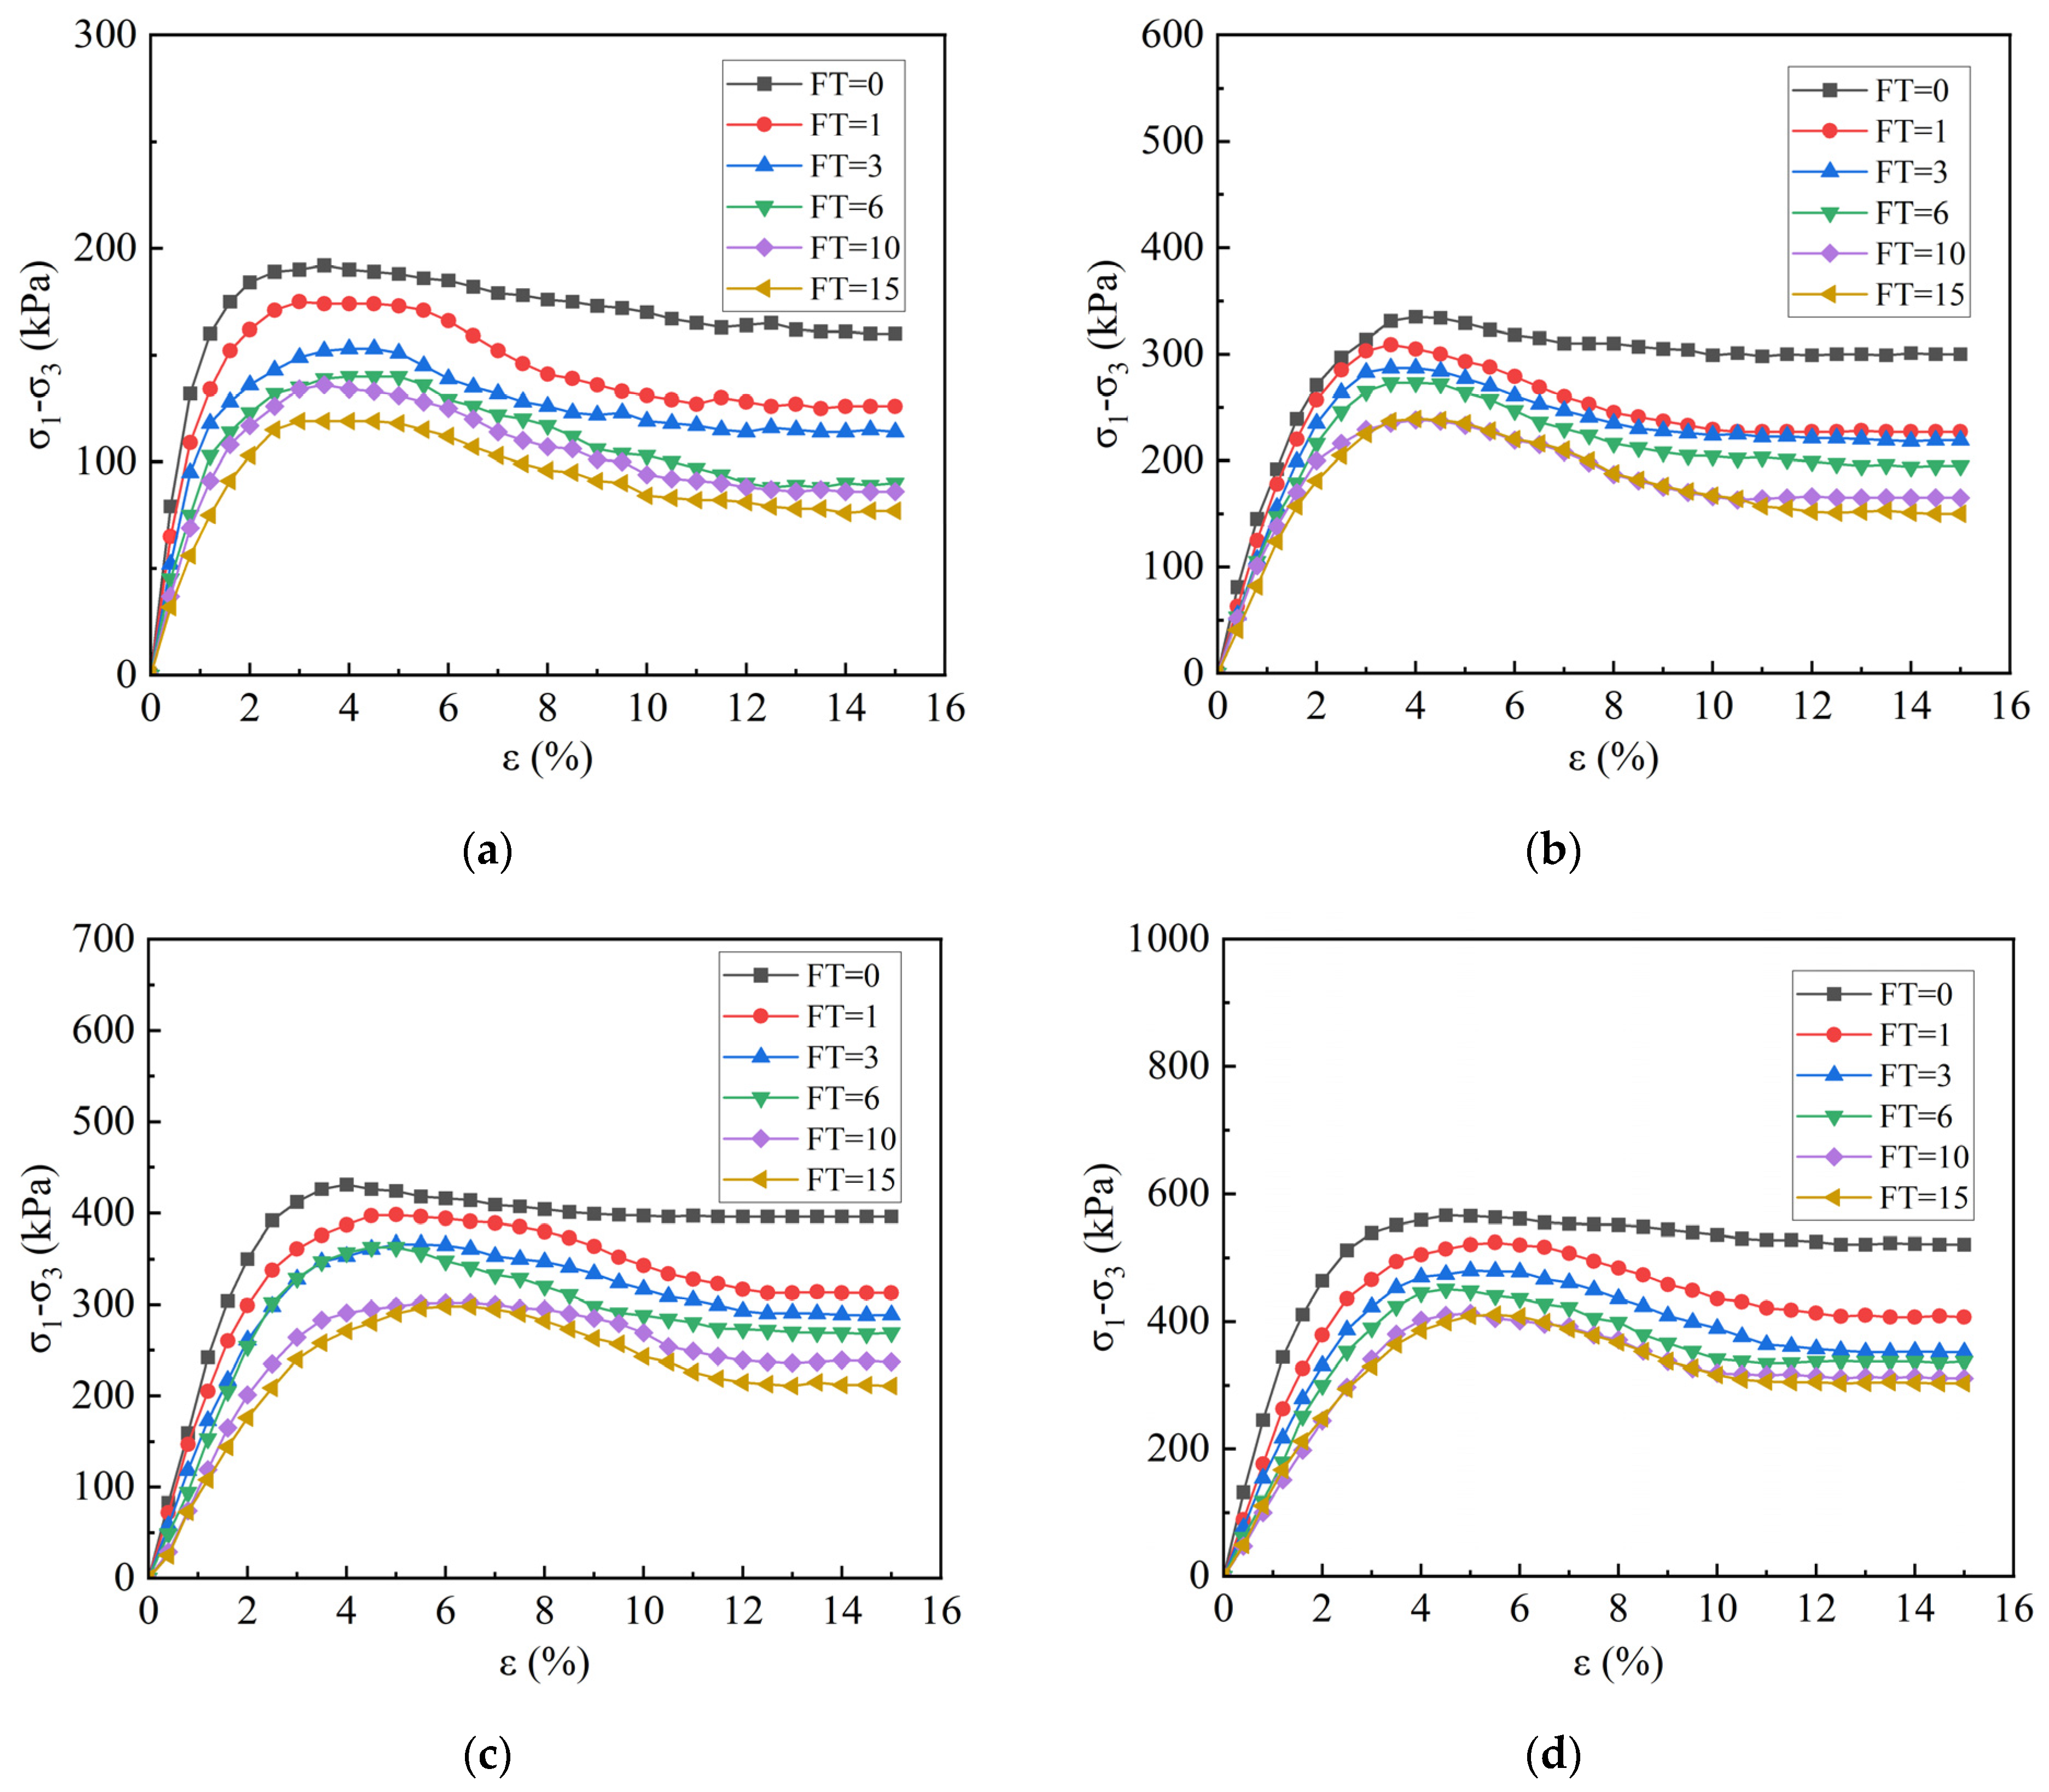
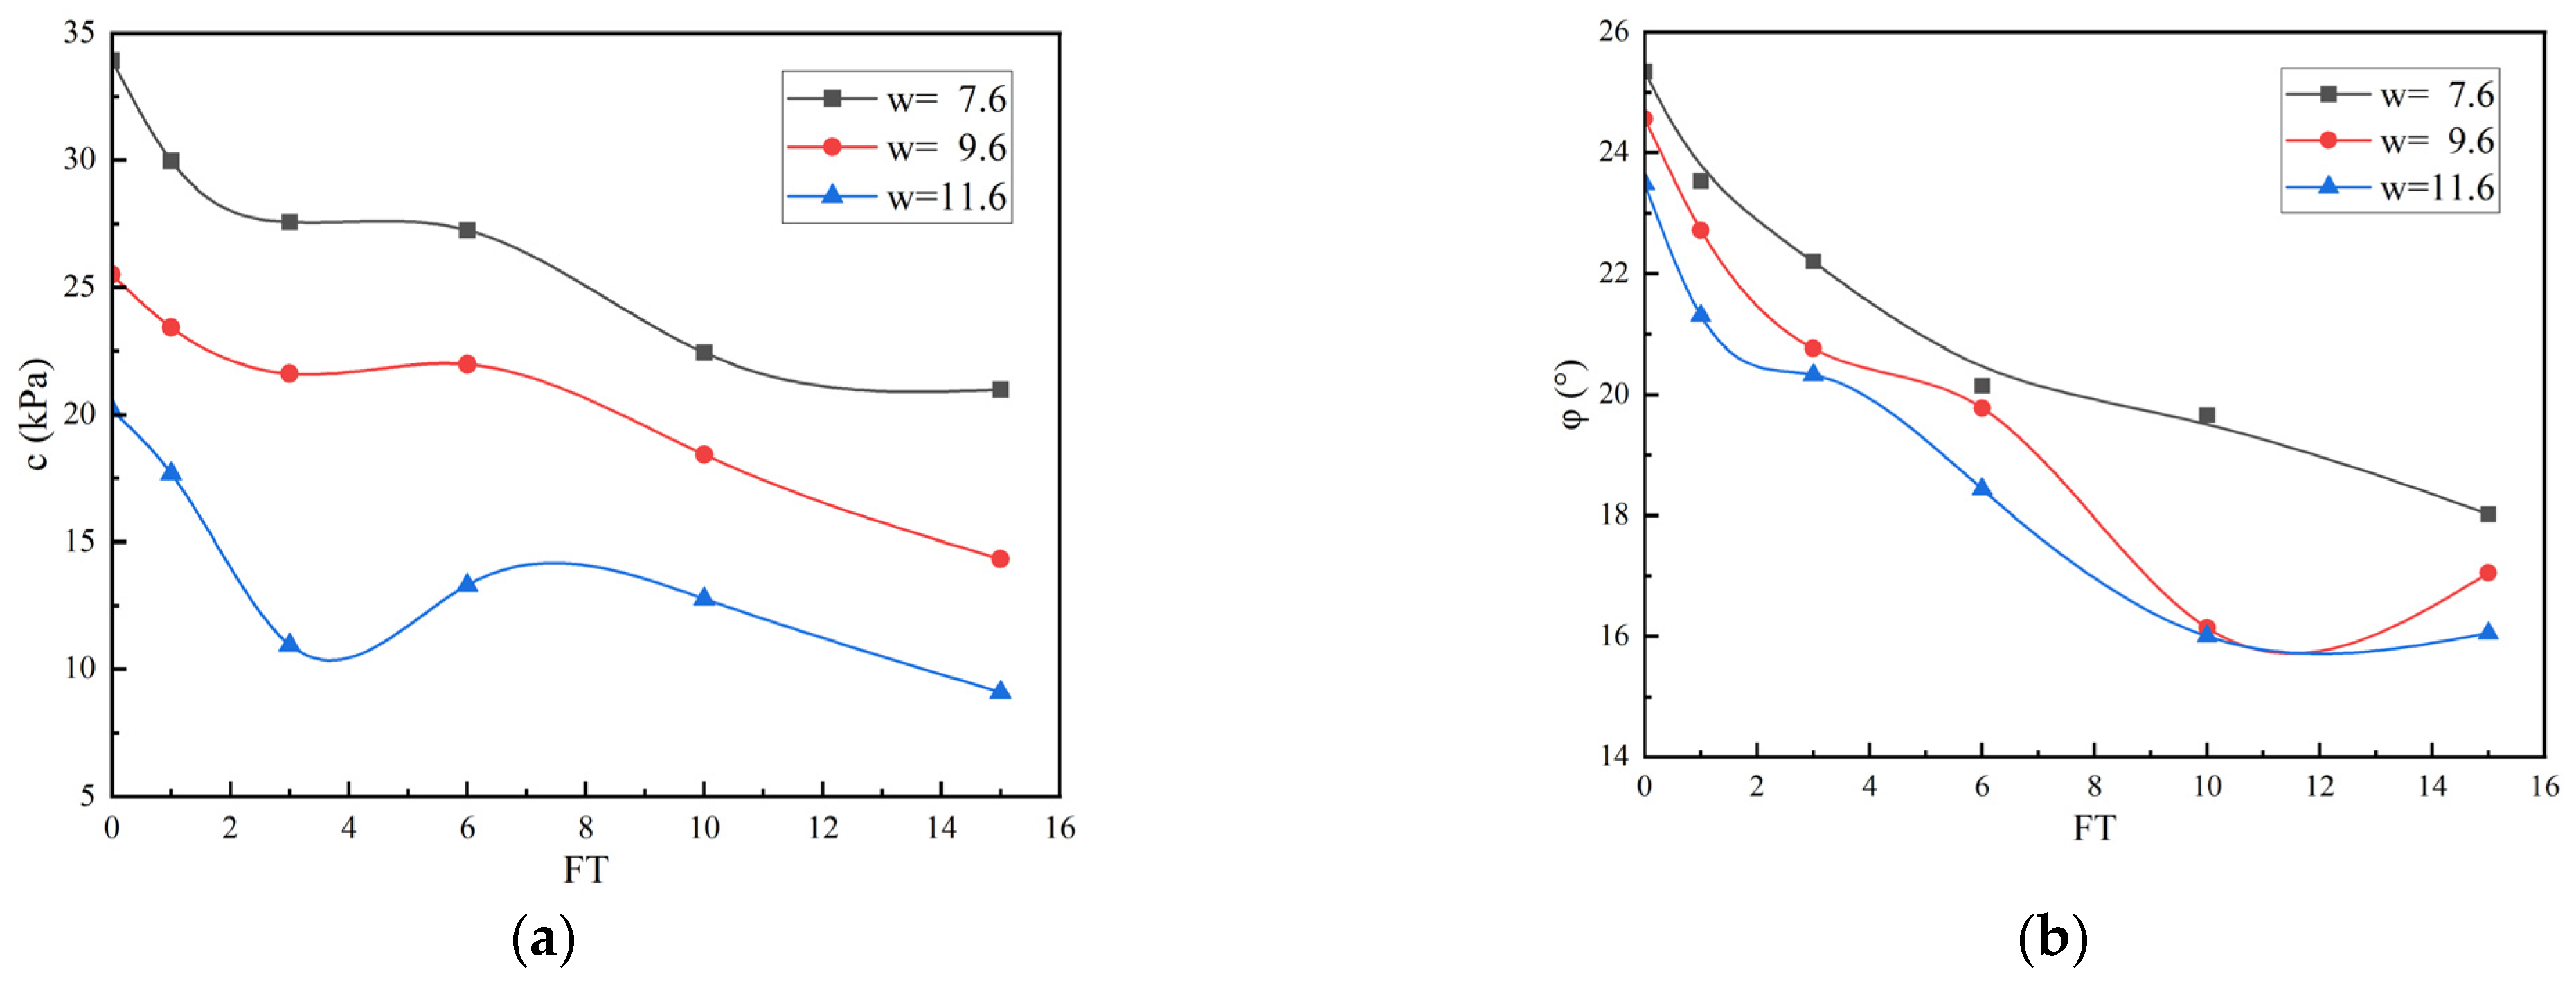
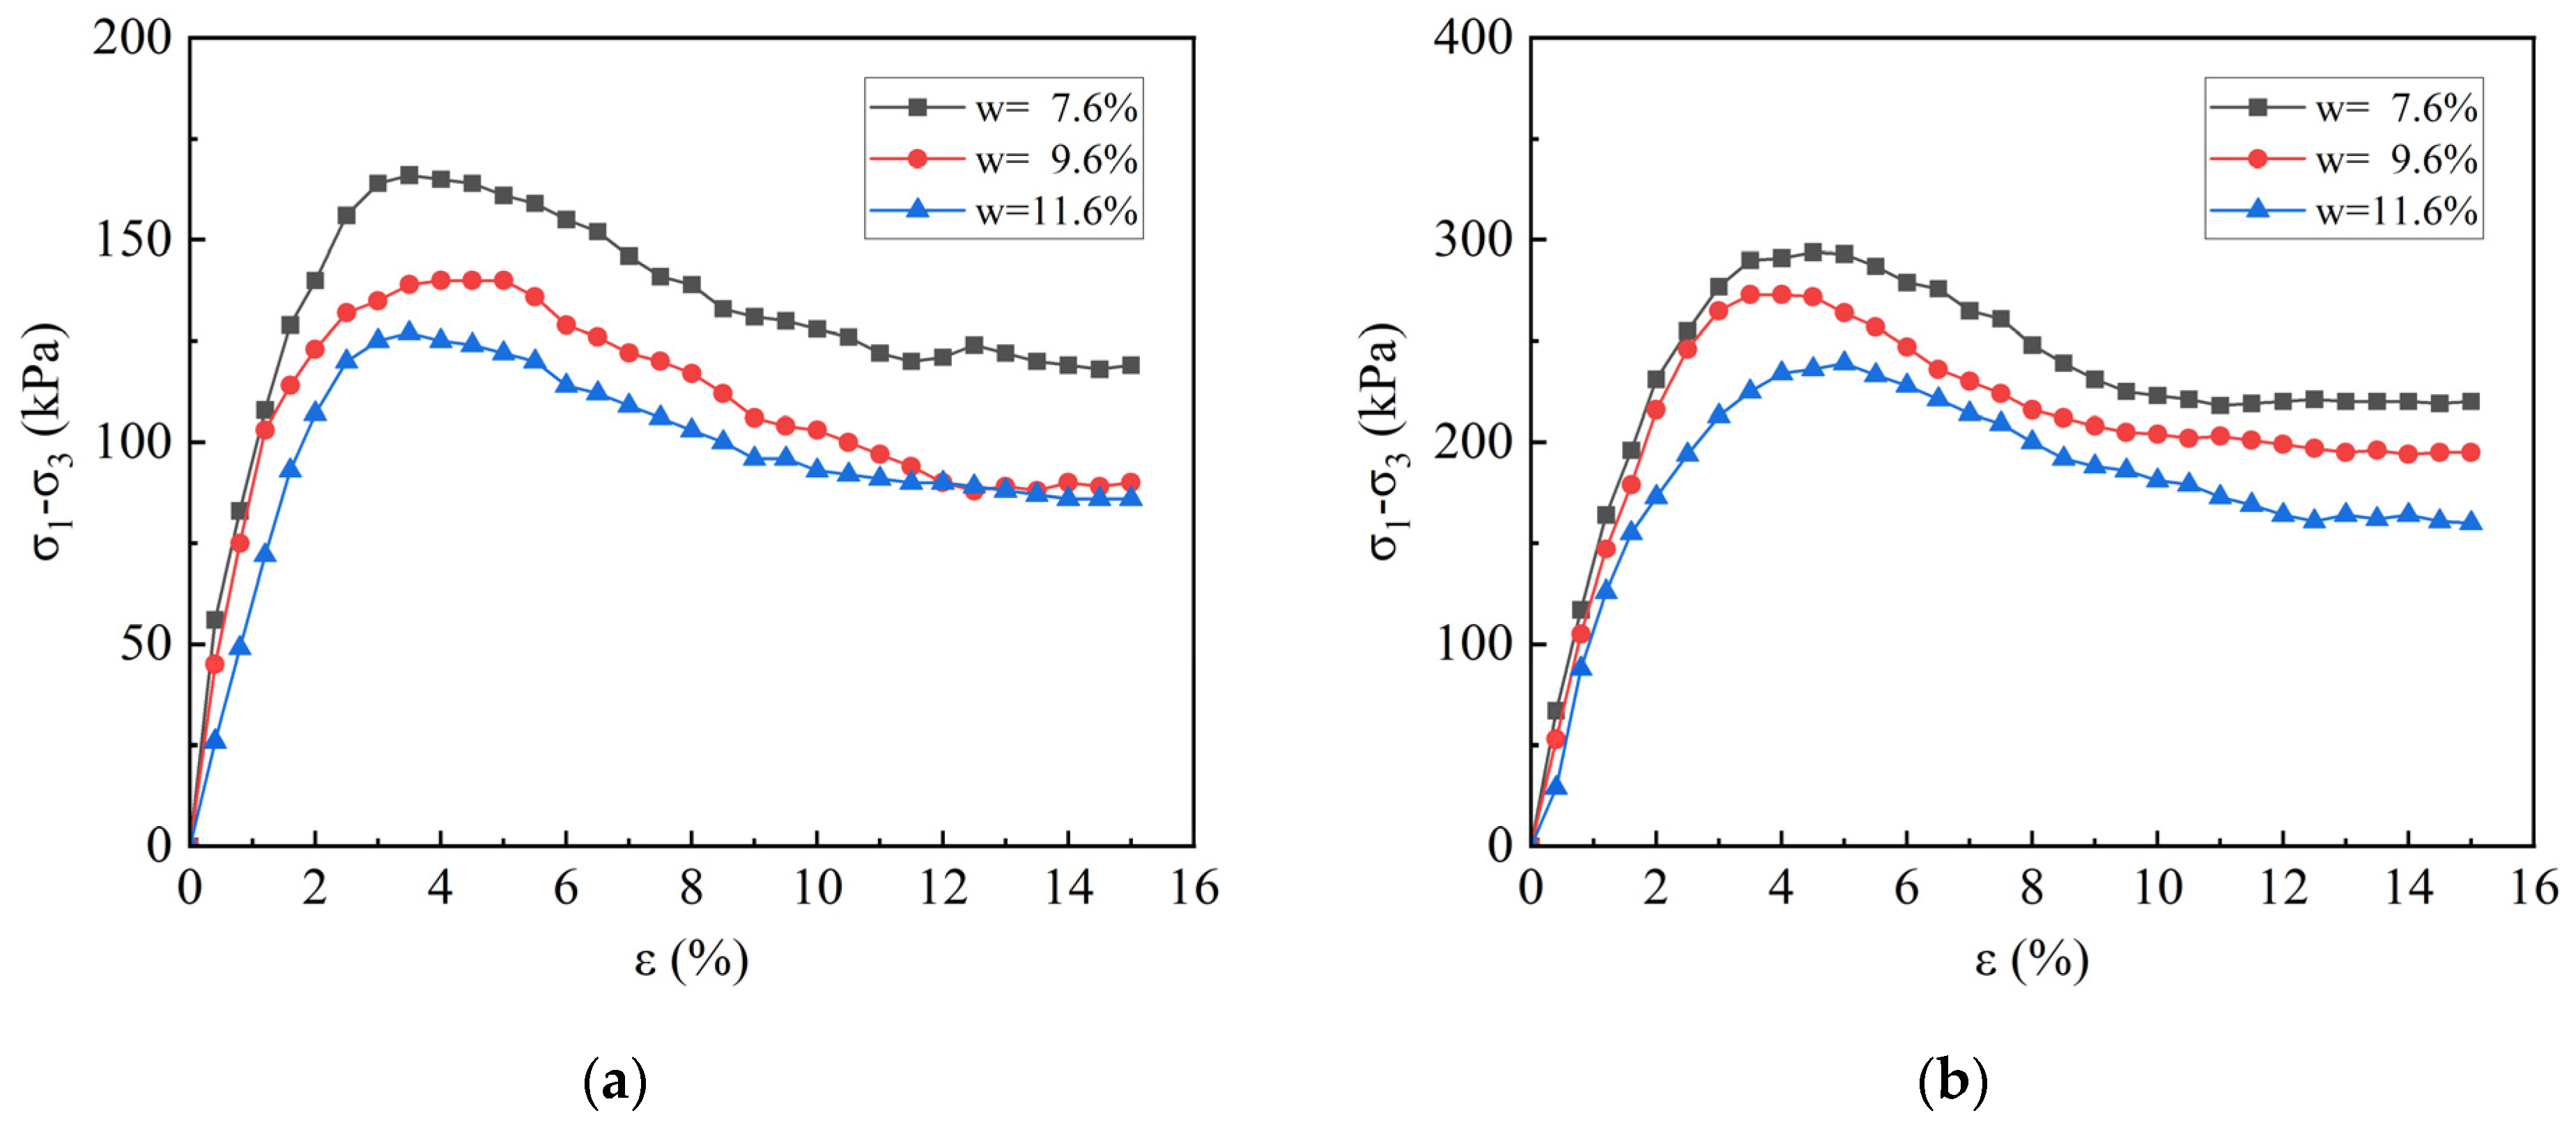
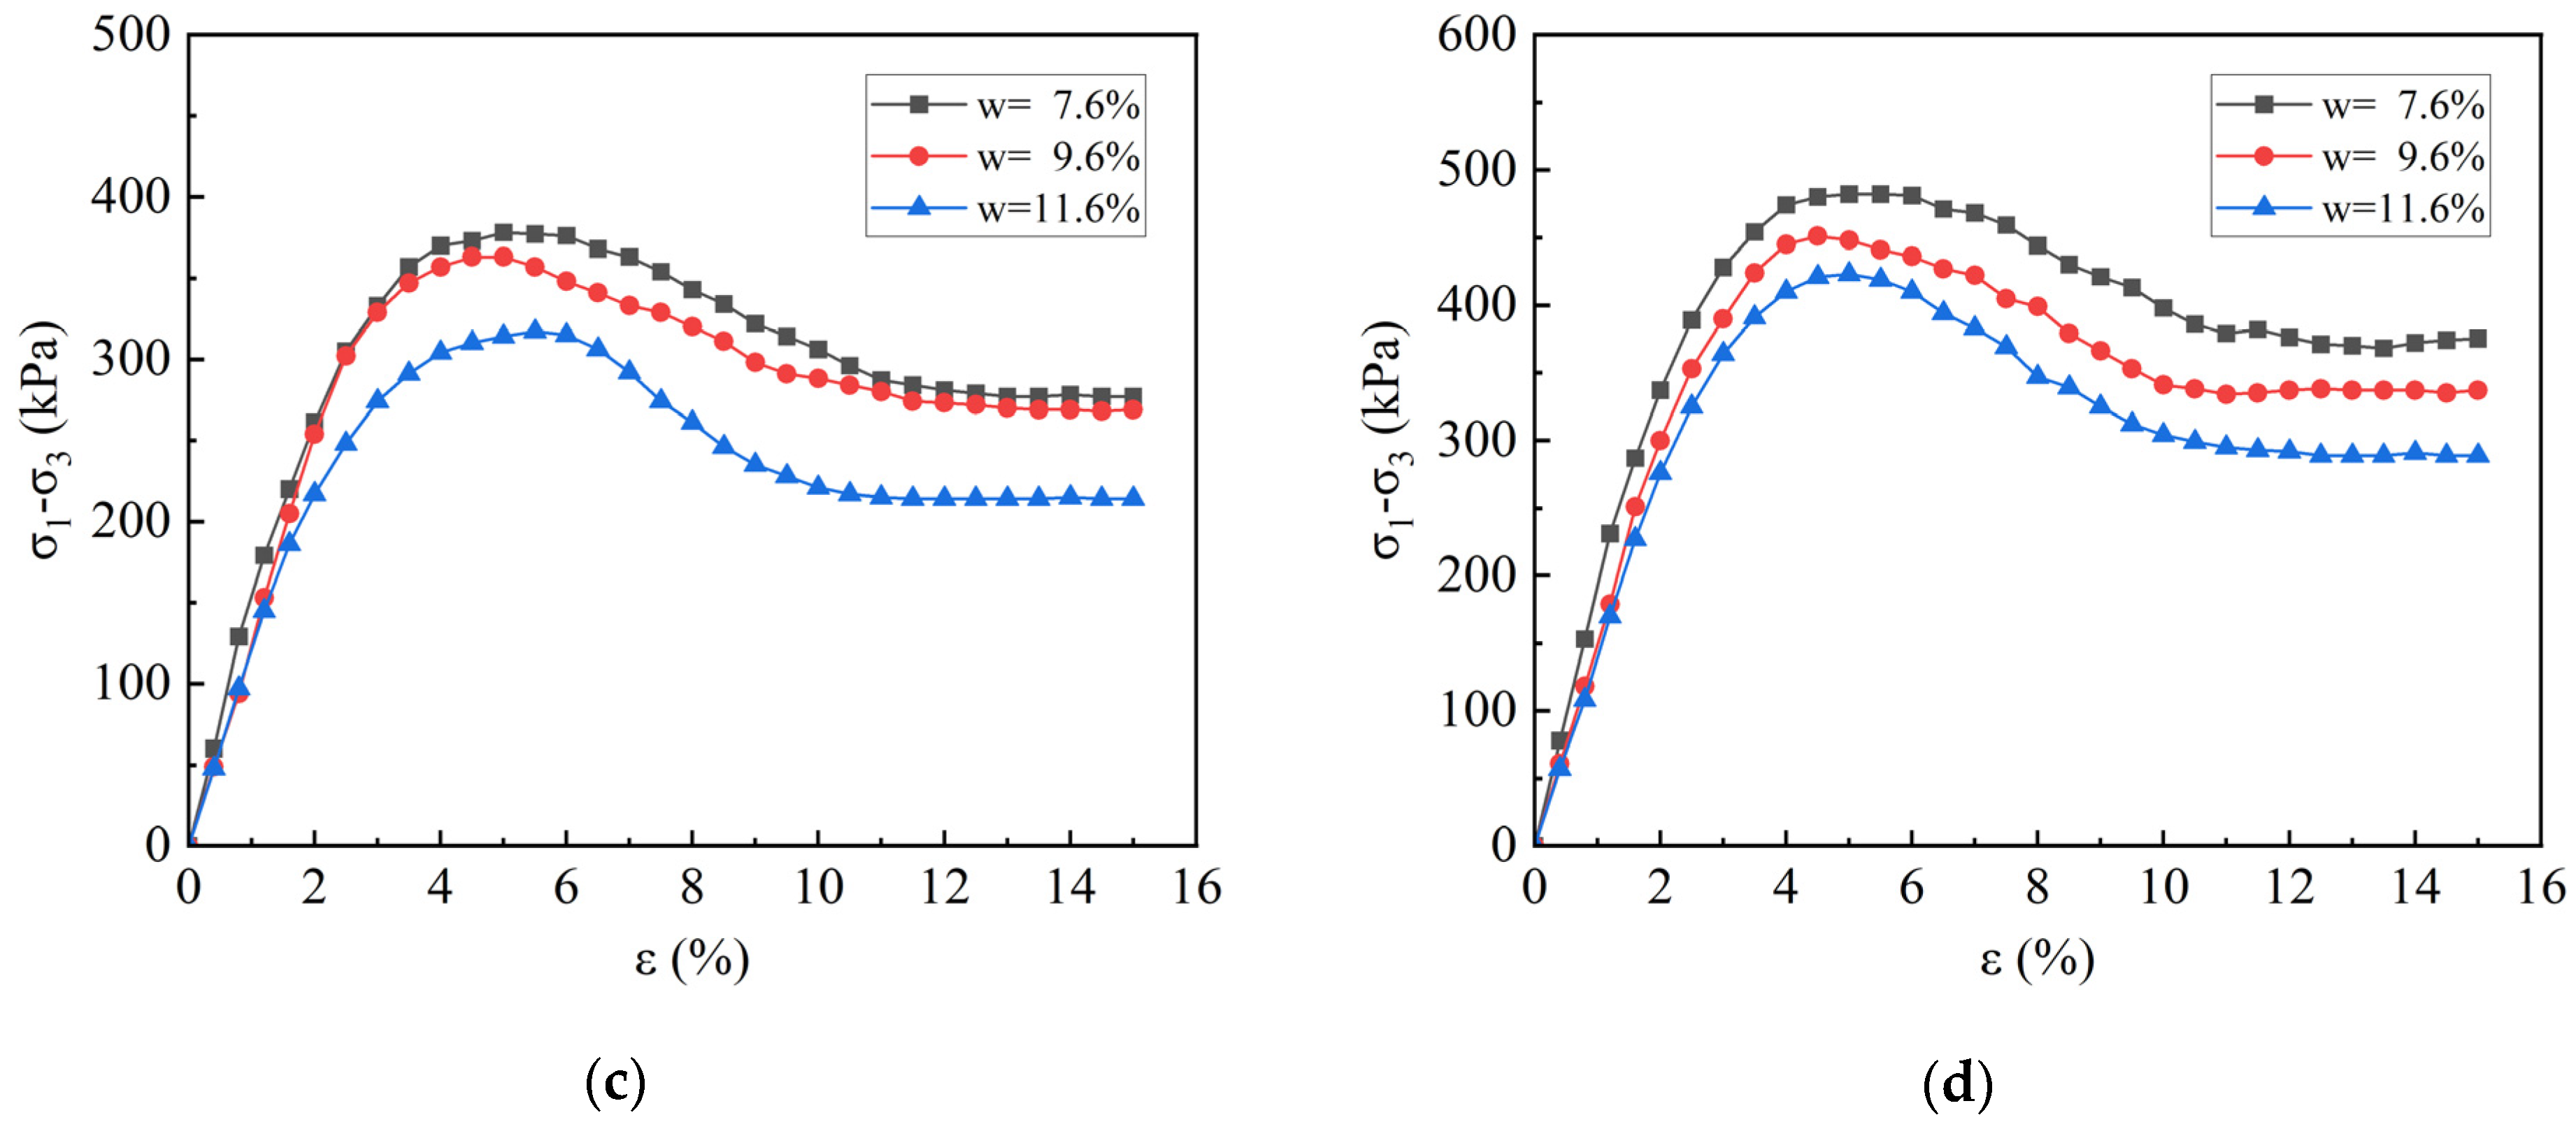
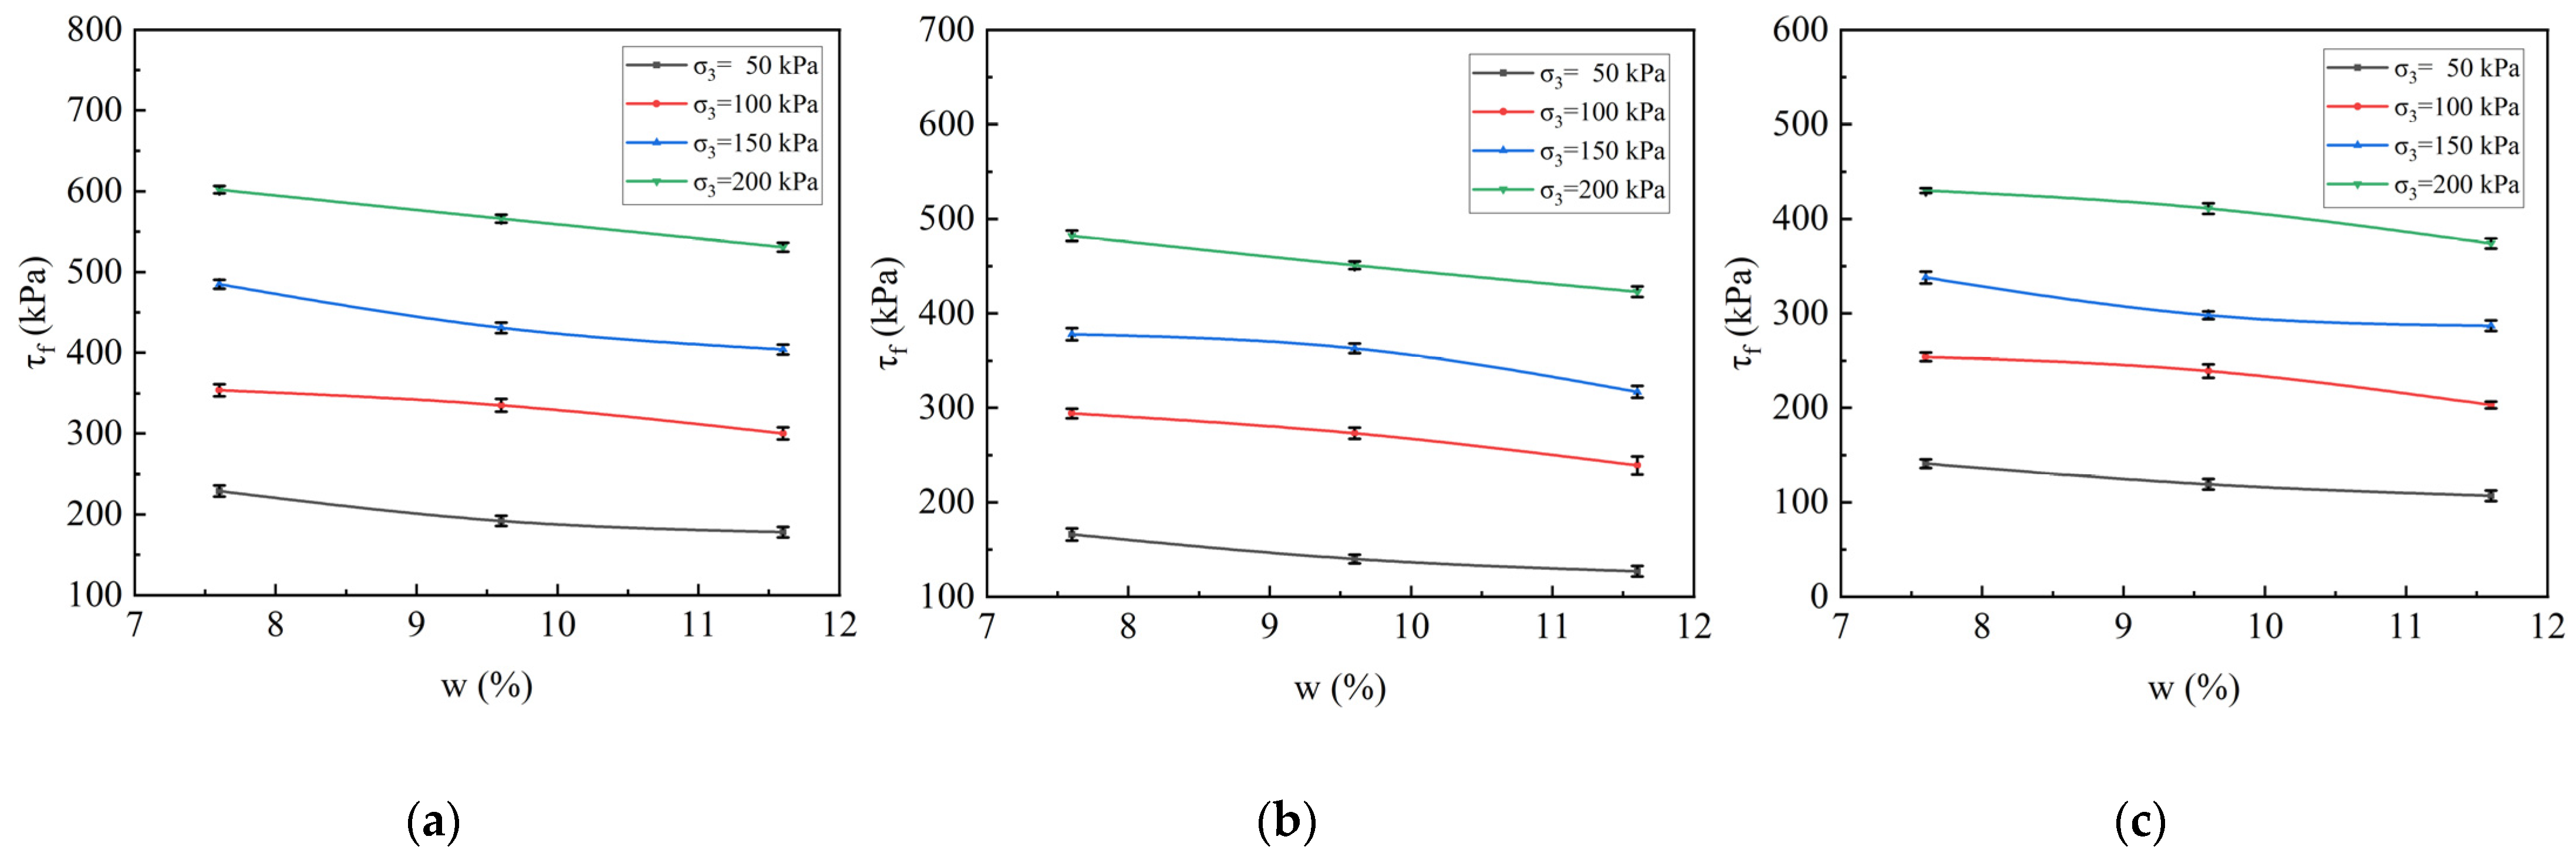
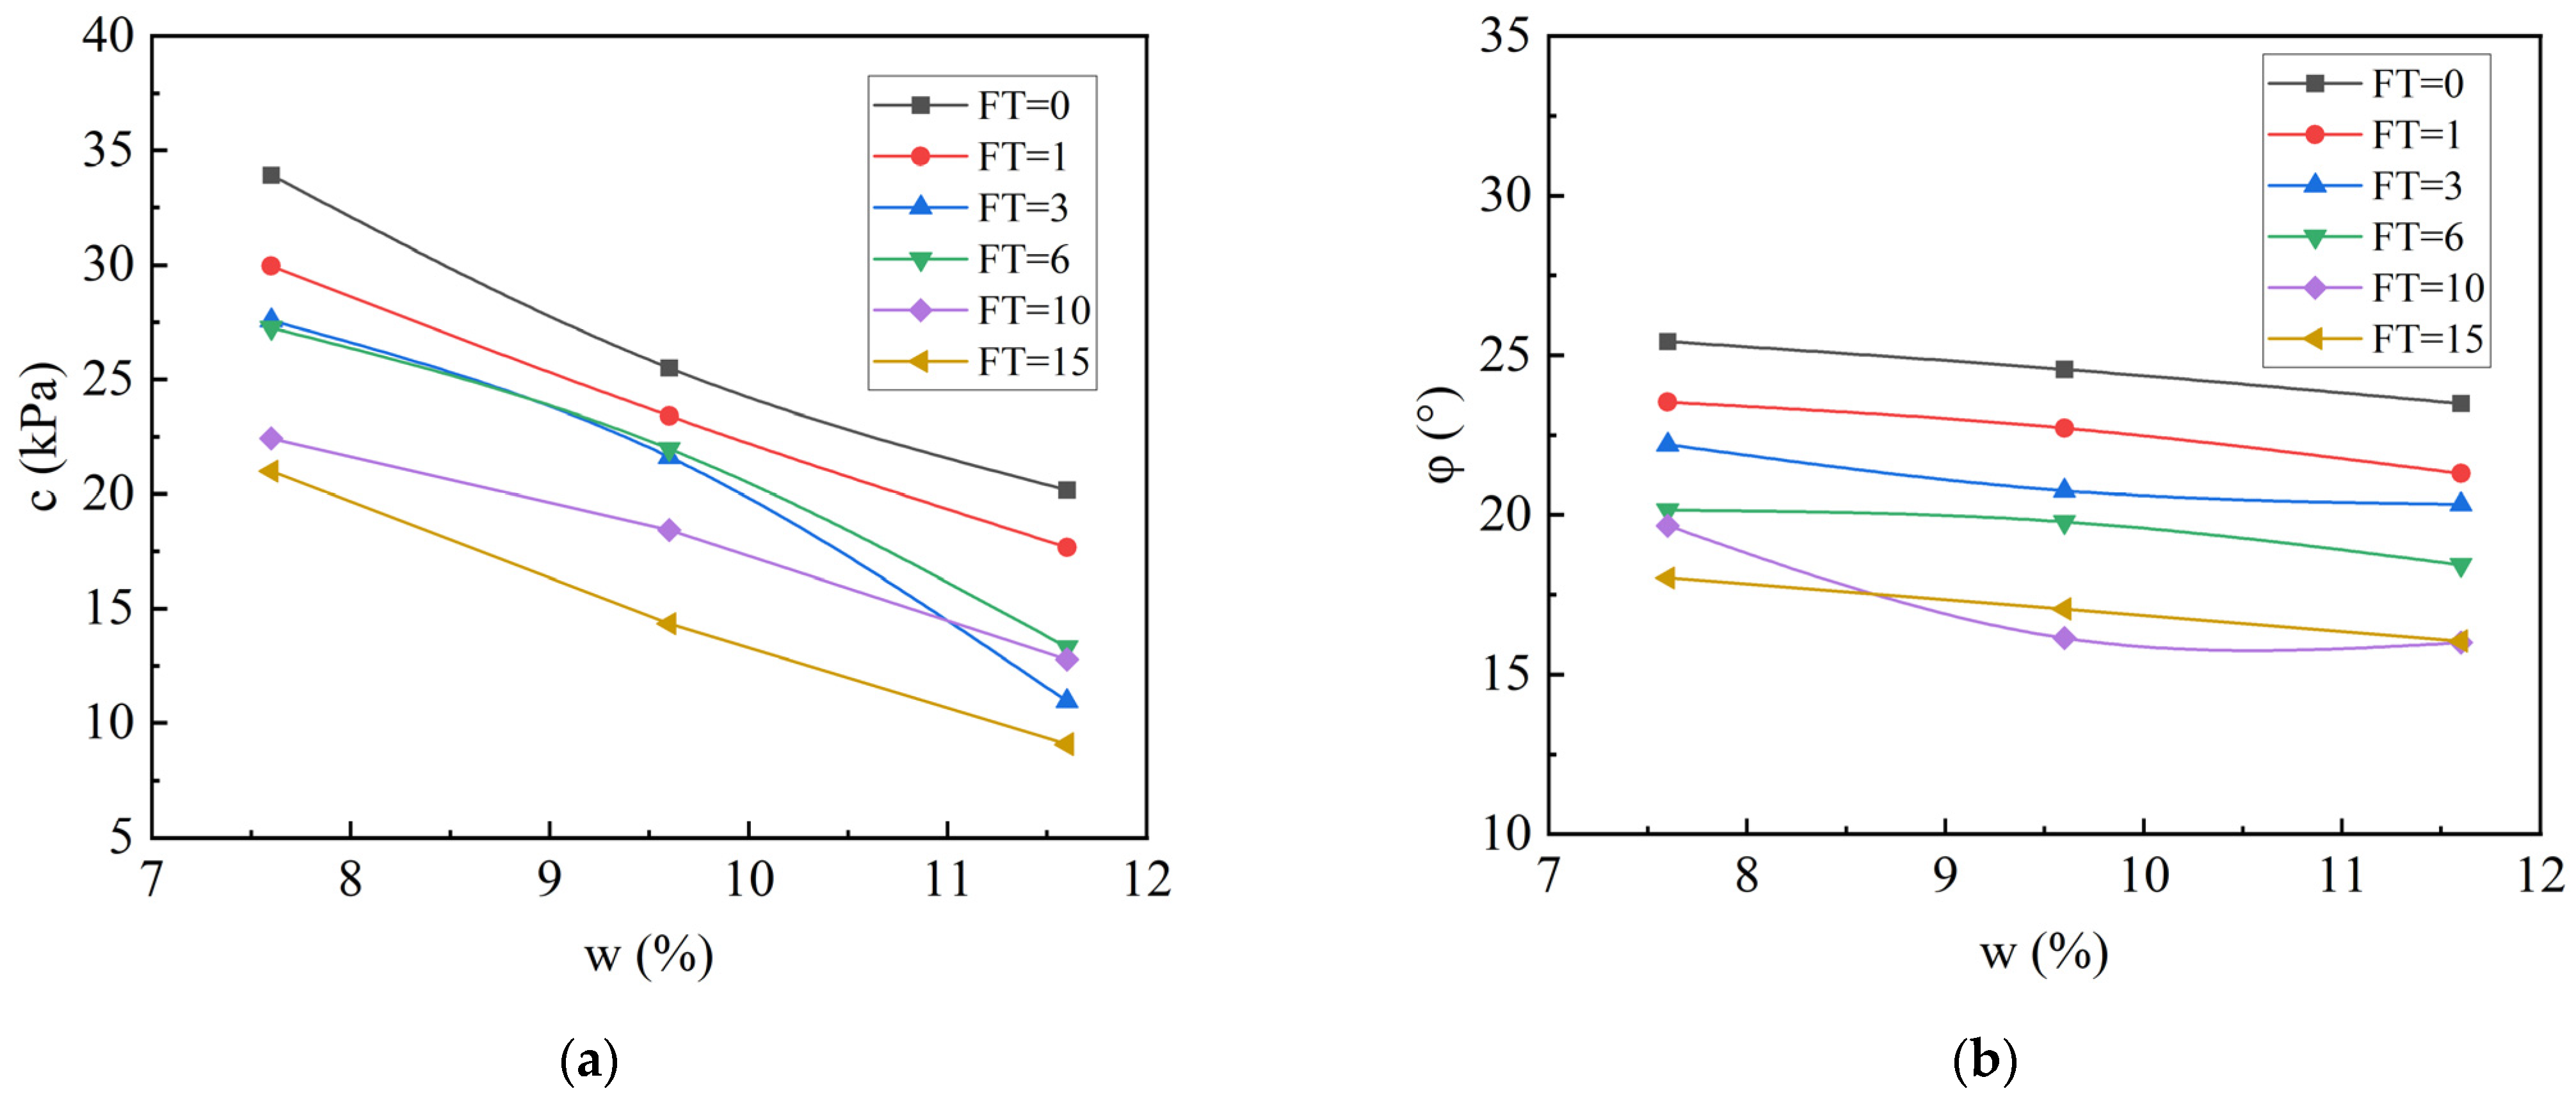
3.2. The Effect of Water Content and Confining Pressure on the Mechanical Properties of Samples

The stress–strain curves of coarse-grained soil from the southeastern Xizang region under different confining pressures (σ3) and water contents (w) after different FT cycles were plotted based on the results of triaxial shear tests (UU), as shown in Figure 9, Figure 10 and Figure 11.
Figure 9 presents the shear behavior of coarse-grained soil samples from the southeastern Xizang region under different confining pressures (σ3) and water contents (w) of 7.6%, 9.6%, and 11.6%, without undergoing FT cycles. The degree of strain softening increases with water content and decreases with confining pressure. Under the same testing conditions, as the water content increases from 7.6% to 11.6%, the average strain softening degree progressively increases, reaching 8.03% (w = 7.6%), 10.80% (w = 9.6%), and 15.95% (w = 11.6%). Conversely, as the confining pressure rises from 50 kPa to 200 kPa, the average strain softening degree decreases, with values of 17.95% (σ3 = 50 kPa), 11.67% (σ3 = 100 kPa), 9.35% (σ3 = 150 kPa), and 7.39% (σ3 = 200 kPa). Figure 10 and Figure 11 illustrate the shear behavior of the same samples after undergoing six and fifteen FT cycles, respectively. The strain softening behavior follows the same trend as the samples without FT cycles, increasing with water content and decreasing with confining pressure. However, the samples subjected to FT cycles show a more significant increase in strain softening compared to those that were not. After six FT cycles, under unchanged experimental conditions, as the water content increases from 7.6% to 11.6%, the average strain softening degree becomes 25.60% (w = 7.6%), 28.86% (w = 9.6%), and 32.38% (w = 11.6%). As the confining pressure increases from 50 kPa to 200 kPa, the average strain softening degree decreases to 32.10% (σ3 = 50 kPa), 28.93% (σ3 = 100 kPa), 28.37% (σ3 = 150 kPa), and 26.38% (σ3 = 200 kPa). After 15 FT cycles, the average strain softening degree increases to 27.90% (w = 7.6%), 32.00% (w = 9.6%), and 33.74% (w = 11.6%) as the water content increases. The corresponding values for the confining pressures of 50 kPa, 100 kPa, 150 kPa, and 200 kPa are 32.05%, 34.08%, 29.21%, and 29.52%, respectively. It is evident that FT cycles significantly affect the strain softening degree, with this effect stabilizing as the number of cycles increases. Samples with higher water content are more susceptible to FT damage, resulting in greater strain softening. However, when the water content reaches a certain level, this effect becomes more stable. The increase in strain softening as the water content rises from 7.6% to 11.6% is due to higher pore water pressures in higher water content samples, which makes the soil structure more vulnerable to damage, facilitating the reorientation of soil particles. Additionally, the lubricating effect of water reduces friction between the rough surfaces of soil particles, leading to a decrease in residual strength.
As the confining pressure increases from 50 kPa to 200 kPa, the strain softening degree decreases because higher confining pressures compress the internal pores and cracks of the soil, reducing the particle spacing and improving the compaction of the sample. This makes the soil more resistant to deformation and failure. Notably, the effect of confining pressure on strain softening is more pronounced than the effect of water content when no FT cycles are applied, while for samples subjected to FT cycles, the influence of water content is more significant [28].
Figure 9 shows that for the samples without FT cycles, under the same experimental conditions, as the water content increases, the slope of the initial part of the stress–strain curve and the peak deviator stress gradually decrease. The degree of peak stress reduction is 9.66% when the water content increases from 7.6% to 9.6%, and 7.55% when the water content increases from 9.6% to 11.6%. As the confining pressure increases, both the slope and peak stress increase, with peak stress rising by 65.11% (from 50 kPa to 100 kPa), 33.47% (from 100 kPa to 150 kPa), and 28.71% (from 150 kPa to 200 kPa). Figure 10 and Figure 11 show similar trends for the samples subjected to FT cycles: the slope of the elastic phase and the peak deviator stress both decrease with increasing water content and increase with rising confining pressure. After six FT cycles, under the same experimental conditions, the peak stress reduction is 15.66% (from 7.6% to 9.6% water content) and 9.29% (from 9.6% to 11.6%) [29]. As the confining pressure increases, the peak stress increases by 86.14% (from 50 kPa to 100 kPa), 31.27% (from 100 kPa to 150 kPa), and 26.38% (from 150 kPa to 200 kPa). After 15 FT cycles, the peak stress reduction is 15.60% (from 7.6% to 9.6% water content) and 10.08% (from 9.6% to 11.6% water content). The peak stress increases by 89.65% (from 50 kPa to 100 kPa), 32.61% (from 100 kPa to 150 kPa), and 31.64% (from 150 kPa to 200 kPa).
The reduction in the slope of the curve as the water content increases from 7.6% to 11.6% is primarily due to the lubricating effect of water, which reduces friction between soil particles, accelerating plastic deformation. The decrease in peak stress is mainly due to water lubricating the particles and increasing pore water pressures, which makes the particle spacing larger and facilitates particle interlocking and sliding. As the confining pressure increases from 50 kPa to 200 kPa, the increase in the slope and peak stress is attributed to the compression of soil particles, closing or compacting pores and micro-cracks, and improving the soil’s resistance to shear failure [30]. Moreover, the effect of confining pressure on peak stress is more pronounced than the effect of water content, especially at lower confining pressures (σ3 = 50 kPa) and near the optimal water content (w = 7.6%).
The peak values of the stress–strain curves of the samples were taken as the shear strength of the soil. The relationship between shear strength, water content, and confining pressure was plotted, as shown in Figure 12 (only the curves after six and fifteen FT cycles are presented due to the large volume of experimental data). Under the same experimental conditions, for the samples that did not undergo FT cycles, as the water content increased from 9.6% to 11.6%, the shear strength decreased by 22.27% (σ3 = 50 kPa), 15.25% (σ3 = 100 kPa), 16.70% (σ3 = 150 kPa), and 11.79% (σ3 = 200 kPa), with an average decrease of 16.51%. When the number of FT cycles was six, the shear strength reduction as the water content increased from 9.6% to 11.6% was 23.49% (σ3 = 50 kPa), 18.71% (σ3 = 100 kPa), 16.14% (σ3 = 150 kPa), and 12.24% (σ3 = 200 kPa), with an average reduction of 17.64%. After 15 FT cycles, the shear strength decreased by 24.11% (σ3 = 50 kPa), 20.08% (σ3 = 100 kPa), 15.09% (σ3 = 150 kPa), and 13.02% (σ3 = 200 kPa), with an average reduction of 18.08%. It is evident that, whether or not the samples underwent FT cycles, the shear strength consistently decreased with increasing water content, and the rate of reduction increased with more FT cycles [31]. This is due to the fact that, as the water content increases, water hinders inter-particle interlocking and friction, making it easier for soil particles to dislocate, slide, and override, leading to failure. Additionally, the increase in pore water pressure during shear exacerbates the disturbance and damage to the sample’s internal structure, making failure more likely. After FT cycles, the detrimental effects of water on the soil are further emphasized.
Under the same experimental conditions, for the samples that did not undergo FT cycles, as the confining pressure decreased from 200kPa to 50kPa, the shear strength decreased by 61.96% (w = 7.6%), 66.08% (w = 9.6%), and 66.48% (w = 11.6%), with an average reduction of 64.84%. When the number of FT cycles was six, the shear strength decreased by 65.56% (w = 7.6%), 68.96% (w = 9.6%), and 69.98% (w = 11.6%), with an average reduction of 68.16%. After 15 FT cycles, the shear strength decreased by 67.21% (w = 7.6%), 71.05% (w = 9.6%), and 71.39% (w = 11.6%), with an average reduction of 69.88%. It is clear that regardless of whether the sample underwent FT cycles, shear strength increased with increasing confining pressure, and the extent of this increase grew with the number of FT cycles. This is because, as the confining pressure increases, the sample is compressed, reducing pores and cracks and resulting in the tighter interlocking of soil particles, which strengthens the sample’s structure and makes failure less likely. Furthermore, the confining pressure enhances the stress state of the soil particles [32], increasing their resistance to sliding and overturning, thereby improving the soil’s resistance to deformation and failure.
Based on the results of triaxial tests under different water contents and confining pressures, the Mohr stress circles and failure envelope for coarse-grained soil samples from the southeastern Xizangan Plateau were plotted. The shear strength parameters, cohesion (c), and internal friction angle (φ) were calculated using the Mohr–Coulomb failure criterion and are presented in Figure 13.
As shown in Figure 13, the cohesion and internal friction angle of the coarse-grained soil samples from the southeastern Xizangan Plateau decrease to varying degrees as the water content increases from 7.6% to 11.6%. The reduction in cohesion is more pronounced compared to the internal friction angle. At a water content of 7.6%, the cohesion of the soil ranges from 20.99 kPa (FT = 15) to 33.92 kPa (FT = 0), with an average of 24.25 kPa. At a water content of 9.6%, the cohesion ranges from 14.34 kPa (FT = 15) to 25.50 kPa (FT = 0), with an average of 19.27 kPa. At a water content of 11.6%, the cohesion ranges from 9.08 kPa (FT = 15) to 20.17 kPa (FT = 0), with an average of 13.65 kPa. The reduction in cohesion from a water content of 7.6% to 11.6% is between 40.54% and 60.28%, indicating a significant deterioration in cohesion after FT cycles.
For the internal friction angle, at a water content of 7.6%, it ranges from 18.02° (FT = 15) to 25.43° (FT = 0), with an average of 19.51°. At a water content of 9.6%, the internal friction angle ranges from 16.14° (FT = 10) to 24.56° (FT = 0), with an average of 18.66°. At a water content of 11.6%, the internal friction angle ranges from 16.00° (FT = 10) to 23.49° (FT = 0), with an average of 18.17°. The reduction in the internal friction angle from a water content of 7.6% to 11.6% ranges from 7.63% to 18.62%.
The deterioration of cohesion and internal friction angles with increasing water content in the coarse-grained soil from the southeastern Xizangan Plateau can be attributed to the fact that a water content of 7.6% corresponds to the optimal water content. At this point, the soil particles are more tightly arranged, and their interlocking is stronger, resulting in fewer pores and cracks. As a result, the coarse-grained soil exhibits higher apparent cohesion and internal friction angles. However, as the water content increases, the soil particles become more loosely arranged, with weaker interlocking and a reduced overall structure. This leads to an increase in pores and cracks, significantly reducing the apparent cohesion and internal friction angle. Additionally, the increased water content causes the finer particles, which are present in small amounts, to become muddied and lose their cohesive properties, further decreasing cohesion. The muddy fine particles, along with water, act as lubricants during the deformation and failure process, reducing the friction between soil particles, which further decreases the internal friction angle.

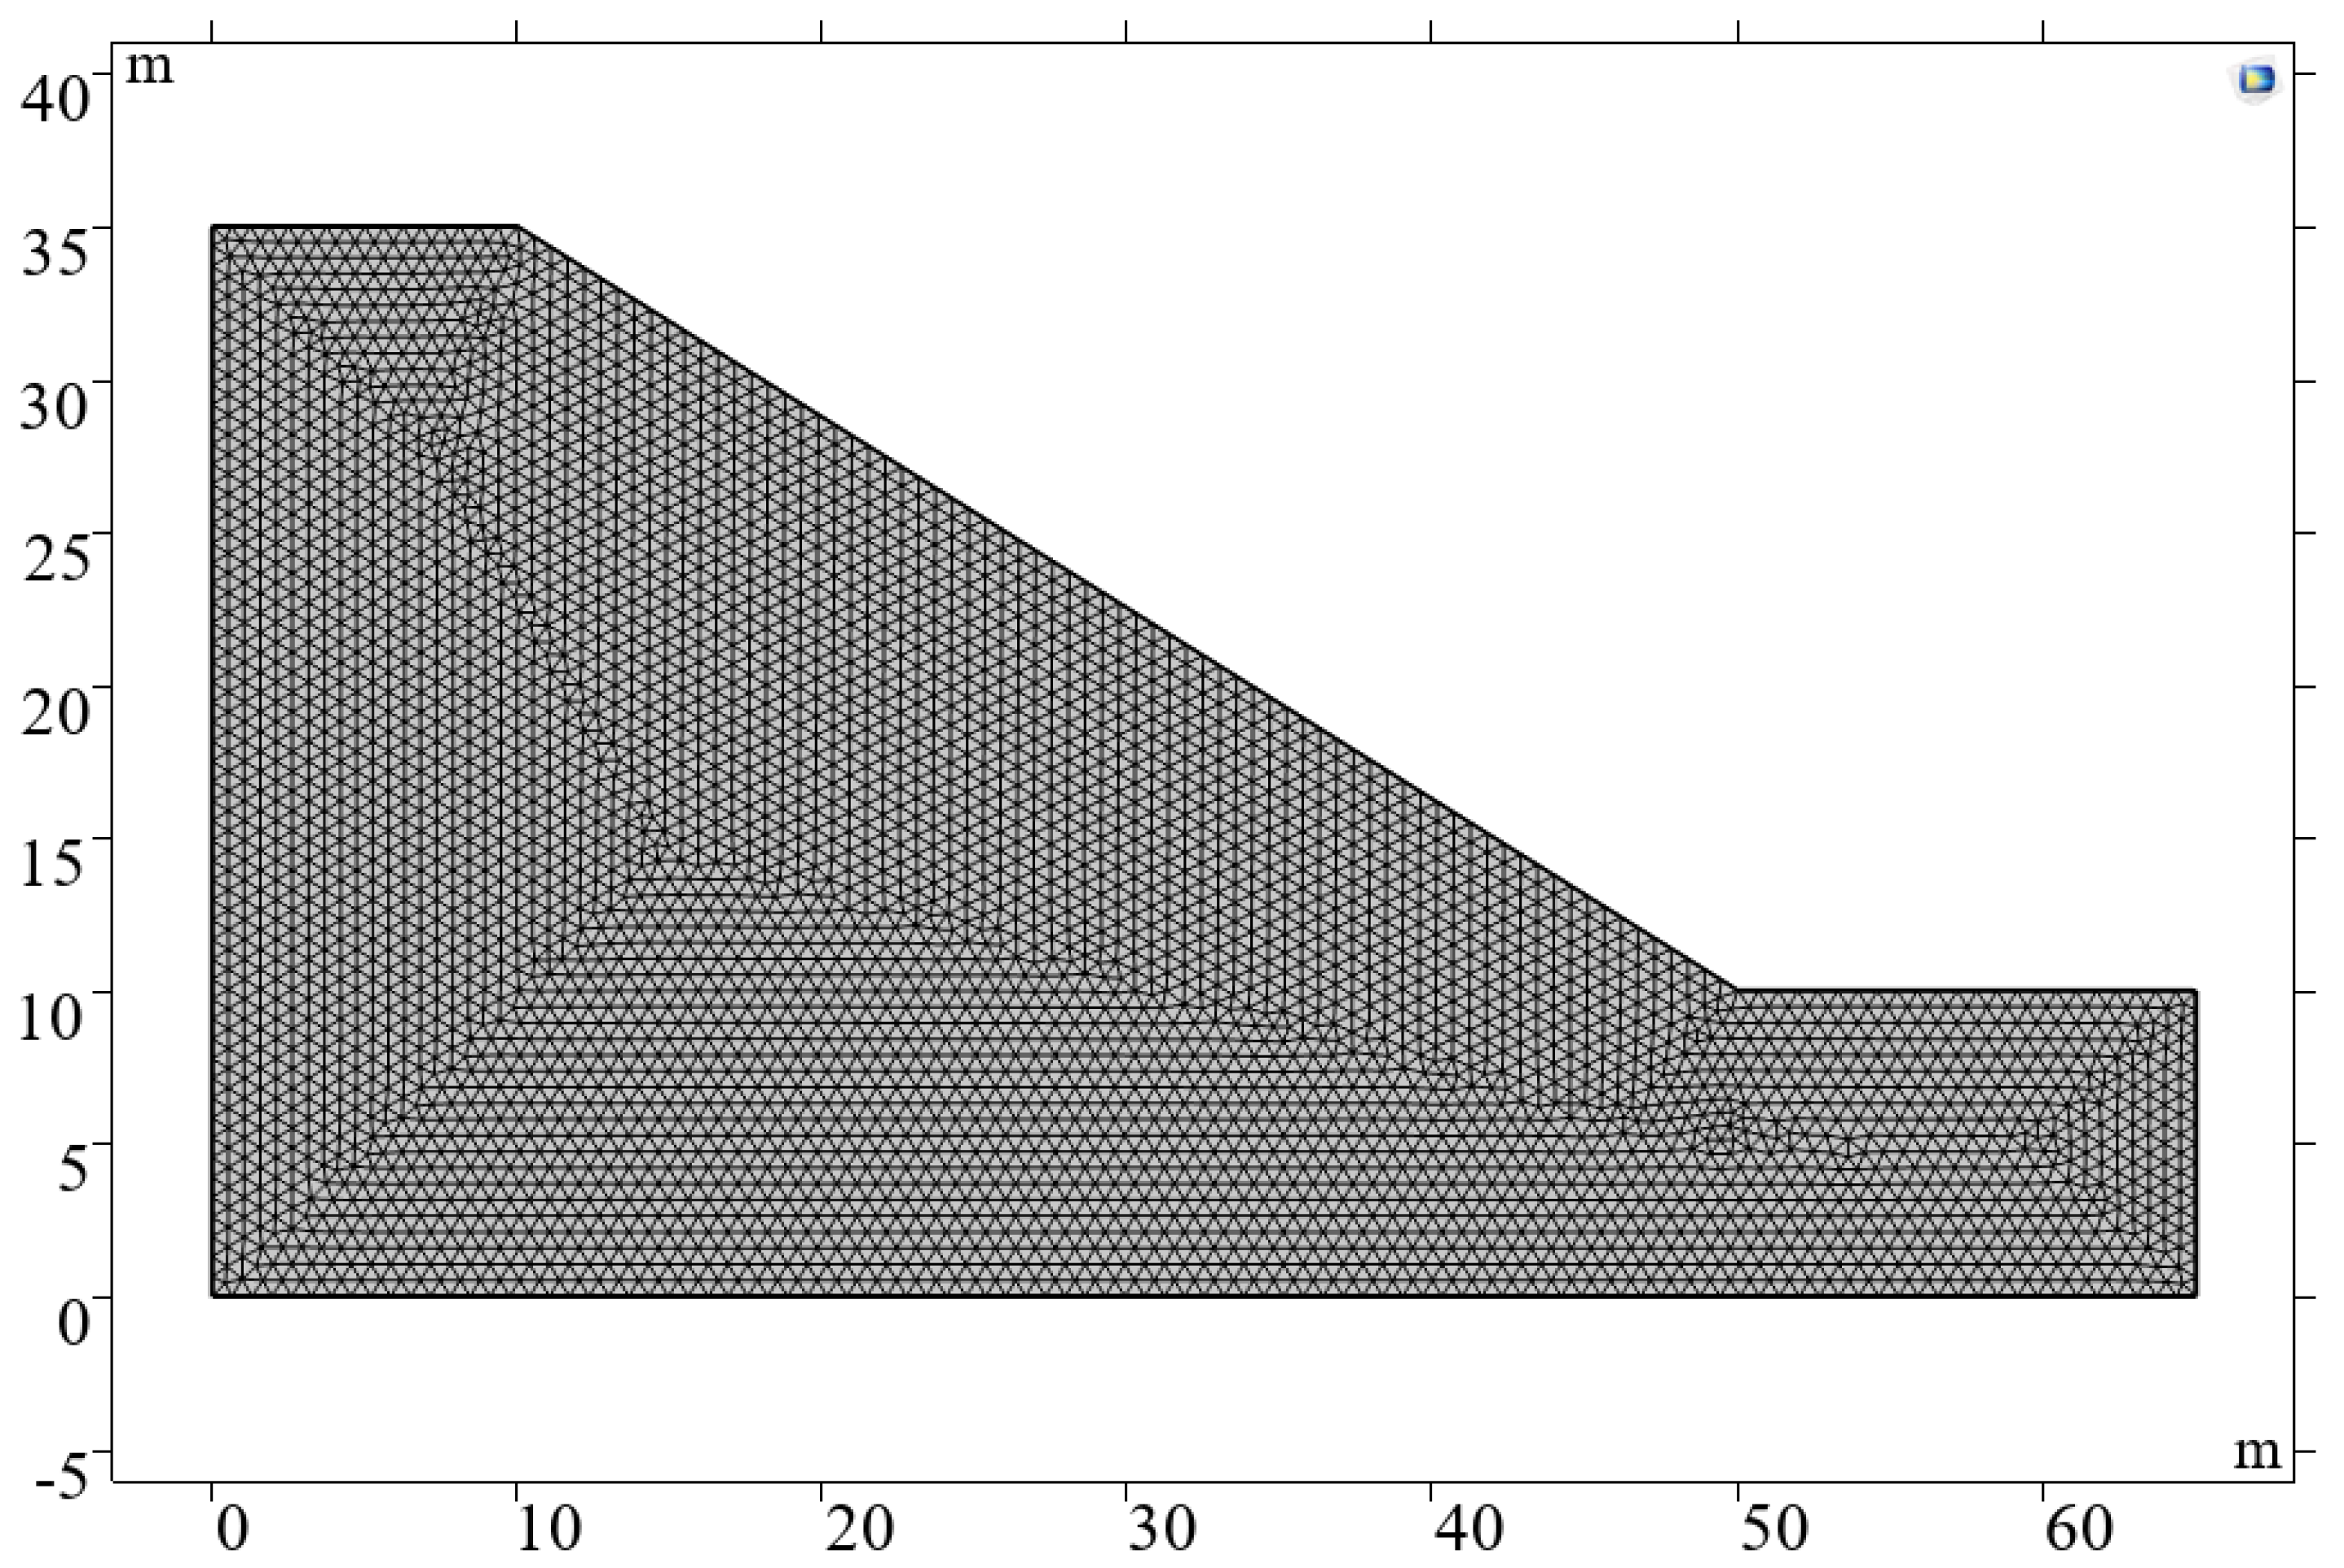
4. Numerical Analysis of the Slope Stability of Coarse-Grained Soil Based on COMSOL Multiphysics

In this study, numerical calculations are performed using COMSOL Multiphysics (V6.3), a multiphysics coupling analysis software developed by COMSOL, Sweden, based on the finite element method. This software solves the partial differential equations corresponding to multiple physical fields to achieve coupling calculations between them. It can accurately perform heat transfer and slope stability calculations on the slope soil.
There are numerous formulas involved in this paper, and only the main equations are listed here. The governing equations for heat transfer calculations are shown in Equations (1) and (2) [33].
d z ρ C p 𝜕 T 𝜕 t + d z ρ C p u T + q = d z Q + q 0 + d z Q t e d
q = d z k T
In these equations, dz represents the thickness of the physical model, set to 1m in this study; ρ is the density, in kg/m3; Cp is the specific heat at constant pressure, in J/(kg·K); T is the temperature, in K; t is time, in hours; u is the velocity vector, in m/s; q is the conductive heat flux vector, in W/m2; Q is the heat absorbed by the system, in J; q is the heat source term coefficient, in W/m2; Qted is the thermal elastic damping, in J; and k is the thermal conductivity, in W/(m·K) [33].
ρ a f = S + F v
In this equation, ρ is the density, in kg/m3; af is the multiphysics acceleration, in m/s2; S is the second Piola–Kirchhoff stress tensor, in Pa; and Fv is the body force density, in N/m3.
Using COMSOL Multiphysics software for modeling, the slope model adopts a two-dimensional model of a coarse-grained soil slope with a slope height of 35 m. The physical properties of the coarse-grained soil layer are shown in Table 2.
Considering the computational accuracy and time step, the model is automatically meshed into highly refined free triangular elements by COMSOL. The total number of mesh elements in the entire model is 8386, with different element masses. The minimum element mass is 0.6595, and the average element mass is 0.9538. The meshed coarse-grained soil slope model established is shown in Figure 14.

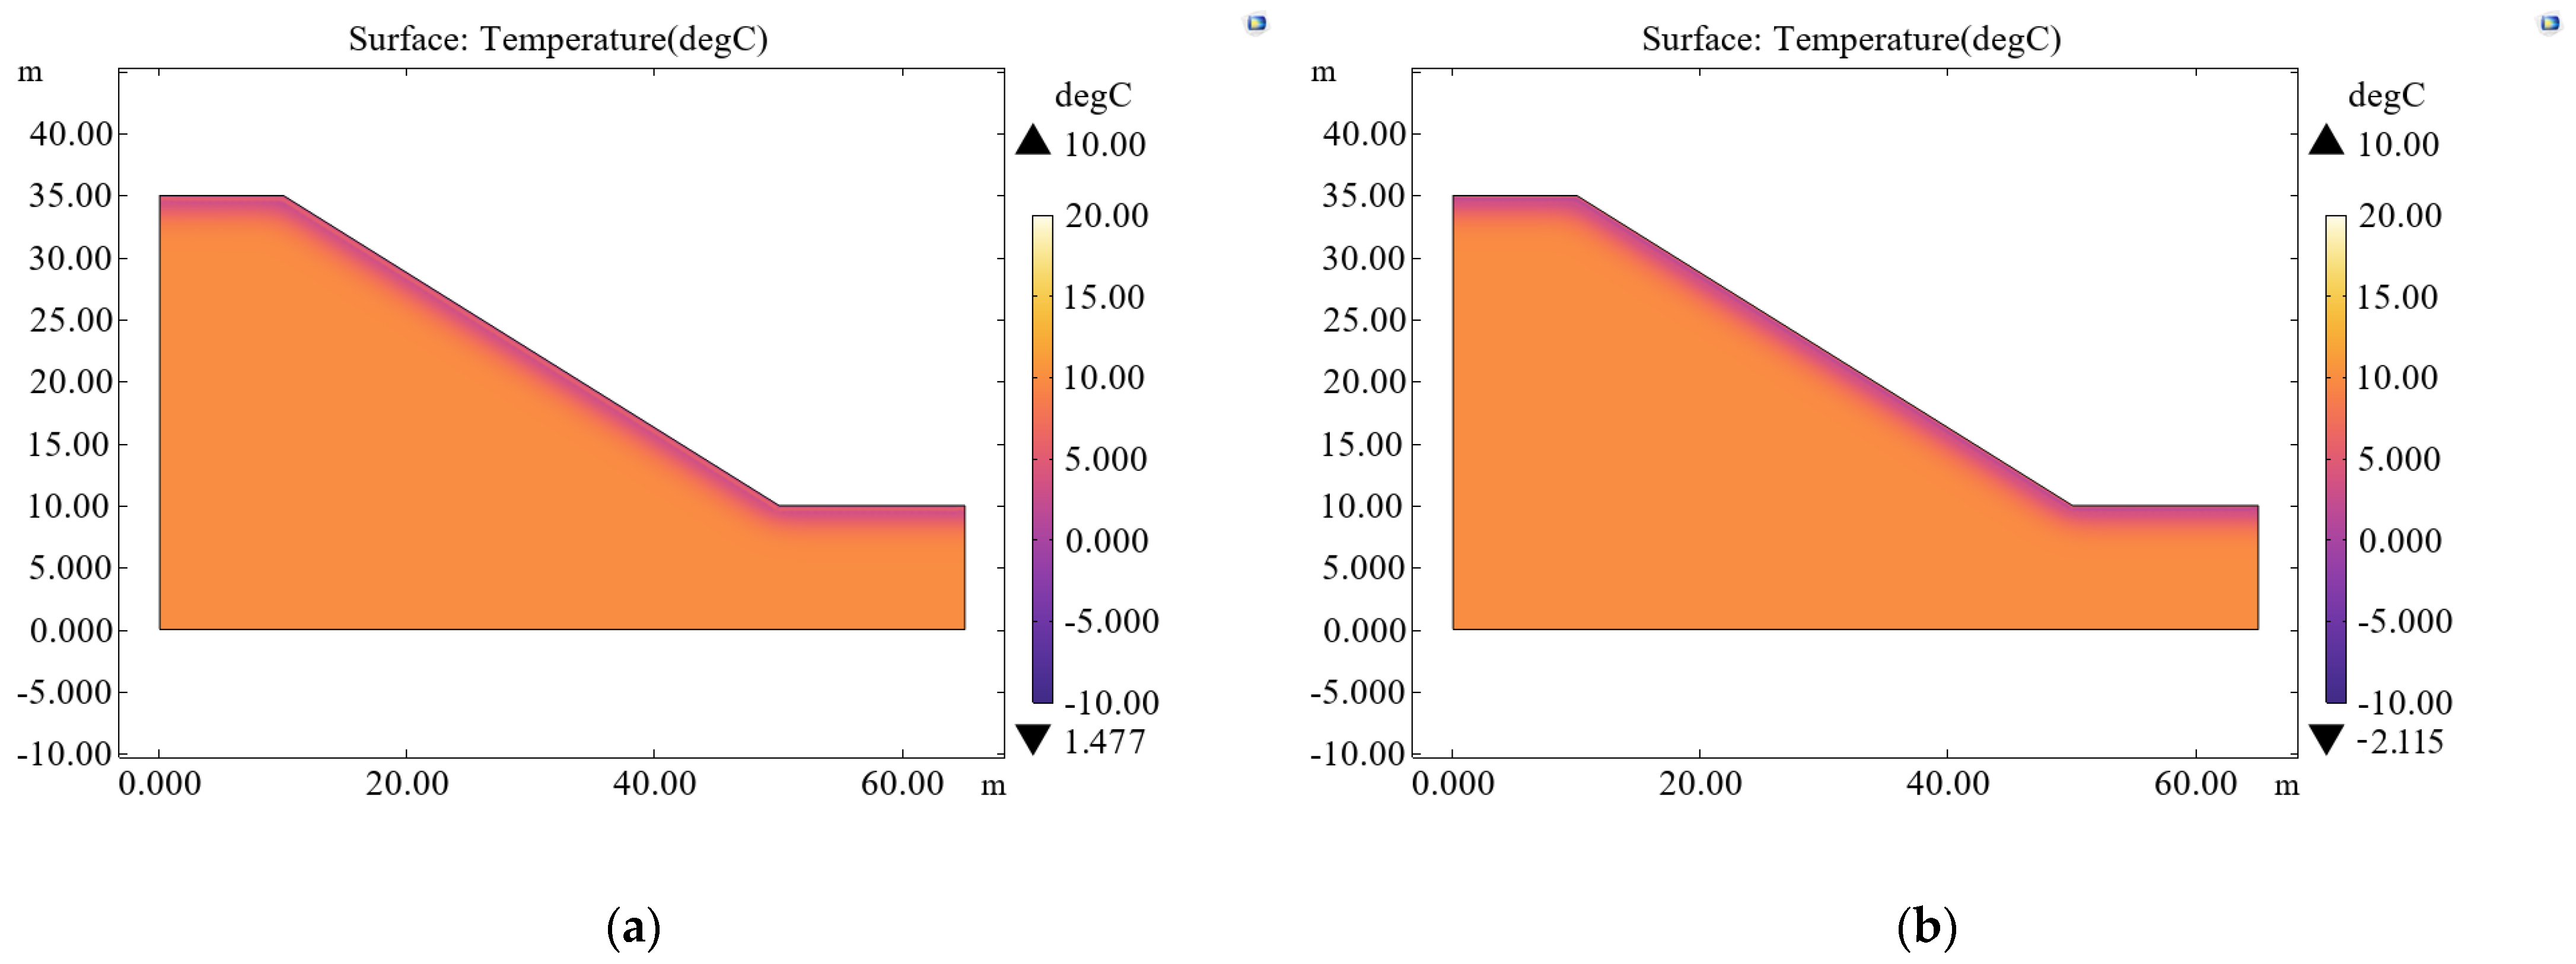
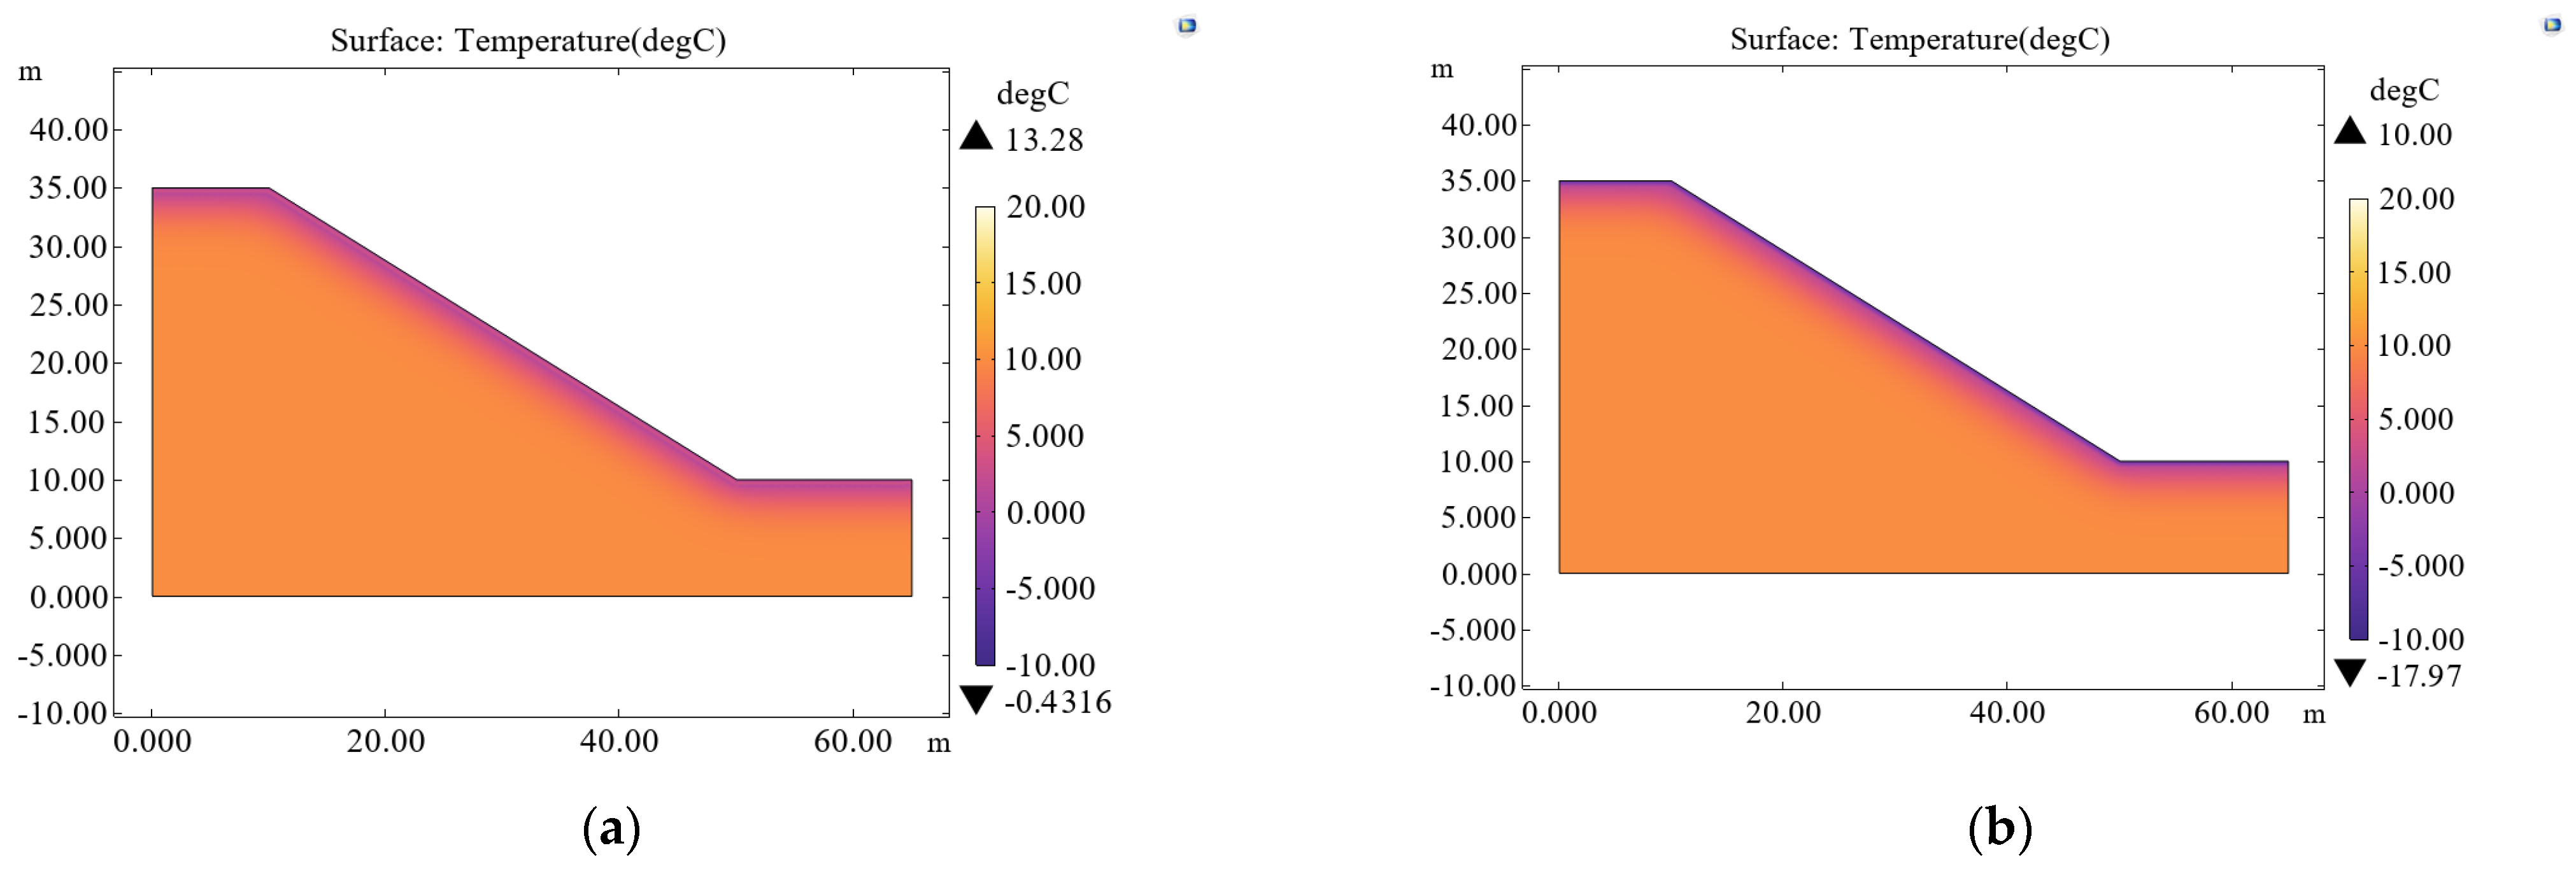
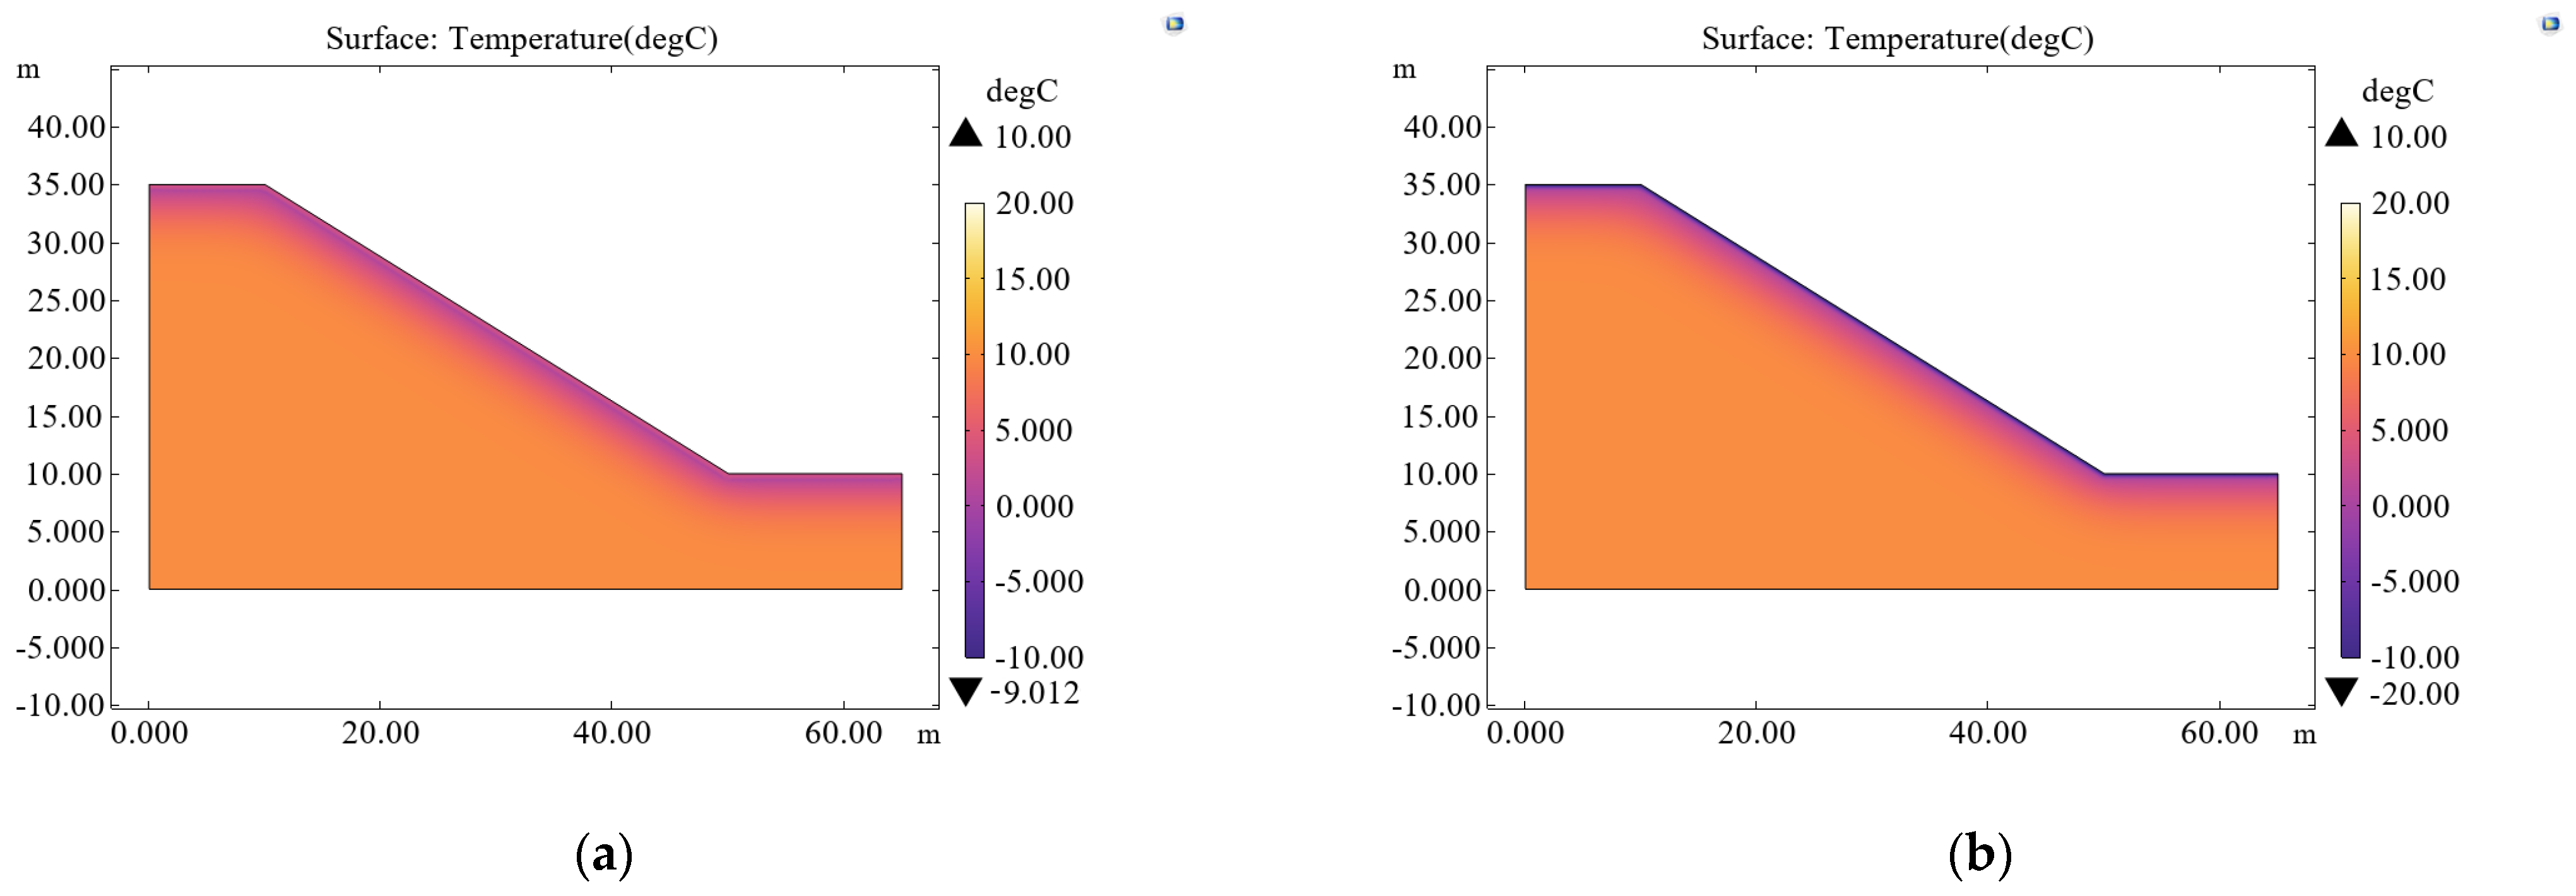
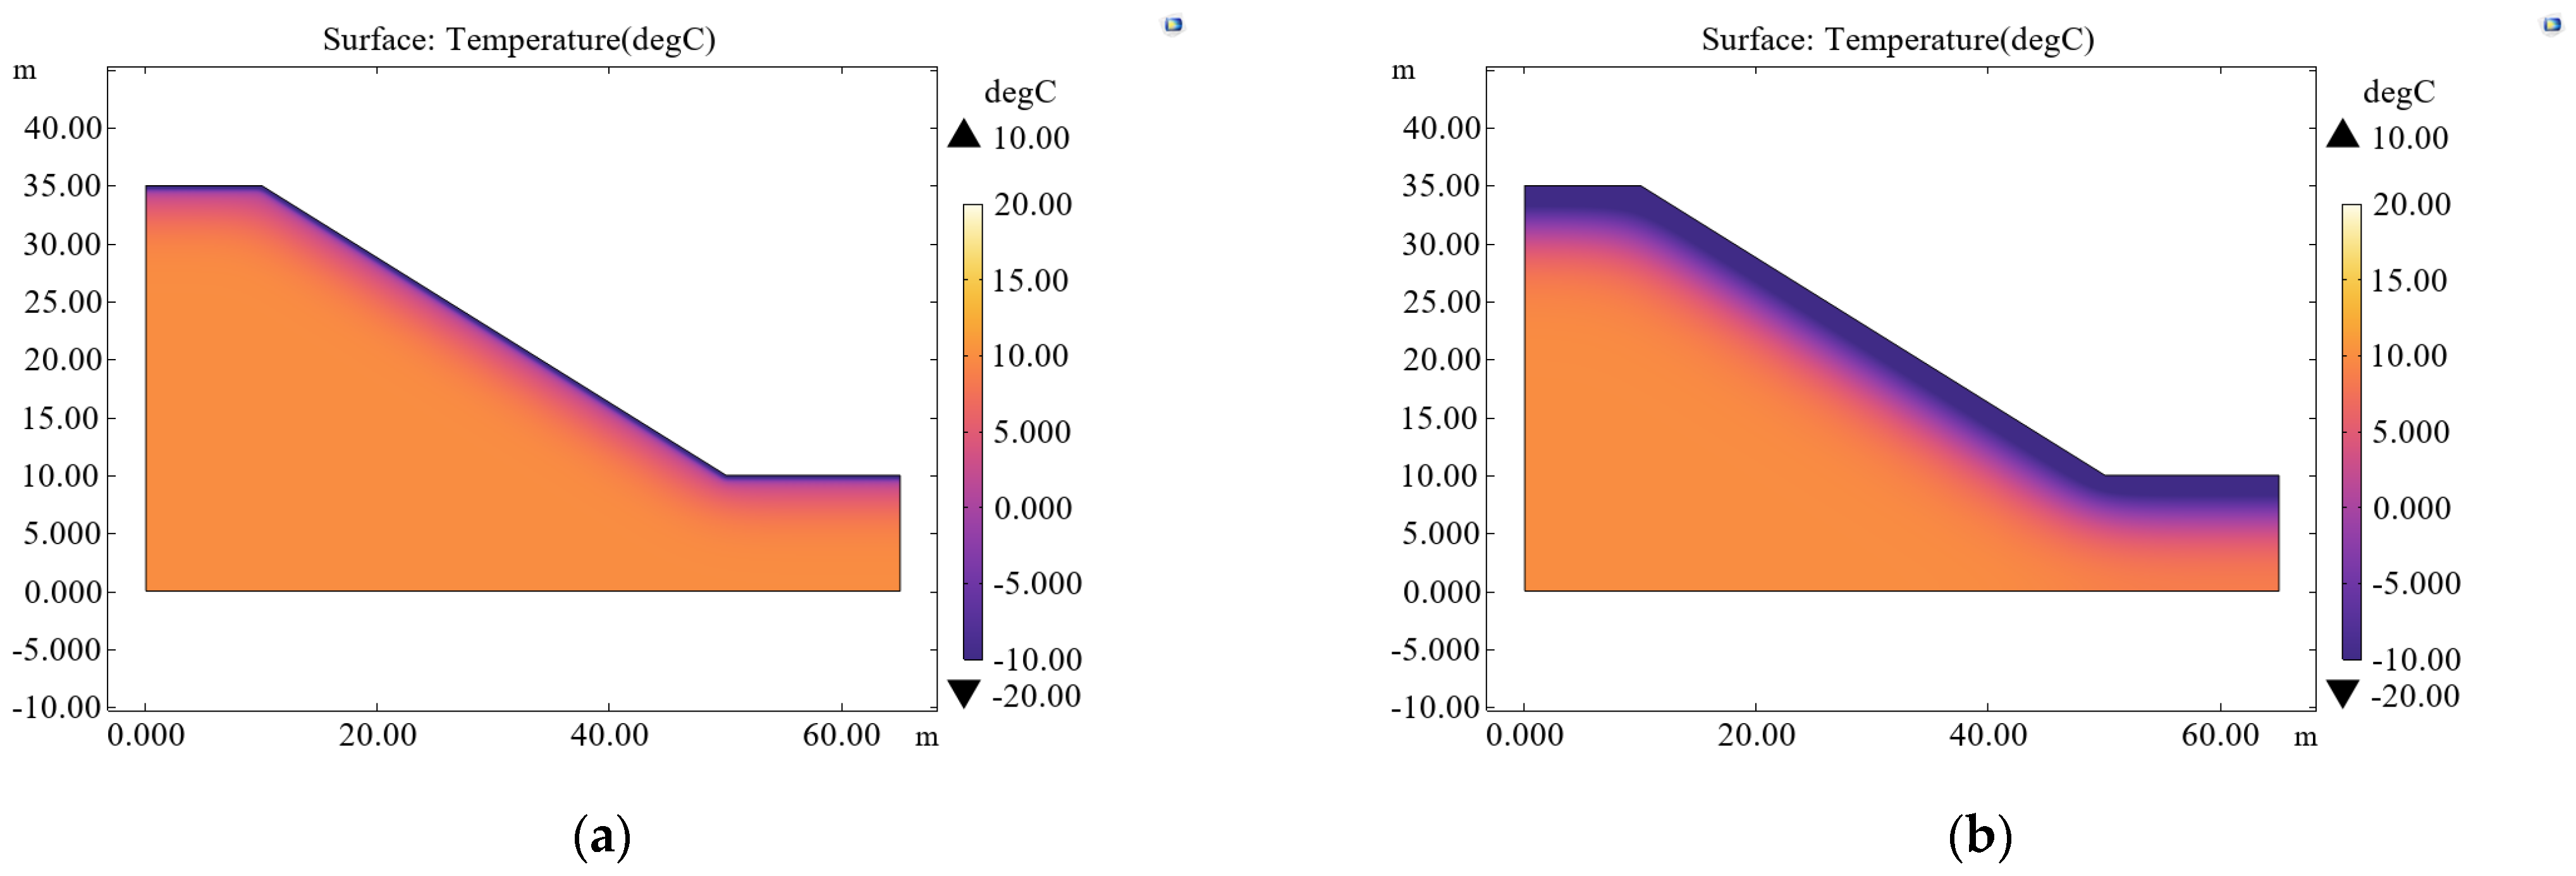
4.1. The Temperature Variation of the Slope’s Soil Under the Action of FT Cycles

The temperature variation of the surface soil under FT cycles and the affected depth are of significant importance for the study of coarse-grained soil slopes. A variable temperature with 24 h FT cycles is applied to the surface of the slope model with an initial temperature of 10 °C. The temperature extremes are the same as the previous experimental conditions. The temperature distribution contour maps of the slope under different FT cycle counts are shown in Figure 15, Figure 16, Figure 17 and Figure 18.
According to Figure 15, after 15 FT cycles, the minimum temperature of the slope soil reaches 1.48 °C under high environmental temperature conditions and −2.16 °C under low environmental temperature conditions. At this point, the depth of the soil affected by temperature changes does not exceed 1 m, and the affected layers of soil are completely thawed, with the water in the soil transforming into liquid form.
According to Figure 16, after 35 FT cycles, the minimum temperature of the slope soil is −0.95 °C under high environmental temperature conditions and −17.97 °C under low environmental temperature conditions. At this point, the depth of the soil affected by temperature changes is approximately 1 to 2 m. Additionally, certain areas of the affected soil layers cannot fully thaw, and some water within the soil cannot transform into liquid form. However, most areas can still undergo normal FT cycles.
According to Figure 17, after 54 FT cycles, the minimum temperature of the slope soil is −9.01 °C under high environmental temperature conditions and −20.00 °C under low environmental temperature conditions. At this point, the depth of the soil affected by temperature changes is approximately 2 to 3 m. Moreover, most areas of the affected soil layers cannot fully thaw, and some water within the soil cannot transform into liquid form. However, some regions can still undergo normal FT cycles.
As shown in Figure 18, under the aforementioned FT cycle conditions, when the number of FT cycles reaches 55, the minimum temperature of the slope soil under high environmental temperature conditions remains at −20.00 °C. This indicates that at this point, the upper layer of the slope soil is no longer significantly affected by the increase in external environmental temperature. The soil layers affected by temperature changes have likely reached a state where they can no longer thaw, and much of the moisture in the soil has turned into ice. As the number of FT cycles increases, the impact of environmental temperature changes on the upper layer of the slope becomes more pronounced, with the affected soil depth increasing. When the number of FT cycles reaches 150, the depth of the temperature-affected zone in the slope soil can reach 4–5 m. In the model test, this depth will continue to increase with the number of FT cycles. However, considering that the number of FT cycles that actually occur in the study area within a year will not exceed 150, this issue will not be further discussed.

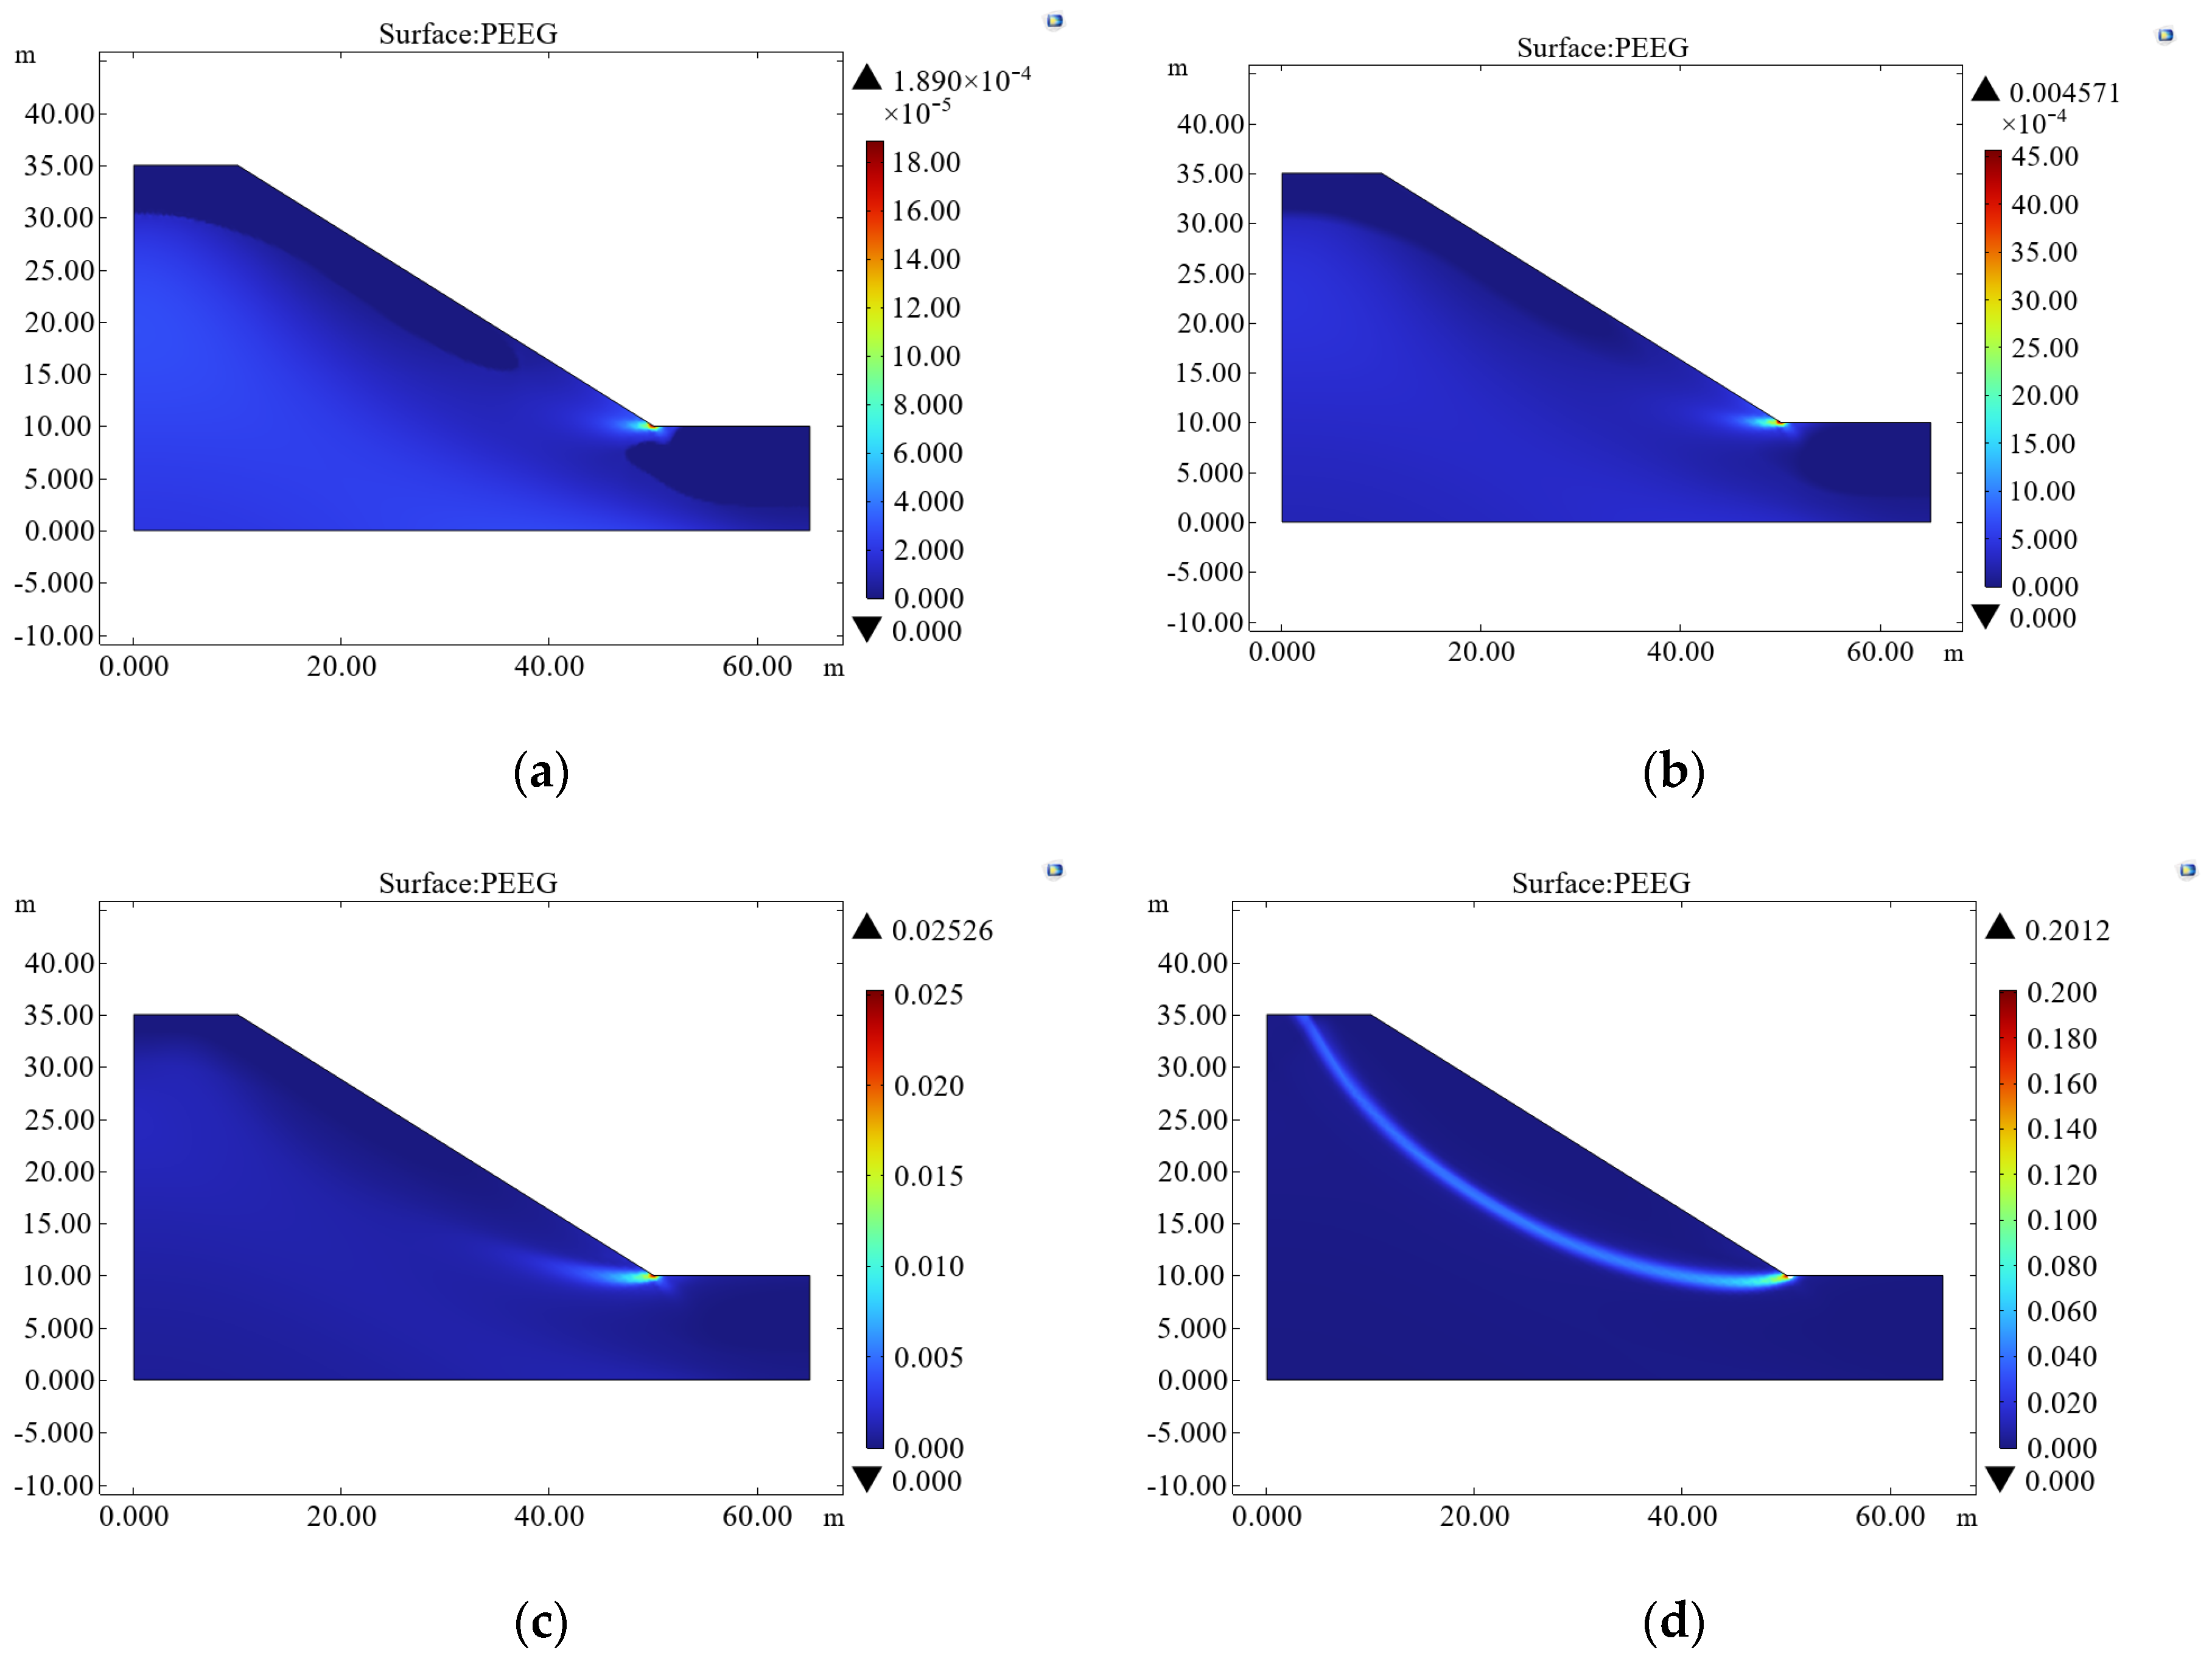
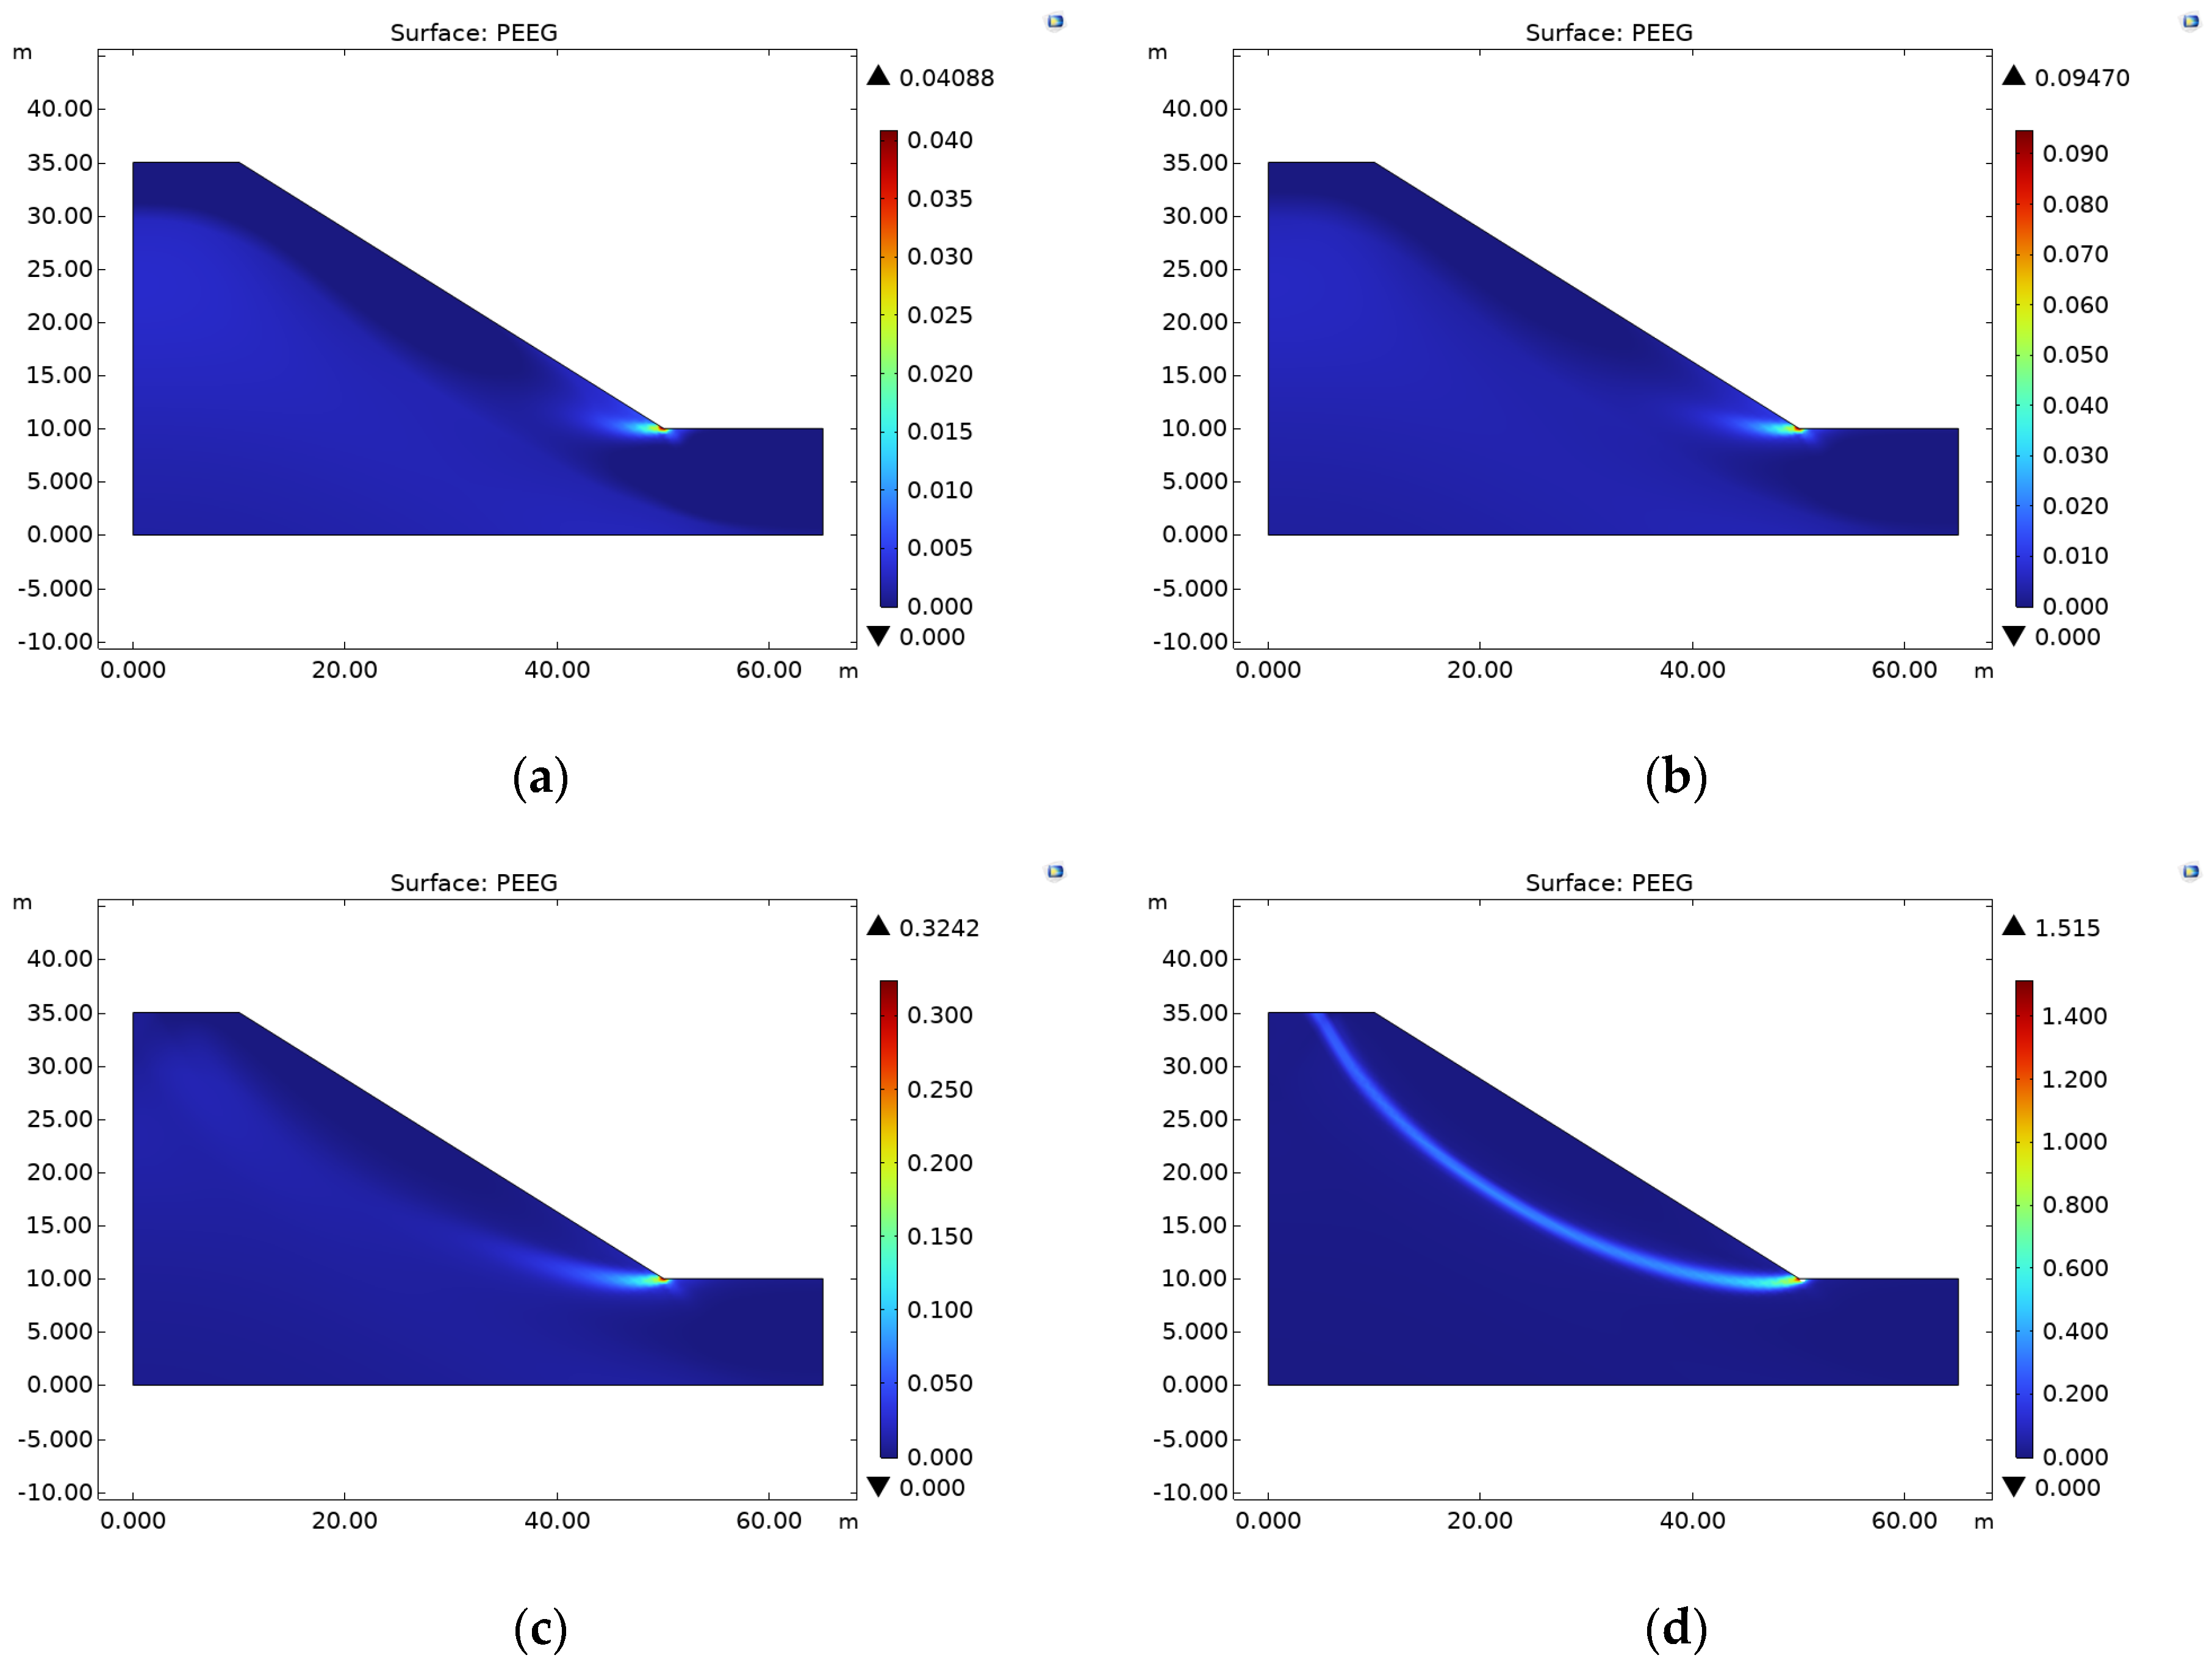
4.2. Changes in Slope Soil Stability Under FT Cycles

In order to fully simulate the changes in the decay of soil strength and the reduction in stiffness of the slope’s soil with different moisture contents under continuous FT cycles, the attenuation trends of soil cohesion and internal friction angles with increasing FT cycle counts obtained from laboratory tests were used. Using MATLAB (R2022a) software, the relationship between the cohesion (c), internal friction angle (φ), and number of FT cycles was fitted using the nonlinear least squares method. The fitting results for each moisture content level are shown in Table 3.
The fitting equations from the above table were input into the soil plasticity section of the slope model to simulate the stability changes of the slope model with increasing FT cycle counts under different moisture content conditions. The equivalent plastic strain contour maps for slopes with different coarse-grained soils are shown in Figure 19, Figure 20 and Figure 21.
Figure 19a shows the distribution of equivalent plastic strain in various parts of the slope model before undergoing any FT cycles. It can be observed that the larger equivalent plastic strain appears as point-like distributions, occurring only at the slope foot, with the maximum value concentrated at 1.89 × 10⁻⁴. This indicates that the slope foot is the potential sliding surface’s initiation point and an active area for slope shear failure. However, at this stage, the slope is still in a stable state.
From Figure 19b, after 60 FT cycles, the equivalent plastic strain is distributed in a star-like pattern, with the maximum value reaching 4.571 × 10⁻². At this point, the plastic strain zone starts to show a tendency to expand along the potential sliding surface direction at the slope foot. Due to the increase in pore water pressure and the decrease in effective stress, friction resistance between particles of coarse-grained soil locally fails, triggering small plastic zones. Subsequently, the rate of equivalent plastic strain within the shear zone gradually accelerates.
After 150 FT cycles, as shown in Figure 19c, the equivalent plastic strain zone begins to present a continuous band-like distribution (shear band), with the maximum equivalent plastic strain reaching 2.52 × 10⁻². As the number of FT cycles increases, the equivalent plastic strain contour map gradually evolves. Finally, after 176 FT cycles, the region with high continuity and high values of equivalent plastic strain appears in Figure 19c, with the maximum value reaching 0.2012. The pore structure of coarse-grained soil is reorganized due to the accumulation of plastic deformation, and the slope enters a critical state of instability.
Figure 20 and Figure 21 show a similar trend in the development of equivalent plastic strain in the slope models, as observed in Figure 19. It can be seen that as the moisture content increases, the number of FT cycles required for the slope to reach the critical state of instability significantly decreases. For instance, when the moisture content of the slope soil is 9.6%, the slope reaches the critical state of instability after 106 FT cycles, while when the moisture content increases to 11.6%, this process occurs after only 15 FT cycles. Furthermore, as the moisture content of the slope soil increases, the maximum value of the equivalent plastic strain at each stage of development also shows a gradual increase. For example, when the slope reaches the critical state of instability, the maximum equivalent plastic strain in the three slope models with increasing moisture content is 0.2012, 1.515, and 2.465, respectively.
On the one hand, the increase in moisture content reduces the shear strength of the soil, making the soil more prone to shear slip deformation. As a result, the soil needs to undergo larger plastic strains to reach the critical state of instability. On the other hand, the water in the soil fills the pores between particles, reducing the effective stress in the soil, weakening the particle skeleton support, and further decreasing the overall stiffness of the slope. This process exacerbates stress redistribution and promotes the expansion of the equivalent plastic strain zone.
Moreover, the process of increasing the moisture content is somewhat similar to the “strength reduction” in its natural state (e.g., the simultaneous reduction of cohesion and the internal friction angle), causing the safety factor of the slope’s stability to decrease. In the strength reduction method, the greater the reduction in strength parameters, the more significant the accumulation of equivalent plastic strain at the point of instability.

5. Conclusions

This study focuses on coarse-grained soil in the southeastern Xizangan region. Through indoor FT cycle tests and triaxial shear tests, the mechanical property evolution of coarse-grained soil under FT cycles at different moisture contents is systematically analyzed. Additionally, a slope stability analysis model is constructed based on COMSOL Multiphysics software. The following conclusions are drawn:
(1)
FT cycles significantly degrade the mechanical properties of coarse-grained soil in southeastern Xizang. The stress–strain curve of the samples initially shows a higher slope and stable peak value. After one FT cycle, the peak stress decreases by 8.4%, and after fifteen cycles, the overall reduction reaches approximately 31.2%. The cohesion and internal friction angle decrease by an average of 26.5 kPa (38~55%) and about 7.4° (29~32%), respectively, with changes stabilizing after 10 cycles.
(2)
An increase in moisture content leads to an increase in pore water pressure, weakening the particle interlocking effect. As the moisture content increases from 7.6% to 11.6%, the strain softening degree increases from 8.0% to 16.0% in the non-FT samples, and after FT cycles, it increases further to 27.9~33.7%. This indicates that the shear strength degradation is more pronounced at higher moisture levels.
(3)
Increased confining pressure significantly enhances shear strength. Under conditions where the confining pressure increases from 50 kPa to 200 kPa, the peak stress increases by as much as 89.7%, effectively inhibiting the structural degradation caused by FT cycles and high moisture levels.
(4)
The two-dimensional slope model constructed using COMSOL Multiphysics shows that, at a lower moisture content (7.6%), the maximum plastic strain at the critical instability of the slope is approximately 0.20. At moisture contents of 9.6% and 11.6%, instability occurs earlier at 106 and 15 FT cycles, respectively, with the maximum plastic strain increasing to 1.515 and 2.465, indicating that the moisture content has a decisive impact on slope stability.
While the experimental–numerical framework developed here offers valuable insights, several limitations remain:
The laboratory specimens (φ = 101 mm, h = 210 mm) do not reflect the full heterogeneity of natural slopes, including macro-cracks, layering, or scale-dependent behavior.
The FT cycles were performed under idealized and accelerated conditions (±20 °C, 12 h intervals), which may not mimic gradual seasonal transitions.
No external water was supplied during cycles, potentially underestimating the effects of rainwater infiltration or snowmelt recharge.
The numerical slope model assumes homogeneity and isotropy without considering stratification, moisture migration, or chemical weakening.
Strength degradation was modeled using exponential fits, which lack mechanistic thresholds or time-dependent acceleration.
Future work will explore coupled thermal–hydraulic–mechanical–chemical (THMC) models, meso-scale physical tests, and large-scale field validation to enhance predictive capacity under real climate conditions.
These findings are particularly applicable to seasonally frozen, coarse-grained soils in regions such as southeastern Qinghai–Xizang, Alaska, and Scandinavia. However, caution is advised in extrapolating the results to fine-grained soils or highly stratified, anisotropic slope systems. Future studies integrating multi-field coupling, moisture redistribution, and time-dependent chemical degradation will be crucial to improving the universality and robustness of the proposed framework.

Author Contributions

H.N.: Conceptualization, Data curation, Methodology, Validation, Writing—original draft. P.W.: Conceptualization, Funding acquisition, Supervision, Writing—review and editing. L.C.: Conceptualization, Formal Analysis, Funding acquisition. W.Z.: Conceptualization, Methodology, Supervision, Validation, Writing—review and editing. D.S.: Conceptualization, Data curation, Writing—review and editing. C.L.: Conceptualization, Data curation, Writing—review and editing. C.S.: Conceptualization, Methodology, Validation, Writing–review and editing. All authors have read and agreed to the published version of the manuscript.

Funding

The authors declare that financial support was received for the research, authorship, and publication of this article. National Natural Science Foundation of China—Regional Innovation and Development Joint Fund Key Program (U22A20594); Key Program of Natural Foundation of Science and Technology Department of Xizang Autonomous Region, China (XZ202301ZR0033G); Key Program of Natural Foundation of Science and Technology Department of Xizang Autonomous Region, China (XZ202201ZR0068G); Sponsored by the Graduate Education Innovation Program of Xizang Agricultural and Animal Husbandry College (YJS2024-44).

Institutional Review Board Statement

Not applicable.

Informed Consent Statement

Not applicable.

Data Availability Statement

The original contributions presented in this study are included in the article. Further inquiries can be directed to the corresponding author.

Conflicts of Interest

The authors declare that the research was conducted with no commercial or financial relationships that could be perceived as potential conflicts of interest.

References

  1. Wang, Y.; Ding, J.; Piao, S. Does the continuous wetting of the Tibetan Plateau contribute to the accelerated degradation of permafrost? Sci. China Earth Sci. 2024, 67, 1714–1718. [Google Scholar] [CrossRef]
  2. Liu, W.; Wen, J.; Chen, J.; Wang, Z.; Lu, X.; Wu, Y.; Jiang, Y. Characteristic analysis of the spatio-temporal distribution of key variables of the soil freeze-thaw processes over the Qinghai-Tibetan Plateau. Cold Reg. Sci. Technol. 2022, 197, 103526. [Google Scholar] [CrossRef]
  3. Zhao, L.; Hu, G.; Liu, G.; Zou, D.; Wang, Y.; Xiao, Y.; Du, E.; Wang, C.; Xing, Z.; Sun, Z.; et al. Investigation, Monitoring, and Simulation of Permafrost on the Qinghai-Tibet Plateau: A Review. Permafr. Periglac. Process. 2024, 35, 412–422. [Google Scholar] [CrossRef]
  4. Leuther, F.; Schlüter, S. Impact of freeze–thaw cycles on soil structure and soil hydraulic properties. Soil 2021, 7, 179–191. [Google Scholar] [CrossRef]
  5. Dai, L.; Guo, X.; Zhang, F.; Du, Y.; Ke, X.; Li, Y.; Cao, G.; Li, Q.; Lin, L.; Shu, K.; et al. Seasonal dynamics and controls of deep soil water infiltration in the seasonally-frozen region of the Qinghai-Tibet plateau. J. Hydrol. 2019, 571, 740–748. [Google Scholar] [CrossRef]
  6. Luo, S.; Wang, J.; Pomeroy, J.W.; Lyu, S. Freeze–thaw changes of seasonally frozen ground on the Tibetan Plateau from 1960 to 2014. J. Clim. 2020, 33, 9427–9446. [Google Scholar] [CrossRef]
  7. Lancuo, Z.; Hou, G.; Xu, C.; Liu, Y.; Zhu, Y.; Wang, W.; Zhang, Y. Simulating the route of the Tang-Tibet Ancient Road for one branch of the Silk Road across the Qinghai-Tibet Plateau. PLoS ONE 2019, 14, e0226970. [Google Scholar] [CrossRef] [PubMed]
  8. Chen, C.; Peng, W.; Li, J.; Luo, Q.; Jiang, B.; Yu, Y.; Liu, E. Effects of Freeze–Thaw Cycle on Permeability and Compression Properties of Aeolian Soil–Bentonite Mixture. Iranian Journal of Science and Technology, Transactions of Civil Engineering 2024, 48, 3621–3641. [Google Scholar] [CrossRef]
  9. Yu, S.; Huang, S.; Liu, F.; Cai, H.; Ye, Y. Quantification of pore structure evolution and its correlation with the macroscopic properties of sandstones under freeze–thaw action. Bull. Eng. Geol. Environ. 2024, 83, 3. [Google Scholar] [CrossRef]
  10. Chen, J.; Wang, E.; Xue, J.; Cui, L.; Zheng, X.; Du, Q. Effects of soil particle size and gradation on the transformation between shallow phreatic water and soil water under laboratory freezing-thawing action. J. Hydrol. 2023, 619, 129323. [Google Scholar] [CrossRef]
  11. Chen, H.; Xu, N.; Jiang, P.; Jiang, L. Study on the Effect of Freeze–Thaw Action on the Electrical Conductivity and Sensing Properties of Graphene-Based Cement Composites. Materials 2023, 16, 855. [Google Scholar] [CrossRef] [PubMed]
  12. Jiang, Y.; Lu, X.; Liu, Z.; Wang, N.; Xu, P.; Li, P. Experimental study on the engineering properties and failure mechanism of moraine in Southeast Tibet under freeze–thaw cycles conditions. Eng. Fail. Anal. 2024, 163, 108551. [Google Scholar] [CrossRef]
  13. Liu, Z.; Xiang, Y.; Liu, W.; Huang, J.; Liang, Z.; Zhang, Q.; Li, W. Effect of Freeze–Thaw Cycles on Microstructure and Hydraulic Characteristics of Claystone: A Case Study of Slope Stability from Open-Pit Mines in Wet Regions. Water 2024, 16, 640. [Google Scholar] [CrossRef]
  14. Xiang, B.; Liu, E.; Yang, L. Influences of freezing–thawing actions on mechanical properties of soils and stress and deformation of soil slope in cold regions. Sci. Rep. 2022, 12, 5387. [Google Scholar] [CrossRef] [PubMed]
  15. Huang, S.; He, Y.; Yu, S.; Cai, C. Experimental investigation and prediction model for UCS loss of unsaturated sandstones under freeze-thaw action. Int. J. Min. Sci. Technol. 2022, 32, 41–49. [Google Scholar] [CrossRef]
  16. Li, S.; Wang, C.; Yang, J.; Lai, Y.; Jiang, Q.; Wan, X. Thermo-hydro-mechanical process and damage mechanism of a cold-region canal under coupled wetting–drying and freezing–thawing cycles. Acta Geotech. 2022, 17, 4655–4665. [Google Scholar] [CrossRef]
  17. Ling, X.; Tian, S.; Tang, L.; Li, S. A damage-softening and dilatancy prediction model of coarse-grained materials considering freeze–thaw effects. Transp. Geotech. 2020, 22, 100307. [Google Scholar] [CrossRef]
  18. Tian, S.; Tang, L.; Ling, X.; Kong, X.; Li, S.; Cai, D. Cyclic behaviour of coarse-grained materials exposed to freeze-thaw cycles: Experimental evidence and evolution model. Cold Reg. Sci. Technol. 2019, 167, 102815. [Google Scholar] [CrossRef]
  19. Li, A.; Niu, F.; Zheng, H.; Akagawa, S.; Lin, Z.; Luo, J. Experimental measurement and numerical simulation of frost heave in saturated coarse-grained soil. Cold Reg. Sci. Technol. 2017, 137, 68–74. [Google Scholar] [CrossRef]
  20. Liu, Y.; Deng, H.; Xu, J.; Tian, G.; Deng, J. Association study on the pore structure and mechanical characteristics of coarse-grained soil under freeze–thaw cycles. Minerals 2022, 12, 314. [Google Scholar] [CrossRef]
  21. Zhang, D.; Liu, E.; Liu, X.; Zhang, G.; Song, B. A new strength criterion for frozen soils considering the influence of temperature and coarse-grained contents. Cold Reg. Sci. Technol. 2017, 143, 1–12. [Google Scholar] [CrossRef]
  22. Qu, Y.L.; Ni, W.K.; Niu, F.J.; Mu, Y.H.; Chen, G.L.; Luo, J. Mechanical and electrical properties of coarse-grained soil affected by cyclic freeze-thaw in high cold regions. J. Cent. South Univ. 2020, 27, 853–866. [Google Scholar] [CrossRef]
  23. Wang, D.; Liu, E.; Yang, C.; Wang, P.; Song, B. Micromechanics-based binary-medium constitutive model for frozen soil considering the influence of coarse-grained contents and freeze–thaw cycles. Acta Geotech. 2023, 18, 3977–3996. [Google Scholar] [CrossRef]
  24. IPCC. Climate Change 2021: The Physical Science Basis; Contribution of Working Group I to the Sixth Assessment Report of the Intergovernmental Panel on Climate Change; Cambridge University Press: Cambridge, UK, 2021. [Google Scholar]
  25. GB/T 50123-2019; Standard for Soil Test Methods. Ministry of Housing and Urban-Rural Development: Beijing, China, 2019.
  26. Kloffel, T.; Larsbo, M.; Jarvis, N.; Barron, J. Freeze-thaw effects on pore space and hydraulic properties of compacted soil and potential consequences with climate change. Soil Tillage Res. 2024, 239, 106041. [Google Scholar] [CrossRef]
  27. Mutaz, E.; Serati, M.; Rimmelin, R.; Williams, D.J. Variation of apparent cohesion and friction angle under polyaxial stress conditions in concrete. Presented at the ISRM International Symposium—EUROCK 2021, Virtual, 21–24 September 2021. ISRM-EUROCK-2021-013. [Google Scholar]
  28. Zhao, Y.D.; Hu, X. How do freeze–thaw cycles affect the soil pore structure in alpine meadows considering soil aggregate and soil column scales? J. Soil Sci. Plant Nutr. 2022, 22, 4207–4216. [Google Scholar] [CrossRef]
  29. Wang, D.; Yang, X.; Wan, Q.; Zhang, S. Experimental study on the dynamic characteristics of coarse-grained saline soil embankments in the high-cold saline lake area under freeze-thaw cycle action. Case Stud. Constr. Mater. 2024, 21, e04040. [Google Scholar] [CrossRef]
  30. Li, D.; Sun, B.; Yang, L.; Wang, W. Mechanical and thermal properties of recycled coarse aggregate concrete incorporating microencapsulated phase change materials and recycled tire rubber granules and its freeze-thaw resistance. J. Build. Eng. 2025, 101, 111821. [Google Scholar] [CrossRef]
  31. Song, B.; Nakamura, D.; Kawaguchi, T.; Kawajiri, S.; Rui, D. Quantifying the shear behavior of fine-grained soil with herbaceous plant roots under freeze-thaw conditions using X-ray CT scan. Soil Tillage Res. 2025, 246, 106326. [Google Scholar] [CrossRef]
  32. Shu, H.; Yu, Q.; Niu, C.; Wang, Q. The crack characteristics and microscopic mechanism of composite solidified soil under alternating wet-dry and freeze-thaw cycles. Cold Reg. Sci. Technol. 2025, 235, 104479. [Google Scholar] [CrossRef]
  33. Liu, R.; Zhang, W.; Han, S.; Du, H.; Cui, P.; Ma, Z.; Feng, X.; Zhang, W. A numerical heat transfer model and performance evaluation of coaxial geothermal heat exchanger under soil freezing conditions. Appl. Therm. Eng. 2025, 266, 125538. [Google Scholar] [CrossRef]
Figure 1. Particle size analysis test of coarse-grained soil in southeastern Xizang. (a) Schematic of the sieved soil samples and (b) grain size distribution curves.
Applsci 15 04900 g001
Figure 2. Specimens prepared for FT cycle testing.
Applsci 15 04900 g002
Figure 3. Testing equipment. (a) Surface vibration compactor, (b) constant temperature and humidity chamber, and (c) strain-controlled triaxial apparatus.
Applsci 15 04900 g003
Figure 4. Stress–strain curves of specimens with different FT cycles and confining pressures (moisture content w = 7.6%). (a) σ3 = 50 kPa, (b) σ3 = 100 kPa, (c) σ3 = 150 kPa, and (d) σ3 = 200 kPa.
Applsci 15 04900 g004
Figure 5. Stress–strain curves of specimens with different FT cycles and confining pressures (moisture content w = 9.6%). (a) σ3 = 50 kPa, (b) σ3 = 100 kPa, (c) σ3 = 150 kPa, and (d) σ3 = 200 kPa.
Applsci 15 04900 g005
Figure 6. Stress–strain curves of specimens with different FT cycles and confining pressures (moisture content w = 11.6%). (a) σ3 = 50 kPa, (b) σ3 = 100 kPa, (c) σ3 = 150 kPa, and (d) σ3 = 200 kPa.
Applsci 15 04900 g006aApplsci 15 04900 g006b
Figure 7. Variation of shear strength with FT cycles for samples with different moisture contents. (a) w = 7.6%, (b) w = 9.6%, and (c) w = 11.6%.
Applsci 15 04900 g007
Figure 8. The relationship between cohesion (c), internal friction angle (φ), and the number of FT cycles. (a) Cohesion c and (b) the internal friction angle φ.
Applsci 15 04900 g008
Figure 9. Stress–strain curves of samples with different water contents under different confining pressures (FT = 0). (a) σ3 = 50 kPa, (b) σ3 = 100 kPa, (c) σ3 = 150 kPa, and (d) σ3 = 200 kPa.
Applsci 15 04900 g009
Figure 10. Stress–strain curves of samples with different water contents under different confining pressures (FT = 6). (a) σ3 = 50 kPa, (b) σ3 = 100 kPa, (c) σ3 = 150 kPa, and (d) σ3 = 200 kPa.
Applsci 15 04900 g010aApplsci 15 04900 g010b
Figure 11. Stress–strain curves of samples with different water contents under various confining pressures (FT = 15). (a) σ3 = 50 kPa, (b) σ3 = 100 kPa, (c) σ3 = 150 kPa, and (d) σ3 = 200 kPa.
Applsci 15 04900 g011
Figure 12. Relationship between shear strength and water content under different numbers of FT cycles. (a) FT = 0, (b) FT = 6, and (c) FT = 15.
Applsci 15 04900 g012
Figure 13. Relationship between cohesion (c), the internal friction angle (φ), and water content. (a) Cohesion c and (b) the internal friction angle φ.
Applsci 15 04900 g013
Figure 14. Model of the coarse-grained soil slope.
Applsci 15 04900 g014
Figure 15. Temperature of the slope model after 15 FT cycles. (a) High environmental temperature state and (b) low environmental temperature state.
Applsci 15 04900 g015
Figure 16. Temperature of the slope model after 35 FT cycles. (a) High environmental temperature state and (b) low environmental temperature state.
Applsci 15 04900 g016
Figure 17. Temperature of the slope model after 54 FT cycles. (a) High environmental temperature state and (b) low environmental temperature state.
Applsci 15 04900 g017
Figure 18. Temperature of the slope model under high environmental temperature conditions at different FT cycle counts. (a) FT = 55 and (b) FT = 150.
Applsci 15 04900 g018
Figure 19. Development trend of equivalent plastic strain in the slope model with a soil moisture content of 7.6%. (a) FT = 0, (b) FT = 60, (c) FT = 150, and (d) FT = 176.
Applsci 15 04900 g019
Figure 20. Development trend of equivalent plastic strain in the slope model with a soil moisture content of 9.6%. (a) FT = 0, (b) FT = 39, (c) FT = 96, and (d) FT = 106.
Applsci 15 04900 g020
Figure 21. Development trend of equivalent plastic strain in the slope model with a soil moisture content of 11.6%. (a) FT = 0, (b) FT = 12, (c) FT = 38, and (d) FT = 45.
Applsci 15 04900 g021
Table 1. Basic physical properties of the soil in the study area (based on our own tests).
ParameterNatural Density (g/cm3)Maximum Dry Density (g/cm3)Minimum Dry Density (g/cm3)Optimum Moisture Content (%)Natural Moisture Content (%)Specific Gravity (g/cm3)
Measured Value1.972.151.767.61.22.65
Table 2. Physical parameters for numerical calculations (based on available regional engineering reports).
ParameterDensity (kg/m3)Thermal Conductivity
(W/(m·K))
Specific Heat Capacity (J/(kg·K))Porosity (%)Young’s Modulus (MPa)Poisson’s RatioCohesion (kPa)Internal Friction Angle (rad)
Initial Slope215031500301200.233.920.442
Table 3. Fitting results of the cohesion and internal friction angle with varying FT cycle counts (FT) under different moisture content conditions.
Moisture ContentCohesion c (Pa)Internal Friction Angle φ (rad)
7.6%c = 31,728*exp(−0.002*FT)φ = 0.4206*exp(−0.002*FT)
9.6%c = 25,128*exp(−0.003*FT)φ = 0.4032*exp(−0.002*FT)
11.6%c = 17,181*exp(−0.003*FT)φ = 0.3864*exp(−0.002*FT)
Disclaimer/Publisher’s Note: The statements, opinions and data contained in all publications are solely those of the individual author(s) and contributor(s) and not of MDPI and/or the editor(s). MDPI and/or the editor(s) disclaim responsibility for any injury to people or property resulting from any ideas, methods, instructions or products referred to in the content.

