1. Introduction
Sintered Neodymium–iron–boron (NdFeB) is widely used for its high magnetic properties [
1]. However, it is not suitable to be machined by traditional machining due to its high hardness and brittleness [
2,
3]. Electrical discharge machining (EDM) is achieved by the thermal effect between the tool electrode and the workpiece in the dielectric [
4,
5], without considering the hardness and brittleness of the materials [
6,
7]. Thus, EDM is a viable processing method for sintered NdFeB.
Currently, there are fewer studies on EDM of sintered NdFeB. Miller et al. [
8] processed the sintered NdFeB material by the EDM wire cutting method and concluded that the surface roughness increased gradually with the increase of pulse on time. It was also observed that the thickness of the recast layer and the damage on the surface were different when the thickness of the processed workpiece was 1.5 mm and 27 mm. Li et al. [
9] investigated the effect of discharge energy on the MRR and SR of sintered NdFeB processed by EDM. It was found that MRR and SR were increased with the increase of discharge energy. Li et al. [
10] proposed ultrasonic-assisted EDM machining of sintered NdFeB and analysed the sintered NdFeB surface morphology of EDM and ultrasonic-assisted EDM machining using scanning electron microscopy. It was found that sintered NdFeB processed by ultrasonic-assisted EDM had fewer microcracks on their surfaces and a more uniform recast layer.
EDM milling is a new EDM processing method based on the traditional EDM method [
11]. EDM milling is the process of etching material layer by layer by rotating an electrode and controlling the trajectory of the movement [
12], with the advantages of high processing efficiency and low processing cost [
13]. Mullya et al. [
14] proposed the application of an improvised tool to enhance rotation and induced debris flushing. The improvised tool enhanced the MRR by 150% compared with conventional cylindrical tools. Guo et al. [
15] implemented a combination of unstable arc discharge and stable arc discharge for material removal by adapting the servo control strategy, and improved discharge energy utilization of ED milling in titanium alloy machining. Kou et al. [
16] proposed high-speed EDM milling with moving electric arcs and water-based dielectric, which effectively improved the MRR of titanium alloy. Wang et al. [
17] proposed a new compound machining method of titanium alloy by super high-speed EDM milling and arc machining. This method could significantly improve the machining efficiency compared with traditional EDM. Yu et al. [
18] compared and studied the machining of cemented carbide WC G5 material by a dry EDM milling method and an EDM milling method in oil. It was found that the former had a higher MRR and a lower electrode loss rate, which was more favourable for the machining of WC G5 material considering the machining time and cost. Zhang et al. [
19] proposed a new high-speed EDM milling method using rotating short arcs under a composite energy field. It was found that this method increased the MRR by 46% compared to traditional EDM.
The interactions that exist between processing parameters may affect the discharge physical conditions and processing effects of EDM [
20]. To improve efficiency and surface quality, researchers carried out studies on the interactive effects of EDM process parameters on machining. Singh et al. [
21] investigated the tool wear rate in tungsten powder hybrid EDM of AA6061/10%SiCp by RSM approach. It was found that the interaction effect of current and pulse on time, and current and pulse off time, are significant to tool wear rate. Pradhan [
22] used response surface methodology (RSM) to assess the significance of the interaction effect of process parameters on MRR and SR of AISI D2 tool steel by EDM. It was shown that the interaction of current, pulse on time, and duty cycle had significant effects on MRR and SR. Khan et al. [
23] used the hybrid Taguchi grey approach to study the machining effect of Ti6Al4V by wire EDM. It was concluded that interactions of pulse on time versus pulse off time and peak current versus pulse off time on MRR and SR were significant according to the constructed contour plots and their analysis. The significance of the interaction effect of factors on the machining effect could also be determined by ANOVA. Sivaprakasam et al. [
24] carried out magnetic field-assisted microfabrication EDM of AMC materials, and it was shown that the interaction of voltage and feed rate had a more significant effect on MRR based on the ANOVA results. Ye et al. [
25] proposed a linear regression model with the inclusion of two-way interactions based on ANOVA to optimally select the process parameters in Micro-EDM Drilling/Milling. The ANOVA-based results revealed that three interaction terms—pulse frequency and current, pulse frequency and regulation gain, and regulation gain and servo voltage—show significant effects on the MRR besides the main effect. Yadav et al. [
26] found that the interaction of voltage and powder concentration had a significant effect on the taper angle, as determined by ANOVA, in an experimental investigation for drilling micro-holes using the Al
2O
3 powder-mixed micro-EDM technique.
Researchers also used methods such as calculating factor effect values and comparing prediction errors of the regression model to study the interaction of factors on the machining effectiveness of EDM. Zarepour et al. [
27] employed Taguchi’s standard orthogonal array to design experiments and studied the electrode wear of the hot work tool steel 1.2714. Factor effects were calculated, and it was concluded that the interaction between engaging time and pre-EDM roughing had the least effect on electrode wear according to the values of the factor effects. Hourmand et al. [
28] investigated the effect of process parameters on the MRR of Al-Mg
2Si by powder-mixed EDM and validated experimental results by the RSM-generated adaptive neuro-fuzzy inference system (ANFIS) model. It was concluded that current–voltage and current–pulse on time had the most significant interaction effect on the MRR according to the drawn three-dimensional ANFIS model of the MRR. Marafona et al. [
29] used Taguchi’s experimental method to study the variation of the black layer of the electrode with the interaction of the parameters and found it inconsistent by comparing the additive model-predicted values with the experimental values. It was shown that there was a significant interaction between the parameters, and the black layer on the electrode varied with the interaction of the parameters. Marafona et al. [
30] used Taguchi’s method to study the effect of workpiece hardness and each process parameter on the MRR of alloy steels machined by EDM. The regression model of MRR was established, and the significance of each item within the model was determined by comparing the prediction error of the established model. The results showed that the workpiece hardness interacted with all other parameters except the ram cycle.
Since the high hardness and brittleness of sintered NdFeB are well-suited for EDM machining, and the analytical parameters selected in this study are the main interaction influences on the efficiency of EDM machining, the importance of analytical parameter interactions is crucial for EDM machining of sintered NdFeB. In addition, there is less study on the trend of change in the significance of the interaction of processing parameters on the effect of EDM processing and its causes. Therefore, in this study, interaction curves are proposed and plotted to more intuitively show the trends in the effect of two-factor interaction on MRR and the significance of the two-factor interaction. Based on these interaction curves, the interaction effects of factors on MRR during EDM milling of sintered NdFeB were investigated, and the causes were analysed through the interaction trends. This work helps fill the gap in research on EDM machining of sintered NdFeB and provides new insights for related fields.
3. Introduction of the Interaction Curve, the △y(x) and △y x
The aim of this study is to visually reveal the effects of interactions between parameters on MRR. In traditional statistical methods, ANOVA judges the significance of interaction terms using p-values, while RSM is required for more complex experimental designs [
22]. In contrast, interaction curves visualise whether there is an interaction between different parameter combinations and the significance of the interaction between parameter combinations for MRR changes by means of two-dimensional graphs. Therefore, using the mathematical model of MRR in Equation (1), the interaction curve is plotted, and the interaction and significance of two factors on MRR are investigated using Origin software.
To study the interaction and significance of voltage and current on MRR, for example, a new curve, which is called the interaction curve of current and voltage on MRR, is drawn and analysed. Two curves are included. One curve shows the change in MRR with variation in current under a certain value of voltage. The other curve shows the change in MRR with variation in voltage under a certain value of current. During plotting, the value of pulse on time and the value of pulse off time are fixed at their centre levels, respectively.
To obtain the curve showing the change in MRR with variation on current under a certain value of voltage, the voltage is first set at a certain value within the experimental interval [30 V, 70 V], and then the current is varied within its experimental interval [3 A, 6 A] to calculate the change in MRR caused by the change of current. An orthogonal coordinate system is established, as shown in
Figure 2. The horizontal axis at the top is the value of voltage. The vertical axis on the right side is the change in MRR due to the change in current when the voltage is set at the corresponding value shown by the horizontal axis. The curve is marked as the influence of current. Using the same method, the curve showing the change in MRR with variation in voltage under a certain value of current is drawn and also shown in
Figure 2, marked as the influence of voltage.
The curve shown in
Figure 2 is called the interaction curve of current and voltage on MRR. It could be used to analyse the interaction between voltage and current on MRR.
In order to obtain the significance, the variables △y(x) and △y x are defined. The variation of MRR caused by a change of factor is marked as △y(x), where y represents the factor that is set at a certain value and x represents the factor that varies to change the MRR. For example, in the interaction of current and voltage on MRR (namely U-I), the variation of MRR due to a change in current is expressed as △U(I) when the voltage is fixed. The change of change is marked as △y x. For example, in the U-I mentioned above, the change of in △U(I) due to a change in voltage is expressed by △U I.
4. Interaction of Machining Parameters on the MRR
4.1. Interaction of Current and Voltage on the MRR
4.1.1. Significance of Current on the MRR
It is obvious in
Figure 2 that the influence of current on MRR gradually increases with the increase of voltage. When the value of voltage is 70 V, the change in MRR caused by the change in current reaches a maximum, i.e., the △
U(
I) is 34.22 mg/min. This means that the influence of current on MRR is maximum, i.e., the significance of current on MRR is strongest. When the value of voltage is 30 V, △
U(
I) is at its minimum of 19.68 mg/min. This means that the significance of current on MRR is weakest. The difference between the 34.22 mg/min and 19.68 mg/min is 14.54 mg/min, i.e., △
U I is 14.54 mg/min, which is listed in
Table 2 and used to analyse the significance of MRR.
To interpret the above results, the size of the crater on the machined surfaces under different values of current and voltage are observed comparatively, as shown in
Figure 3.
Table 3 lists the mean and difference of crater diameters under different values of current and voltage.
It is well known that MRR is positively associated with crater diameter. Thus, the effect of voltage on MRR is more significant when the current is 3 A. However, the significance of the effect of voltage on MRR is weaker when the current is 6 A. This is consistent with the results of the interaction curve. This results in significant effects of discharge energy variations on MRR [
9]. The reasons for this can be explained as follows.
When the discharge energy is low, the deionisation of the dielectric is good, and the diffusion condition of the inter-polar dielectric is good. A change in the value of voltage will result in a change in the distance between the electrode and the workpiece. The energy density of the plasma channel varies significantly from its centre to its circumference along the radius. The effective radius of the plasma channel that can be used for the removal of material varies significantly, and as a result, the diameter of the crater varies significantly. Moreover, there are fewer residual particles in the discharge channel, which means less consumption of discharge energy due to secondary discharge. Therefore, the effect of voltage on MRR is greater under low current.
As current increases, discharge energy increases, However, the deionisation and the diffusion conditions of the inter-polar dielectric worsen. The diffusion resistance of the inter-polar dielectric is large. Meanwhile, there are more residual etched particles in the discharge channel, which consumes more discharge energy due to secondary discharge. This results in a small variation in the crater diameter. Therefore, the significance of the effect of voltage on MRR is less at higher currents.
4.1.2. Significance of Voltage on the MRR
It is also obvious in
Figure 2 that the significance of the influence of voltage on MRR decreases and then increases as the current increases. When the value of current is 3 A, △
I(
U) reaches a maximum of 11.93 mg/min, indicating that the influence of voltage on MRR is strongest. When the value of current is 5.4 A, △
I(
U) is at its minimum of 3.36 mg/min, indicating that the significance of voltage on MRR is weakest. The △
I U is 8.57 mg/min and is listed in
Table 2. Furthermore, △
I(
U) is 4.89 mg/min at a current of 6 A, which is less than that under a current of 3 A.
As shown in
Table 3, the difference in crater diameter between 3 A and 6 A is 54.96 μm when the voltage is 30 V, and 57.12 μm when the voltage is 70 V. This means that the change in crater diameter caused by the change in current is smaller when the voltage is 30 V. Namely, the effect of current on crater diameter is less significant under a voltage of 30 V. However, the change in crater diameter caused by a change in current is greater when the voltage is 70 V, indicating the effect of current on crater diameter is more significant at 70 V. Considering that crater diameter significantly affects MRR, the effect of current on MRR is more significant under the voltage of 70 V than at 30 V, which is consistent with the results in
Figure 2. The reasons for this phenomenon can be analysed as follows.
When the voltage is 30 V, the distance between the electrode and the workpiece is small. The deionisation of the dielectric between the poles is poor. The residual heat and residual corrosion products of the previous pulse discharge are retained in the dielectric between the electrode and the workpiece, which has a great effect on the next discharge. When the current changes, the expansion or contraction process of the plasma channel from the centre of the channel to the circumferential edge of the channel is affected because of changes in the diffusion conditions of the inter-polar dielectric. However, its radial expansion or contraction is limited, and the change in the radial dimension of the plasma channel is not obvious, which results in a smaller change in crater diameter. Therefore, the change in crater diameter on the surface of the workpiece caused by the change in current is less under a voltage of 30 V.
When the voltage is 70 V, the distance between the tool electrode and the workpiece is larger [
28]. The deionisation effect of the inter-polar dielectric is better. The expansion resistance of the plasma discharge channel is smaller along the radius direction. Meanwhile, the residual heat and residual corrosion products of the previous pulse discharge are sufficiently dispersed. As a result, the radius of the discharge channel varies greatly with the change in current. Consequently, the change in crater diameter is larger. Thus, the significance of the effect of current on MRR increases with increasing voltage.
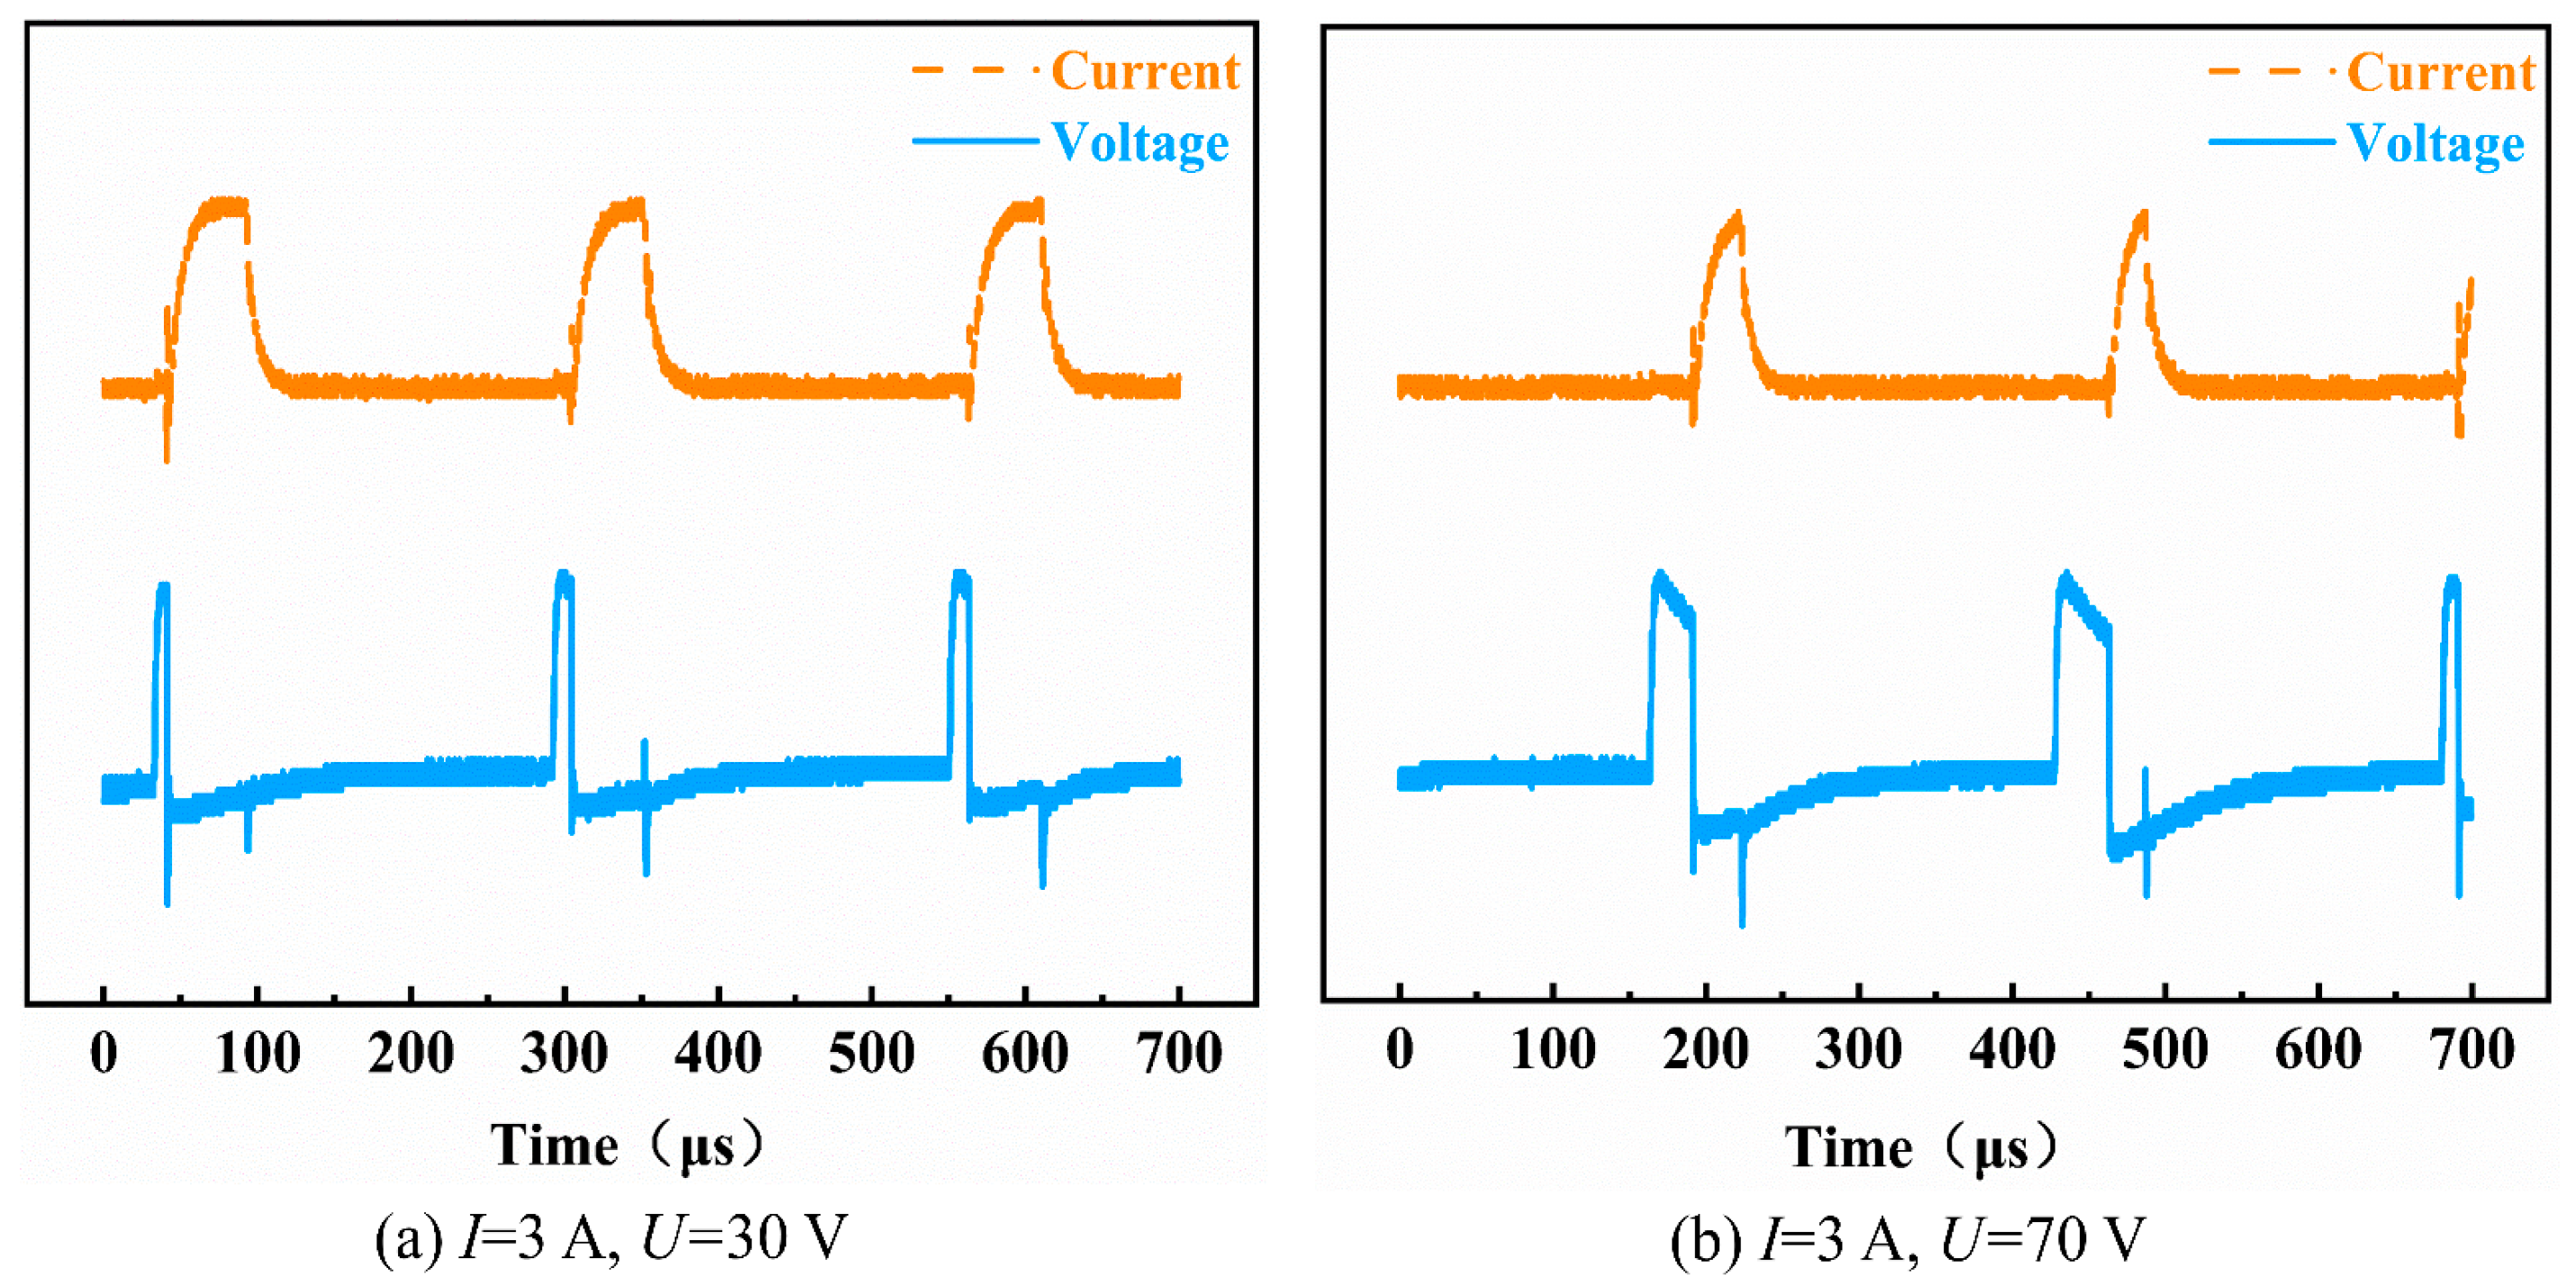
Figure 4 shows the measured waveform of discharge voltage and discharge current. Compared with the case of 3 A and 70 V (
Figure 4b), the breakdown delay time is shorter in the case of 3 A and 30 V (
Figure 4a). Under the conditions of low voltage, the distance between the poles is small. The residual heat and residual corrosion products of the previous pulse discharge are more easily retained between the two poles. The deionisation of the dielectric between the poles is not sufficient. As a result, there is an influence of the previous pulse discharge on the dielectric breakdown process of the next pulse discharge. The variation in the diameter of the plasma discharge channel is affected. Consequently, the change in crater diameter is influenced.
4.2. Interaction of Pulse on Time and Pulse off Time on the MRR
Using the same method, the change in MRR with the variation of pulse off time under a certain value of pulse on time, and the change in MRR with the variation of pulse on time under a certain value of pulse off time, is obtained, as shown in
Figure 5.
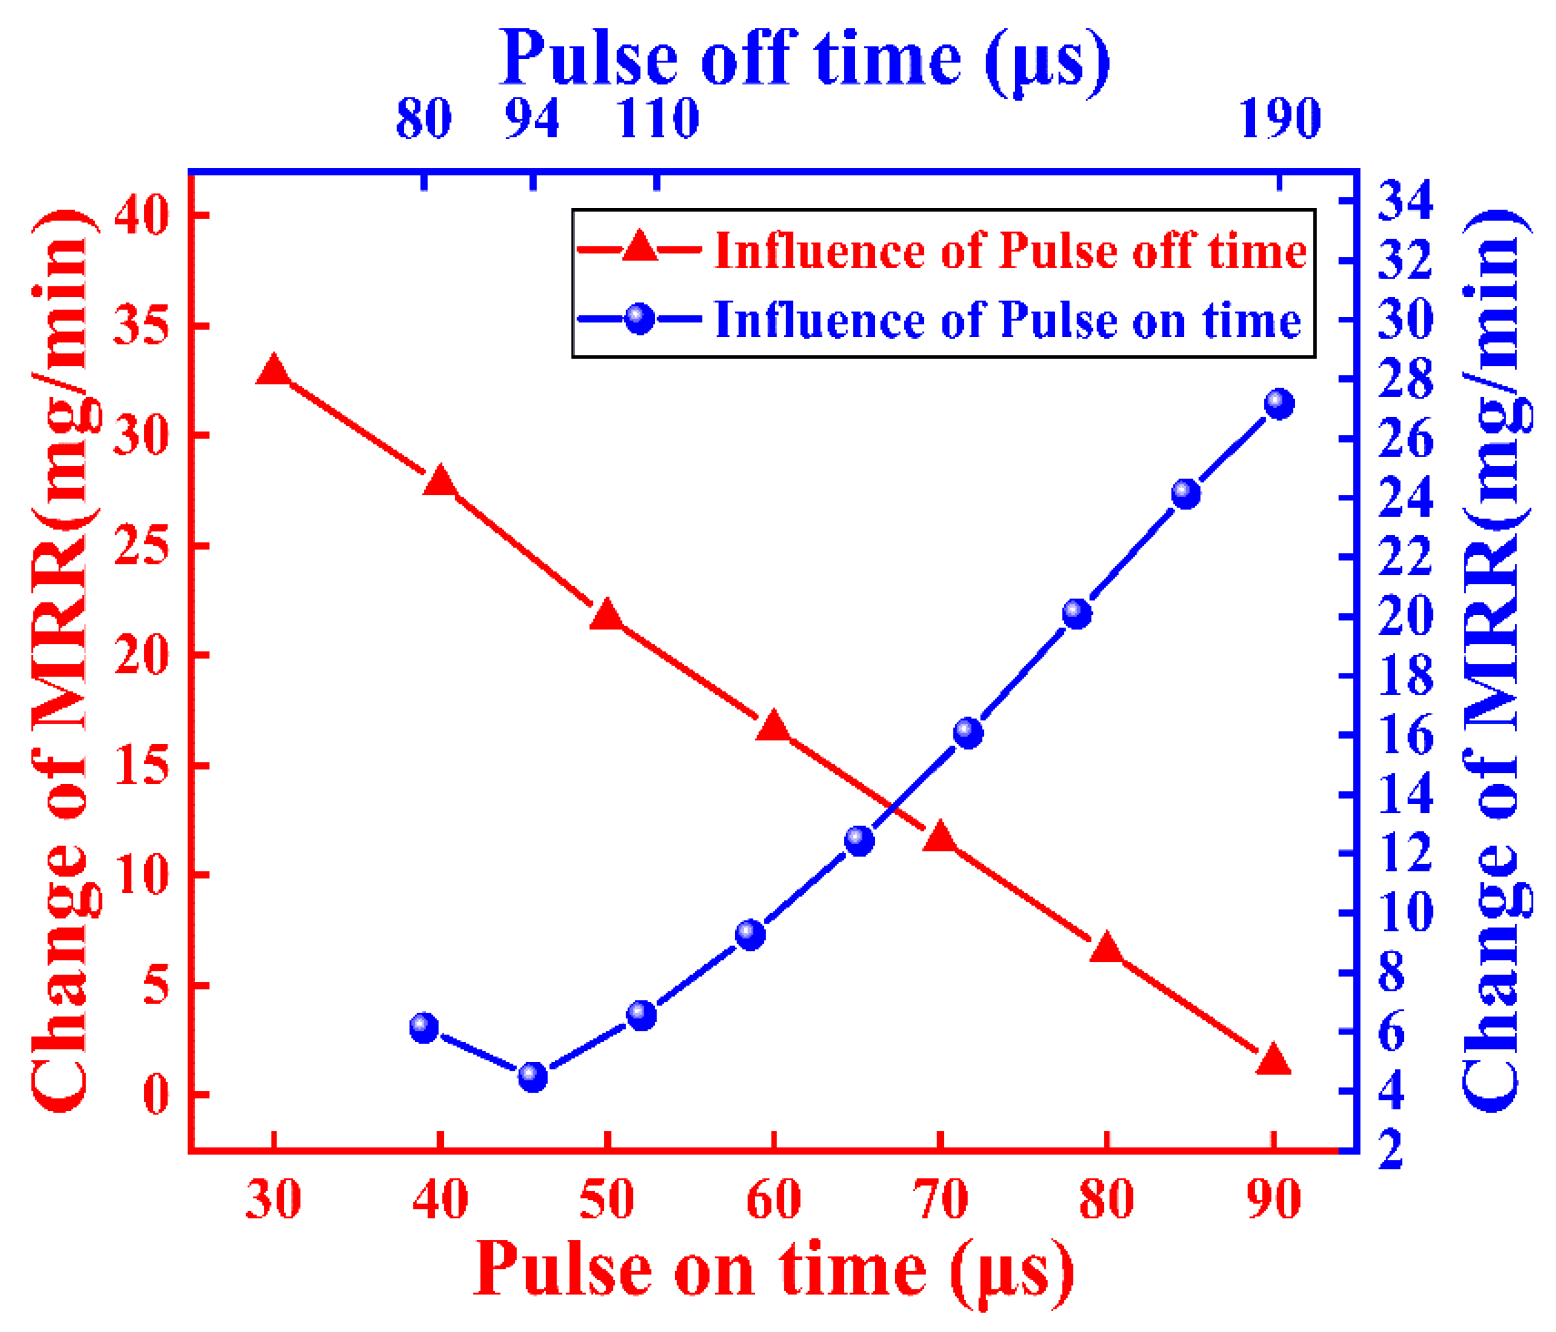
Figure 5 is called the interaction curve of pulse on time and pulse off time on MRR. The horizontal axis at the top is the value of pulse off time. The vertical axis on the right side is the change in MRR due to the change in pulse on time when the pulse off time is set at the corresponding value shown by the horizontal axis. The curve is marked as the influence of pulse on time. Using the same method, the curve that shows the change in MRR with the variation of pulse off time under a certain value of the pulse on time is drawn and also shown in
Figure 5, marked as the influence of pulse off time.
4.2.1. Significance of Pulse off Time on the MRR
It is obvious in
Figure 5 that the significance of pulse off time on MRR gradually decreases with the increase of pulse on time. When the value of pulse on time is 30 μs,△
Ton(
Toff) reaches a maximum of 32.86 mg/min. Namely, the significance of pulse off time on MRR is the strongest. When the value of pulse on time is 90 μs, △
Ton(
Toff) is at its minimum of 1.50 mg/min, indicating that the significance of pulse off time on MRR is weakest. The △
Ton Toff is 31.36 mg/min, as listed in
Table 2.
The above phenomenon can be explained by the significance of the effect of pulse off time on the pulse discharge frequency. It is generally known that the period of pulse discharge is equal to the sum of the pulse on time and the pulse off time. The variation in pulse off time affects the pulse discharge frequency. In the range of parameters in this study, when the pulse on time is 30 μs, the variation interval of the pulse off time is [80 μs, 190 μs], which is about 2.7 times to 6.3 times the value of the pulse on time. Namely, the effect of the pulse off time on the pulse discharge frequency is amplified by about 2.7 to 6.3 times. However, when the pulse on time is 90 μs, the value of pulse off time varies from about 0.9 times to 2.1 times of the pulse on time. Namely, the effect of the pulse off time on the pulse discharge frequency is amplified by about 0.9 to 2.1 times. It is clear that the influence of pulse off time on MRR is more significant when the pulse on time is low. Thus, it appears that the significance of the effect of pulse off time on MRR decreases as pulse on time increases.
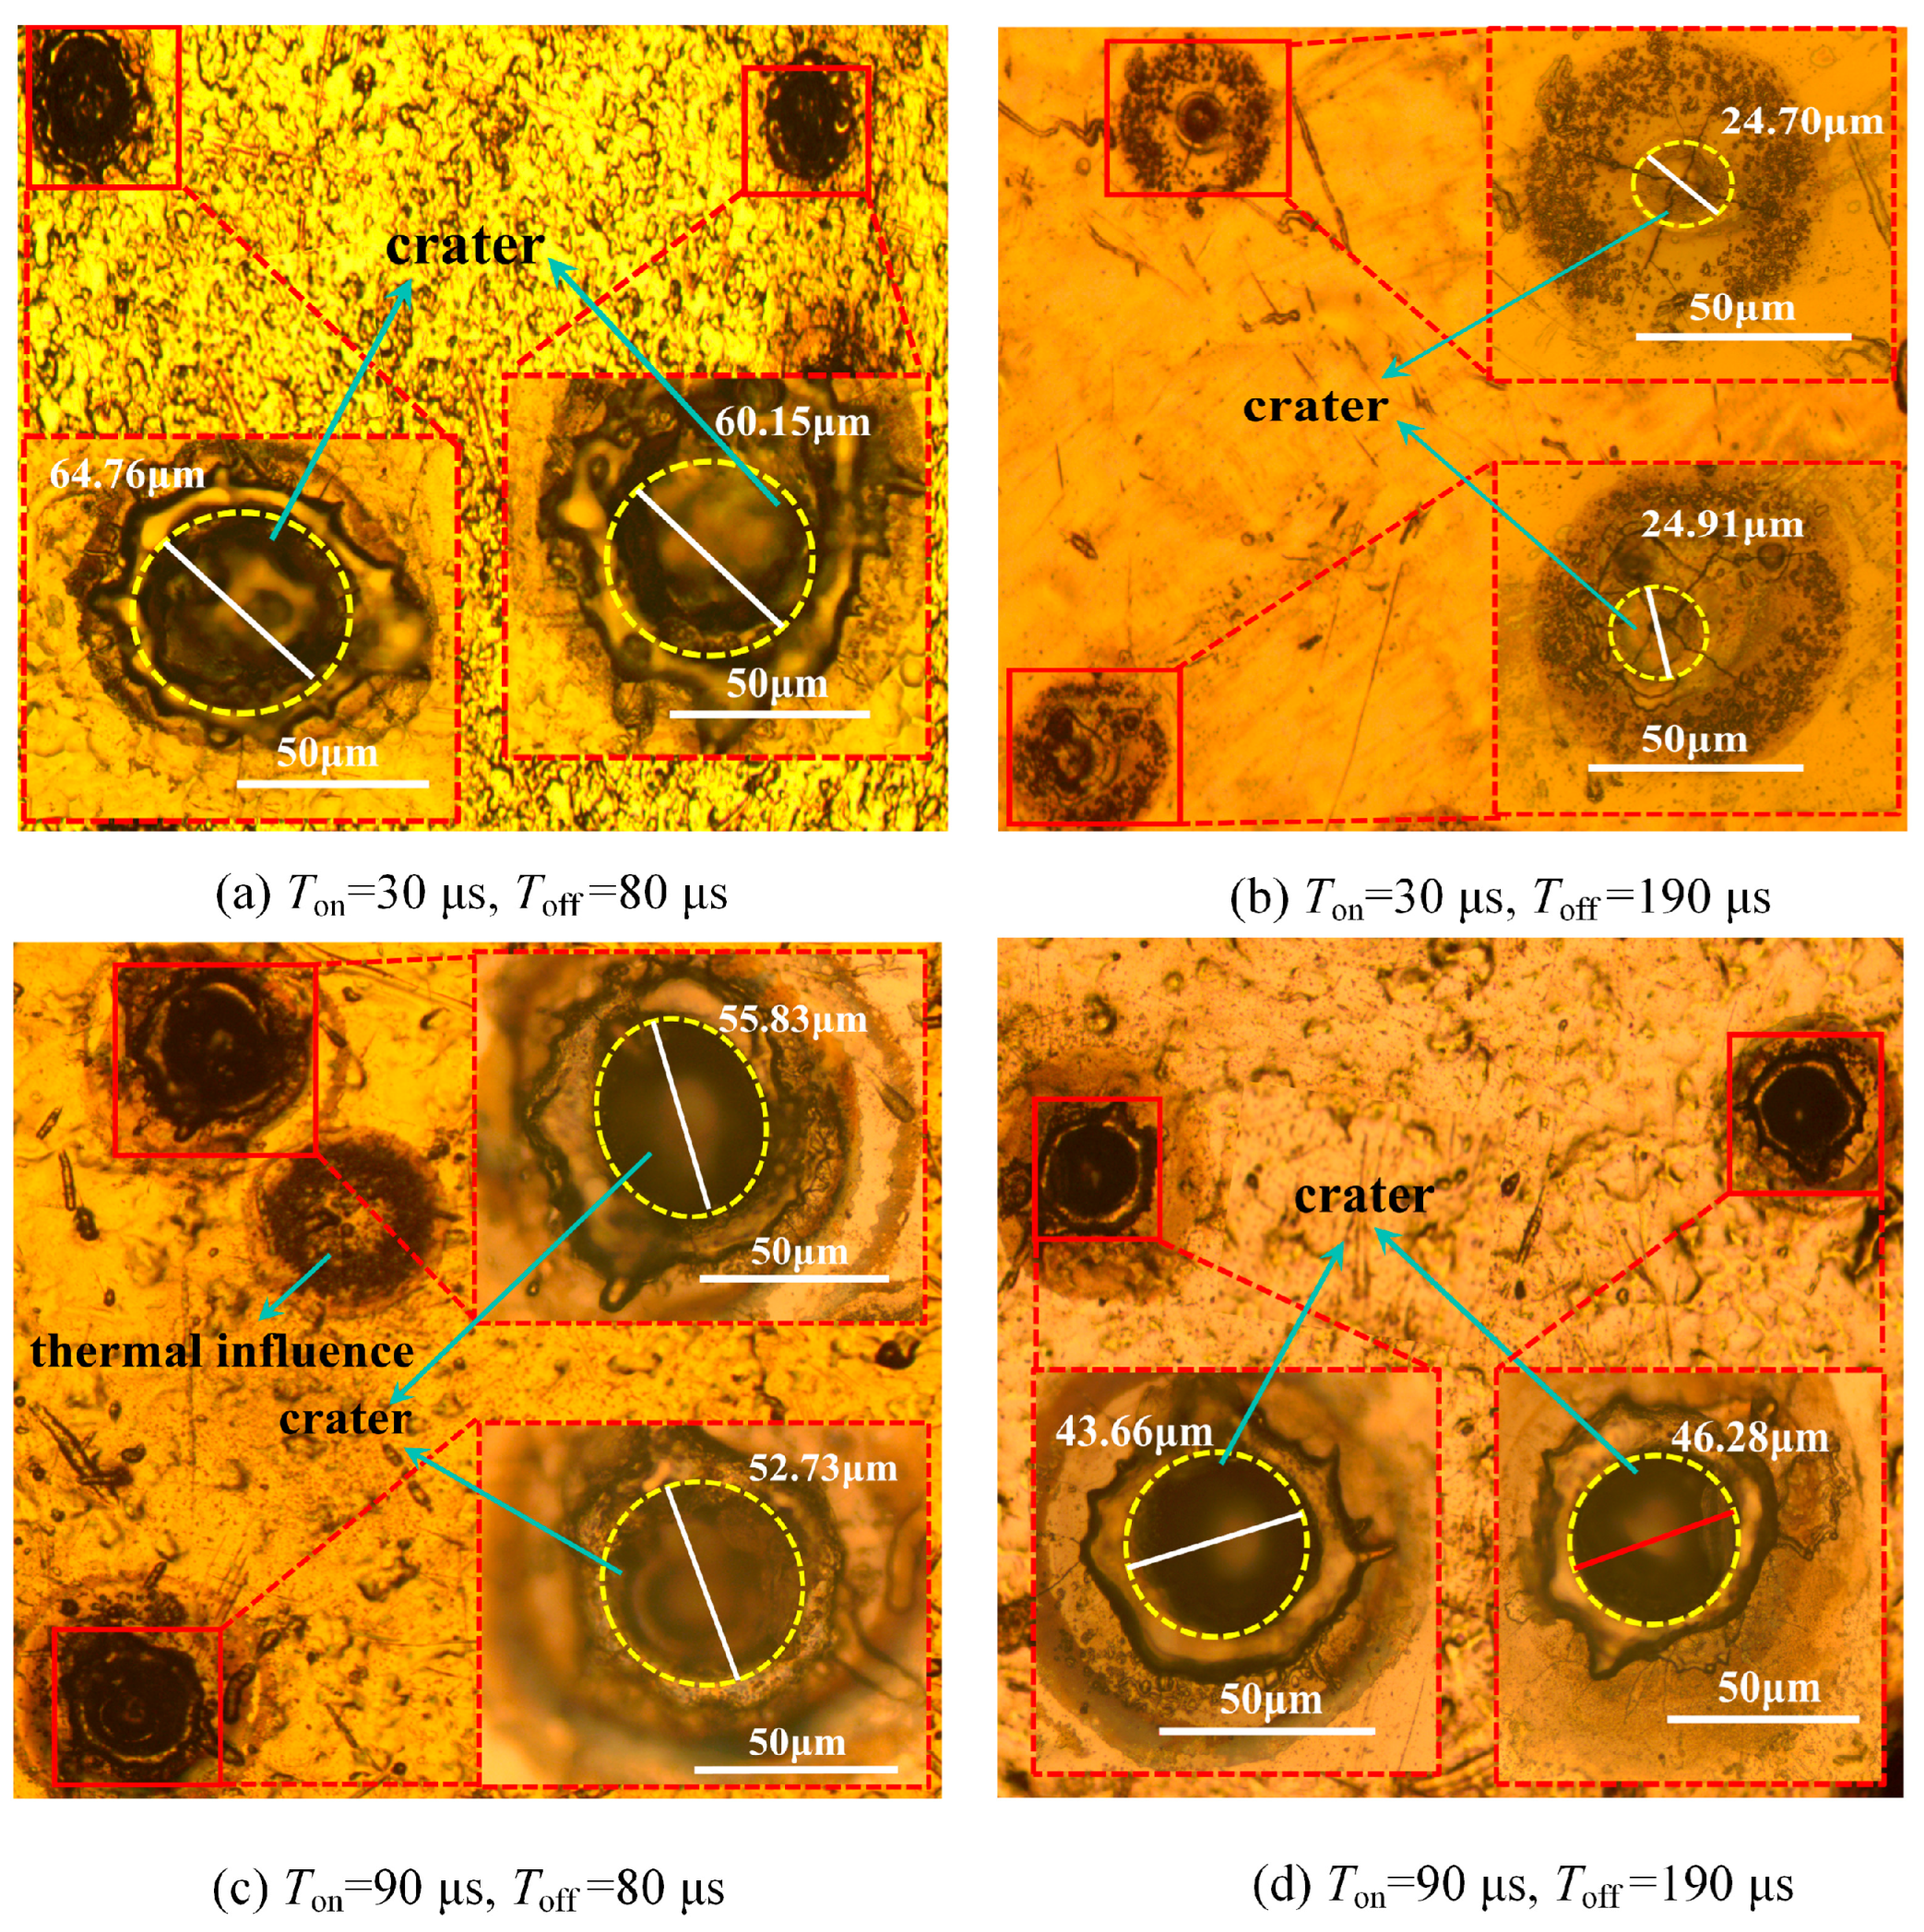
Figure 6 shows the diameters of craters under different pulse on time and pulse off times.
Table 4 shows the mean and differences of the crater diameters corresponding to
Figure 6. According to
Table 4, the difference in crater diameter is 37.65 μm between pulse off times of 80 μs and 190 μs when the pulse on time is 30 μs, and the difference is 9.31 μm between the same pulse off times when the pulse on time is 90 μs. It is clear that the variation in crater diameter caused by variation in pulse off time is larger when the pulse on time is 30 μs. The effect of pulse off time on crater diameter is more significant under a pulse on time of 30 μs. Therefore, an increase in the value of pulse on time could decrease the significance of the effect of pulse off time on MRR.
4.2.2. Significance of Pulse on Time on the MRR
In
Figure 5, it is also obvious that the significance of pulse on time on MRR decreases and then increases as pulse off time increases. When the value of pulse off time is 190 μs, △
Toff(
Ton) reaches a maximum of 27.16 mg/min. This means that the influence of pulse on time on MRR is at maximum, i.e., the significance of the influence of pulse on time on MRR is strongest. When the value of pulse off time is 94 μs, △
Toff(
Ton) is at its minimum of 4.47 mg/min, indicating that the significance of pulse on time on MRR is weakest. The △
Toff Ton is 22.69 mg/min, as listed in
Table 2. In addition, when the value of pulse off time is 80 μs, the △
Toff (
Ton) is 6.12 mg/min, which is less significant than that of 190 μs. The reasons are explained as follows.
When the pulse off time is 80 μs, the residual effect of the previous discharge is significant. The deionisation of the dielectric is insufficient, and the expansion of the plasma discharge channel is limited. The change in pulse on time causes a change in the diameter of the plasma discharge channel, but the change is not significant. As a result, the effect of pulse on time on crater diameter is insignificant. However, when the pulse off time is 190 μs, the residual effect of the previous discharge is weak, and the deionisation is good. The resistance to changes in the diameter of the plasma discharge channel is low. The variation in pulse on time can effectively affect the size of the crater, which has a large effect on MRR. Thus, the significance of the effect of pulse on time on MRR increases as the pulse off time is adjusted from 80 to 190 μs.
4.3. Interaction of Pulse on Time and Voltage on the MRR
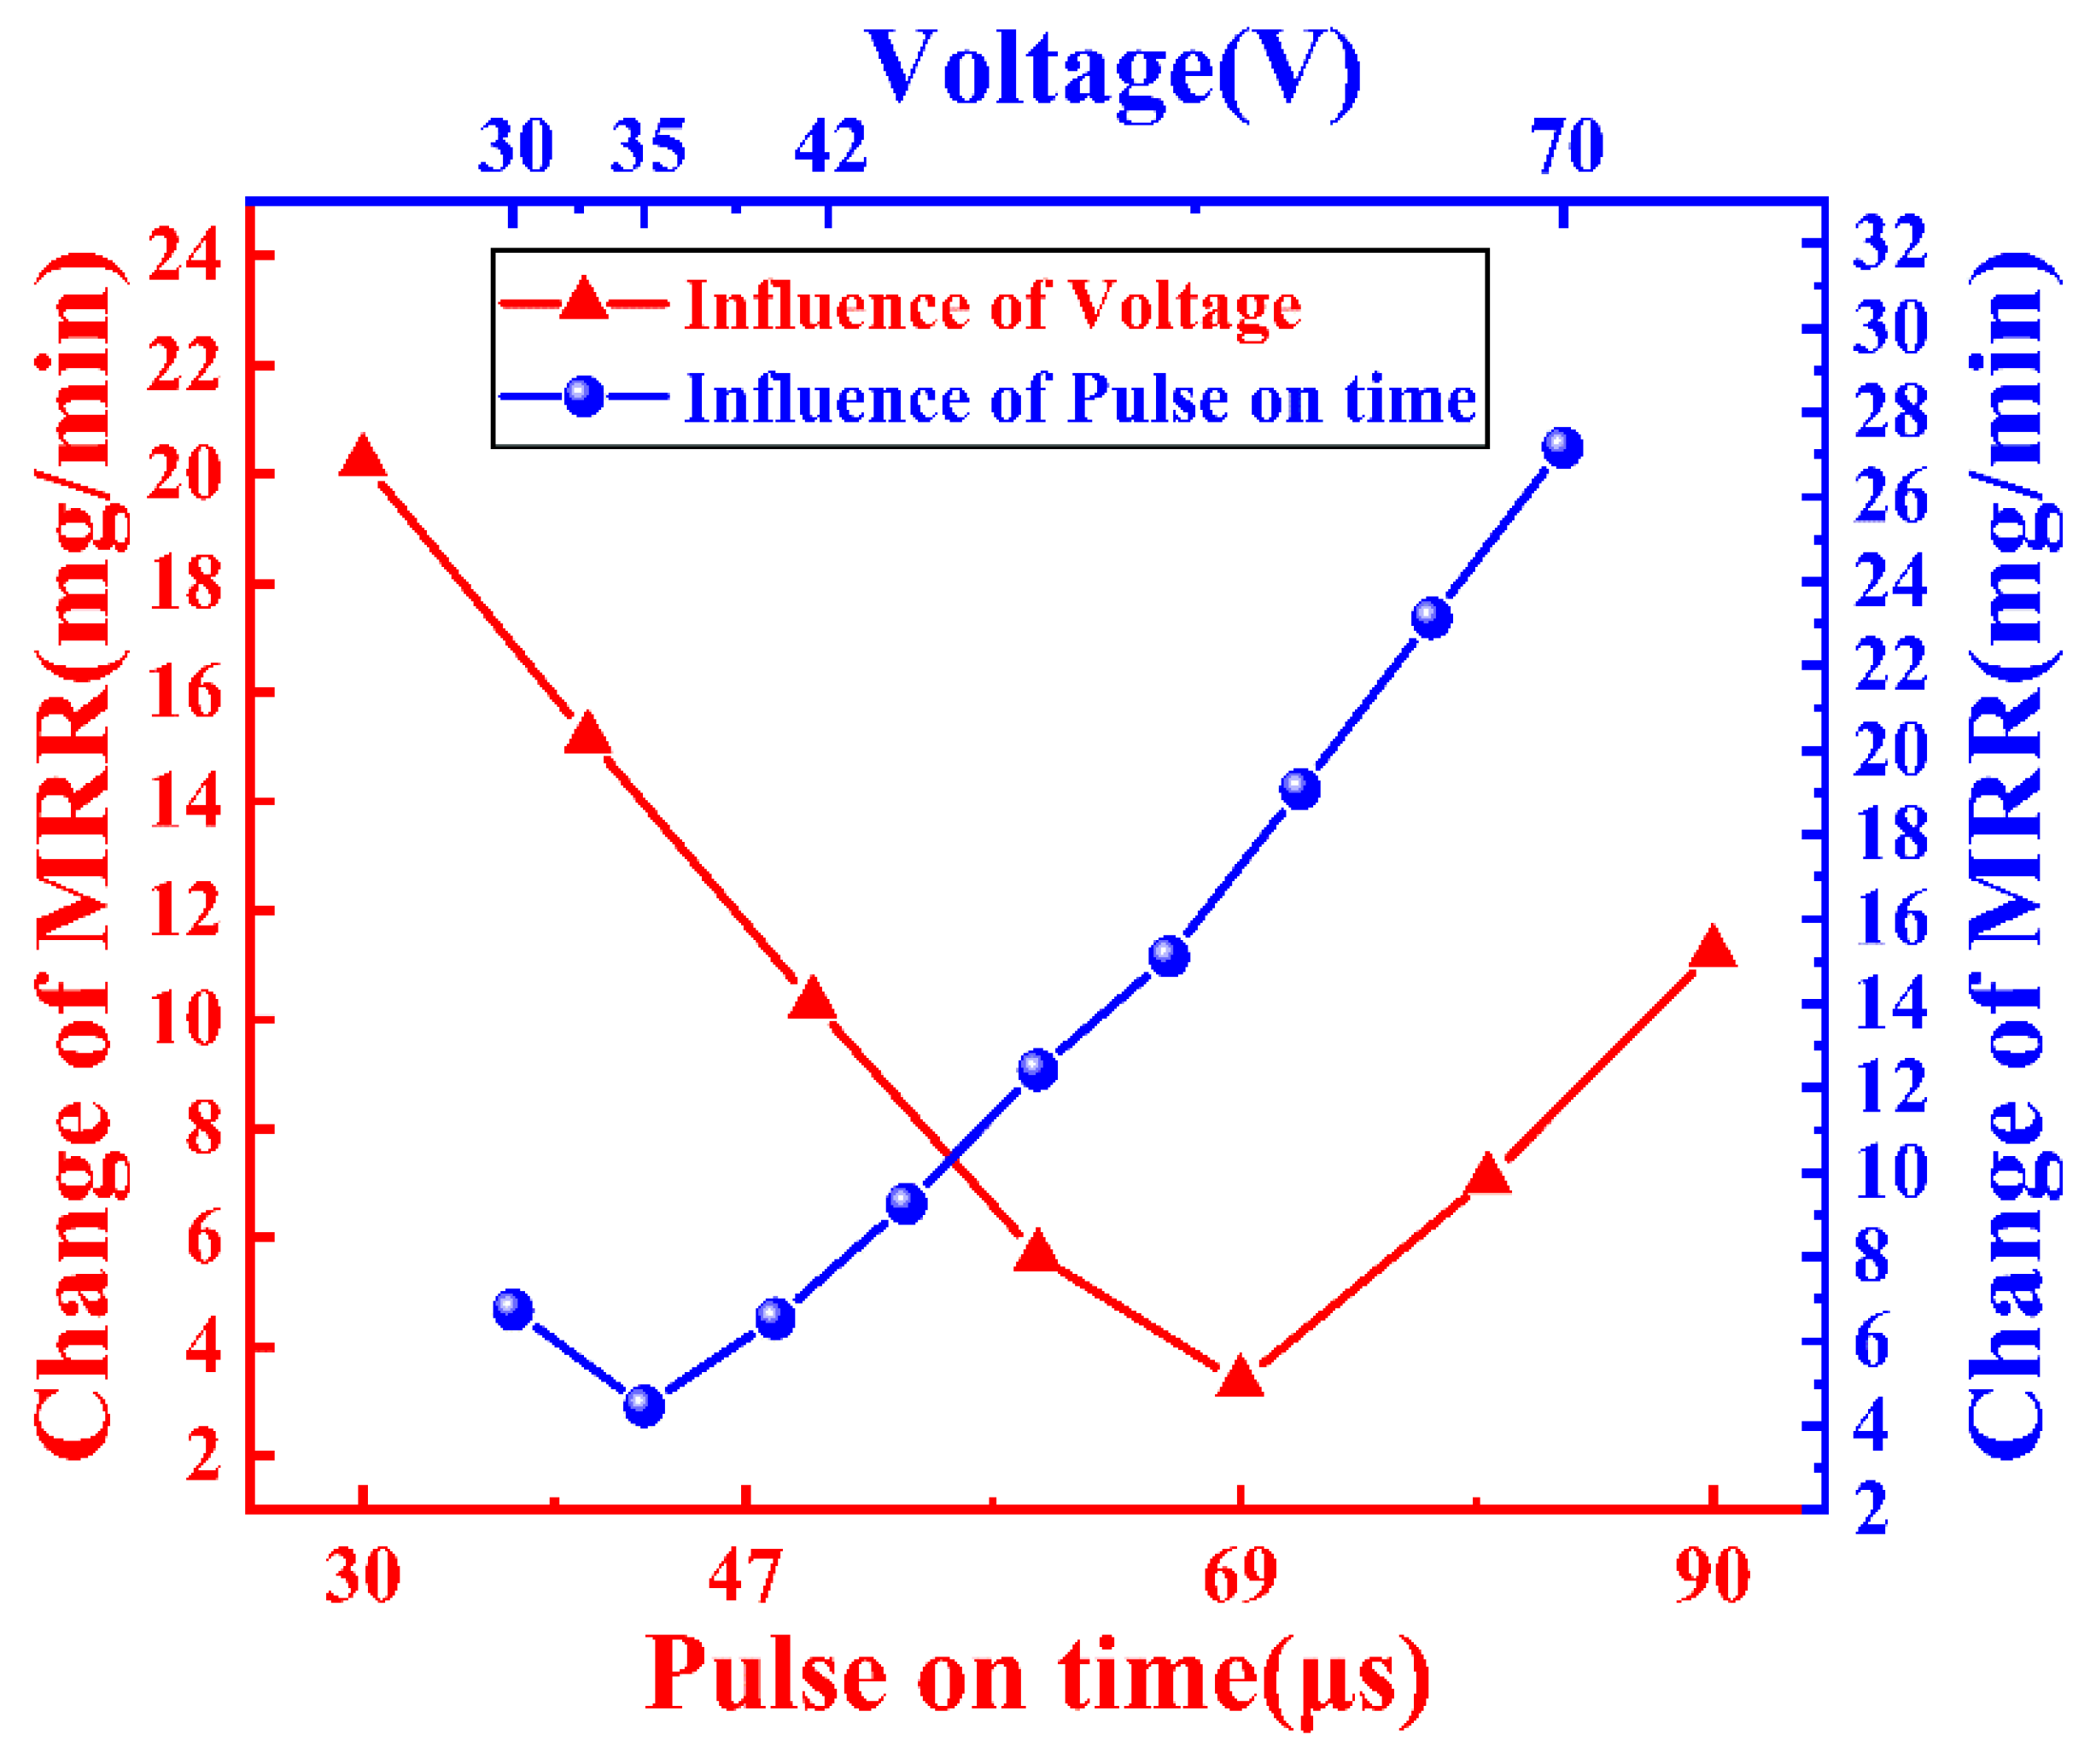
The interaction curve of pulse on time and voltage on MRR is shown in
Figure 7. The horizontal axis at the top is the value of voltage. The vertical axis on the right side is the change in MRR due to the change in pulse on time when the voltage is set at the corresponding value shown by the horizontal axis. The curve is marked as the influence of pulse on time. Using the same method, the curve representing the change in MRR with the variation of voltage under a certain value of pulse on time is drawn and shown in
Figure 7, marked as the influence of voltage.
4.3.1. Significance of Voltage on the MRR
It can be seen that the significance of the influence of voltage on MRR decreases and then increases as the pulse on time increases. When the value of pulse on time is 30 µs, △
Ton(
U) reaches a maximum of 20.24 mg/min. When the value of pulse on time is 69 µs, △
Ton(
U) is at its minimum of 3.35 mg/min. The △
Ton U is 16.89 mg/min, as listed in
Table 2. In addition, when the value of pulse on time is 90 µs, the △
Ton(
U) is 11.24 mg/min.
When the pulse on time is set to a certain value, changing the reference voltage leads to a change in the distance between the poles. As a result, the deionisation of the dielectric and the breakdown delay time of a single pulse discharge will be affected.
When the pulse on time is 30 μs, the discharge energy is low, and the corrosion product and residual heat are small. Their dissipation is sufficient, and the dielectric is pure. When the voltage is varied between 30 V and 70 V, the dielectric can respond to the diffusion of corrosion product and residual heat quickly. On the other hand, the breakdown delay time is large due to the weak breakdown effect of the previous discharge. When the voltage becomes larger, the control system of the EDM machine tool increases the breakdown delay time to make the average voltage between poles equal to the set value. As a result, the effective machining time within a period of discharge will be decreased further. Pulse periods without breakdown are more likely to occur under high voltage conditions.
Figure 8 shows the waveform of discharge voltage and discharge current under different pulse on times and voltages.
Figure 8a,b shows waveforms at a pulse on time of 30 μs. The discharge is continuous and uniform in the case of low voltage (
Figure 8a); however, continuous pulse periods without breakdown can be observed in the case of high voltage (
Figure 8b). Thus, the effect of voltage on MRR is significant under conditions with a low pulse on time.
As the pulse on time gradually increases to 69 μs, the energy of the pulse discharge gradually increases [
31]. The residual corrosion products and residual heat gradually increase. The dissipation ability of the dielectric weakens gradually. The dielectric deteriorates gradually. The energy consumed by the corrosion products gradually increases. The utilization of the energy is reduced gradually. As a result, the significance of the effect of voltage on MRR is gradually weakens with the gradual increase in the pulse on time to a dielectric value.
Thereafter, with the increase of pulse on time up to 90 μs, the heat in the inter-polar dielectric increases significantly, and the breakdown effect due to the previous discharge becomes obvious. As shown in
Figure 8, the breakdown delay time is clearly shorter at higher pulse on times (
Figure 8c,d) compared with the corresponding low pulse on time (
Figure 8a,b). Moreover, discharge concentration is limited due to the poor diffusion conditions of the dielectric under low voltage. However, it can be improved significantly due to improvement of the heat diffusion conditions under a higher voltage and a larger distance between poles. Consequently, the significance of the effect of voltage on MRR increases gradually as the pulse on time increases.
4.3.2. Significance of Pulse on Time on the MRR
As shown in
Figure 7, the significance of the influence of pulse on time on MRR decreases and then increases as the voltage increases. When the value of voltage is 70 V, △
U(
Ton) reaches a maximum of 27.18 mg/min. When the value of voltage is 35 V, △
U(
Ton) is at its minimum of 4.47 mg/min. The △
U Ton is 22.71 mg/min, as listed in
Table 2. In addition, when the value of voltage is 30 V, the △
U(
Ton) is 6.74 mg/min.
When the voltage is 30 V, the discharge gap is small. The residual heat and corrosion products are dissipated not sufficiently. In this case, if the corrosion products and residual heat are appropriate in the discharge gap, the breakdown of the dielectric is easy, which will be favourable to the improvement of the MRR. However, if there are too many residual corrosion products and heat in the discharge gap, the utilization of the discharge energy will deteriorate, which will go against the improvement of the MRR.
Figure 8a,c show discharge waveforms under a voltage of 30 V. It can be seen that the breakdown delay time is longer, which might be due to the weak breakdown effect when the pulse on time is 30 μs (
Figure 8a), caused by less remaining heat and corrosion products. However, the breakdown delay time is shorter when the pulse on time is 90 μs, as shown in
Figure 8c. This might be due to the obvious breakdown effect of the remaining heat and corrosion products after the previous pulse discharge. The pulse on time influences the pulse discharge energy, the residual heat, and the residual corrosion product. The pulse discharge energy increases with the increase of pulse on time; however, the utilization of the energy will become insufficient due to the poor condition of the dielectric. Likewise, the decrease of pulse on time will result in a decrease of energy and an improvement of its sufficient utilization. Therefore, the influence of pulse on time on MRR is not significant under a voltage of 30 V.
When the voltage increases to 35 V, the discharge gap increases slightly. The dissipation of discharge energy increases slightly. The breakdown delay time increases slightly. The significance of the effect of pulse on time on MRR becomes less significant.
As the voltage increases to 70 V, the discharge gap becomes larger. The positive effect of the previous pulse discharge on the subsequent one becomes weaker. Furthermore, to maintain the average voltage at a higher level, the control system of the machine tool increases the breakdown delay time, which shortens the duration of a single pulse discharge and decreases the effective utilization of the energy. In this case, pulses without breakdown are more likely to occur. Comparing
Figure 8b,d, it can be seen that the utilization of the pulse energy is not sufficient due to the continuous waveform without breakdown in the case of high voltage and short pulse on time (
Figure 8b). However, the discharge frequency is higher under the condition of high voltage and long pulse on time (
Figure 8d). In conclusion, the significance of the effect of pulse on time on MRR increases as it affects deionisation, effective breakdown frequency, and the effective time of a single pulse discharge.
4.4. Interaction of Pulse off Time and Voltage on the MRR
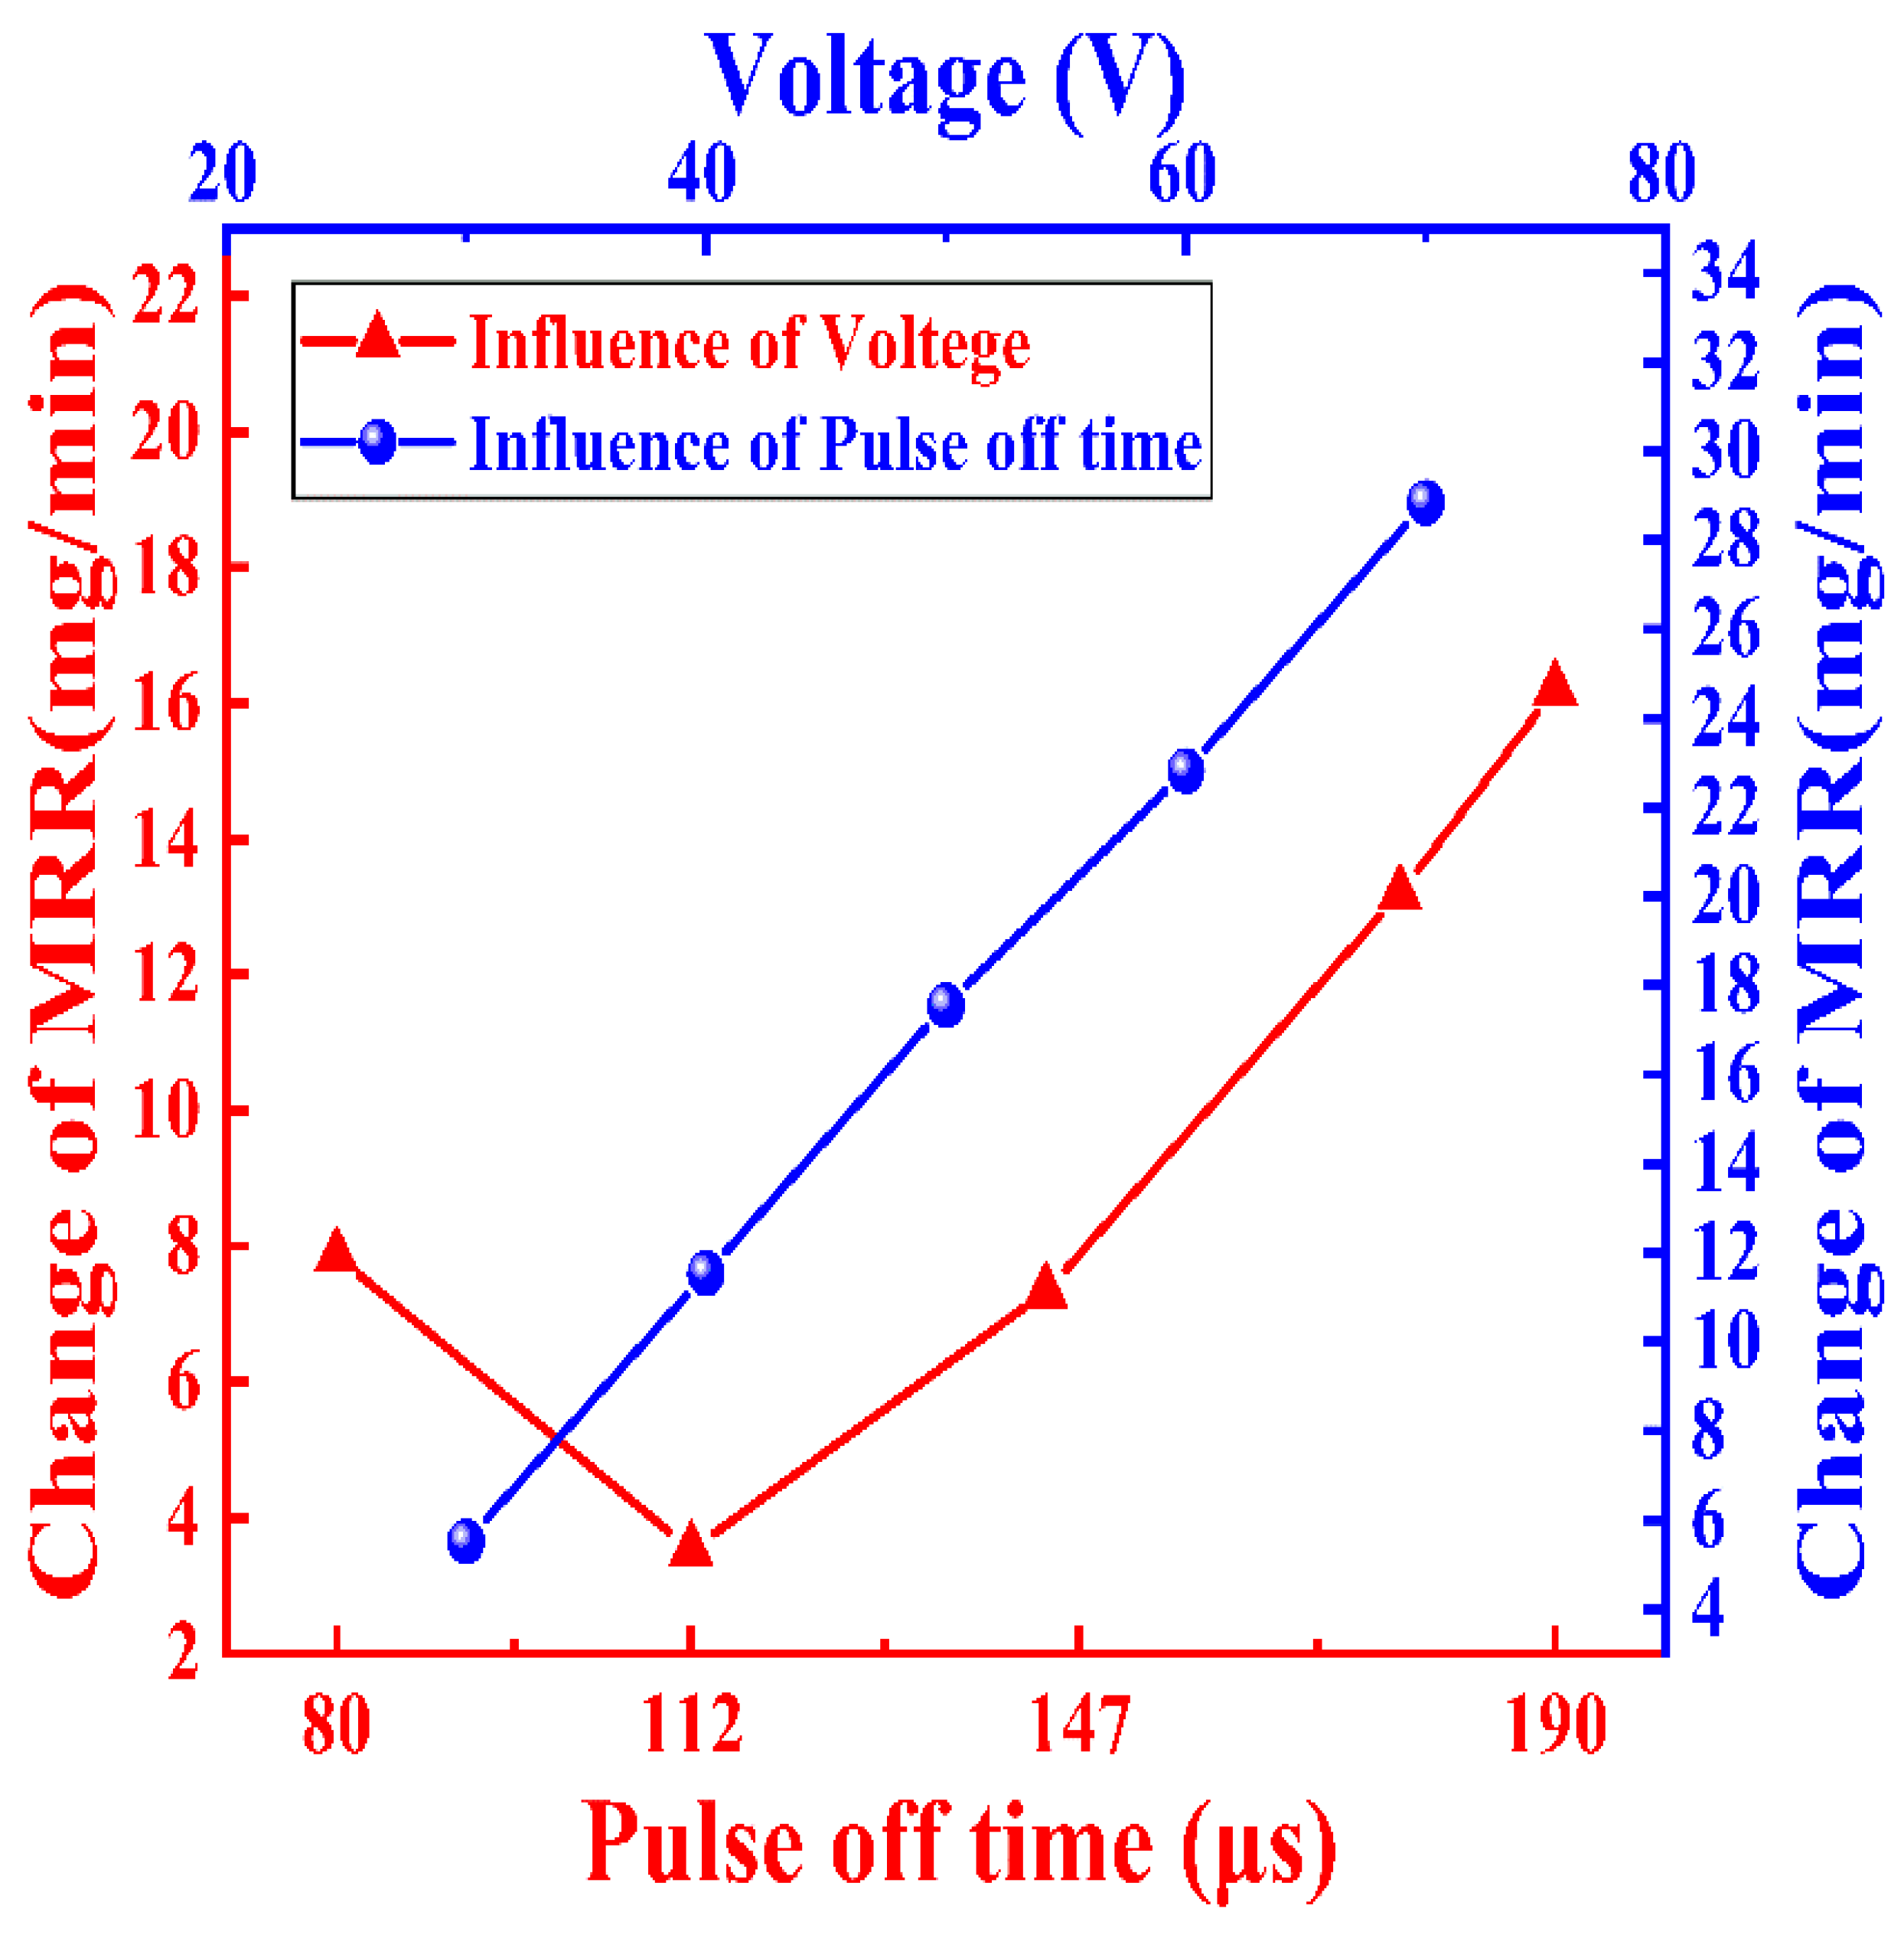
The interaction curve of pulse off time and voltage on MRR is shown in
Figure 9. The horizontal axis at the top is the value of voltage. The vertical axis on the right side is the change in MRR due to the change in pulse off time when the voltage is set at the corresponding value shown by the horizontal axis. The curve is marked as the influence of pulse off time. Using the same method, the curve representing the change in MRR with the variation in voltage under a certain value of the pulse off time is drawn and shown in
Figure 9, marked as the influence of voltage.
4.4.1. Significance of Voltage on the MRR
It can be seen that the significance of the influence of voltage on MRR decreases and then increases as the pulse off time increases. △
Toff(
U) reaches a maximum of 16.21 mg/min when the value of pulse off time is 190 µs, and △
Toff (
U) is at its minimum of 3.52 mg/min when the value of pulse off time is 112 µs. The △
Toff U is 12.69 mg/min, as listed in
Table 2. In addition, when the value of pulse off time is 80 μs, the △
Toff(
U) is 7.85 mg/min.
The pulse off time affects the deionisation time and discharge frequency [
28]. The deionisation time affects the residual corrosion products and heat from the previous discharge. If the deionisation time is appropriate, proper corrosion products and heat will be conducive to the formation of the plasma channel, and the discharge energy will be used effectively. However, excessive residual corrosion products and heat will seriously deteriorate the dielectric, and the energy will not be used effectively.
Voltage affects the distance between the poles and the breakdown delay time. The distance affects the deionisation of the dielectric and the diffusion of the pulse energy. When the distance increases, it helps to reduce the density of the corrosion products and residual heat in the inter-polar dielectric and increases diffusion. The breakdown delay time affects deionisation and the utilization of discharge energy. When the breakdown delay time is increased by the control system of the machine tool, the effective pulse discharge time is shortened, while the deionisation time is prolonged.
Based on the above, an analysis is conducted on the significance of the effect of voltage on the MRR with the variation of the pulse off time, considering the waveform of discharge voltage and discharge current, as shown in
Figure 10.
When the pulse off time is 80 μs, the deionisation time is short. The material removal process will be affected by the previous discharge due to the residual heat and corrosion product. The breakdown delay time is short, and the diffusion resistance of the discharge energy is large. The dielectric will be affected significantly by the voltage. As a result, the MRR will be significantly affected by the voltage.
When the pulse off time increases from 80 to 112 μs, the deionisation time prolongs. The residual heat and corrosion products are gradually reduced, and the diffusion condition of the dielectric improves. The effect of voltage on MRR decreases with of the increase in pulse off time.
When the pulse off time increases from 112 to 190 μs, the discharge frequency is reduced further and deionisation becomes more sufficient. The effect of voltage on the residual heat and corrosion products becomes weakened. However, the average voltage between the poles becomes significantly lower than the reference voltage as pulse off time increases. The machine tool increases the breakdown delay time to prolong the average voltage. This will result in a decrease in discharge time in a single pulse. Moreover, the discharge frequency will be reduced significantly due the dielectric not being broken down effectively. As shown in
Figure 10d, pulses without breakdown can be easily observed under conditions of high voltage and long pulse off time. Thus, the significance of the influence of voltage on MRR increases with the increase in pulse off time from 112 to 190 μs.
4.4.2. Significance of Pulse off Time on the MRR
According to
Figure 9, it can also be found that the significance of the influence of pulse off time on MRR increases with the increase in voltage. When the value of voltage is 70 V, △
U(
Toff) reaches a maximum of 28.84 mg/min. When the value of voltage is 30 V, △
U(
Toff) is at its minimum of 5.51 mg/min. The △
U Toff is 23.33 mg/min, as listed in
Table 2.
When the voltage is 30 V, the distance between the electrode and the workpiece is small. The dissipation of the energy is less. The pulse off time affects the deionisation and the discharge frequency. An improvement in deionisation time and a decrease in frequency will be induced along with an increase in the pulse off time, and vice verse. The improvement of the deionisation favours the increase of MRR. However, the decrease in discharge frequency is not conducive to the increase of MRR. Therefore, the effect of pulse off time on MRR is less significant when the voltage is low.
When the voltage is 70 V, the machine tool increases the breakdown delay time to increase the average voltage. Deionisation is improved, and the densities of residual corrosion products and heat are reduced. The effect of pulse off time on deionisation is weakened. However, pulse off time affects the utilization of the discharge energy effectively. As shown in
Figure 10, the utilization of the discharge energy under higher voltages (
Figure 10b and
Figure 10d) is obviously less than that under the corresponding lower voltages (
Figure 10a and
Figure 10c), respectively. Moreover, when the voltage is 70 V, the MRR under a long pulse off time (
Figure 10d) will be significantly lower than that under a short pulse off time (
Figure 10b) due to the insufficient utilization of discharge energy. Thus, the significance of the effect of pulse off time on MRR increases with the increase in voltage.
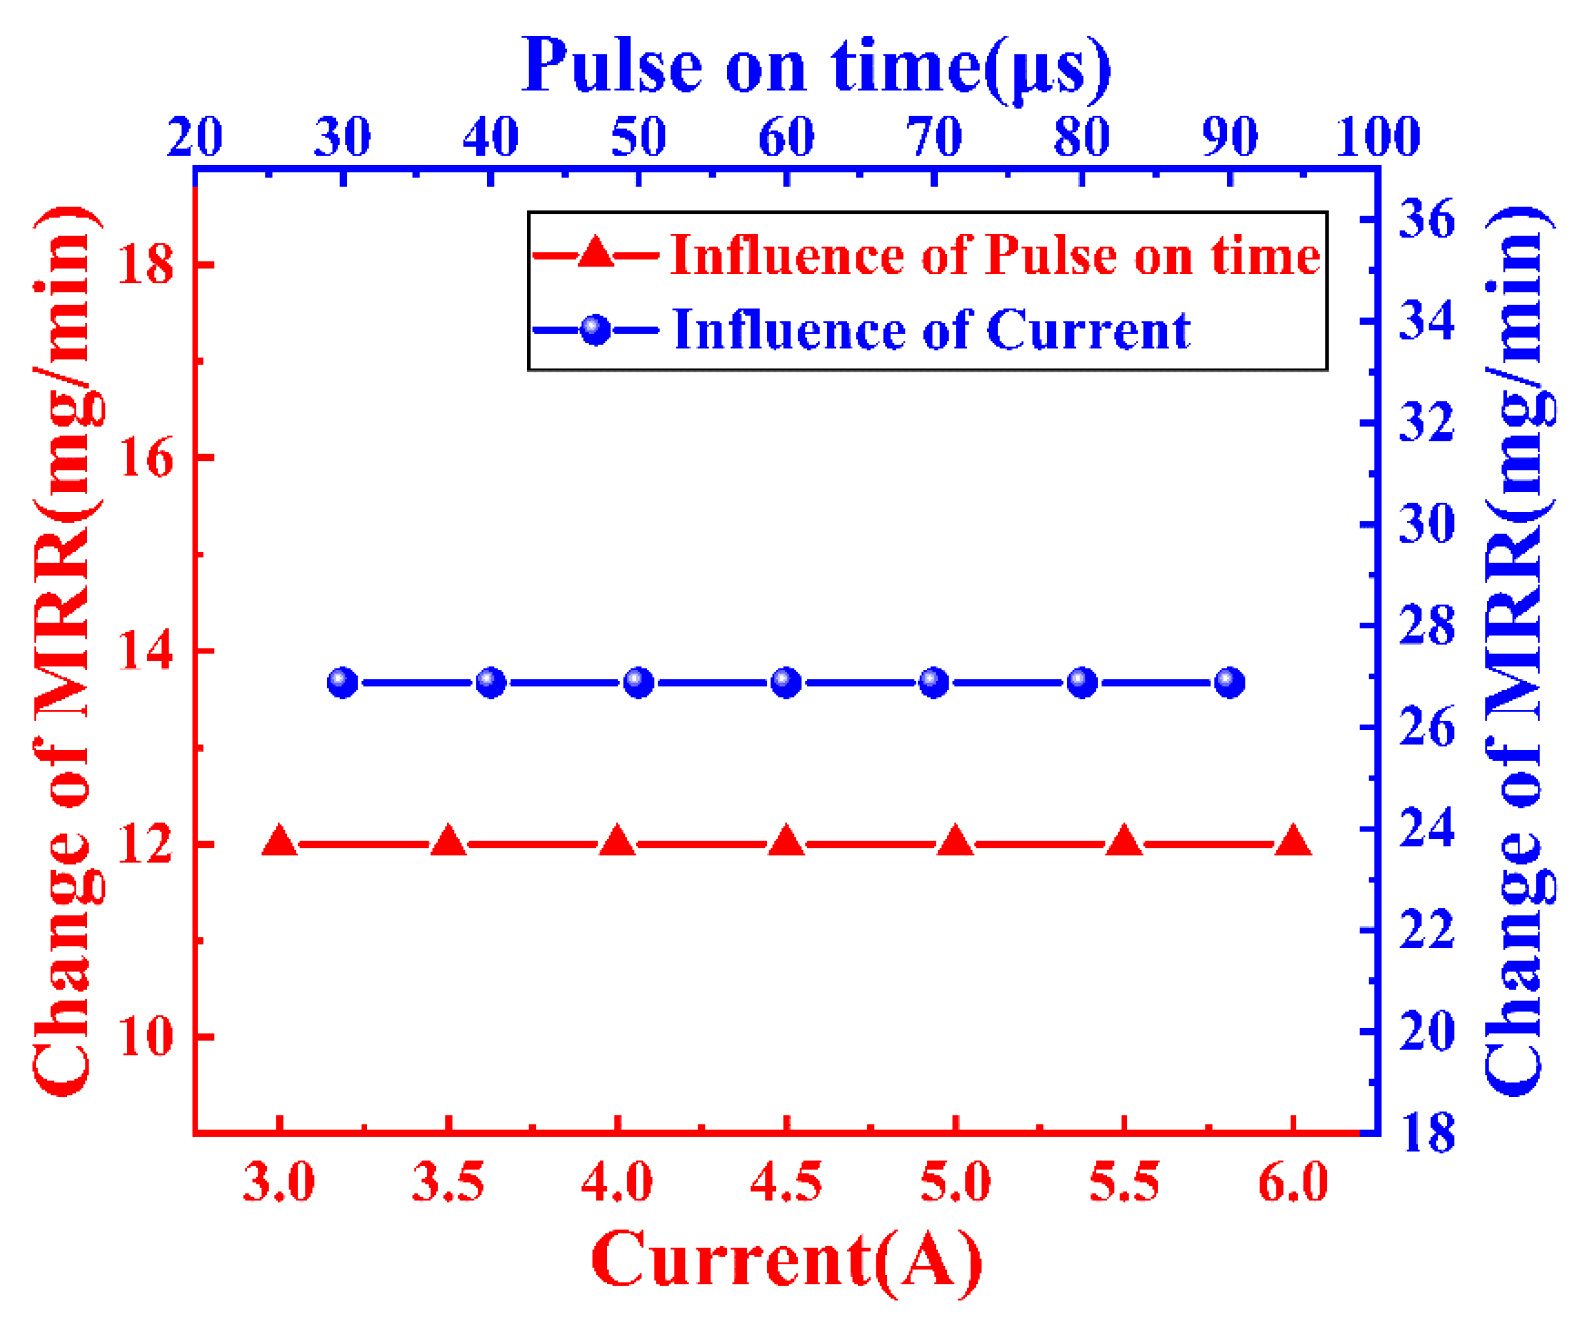
4.5. Interaction of Pulse on Time and Current on the MRR
The interaction curve of current and pulse on time on MRR is shown in
Figure 11. The horizontal axis at the top is the value of pulse on time. The vertical axis on the right side is the change in MRR due to the change in current when the pulse on time is set at the corresponding value shown by the horizontal axis. The curve is marked as the influence of current. Using the same method, the curve representing the change in MRR with variation in pulse on time under a certain value of the current is drawn and shown in
Figure 11, marked as the influence of pulse on time.
The △
Ton(
I) is 26.87 mg/min when the pulse on time is set at different values, and the △
I(
Ton) is 12.00 mg/min when the current is set at different values. This means that changes in current do not affect the influence of pulse on time on MRR. Meanwhile, changes in pulse on time also do not affect the influence of current on MRR. Therefore, there is no interaction between current and pulse on time on MRR. Both △
Ton I and △
I Ton are 0 mg/min, as listed in
Table 2.
The reasons can be explained as follows. When the current is set at a certain value, the change in pulse on time, on one hand, leads to a change in the discharge time of a single pulse. As a result, the pulse discharge energy per unit of time changes. On the other hand, the change in pulse on time leads to a change in the amount of residual heat and corrosion products, which in turn influences the diffusion capacity of the inter-polar dielectric. Therefore, pulse on time affects MRR through the two mechanisms mentioned above, which affects MRR on the contrary. Specifically, the discharge time increases with the increase in pulse on time, which is favourable to the increase of MRR. Meanwhile, more residual heat and corrosion products will be generated in the discharge gap, which will deteriorate the dielectric and be unfavourable to the improvement of MRR. Similarly, discharge time and residuals decrease with an decrease in pulse on time. Therefore, variations in pulse on time do not result in a significant change in MRR. In other words, the significance of the effect of pulse on time on MRR is not influenced by the current. It is well known that discharge energy is significantly affected by pulse on time and current. Similar to the above analysis, the significance of the effect of current on MRR does not change significantly with changes in pulse on time. As a result, there is no interaction between the influence of current and pulse on time on the MRR.
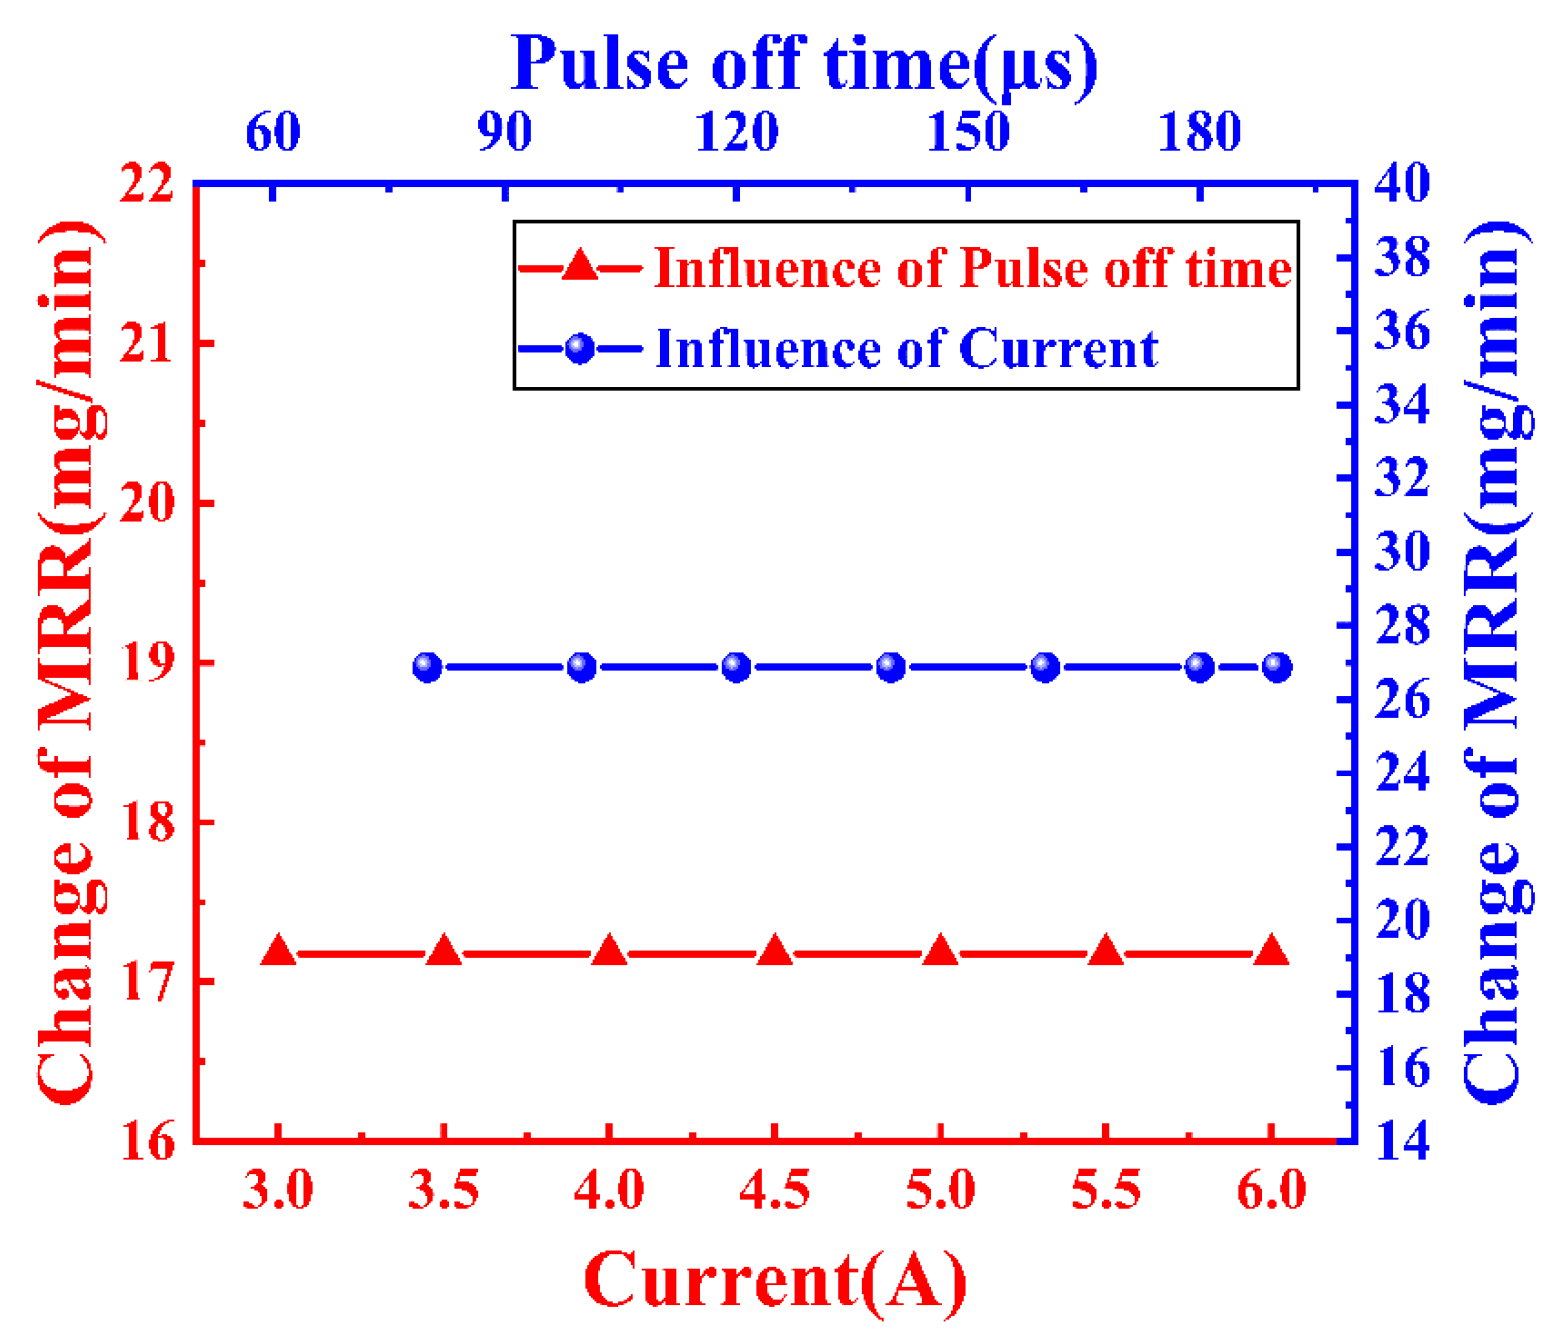
4.6. Interaction of Pulse off Time and Current on the MRR
The interaction curve of current and pulse off time on MRR is shown in
Figure 12. The horizontal axis at the top is the value of pulse off time. The vertical axis on the right side is the change in MRR due to the change in current when the pulse off time is set at the corresponding value shown by the horizontal axis. The curve is marked as the influence of current. Using the same method, the curve representing the change in MRR with variations in pulse off time under a certain value of current is drawn and shown in
Figure 12, marked as the influence of pulse off time.
The △
Toff(
I) is 26.87 mg/min when the pulse off time is set at different values, and the △
I (
Toff) is 17.18 mg/min when the current is set at different values. Therefore, there is no interaction between current and pulse off time on MRR. Both △
Toff I and the △
I Toff are 0 mg/min, as listed in
Table 2.
The reasons can be explained as follows. When the current is set at a certain value, pulse off time influences the discharge frequency and then the discharge energy per unit time. On the other hand, pulse off time influences the deionisation time and then the utilization of the pulse discharge energy. The above two will result in the variation of MRR, which will be opposite to each other. Specifically, the discharge frequency increases with the decrease in pulse off time, which will be favourable to the improvement of MRR. However, more residual heat and corrosion products remain in the discharge gap. The deionisation ability of the inter-polar dielectric deteriorates and there will be more secondary discharges. As a result, the utilization of energy will be decreased, which will be unfavourable to the increase of MRR. Conversely, the discharge frequency decreases with the increase of pulse off time, which will be unfavourable to the improvement of MRR and the utilization of energy will be increased, which will be favourable to the increase of MRR. Thus, there is no obvious change in MRR with changes in pulse off time. Namely, the significance of the effect of the pulse off time on MRR is not influenced by current.
The significance of the effect of the current on MRR is not influenced by pulse off time. As analysed in
Section 4.5, discharge energy increases with the increase in current, which is favourable to the increase of MRR; however, the utilization of energy will be decreased, which will be unfavourable to the improvement of MRR. In summary, there is no interaction between current and pulse off time on the MRR.


