Article

Integrated Physical Microstructure and Mechanical Performance Analysis of the Failure Mechanism of Weakly Cemented Sandstone Under Long-Term Water Immersion

Center of Rock Instability and Seismicity Research, School of Resources and Civil Engineering, Northeastern University, Shenyang 110819, China
*
Authors to whom correspondence should be addressed.
Appl. Sci. 2025, 15(9), 4777; https://doi.org/10.3390/app15094777
Submission received: 17 February 2025 / Revised: 16 April 2025 / Accepted: 23 April 2025 / Published: 25 April 2025

Abstract

:
The duration of water immersion significantly affects the mechanical response of rock materials. This study investigated the weakly cemented sandstone from the Wulagen Open-pit Mine to examine how varying immersion times affected the mineral composition, micro-porous structure, and macro-mechanical properties of the sandstone. The current study aimed to explore the mechanisms underlying the degradation of the strength and deformability of sandstone due to prolonged water exposure. The analysis showed that immersion time notably influenced the pore structure as well as the mineralogical characteristics of weakly cemented sandstone. These changes were the primary factors leading to alterations in its mechanical properties and failure modes. Specifically, with increasing immersion time, clay minerals absorbed water and expanded, with the most significant expansion occurring between 30 and 60 days. This rapid internal crack growth led to an exponential decrease in compressive strength and elastic modulus, with the most significant decline occurring between 30 and 60 days. The failure mode of the sandstone transitioned from extensional fracture to shear failure. Acoustic emission analysis revealed that, in the dry state, tensile cracks were about three times more prevalent than shear cracks, while after 60 days of immersion, shear cracks accounted for over 80%. After 60 days of immersion, microscopic cracks were fully interconnected, and the mechanical properties of the sandstone showed minimal change, with shear failure becoming predominant. These experimental results provide theoretical guidance for preventing the collapse of slopes composed of weakly cemented rock under long-term immersion conditions.

1. Introduction

Accelerated economic growth has led to a significant surge in the demand for mineral resources, necessitating the exploration of deeper resources. This shift results in increasingly complex hydrogeological conditions, often producing substantial amounts of mine water, which can significantly affect mining operations and safety. Water-induced geological disasters, such as landslides, are a major concern in many mining regions. For instance, over 90% of landslides in China are attributed to water [1,2], with incidents like those at the Fushun West open-pit mine highlighting the risks associated with seepage [3,4]. Therefore, studying the weakening mechanisms of rock masses under prolonged water immersion is essential for understanding landslide mechanisms and ensuring mine safety.
Research on the water-induced softening of sandstone has advanced, with several researchers focusing on a macro perspective, investigating basic mechanical indicators, including compressive strength, tensile strength, energy evolution, and failure modes. Zhang et al. investigated how moisture content influences the energy transformation in red sandstone by conducting axial loading and unloading tests. In their research, both the distribution and progression of inherent elastic energy and energy dissipation were assessed [5]. Kim et al. measured both dynamic and static compressive and tensile strengths during variations in water content, providing an explanation of how water content influences the mechanical characteristics of sandstone from dynamic and static perspectives [6]. Li et al. examined how water content affects the distribution of the deformation characteristics of rocks under multidirectional compression [7,8], revealing that uneven water distribution primarily impacts cohesion, thereby influencing crack propagation. It is essential to integrate acoustic emission studies with research on fracture morphology and energy release related to water content in sandstone [9,10,11,12,13,14]. As research progresses, accurately describing alterations in pore structure becomes critical to understanding the mechanisms of water–rock interactions. Several researchers have employed techniques such as Nuclear Magnetic Resonance (NMR), X-ray Diffraction (XRD), Scanning Electron Microscopy (SEM), ultrasonic testing, and Computed Tomography (CT) imaging to comprehensively evaluate the alterations in mineral composition and pore structure in sandstone [15,16,17,18,19]. Studies have also examined the effects of acidic and alkaline water on pore structure and cementing materials in sandstone [20,21]. Therefore, understanding the water–pore–cementing material interactions in sandstone is essential for studying the hydration effects of sandstone.
Weakly cemented sandstone is a unique sandstone that has experienced late diagenesis, leading to poor cementation [22]. During groundwater seepage, the framework particles break down into smaller particles, altering the pore structure and increasing the permeability of sandstone [23,24,25,26]. Research on weakly cemented sandstone examines not only its basic macroscopic properties but also its mineral composition and other microscopic aspects, including the relationships between compressive strength, longitudinal wave velocity, strain, elastic modulus, porosity, and changes in mineral composition of the rock samples [27,28,29,30]. To gain a deeper understanding of the impacts of mineral composition on pores, some researchers have conducted comprehensive analyses of the evolution of microscopic pores in weakly cemented sandstone [22,31,32,33].
Despite different conclusions in the macro-, meso-, and micro-level studies of weakly cemented sandstone, its unique properties significantly impact mining operations. Therefore, analyzing the water–rock mechanisms in weakly cemented sandstone continues to be a topic of ongoing research. This study evaluated the weakly cemented sandstone in the southern slope landslide area of the Wulagen Open-pit Mine. Employing different monitoring methods, it examined the weakening mechanisms of weakly cemented sandstone under prolonged water immersion from macro, meso, and micro perspectives. Initially, thin section analysis and XRD testing were performed on sandstone samples at varying immersion durations to determine the variations in internal mineral composition. The variations in pore structure under different immersion times were analyzed using SEM. Next, uniaxial compression tests combined with acoustic emission monitoring were performed to observe the evolution of mechanical parameters in sandstone samples after different immersion periods. The failure mode served as a link to correlate micro, meso, and macro acoustic emission signals. Finally, the mechanistic reasons for all observed patterns were summarized.

2. Methodology

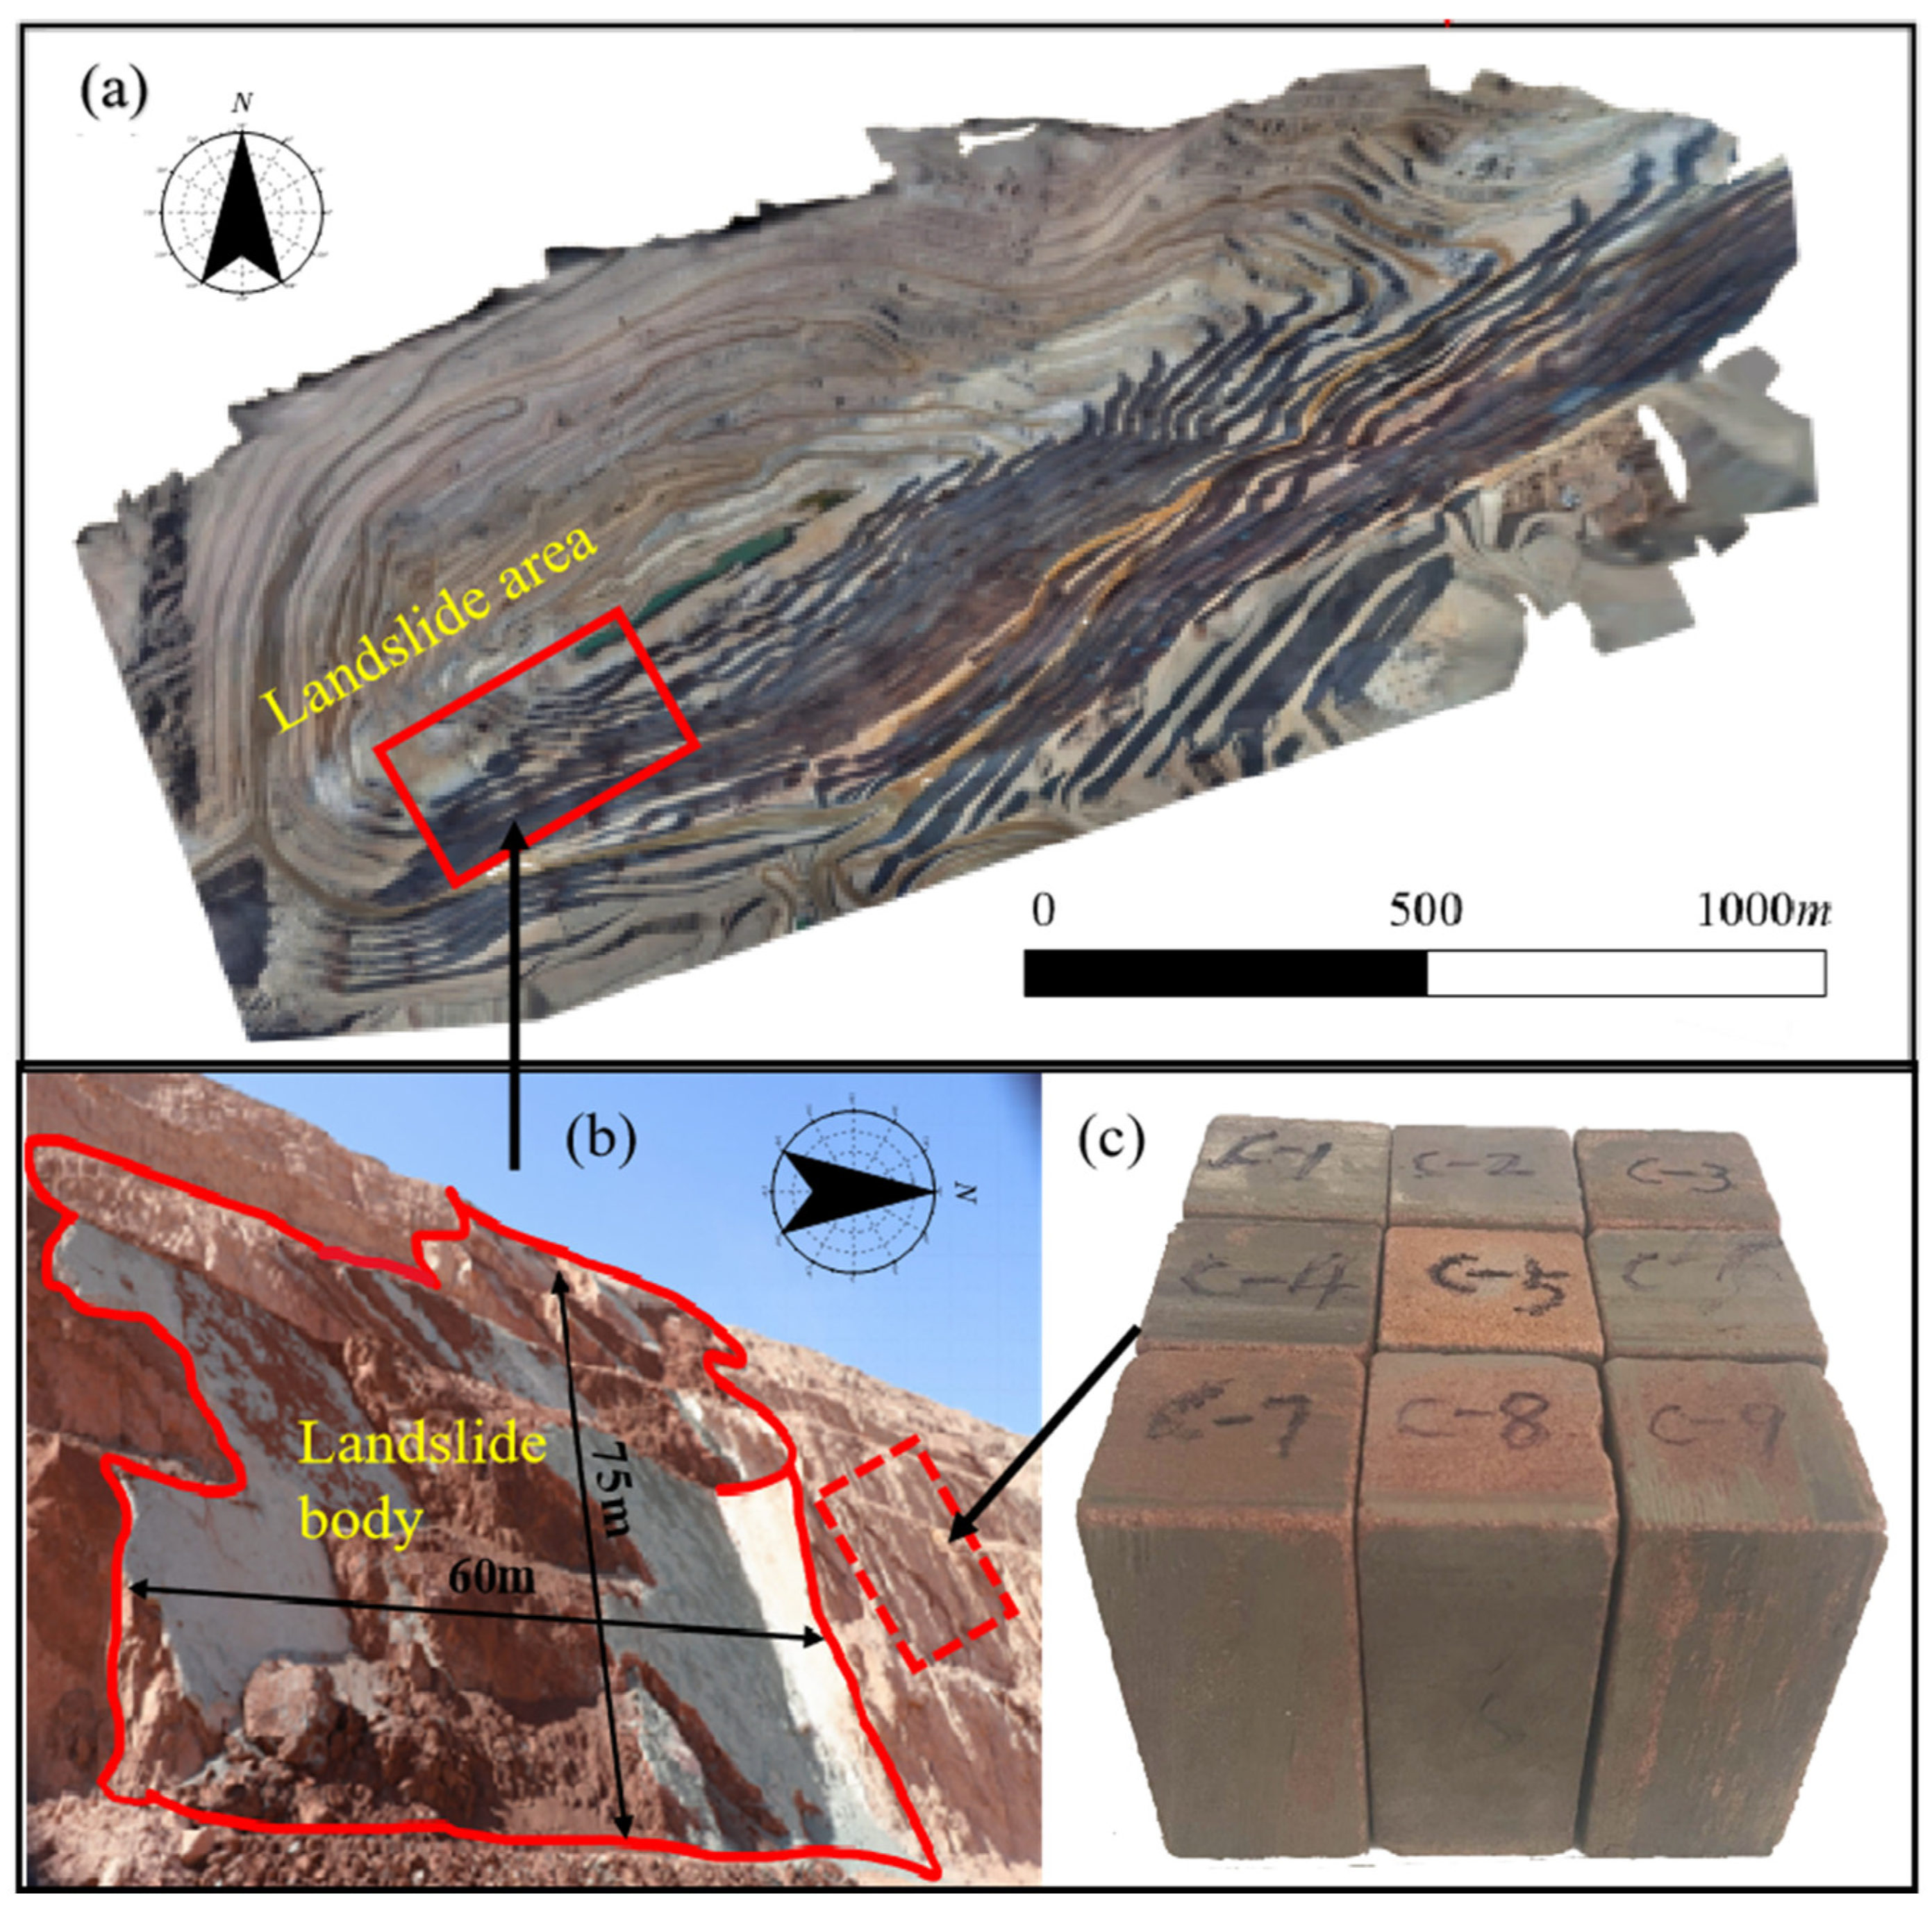
2.1. Preparation of Rock Samples

As shown in Figure 1a, the rock samples used in this study were sourced from the southern slope landslide area of the Wulagen Mine, Xinjiang (75°02′30″ E, 39°40′52″ N), Since the end of 2020, multiple wedge collapses have occurred on the southern ultimate pit wall steps of the open-pit mine. Figure 1b shows the specific landslide body within the landslide area; the landslide body is approximately 60 m in length and 75 m in height. Field investigations of the landslide area revealed a significant number of seepage points on the slope. The average measured seepage volume at the pit bottom was approximately 4600 m3/day, far exceeding the predicted inflow rate, and the rock’s average moisture level in this area was measured to be 2%. This suggests that the landslide is highly likely caused by prolonged water saturation. To verify the impact of water saturation on slope stability, dry feldspar sandstone samples were collected from the study area near the landslide region (Figure 1b). The feldspar sandstone samples have a medium to coarse-grained sandstone structure with medium to thick bedding. The composition mainly consists of quartz, feldspar, a small amount of rock fragments, and filling materials. The particles are well sorted, sub-rounded, and the maturity is low. The filling materials include needle-like gypsum and carbonate rock. The sandstone has a cemented type of porosity with flow-through pores, and some particles are suspended or loosely accumulated, classifying it as weakly cemented sandstone. Regarding porosity, although it was not directly measured in this experiment, according to the literature, the porosity of weakly cemented sandstone is typically around 30% [34,35].
According to the guidelines established by the International Society for Rock Mechanics, 18 feldspar sandstone blocks that met processing conditions were chosen. All samples were collected along the bedding direction to ensure the consistency and comparability of the experiment and processed into 50 mm × 50 mm × 100 mm cubes, with surface errors within 0.3 mm and intact surfaces. Some of the processed feldspar sandstone samples are shown in Figure 1c.
All feldspar sandstone samples were subjected to drying at a constant temperature of 105 °C for 48 h. This is a standard practice commonly used in the field for drying rock samples to ensure complete removal of moisture. After drying, the longitudinal wave velocity of the samples was measured using a ZT802 non-metallic ultrasonic testing analyzer. Fourteen samples exhibiting similar wave velocities were chosen for further physical and mechanical testing. The dried samples were then sealed in plastic wraps, and the masses were recorded of two dried samples, labeled A0-1 and A0-2, kept aside. As shown in Figure 2, the remaining twelve samples were placed in two desiccators, A1 and A2, with six samples in each desiccator. The samples were prepared using a saturated sodium chloride solution with a mass concentration of 26.4%.
Figure 3a illustrates the variations in moisture content of each sample under different immersion times, while the variations in average moisture content over time in desiccators A1 and A2 are depicted in Figure 3b. The moisture content showed a steady increase with longer immersion, which can be classified into three stages, beginning with a linear growth phase from 0 to 5 days with an average growth rate of 0.3% per day, a decelerating growth stage from 6 to 18 days, with growth rates ranging from 0.2% per day (6–9 days) to 0.55% per day (10–18 days), and a stabilization stage from 18 to 30 days, with the final moisture content of 2.4%.
The twelve rock samples from the two desiccators that reached stable moisture content were categorized into six groups based on similar moisture levels. These groups were then placed back into the desiccators for 0, 7, 14, 30, 60, and 90 days.

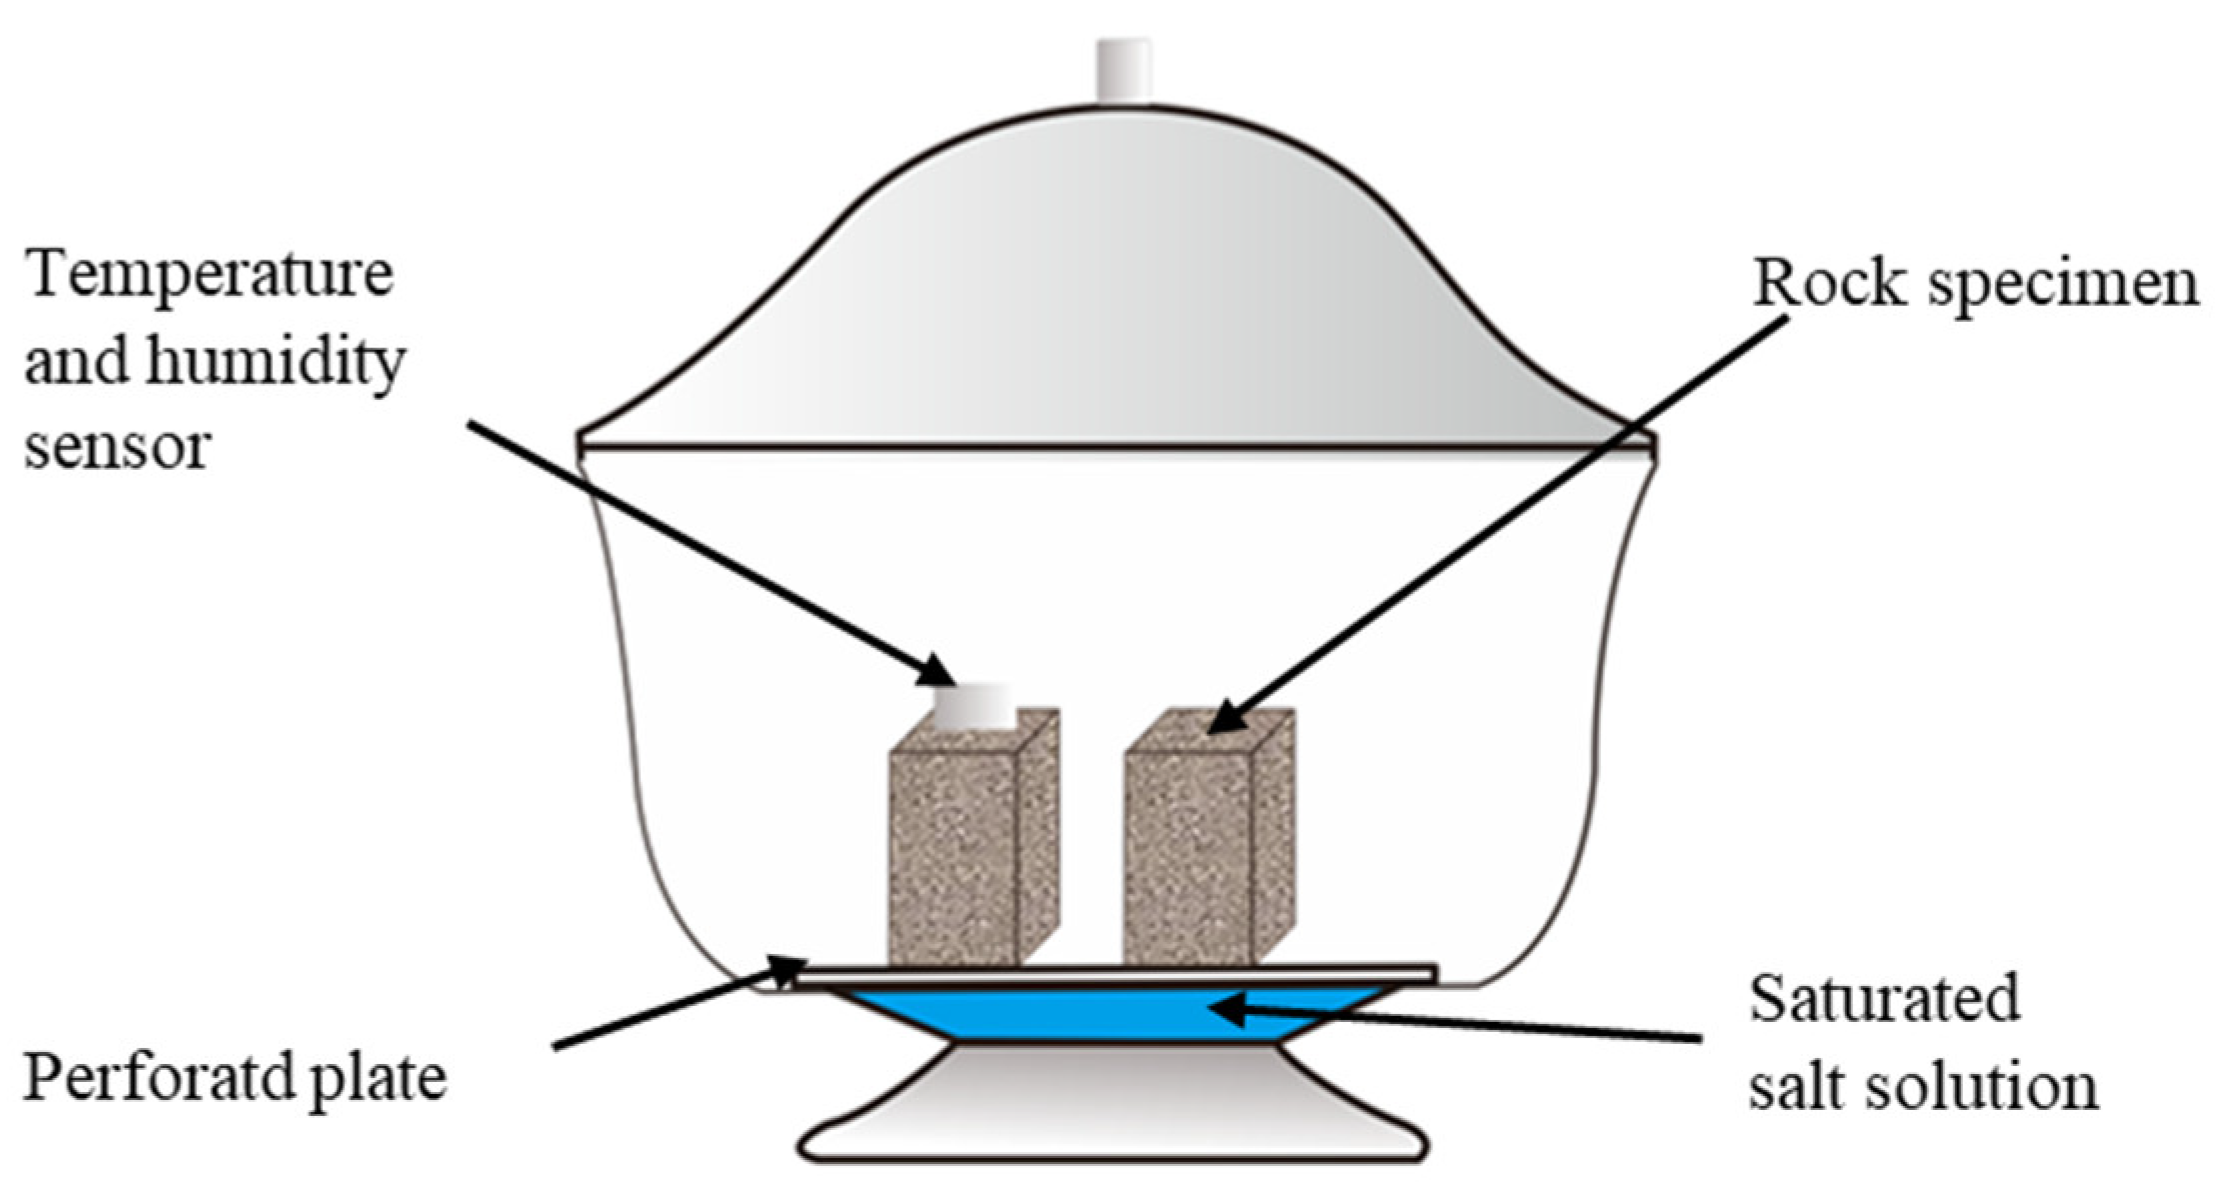
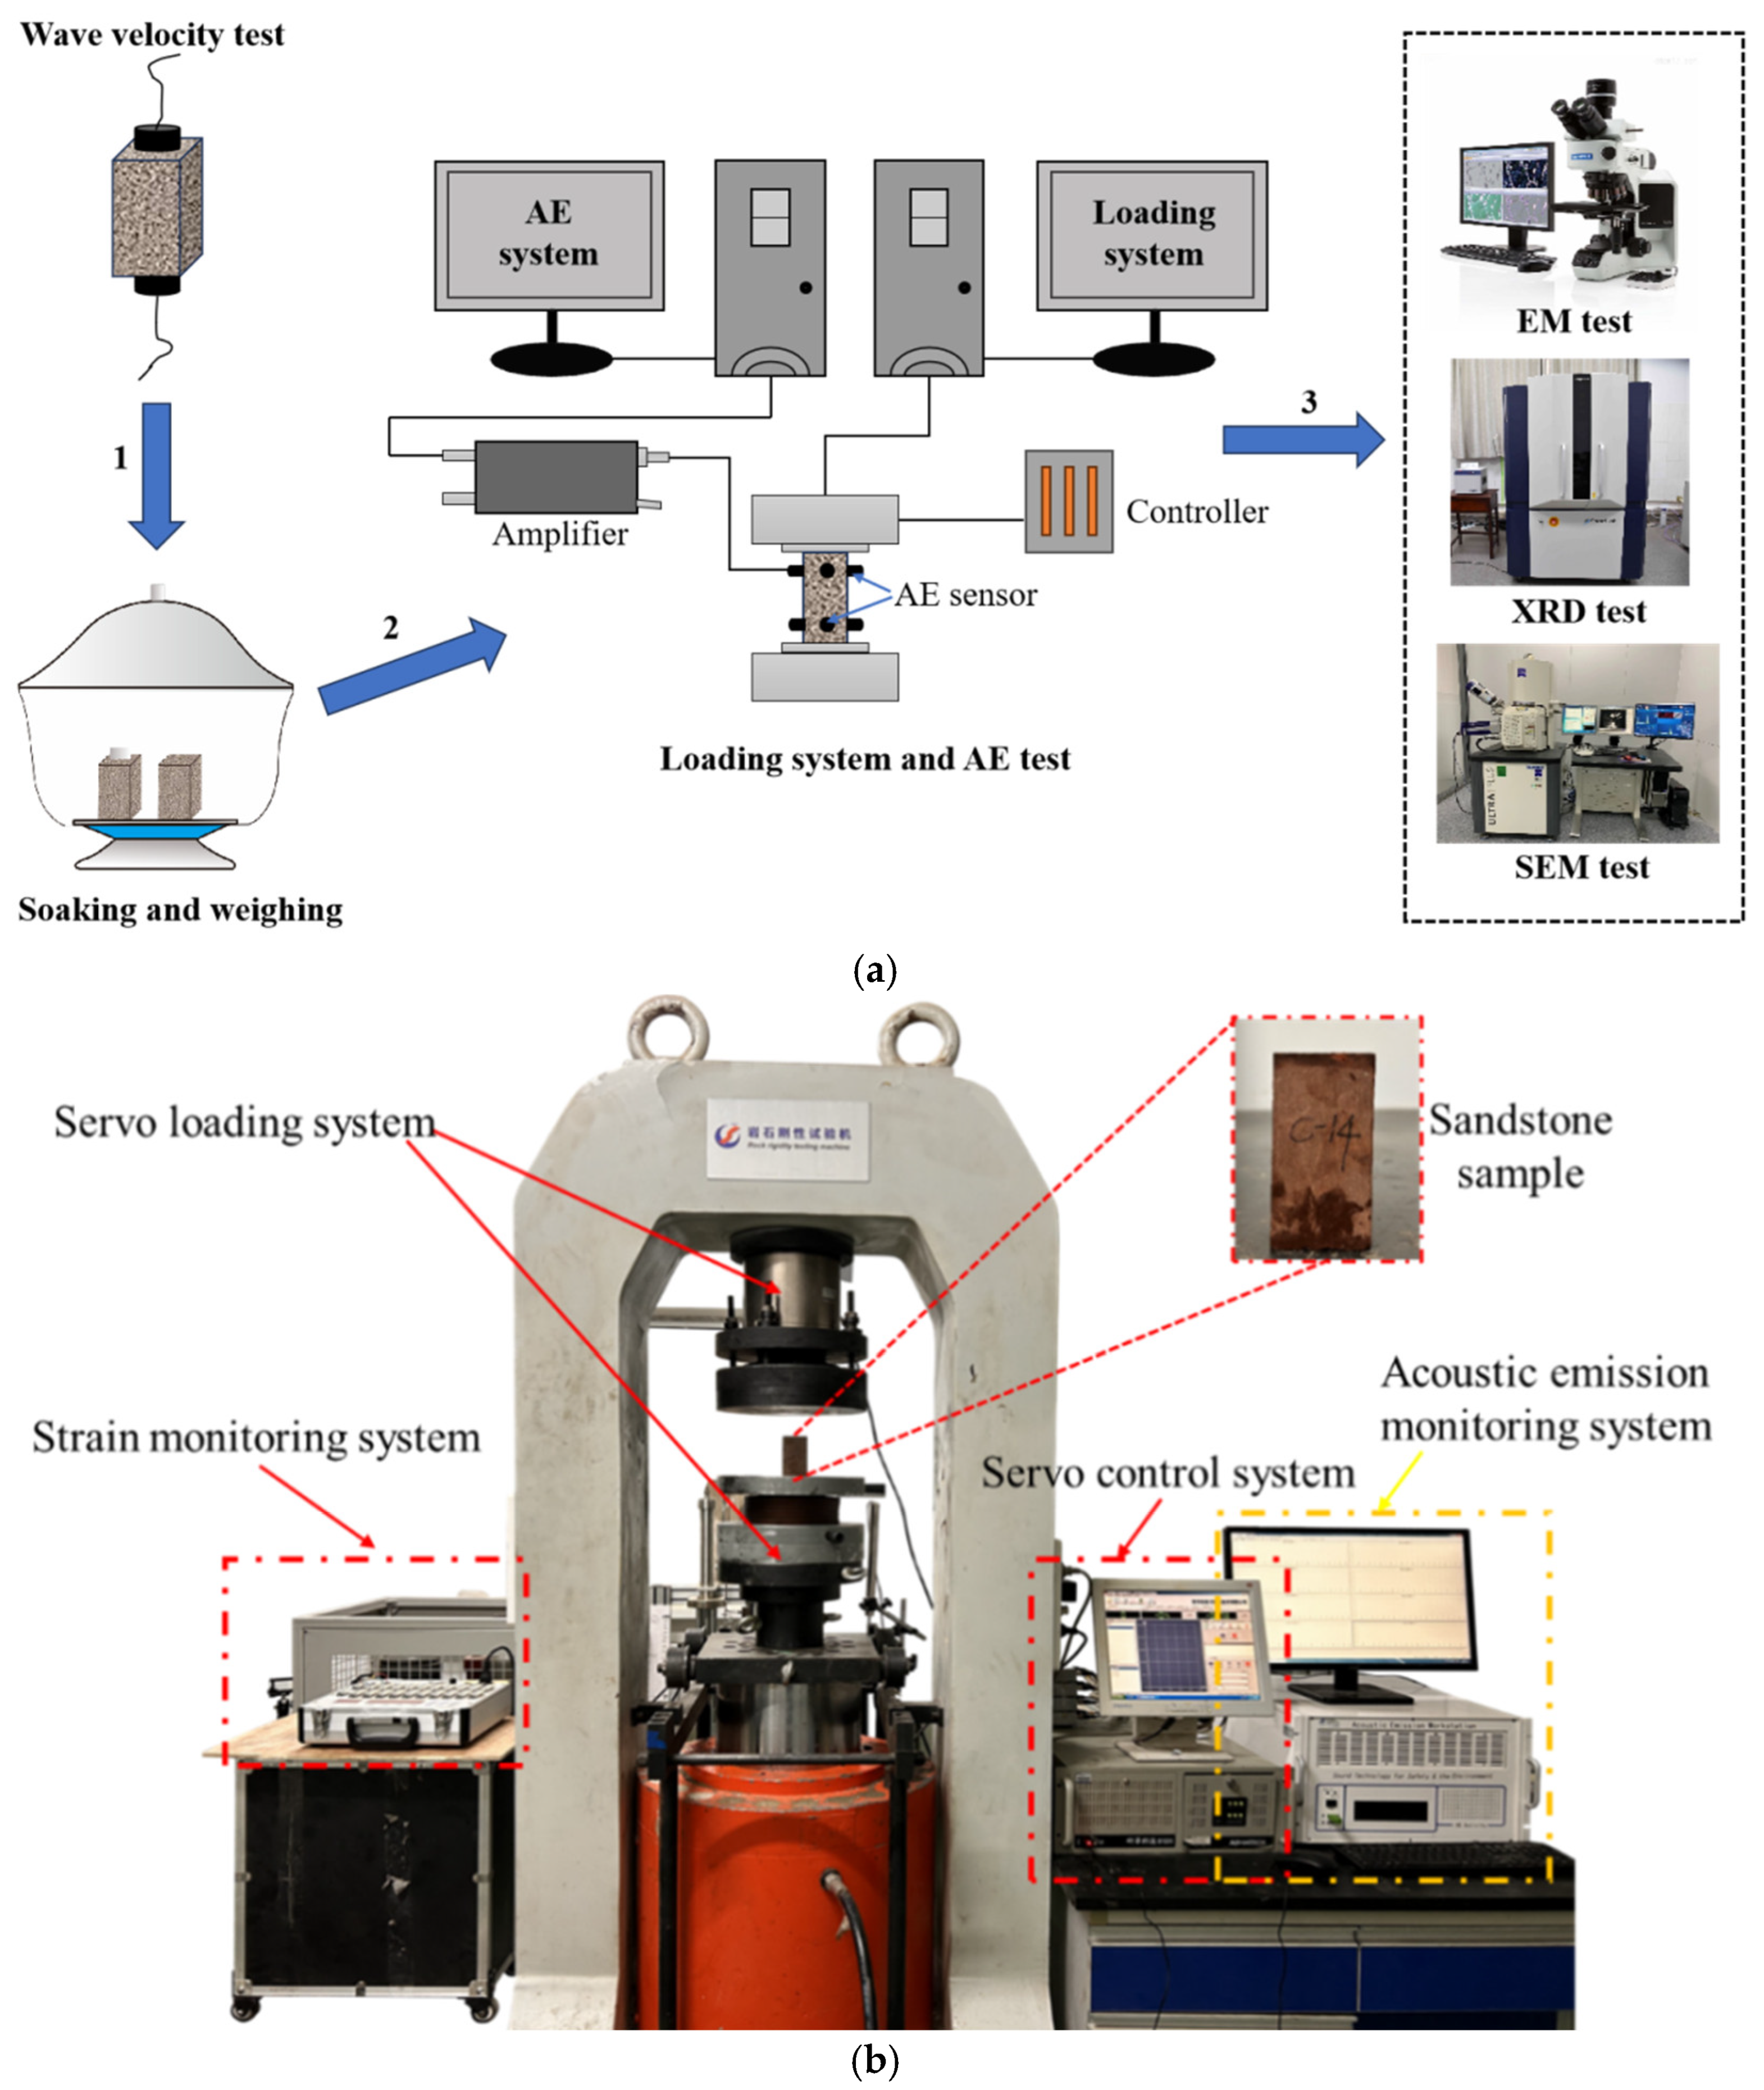
2.2. Experimental Procedure and Equipment

The experimental procedure is illustrated in Figure 4a. The testing equipment includes a P-wave velocity tester, a stress loading system, and an acoustic emission system. To investigate the failure mechanism of sandstone samples, fragments from samples subjected to different immersion times were collected post-loading, labeled, and analyzed using thin-section microscopy, XRD, and SEM tests.
Figure 4b shows the YAW-3000kN microcomputer servo press testing machine, developed in house by the Rock and Instability Research Institute at Northeastern University, along with its accompanying data acquisition system; the AE monitoring and analysis system; and the strain acquisition system, composed of strain gauges, displacement sensors, and stress sensors. During compression of the sandstone sample shown in Figure 4b, the loading was controlled by displacement, with a rate of 0.002 mm/s. The data acquisition, AE, and strain monitoring systems were activated simultaneously upon contact of the probes with the sample to facilitate real-time observation. Upon sample failure, the failure patterns and morphology were photographed and documented.

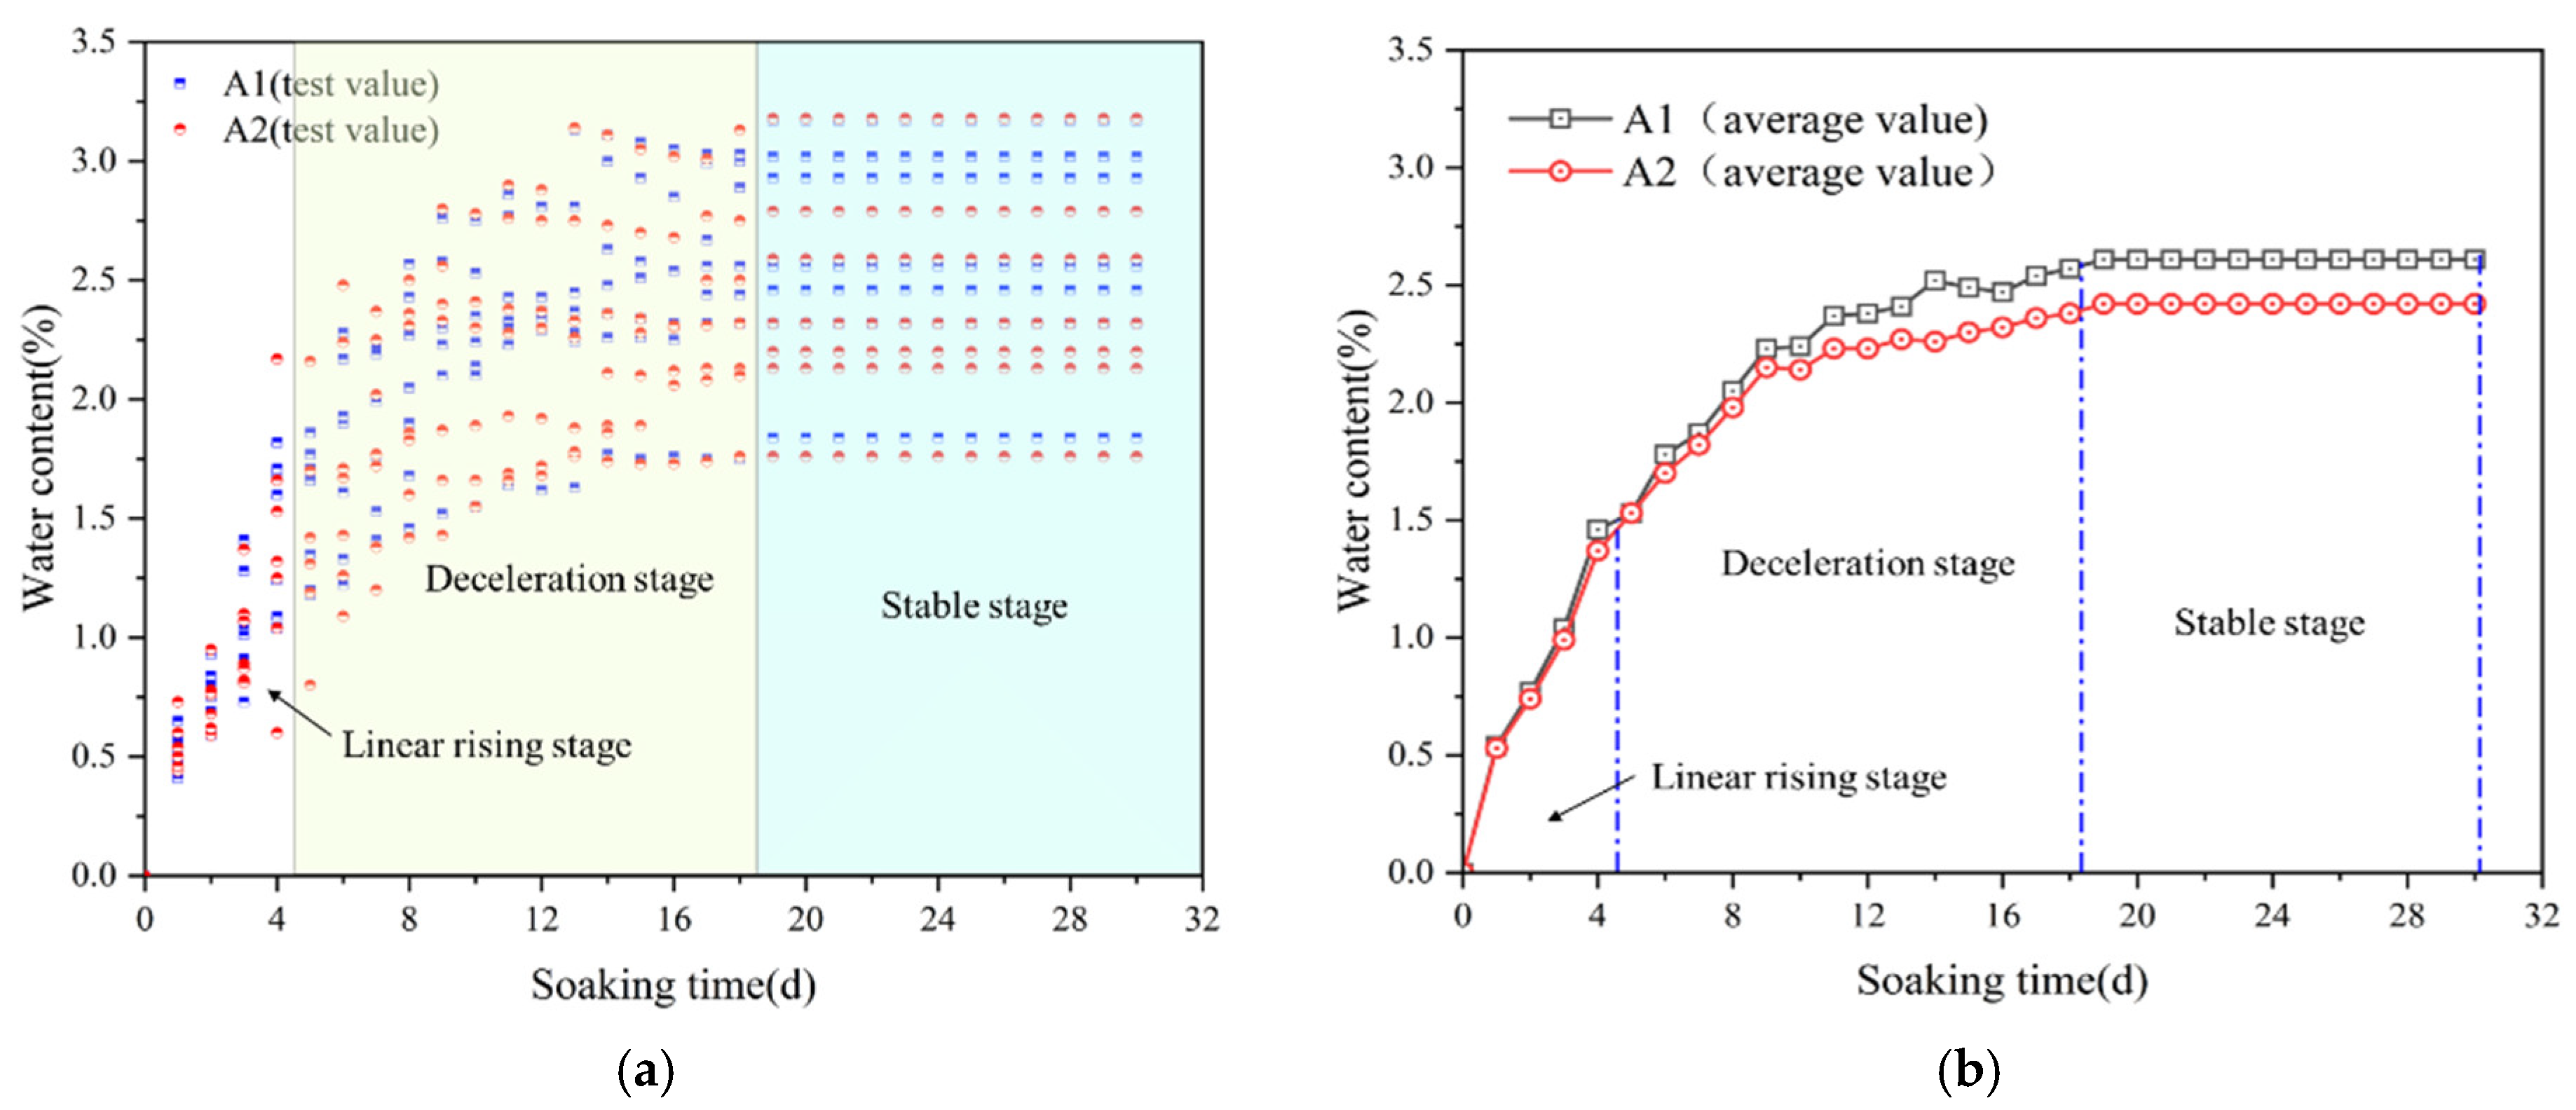
3. Analysis of Test Results

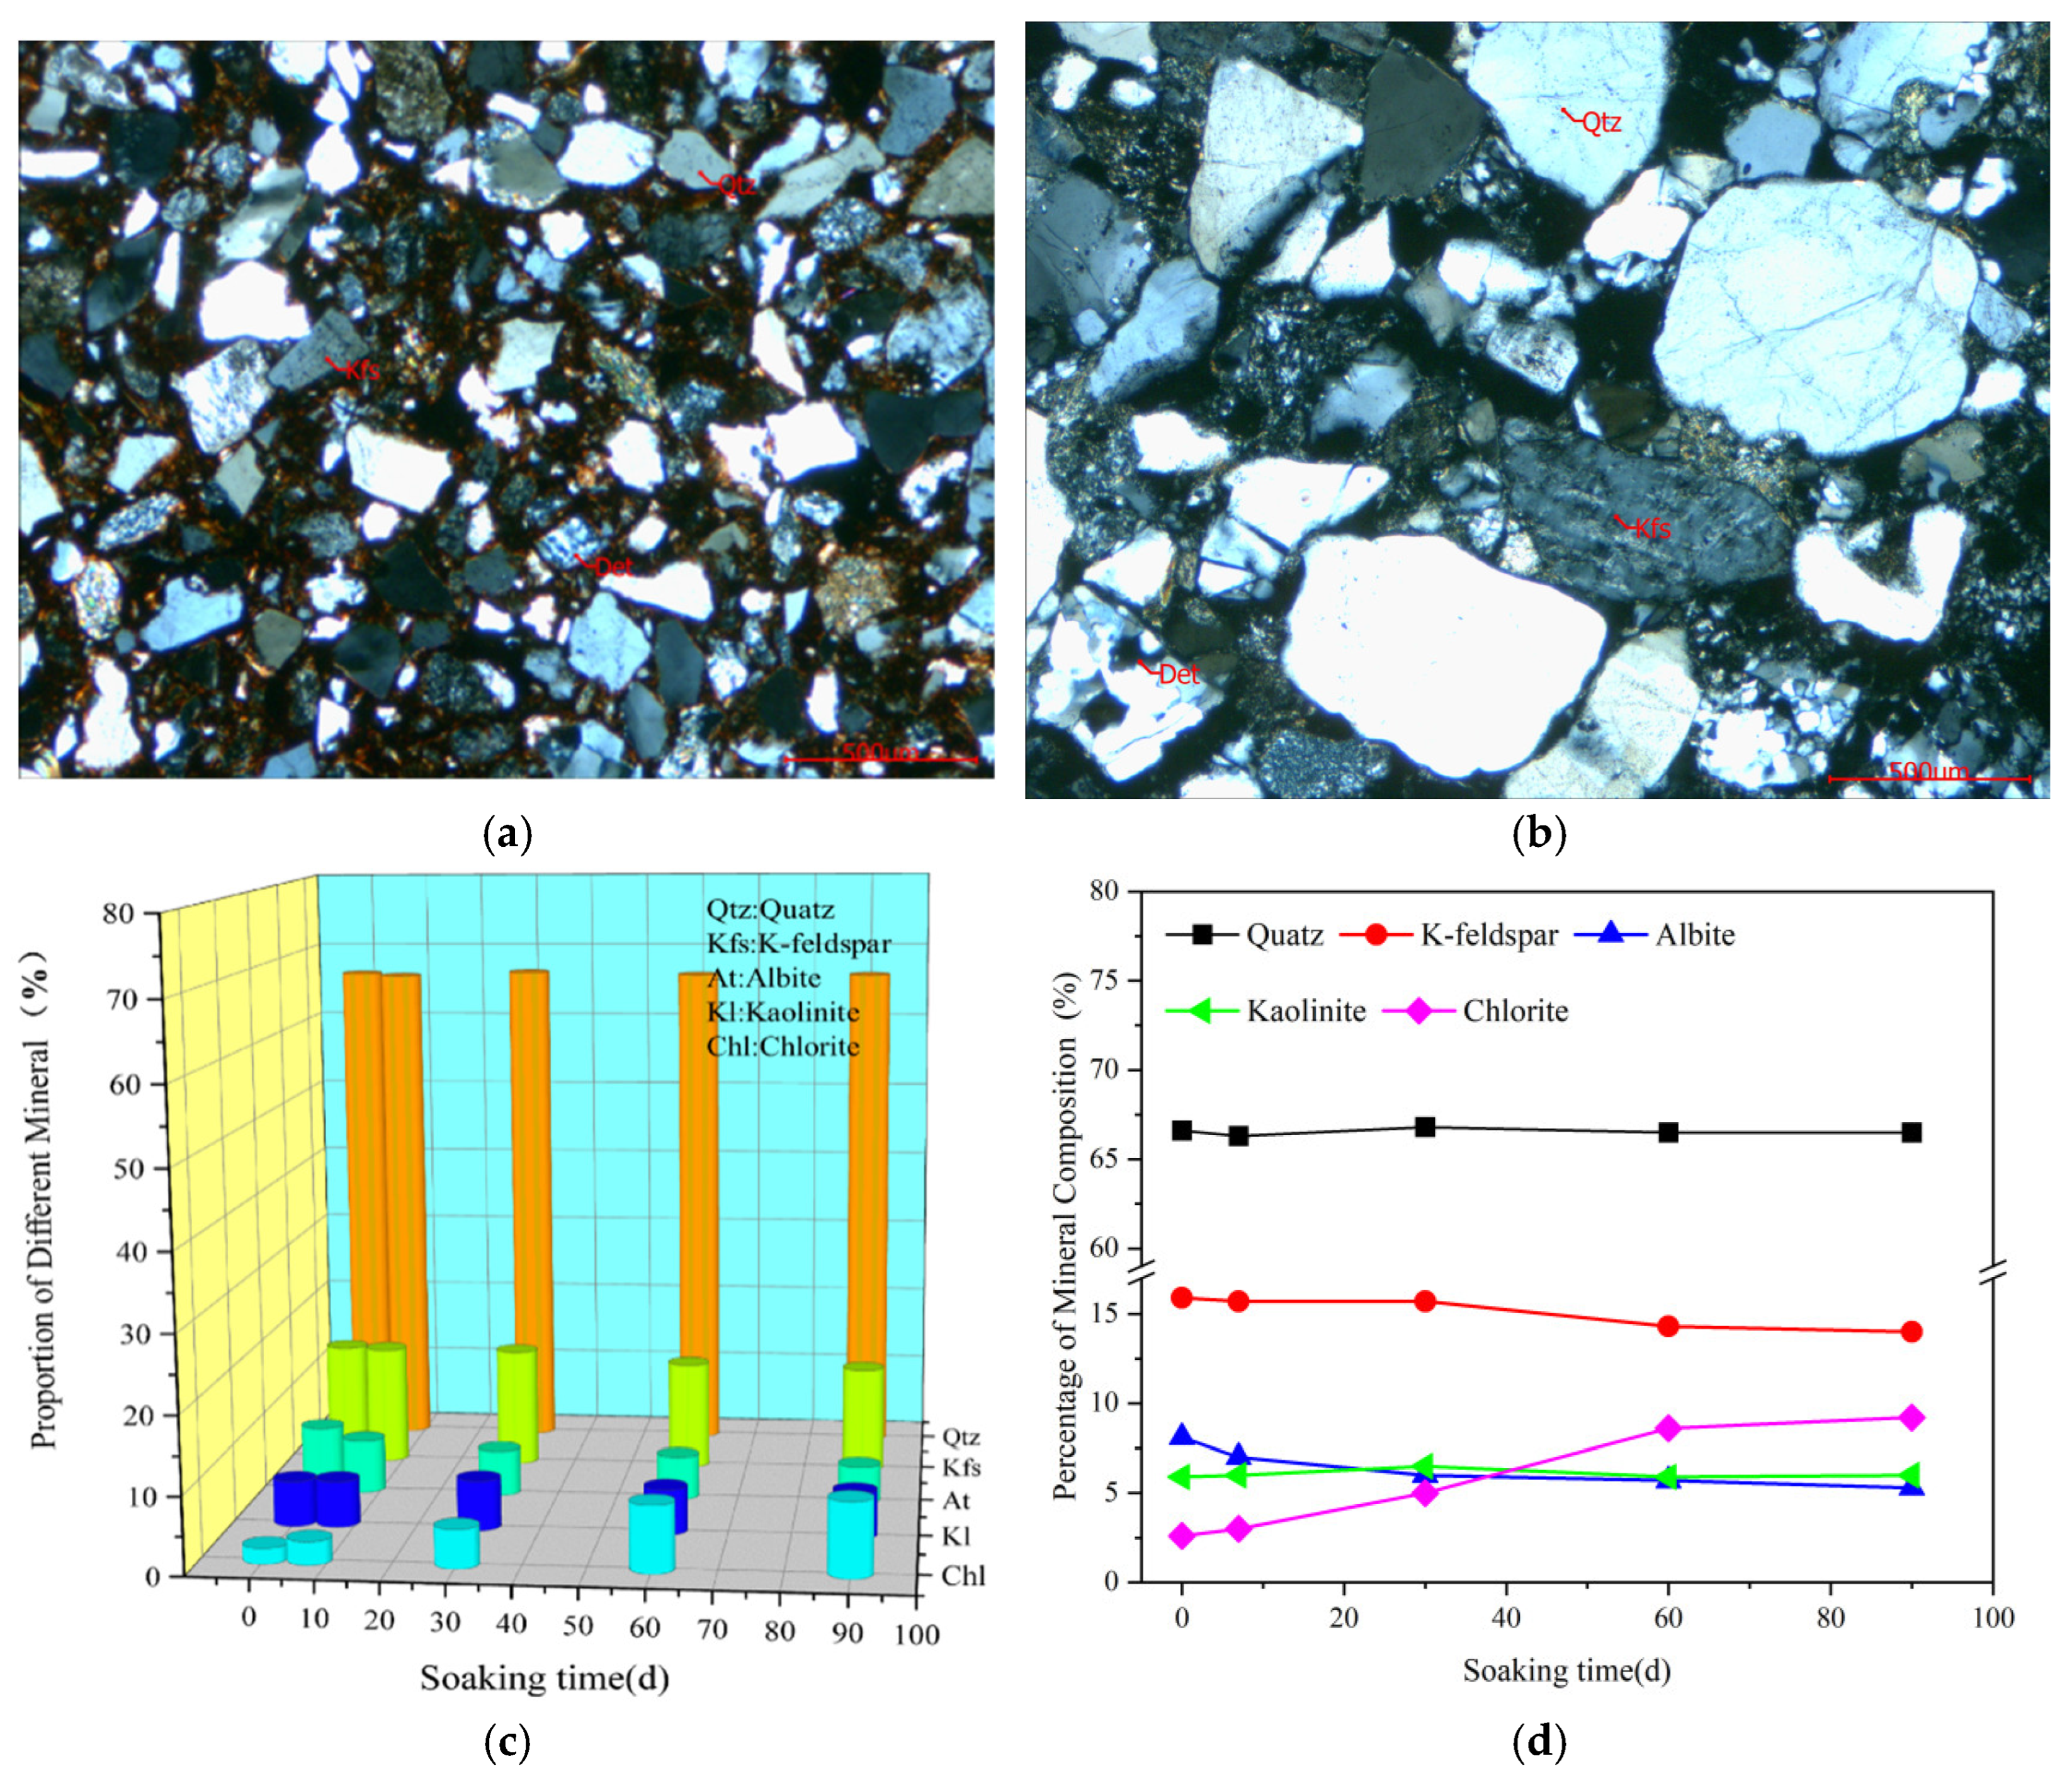
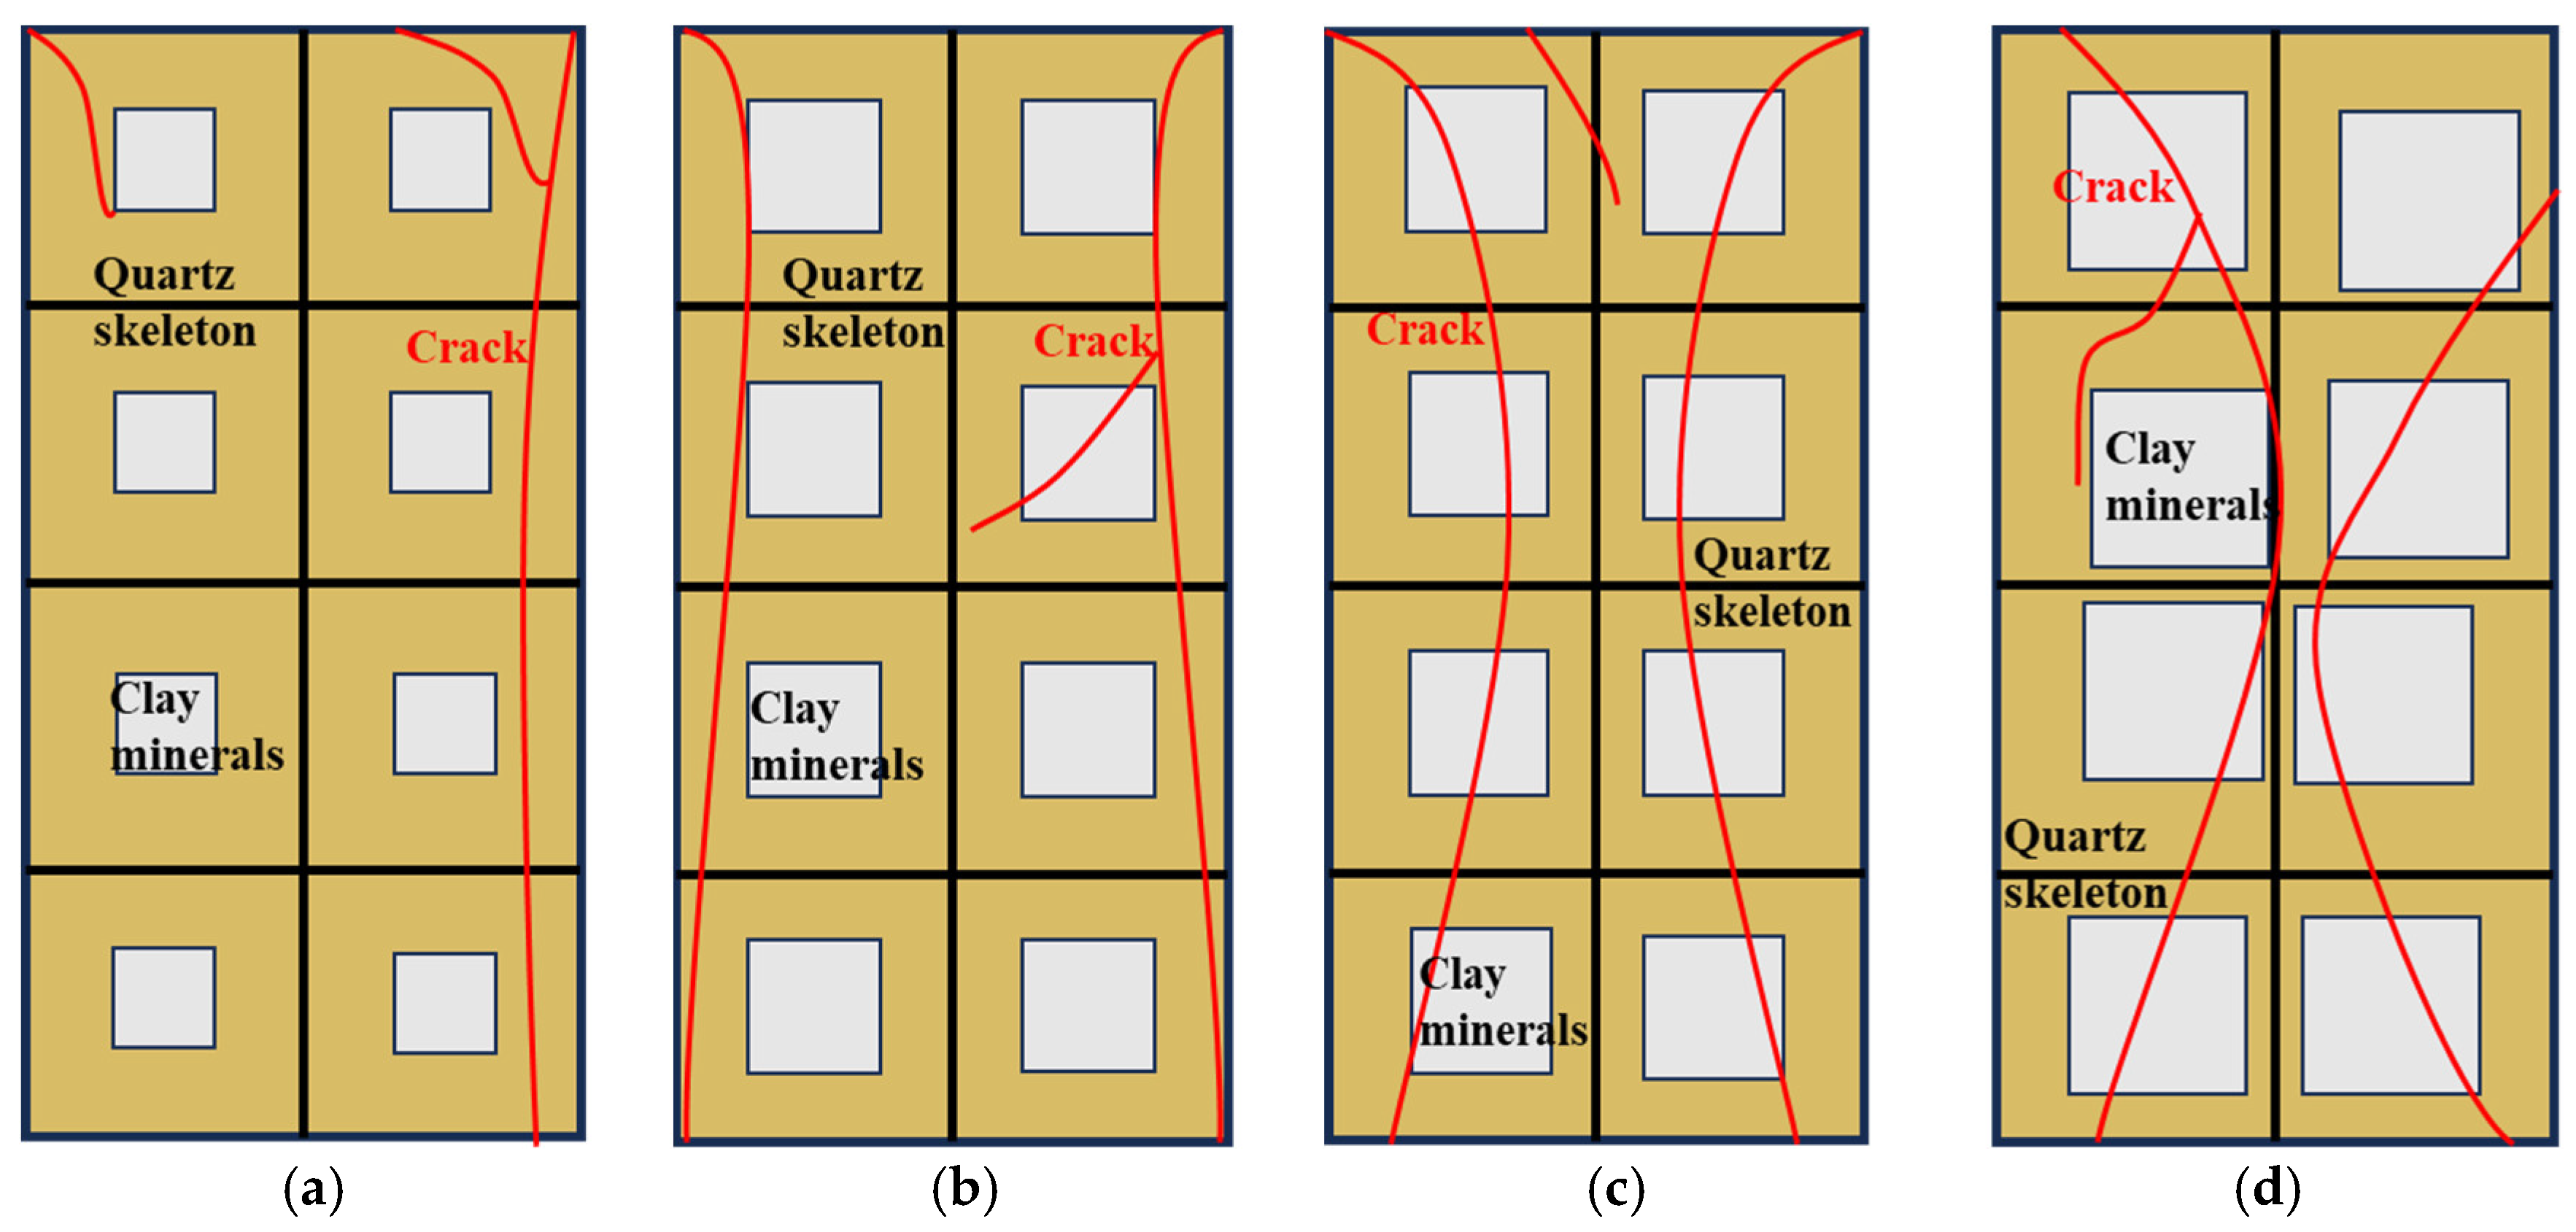
3.1. Structure and Composition of Rock Samples

Figure 5a,b show that the sandstone has a blocky structure, with quartz and potassium feldspar clastic particles forming the framework and accounting for 70% of the structure, while clay minerals, as the filling material, account for the remaining 30%. The mineral composition and content of the sandstone samples were then determined using X-ray diffraction, as shown in Figure 5c,d. The dry sandstone comprises total rock minerals: quartz 70%, potassium feldspar 15.9%, amorphous substances 2.2%, albite 0.4%, and clay minerals, such as kaolinite 5.9% and chlorite 0.5%. Over 90 days of immersion, the proportion of total rock minerals decreased by 5.9% compared to the dry state, while the proportion of clay minerals increased.
Within the clay minerals, the kaolinite content initially increased following immersion and then decreased, eventually stabilizing at around 6%. The chlorite content continuously increased by 7.6% over 90 days of immersion. The most rapid growth occurred between 30 days and 60 days, followed by 7–30 days, indicating that during these periods, chlorite in the clay minerals fully absorbed water and expanded, with the growth rate reducing between 60 days and 90 days.

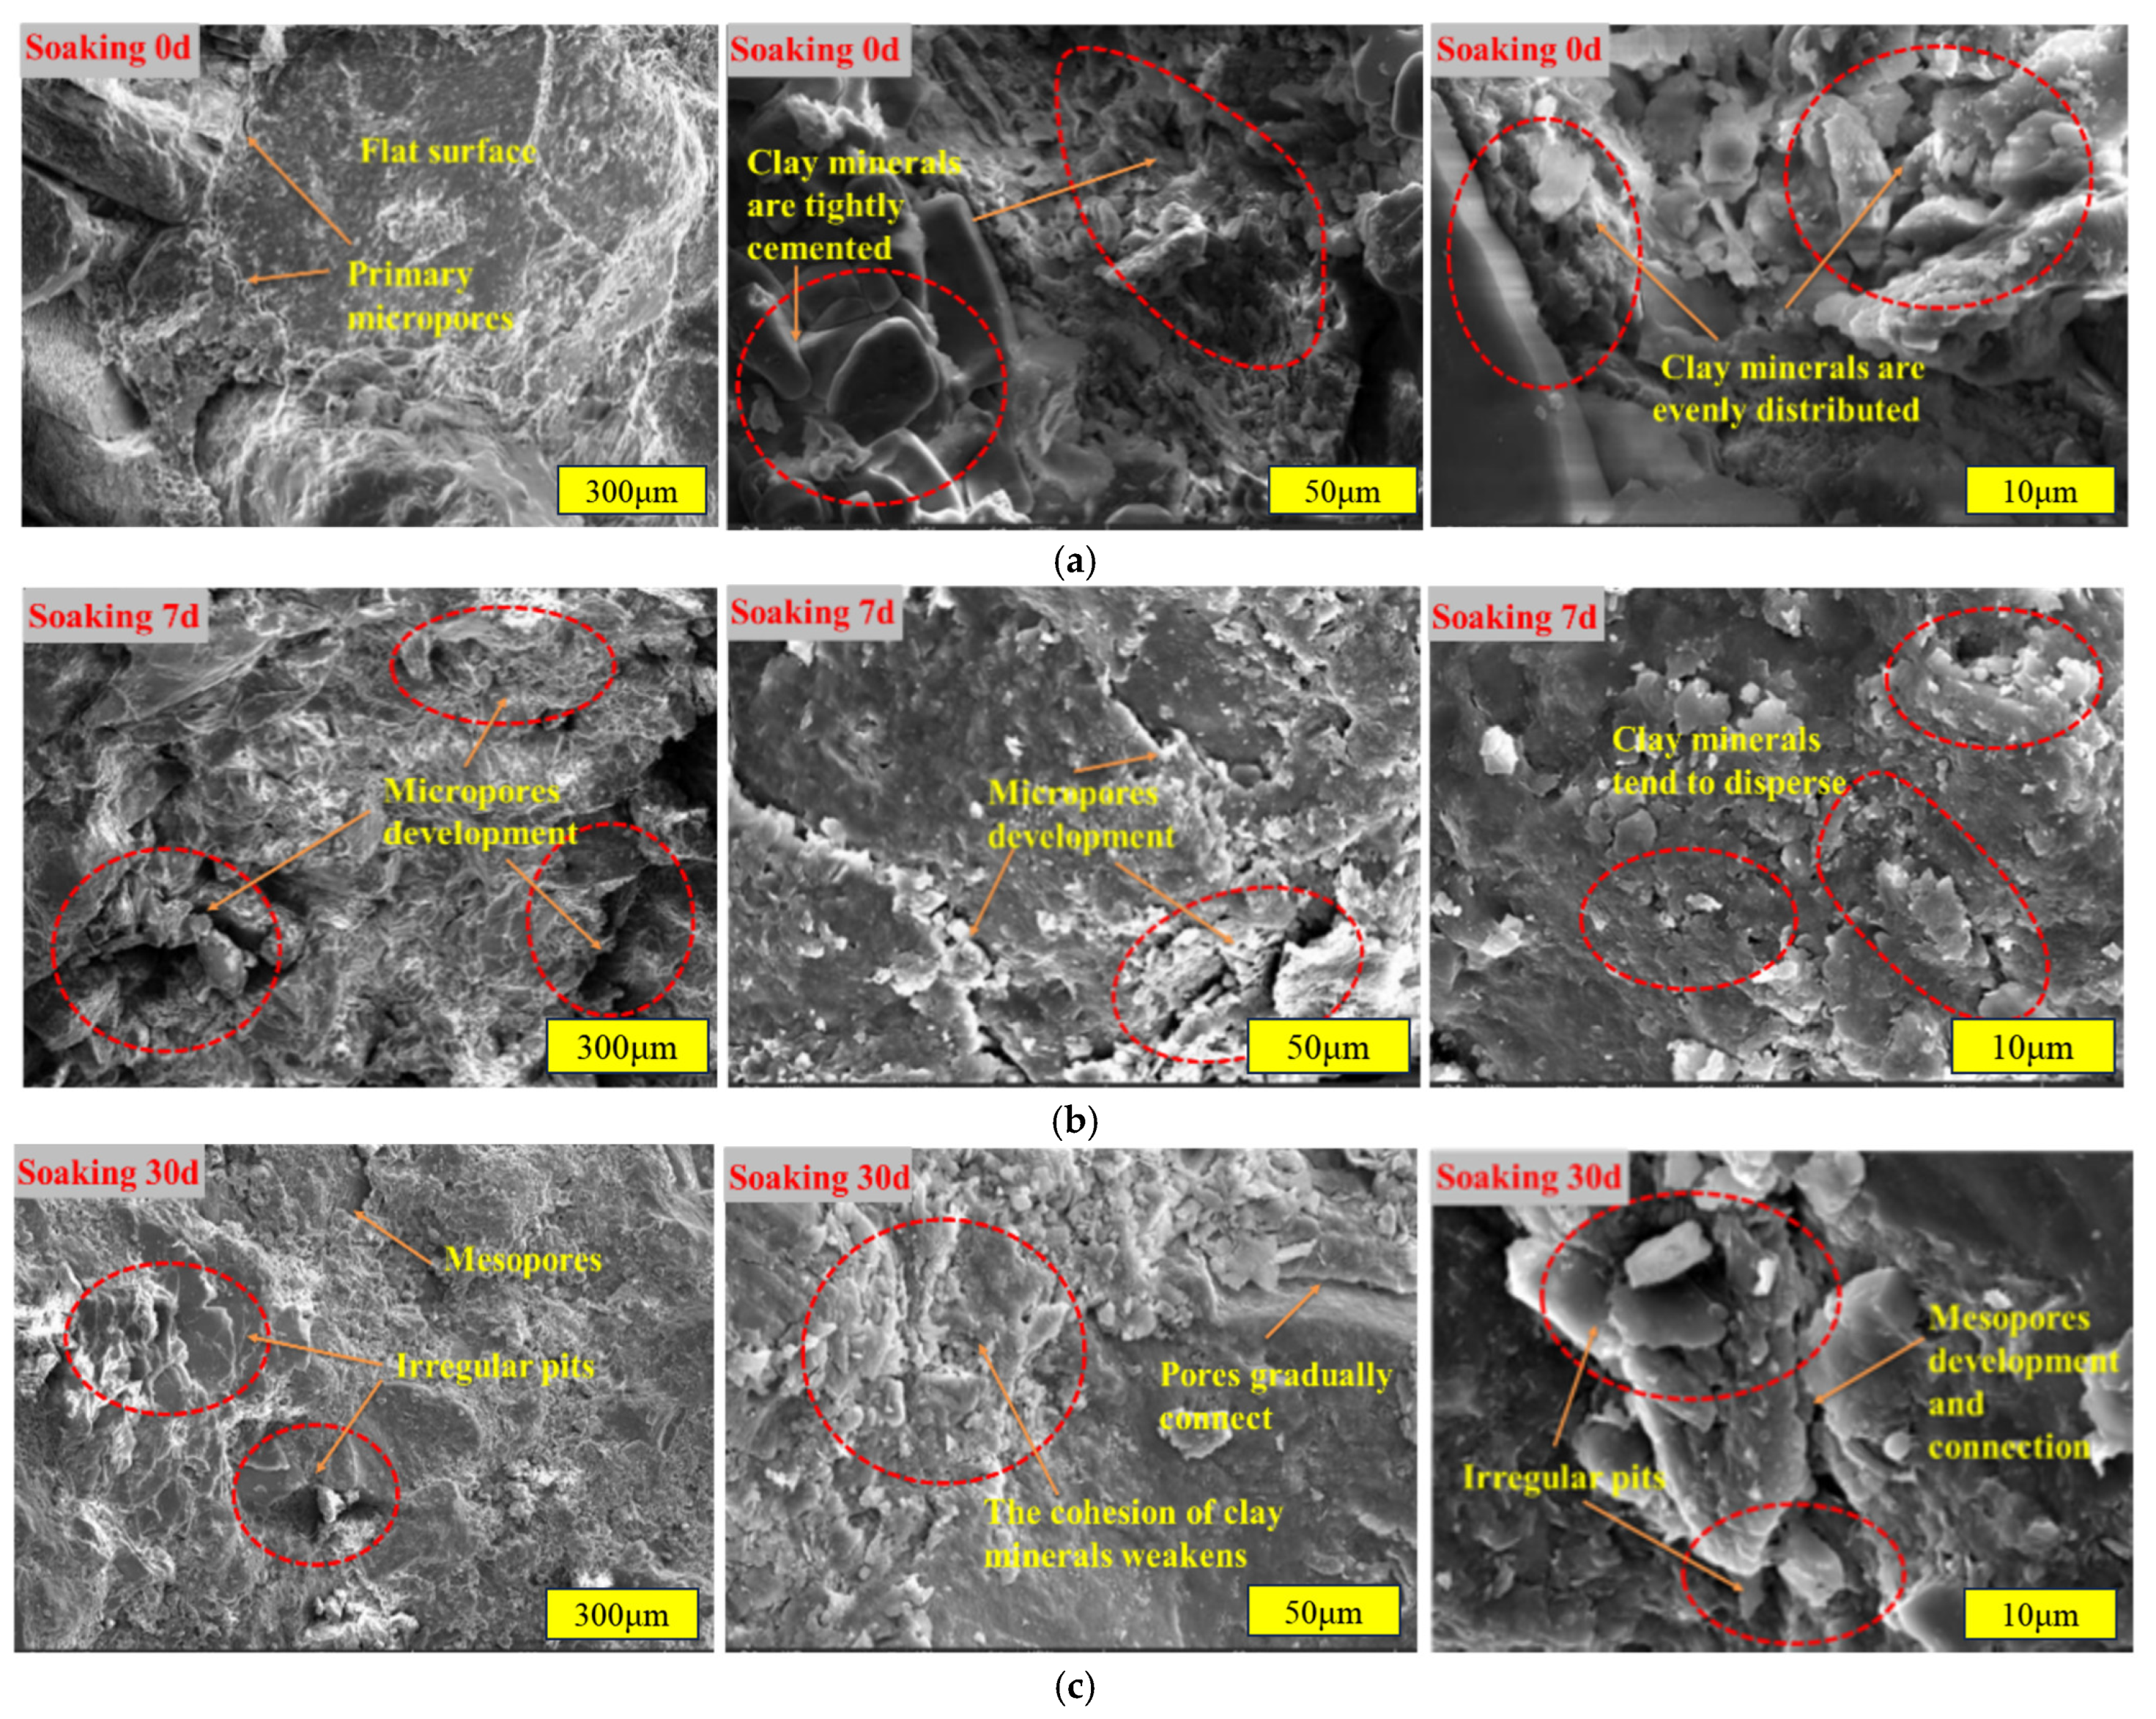
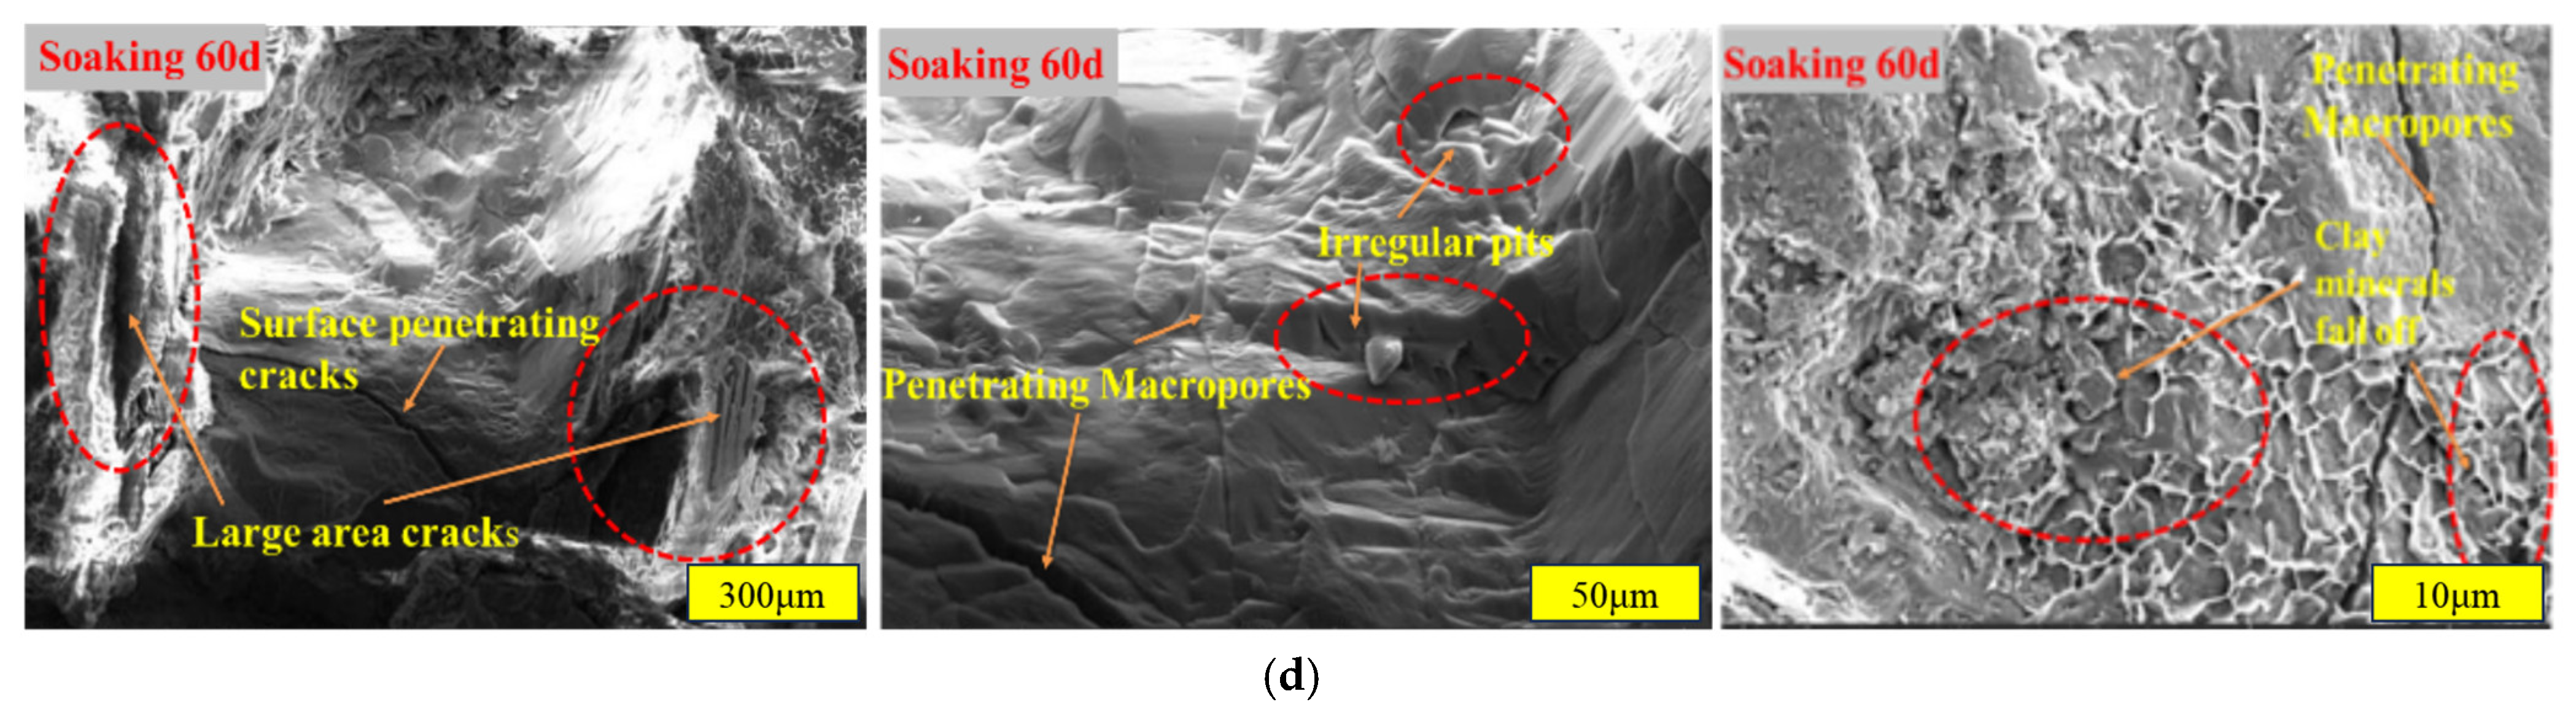
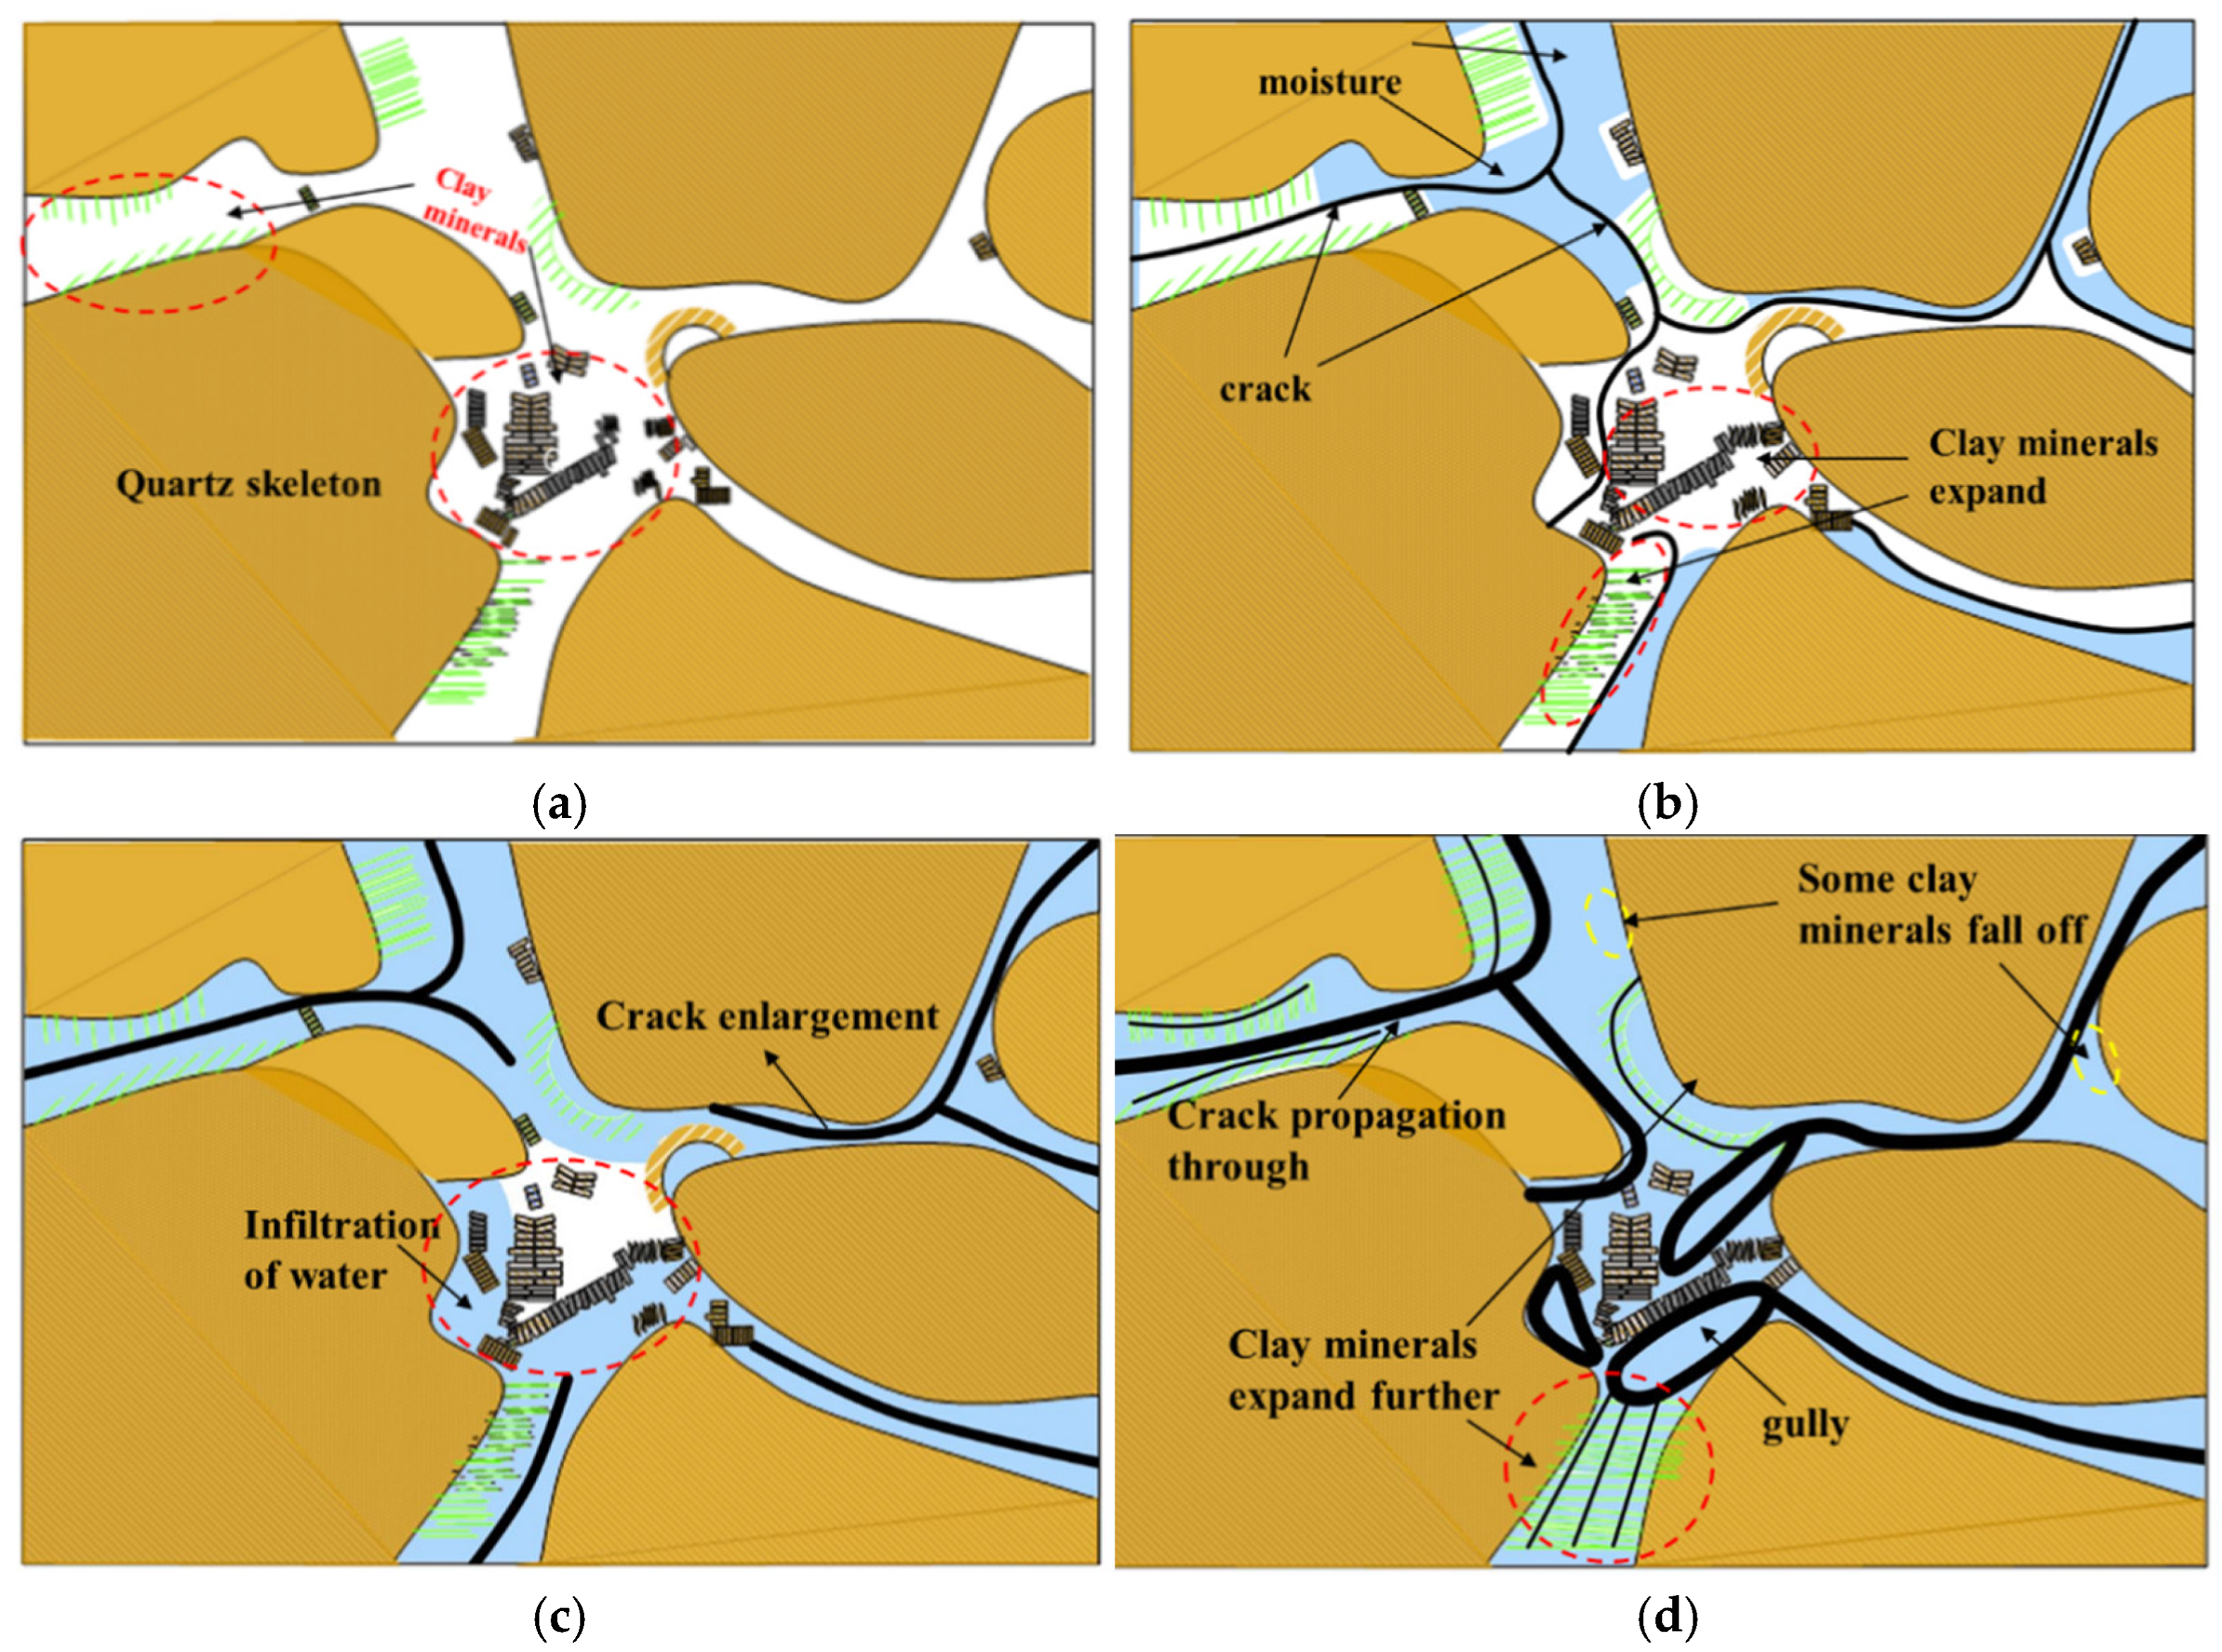
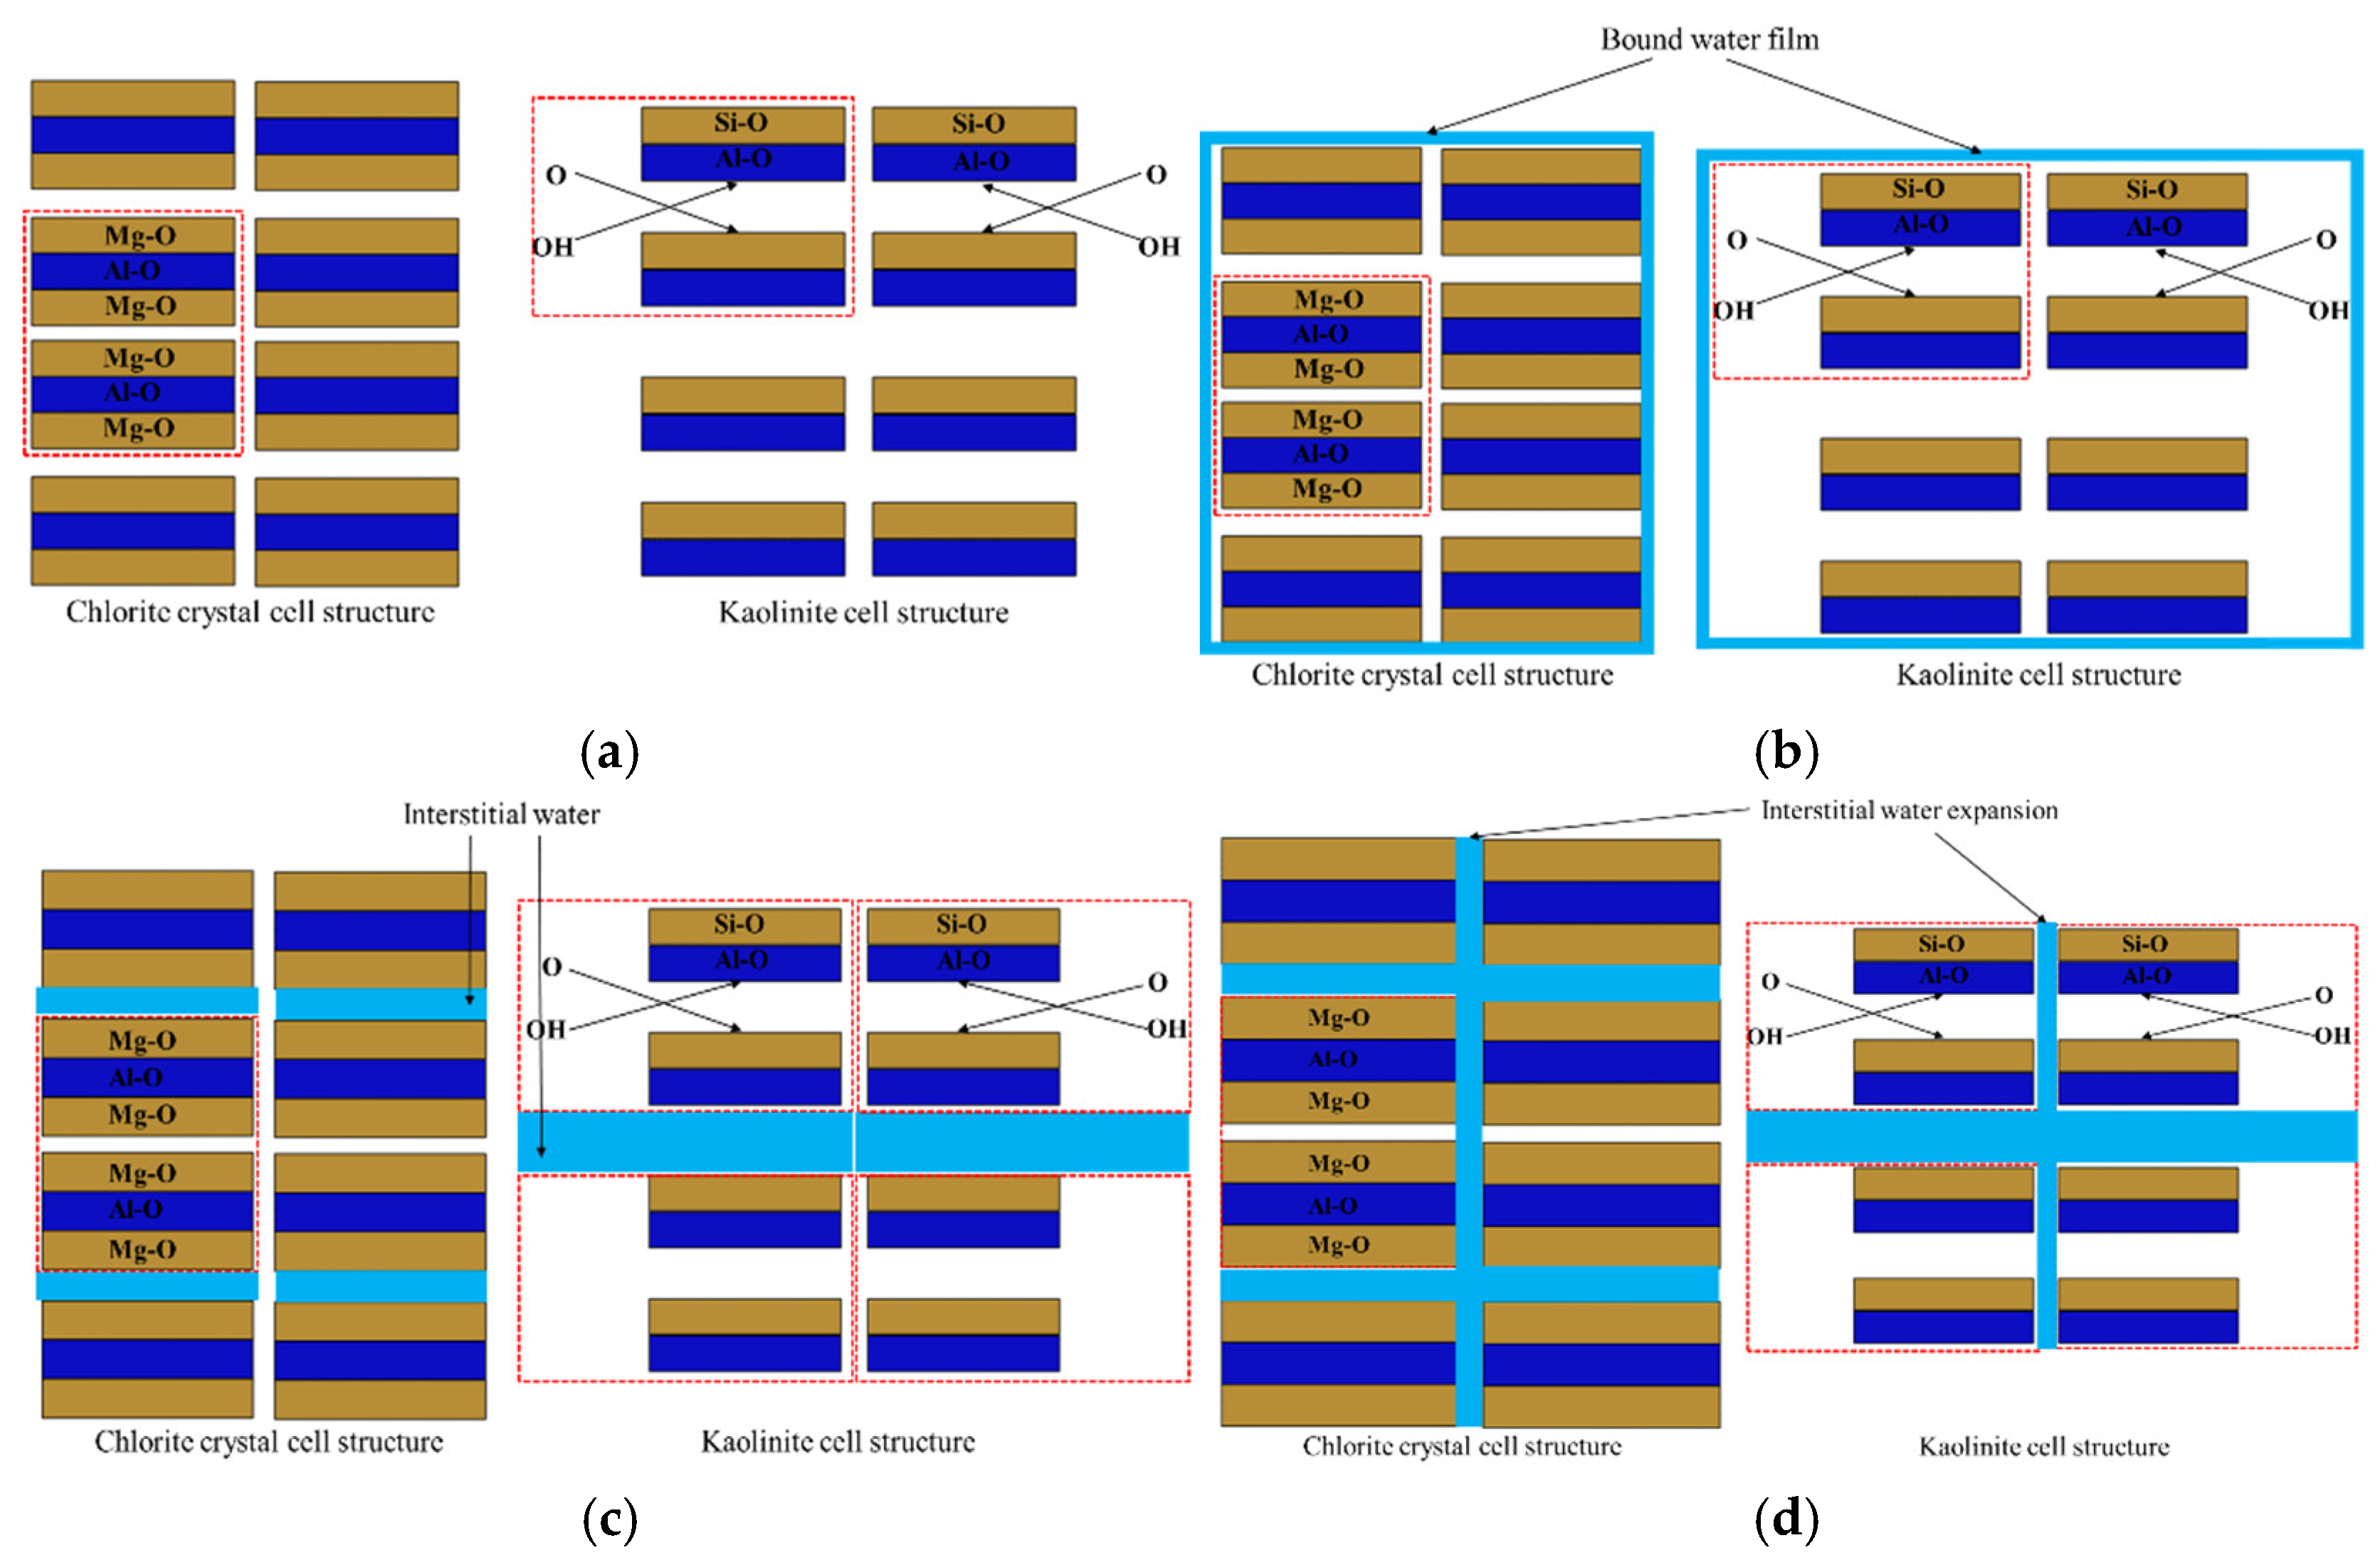
3.2. SEM Test Results

The variations in the microscopic structure of rocks directly influence their macroscopic failure modes. To further investigate the alterations in the microscopic structure of sandstone during prolonged soaking, SEM analysis was performed on the samples at different immersion times. In this study, Scanning Electron Microscopy (SEM) was used to examine the microstructure of both sandstone and mudstone samples after different immersion durations. The Apreo 2C Field Emission SEM (Thermo Fisher Scientific, Waltham, MO, USA) in Shenyang, China was employed to capture high-resolution images of the sample surfaces. The specimens were first cut into 5 mm × 5 mm blocks and cleaned using an ultrasonic cleaner to remove impurities. After immersion, the samples were dried in a vacuum dryer at 40 °C to prevent moisture residue. A thin metal coating (gold or carbon) was applied to improve conductivity before imaging. SEM analysis was conducted at an accelerating voltage of 15–20 kV, with a working distance of 8–15 mm and magnifications ranging from 1000× to 10,000×. Images were captured from different regions of the samples to examine pore structures, mineral expansions, and water penetration effects. The images were obtained at magnifications of 500×, 2000×, and 10,000×, as shown in Figure 6. The following are the observed changes in the structure of mineral particles, pores, and cracks in sandstone subjected to prolonged soaking:
(1) Dry sandstone (Figure 6a) exhibits a smooth, continuous surface with dense matrix. The clay minerals, including kaolinite and chlorite, are tightly cemented and uniformly distributed among the quartz particles.
(2) After submerging for 7 days (Figure 6b), the sample surface gradually becomes rough. The pores between quartz particles and clay minerals increase, and microcracks begin to gradually develop among the clay minerals.
(3) In the SEM images of the sample soaked for 30 days (Figure 6c), the structure of the clay minerals loosens, leading to the formation of penetrative cracks between them. These cracks weaken the connections between particles and allow the cracks to expand and penetrate further.
(4) After 60 days of soaking (Figure 6d), penetrative cracks are formed on the rock surface. The internal penetrative cracks within the clay minerals are visible, with some clay minerals detaching and forming debris.

3.3. Uniaxial Compression Test Results

3.3.1. Basic Mechanical Indicators

Figure 7 shows the variational patterns of various physical and mechanical properties at different soaking times. All data points are average values of a group of samples. From Figure 7a,b, the data indicate that the pressure resistance of sandstone samples declines with extended soaking time. After 7, 14, 30, 60, and 90 days of soaking, the compressive strength percentages are 70.7%, 55.8%, 46.4%, 24.2%, and 17.7% of that of the dry sandstone, respectively. The most significant reductions in compressive strength occurred between 7 days and 14 days and 30 days and 60 days, with a decrease of 14.9% and 22.2%, respectively. This is consistent with the XRD and SEM results, indicating that water gradually infiltrated clay minerals over 7–14 days, and chlorite swelling fully occurred due to water absorption between 30 days and 60 days. During 60–90 days, the compressive strength decreased by 6.5%, which is consistent with the XRD results, indicating limited changes in chlorite and SEM observations of penetrative cracks.
Figure 7c and Table 1 show that the elastic modulus of dry sandstone is 931.43 MPa, while the elastic modulus decreases to 813.76, 591.41, 440.28, 316.34, 210.03, and 108.2 MPa after 1, 7, 14, 30, 60, and 90 soaking days, respectively, exhibiting an exponential decline similar to the trend observed in compressive strength. As shown in Figure 7d, with increasing soaking time, the Poisson’s ratio of the samples gradually increases, indicating softening of the samples and transitioning of the rock from brittle to plastic behavior during fracture. The variations in elastic modulus and Poisson’s ratio are related to microstructural changes in the samples attributed to soaking, with detailed explanations provided in the Discussion Section.

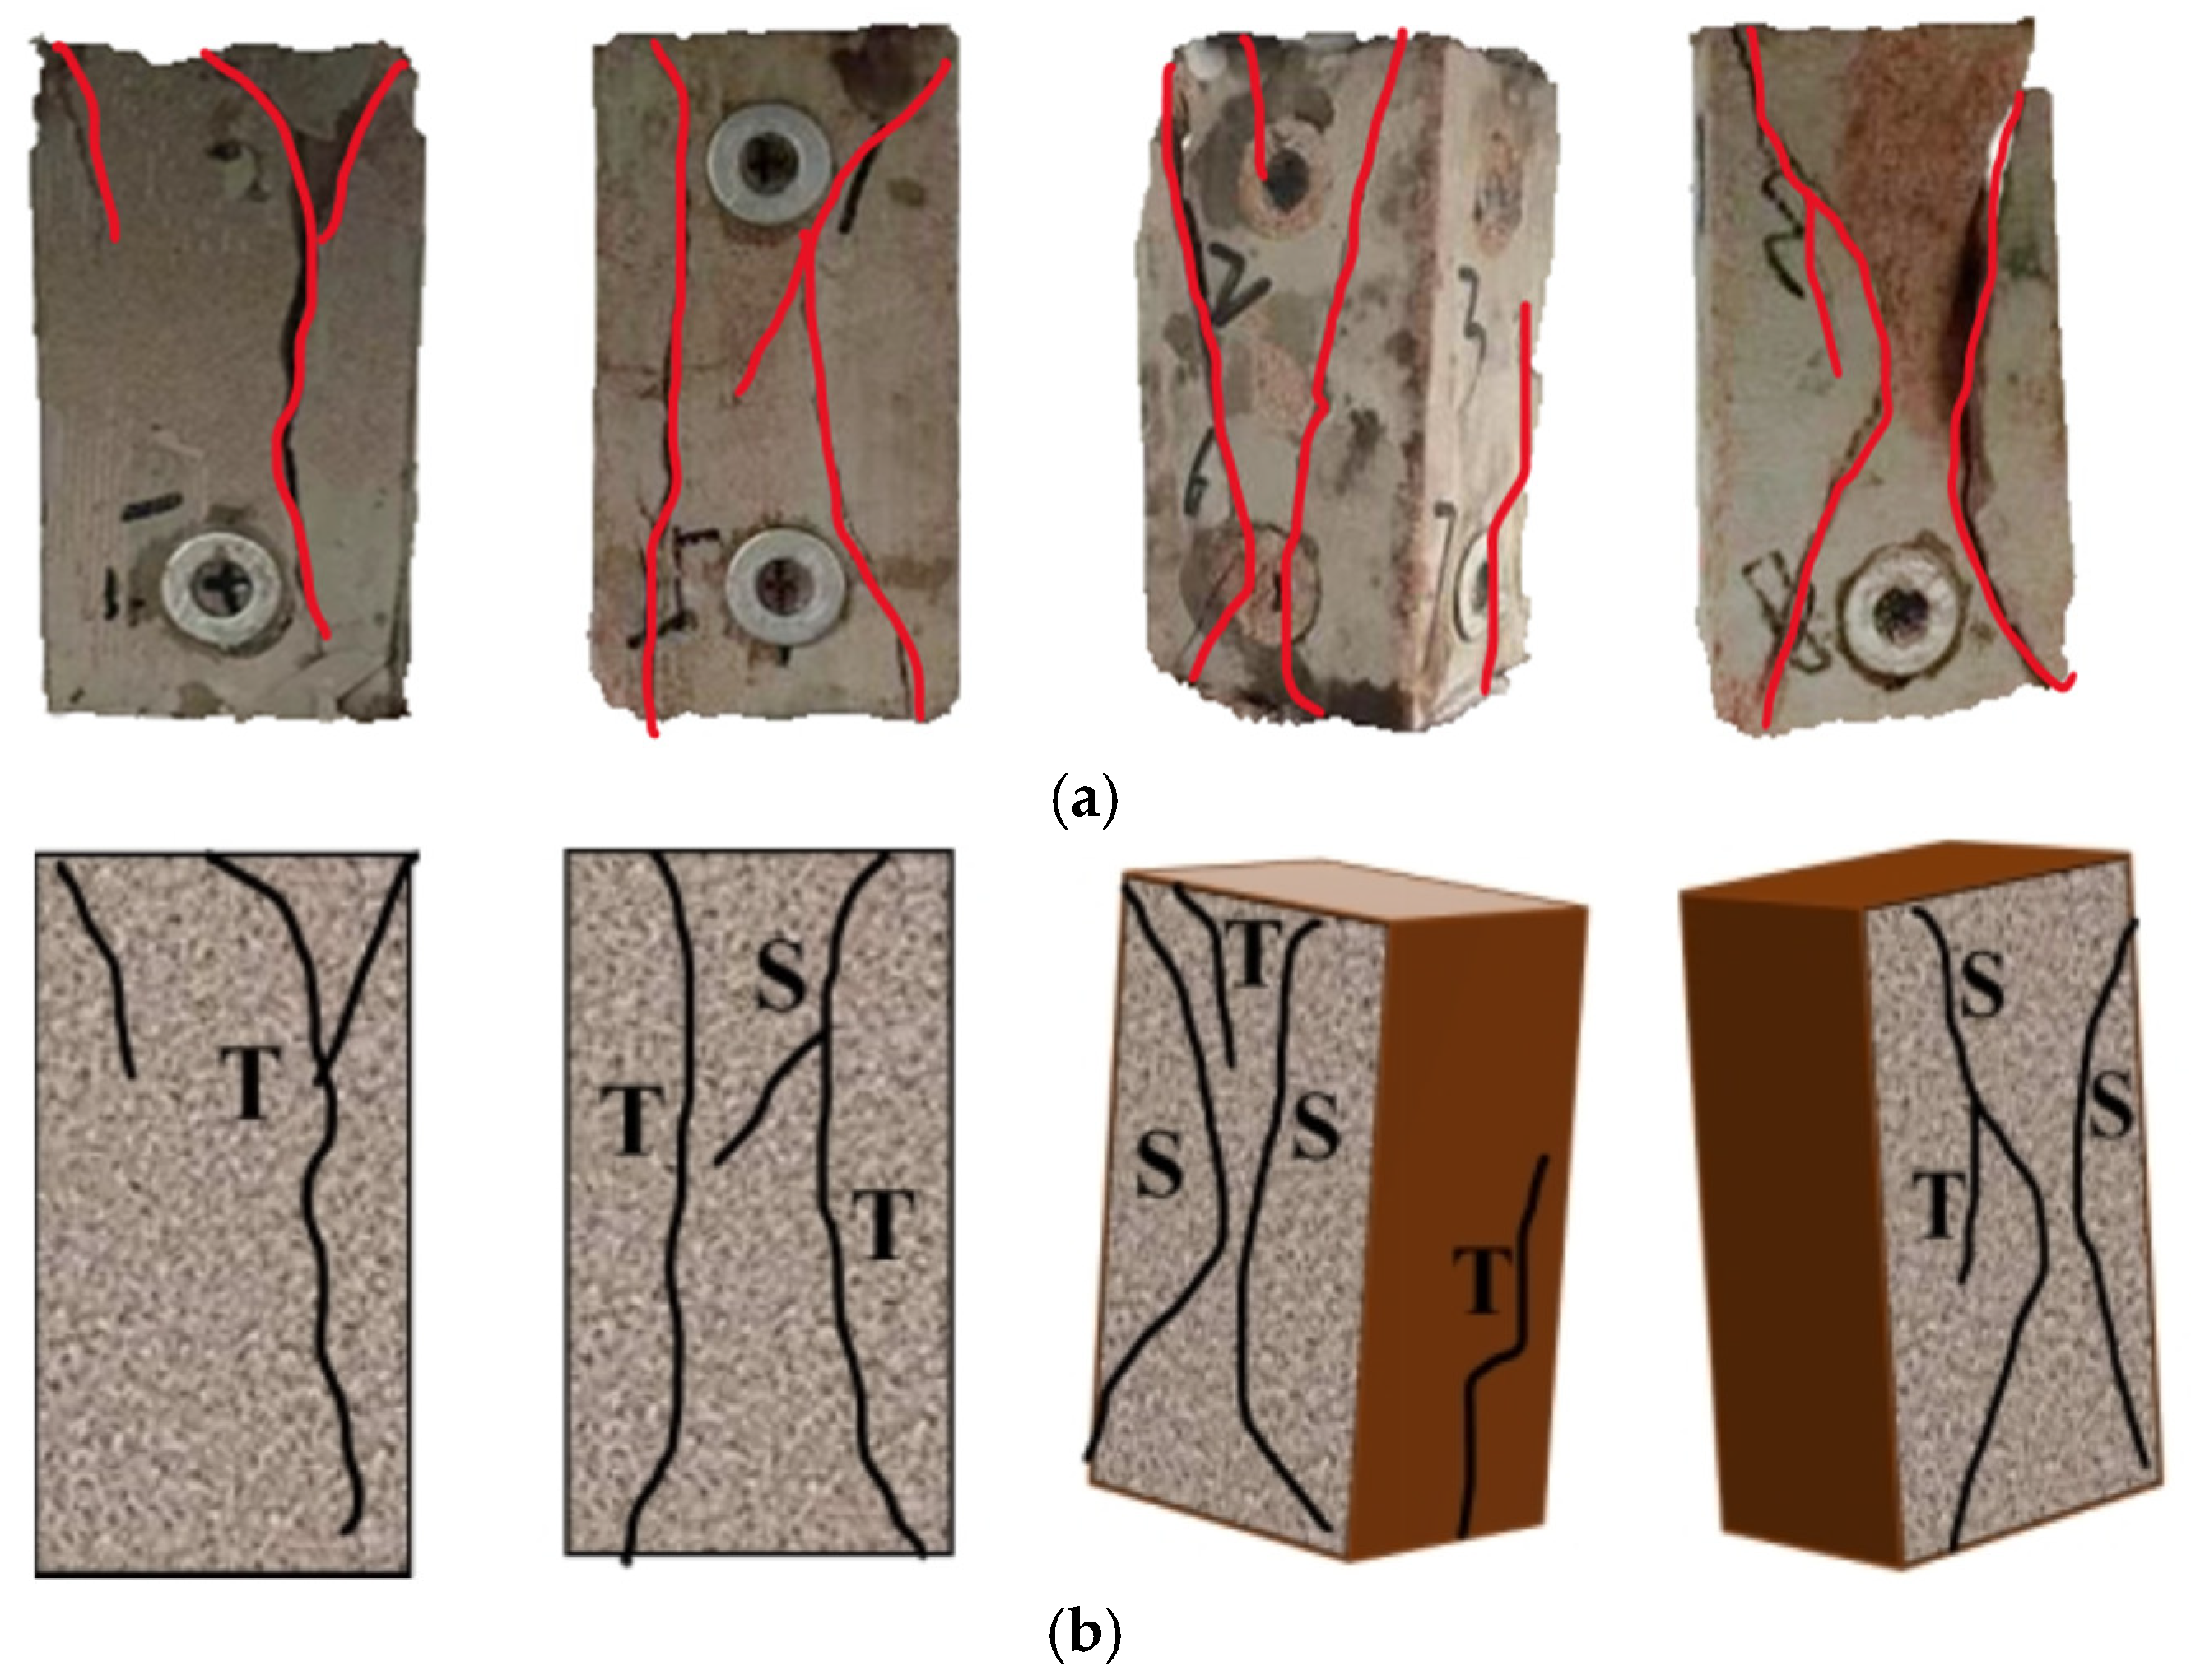
3.3.2. Failure Modes

By performing uniaxial compression tests on sandstone samples subjected to different soaking times, the variations in mechanical parameters such as peak strength, deformation modulus, and Poisson’s ratio can be analyzed. Additionally, following the tests, the macroscopic morphology of the samples reveals different failure modes due to water-induced weakening, as shown in Figure 8.
Examining sandstone samples at different soaking times reveals changes in their failure modes: in the dry state, nearly all cracks are tensile, indicating brittle failure. After 7 days of soaking, shear cracks began to expand, suggesting that water interacted with the rock. This is evident from the SEM images in Figure 6b, which show water concentration in quartz and clay minerals. After 30 days of soaking, the shear cracks became more prevalent than tensile cracks. The corresponding XRD results reveal a significant expansion of the clay minerals between 7 days and 30 days. This can be attributed to the complete infiltration of water into the clay minerals, causing them to soften. This increases the ductility of the sandstone, leading to the development of shear cracks. After 60 days of soaking, almost all cracks in the samples were shear cracks. The XRD results in Figure 5c,d indicate that the expansion rate of clay minerals is highest between 30 days and 60 days, while it is almost negligible between 60 days and 90 days. The SEM results also indicate that after 60 days of soaking, large, interconnected cracks appeared within the clay minerals, indicating very weak bonding between the clay minerals and the quartz framework. Therefore, under prolonged soaking conditions, the ductility of the samples nearly reached its peak, resulting in this failure mode.

3.4. Acoustic Emission Characteristics

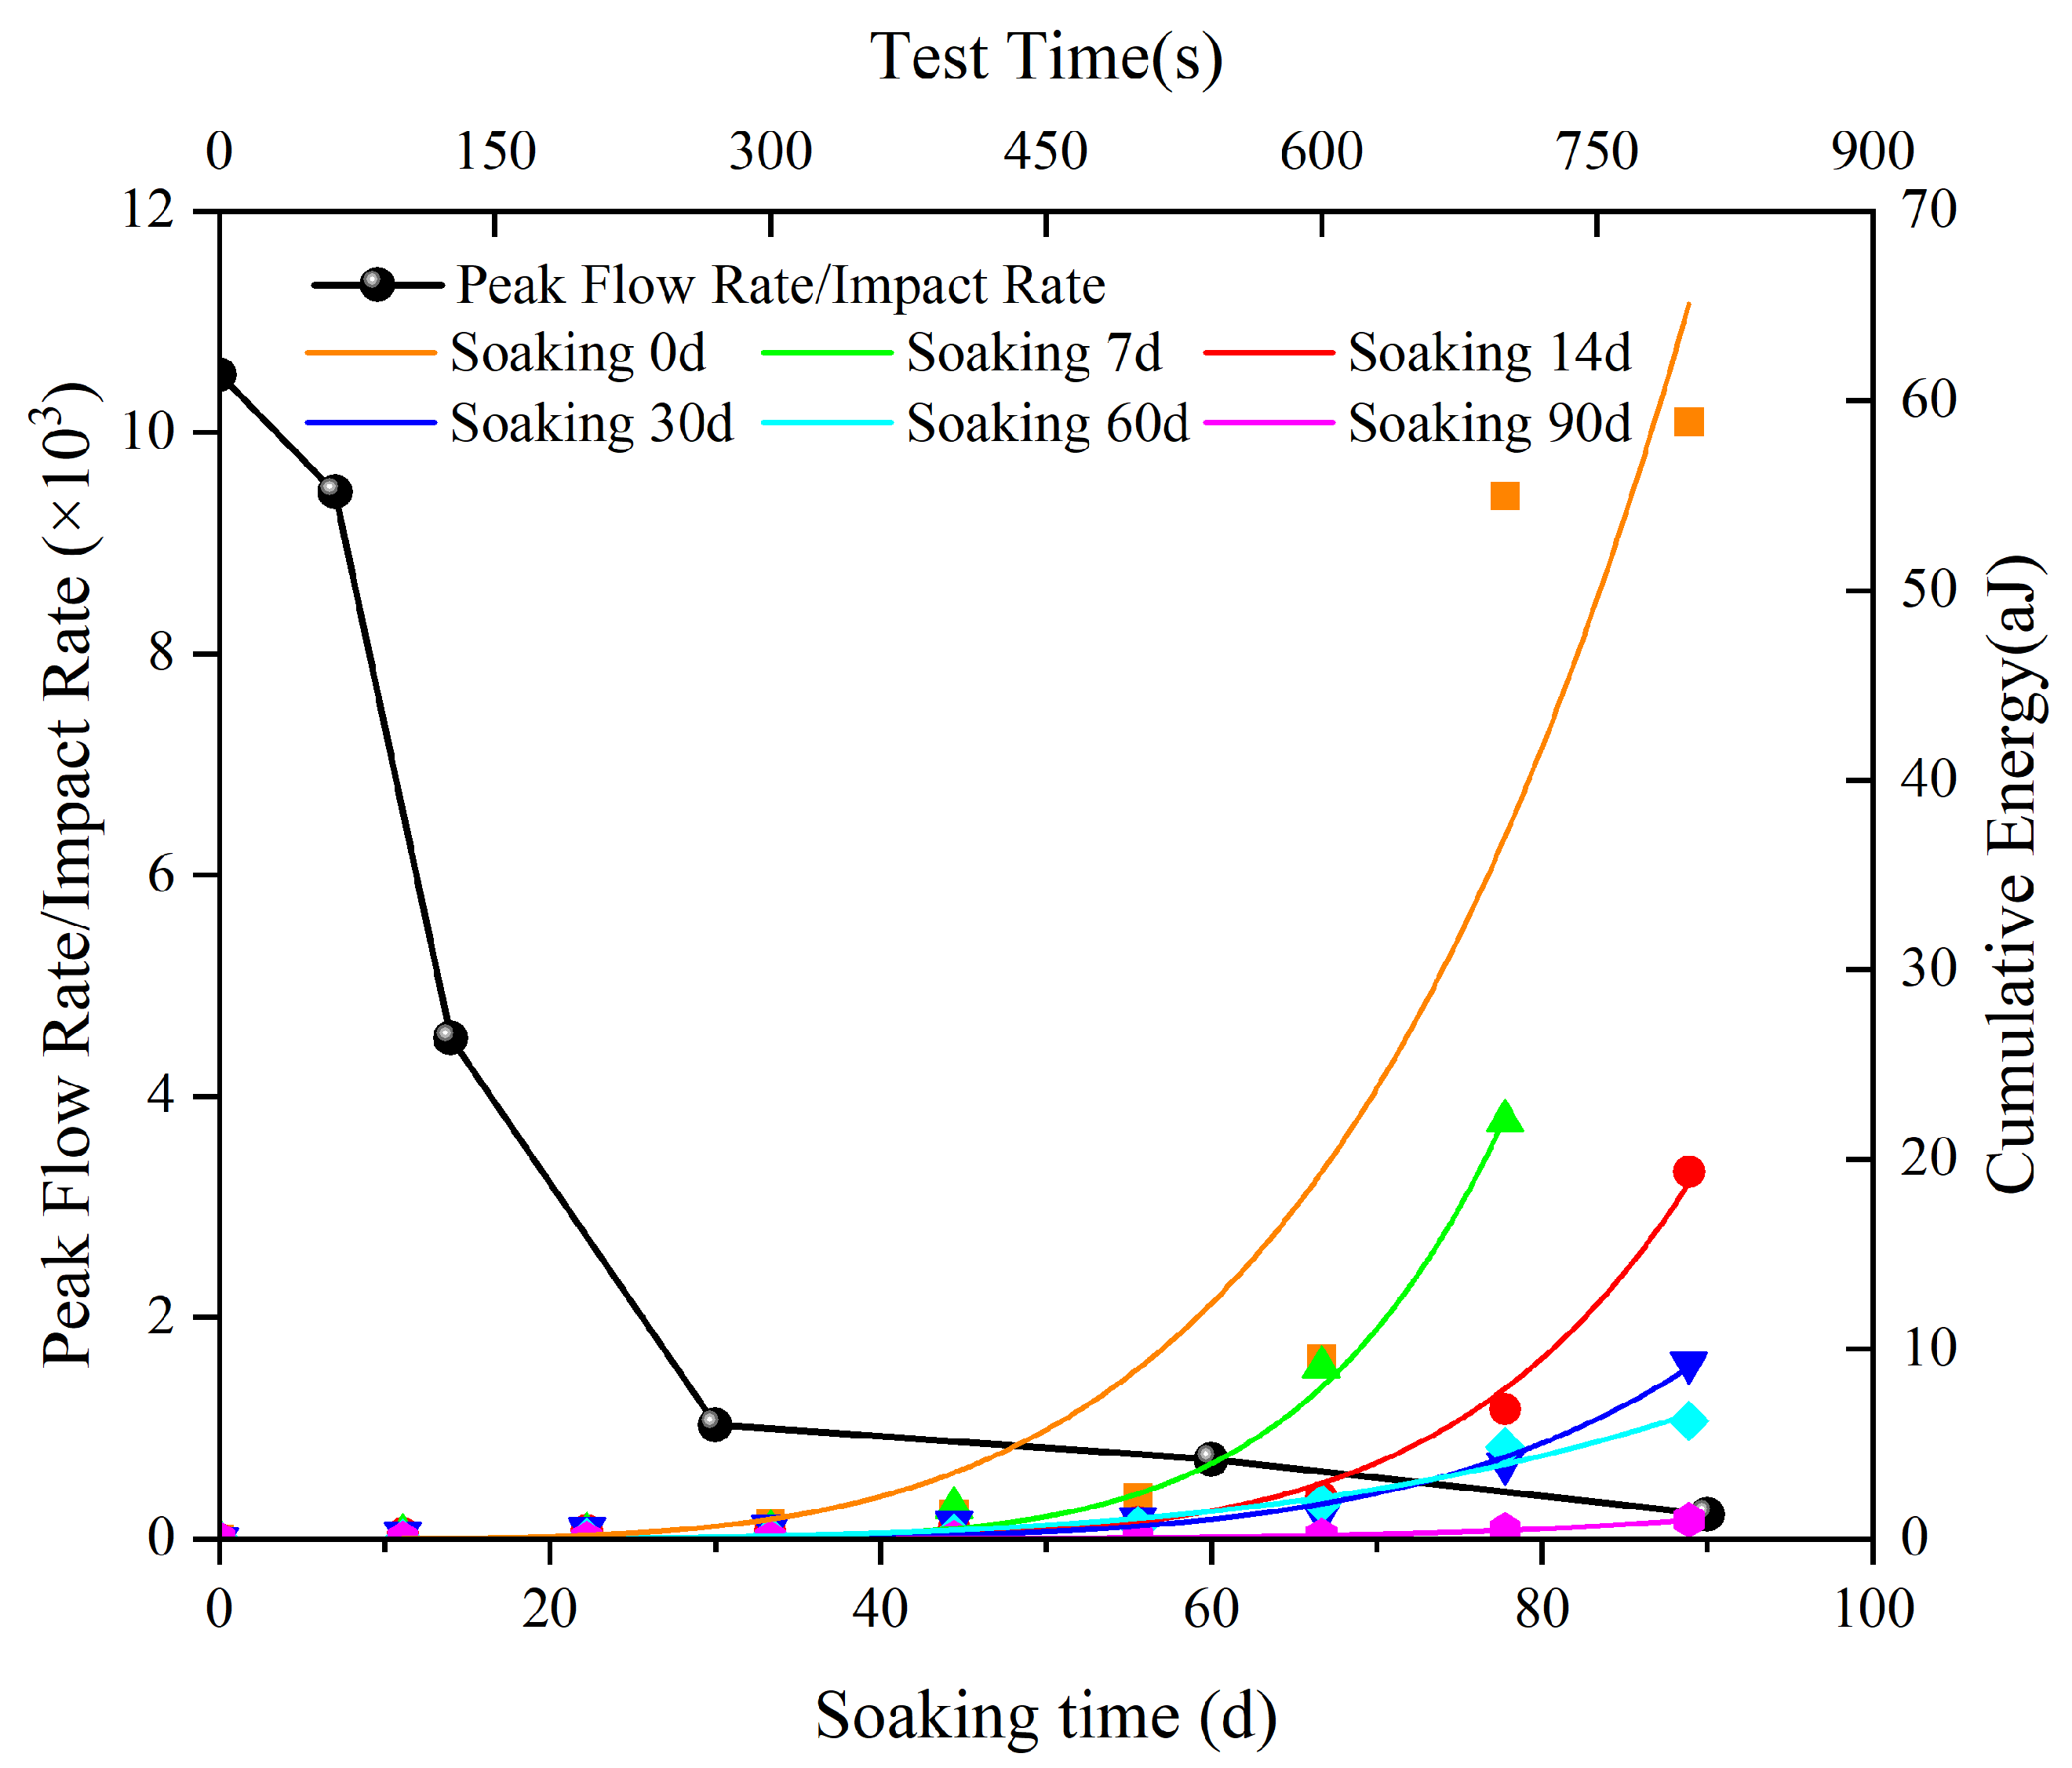
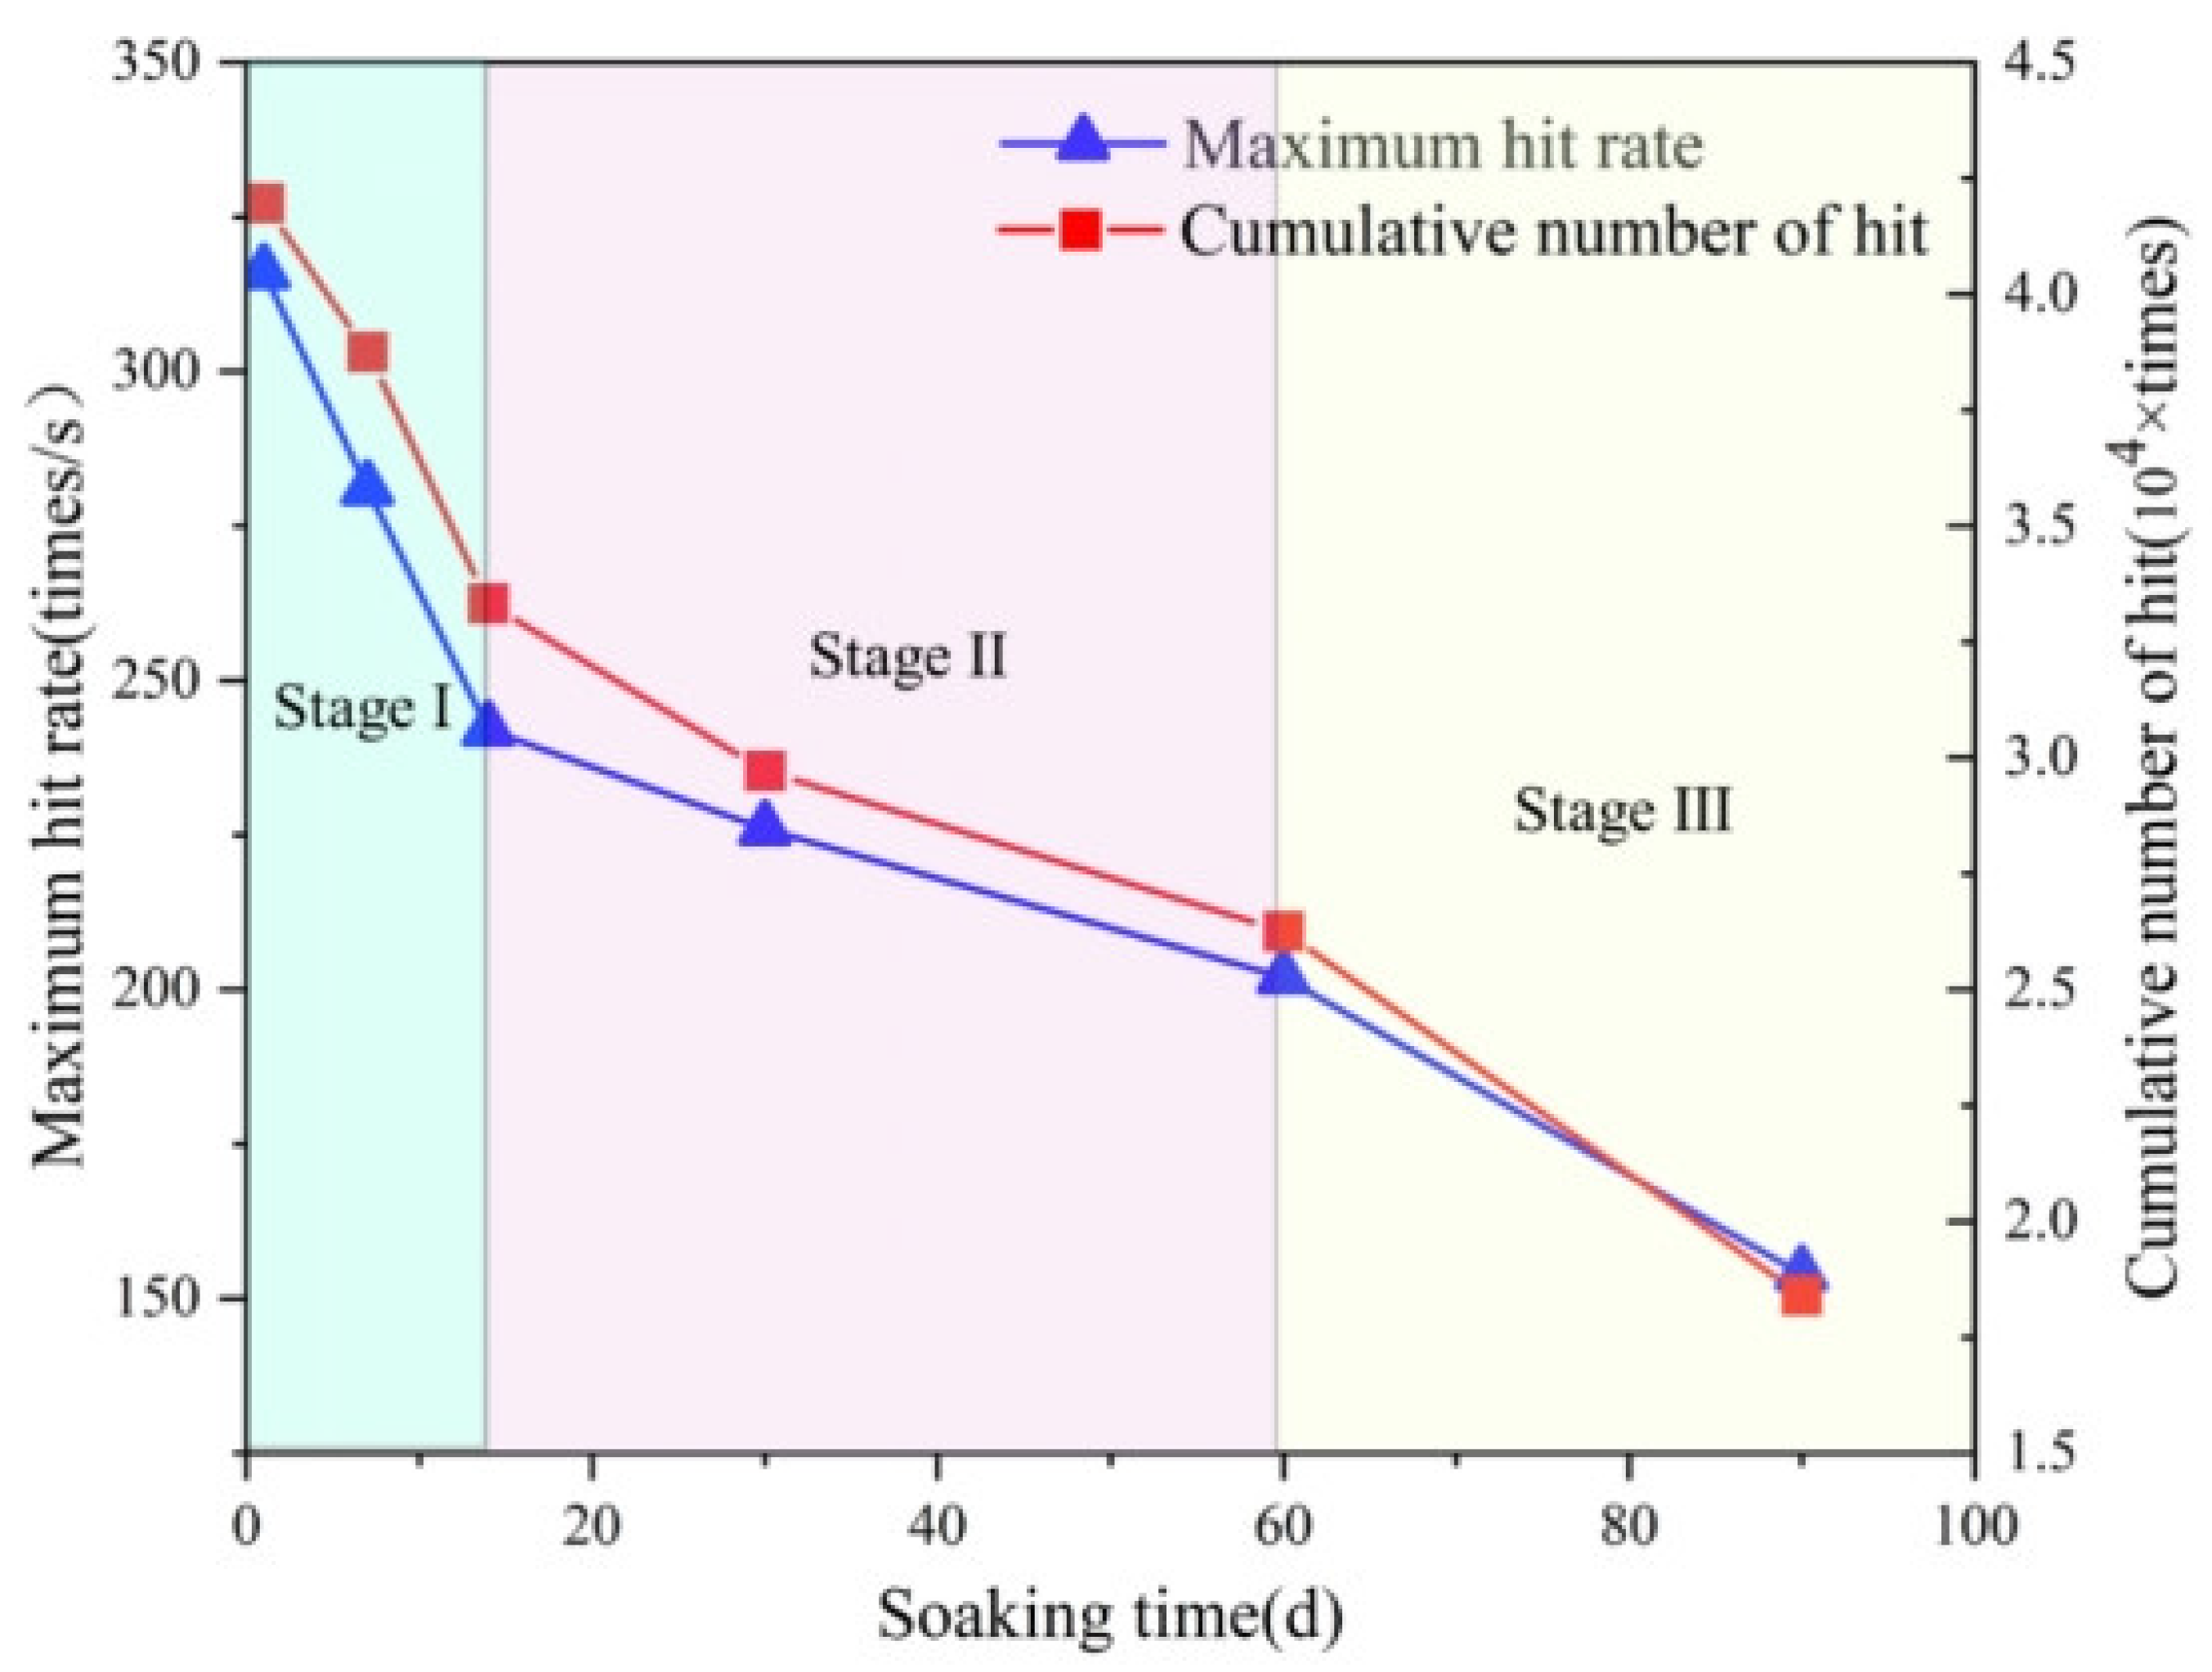
3.4.1. Energy Rate Characteristics

Figure 9 illustrates the quantitative variation curves of the peak energy rate/impact rate. It can be observed that with increasing soaking time, there is a gradual decrease in energy rate per impact. The energy rate per impact for dry sandstone is 10,522 counts. In contrast, the peak energy rates per impact for sandstone soaked for 7, 14, 30, 60, and 90 days are 9460, 4522, 1028, 717, and 198 counts, indicating a reduction of 10.1%, 57%, 90.2%, 93.2%, and 98.1% compared to dry sandstone, respectively. This result indicates that the severity of rock sample failure decreases with increasing soaking time. In rock, the energy released during tensile cracking exceeds that released during shear cracking [36,37]. The cumulative energy data indicate that with increasing soaking time, there is a gradual reduction in the rate of change in cumulative energy released by acoustic emission.
As observed in the fitted curve in Figure 9, the average cumulative energy was recorded every 100 s from the start of the uniaxial compression test until the fracture of samples at different soaking times. The secant line of the fitted curve shows a steady decrease in its slope, indicating a transition from brittle to plastic failure mode. Extensive experimental data and research indicate that tensile cracking occurs over a shorter time, while shear cracking takes longer. This trend aligns with the observed transition from tensile to shear failure in the rock samples.

3.4.2. Impact Characteristics

As shown in Figure 10 and Table 2, both the maximum impact rate and cumulative impact count decrease with increasing soaking time. For dry sandstone, the maximum impact rate is 316 counts, whereas the maximum impact rates for the other five groups with varying soaking times are 281, 242, 226, 202, and 154 counts, respectively. These rates decrease by 11.08%, 23.42%, 28.48%, 36.08%, and 51.27%, respectively, compared to the dry sandstone. The cumulative impact count for sandstone soaked for 90 days is 18,405 counts, a 56.14% decrease compared to the 41,964 counts for dry sandstone. As shown in Figure 10, the reduction in impact rate and cumulative impact count occurs in three distinct stages: the highest reduction rate occurs from 0–13 days, followed by a slower reduction rate from 13–60 days, and the slowest reduction rate from 60–90 days. Based on the microscopic changes in sandstone after soaking, it is known that water infiltration causes the internal pores of sandstone to gradually develop, enlarge, and interconnect. This weakens or even dislodges the cementation between clay particles within the rock, leading to a reduction in AE signal values in the sandstone.

3.4.3. Main Frequency Characteristics

Peak frequency serves as a crucial parameter for signal spectrum analysis [38]. It provides insights into the nature of the cracks that are formed [39], with shear cracks representing low-frequency signals and tensile cracks representing high-frequency signals. Figure 11a–e illustrate the scatter plots of the main frequency for sandstone at different soaking times and the trend lines of peak frequency. It can be observed that for soaking times lower than 30 days, the main frequency scatter points are mostly concentrated at 10–80 kHz, 100–120 kHz, and 250–300 kHz. When the soaking time exceeds 60 days, the scatter points at 100–120 kHz gradually disappear, and with a further increase in the soaking time, the proportion of scatter points at 250–300 kHz increases, while the proportion at 250–300 kHz decreases. At 90 days, the scatter points at 250–300 kHz are almost negligible, while a significant portion of the scatter points is concentrated at 10–80 kHz.
The variational trend curve of the main frequency shows that the values for samples soaked for 0, 7, 14, 30, 60, and 90 days are 220, 200, 160, 150, 140, and 120 kHz, respectively. This indicates that low-frequency acoustic emission signals become more apparent in sandstone samples at higher soaking times. Therefore, with increasing soaking time, the crack patterns in sandstone samples gradually shift from tensile cracks to shear cracks during uniaxial compression failure.
To better visualize the changes in proportion of each frequency band, the data from the above bar chart were compiled into the line chart in Figure 11g. It can be observed that the proportion of the 10–80 kHz band gradually increases with soaking time. The proportions at 0, 7, 14, 30, 60, and 90 days of soaking are 21.94%, 29.57%, 31.93%, 45.79%, 81.57%, and 91.38%, respectively. The proportion of the 250–300 kHz band gradually decreases, and the corresponding proportions are 66.71%, 58.17%, 51.14%, 35.73%, 17.65%, and 8.25%. This confirms the pattern identified previously in the qualitative analysis.

4. Discussion

The observed changes in microstructure and macroscopic mechanical properties can be explained by the following mechanisms:
(1) Composition, cementation mode, and pore structure characteristics of samples: Based on the relevant literature and standards, clay minerals in sandstone are primarily concentrated in intergranular pores or adhered to particle surfaces. They exist in dispersed, linear, bridge-like, and film-like forms. Integrating these results with the Scanning Electron Microscopy results in this study, a simplified diagram (Figure 12) was designed to demonstrate the distribution and variations in cementation, pore structure, water content, and crack formation in sandstone samples over different soaking durations. In Figure 12, it can be observed that with increasing soaking time, the number and size of microscopic cracks gradually increase, as indicated by the black lines. Water initially diffuses to the cementation points between the quartz framework and clay minerals. Therefore, cracks first form at these points. As soaking time progresses and water continues to diffuse, some clay minerals absorb water and expand, weakening the cohesion between their particles. These cracks then begin to extend between the clay minerals, increasing in both number and size. After 60 days of soaking, water has fully infiltrated the clay minerals, and the microcracks between the clay minerals gradually connect, leading to a loose connection between the clay minerals, accompanied by the peeling and detachment of the clay minerals. The reasons for these changes are primarily explained in Section 2 and Section 3.
(2) Forms of water: Water can exist in rocks in different forms, including gaseous, solid, and liquid states. Based on its proximity to rock particles, liquid water can be categorized into strongly bound water (less than 0.5 μm) closest to the particle surface, weakly bound water (5–10 μm) as the binding force decreases, capillary water due to surface tension, and free water [40]. These differences in water forms also lead to different reactions of feldspar sandstone components with water, as explained in (3).
(3) Mechanisms of hydration in feldspar sandstone components:
a. A schematic diagram of the sandstone components in a dry state is shown in Figure 13a. During the initial stage of rock soaking, the pore water is mainly composed of bound water. During the water absorption process, molecular forces are predominant, making it easier for water to enter larger pores between quartz particles [7]. As water molecules infiltrate the spaces between quartz particles, a bound water film forms at the cementation points between quartz particles and clay minerals in the sandstone. Under external load, the pore space is either compressed or stretched. When primary pores close and the pore walls come into contact, the bound water film acts as a lubricant, reducing friction between particles [41], as shown in Figure 13b.
b. As the soaking time reaches a certain level, in rocks containing clay minerals, some water adsorbs onto the surface of clay minerals, while some may interact with the interlayers of clay minerals. Instead of causing significant interlayer expansion, as seen in highly expansive clays, the primary effect is a thickening of the bound water film at the particle surfaces. This increases the intergranular spacing and leads to slight intergranular expansion, particularly in minerals like chlorite [42,43]. This mechanism results in a weakening of the cementation ability within the clay minerals, as the water influences the interactions between the particles.
c. Prolonged soaking leads to a gradual increase in water absorption by clay minerals. The XRD results indicate that the clay minerals in sandstone are predominantly kaolinite. Hydrogen bonds readily form between these planes, leading to strong interlayer attraction and tight crystal layer connections. However, for kaolinite, water mainly adsorbs onto the surface of the mineral, with little effect on interlayer spacing due to its small interlayer distance [44]. In contrast, chlorite exhibits more noticeable swelling upon contact with water. This swelling is partly due to the thickening of the bound water film at the particle surfaces, which increases the intergranular spacing and causes slight intergranular expansion (as observed by the changes in the sizes of chlorite and kaolinite unit cells in Figure 13a–d). Although the expansion is limited compared to more expansive minerals like montmorillonite, this mechanism plays a more significant role in chlorite compared to kaolinite [45,46]. The expansion stress generated can be significant enough to compress and displace the quartz framework, leading to new intergranular cracks [47]. Under external loads, the quartz framework deforms, compressing the pore space. If the pore space becomes less than the volume of free water within the pores, the incompressible water exerts pressure, resulting in the expansion of other micropores. This leads to the formation of interconnected cracks within the clay minerals. Moreover, if the crack tips adsorb free water, the high curvature at these crack tips indicates the difference in the properties of adsorbed water from the water adsorbed on the pore walls, significantly reducing the fracture energy of the rock and lowering the critical stress necessary for crack initiation [48]. This explains the decrease in the elastic modulus of the rock samples.
(4) Failure modes based on microscopic mechanisms: According to relevant standards and the experimental results, it can be inferred that clay minerals are relatively uniformly distributed within the quartz framework, as shown in Figure 14a. With increasing soaking time of sandstone, the clay minerals gradually expand. The analyses in (1), (2), and (3) above reveal increasingly irregular expansion, as shown in Figure 14b–d. Additionally, the area of cracks traversing the clay minerals gradually increases, leading to the formation of different failure states. Therefore, the failure modes through microscopic mechanisms offer a strong foundation for the mechanistic analysis presented above.
Although this study primarily focuses on the effect of water immersion on rock weakening, it is important to acknowledge that, in real-world conditions, water and mechanical load often act simultaneously on rocks. This synergistic effect could lead to more complex degradation mechanisms than those observed in this study. Future research should investigate the combined effect of water and mechanical load on rock failure, as these factors can interact to accelerate the weakening process [49,50]. Experiments simulating the combined effects of water immersion and mechanical loading will provide a more comprehensive understanding of rock behavior, especially in natural environments such as landslides, mining operations, and deep geological processes [8,51]. Exploring these coupled effects will be crucial for more accurately predicting rock stability under real-world conditions.

5. Conclusions

This investigation involved conducting unidirectional compression tests on sandstone specimens subjected to different immersion durations, namely 0, 7, 14, 30, 60, and 90 days. The research investigates the impact of sustained water–rock interaction processes on the deterioration of mechanical properties. The principal findings of the research are outlined below:
(1) The XRD results indicate that the samples were primarily composed of a quartz framework, clay minerals, and filler materials, with the most significant expansion of clay minerals occurring between 30 and 60 days. SEM analysis reveals the evolution of the sandstone’s pore structure through microscopic structural changes, including microcrack formation and changes in clay mineral morphology. As soaking time increased, microcracks initially formed at the cementation points between the quartz framework and clay minerals. These microcracks then expanded and propagated within the clay minerals, weakening their cohesion. After 60 days of soaking, the microcracks within the clay minerals progressively connected, leading to weak interconnections between the clay minerals.
(2) As soaking time increased, both the strength under compression and the elasticity of the sandstone decreased, with the most significant reduction occurring between 30 and 60 days, followed by a minimal decline from 60 to 90 days. These results were consistent with the XRD and SEM findings. The increase in Poisson’s ratio suggests a shift toward more plastic behavior of the rock under prolonged soaking.
(3) AE analysis was employed to investigate the impact, energy rate, and dominant frequency characteristics of sandstone samples. The results show that tensile cracks were approximately three times more prevalent than shear cracks in dry sandstone. After 60 days of soaking, shear cracks accounted for over 80% of the total, confirming the transition of failure modes from tensile to shear cracks under prolonged soaking conditions.
(4) From both microscopic observations and macroscopic mechanical test results, it can be concluded that under prolonged immersion, the rebinding effect reduces the critical stress required for crack initiation at crack tips. When expansion stress reaches a sufficient magnitude, it displaces quartz particles, promoting crack propagation and the formation of new intergranular cracks, thereby lowering the fracture energy of the rock. Furthermore, the ongoing expansion and compression of clay minerals facilitate water penetration, leading to interconnected crack development and an increased likelihood of shear slippage.

Author Contributions

Methodology and project administration, H.L.; writing—review and editing, W.D., J.L., and J.Z.; field research, T.Y.; manuscript writing, S.Z. All authors have read and agreed to the published version of the manuscript.

Funding

This work was supported by the National Natural Science Foundation of China (Grant number 52174070), the National Key Research and Development Program of China (Grant number 2022YFC2903902), and the Key Science and Technology Project of Ministry of Emergency Management of the People’s Republic of China (Grant number 2024EMST080802).

Institutional Review Board Statement

Not applicable.

Informed Consent Statement

Not applicable.

Data Availability Statement

The original contributions presented in the study are included in the article; further inquiries can be directed to the corresponding author.

Conflicts of Interest

The authors declare no conflicts of interest.

References

  1. Wang, C.; Min, H.; Zhu, T.; Wang, H.; Qin, W.; Zhang, G. Failure mechanism and stability analysis of the landslide: A case study for open pit iron mine in Xichang, Sichuan, China. Nat. Hazards 2023, 116, 663–691. [Google Scholar] [CrossRef]
  2. Zhang, Y.; Zhang, Z.; Xue, S.; Wang, R.; Xiao, M. Stability analysis of a typical landslide mass in the Three Gorges Reservoir under varying reservoir water levels. Environ. Earth Sci. 2020, 79, 42. [Google Scholar] [CrossRef]
  3. Li, J.; Gao, Y.; Yang, T.; Zhang, P.; Zhao, Y.; Deng, W.; Liu, H.; Liu, F. Integrated simulation and monitoring to analyze failure mechanism of the anti-dip layered slope with soft and hard rock interbedding. Int. J. Min. Sci. Technol. 2023, 33, 1147–1164. [Google Scholar] [CrossRef]
  4. Nie, L.; Li, Z.; Zhang, M.; Xu, L. Deformation characteristics and mechanism of the landslide in West Open-Pit Mine, Fushun, China. Arab. J. Geosci. 2015, 8, 4457–4468. [Google Scholar] [CrossRef]
  5. Zhang, Z.; Gao, F. Experimental investigation on the energy evolution of dry and water-saturated red sandstones. Int. J. Min. Sci. Technol. 2015, 25, 383–388. [Google Scholar] [CrossRef]
  6. Kim, E.; Stine, M.A.; de Oliveira, D.B.M.; Changani, H. Correlations between the physical and mechanical properties of sandstones with changes of water content and loading rates. Int. J. Rock Mech. Min. Sci. 2017, 100, 255–262. [Google Scholar] [CrossRef]
  7. Cai, X.; Cheng, C.; Zhao, Y.; Zhou, Z.; Wang, S. The role of water content in rate dependence of tensile strength of a fine-grained sandstone. Archiv. Civ. Mech. Eng. 2022, 22, 58. [Google Scholar] [CrossRef]
  8. Li, J.; Gao, Y.; Yang, T.; Zhang, P.; Deng, W.; Liu, F. Effect of water on the rock strength and creep behavior of green mudstone. Geomech. Geophys. Geo Energy Geo-Resour. 2023, 9, 101. [Google Scholar] [CrossRef]
  9. Li, H.; Qiao, Y.; Shen, R.; He, M.; Cheng, T.; Xiao, Y.; Tang, J. Effect of water on mechanical behavior and acoustic emission response of sandstone during loading process: Phenomenon and mechanism. Eng. Geol. 2021, 294, 106386. [Google Scholar] [CrossRef]
  10. Li, X.-f.; Du, K.; Zhou, J.; Yin, Z.-q. Failure behaviors of square-tunnel-structured rock specimens under various inclined boundary stress conditions. Eng. Fail. Anal. 2024, 157, 107888. [Google Scholar] [CrossRef]
  11. Xu, R.; Hu, Y.; Yan, Z.; Zhao, Y.; Li, Z. Experimental Investigation on the Effect of Water Saturation on the Failure Mechanism and Acoustic Emission Characteristics of Sandstone. Int. J. Geomech. 2024, 24, 04024102. [Google Scholar] [CrossRef]
  12. Zhou, Z.; Cai, X.; Ma, D.; Cao, W.; Chen, L.; Zhou, J. Effects of water content on fracture and mechanical behavior of sandstone with a low clay mineral content. Eng. Fract. Mech. 2018, 193, 47–65. [Google Scholar] [CrossRef]
  13. Zhao, K.; Yang, D.; Zeng, P.; Huang, Z.; Wu, W.; Li, B.; Teng, T. Effect of water content on the failure pattern and acoustic emission characteristics of red sandstone. Int. J. Rock Mech. Min. Sci. 2021, 142, 104709. [Google Scholar] [CrossRef]
  14. Chen, J.; Ye, Y.; Pu, Y.; Xu, W.; Mengli, D. Experimental study on uniaxial compression failure modes and acoustic emission characteristics of fissured sandstone under water saturation. Theor. Appl. Fract. Mech. 2022, 119, 103359. [Google Scholar] [CrossRef]
  15. Han, P.; Zhao, Y.; Zhang, C.; Wang, X. Progressive Damage Characteristic and Microscopic Weakening Mechanism of Coal Under Long-Term Soaking. Rock Mech. Rock Eng. 2023, 56, 7861–7881. [Google Scholar] [CrossRef]
  16. Li, M.; Lin, G.; Zhou, W.; Mao, X.; Zhang, L.; Mao, R.; Karinski, Y.S. Experimental Study on Dynamic Tensile Failure of Sandstone Specimens with Different Water Contents. Shock Vib. 2019, 2019, 7012752. [Google Scholar] [CrossRef]
  17. Qin, X.; Zhang, H.; Xu, R.; Zhang, J.; Yuan, C. Experimental investigation on the failure mechanism of grouted rock mass: Mesostructure and macroscopic mechanical behavior. Eng. Fail. Anal. 2024, 161, 108304. [Google Scholar] [CrossRef]
  18. Safari, H.; Balcom, B.J.; Afrough, A. Characterization of pore and grain size distributions in porous geological samples—An image processing workflow. Comput. Geosci. 2021, 156, 104895. [Google Scholar] [CrossRef]
  19. Wang, X.; Liu, Y.; Hou, J.; Wang, D.; Ji, L.; Sun, J.; Li, Y.; Yan, X. Impacts of water flooding on pore structure of sandstone reservoirs—Case study of Wang Guantun oilfield, Bohai Bay Basin, China. Arab. J. Geosci. 2018, 11, 580. [Google Scholar] [CrossRef]
  20. Fang, X.; Xu, J.; Wang, P. Compressive failure characteristics of yellow sandstone subjected to the coupling effects of chemical corrosion and repeated freezing and thawing. Eng. Geol. 2018, 233, 160–171. [Google Scholar] [CrossRef]
  21. Ping, Q.; Wang, C.; Gao, Q.; Shen, K.; Wu, Y.; Wang, S.; Li, X.; Jiang, Q. Experimental Study on Dynamic Compression Mechanics of Sandstone After Coupled Alkali-Chemical-Dynamic Interaction. Adv. Civ. Eng. 2022, 2022, 1970591. [Google Scholar] [CrossRef]
  22. You, S.; Ji, H.; Wang, T.; Song, Z. Thermal and mechanical coupling effects on permeability of weakly cemented sandstone. Emerg. Mater. Res. 2018, 7, 100–108. [Google Scholar] [CrossRef]
  23. Chai, Z.; Bai, J.; Sun, Y. Change of pore structure and Uniaxial compressive strength of sandstone under electrochemical coupling. Geomech. Eng. 2019, 17, 157–164. [Google Scholar] [CrossRef]
  24. Shi, H.; Zhang, H.; Song, L. Evolution of sandstone shear strength parameters and its mesoscopic mechanism. Geomech. Eng. 2020, 20, 29–41. [Google Scholar] [CrossRef]
  25. Zhao, J.; Tan, Z.; Wang, X.; Zhou, Z.; Li, G. Engineering characteristics of water-bearing weakly cemented sandstone and dewatering technology in tunnel excavation. Tunn. Undergr. Space Technol. 2022, 121, 104316. [Google Scholar] [CrossRef]
  26. Awadh, S.M.; Al-Sulttani, A.H.; Yaseen, Z.M. Temporal dynamic drought interpretation of Sawa Lake: Case study located at the Southern Iraqi region. Nat. Hazards 2022, 112, 619–638. [Google Scholar] [CrossRef]
  27. Bai, Y.; Shan, R.; Ju, Y.; Wu, Y.; Sun, P.; Wang, Z. Study on the mechanical properties and damage constitutive model of frozen weakly cemented red sandstone. Cold Reg. Sci. Technol. 2020, 171, 102980. [Google Scholar] [CrossRef]
  28. Brouwers, L.B. A Closer Look: Petrographic Analysis of Extremely Weak Sandstone/Cemented Sand of the Ghayathi Formation, Dubai, UAE. In International Congress and Exhibition “Sustainable Civil Infrastructures”; Springer International Publishing: Cham, Switzerland, 2020; pp. 12–19. [Google Scholar]
  29. Wang, Z.; Li, W.; Wang, Q.; Liu, S.; Hu, Y.; Fan, K. Relationships between the petrographic, physical and mechanical characteristics of sedimentary rocks in Jurassic weakly cemented strata. Environ. Earth Sci. 2019, 78, 131. [Google Scholar] [CrossRef]
  30. Zhang, Y.; Shao, J.F.; Xu, W.Y.; Sun, H.K. Stability analysis of a large landslide in hydropower engineering. Nat. Hazards 2014, 70, 527–548. [Google Scholar] [CrossRef]
  31. Fan, G.; Chen, M.; Zhang, D.; Wang, Z.; Zhang, S.; Zhang, C.; Li, Q.; Cao, B. Experimental Study on the Permeability of Weakly Cemented Rock under Different Stress States in Triaxial Compression Tests. Geofluids 2018, 2018, 9035654. [Google Scholar] [CrossRef]
  32. Zhang, W.; Zhang, D.; Han, C.; Ren, Q.; Zhou, W.; Wei, J. Experimental investigation of the microstructural evolution of weakly cemented sandstone under seepage erosion. Bull. Eng. Geol. Environ. 2023, 82, 440. [Google Scholar] [CrossRef]
  33. Cai, X.; Zhou, Z.; Zang, H.; Song, Z. Water saturation effects on dynamic behavior and microstructure damage of sandstone: Phenomena and mechanisms. Eng. Geol. 2020, 276, 105760. [Google Scholar] [CrossRef]
  34. Liu, Q.; Sun, Y.J.; Li, J. Experimental Study on Seepage Characteristics of Jurassic Weakly Cemented Sandstone Under Water-Rock Interaction. Geofluids 2020, 2020, 8543687. [Google Scholar] [CrossRef]
  35. Yu, J.X.; Duffaut, K.; Avseth, P. Stress sensitivity of elastic moduli in high-porosity cemented sandstone-Heuristic models and experimental data. Geophysics 2023, 88, MR185–MR194. [Google Scholar] [CrossRef]
  36. Zhou, Z.L.; Cai, X.; Li, X.B.; Cao, W.Z.; Du, X.M. Dynamic Response and Energy Evolution of Sandstone Under Coupled Static-Dynamic Compression: Insights from Experimental Study into Deep Rock Engineering Applications. Rock Mech. Rock Eng. 2020, 53, 1305–1331. [Google Scholar] [CrossRef]
  37. Miao, S.T.; Pan, P.Z.; Zhao, X.G.; Shao, C.Y.; Yu, P.Y. Experimental Study on Damage and Fracture Characteristics of Beishan Granite Subjected to High-Temperature Treatment with DIC and AE Techniques. Rock Mech. Rock Eng. 2021, 54, 721–743. [Google Scholar] [CrossRef]
  38. Zhang, Y.; Wu, W.; Yao, X.; Liang, P.; Sun, L.; Liu, X. Study on Spectrum Characteristics and Clustering of Acoustic Emission Signals from Rock Fracture. Circuits Syst. Signal Process. 2019, 39, 1133–1145. [Google Scholar] [CrossRef]
  39. Eaton, D.W.; van der Baan, M.; Birkelo, B.; Tary, J.-B. Scaling relations and spectral characteristics of tensile microseisms: Evidence for opening/closing cracks during hydraulic fracturing. Geophys. J. Int. 2014, 196, 1844–1857. [Google Scholar] [CrossRef]
  40. Yang, C.; Mao, H.; Huang, X.; Wang, X. Study on the variation on micostructure and mechanical properties of water-weakening slates. In Proceedings of EUROCK; Rock and Soil Mechanics: Wuhan, China, 2006; pp. 173–182. [Google Scholar]
  41. Jia, H.; Ding, S.; Wang, Y.; Zi, F.; Sun, Q.; Yang, G. An NMR-based investigation of pore water freezing process in sandstone. Cold Reg. Sci. Technol. 2019, 168, 102893. [Google Scholar] [CrossRef]
  42. Laird, D.A. Influence of layer charge on swelling of smectites. Appl. Clay Sci. 2006, 34, 74–87. [Google Scholar] [CrossRef]
  43. Shen, X.Y.; Zheng, X.J.; Bourg, I.C. A coarse-grained model of clay colloidal aggregation and consolidation with explicit representation of the electrical double layer. J. Colloid Interface Sci. 2025, 683, 1188–1196. [Google Scholar] [CrossRef]
  44. He, Y.L.; Niu, W.Z.; Gao, Z.W.; Dong, H.; An, S.Z.; Han, C.C.; Zhao, L. Adsorption Behavior of Asphaltene on Clay Minerals and Quartz in a Heavy Oil Sandstone Reservoir with Thermal Damage. Clays Clay Miner. 2022, 70, 120–134. [Google Scholar] [CrossRef]
  45. Wenk, H.R.; Bulakh, A. Minerals: Their Constitution and Origin; Cambridge University Press: Cambridge, UK, 2004. [Google Scholar]
  46. Rahromostaqim, M.; Sahimi, M. Molecular Dynamics Study of the Effect of Layer Charge and Interlayer Cations on Swelling of Mixed-Layer Chlorite-Montmorillonite Clays. J. Phys. Chem. C 2020, 124, 2553–2561. [Google Scholar] [CrossRef]
  47. Bian, K.; Liu, J.; Zhang, W.; Zheng, X.; Ni, S.; Liu, Z. Mechanical Behavior and Damage Constitutive Model of Rock Subjected to Water-Weakening Effect and Uniaxial Loading. Rock Mech. Rock Eng. 2019, 52, 97–106. [Google Scholar] [CrossRef]
  48. Rehbinder, P.; Lichtman, V. Effect of Surface Active Media on Strain and Rupture in Solids. In Proceedings of the Second International Congress of Surface Activity, London, UK, 8–13 April 1957; pp. 563–580. [Google Scholar]
  49. Li, Z.Q.; Nie, L.C.; Xue, Y.G.; Li, Y.; Tao, Y.F. Experimental Investigation of Progressive Failure Characteristics and Permeability Evolution of Limestone: Implications for Water Inrush. Rock Mech. Rock Eng. 2024, 57, 4635–4652. [Google Scholar] [CrossRef]
  50. Yang, Y.T.; Tang, X.H.; Zheng, H.; Liu, Q.S.; Liu, Z.J. Hydraulic fracturing modeling using the enriched numerical manifold method. Appl. Math. Model. 2018, 53, 462–486. [Google Scholar] [CrossRef]
  51. Yan, C.Z.; Xie, X.; Ren, Y.H.; Ke, W.H.; Wang, G. A FDEM-based 2D coupled thermal-hydro-mechanical model for multiphysical simulation of rock fracturing. Int. J. Rock Mech. Min. Sci. 2022, 149, 104964. [Google Scholar] [CrossRef]
Figure 1. Sampling locations and some feldspar sandstone samples: (a) Wulagen lead–zinc mine; (b) localized landslides; (c) feldspar sandstone samples.
Applsci 15 04777 g001
Figure 2. Schematic diagram of desiccator.
Applsci 15 04777 g002
Figure 3. The moisture content–time curve for the rock samples: (a) Sample test values; (b) Mean value of samples.
Applsci 15 04777 g003
Figure 4. A flowchart of the experimental procedure: (a) a schematic diagram of the experimental procedure; (b) an actual image of the uniaxial compression acoustic emission test setup.
Applsci 15 04777 g004
Figure 5. Structure and composition of rock samples: (a) electron microscope image; (b) magnified structure of sandstone; (c) 3D bar chart of variation in mineral content with soaking time; (d) line chart of variation in mineral composition with soaking time.
Applsci 15 04777 g005
Figure 6. SEM images of three stages at different soaking times: (a) dry state; (b) immersion for 7 days; (c) immersion for 30 days; (d) immersion for 60 days.
Applsci 15 04777 g006aApplsci 15 04777 g006b
Figure 7. Variational patterns of physical and mechanical indicators at different immersion times: (a) stress–strain curves; (b) compressive strength fitting curve; (c) elastic modulus fitting curve; (d) variational trend in Poisson’s ratio.
Applsci 15 04777 g007
Figure 8. Failure modes of samples soaked for 7, 14, 30, and 60 days: (a) actual damage photographs; (b) damage schematic diagrams.
Applsci 15 04777 g008
Figure 9. Quantitative curves of stress–energy rate/impact rat–cumulative energy–process time.
Applsci 15 04777 g009
Figure 10. Variations in maximum impact rate and cumulative impact count of sandstone with different soaking times.
Applsci 15 04777 g010
Figure 11. Scatter plots of main frequency versus time for sandstone at different soaking times: (a) dry state; (b) submerged for 7 days; (c) submerged for 14 days; (d) submerged for 30 days; (e) submerged for 60 days; (f) submerged for 90 days; (g) changes in number and proportion of three frequency bands of sandstone over soaking time.
Applsci 15 04777 g011
Figure 12. Simplified diagram of microstructural features at different soaking times: (a) dry state; (b) submerged for 14 days; (c) submerged for 30 days; (d) submerged for 60 days.
Applsci 15 04777 g012
Figure 13. Schematic diagram of intercrystallite structure changes in chlorite and kaolinite: (a) dry state; (b) submerged for 14 days; (c) submerged for 30 days; (d) submerged for 60 days.
Applsci 15 04777 g013
Figure 14. Schematic diagram of failure mode evolution based on microscopic mechanisms: (a) dry state; (b) submerged for 14 days; (c) submerged for 30 days; (d) submerged for 60 days.
Applsci 15 04777 g014
Table 1. Sandstone sample numbers and mechanical characteristics at different soaking times.
SampleSoaking Time/dPeak Stress/MPaPeak StrainElastic Modulus/MPa
TestedAverageTestedAverageTestedAverage
A0-1017.117.00.10310.1033934.2931.4
A0-216.90.1035926.8
A1-1712.612.00.10870.1088594.2591.4
A2-311.40.1089588.6
A1-51410.59.50.13560.1381440.8440.3
A2-58.50.1406439.8
A1-2308.47.90.15390.1481318.5316.3
A2-67.40.1423314.1
A1-6603.94.10.17540.1748211.4210.0
A2-44.30.1742208.6
A1-7903.63.00.19220.1870112.1108.2
A2-72.40.1818104.3
Table 2. Peak impact rate and cumulative impact count of sandstone at different soaking times.
Soaking Time/dPeak Impact RateDecline Rate/%Cumulative Number of ImpactsDecline Rate/%
0316041,9640
728111.0838,7547.65
1424223.4233,32820.58
3022628.4829,72229.17
6020236.0826,25637.43
9015451.2718,40556.14
Disclaimer/Publisher’s Note: The statements, opinions and data contained in all publications are solely those of the individual author(s) and contributor(s) and not of MDPI and/or the editor(s). MDPI and/or the editor(s) disclaim responsibility for any injury to people or property resulting from any ideas, methods, instructions or products referred to in the content.

