Article

Optimal Design and Seismic Performance of Base-Isolated Structures with Varying Heights Equipped with Tuned Inerter Dampers Subjected to Far-Fault and Near-Fault Ground Motions

1
Key Laboratory of Roads and Railway Engineering Safety Control, Shijiazhuang Tiedao University, Ministry of Education, Shijiazhuang 050043, China
2
Innovation Center for Wind Engineering and Wind Energy Technology of Hebei Province, Shijiazhuang 050043, China
3
School of Civil Engineering, Shijiazhuang Tiedao University, Shijiazhuang 050043, China
4
State Key Laboratory of Mechanical Behavior and System Safety of Traffic Engineering Structures, Shijiazhuang Tiedao University, Shijiazhuang 050043, China
*
Author to whom correspondence should be addressed.
Appl. Sci. 2025, 15(9), 4739; https://doi.org/10.3390/app15094739
Submission received: 6 March 2025 / Revised: 23 April 2025 / Accepted: 23 April 2025 / Published: 24 April 2025

Abstract

:
This paper investigates the optimal design of base-isolated structures equipped with tuned inerter dampers (TIDs) subjected to various ground motions. The Clough–Penzien model is employed to simulate the power spectrum of three types of ground motions: far-fault, near-fault without pulse subset, and near-fault with pulse subset, with the relevant parameters identified based on actual ground motions. The optimal parameters of the TID for base-isolated structures are determined using the H2 optimization criterion to reduce the structural displacement response. The impact of relevant design properties about the optimal parameters is analyzed. The seismic control effectiveness of the TID for 5-storey, 10-storey, and 15-storey base-isolated structures with varying heights is then evaluated through time history analysis, considering far-fault, near-fault without pulse subset, and near-fault with pulse subset ground motions. The main conclusions of this study are as follows: the ground motion type, the natural vibration period of the isolated structure, the damping ratio of the isolated structure and the mass ratio of the TID all affect the optimal parameters and should be analyzed based on specific circumstances. The control effectiveness of the TID on displacement and acceleration response is more pronounced under far-fault ground motion than under near-fault ground motion. The TID equipped in the isolation storey exhibits considerable effectiveness in controlling the seismic response of 5-storey and 10-storey base isolated structures, while it exhibits weaker control over the seismic response of the 15-storey structure. Additionally, while the TID primarily targets displacement response control, it also exhibits substantial control over the absolute acceleration response of the structure.

1. Introduction

Structures may undergo excessive vibrations when subjected to various dynamic loads, including earthquakes, winds, traffic, and other service-related loads. To ensure the resident comfort and structural safety of the structures, structural control systems are employed to minimize unwanted structural vibrations [1]. In general, these systems can be broadly divided into four main groups, namely passive, active, semi-active, and hybrid [2]. The passive control system is commonly used in engineering practice due to its advantages of low cost and high reliability [3]. As a typical passive control system, base isolation has garnered significant attention from scholars in the areas of isolation structure design, the development of isolation bearings, and the creation of efficient numerical models [4,5,6,7]. Base isolation successfully reduces the structural inter-storey drifts, but the structure itself undergoes unfavorable relatively large displacements [8]. One approach to reducing the displacement of base-isolated structures is to enhance the damping characteristics of the isolation layer, but it will increase the acceleration response of the primary structure, which brings a greater risk of damage to non-structural components [9,10]. As another typical passive control device, tuned mass dampers (TMD) are extensively adopted to suppress the vibration of structures [11]. Therefore, to decrease the displacement of the based-isolated structures, a hybrid system consisting of both base isolation and TMD have been proposed [12]. It is commonly accepted that the control effectiveness of the TMD is strongly dependent on the mass ratio between the TMD and the primary structure. Research has shown that a larger mass ratio is more advantageous in reducing seismic response compared to a smaller mass ratio [13,14,15,16,17]. However, the large mass ratio TMD systems are only suitable in limited circumstances, such as inter-storey isolation structures, mega-substructure systems, industrial structures with large mass ratio equipment, etc. [18]. Therefore, a smaller auxiliary mass is typically used to achieve control effects similar to those of the above system.
A type of mechanical component with two ends, introduced by Smith in 2002 and referred to as an inerter component, has garnered significant attention from researchers in recent years [19]. A key characteristic of the inerter is its ability to generate a force that is directly proportional to the relative acceleration across its terminals. The proportionality constant between the force and the acceleration has the same units as the physical mass and is called the inertance, apparent mass, or inerter coefficient, etc. The rack-and-pinion and ball-screw mechanisms are typical physical implementation schemes of inerters and are easy to manufacture [20,21,22,23,24]. The apparent mass of the inerter far exceeds its physical mass, which means they have excellent mass amplification effect. For example, Alicia, Lazar, and Nakamura have developed the inerters with mass amplification factors of 32.5, 175, and 3300, respectively [25,26,27]. Due to the special characteristic of the inerter, inerter-based damping systems have become a research hotspot recently in the field of controlling the dynamic response of civil structures [28,29,30].
Tuned inerter-based dampers and inerter-based TMD are two typical inerter-based damping systems [31]. The tuned inerter-based dampers are mainly composed of three elements: an inerter, a spring and a viscous damper, and these three elements are connected in series, parallel or hybrid [32,33,34]. Tuned viscous mass damper (TVMD), tuned inerter damper (TID), and tuned series viscous mass damper (TSVMD) are three basic types of the tuned inerter-based dampers. Among them, the inerter in the TID is installed in series with the spring and the viscous damper, similar to TMD [35]. On the other hand, in the inerter-based TMD, the inerter is primarily used in combination with the TMD to enhance its performance [36,37,38,39]. Previous studies on the two typical inerter-based damping systems primarily focused on parameter optimization and performance evaluation of the structures subjected to harmonic loads and white-noise random loads [40,41]. When the structure experiences ground motions, which are usually simulated with random loads, the reduction in the mean square of the structural response is usually selected as the optimization goal, which is also called H2 optimization [42]. Generally, both algebraic and numerical methods were used to solve the optimization problem. Although this optimization method yields favorable results, it does not consider variations in the spectral characteristics of ground motion, which may limit the seismic reduction effect from reaching the desired level. In recent years, the combination of tuned inerter-based dampers or inerter-based TMD with base-isolation structure has been proposed to be extensively studied [43,44,45,46]. Previous studies have primarily considered that the primary structure almost behaves almost like a rigid body, and it is typically simplified as a single-degree-of-freedom (SDOF) system, with its equivalent mass representing the total mass of the primary structure [47]. However, for multi-storey structures, the provided solutions may not be applicable, as the equivalent mass of the base-isolated structure is no longer a simple sum of the structural masses, and the impact of the damping in the isolated structure on parameter optimization must also be considered. More importantly, in the previous studies, the external excitation was often regarded as white-noise random loads, which cannot accurately describe the spectral differences between far-fault and near-fault ground motions [48,49,50,51]. In general, the parameters of ground motion cause the difference in the optimal parameters of the TID to increase progressively as the mass ratio rises [52]. Additionally, the optimal parameters of TID are closely related to the main structural damping [53]. Most of these valuable results are derived from the analysis of SDOF structures, while research on multi-degree-of-freedom structures remains relatively scarce. Therefore, investigating how to select the optimal parameters of TID for multi-storey seismic isolation structures under various ground motions, along with assessing its vibration reduction control effectiveness, offers significant practical value for engineering applications [54].
This paper examines the combination of the TID and base isolation, evaluating the seismic reduction effects of the TID on simplified seismic isolation structure models of three different heights. A more general parameter optimization scheme is constructed, which can be directly applied to the base-isolated structure with different damping ratios subjected to far-fault and near-fault ground motions. The optimal frequency ratio and optimal damping ratio of the TID were determined through a numerical optimization method according to the H2 optimization, when the ground motions are modelled as white-noise random process. Subsequently, influences of ground motion parameters on the optimal parameters of the TID are investigated, using the filtered Kanai–Tajimi spectrum to model far-fault and near-fault ground motions. The selection of optimal parameters for the TID system under various ground motions offers valuable guidance. Finally, the seismic performance of the TID with varying parameters for 5-storey, 10-storey, and 15-storey base-isolated structures was assessed, highlighting the impact of height on the damping effect of the TID.

2. Optimal Design of the TID

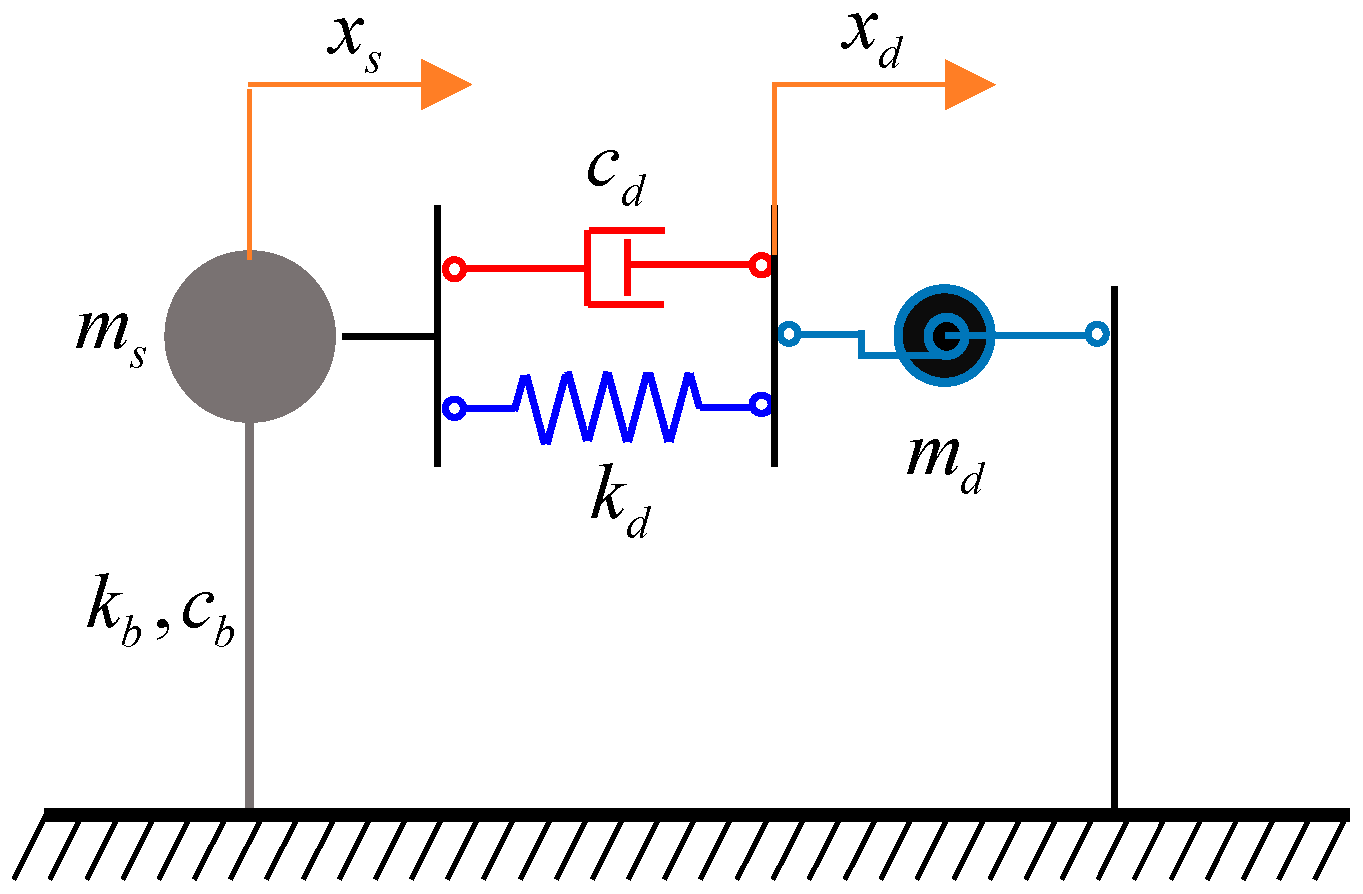
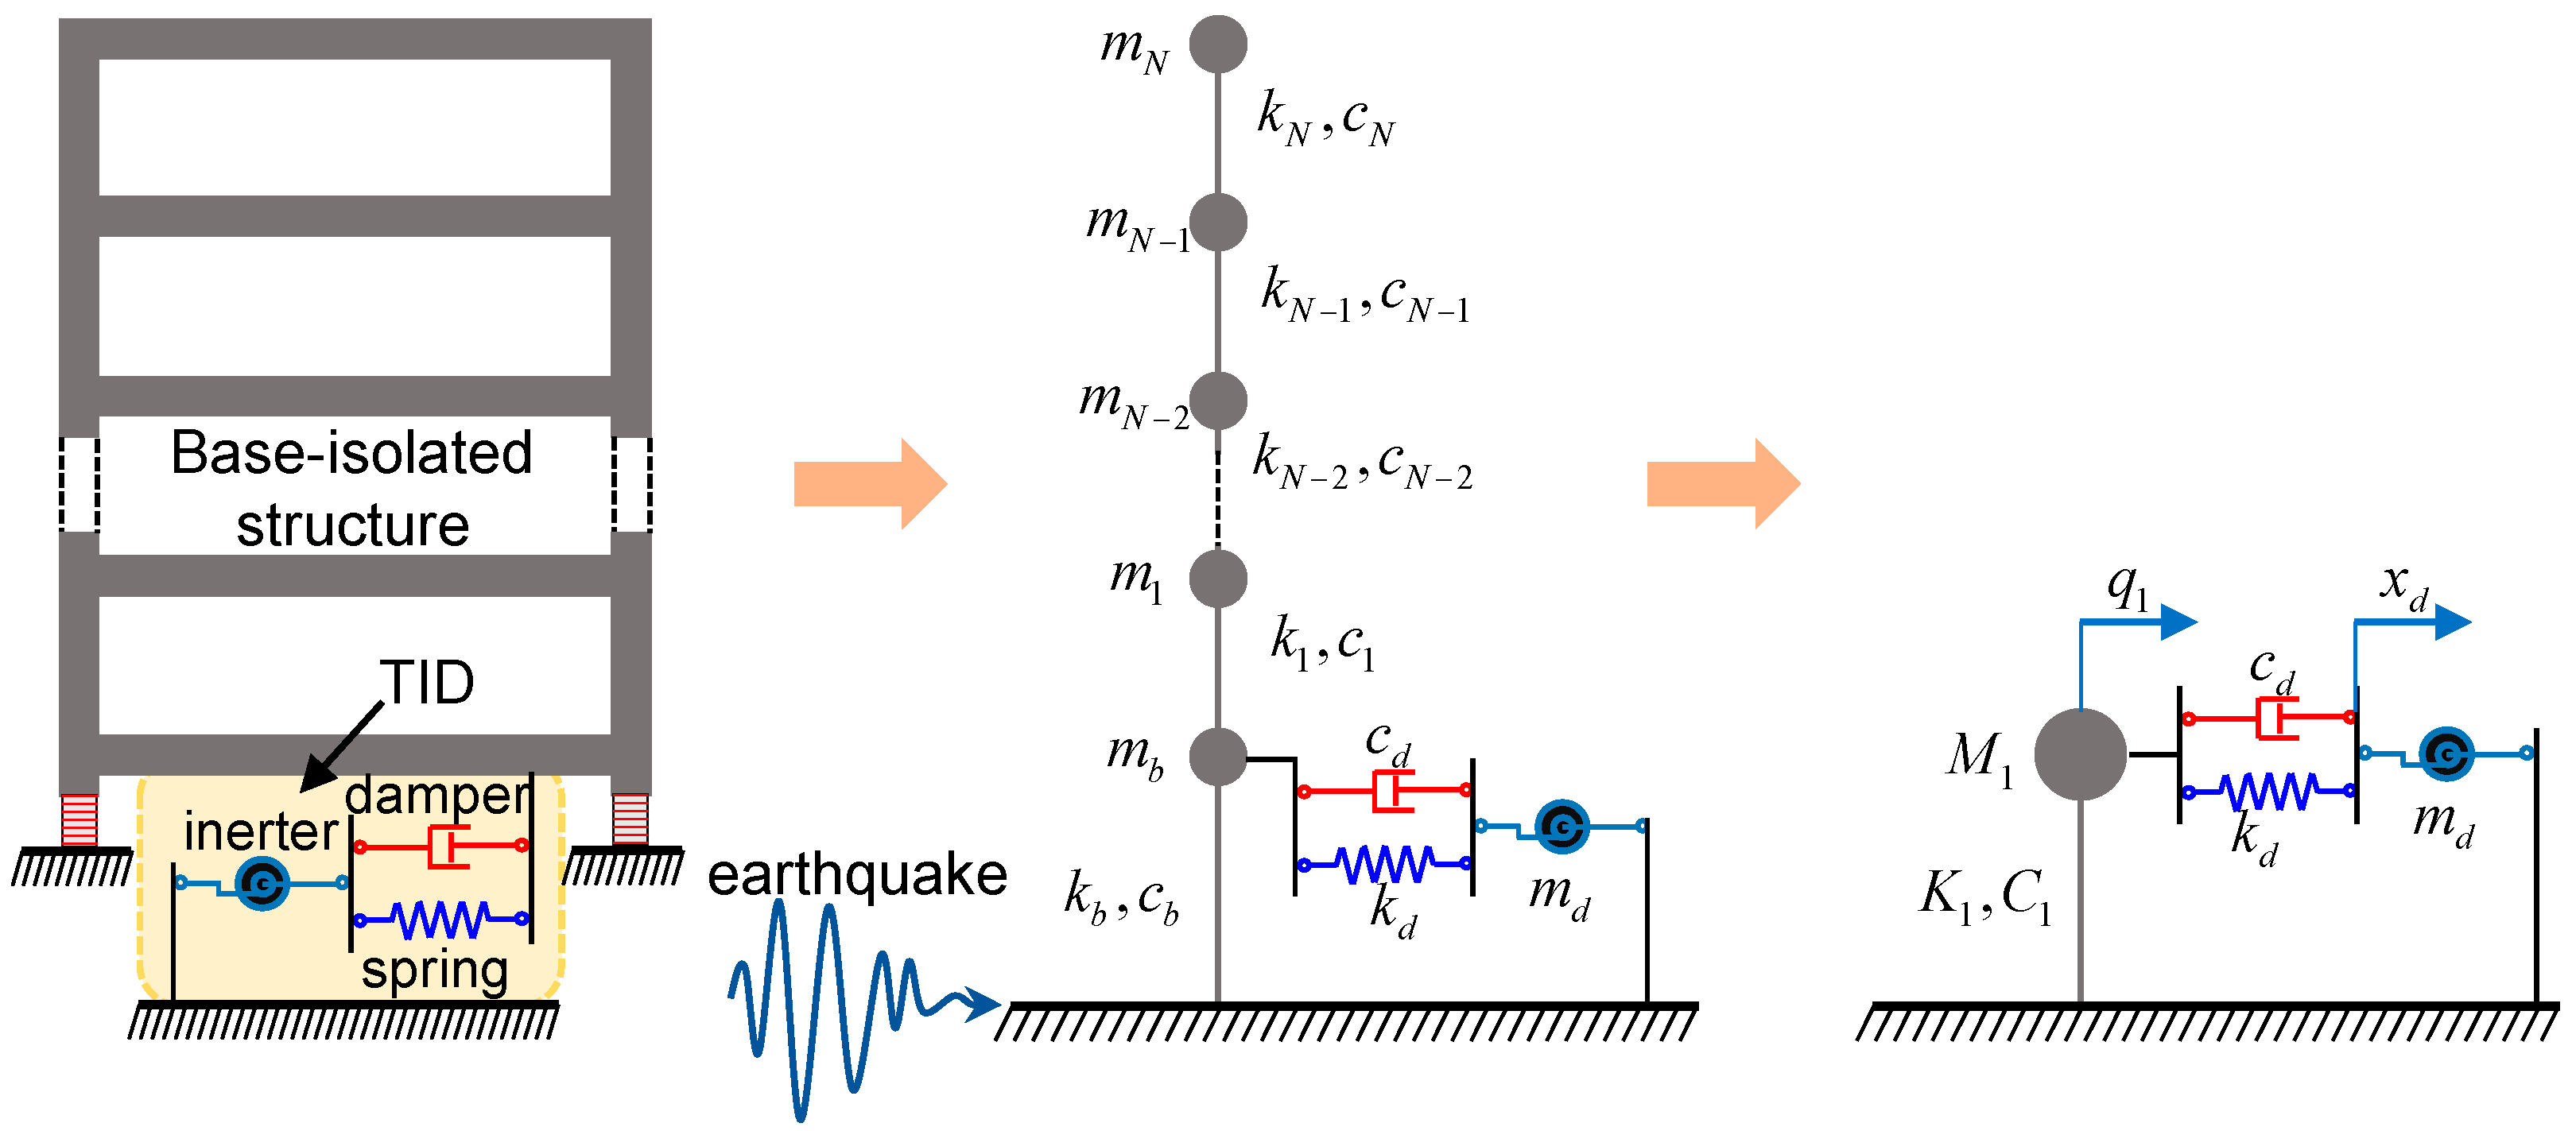
2.1. Mathematical Modelling

The first vibration mode of the base-isolated structure is represented by the SDOF structure, and its main dynamic characteristics are equivalent mass m s , viscous damping c b , and stiffness k b . A TID featured by inertial mass m d , viscous damping c d and stiffness k d is attached to the base-isolated structure as illustrated in Figure 1. The dynamic equilibrium equation of the structure equipped with a TID under the base acceleration excitation x ¨ g is given by Equation (1):
m s x ¨ s + c b x ˙ s + k b x s + c d x ˙ s x ˙ d + k d x s x d = m s x ¨ g m d x ¨ d + c d x ˙ d x ˙ s + k d x d x s = 0
In Equation (1), x s , x ˙ s , and x ¨ s represent the displacement, velocity, and acceleration vectors of the base-isolated structure, respectively, while x d , x ˙ d , and x ¨ d represent the displacement, velocity, and acceleration vectors of the TID, all referenced to the ground.
By setting U = x s x d T , Equation (2) is derived from Equation (1):
M U ¨ + C U ˙ + KU = m s 0 x ¨ g
in which
M = m s 0 0 b , C = c b + c d c d c d c d , K = k b + k d k d k d k d
Upon solving Equation (2), the frequency transfer function H ( ω ) between displacement response to the base acceleration excitation x ¨ g is expressed in Equation (4):
H ( ω ) = ω 2 M + i ω C + K 1 m s 0
in which ω is the frequency of the base acceleration excitation x ¨ g .
Based on Equations (3) and (4), the frequency transfer function H 1 ( ω ) relating the structural displacement x s to x ¨ g can be derived as shown in Equation (5):
H 1 ( ω ) = ω 2 + 2 i ξ d ω ω d + ω d 2 ω 2 + 2 i ξ b ω ω b + ω b 2 ω 2 + 2 i ξ d ω ω d + ω d 2 μ ω 2 2 i ξ d ω ω d + ω d 2
where
  ω b = k b / m s ,   ξ b = c b / 2 m s ω b ,   ω d = k d / m d ,   ξ d = c d / 2 m d ω d , μ = m d / m s
in which ω b and ξ b represent the frequency and damping ratio of the base-isolated structure, respectively; ω d , ξ d , and μ represent the frequency, damping ratio, and mass ratio of the TID, respectively.

2.2. Optimization Problem

The ground motion acceleration x ¨ g are usually modeled as stationary random processes, making the results independent of the specifics of the ground motion. σ 2 is expressed as the mean square displacement response of the base-isolated structure under the excitation of random loads.
σ 2 = | H 1 ω | 2 S ω d ω
S ( ω ) represents the spectral power density of the ground motion, which characterizes the distribution of power across different frequencies in the ground motion signal.
Let ground motion acceleration x ¨ g be represented by a stationary white-noise with constant power spectral density S 0 . This greatly simplifies the analysis of structural dynamic response and becomes a common model for simulating ground motions. Then Equation (7) can be expressed as Equation (8):
σ 2 = H 1 ω 2 S 0 d ω
Substituting the frequency transfer function from Equations (5)–(8), and solving the integrals of form, the σ 2 of the structure is expressed by
σ 2 = π S 0 ω b 3 A 0 A 1 B 2 2 A 0 A 3 B 1 2 2 B 0 B 2 + B 0 2 A 1 A 2 A 3 A 0 A 0 A 3 2 + A 1 2 A 1 A 2 A 3 A 0 = f 2 A 1 = 2 f ( ξ d + f ξ b ) A 2 = 1 + 4 f ξ b ξ d + ( 1 + μ ) f 2 A 3 = 2 ( ξ b + ( 1 + μ ) f ξ d ) B 0 = f 2 B 1 = 2 f ξ d B 2 = 1
It is seen that σ 2 is a function of ω b , ξ b , μ , f , and ξ d . Specifically, ω b and ξ b are modal parameters of the base-isolated structure. Hence, σ 2 is mainly determined by the TID parameters μ , f , and ξ d . For convenience, μ is usually selected first. Subsequently, f and ξ d correspond to various values of μ are optimized to minimize σ 2 for the specified structure. The expression of objective function is as shown in Equation (10):
min f ,   ξ d   σ 2 f ,   ξ d s . t .   f 0 ,   ξ d 0
The energy distribution of the white-noise process in the frequency domain is uniform, which cannot reflect the differences caused by the site, distance, etc., in the actual ground motion. Therefore, using the Clough–Penzien spectrum is more suitable for structural seismic performance assessment. The power spectral density function of the Clough–Penzien spectrum is defined by Equation (11):
S ω = ω g 4 + 4 ξ g 2 ω g 2 ω 2 ω g 2 ω 2 2 + 4 ξ g 2 ω g 2 ω 2 ω 4 ω f 2 ω 2 2 + 4 ξ f 2 ω f 2 ω 2 S w
in which, ω s , ξ g , ω f , and ξ f are the key parameters of the power spectrum model, which have a strong correlation with the site characteristics. S W is the spectral density, which is generally believed to have a strong correlation with the amplitude of base acceleration excitation.
Ground motion varies significantly with fault distance. To fully account for the impact of seismic loads, it is recommended to select different categories of ground motions for separate analysis. The PEER database provides a method for selecting ground motions at different fault distances. For routine analysis, PEMA P695 provides 20 far-field seismic motions, 12 near-fault non-pulse seismic motions, and 10 near-fault pulse seismic motions [55]. The details of the selected ground motion records are presented in Table 1, Table 2 and Table 3. Figure 2 shows the pseudo-acceleration response spectra, power spectral density and estimated parameters of the ground motions. Notably, the estimated parameters are obtained by fitting the Clough–Penzien spectrum S ( ω ) to the averaged power spectral density (PSD) for each group of ground motions. It is seen that the fitting result matches well with the target, indicating the Clough–Penzien spectrum captures well the frequency content of different ground motions. Unlike far-fault ground motions, near-fault ground motions contain more long-period or low-frequency components. Moreover, near-fault ground motions with pulse subset exhibit this feature more obviously.
The power spectrum parameters of the three types of ground motions are as follows: ω g = 13.22 ,   ξ g = 0.75 ,   ω f = 0.83 ,   ξ f = 0.97 for the far-fault ground motions; ω g = 9.04 ,   ξ g = 0.98 ,   ω f = 1.38 ,   ξ f = 0.89 for the near-fault ground motions without pulse subset; ω g = 6.78 ,   ξ g = 0.96 ,   ω f = 0.83 ,   ξ f = 0.87 for the near-fault ground motions with pulse subset. After obtaining the above power spectrum parameters, it can be seen from Equations (7) and (11) that the expression of objective function can also be expressed by Equation (10).

2.3. Optimization Method

As shown in Equation (10) of Section 2.2, the optimization problem outlined above is equivalent to addressing the constrained optimization problem of the binary function. However, the complexity of the objective function makes it difficult to obtain the theoretical solution, so the use of numerical optimization methods to calculate the optimal values is a more feasible option. In this paper, the FMINCON function provided by MATLAB (2024a) Optimization Toolbox was adopted. The function descriptions of the FMINCON are
m i n x f ( x ) s . t .   l b x u b ;   A x b ;   A e q x = b e q ;   c ( x ) 0 ;   c e q ( x ) = 0
in which x denotes a vector of variables. f(x) represents a scalar function of x. The values of x are constrained by lb and ub, with lb denoting the lower bound and ub denoting the upper bound. The coefficient matrices and constant vectors for linear inequalities are denoted by A and b, respectively. Aeq and beq represent the coefficient matrices and constant vectors corresponding to the linear equalities. The functions c(x) and ceq(x) take x as input and return vectors. It is important to note that f(x), c(x), and ceq(x) may be nonlinear functions.
It can be seen from Equation (12) that the FMINCON function can be applied to the TID optimization problem described in Equation (10), where the matrix A is defined as [1 0;0 −1], and the vector b is defined as [0;0], which are used to specify the boundary conditions for the frequency ratio and damping ratio. The remaining parameters lb, ub, Aeq, beq, are not considered in this optimization problem. As a special case, Pan et al. [34] deduced the theoretical solution of the optimal frequency ratio f o p t and optimal damping ratio ξ o p t of the TID under white-noise excitation on the premise that the damping ratio of the base-isolated structure is 0, as shown in Equation (13). Based on this, Figure 3 shows the numerical optimization results obtained by the FMINCON function and the calculation results of Equation (13). It can be seen from the results that the optimal parameters derived from both methods are in agreement, which verifies the accuracy of the numerical optimization method.
f o p t = 1 + μ / 2 1 + μ ,   ξ d o p t = μ 1 + 3 μ / 4 4 1 + μ 1 + μ / 2

2.4. Optimization Results

The case that the loads on the structure are white noise excitations is first considered. From Equation (9), it can be identified that the optimal parameter for a specific mass ratio is related to the damping ratio of the isolation structure, but is independent of its natural frequency of vibration. The optimal parameters for TID with different mass ratios are presented in Figure 4, when the damping ratios ξ b of the base-isolated structure are 0.05, 0.1, 0.15, 0.2, and 0.25, respectively. Through observation, the optimal frequency ratio f is inversely proportional to the mass ratio μ and the damping ratio ξ b of the base-isolated structure. In addition, it is observed that the optimal damping ratio ξ d is proportional to the mass ratio μ and it is also independent of the damping ratio ξ b of the base-isolated structure. For convenience, the curve-fitting method based on the least-squares principle was used to fit the optimal parameters curves of the TID. The expressions of the fitting formulas in terms of mass ratio μ and damping ratio ξ b of the base-isolated structure are given in Equation (14). As shown in Figure 4, there is a close agreement between the optimal parameters of the TID given by numerical optimization and the fitting formulas (FF). The errors of the fitting formulas are no greater than 0.5% for all mass ratios, which satisfies the actual design requirements of the TID.
f o p t = 1 + μ / 2 1 + μ 0.49 μ ξ b + 0.37 μ ξ b ,   ξ d o p t = μ 1 + 3 μ / 4 4 1 + μ 1 + μ / 2
Next, in the case of modeling three kinds of ground motion power spectrum with Clough–Penzien spectrum, the optimal parameters of TID are solved. In this case, the optimal parameters for a specific mass ratio are related to both the damping ratio and the natural vibration frequency of the based-isolated structure, which is different from the above-mentioned case of white noise excitation. Figure 5 shows the connection between the optimal parameters of the TID and the dynamic characteristics (damping ratio and natural vibration period) of the based-isolated structure, respectively, for the far-fault, no pulse near-fault and pulse near-fault ground motions when μ is equal to 0.2. From the figure, the following distribution characteristics of the optimal parameters can be made: (a) the impact of the dynamic characteristics of the based-isolated structure on the optimal parameters is similar for these three kinds of ground motion. Moreover, the optimal frequency ratio and optimal damping ratio are most significantly influenced by the dynamic characteristics of the based-isolated structure for the no pulse near-fault ground motions. (b) The optimal frequency ratio and optimal damping ratio are basically proportional to the natural vibration period. For the far-fault, no pulse near-fault and pulse near-fault ground motions, when the natural vibration period is changed from 1 s to 6 s, the optimal frequency ratio is increased by 11.8%, 29.3%, and 17.5%, the optimal damping ratio is increased by 6.0%, 32.0%, and 15.9%, respectively. (c) The impact of the damping ratio of the based-isolated structure on the optimal parameters is significant with the increase of the natural vibration period. Specifically, the larger the damping ratio of the isolation structure is, the larger the optimal frequency ratio and optimal damping ratio of the TID are.
To evaluate the impact of the mass ratio on the optimal parameters of the TID, the mass ratio was taken from 0.05 to 1.0 at intervals of 0.05, and the period and damping ratio of the based-isolated structure are combined in two groups, namely T b = 1   s ,   ξ b = 0.15 and T b = 6   s ,   ξ b = 0.15 , respectively. Figure 6 shows the optimal frequency ratio and damping ratio of the TID with different mass ratio, for the far-fault, no pulse near-fault and pulse near-fault ground motions, and shows the optimal parameters under white-noise excitation as shown in Equation (14) for comparison at the same time. It can be seen that the variation trend of the optimal parameters with the mass ratio under these three types of ground motion is similar to that under the white-noise excitation. However, the larger the mass ratio is, the larger difference between the optimal parameters under different excitations is. When the base-isolated structure has a period of 6 s, the optimal parameters under the no pulse near-fault ground motion are notably higher than those observed under both far-fault and near-fault pulse ground motion, while the optimal parameters of the latter two conditions are very close. This is due to the strong correlation between the optimal parameter values and the ratio of the frequency of the base-isolated structure to the filter parameters of the power spectrum model. It can be observed that the filter parameters of far-fault ground motion are equal to those of near-fault pulse ground motion, but significantly distinct from those of near-fault non pulse ground motion. This has led to the phenomenon of differences in the optimal parameters mentioned above.
In summary, the optimal parameters are affected by many factors, such as the natural vibration period and damping ratio of the base-isolated structure, the mass ratio of the TID, and the type of excitation load. Therefore, the optimal parameters for identifying TID must comprehensively consider the impact of the detailed dynamic characteristics of the base-isolated structure.

2.5. Control Effectiveness

This section showcases the control effectiveness of the TID for various ground motions. In order to quantitatively evaluate the control effectiveness, the displacement reduction ratio J of the base-isolated structure is expressed in Equation (15):
J = σ w 2 σ w o 2 = y w ( ω ) 2 S ω d ω y w o ( ω ) 2 S ω d ω
where σ w o 2 and σ w 2 are the mean squared displacement responses of the base-isolated structure with and without TID, respectively. y w o ( ω ) and y w ( ω ) are the frequency transfer function between the displacement of the base-isolated structure and the base acceleration excitation, respectively.
Figure 7 shows the control effectiveness of the TID with mass ratios of 0.2 and 0.5 for the base-isolated structure corresponding to the far-fault, no pulse near-fault and pulse near-fault ground motions, respectively. The results of the three conditions have the similar trends, that is, the larger the damping ratio of the base-isolated structure is, the smaller the displacement reduction ratio is. Conversely, the control effectiveness of the TID exhibits a negative correlation with the isolation period, but the degree of influence is much weaker than the impact of the damping ratio.
In addition, the mass ratio and control effectiveness also have a strong correlation. For further investigating the impact of the mass ratio, the period and damping ratio of the based-isolated structure are combined in two groups as in the previous section. Figure 8 shows the relationship between the control effectiveness and the mass ratio of the TID. The control effectiveness of the TID under white-noise excitation are also shown in the figure for comparison. Another point to note is that the control effectiveness of the TID under white-noise excitation is only related to the damping ratio of the based-isolated structure, and has nothing to do with the natural vibration period of the based-isolated structure. As illustrated in Figure 8 the effectiveness of TID in reducing structural vibration is very significant. When the mass ratio <0.2, the displacement reduction ratio J decreases sharply, however, after the mass ratio exceeds 0.2, the benefit of increasing the mass ratio is no longer significant. Another result shows that the control effectiveness of the TID under three types of ground motion is better than that under white-noise excitation, and it increases with the increase of the natural vibration period. However, the difference among the control effectiveness of the TID under the three ground motions is not obvious, especially when the mass ratio is less than 0.2. Therefore, for engineering practice, considering that if the designed mass ratio is too large, the economic cost will be significantly increased, so adopting a suitable mass ratio (<0.2) can often achieve ideal control requirements.

3. Seismic Control Effectiveness of the TID for Base-Isolated Structures

In this part, how to apply the above optimal design method to the multi-storey base-isolated structure will be introduced, and the seismic control effectiveness of the TID for base-isolated structures with different numbers of storeys under the action of actual ground motions will be verified.

3.1. Optimal Design of Base-Isolated Structures Equipped with a TID

Figure 9 illustrates the modeling of a shear model with N degrees of freedom and the installation of the TID in the multi-storey base-isolated structure.
The dynamic equilibrium equation of the structure equipped with a TID under x ¨ g is given by Equation (16):
M X ¨ + C X ˙ + KX + c d x ˙ 1 x ˙ d D + k d x 1 x d D = MI N x ¨ g m d x ¨ d + c d x ˙ d x ˙ 1 + k d x d x 1 = 0
In Equation (16), M, C, and K represent the mass, damping, and stiffness matrices of the base-isolated structure, respectively. Additionally, Χ , Χ ˙ , and Χ ¨ represent the displacement, velocity, and acceleration vectors of the base-isolated structure, all referenced to the ground. I N is a unit vector, while x 1 and x ˙ 1 refer to the displacement and acceleration of the first storey of the structure. Finally, D = 1 , 0 , 0 , 0 , 0 , , 0 T is the N-dimensional position vector of the TID.
For base-isolated structures, the first-order vibration mode typically has the greatest influence on the seismic response. Therefore, this vibration mode is often selected as the primary control mode. Let M 1 , C 1 , and K 1 represent the modal mass, modal damping, and modal stiffness associated with the first-order vibration mode, respectively. The generalized coordinates for the first-order vibration mode are denoted by q , while Φ 1 represents the first mode shape vector, and ϕ 11 is the first element of this vector. For convenience, the mode shape vector is normalized such that its first element, corresponding to the base story, is set to one, i.e., ϕ 11 . By performing mode decomposition of Equation (16), Equation (17) can be derived as follows:
M 1 q ¨ 1 + C 1 q ˙ 1 + K 1 q 1 + c d q ˙ 1 x ˙ d + k d q 1 x d = Φ 1 T MI N x ¨ g m d x ¨ d + c d x ˙ d q ˙ 1 + k d x d q 1 = 0
It can be observed that Equations (1) and (15) have the same form, so the above optimization results can be directly extended to the multi-storey base-isolated structure. Similarly, the system’s mechanical parameters are represented by Equation (18) as follows:
η 1 = Φ 1 T MI N / M 1 ,   ω 1 = K 1 / M 1 ,   ξ 1 = C 1 / 2 M 1 ω 1 ,   ω d = k d / m d ,   ξ d = c d / 2 m d ω d ,   μ = m d / M 1
in which η 1 , ω 1 , and ξ 1 are the first mode participation factor, structural modal frequency, and structural mode damping ratio, respectively; ω d , ξ d , and μ are still the frequency, damping ratio and mass ratio of the TID, respectively.

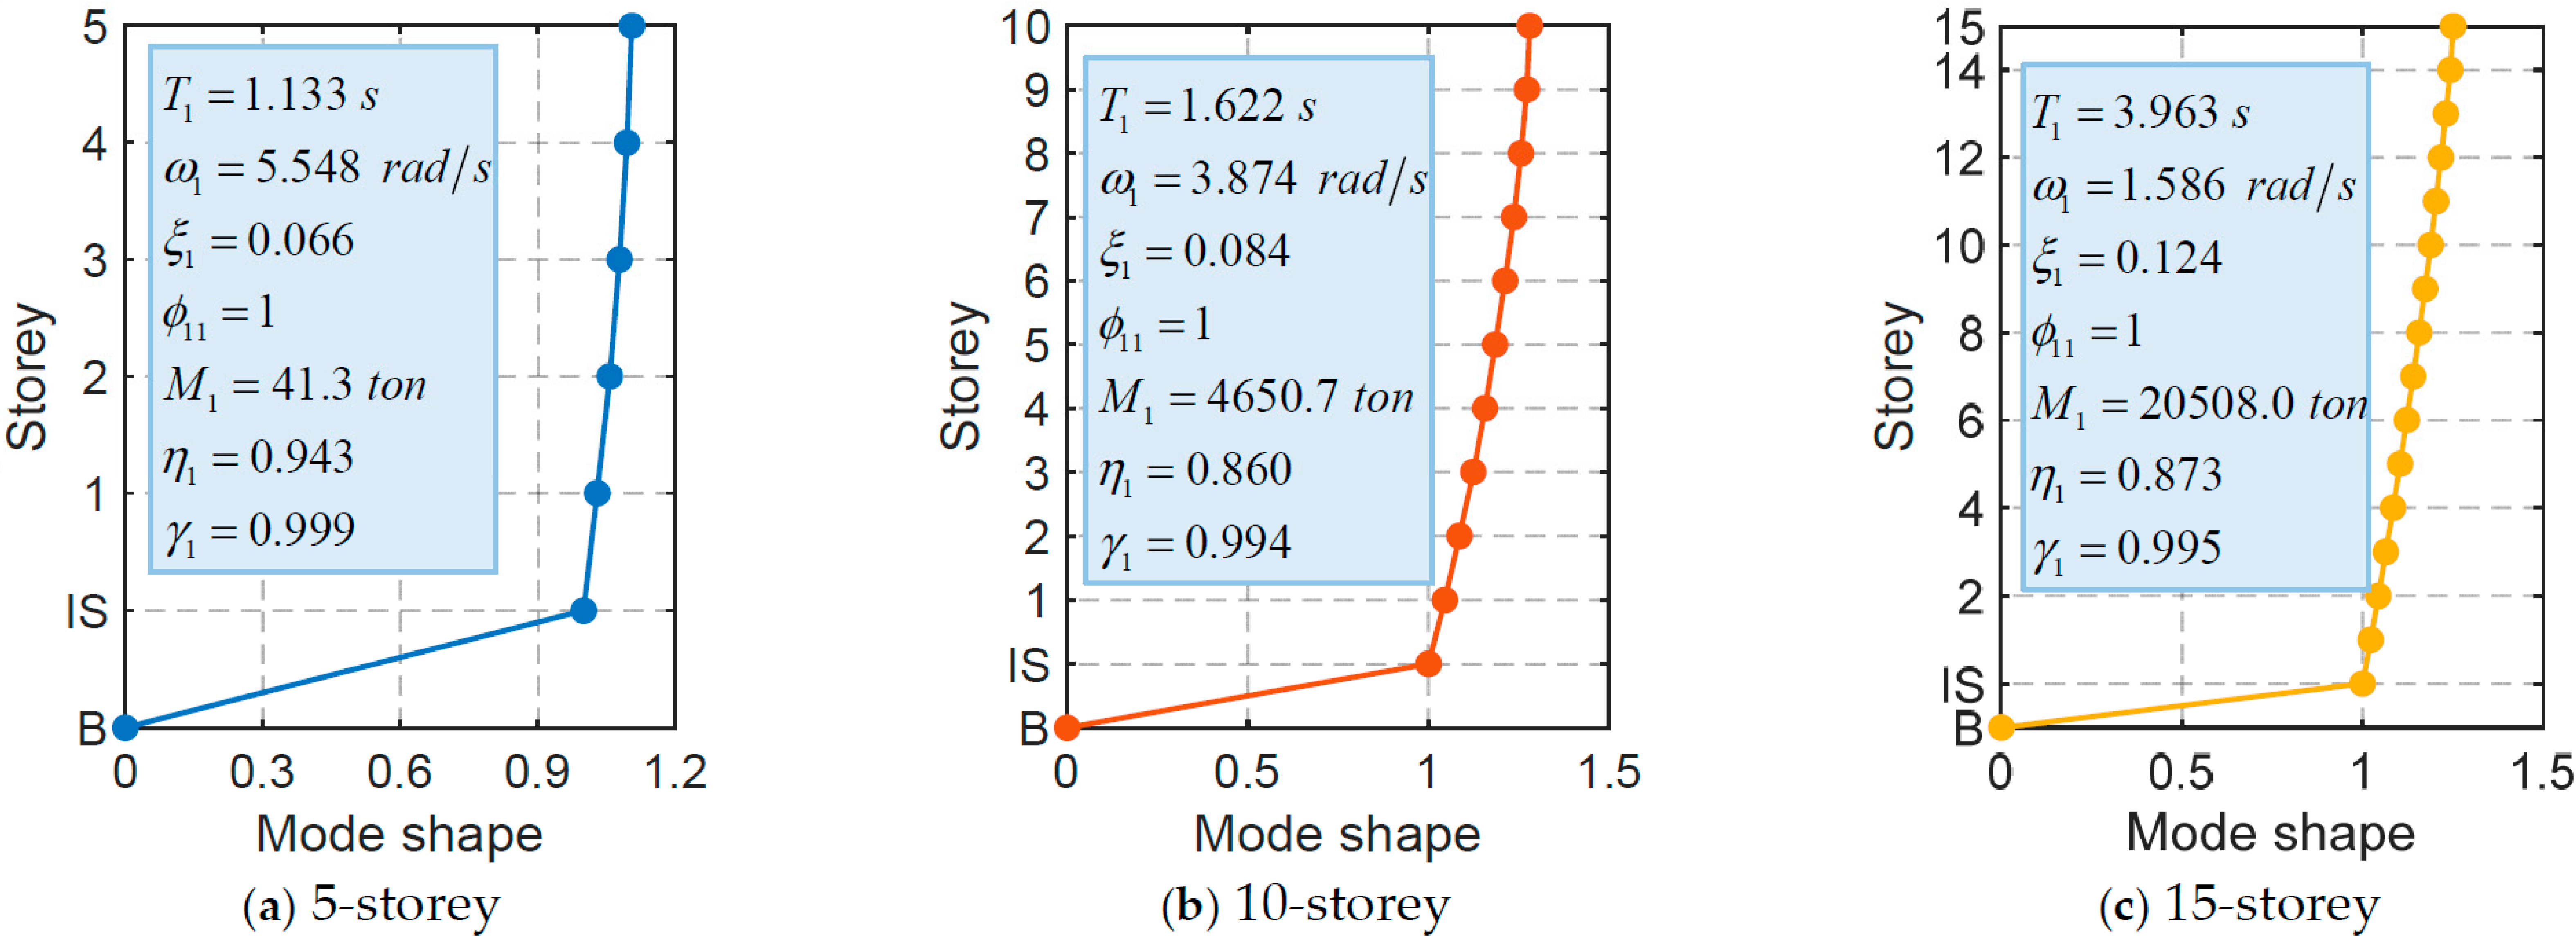
3.2. Structure Information

To illustrate the control effectiveness of the TID, three 5-, 10-, and 15-storey structures have been considered for this study. Table 4 lists the structural parameters of three types of structures modeled using the lumped mass method, including storey mass, stiffness, and damping properties [56]. Specifically, a dead load factor of 1.0 and a live load factor of 0.5 were applied to calculate the lumped mass for seismic response. It is important to note that the first storey, functioning as a seismic isolation storey, does not serve the same purpose as the upper storeys. The first-order modal dynamic characteristics of these three structures are presented in Figure 10, in this case, the mode-shape vectors are all normalized such that the first element, corresponding to the base storey, is set to one. The last parameter γ 1 is the modal mass participation coefficient, which reflects the contribution of the first-order modal to the seismic response of the structure. Considering that inter-storey deformation primarily occurs in the isolation storey, while the upper structure predominantly remains elastic, the laminated rubber bearings can be approximated as springs with viscous damping, exhibiting linear elastic behavior. Therefore, the seismic response analysis of the base-isolated structure in this study is conducted using a linear elastic model [57,58]. However, when lead rubber bearings or friction pendulum bearings are used, the nonlinear behavior of the isolation storey must be considered, which will be the focus of our future research.

3.3. TID Parameters and Time History Analysis

In this part, the mass ratio of the TID is defined as 0.05, 0.1, and 0.2 respectively, and other related parameters use the optimal values obtained in Section 2. The specific parameters are presented in Table 5. In the dynamic time history analysis, the 20 far-fault ground motions, 12 near-fault ground motions without pulse subset, and 10 near-fault ground motions with pulse subset in Section 2.1 are also selected as input ground motions. Ground motion intensity is typically quantified using peak ground acceleration (PGA). In this study, the PGA values of the 42 earthquake records are adjusted to 0.4 g.

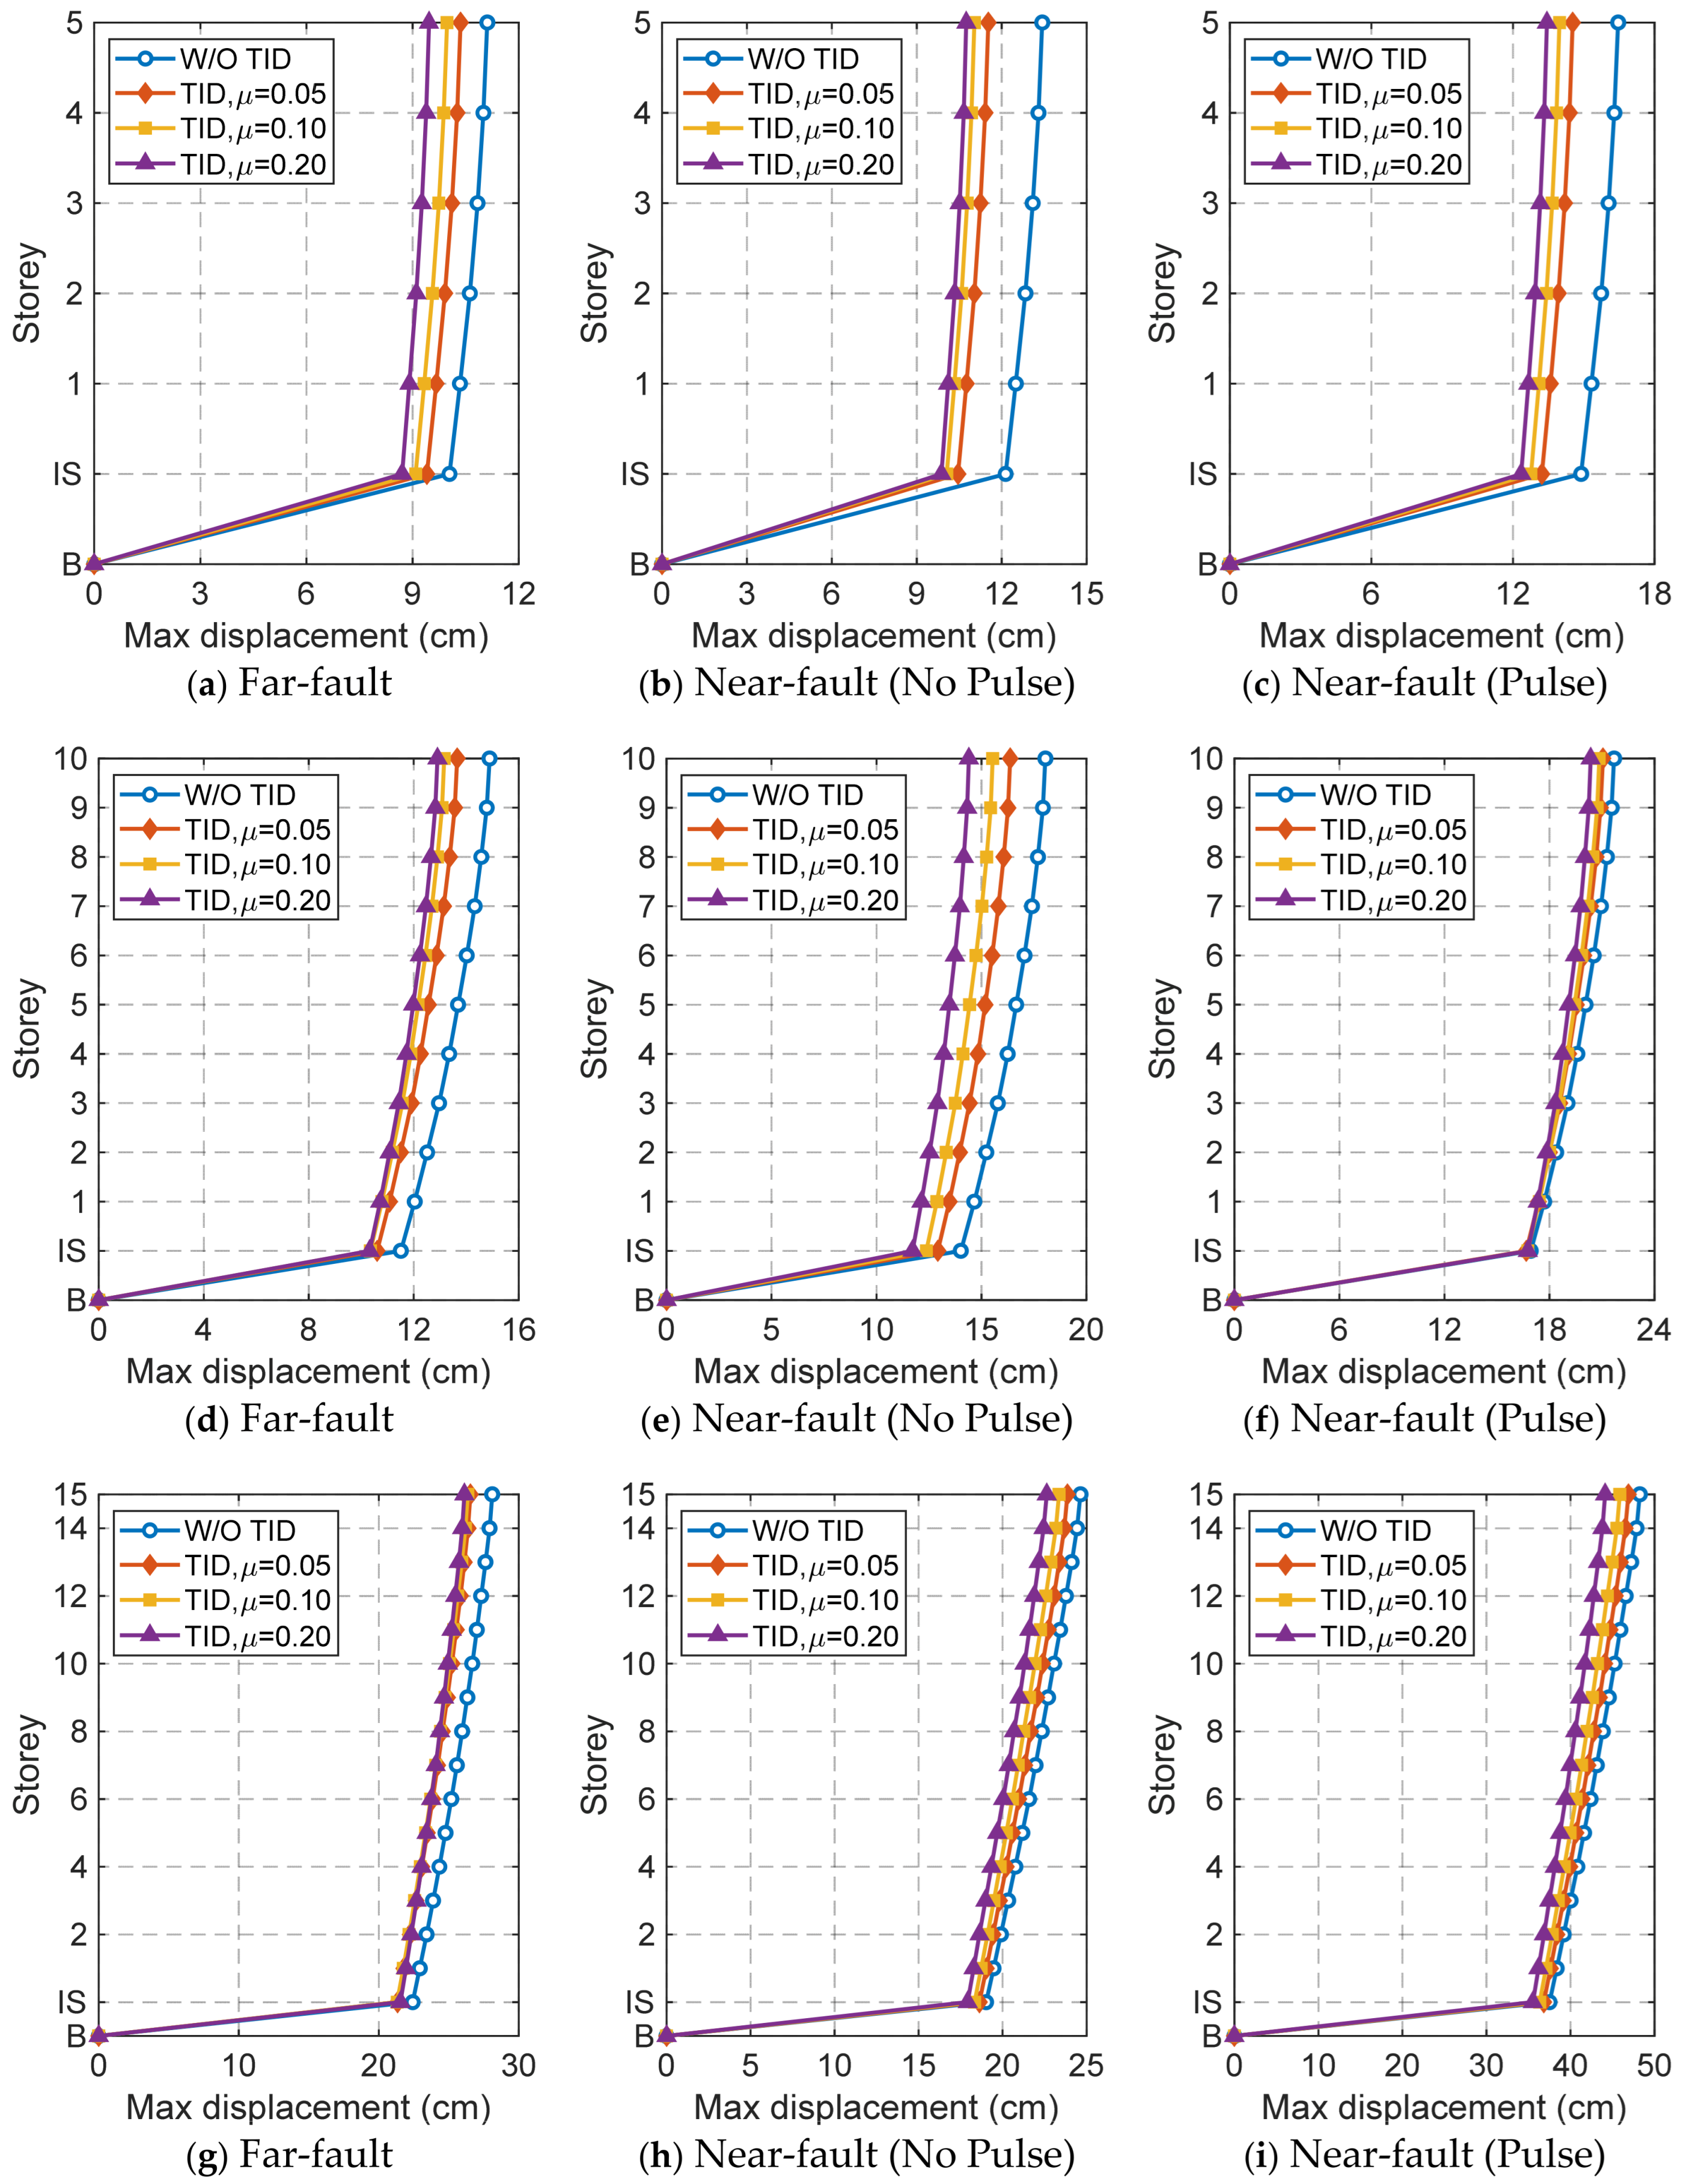
3.4. Displacement Response

In this part, the displacement response of the isolated structure under ground motion excitation is used as the evaluation index of the control effectiveness of the TID. Specifically, the mean square and maximum values of the structural displacement are discussed below, respectively.
Figure 11 presents the mean squared displacement responses for each storey of the three base-isolated structures, both with and without different mass ratio TIDs, subject to three various types of ground motion excitation. First of all, the TID has achieved visible control effectiveness under the three types of ground motion excitation, and the control effectiveness improved with the increase of the mass ratio. Comparing the isolated structures with different heights, the control effectiveness of the TID on low-rise isolated structures is obviously better than that on high-rise isolated structures. This is mainly due to the fact that the higher the structure, the greater the participation of high-order modes, and the more obvious the limitations of single-mode control. Alternatively, the control effectiveness of the TID on different types of ground motion excitation has obvious discreteness, and this discreteness is also affected by the altitude of the base-isolated structure. For example, the control effectiveness of the TID on the 15-story isolated structure under the near-fault ground motions without pulse subset is significantly smaller than that in other cases.
Another consideration is the peak displacement of the base-isolated structure. Figure 12 displays the peak displacement responses of the structure, comparing cases with and without the TID. By comparing the control effect of TID on peak displacement, it can be observed that TID has a less significant influence on peak displacement than on mean square displacement, particularly for the 15-storey structure. This is mainly due to the fact that the TID, like traditional passive TMD, cannot effectively play a controlling role in the initial stage. Therefore, if the structure reaches the peak displacement at the initial stage of ground motion excitation, the TID cannot fully exert the control effect at this time, which results in poor reduction for the peak displacement. In some cases, increasing the mass ratio of TID can offset the disadvantages of its control delay, with this effect being more pronounced on lower stories.
Next, the displacement reduction rate of the base storey is used as an index to quantify the control effectiveness of the TID. The bar charts in Figure 13a represent the percentage reduction of the mean squared displacement responses of the base storey. For the five-storey base-isolated structure, the control effectiveness of the TID is excellent. When the mass ratio is 0.2, the displacement reduction rates are 31.0%, 26.7%, and 18.6%, respectively, corresponding to the far-fault, near-fault without pulse subset, and near-fault with pulse subset ground motions. However, for the 10-storey and 15-storey base-isolated structures, the control effectiveness of the TID on the structural displacement is less ideal for the near-fault ground motion excitation. The peak displacement of the isolated storey is often related to the stroke of the equipment and design requirements for isolation measures, etc. The percentage reduction of the peak displacement response of the base storey is presented in Figure 13b. It is obvious that the control law for the peak displacement of the TID is similar to that for the mean square displacement, but the reduction rate is smaller and there are significant differences in individual conditions. For example, the control effectiveness of the TID for the 10-story isolated structure under near-fault with pulse subset ground motion is almost negligible.

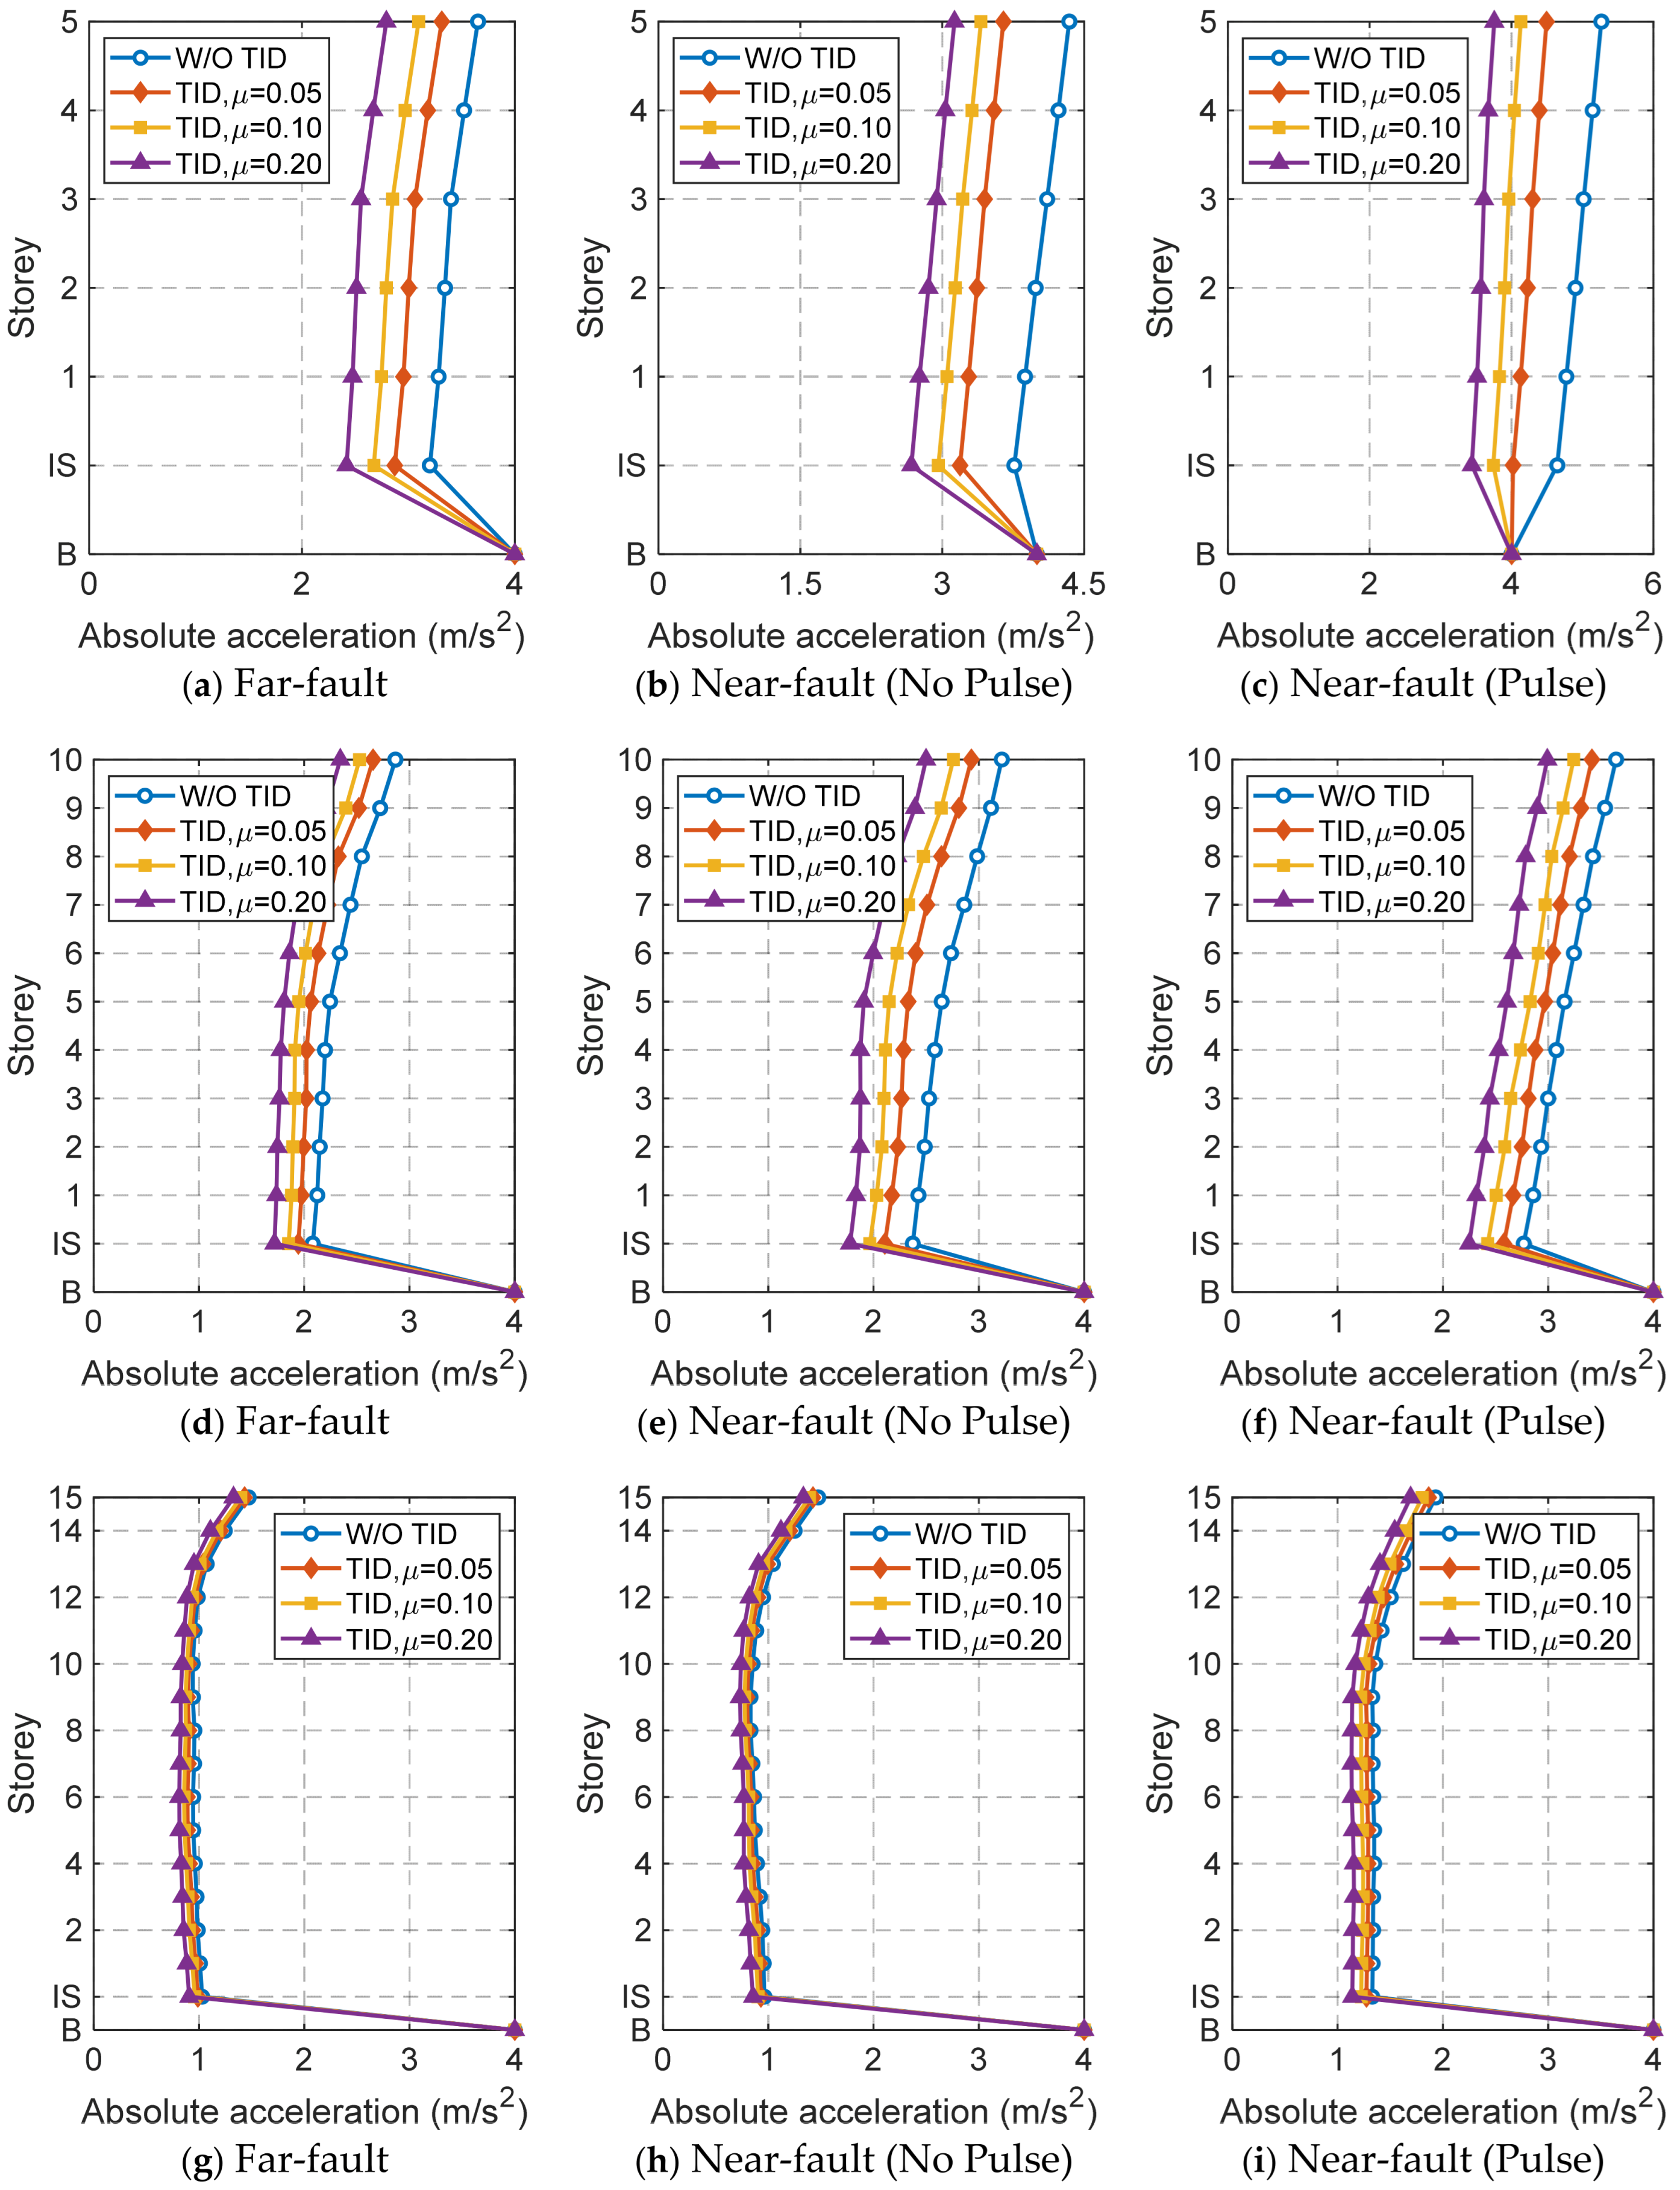
3.5. Absolute Acceleration Response

Controlling the absolute acceleration response of the structure is essential for protecting the contents within, making it a key factor in evaluating the effectiveness of the TID. Figure 14 illustrates the mean maximum absolute acceleration responses for the three base-isolated structures, both with and without the TID. Meanwhile, Figure 15 depicts the percentage reduction in the absolute acceleration response of the top storey. First of all, it is apparent that for the base-isolated structure, the acceleration response of the low structure with a shorter period is more serious, and the absolute acceleration about the top storey is generally the largest. In addition, the acceleration response of the base-isolated structure under the near-fault with pulse subset ground motion excitation is more severe, and the acceleration of some floors has exceeded the limit of 3 m/s2. In terms of the control effectiveness of the TID on structural acceleration, it can be summarized as the following aspects. The higher the base-isolated structure or the longer the period of the base-isolated structure is, the worse control effectiveness of the TID is. The control effectiveness of the TID is best due to the far-fault ground motion excitation, and the worst under the near-fault with pulse subset ground motion excitation. Additionally, a general trend is that the mass ratio increases, the effectiveness the TID is in controlling the response also increases.
In general, for medium and low base-isolated structures that required to control acceleration response the acceleration response, it is a considerable solution to equip the TID in the isolation layer, and when the mass ratio of the TID is 0.2, the absolute acceleration of each storey can generally be controlled below the limit of 3 m/s2.
Based on the above analysis, it is evident that equipping TID in the isolation storey to control the dynamic response of the structure is an effective solution for low-rise base-isolated structures. However, while improving the mass ratio of TID can enhance the vibration reduction effect, its applicability to high-rise base-isolated structures remains limited. In light of this, it may be worth considering the arrangement of inerter-based vibration control devices between the storeys of high-rise structures or between adjacent structures to achieve improved vibration control [59,60].

4. Conclusions

This study explored the optimal design and seismic performance of base-isolated structures equipped with TIDs, subjected to both far-fault and near-fault ground motions, respectively. The impact of design factors on the optimal parameters of the TID was examined. The control effectiveness of the TID for base-isolated structures with varying heights was evaluated. The following summarizes the main conclusions:
(1)
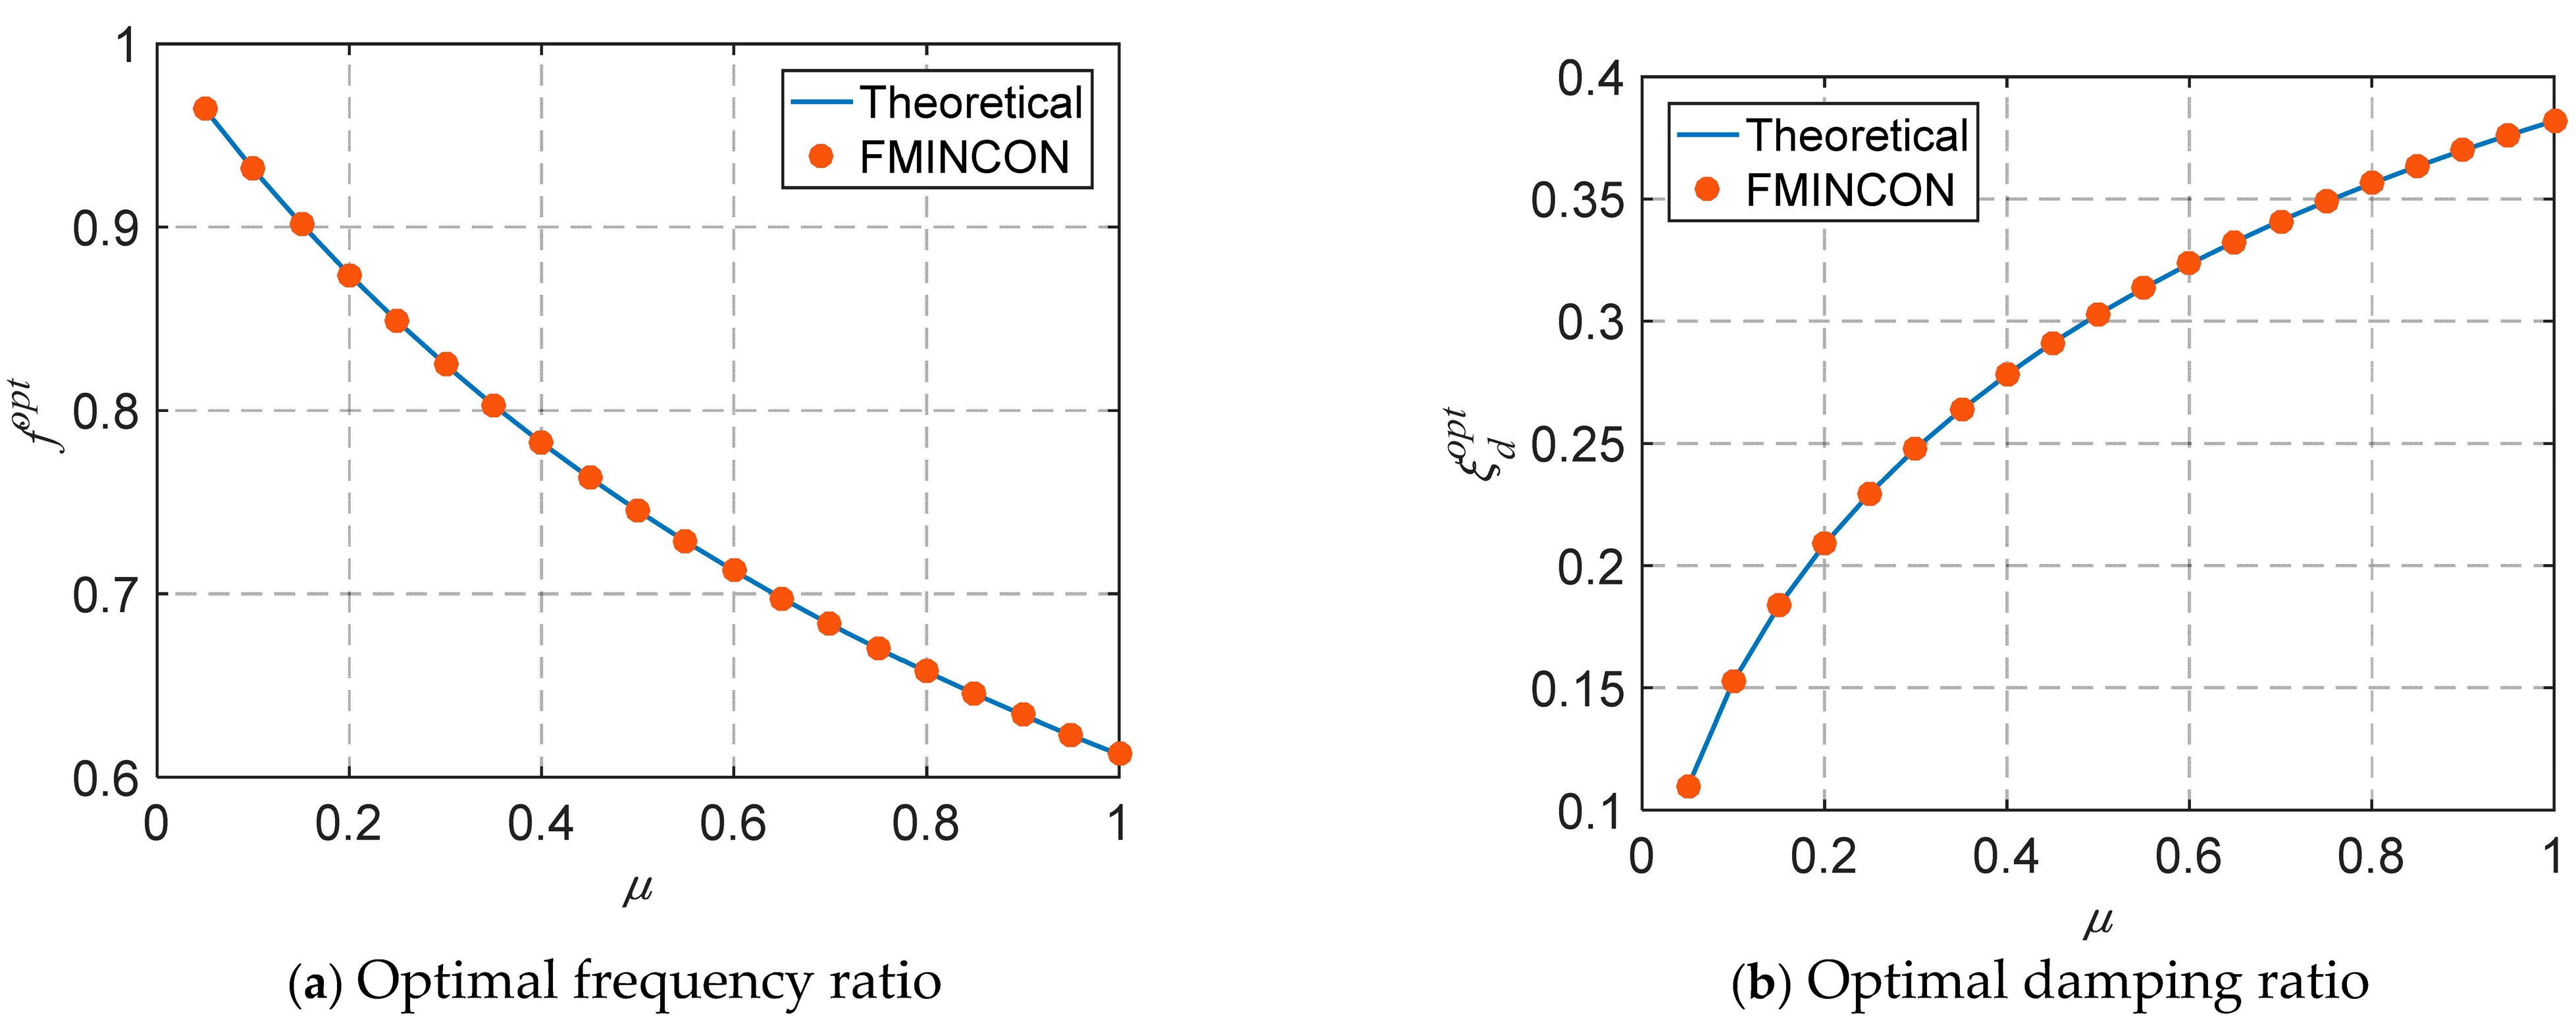
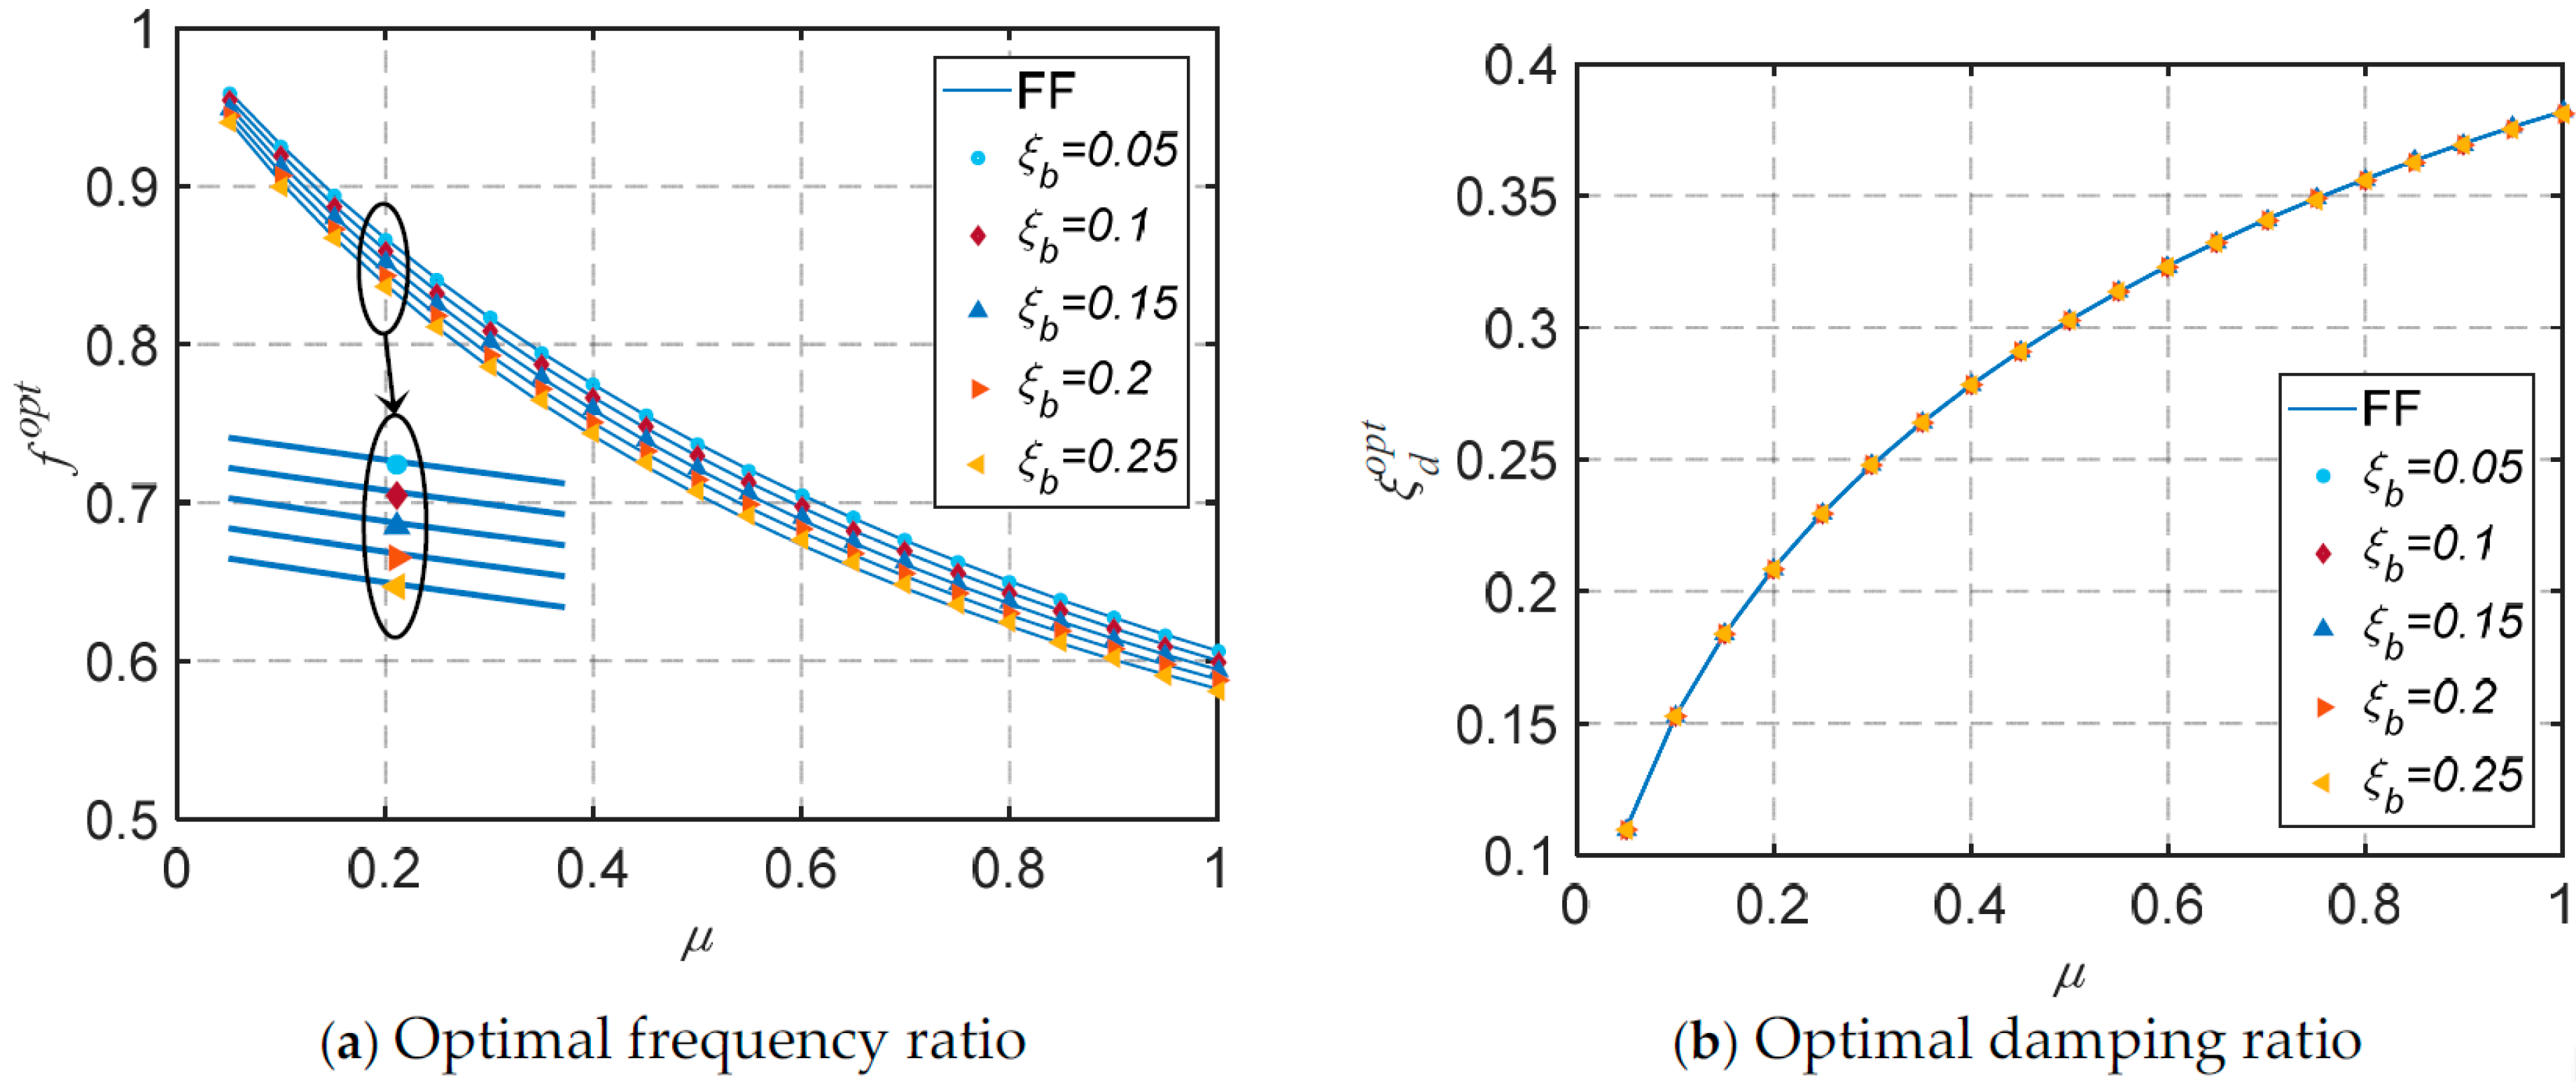
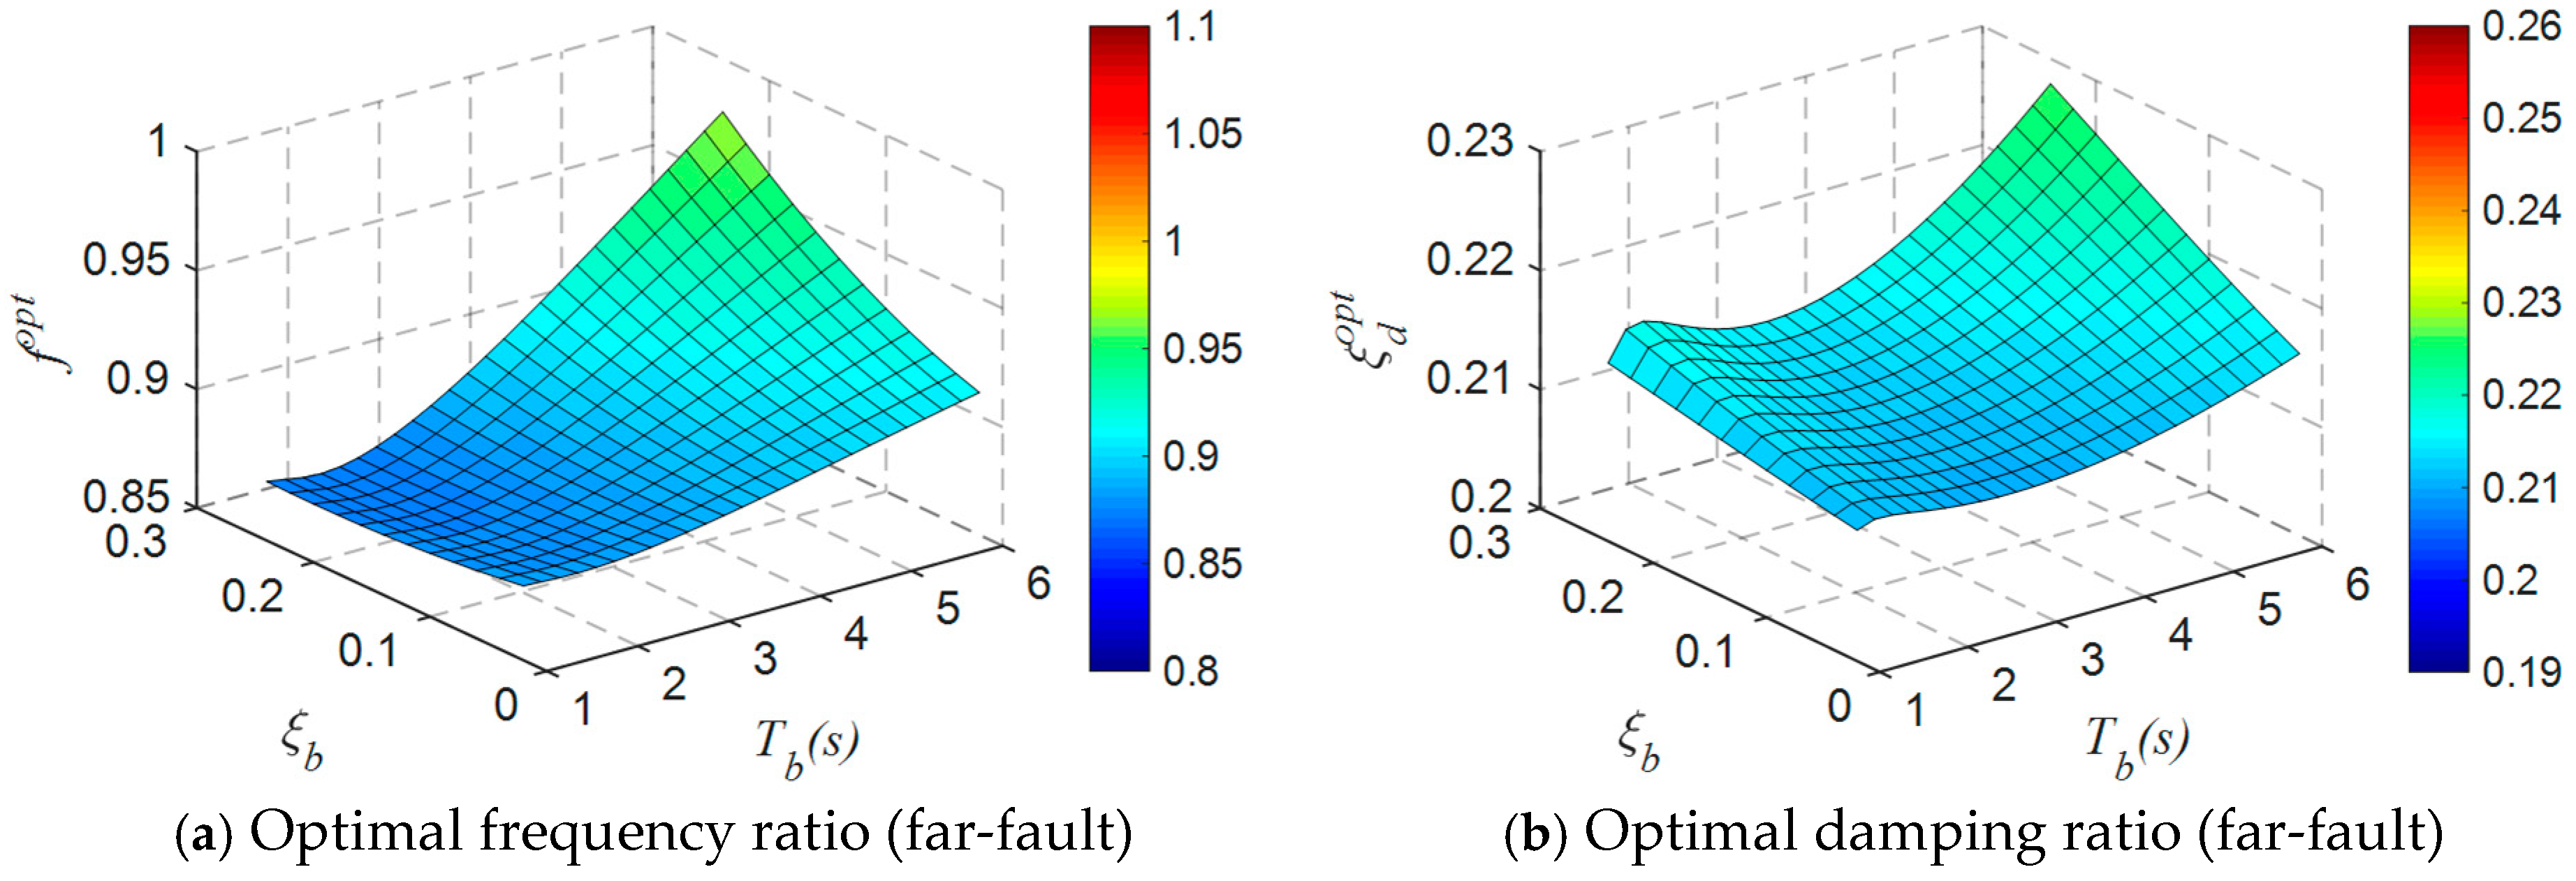
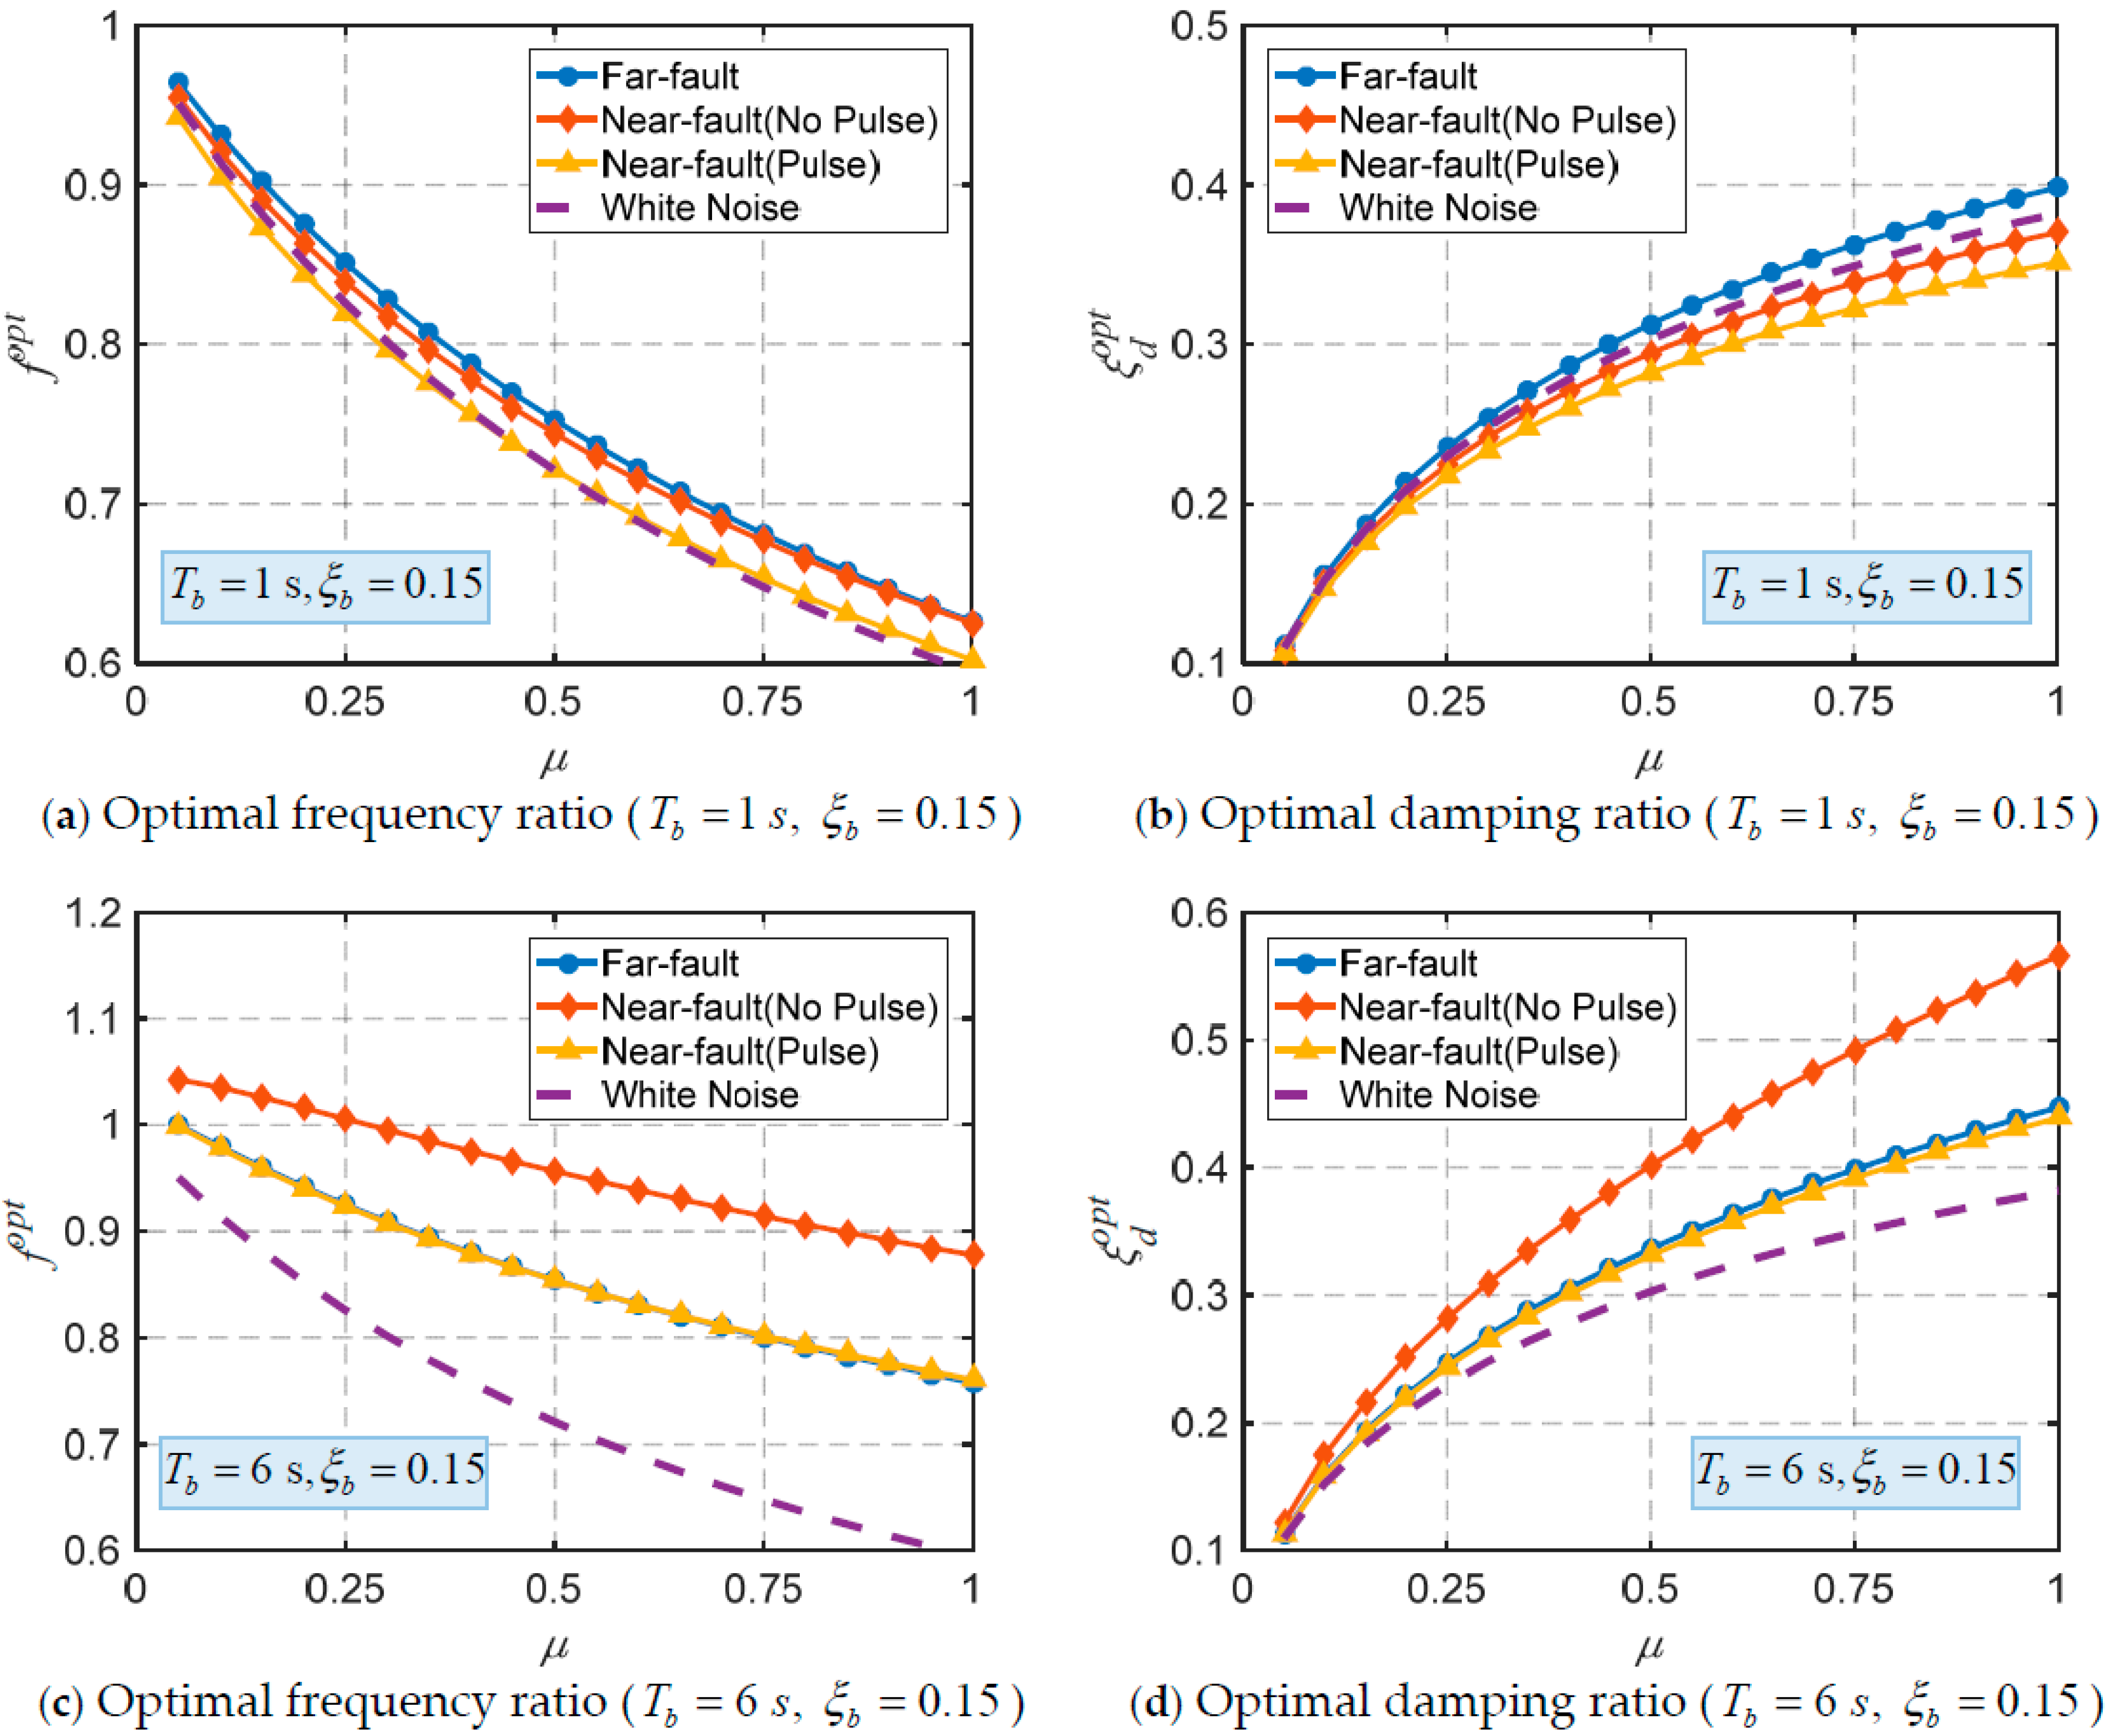
Considering the impact of ground motion characteristics, the optimal parameters for the base-isolated structure equipped with the TID have been determined. As the natural period and damping ratio of the base-isolated structure increase, both the optimal frequency ratio and damping ratio tend to rise. Due to the impracticality of deriving or fitting simple and accurate closed-form solutions, a parameter optimization analysis based on design conditions has been proposed.
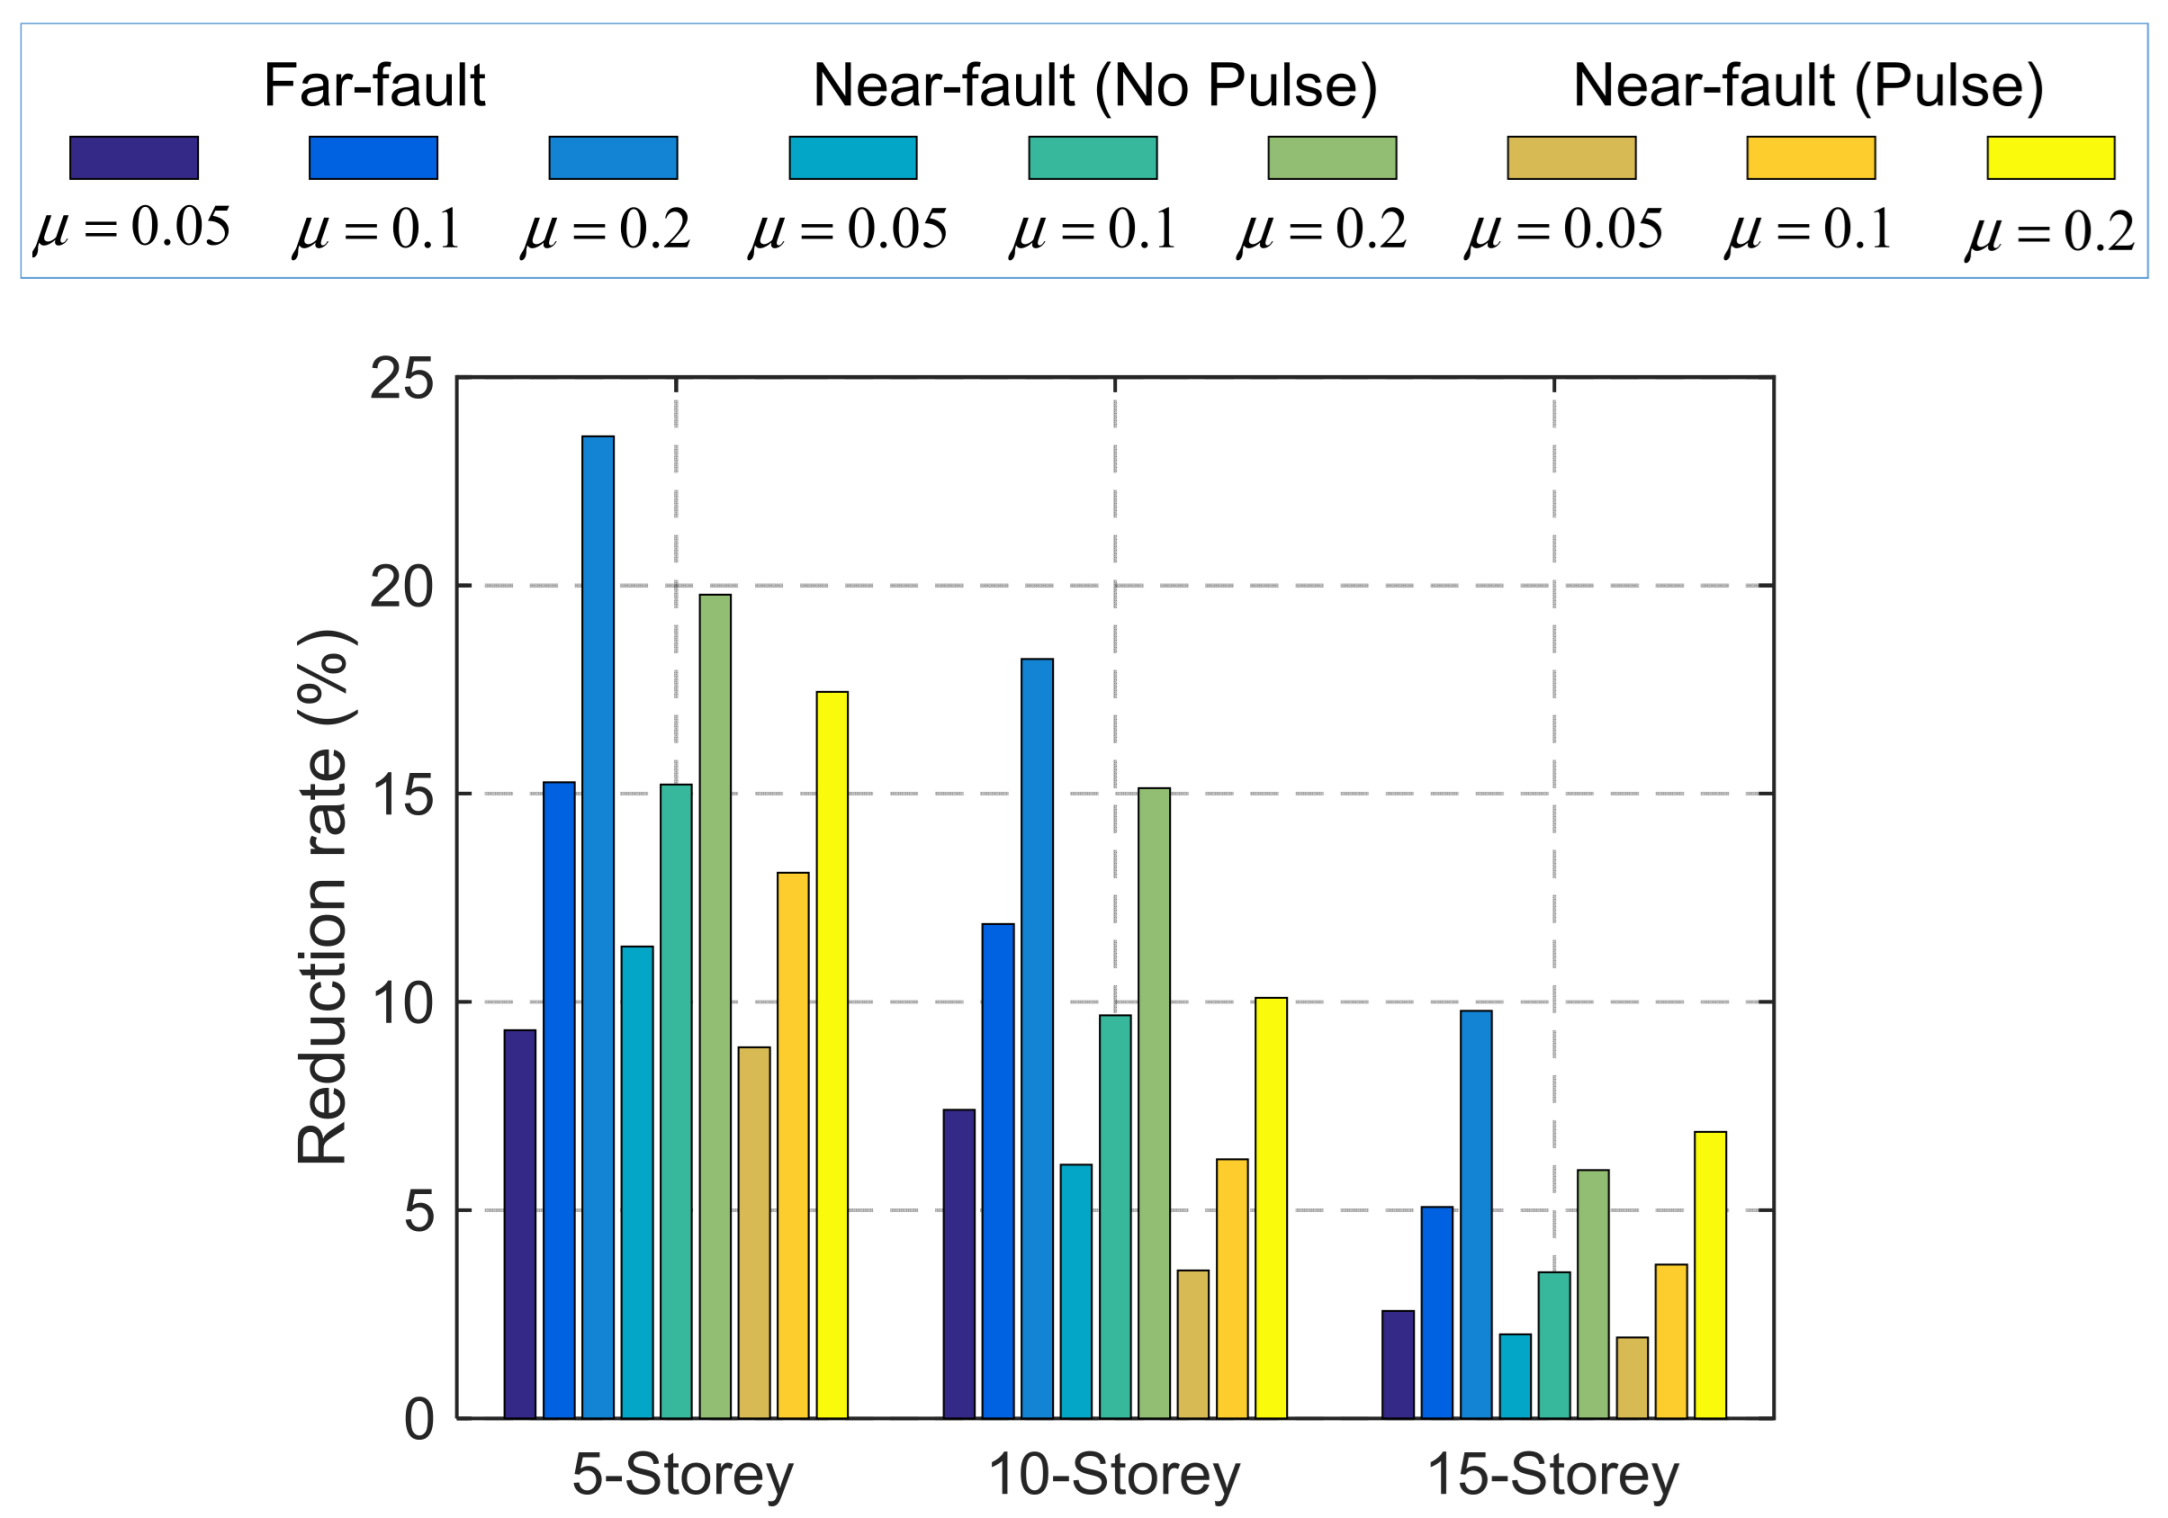
(2)
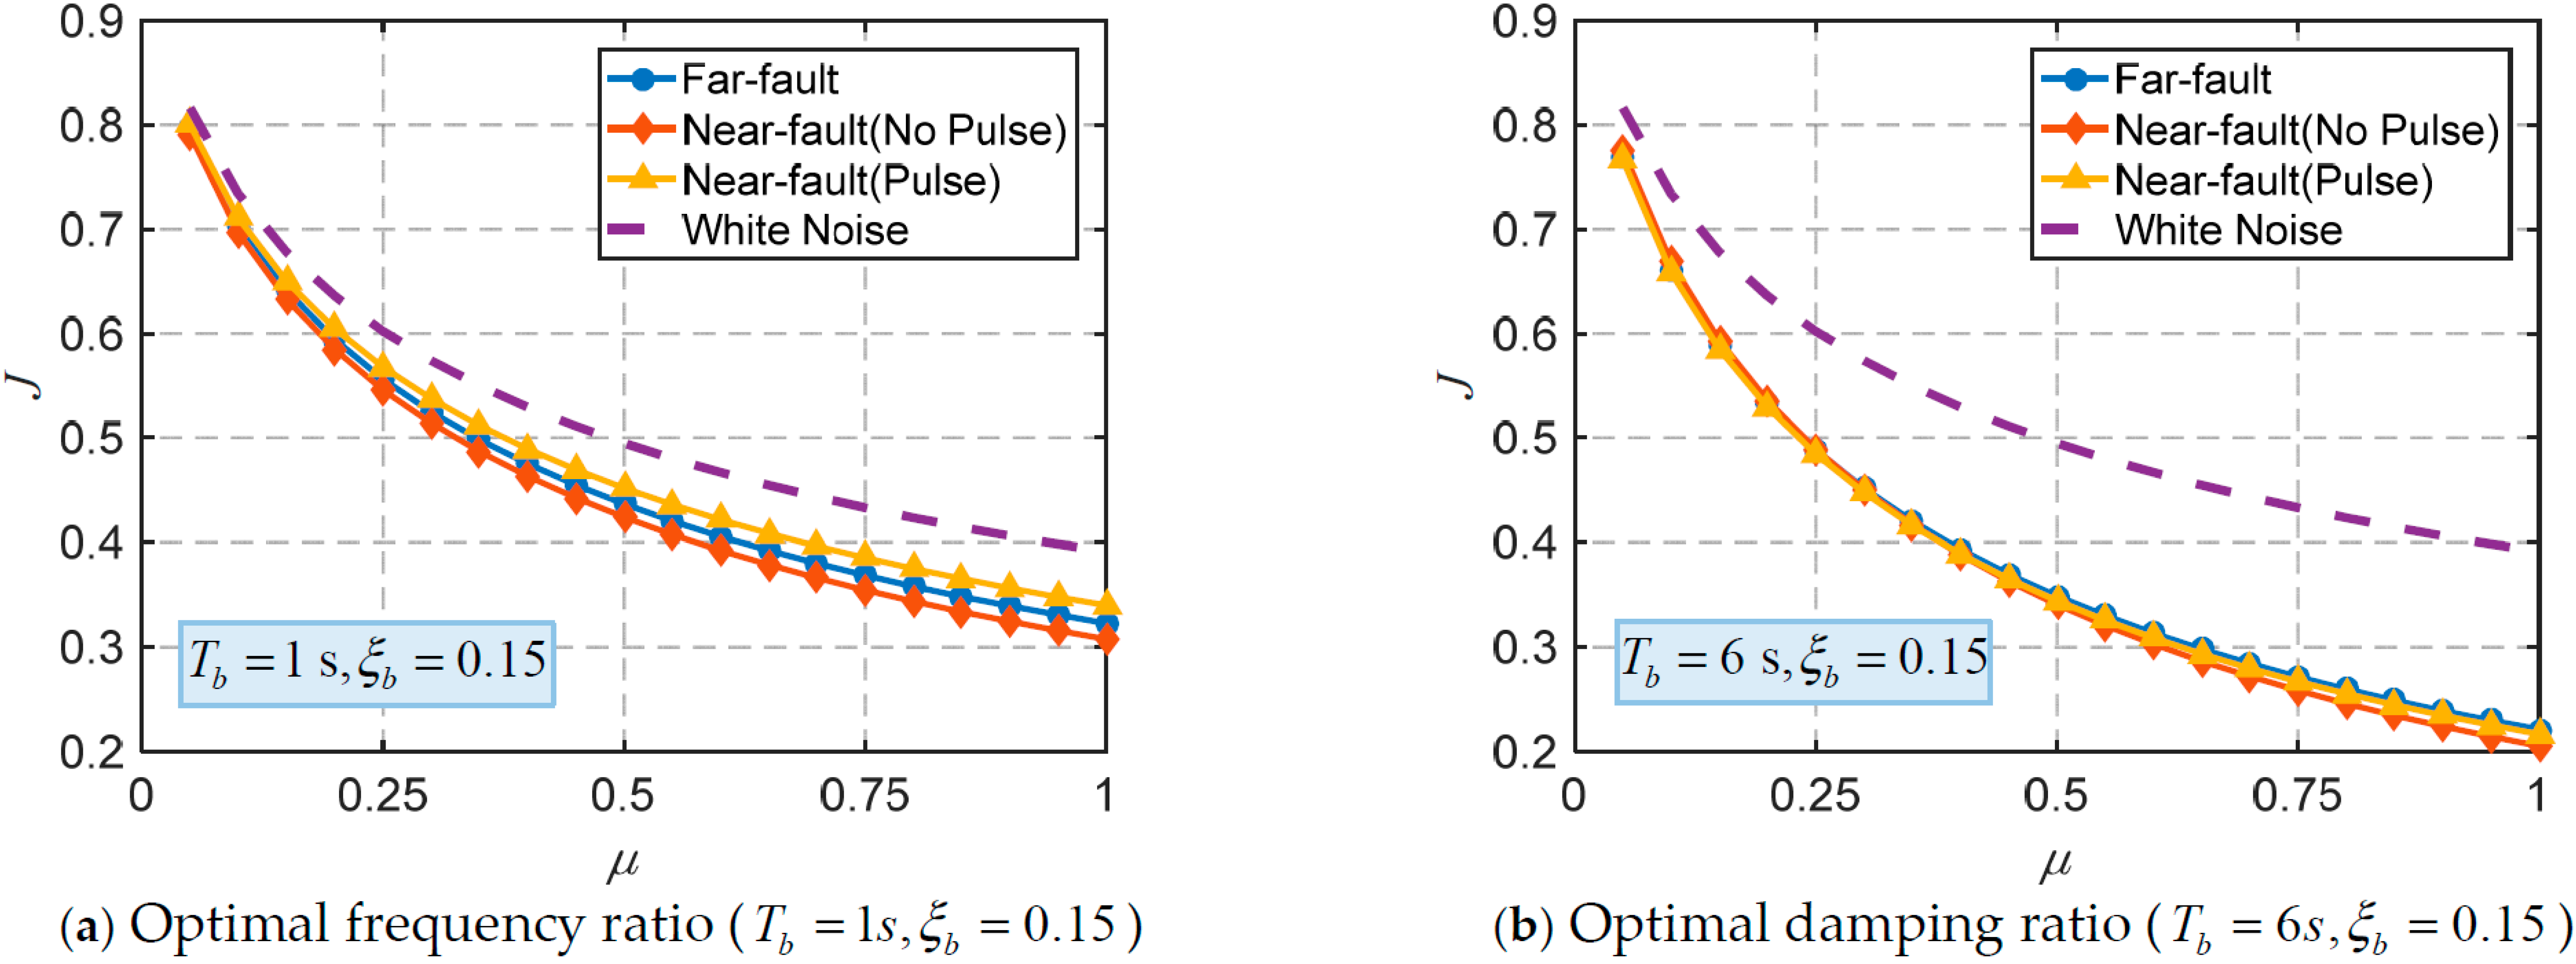
The TID is more effective and stable for seismic control of base-isolated structures under far-fault ground motions than under near-fault ground motions. Additionally, the TID is more suitable for low-rise base-isolated structures. The control effectiveness of the TID improves with the mass ratio, however, when the mass ratio exceeds 0.2, the additional benefits of increasing the mass ratio diminish.
(3)
The TID provides excellent control over the mean square displacement response of the base-isolated structure, but its control effect on the peak displacement response is less significant due to the control hysteresis of the TID. Additionally, the TID demonstrates effective control over the absolute acceleration response of low-rise base-isolated structures.
As indicated by the findings of this study, the characteristics of the dynamic loads, such as earthquake and wind load, significantly influence the optimal parameters of vibration reduction systems. The proper selection of these parameters is critical in determining whether the device can effectively demonstrate vibration reduction performance. Designers should also assess the likelihood of the building experiencing near-fault ground motions based on the fault distance. When considering the influence of near-fault effects, it is recommended to use the optimal parameters proposed in this paper that correspond to near-fault non-pulse type ground motion. In the case of near-fault pulse type ground motion, the damping effect of TID is limited and should be combined with other vibration control devices. For high-rise base-isolated structures, equipping TID devices in the isolation storey does not provide significant vibration reduction. It may be more effective to consider placing inerter-based vibration control devices between storeys of the high-rise structure or between adjacent structures to achieve improved vibration control. Additionally, further research on structural nonlinearity, robustness analysis, and sensitivity effects should be prioritized in future studies.

Author Contributions

Formal analysis, Z.Z. (Zeyu Zhang) and X.Z.; Investigation, Z.Z. (Zeyu Zhang); Writing—original draft, Y.K.; Writing—review & editing, Y.K. and Z.Z. (Zewen Zhang); Supervision, Q.L.; Project administration, Q.L.; Funding acquisition, Q.L. All authors have read and agreed to the published version of the manuscript.

Funding

The authors are grateful for financial support from the National Natural Science Foundation of China (Grant No. 52208493), the Hebei Natural Science Foundation (Grant No. E2022210038), the Hebei Natural Science Foundation (Grant No. E2022210078), Science and Technology Project of Hebei Education Department (Grant No. BJK2023038).

Institutional Review Board Statement

Not applicable.

Informed Consent Statement

Not applicable.

Data Availability Statement

The original contributions presented in this study are included in the article. Further inquiries can be directed to the corresponding author.

Conflicts of Interest

The authors declare that they have no known competing financial interests or personal relationships that could have appeared to influence the work reported in this paper.

References

  1. Saaed, T.E.; Nikolakopoulos, G.; Jonasson, J.-E.; Hedlund, H. A state-of-the-art review of structural control systems. J. Vib. Control 2015, 21, 919–937. [Google Scholar] [CrossRef]
  2. Ramírez, A.; Tomás-Rodríguez, M.; Sierra-García, J.E.; Santos, M. Metaheuristic optimized semi-active structural control approaches for a floating offshore wind turbine. Appl. Sci. 2024, 14, 11368. [Google Scholar] [CrossRef]
  3. Parulekar, Y.M.; Reddy, G.R. Passive response control systems for seismic response reduction: A state-of-the-art review. Int. J. Struct. Stab. Dyn. 2011, 9, 151–177. [Google Scholar] [CrossRef]
  4. Lee, S.J.; Kim, J.H. Effect of nonlinear hysteresis details of isolation system on in-structure response spectra. Appl. Sci. 2025, 15, 62. [Google Scholar] [CrossRef]
  5. Xu, Y.; Guo, T.; Xiong, J.; Chen, B.; Zhi, Q.; Yang, J. Optimization design of triple friction pendulums for base-isolated high-rise buildings based on bearing displacement and collapse fragility. Structures 2022, 43, 1091–1099. [Google Scholar] [CrossRef]
  6. Shang, J.; Tan, P.; Han, J.; Zhang, Y.; Li, Y. Performance of seismically isolated buildings with variable friction pendulum bearings under near-fault ground motions. J. Build. Eng. 2022, 45, 103584. [Google Scholar] [CrossRef]
  7. Habieb, A.B.; Valente, M.; Milani, G. Implementation of a simple novel Abaqus user element to predict the behavior of unbonded fiber reinforced elastomeric isolators in macro-scale computations. Bull. Earthq. Eng. 2019, 17, 2741–2766. [Google Scholar] [CrossRef]
  8. Chen, H.; Xu, H.; Liu, Y.; Ren, X. Seismic demand estimation of isolated buildings with nonlinear bearings subjected to linear response spectra. J. Build. Eng. 2023, 67, 105995. [Google Scholar] [CrossRef]
  9. Kelly, J.M. The role of damping in seismic isolation. Earthq. Eng. Struct. Dyn. 1999, 28, 3–20. [Google Scholar] [CrossRef]
  10. Bhagat, S.; Wijeyewickrema, A.C.; Subedi, N. Influence of near-fault ground motions with fling-step and forward-directivity characteristics on seismic response of base-isolated buildings. J. Earthq. Eng. 2021, 25, 455–474. [Google Scholar] [CrossRef]
  11. Elias, S.; Matsagar, V. Research developments in vibration control of structures using passive tuned mass dampers. Annu. Rev. Control 2017, 44, 129–156. [Google Scholar] [CrossRef]
  12. Li, D.; Ikago, K. Optimal design of nontraditional tuned mass damper for base-isolated building. J. Earthq. Eng. 2023, 27, 2841–2862. [Google Scholar] [CrossRef]
  13. De Angelis, M.; Perno, S.; Reggio, A. Dynamic response and optimal design of structures with large mass ratio TMD. Earthq. Eng. Struct. Dyn. 2012, 41, 41–60. [Google Scholar] [CrossRef]
  14. Kang, Y.J.; Peng, L.Y. Optimisation design and damping effect analysis of large mass ratio tuned mass dampers. Shock Vib. 2019, 8376781. [Google Scholar] [CrossRef]
  15. Kang, Y.-J.; Peng, L.-Y.; Peng, P.; Wang, H.-S.; Xiao, G.-Q. Seismic performances of a structure equipped with a large mass ratio multiple tuned mass damper. Struct. Des. Tall Spec. 2020, 29, e1803. [Google Scholar] [CrossRef]
  16. Yahyai, M.; Zebarjad, L.; Head, M.; Shokouhian, M. Optimum parameters for large mass ratio tmds using frequency response function. J. Earthq. Eng. 2021, 25, 2127–2146. [Google Scholar] [CrossRef]
  17. Kang, Y.-J.; Peng, L.-Y.; Pan, P.; Xiao, G.-Q.; Wang, H.-S. Shaking table test and numerical analysis of a coal-fired power plant equipped with large mass ratio multiple tuned mass damper (LMTMD). J. Build. Eng. 2021, 43, 102852. [Google Scholar] [CrossRef]
  18. Shu, Z.; Li, S.; Sun, X.; He, M. Performance-based seismic design of a pendulum tuned mass damper system. J. Earthq. Eng. 2019, 23, 334–355. [Google Scholar] [CrossRef]
  19. de Souza Pippi, A.; Avila, S.M.; Doz, G. A review on the use of the inerter device in the structural coupling technique for adjacent building vibration control. Structures 2022, 42, 480–501. [Google Scholar] [CrossRef]
  20. Ma, R.; Bi, K.; Hao, H. A novel rotational inertia damper for amplifying fluid resistance: Experiment and mechanical model. Mech. Syst. Signal Process. 2021, 149, 107313. [Google Scholar] [CrossRef]
  21. Xu, K.; Bi, K.; Han, Q.; Li, X.; Du, X. Using tuned mass damper inerter to mitigate vortex-induced vibration of long-span bridges: Analytical study. Eng. Struct. 2019, 182, 101–111. [Google Scholar] [CrossRef]
  22. Makris, N.; Kampas, G. Seismic protection of structures with supplemental rotational inertia. J. Eng. Mech. 2016, 142, 04016089. [Google Scholar] [CrossRef]
  23. Ikago, K.; Saito, K.; Inoue, N. Seismic control of single-degree-of-freedom structure using tuned viscous mass damper. Earthq. Eng. Struct. Dyn. 2012, 41, 453–474. [Google Scholar] [CrossRef]
  24. Hwang, J.S.; Kim, J.; Kim, Y.M. Rotational inertia dampers with toggle bracing for vibration control of a structure. Eng. Struct. 2007, 29, 1201–1208. [Google Scholar] [CrossRef]
  25. Gonzalez-Buelga, A.; Lazar, I.F.; Jiang, J.Z.; Neild, S.A.; Inman, D.J. Assessing the effect of nonlinearities on the performance of a tuned inerter damper. Struct. Control Health Monit. 2017, 24, e1879. [Google Scholar] [CrossRef]
  26. Nakamura, Y.; Fukukita, A.; Tamura, K.; Yamazaki, I.; Matsuoka, T.; Hiramoto, K.; Sunakoda, K. Seismic response control using electromagnetic inertial mass dampers. Earthq. Eng. Struct. Dyn. 2014, 43, 507–527. [Google Scholar] [CrossRef]
  27. Lazar, I.F.; Neild, S.A.; Wagg, D.J. Using an inerter-based device for structural vibration suppression. Earthq. Eng. Struct. Dyn. 2014, 43, 1129–1147. [Google Scholar] [CrossRef]
  28. He, H.; Tan, P.; Hao, L.; Xu, K.; Xiang, Y. Optimal design of tuned viscous mass damper for acceleration response control of civil structures under seismic excitations. Eng. Struct. 2022, 252, 113685. [Google Scholar] [CrossRef]
  29. Di Egidio, A.; Contento, A. Seismic benefits from coupling frame structures with a hysteretic mass damper inerter. Appl. Sci. 2023, 13, 5017. [Google Scholar] [CrossRef]
  30. Djerouni, S.; Ounis, A.; Elias, S.; Abdeddaim, M.; Rupakhety, R. Optimization and performance assessment of tuned mass damper inerter systems for control of buildings subjected to pulse-like ground motions. Structures 2022, 38, 139–156. [Google Scholar] [CrossRef]
  31. Chen, H.; Jia, S.; He, X. Dynamic characteristics of multiple inerter-based dampers for suppressing harmonically forced oscillations. Struct. Eng. Mech. 2019, 72, 747–762. [Google Scholar]
  32. Wen, Y.; Chen, Z.; Hua, X. Design and evaluation of tuned inerter-based dampers for the seismic control of MDOF structures. J. Struct. Eng. 2016, 143, 04016207. [Google Scholar] [CrossRef]
  33. Jangid, R.S. The role of a simple inerter in seismic base isolation. Appl. Sci. 2024, 14, 1056. [Google Scholar] [CrossRef]
  34. Pan, C.; Zhang, R. Design of structure with inerter system based on stochastic response mitigation ratio. Struct. Control Health Monit. 2018, 25, e2169. [Google Scholar] [CrossRef]
  35. Chen, H.; Bi, K.; Yanhui, L.; Ping, T. Performance evaluation of multiple tuned inerter-based dampers for seismic induced structural vibration control. Struct. Control Health Monit. 2022, 29, e2860. [Google Scholar] [CrossRef]
  36. Hu, Y.; Chen, M.Z.Q. Performance evaluation for inerter-based dynamic vibration absorbers. Int. J. Mech. Sci. 2015, 99, 297–307. [Google Scholar] [CrossRef]
  37. Xu, K.-F.; Zhang, Y.-W.; Niu, M.-Q.; Chen, L.-Q. Dynamics analysis of a variable stiffness tuned mass damper enhanced by an inerter. Appl. Sci. 2023, 13, 1404. [Google Scholar] [CrossRef]
  38. Zuo, H.; Bi, K.; Hao, H.; Ma, R. Influences of ground motion parameters and structural damping on the optimum design of inerter-based tuned mass dampers. Eng. Struct. 2021, 227, 111422. [Google Scholar] [CrossRef]
  39. Javidialesaadi, A.; Wierschem, N.E. Design and performance evaluation of inerter-based tuned mass dampers for a ground acceleration excited structure. Soil Dyn. Earthq. Eng. 2021, 140, 106463. [Google Scholar] [CrossRef]
  40. Barredo, E.; Blanco, A.; Colín, J.; Penagos, V.M.; Abúndez, A.; Vela, L.G.; Meza, V.; Cruz, R.H.; Mayén, J. Closed-form solutions for the optimal design of inerter-based dynamic vibration absorbers. Int. J. Mech. Sci. 2018, 144, 41–53. [Google Scholar] [CrossRef]
  41. Hu, Y.; Chen, M.Z.; Shu, Z.; Huang, L. Analysis and optimisation for inerter-based isolators via fixed-point theory and algebraic solution. J. Sound Vib. 2015, 346, 17–36. [Google Scholar] [CrossRef]
  42. Sun, H.; Zuo, L.; Wang, X. Exact H2 optimal solutions to inerter-based isolation systems for building structures. Struct. Control Health Monit. 2019, 26, e2357. [Google Scholar] [CrossRef]
  43. De Domenico, D.; Ricciardi, G. Improving the dynamic performance of base-isolated structures via tuned mass damper and inerter devices: A comparative study. Struct. Control Health Monit. 2018, 25, e2234. [Google Scholar] [CrossRef]
  44. Zhang, L.; Guo, M.; Li, Z.; Zhu, L.; Meng, Y. Optimal design and seismic performance of base-isolated storage tanks using friction pendulum inerter systems. Structures 2022, 43, 234–248. [Google Scholar] [CrossRef]
  45. Djerouni, S.; Elias, S.; Abdeddaim, M.; Rupakhety, R. Optimal design and performance assessment of multiple tuned mass damper inerters to mitigate seismic pounding of adjacent buildings. J. Build. Eng. 2022, 48, 103994. [Google Scholar] [CrossRef]
  46. De Domenico, D.; Impollonia, N.; Ricciardi, G. Soil-dependent optimum design of a new passive vibration control system combining seismic base isolation with tuned inerter damper. Soil Dyn. Earthq. Eng. 2018, 105, 37–53. [Google Scholar] [CrossRef]
  47. Qian, F.; Luo, Y.; Sun, H.; Tai, W.C.; Zuo, L. Optimal tuned inerter dampers for performance enhancement of vibration isolation. Eng. Struct. 2019, 198, 109464. [Google Scholar] [CrossRef]
  48. De Angelis, M.; Giaralis, A.; Petrini, F.; Pietrosanti, D. Optimal tuning and assessment of inertial dampers with grounded inerter for vibration control of seismically excited base-isolated systems. Eng. Struct. 2019, 196, 109250. [Google Scholar] [CrossRef]
  49. Djerouni, S.; Abdeddaim, M.; Eliasa, S.; Rupakhety, R. Optimum double mass tuned damper inerter for control of structure subjected to ground motions. J. Build. Eng. 2021, 44, 103259. [Google Scholar] [CrossRef]
  50. Masnata, C.; Matteo, A.D.; Adam, C.; Pirrotta, A. Assessment of the tuned mass damper inerter for seismic response control of base-isolated structures. Struct. Control Health Monit. 2020, 28, e2665. [Google Scholar] [CrossRef]
  51. Masnata, C.; Di Matteo, A.; Adam, C.; Pirrotta, A. Smart structures through nontraditional design of Tuned Mass Damper Inerter for higher control of base isolated systems. Mech. Res. Commun. 2020, 105, 103513. [Google Scholar] [CrossRef]
  52. Ren, C.; Wang, J.; Looi, D.T.W.; Hong, M. Optimal design and performance evaluation of a tuned inertial damper considering soil-structure interaction effects. Soil Dyn. Earthq. Eng. 2025, 194, 109338. [Google Scholar] [CrossRef]
  53. Tong, S.; Zeng, J.; Miao, Z.; Chen, G. Parameter optimization of tuned inerter damper for vibration suppression in structures with damping. J. Sound Vib. 2025, 597, 118827. [Google Scholar] [CrossRef]
  54. Greco, R.; Morga, M. Optimum design of tuned mass dampers for different earthquake ground motion parameters and models. J Struct. Des. Tall Spec. Build. 2019, 28, e1672. [Google Scholar] [CrossRef]
  55. Applied Technical Council. Federal Emergency Management Agent. Quantification of Seismic Performance Factors; FEMA: Washington, DC, USA, 2009.
  56. Wang, H.; Shen, W.; Li, Y. Dynamic behavior and seismic performance of base-isolated structures with electromagnetic inertial mass dampers: Analytical solutions and simulations. Eng. Struct. 2021, 246, 113072. [Google Scholar] [CrossRef]
  57. Liu, T.; Zordan, T.; Briseghella, B. An improved equivalent linear model of seismic isolation system with bilinear behavior. Eng. Struct. 2014, 61, 113–126. [Google Scholar] [CrossRef]
  58. Far, H.; Fatahi, B.; Ghabraie, K. Evaluation of numerical procedures to determine seismic response of structures under influence of soil-structure interaction. Struct. Eng. Mech. 2015, 56, 27–47. [Google Scholar]
  59. Wang, Q.; Qiao, H.; De Domenico, D.; Zhu, Z.; Tang, Y. Seismic response control of adjacent high-rise buildings linked by the Tuned Liquid Column Damper-Inerter (TLCDI). Eng. Struct. 2020, 223, 111169. [Google Scholar] [CrossRef]
  60. Qiao, H.; Huang, P.; De Domenico, D.; Wang, Q. Structural control of high-rise buildings subjected to multi-hazard excitations using inerter-based vibration absorbers. Eng. Struct. 2022, 266, 114666. [Google Scholar] [CrossRef]
Figure 1. Base-isolated SDOF structure equipped with a TID.
Applsci 15 04739 g001
Figure 2. Pseudo-acceleration response spectra, power spectral density, and estimated parameters of the ground motions.
Applsci 15 04739 g002
Figure 3. The optimal frequency ratio and optimal damping ratio of the TID under white-noise excitation when the damping ratio of the base-isolated structure is zero.
Applsci 15 04739 g003
Figure 4. The optimal frequency ratio and optimal damping ratio of the TID under white-noise excitation when the damping ratios of the base-isolated structure are 0.05, 0.1, etc., respectively.
Applsci 15 04739 g004
Figure 5. The relationship of the optimal parameters of the TID and the dynamic characteristics (damping ratio and natural vibration period) of the based-isolated structure ( μ = 0.2 ).
Applsci 15 04739 g005aApplsci 15 04739 g005b
Figure 6. The connection of the optimal parameters of the TID and the mass ratio for T b = 1   s ,   ξ b = 0.15 and T b = 6   s ,   ξ b = 0.15 .
Applsci 15 04739 g006
Figure 7. The relationship between displacement reduction ratio J and the dynamic characteristics (damping ratio and natural vibration period) of the based-isolated structure ( μ = 0.2 ,   0.5 ).
Applsci 15 04739 g007
Figure 8. The relationship between displacement reduction ratio J and the mass ratio.
Applsci 15 04739 g008
Figure 9. Multi-storey building structures equipped with a tuned inerter damper.
Applsci 15 04739 g009
Figure 10. First mode shape of the three base-isolated structures.
Applsci 15 04739 g010
Figure 11. Mean squared displacement responses for each storey of the three base-isolated structures with and without different mass ratio TIDs under the three types of ground motion excitation.
Applsci 15 04739 g011
Figure 12. Peak displacement responses for each storey of the three base-isolated structures with and without different mass ratio TIDs under the three types of ground motion excitation.
Applsci 15 04739 g012
Figure 13. Percentage reduction rate of the mean squared or peak displacement responses for the base storey of the three base-isolated structures with different mass ratio TIDs.
Applsci 15 04739 g013
Figure 14. Peak absolute acceleration response for each storey of the three base-isolated structures with and without different mass ratio TIDs under the three types of ground motion excitation.
Applsci 15 04739 g014
Figure 15. Percentage reduction rate of the peak absolute acceleration response for the base storey of the three base-isolated structures with different mass ratio TIDs.
Applsci 15 04739 g015
Table 1. Information of the far-fault ground motions.
No.EarthquakeYearMStationDistance (km)Site ClassVs_30 (m/s)Component
1Northridge19946.7Canyon Country-WLC11.9D309NORTHR/LOS000
2Duzce19997.1Bolu12.2D326DUZCE/BOL000
3Hector Mine19997.1Hector11.2C685HECTOR/HEC000
4Imperial Valley19796.5Delta22.25D275IMPVALL/H-DLT262
5Kobe19956.9Nishi-Akashi16.15C609KOBE/NIS000
6Kobe19956.9Shin-Osaka23.8D256KOBE/SHI000
7Kocaeli19997.5Duzce14.5D276KOCAELI/DZC180
8Kocaeli19997.5Arcelik12.05C523KOCAELI/ARC000
9Landers19927.3Yermo Fire Station23.7D354LANDERS/YER270
10Landers19927.3Coolwater19.85D271LANDERS/CLW-LN
11Loma Prieta19896.9Capitola22.1D289LOMAP/CAP000
12Loma Prieta19896.9Gilroy Array #312.5D350LOMAP/G03000
13Manjil19907.4Abbar12.8C724MANJIL/ABBAR--L
14Superstition Hills19876.5El Centro Imp. Co.18.35D192SUPERST/B-ICC000
15Superstition Hills19876.5Poe Road (temp)11.45D208SUPERST/B-POE270
16Cape Mendocino19927.0Rio Dell Overpass11.1D312CAPEMEND/RIO270
17Chi-Chi19997.6CHY10112.75D259CHICHI/CHY101-E
18Chi-Chi19997.6TCU04526.4C705CHICHI/TCU045-E
19San Fernando19716.6LA—Hollywood Stor24.35D316SFERN/PEL090
20Friuli19766.5Tolmezzo15.4C425FRIULI/A-TMZ000
Table 2. Information of the near-fault ground motions without pulse subset.
No.EarthquakeYearMStationDistance (km)Site ClassVs_30 (m/s)Component
1Gazli, USSR19766.8Karakyr4.7C660GAZLI/GAZ000
2Imperial Valley-0619796.5Bonds Corner2.25D223IMPVALL/H-BCR140
3Imperial Valley-0619796.5Chihuahua7.85D275IMPVALL/H-CHI012
4Nahanni, Canada19856.8Site 16.05C660NAHANNI/S1010
5Nahanni, Canada19856.8Site 22.45C660NAHANNI/S2240
6Loma Prieta19896.9Corralitos2.05C462LOMAP/CLS000
7Cape Mendocino19927.0Cape Mendocino3.5C514CAPEMEND/CPM000
8Northridge-0119946.7LA—Sepulveda VA4.2C380NORTHR/SPV270
9Northridge-0119946.7Northridge—Saticoy6.05D281NORTHR/STC090
10Chi-Chi, Taiwan19997.6TCU0673.55C434CHICHI/TCU067-E
11Chi-Chi, Taiwan19997.6TCU0845.6C553CHICHI/TCU084-E
12Denali, Alaska20027.9TAPS Pump Sta. #104.45C553DENALI/PS10-047
Table 3. Information of the near-fault ground motions with pulse subset.
No.EarthquakeYearMStationDistance (km)Site ClassVs_30(m/s)Component
1Imperial Valley19796.5El Centro Array #61.75D203IMPVALL/H-E06140
2Imperial Valley19796.5El Centro Array #72.1D211IMPVALL/H-E07140
3Loma Prieta19896.9Saratoga-Aloha8.05C371LOMAP/STG000
4Erzican19926.7Erzincan2.2D275ERZIKAN/ERZ-EW
5Cape Mendocino19927.0Petrolia4.1C713CAPEMEND/PET000
6Landers19927.3Lucerne2.95C685LANDERS/LCN260
7Northridge19946.7Rinaldi Receiving Sta3.25D282NORTHR/RRS228
8Northridge19946.7Sylmar-Olive View3.5C441NORTHR/SYL090
9Chi-Chi19997.6TCU0653.65D306CHICHI/TCU065-E
10Chi-Chi19997.6TCU1024.6C714CHICHI/TCU102-E
Table 4. Properties of the three base-isolated structures.
5-StoreyIS12345
Mass
(103 kg)
6.86.06.06.06.06.0
Stiffness
(103 kN/m)
1.233.729.128.625.019.0
Damping
(kN/m/s)
306758575038
10-StoreyIS12345678910
Mass
(103 kg)
380380380380280280280275275275275
Stiffness
(103 kN/m)
6012001200110011001100950850800650650
Damping
(103 kN/m/s)
3554.84.74.743.73.42.82.8
15-StoreyIS123456789101112131415
Mass
(103 kg)
981981981981981981981981981981981981981981981981
Stiffness
(103 kN/m)
4519131864181517171668157015201422127511771030883687490400
Damping
(103 kN/m/s)
818.518.017.516.616.115.214.713.712.311.410.08.56.64.73.9
Table 5. Optimum parameters of the TID with different mass ratios for the three base-isolated structures.
Ground Motions TypeFar-FaultNear-Fault (No Pulse)Near-Fault (Pulse)
StructureParametermd (ton)fopt ξ d opt md (ton)fopt ξ d opt md (ton)fopt ξ d opt
5-Storeyμ = 0.052.0670.9640.1112.0670.9620.1102.0670.9570.109
μ = 0.14.1350.9330.1544.1350.9300.1524.1350.9220.150
μ = 0.28.2690.8780.2128.2690.8750.2078.2690.8640.204
10-Storeyμ = 0.05232.5350.9630.111232.5350.9660.110232.5350.9610.110
μ = 0.1465.0710.9310.155465.0710.9350.154465.0710.9280.152
μ = 0.2930.1410.8760.213930.1410.8830.211930.1410.8730.208
15-Storeyμ = 0.051025.3850.9750.1111025.3850.9990.1141025.3850.9730.111
μ = 0.12050.7700.9480.1552050.7700.9800.1602050.7700.9450.155
μ = 0.24101.5390.9000.2144101.5390.9450.2234101.5390.8970.213
Disclaimer/Publisher’s Note: The statements, opinions and data contained in all publications are solely those of the individual author(s) and contributor(s) and not of MDPI and/or the editor(s). MDPI and/or the editor(s) disclaim responsibility for any injury to people or property resulting from any ideas, methods, instructions or products referred to in the content.

