Abstract
To address the challenges of infrared dim small target detection under sky cloud backgrounds on edge devices, this study proposes a lightweight sequential-differential-frame-based network (LSDF-Net) with optimization and deployment on the heterogeneous FPGA JFMQL100TAI. The network enhances detection performance through sequential-differential inputs, false-alarm-object learning, and multi-anchor assignment while reducing computational overhead through sequential-differential acceleration and convolutional pooling. Deployment efficiency is improved via image channel optimization, mixed quantization, and refining the infrared image calibration set. Experimental results indicate that the proposed network structure optimization methods reduce the hardware inference time by 15.78%. Overall, the optimized LSDF-Net achieves a recall rate of no less than 85.71% on the validation datasets and an FPS of 54.10 on the JFMQL100TAI. The proposed methods provide a reference solution for related application fields.
1. Introduction
Infrared detection utilizes the difference between target and background radiation for detection. Compared to visible light detection systems, infrared detection has the advantages of a long detection distance, working day and night, and strong anti-interference capabilities []. Long-distanced infrared targets, especially under a sky cloud background, usually show weak and small characteristics [,]. The detection of infrared dim and small targets plays an important role in the field of infrared image processing and has high application value in the field of remote sensing.
The current infrared dim small target detection methods are mainly divided into the traditional method based on a model-driven approach and the deep learning method based on a data-driven approach. Traditional methods can be divided into three categories: (1) Filter-based methods [,,] and background suppression models [,]: These methods have low computational complexity and mainly complete the detection of infrared dim small targets by calculating the differences in grayscale values and suppressing the background; (2) Methods based on the local contrast of the human visual system [,,,,]: These methods are easy to implement and construct the saliency map of the target through the local difference between the target and the background to achieve the detection of dim small infrared targets; (3) Methods based on the low-rank model [,,,]: These methods transform the target detection task into a task completed using sparse low-rank tensors. However, these traditional methods mainly rely on the characteristics of handcrafting and need prior knowledge of the background scenes, which usually have a high false-alarm rate in detection tasks with complex backgrounds and extremely dim targets. As for deep learning methods, the field has experienced rapid development and significant advancements. Researchers design specific function modules and customize network architecture to make the network more suitable for infrared dim small target detection. For example, [,,,,] improved the feature expression ability of small targets by combining traditional methods with deep learning and special network design methods; [,,] solved the problem that small targets easily disappear in a deep network by adopting the method of dense nesting and encoder–decoder design; [,] used confrontation learning and a multi-scale attention mechanism to achieve the balance between false alarms and missing detections in infrared dim small target detection; and [,] improved the adaptability of the detection network to the complex background through the design of a smoothing operator and attention module.
However, the above research has mainly focused on detection performance, which usually leads to complex structures and high computational complexity. Infrared dim small target detection networks usually need to be deployed on edge devices. It is therefore necessary to consider how to reduce the complexity of the network and transplant the network to the selected edge device for hardware acceleration.
Graphics processing units (GPUs) exhibit formidable parallel computing capabilities, rendering them applicable to diverse AI algorithms. However, their relatively high power consumption makes them unsuitable for network deployment in mobile devices with low power requirements. Application-specific integrated circuits (ASICs) are custom-designed for particular AI algorithms, delivering exceptional computational performance while maintaining low power consumption. Nevertheless, they suffer from fixed functionality, limited flexibility, and protracted development cycles [,]. In contrast, heterogeneous FPGA platforms demonstrate balanced performance characteristics, featuring high parallelism, reconfigurability, and energy efficiency, making them a good solution for deploying infrared dim small target detection networks.
Therefore, we propose an infrared dim small target detection network under a sky cloud background and FPGA-based optimization deployment methods. The main contributions of this article are as follows:
- We constructed a lightweight sequential-differential-frame-based network (LSDF-Net) for infrared dim small target detection under a sky cloud background.
- We proposed optimization methods for the network, including sequential-differential acceleration, convolutional pooling, and image channel optimization.
- We explored the impact of the infrared image calibration set on the quantization effect and evaluated the deployment performance of different quantization methods on JFMQL100TAI.
The structure of this article is as follows. Section 1 introduces the research background and the importance of the optimization and deployment methods of infrared dim small target networks based on a heterogeneous FPGA. Section 2 introduces the architecture of the proposed LSDF-Net. Section 3 introduces the optimization methods in detail and then explores the impact of the quantization calibration set on the quantization effect and evaluates different quantization methods on the deployment performance. Section 4 compares and analyzes the experimental results. The last section summarizes the work of this article.
2. LSDF-Net and Structural Optimization of the Network
A lightweight sequential-differential-frame-based network (LSDF-Net) for infrared dim small target detection suitable for detection under a sky cloud background and the optimization methods of the network are proposed in this section. The architecture of the network is shown in Figure 1, which includes the input, differential, intermediate, and output layers. Sequential images are used in the input layer, and the images are differentiated. The middle layer is the main part of the network, which uses a down-sampling pyramid structure to extract the features of the input image. A false-alarm-object learning strategy and multi-anchor box assignment strategy are adopted to improve the detection performance. The output layer contains the regression of the target classification and location, which completes the target detection task.

Figure 1.
Schematic diagram of the network structure.
2.1. Sequential-Differential-Frame Input and Optimization
The existing infrared dim small target detection algorithms can be divided into single-frame detection methods and sequential-frame detection methods. Much research progress has been made in the field of single-frame detection. However, single-frame detection methods lack temporal information and mainly rely on the gray-level and spatial information of infrared images to complete detection, usually resulting in a higher false-alarm rate in low SNR scenes. The input of the proposed LSDF-Net network is four time-sequential images. The four input images are differentiated frame by frame; the current frame is successively subtracted by the previous three frames. The differential layer diagram is shown in Figure 2, where X is the original sequence image with a size of M × N × 4, Y is the sequential-differential-frame image with a size of M × N × 3, and M and N are the width and height of the image.

Figure 2.
Schematic diagram of the sequential image differential.
The sequential images contain gray-level, spatial, and temporal information, which significantly increases the amount of information in the input. After the sequential images are input, the images are differentiated to improve the SNR. Through network learning, small target motion information can be effectively used to improve the target detection rate and suppress the false-alarm rate. As shown in Figure 3, after image differentiating, most of the stationary background clutter is removed, while moving targets are not. Additionally, moving clouds and targets are distinguished based on their different shapes and sizes.
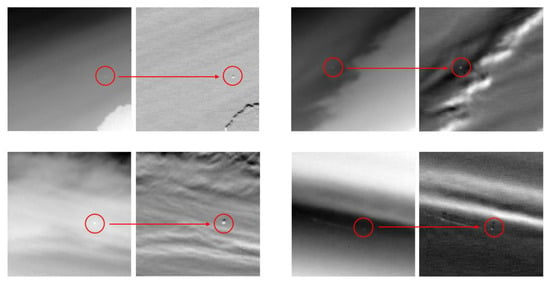
Figure 3.
Original and differential images under a sky cloud background. The (left) side is the original image, and the (right) side is the differential image.
The differential image can highlight the changed area by calculating the pixel-level difference between sequential frames, which can effectively highlight the moving target and eliminate slow-moving background interference information, thus improving the SNR and facilitating subsequent target detection and tracking.
Differential images are generated by the differential layer in the LSDF-Net. Introducing a differential layer into the network structure will increase both the number of layers and the inference time. To reduce the layers of the network, a sequential-differential acceleration method is proposed, which does not need to add an additional differential layer while completing the image differentiation. Firstly, the network is trained with the differential layer. Once the network training is complete, the parameters of the convolution layer are fixed, and the differential layer also has established parameters, allowing it to be combined with the adjacent convolution layer.
The process of the differential layer of four-channel images is as follows:
where X1, X2, X3, and X4 are four time-sequential image inputs, and the output three-channel images are the inputs of the next convolution layer, with the convolution kernel Conv (ω, b), where ω represents the weight of the convolution kernel, with a size of 3 × 3 × 3 × 16, and b represents the bias, with a size of 1 × 1 × 16. The convolution process of the channel differential image and Conv (ω, b) is as follows:
where
Rewriting the above equation yields
where
It can be known from the above derivation that by linearly combining the weights of the original convolutional layer, the differential layer and the adjacent convolution layer are merged into a new differential-convolutional layer , among which the bias b is unchanged. The schematic diagram of the sequential-differential acceleration is shown in Figure 4.
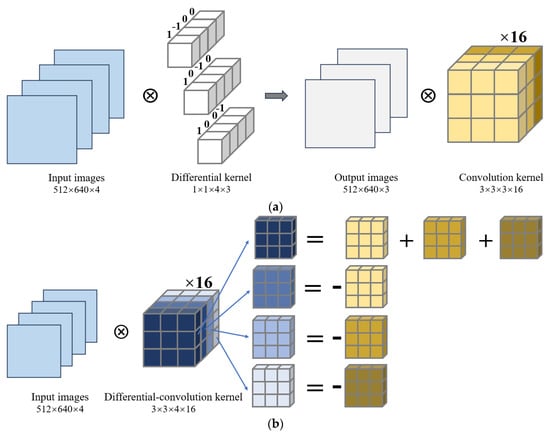
Figure 4.
Schematic diagram of sequential-differential acceleration: (a) original differential and convolution operation; (b) combined operation using sequential-differential acceleration.
The differential layer and adjacent convolution layer are merged into one convolution layer by using the sequential-differential acceleration method. The original differential operation and adjacent convolution are calculated step by step on the FPGA, which consumes a longer amount of time. After adopting sequential-differential acceleration, the dimensionality of the convolutional layer increases, but the original differential layer is removed. The differential-convolution operation is accelerated by utilizing efficient parallel computing on the FPGA platform.
2.2. Convolutional Pooling
In convolutional neural networks, there are three commonly used pooling operations: max pooling, mean pooling, and convolutional pooling. Maximum pooling takes the maximum value of the pixel in the pooling area []. The feature map obtained in this way is more sensitive to rough texture features, but it discards the non-extreme information, which may cause a loss of detail in the features of dim small targets. Mean pooling takes the average value of pixels in the pooling area []. The feature map obtained in this way is more sensitive to background information, but it will smooth the prominent features of dim small targets. Convolutional pooling is achieved by adjusting the stride of the convolution, resulting in a performance comparable to traditional pooling methods. The parameters of the convolutional pooling kernel are automatically learned during network training. Convolutional pooling can transmit the overall information of the target to the next layer and achieve different pooling effects for different channels, which provides high flexibility in extracting the features of dim small targets. Convolutional pooling combines the convolution layer and pooling layer, which can reduce the number of network layers. The schematic diagram of the three pooling methods is shown in Figure 5. In the following chapter, a comparison of the convolutional pooling experimental results is provided.
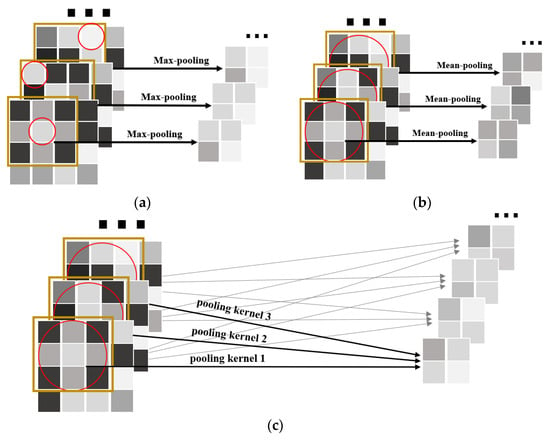
Figure 5.
Comparison of the three pooling methods: (a) max-pooling; (b) mean-pooling; (c) conv-pooling.
2.3. False-Alarm-Object Learning and Multi-Anchor Assignment Strategy
Infrared dim small target detection in complex sky cloud background scenarios is a challenging problem []. To reduce the false alarms of the network, we analyzed the sources of false alarms and found that the interference mainly comes from cloud edges, blind and flicking pixels, and system random noise, as shown in Table 1.

Table 1.
Information on the detected objects.
Based on this, a false-alarm-object learning strategy is adopted, in which the detection network learns infrared dim small targets and other interfering objects including cloud edges, blind and flicking pixels, and system random noise. The images of the multiple objects are shown in Figure 6. This strategy converts object detection tasks into object classification tasks. Compared to single-type dim small target detection, false-alarm-object detection can help to reduce false alarms.
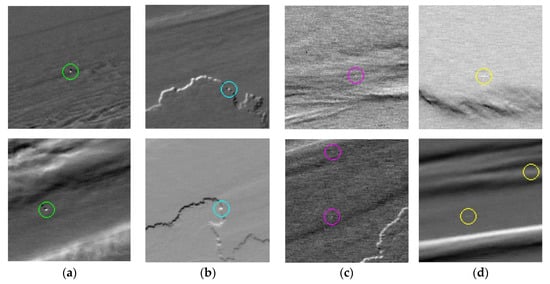
Figure 6.
Diagram of the detected objects: (a) dim small target; (b) cloud edges; (c) blind and flicking pixels; (d) system random noise.
In the task of target detection, one-stage target detection algorithms usually generate a series of anchor boxes on the image, regarding these anchor boxes as potential candidate regions []. The model predicts whether these candidate regions contain targets and predicts the category of targets. In addition, since the anchor box position is fixed, it usually cannot coincide with the target bounding box, so the anchor box needs to be adjusted to form a real bounding box that can accurately describe the object position. In infrared dim small target detection, the target usually occupies 1–15 pixels and is usually contained in only one anchor box. In this article, the input image is divided into multiple grids, which are used as anchor boxes to detect the target bounding box.
Each real bounding box contains seven values, and its output is
where output represents the output value of the bounding box; x, y is the target center coordinate; w, h represents the width and height of the target; c1 represents the target category label; c2 represents the cloud edges, blind and flicking elements, and system random noise label; and conf represents the target confidence level.
However, for single-anchor box assignment, when the target center is close to the middle of the anchor boxes, the target label will be assigned to the closest anchor box, but the location of the target center might swing between the nearby anchor boxes due to the signal noise and target movement, which may lead to a decrease in the detection rate of the target. Especially for moving targets crossing the boundary of anchor boxes, the switching of anchor boxes may decrease the continuity of target detection.
To reduce the missed detections of the network, this article adopts a multi-anchor box assignment strategy. A buffer area is set, as shown in the dashed area in Figure 7. When the target is located in the buffer area, it is considered to belong to both anchor boxes, and the target labels are assigned to the anchor boxes. As shown in Figure 7, Target 1 is inside the anchor frame (Anchor1) that performs the target detection; Target 2 is in the middle of two adjacent anchor frames (Anchor1 and Anchor3), and both anchor frames are assigned target labels and perform the target detection together; and Target 3 is in the middle of four anchor frames (Anchor1, Anchor2, Anchor3, and Anchor4), which are assigned target labels and also perform the target detection together. The multi-anchor box assignment strategy allocates multiple anchor boxes to detect the boundary targets, which increases the target detection probability and improves the continuity of moving target detection.
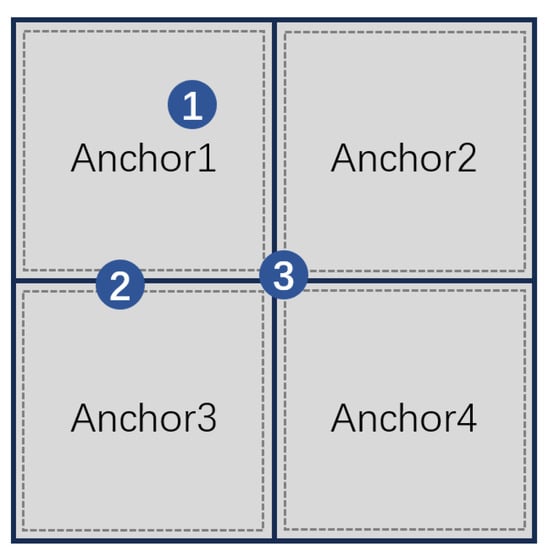
Figure 7.
Target allocation schematic of multiple anchor boxes.
3. FPGA-Based Optimization of Deployment
3.1. Image Input Channel Optimization
The number of image channels refers to the number of values required to describe a pixel. Generally, the grayscale image’s channel number is 1; the color image’s channel number is 3, representing the red, green, and blue (RGB) values of each pixel. In addition, there are some special four-channel images, such as color images with RGB and A channel values, where A represents transparency. The proposed LSDF-Net is input by four-channel infrared sequential images.
Most embedded platforms or AI solutions are designed for color images. In the case of the four-channel input, taking the RGBA format as an example, the R, G, B, and A values of each pixel are stored, and the image is arranged pixel by pixel. Some FPGA platforms only support a pixel-by-pixel four-channel arrangement, while sequential single-band infrared images are arranged channel by channel, as shown in Figure 8.
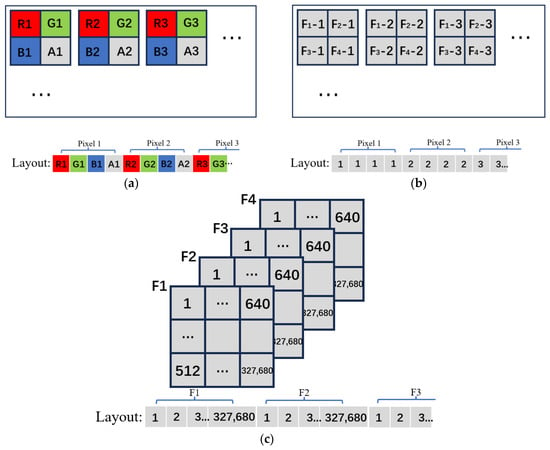
Figure 8.
(a) Arrangement of four-channel color images; (b) four-channel grayscale image arranged by pixels; (c) four-channel grayscale image arranged by channels.
Therefore, during network deployment, it is necessary to rearrange the dataset format before inputting the images, converting the sequential infrared images from a channel-by-channel layout to a pixel-by-pixel layout. The rearrangement of the data format will consume much time, resulting in a poor real-time performance of the detection system. To avoid the rearrangement of the data format and accelerate the differential operation, the differential algorithm is optimized. The original differential operation subtracts the last three frames from the first frame, and the improved differential operation subtracts the mean of the last three frames from the first frame, as shown in Figure 9. Consequently, the differential output is a single channel, so data rearrangement is not required.

Figure 9.
New differential layer.
The merging process of the differential layer and adjacent convolution layer is updated as follows:
where X1, X2, X3, and X4 are four time-sequential image inputs, represents the weight of the convolution kernel, with a size of 3 × 3 × 1 × 16, and represents the bias, with a size of 1 × 1 × 16. The schematic diagram is shown in Figure 10.
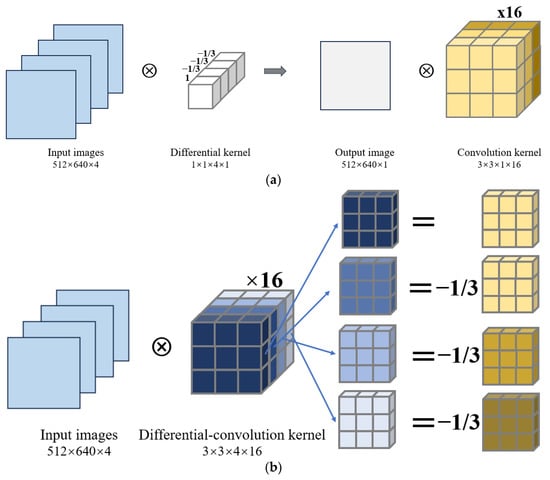
Figure 10.
Using sequential-differential acceleration to merge the improved differential layer and adjacent convolutional layer: (a) original differential and convolution operation; (b) combined operation using sequential-differential acceleration.
3.2. Optimization of the Quantization Calibration Set for Infrared Images
A calibration set is a dataset used to evaluate and adjust quantization parameters during the quantization process. Quantization requires measuring the distribution of each feature map to determine the appropriate quantization scaling factor. The function of the calibration set is to use a portion of the dataset to represent the entire dataset to measure the distribution range of each feature map and to count the input and output data range of each layer as a reference for the feature map quantization.
The relative Euclidean distance and cosine similarity are used as evaluation indicators, which are defined as
where represents the output value of each network layer before quantization, represents the output value of each network layer after quantization, and n represents the number of network layers. The relative Euclidean distance and cosine similarity indicate the difference between the model before and after quantization, which can reflect the effect of model quantization. The smaller the relative Euclidean distance, the better the quantization effect. Similarly, the closer the cosine similarity is to 1, the better the quantization effect.
The selection of a calibration set affects quantization accuracy. For general target detection tasks, the calibration set should meet the following basic requirements:
- Representativeness: the calibration set should well represent the data distribution of the real scene images;
- Diversity: the calibration set should cover different types of input data as much as possible;
- Scale: the calibration set should have enough scale. The larger the scale, the better the quantization effect will be, but more memory and time will be required for the quantization process.
Besides the above, for an infrared image under a sky cloud background, the background mainly contains various clouds. Therefore, it is necessary to optimize the selection criteria for infrared images when used as a quantization calibration set. We further explore the effects of the dynamic range, variance, scale, and batch size of infrared images on the quantization effect. In the next chapter, the experiment results are compared and analyzed in detail.
3.3. Int16/Int8/Mixed Quantization
Model quantization aims to reduce the consumption of storage space and the computing resources of the model. It is a process of converting the network floating parameters into low-bit-width data. Quantification can significantly reduce model size and resource consumption, speed up computing, and make models easier to deploy on resource-constrained edge devices. The commonly used quantization bit widths are int16, int8, and binary quantization/ternary quantization with lower bit widths. However, due to the inevitable rounding and truncation errors in the quantization process, the accuracy of the neural network may be affected. For neural networks with high accuracy requirements, the selection of quantization bit width is a trade-off between network accuracy and network complexity. The text is quantified by the Icraft component, and the main process is shown in Figure 11.
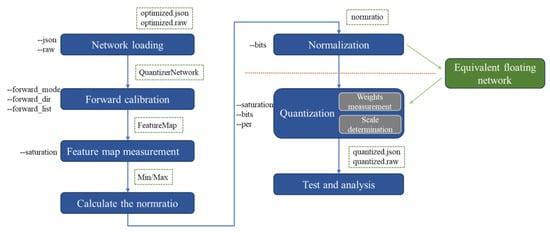
Figure 11.
The flow chart of quantization based on the Icraft quantizer.
Quantization mainly includes the following steps:
- Loading the floating network into the memory to facilitate the subsequent processing of the network;
- Forward calibration: inferring on the floating-point network based on the calibration dataset to obtain the feature map. The parameter forward_mode determines the forward inference mode. Forward_dir and forward_list indicate the position and list of the calibration set;
- Feature map measurement: determining the saturation point of each feature map according to the method specified by the parameter saturation;
- Calculate the normalization ratio: calculating the normalization coefficient of each characteristic map according to the saturation point;
- Normalization: normalizing the network parameters to ensure that the dynamic range of all feature maps is suitable for quantification. After normalization, the network and the previous network are completely equivalent;
- Quantization: Quantizing the floating-point number to the fixed-point number after completing the preparation work;
- Test and analysis: verifying and analyzing the quantified network progress through simulation tools.
For the infrared dim small target detection network, the quantization bit width int8, int16, and mixed are usually used. The mixed precision quantization method uses int16 to calculate the operators that have a greater impact on the quantization precision; meanwhile, other operators are calculated by int8 to reduce the complexity of the network. In the next chapter, the experiment results are compared and analyzed in detail.
4. Experimental Results and Analysis
4.1. Experimental Setup
4.1.1. Dataset and Training Environment
In the experiment, the dataset and training strategy are referenced from the literature []. The training strategy includes small-sized image transfer learning, label refinement, and iterative training methods. The training dataset comprises 89,510 images, while the validation dataset consists of 2128 independent sequential images, each with a size of 640 × 512 × 16 bits. The sample of the validation dataset is shown in Figure 12, where a, b, c, and d correspond to datasets 1, 2, 3, and 4, respectively.
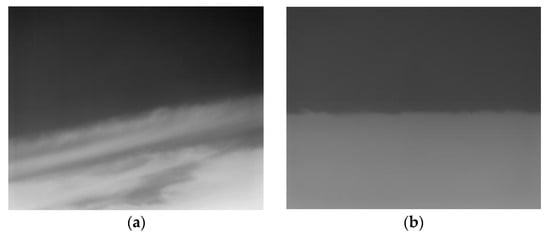
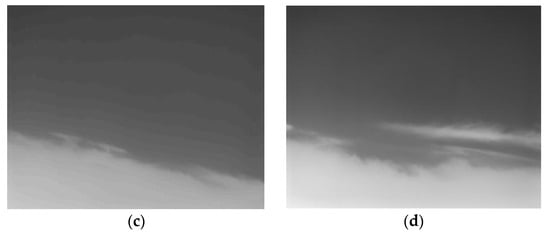
Figure 12.
Sample images of the validation datasets. (a) example of dataset 1; (b) example of Dataset 2; (c) example of dataset 3; (d) example of Dataset 4.
The quantification is completed in Icraft 3.1.1. The quantized network is deployed on the Fudan-Micro Wukong development board, which was equipped with a Fudan-Micro heterogeneous FPGA chip JFMQL100TAI. The device runs on the Ubuntu 20.04 Linux system.
4.1.2. JFMQL100TAI
The heterogeneous FPGA JFMQL100TAI chip of the Fudan Micro Company integrates a processing system (PS), programmable logic (PL), and Buyi AI acceleration engine based on a four-core processor with rich characteristics. The schematic diagram of each unit is shown in Figure 13. The PS is a four-core high-performance 64-bit energy-efficient Cortex-A53 processor based on ARM v8 instruction set architecture, which can be used as the main task management processor of the system, including SDIO, QSPI, UART, Ethernet, and other interfaces. The abundant programmable resources and high-speed interface resources at the PL can also complete the main interface logic functions, including the main control board GTX high-speed communication interface, LVDS interface, PCIE2.0, HDMI, and other high-speed and low-speed interfaces from the backplane; its rich programmable logic resources greatly improve the flexibility and scalability of the system. The Buyi AI acceleration engine is an ASIC AI processing engine integrated into the chip, which supports a variety of quantization precision tasks and has a strong AI computing capability. The quantization computing power for int8 reaches 27.52 TOPs, and for int16, it reaches 6.88 TOPs.
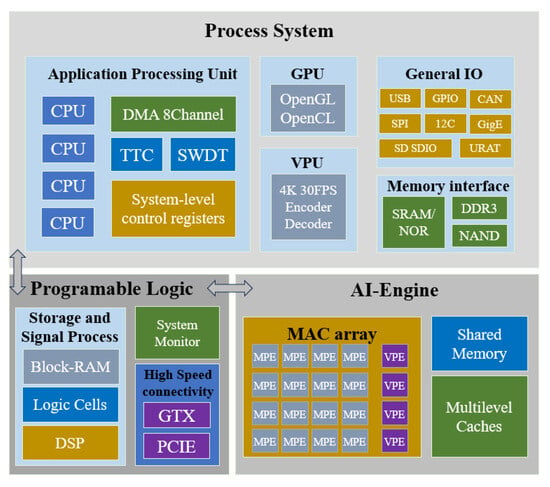
Figure 13.
System block diagram of JFMQL100TAI.
4.2. Ablation Experiments with Sequential-Differential Acceleration and Convolutional Pooling
To verify the improvement of detection accuracy by false-alarm-object learning and the multi-anchor assignment strategy, ablation experiments were conducted, and the results are shown in Table 2.

Table 2.
Ablation study results of the network.
The multi-anchor assignment strategy increased the precision rate from 97.79% to 98.64% and improved the recall rate from 82.66% to 87.61%; the false-alarm-object learning further enhanced the precision rate from 98.64% to 99.17% and boosted the recall rate from 87.61% to 90.18%.
To verify the improvement of the network performance by the sequential-differential acceleration method and convolutional pooling, ablation experiments were conducted. Differential acceleration and convolutional pooling are applied to the LSDF-Net. LSDF-Net + Diff-Acc is converted from the Baseline LSDF-Net by the sequential-differential acceleration method, and LSDF-Net + Diff-Acc + Conv-Pl is retrained with the convolutional pooling method. The networks are deployed to the heterogeneous FPGA JFMQL100TAI using the same settings. The results of the experiment are shown in Table 3.

Table 3.
Ablation study results.
In the table, the hardware inference time is divided into two parts. One is hardware computation time, which represents the time spent by the hardware only on computation, such as convolution operation time and activation time; the other is memory copy time, which refers to the memory access and data transfer time. The average data in the table are the average values of four groups of validation sets. The results indicate that the implementation of sequential-differential acceleration leads to a reduction in memory copy time and hard time. Specifically, the average inference time decreases by 11.37%. Additionally, after applying convolutional pooling, the average inference time is further reduced by 15.78%. Notably, all three networks maintain a consistent recall rate performance.
4.3. Image Input Channel Optimization Experiment
A comparative experiment of four-channel inputs and single-channel inputs was carried out on the four datasets, each with int8 and int16 quantization settings. The experimental results are shown in Table 4, where for the four-channel setting, data processing time includes the image reading, data rearrangement, output decoding, and target association times. For the single-channel setting, data processing time includes the image reading, differential operation, output decoding, and target association times. The experimental results are shown in Table 4.

Table 4.
Results of the different quantization bits and different input channels.
According to the table, by converting the image input from four channels to a single channel, the FPS increased from 28.86 to 51.09 under 16-bit quantization, reflecting an improvement of 43.51%. Similarly, under 8-bit quantization, the FPS increased from 32.20 to 55.73, representing an improvement of 42.22%. The results show that by optimizing the image input channel, the memory copy, hardware, and data processing times are reduced in both 16-bit quantization and 8-bit quantization.
4.4. Quantization Calibration Set Optimization Experiment
One hundred independent infrared images from various scenarios were selected for the quantization calibration experiment (some of the images are shown in Figure 14) and the quantization increment experiments of the quantization calibration set were conducted in two ways. Table 5 shows the increment based on the image dynamic range, and Table 6 shows the increment based on the image variance. Cosine similarity and relative Euclidean distance were used as evaluation metrics to reflect the quantization effect.
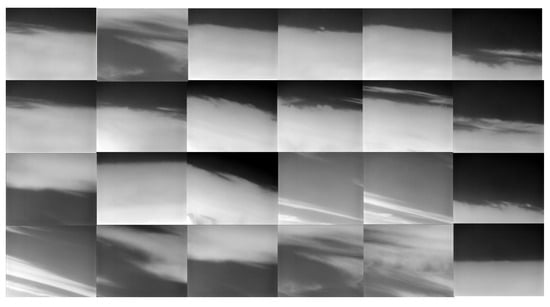
Figure 14.
A selection of the quantization calibration images.

Table 5.
The increment experimental results of the calibration set sorted by the image dynamic range.

Table 6.
The increment experimental results of the calibration set sorted by the image variance.
As shown in Table 4 and Table 5, the experimental results indicate that the dynamic range and variance of the infrared images are positively correlated with the quantization effect. From a portion of the experimental data, it can also be concluded that when the maximum dynamic range remains unchanged and the maximum variance increases, the quantization effect remains the same; however, when the maximum variance remains unchanged and the maximum dynamic range increases, the quantization effect improves. Therefore, the maximum dynamic range of an image significantly influences the quantization effect. Furthermore, it is essential to select a sufficient number of quantization calibration sets to ensure they encompass a diverse range of images with both wide dynamic ranges and high variance.
In addition, experiments on the quantization effects of different batch sizes were conducted, as shown in Table 7. The results indicate that as batch size increases, the quantization effect improves, and the optimal quantization effect is attained with a batch size of 100. It is important to note that when the calibration set is too large, performing a forward pass on all images at once can put significant pressure on the computer’s available memory. Therefore, when the computer has limited memory, batch processing can be used to handle the calibration set in smaller groups. The quantization component will average the results from multiple measurements to produce the final measurement result.

Table 7.
Quantification effect of different batch sizes.
4.5. int16/int8/Mixed Quantization Experiment
The total running time and recall rates of 8-bit, 16-bit, and mixed quantization are compared across the four validation datasets. The experimental results are shown in Table 8.

Table 8.
Recall rate results of the three quantization methods.
The experimental results indicate that for Dataset1 and Dataset2, which have a high target average SNR, all three quantization methods achieve a 100% recall rate; for Dataset3, with a target average SNR of 7.74, the recall of all three quantization methods decreased to 94.12%; For Dataset4, with a target average SNR of 3.72, the recall of int16 and the mixed quantization methods decreased to 85.71%, and the recall of int8 quantization methods further decreased to 80.95%.
The processing time experiment results are shown in Table 9.

Table 9.
Inference time results of the three quantization methods.
The experimental results demonstrate that the average inference time for int8 quantization is reduced by 37.99% compared to int16 quantization, while the average inference time for mixed quantization is 30.65% less than that of int16 quantization. The mixed quantization method not only decreases the hardware inference time but also maintains the same recall rate as int16 quantization. After deploying the mixed quantization, the comparison of the total running time is presented in Table 10, where FPS increased to 54.10.

Table 10.
Comparison of the total running time after deployment with mixed quantization.
After network deployment, the FPGA resource usage of the hardware platform is shown in Table 11. It can be seen that the entire system has less hardware resource utilization and a lower resource consumption ratio.

Table 11.
FPGA resource utilization.
4.6. Comparison with the Existing Method
In order to verify the progressiveness of the proposed method, Efficientnet [], Mobilenetv2 [], Darknet19 [], Googlenet [], Resnet18 [], Yolov5n, and Squeezenet [] were selected for horizontal comparison.
As shown in Table 12, the proposed LSDFnet has fewer parameters and lower FLOPs, achieving a high-speed processing performance with an acceptable detection performance.

Table 12.
Comparison with the existing method.
5. Conclusions
This article proposes a network for infrared dim small target detection under a sky cloud background with optimization and deployment on the heterogeneous FPGA JFMQL100TAI. First, a lightweight sequential-differential-frame-based network (LSDF-Net) is established. This network incorporates sequential-differential input, a false-alarm-object learning strategy, and a multi-anchor box assignment strategy to improve the detection performance under a sky cloud background. Sequential-differential acceleration and convolutional pooling are introduced to optimize the structure of the network, reducing hardware inference time by 15.78%. Subsequently, by converting the image input from four channels to a single channel, FPS is improved by 43.5%. Finally, the selection criteria for the infrared image quantization calibration set are optimized, and mixed quantization is chosen for deploying the network on the heterogeneous FPGA JFMQL100TAI platform. Compared to 16-bit quantization, this approach saves 30.65% of the network inference time while maintaining the same level of recall rate. The recall rate after deployment on the JFMQL100TAI platform is not lower than 85.71% on the four validation datasets, with a performance of 54.10 FPS. Compared to some existing methods, the proposed LSDFnet achieves high-speed processing performance with acceptable detection performance. This article conducts research on network optimization and deployment based on JFMQL100TAI and has achieved some progress. However, the compatibility of this type of device with new network layers or custom network layers still needs to be further improved.
Author Contributions
Y.C. wrote the manuscript; X.L. gave professional guidance and edited; Y.X. gave advice. All authors have read and agreed to the published version of the manuscript.
Funding
This research received no external funding.
Data Availability Statement
The data presented in this study are available in the article.
Conflicts of Interest
The authors declare no conflicts of interest.
References
- Wu, Z.; Fuller, N.; Theriault, D.; Betke, M. A Thermal Infrared Video Benchmark for Visual Analysis. In Proceedings of the 27th IEEE Conference on Computer Vision and Pattern Recognition (CVPR), Columbus, OH, USA, 23–28 June 2014; p. 201. [Google Scholar]
- Qian, K.; Rong, S.H.; Cheng, K.H. Anti-interference small target tracking from infrared dual waveband imagery. Infrared Phys. Technol. 2021, 118, 103882. [Google Scholar] [CrossRef]
- Bai, X.; Chen, Z.; Zhang, Y.; Liu, Z.; Lu, Y. Infrared ship target segmentation based on spatial information improved FCM. IEEE Trans. Cybern. 2015, 46, 3259–3271. [Google Scholar] [CrossRef] [PubMed]
- Barnett, J. Statistical analysis of median subtraction filtering with application to point target detection in infrared backgrounds. In Proceedings of the Infrared Systems and Components III, Los Angeles, CA, USA, 16–17 January 1989; pp. 10–18. [Google Scholar]
- Tom, V.T.; Peli, T.; Leung, M.; Bondaryk, J.E. Morphology-based algorithm for point target detection in infrared backgrounds. In Proceedings of the 5th Conf on Signal and Data Processing of Small TargetsSignal & Data Processing of Small Targets, Orlando, FL, USA, 12–14 April 1993; pp. 2–11. [Google Scholar]
- Deshpande, S.D.; Er, M.H.; Ronda, V.; Chan, P. Max-Mean and Max-Median Filters for Detection of Small-Targets. In Proceedings of the Conference on Signal and Data Processing of Small Targets 1999, Denver, CO, USA, 19–23 July 1999; pp. 74–83. [Google Scholar]
- Wang, X.Y.; Peng, Z.M.; Zhang, P.; He, Y.M. Infrared Small Target Detection via Nonnegativity-Constrained Variational Mode Decomposition. IEEE Geosci. Remote Sens. Lett. 2017, 14, 1700–1704. [Google Scholar] [CrossRef]
- Kong, X.; Yang, C.P.; Cao, S.Y.; Li, C.H.; Peng, Z.M. Infrared Small Target Detection via Nonconvex Tensor Fibered Rank Approximation. IEEE Trans. Geosci. Remote Sens. 2022, 60, 21. [Google Scholar] [CrossRef]
- Shi, Y.F.; Wei, Y.T.; Yao, H.; Pan, D.H.; Xiao, G.R. High-Boost-Based Multiscale Local Contrast Measure for Infrared Small Target Detection. IEEE Geosci. Remote Sens. Lett. 2018, 15, 33–37. [Google Scholar] [CrossRef]
- Han, J.H.; Liu, S.B.; Qin, G.; Zhao, Q.; Zhang, H.H.; Li, N.N. A Local Contrast Method Combined with Adaptive Background Estimation for Infrared Small Target Detection. IEEE Geosci. Remote Sens. Lett. 2019, 16, 1442–1446. [Google Scholar] [CrossRef]
- Chen, C.L.P.; Li, H.; Wei, Y.T.; Xia, T.; Tang, Y.Y. A Local Contrast Method for Small Infrared Target Detection. IEEE Trans. Geosci. Remote Sens. 2014, 52, 574–581. [Google Scholar] [CrossRef]
- Han, J.H.; Moradi, S.; Faramarzi, I.; Liu, C.Y.; Zhang, H.H.; Zhao, Q. A Local Contrast Method for Infrared Small-Target Detection Utilizing a Tri-Layer Window. IEEE Geosci. Remote Sens. Lett. 2020, 17, 1822–1826. [Google Scholar] [CrossRef]
- Wang, X.T.; Lu, R.T.; Bi, H.X.; Li, Y.H. An Infrared Small Target Detection Method Based on Attention Mechanism. Sensors 2023, 23, 8608. [Google Scholar] [CrossRef]
- Gao, C.Q.; Meng, D.Y.; Yang, Y.; Wang, Y.T.; Zhou, X.F.; Hauptmann, A.G. Infrared Patch-Image Model for Small Target Detection in a Single Image. IEEE Trans. Image Process. 2013, 22, 4996–5009. [Google Scholar] [CrossRef]
- He, Y.J.; Li, M.; Zhang, J.L.; Yao, J.P. Infrared Target Tracking Based on Robust Low-Rank Sparse Learning. IEEE Geosci. Remote Sens. Lett. 2016, 13, 232–236. [Google Scholar] [CrossRef]
- Dai, Y.M.; Wu, Y.Q. Reweighted Infrared Patch-Tensor Model with Both Nonlocal and Local Priors for Single-Frame Small Target Detection. IEEE J. Sel. Top. Appl. Earth Obs. Remote Sens. 2017, 10, 3752–3767. [Google Scholar] [CrossRef]
- Zhang, L.D.; Peng, L.B.; Zhang, T.F.; Cao, S.Y.; Peng, Z.M. Infrared Small Target Detection via Non-Convex Rank Approximation Minimization Joint l2,1 Norm. Remote Sens. 2018, 10, 1821. [Google Scholar] [CrossRef]
- Dai, Y.M.; Wu, Y.Q.; Zhou, F.; Barnard, K. Attentional Local Contrast Networks for Infrared Small Target Detection. IEEE Trans. Geosci. Remote Sens. 2021, 59, 9813–9824. [Google Scholar] [CrossRef]
- Yu, C.; Liu, Y.P.; Wu, S.H.; Xia, X.; Hu, Z.H.; Lan, D.Y.; Liu, X. Pay Attention to Local Contrast Learning Networks for Infrared Small Target Detection. IEEE Geosci. Remote Sens. Lett. 2022, 19, 5. [Google Scholar] [CrossRef]
- Zhao, J.M.; Yu, C.; Shi, Z.L.; Liu, Y.P.; Zhang, Y.D. Gradient-Guided Learning Network for Infrared Small Target Detection. IEEE Geosci. Remote Sens. Lett. 2023, 20, 5. [Google Scholar] [CrossRef]
- Wu, X.; Hong, D.F.; Huang, Z.C.; Chanussot, J. Infrared Small Object Detection Using Deep Interactive U-Net. IEEE Geosci. Remote Sens. Lett. 2022, 19, 1–5. [Google Scholar] [CrossRef]
- Hou, Q.Y.; Wang, Z.P.; Tan, F.J.; Zhao, Y.; Zheng, H.L.; Zhang, W. RISTDnet: Robust Infrared Small Target Detection Network. IEEE Geosci. Remote Sens. Lett. 2022, 19, 5. [Google Scholar] [CrossRef]
- Tong, X.Z.; Sun, B.; Wei, J.Y.; Zuo, Z.; Su, S.J. EAAU-Net: Enhanced Asymmetric Attention U-Net for Infrared Small Target Detection. Remote Sens. 2021, 13, 3200. [Google Scholar] [CrossRef]
- Li, B.Y.; Xiao, C.; Wang, L.G.; Wang, Y.Q.; Lin, Z.P.; Li, M.; An, W.; Guo, Y.L. Dense Nested Attention Network for Infrared Small Target Detection. IEEE Trans. Image Process. 2023, 32, 1745–1758. [Google Scholar] [CrossRef]
- Zhang, L.H.; Lin, W.H.; Shen, Z.M.; Zhang, D.W.; Xu, B.L.; Wang, K.M.; Chen, J. CA-U2-Net: Contour Detection and Attention in U2-Net for Infrared Dim and Small Target Detection. IEEE Access 2023, 11, 88245–88257. [Google Scholar] [CrossRef]
- Wang, H.; Zhou, L.P.; Wang, L. Miss Detection vs. False Alarm: Adversarial Learning for Small Object Segmentation in Infrared Images. In Proceedings of the IEEE/CVF International Conference on Computer Vision (ICCV), Seoul, Republic of Korea, 27 October–2 November 2019; pp. 8508–8517. [Google Scholar]
- Du, S.Y.; Wang, K.W.; Cao, Z.G. BPR-Net: Balancing Precision and Recall for Infrared Small Target Detection. IEEE Trans. Geosci. Remote Sens. 2023, 61, 15. [Google Scholar] [CrossRef]
- Yang, Z.; Ma, T.L.; Ku, Y.A.; Ma, Q.; Fu, J. DFFIR-net: Infrared Dim Small Object Detection Network Constrained by Gray-level Distribution Model. IEEE Trans. Instrum. Meas. 2022, 71, 15. [Google Scholar] [CrossRef]
- Hu, Y.; Liu, Y.; Liu, Z. A survey on convolutional neural network accelerators: GPU, FPGA and ASIC. In Proceedings of the 2022 14th International Conference on Computer Research and Development (ICCRD), Shenzhen, China, 7–9 January 2022; pp. 100–107. [Google Scholar]
- Nurvitadhi, E.; Sim, J.; Sheffield, D.; Mishra, A.; Krishnan, S.; Marr, D. Accelerating recurrent neural networks in analytics servers: Comparison of FPGA, CPU, GPU, and ASIC. In Proceedings of the 2016 26th International Conference on Field Programmable Logic and Applications (FPL), Lausanne, Switzerland, 29 August–2 September 2016; pp. 1–4. [Google Scholar]
- Ranzato, M.A.; Boureau, Y.-L.; Cun, Y. Sparse feature learning for deep belief networks. In Proceedings of the Advances in Neural Information Processing Systems 20 (NIPS 2007), Vancouver, BC, Canada, 3–6 December 2007. [Google Scholar]
- LeCun, Y.; Boser, B.; Denker, J.; Henderson, D.; Howard, R.; Hubbard, W.; Jackel, L. Handwritten digit recognition with a back-propagation network. In Proceedings of the Advances in Neural Information Processing Systems 2 (NIPS 1989), Denver, CO, USA, 27–30 November 1989. [Google Scholar]
- He, L.; Xie, L.; Xie, T.; Pan, H.; Zheng, Y. An effective TBD algorithm for the detection of infrared dim-small moving target in the sky scene. In Proceedings of the Multimedia and Signal Processing: Second International Conference, CMSP 2012, Shanghai, China, 7–9 December 2012; pp. 249–260. [Google Scholar]
- Redmon, J.; Divvala, S.; Girshick, R.; Farhadi, A. You Only Look Once: Unified, Real-Time Object Detection. In Proceedings of the 2016 IEEE Conference on Computer Vision and Pattern Recognition (CVPR), Seattle, WA, USA, 27–30 June 2016; pp. 779–788. [Google Scholar]
- Zhao, W.X.; Lai, X.F.; Zhao, X.L.; Xia, Y.C.; Zhou, J.M. A Strategy for Training Dim and Small Infrared Targets Detection Networks Under Sequential Cloud Background Images. IEEE Access 2024, 12, 105016–105026. [Google Scholar] [CrossRef]
- Tan, M.; Le, Q. Efficientnet: Rethinking model scaling for convolutional neural networks. In Proceedings of the International Conference on Machine Learning, Long Beach, CA, USA, 9–15 June 2019; pp. 6105–6114. [Google Scholar]
- Sandler, M.; Howard, A.; Zhu, M.; Zhmoginov, A.; Chen, L.-C. Mobilenetv2: Inverted residuals and linear bottlenecks. In Proceedings of the IEEE Conference on Computer Vision and Pattern Recognition, Salt Lake City, UT, USA, 18–23 June 2018; pp. 4510–4520. [Google Scholar]
- Redmon, J.; Farhadi, A. YOLO9000: Better, faster, stronger. In Proceedings of the IEEE Conference on Computer Vision and Pattern Recognition, Honolulu, HI, USA, 21–26 July 2017; pp. 7263–7271. [Google Scholar]
- Szegedy, C.; Liu, W.; Jia, Y.; Sermanet, P.; Reed, S.; Anguelov, D.; Erhan, D.; Vanhoucke, V.; Rabinovich, A. Going deeper with convolutions. In Proceedings of the IEEE Conference on Computer Vision and Pattern Recognition, Boston, MA, USA, 7–12 June 2015; pp. 1–9. [Google Scholar]
- He, K.; Zhang, X.; Ren, S.; Sun, J. Deep residual learning for image recognition. In Proceedings of the IEEE Conference on Computer Vision and Pattern Recognition, Las Vegas, NV, USA, 27–30 June 2016; pp. 770–778. [Google Scholar]
- Iandola, F.N.; Han, S.; Moskewicz, M.W.; Ashraf, K.; Dally, W.J.; Keutzer, K. SqueezeNet: AlexNet-level accuracy with 50× fewer parameters and <0.5 MB model size. arXiv 2016, arXiv:1602.07360. [Google Scholar]
Disclaimer/Publisher’s Note: The statements, opinions and data contained in all publications are solely those of the individual author(s) and contributor(s) and not of MDPI and/or the editor(s). MDPI and/or the editor(s) disclaim responsibility for any injury to people or property resulting from any ideas, methods, instructions or products referred to in the content. |
© 2025 by the authors. Licensee MDPI, Basel, Switzerland. This article is an open access article distributed under the terms and conditions of the Creative Commons Attribution (CC BY) license (https://creativecommons.org/licenses/by/4.0/).