Article

Electroluminescence Imaging Based on FFT Analysis for Outdoor Photovoltaic Module Inspection: A Self-Powered Signal Modulation Approach

by
Alberto Redondo-Plaza
1,*,
Amy Zulema Velasco-Bonilla
1,
José Ignacio Morales-Aragones
2,
Ángel L. Zorita-Lamadrid
3,
Víctor Alonso-Gómez
4 and
Luis Hernández-Callejo
1,*
1
Departamento de Ingeniería Agrícola y Forestal, Universidad de Valladolid, 42004 Soria, Spain
2
Instituto de Nanociencia y Materiales de Aragón (INMA), CSIC-UNIZAR, 50018 Zaragoza, Spain
3
Departamento de Ingeniería Eléctrica, Universidad de Valladolid, 47002 Valladolid, Spain
4
Departamento de Física Aplicada, Universidad de Valladolid, 47002 Valladolid, Spain
*
Authors to whom correspondence should be addressed.
Appl. Sci. 2025, 15(9), 4606; https://doi.org/10.3390/app15094606
Submission received: 18 March 2025 / Revised: 19 April 2025 / Accepted: 20 April 2025 / Published: 22 April 2025
(This article belongs to the Topic Sustainable Energy Systems)

Abstract

:
Electroluminescence imaging is increasingly used in photovoltaic power plant inspections due to its effectiveness in detecting various types of failures in solar cells. This article presents a novel technique that enables the modulation of an arbitrary electroluminescence signal in PV modules using an electronic device that controls the signal by modulating an arbitrary current waveform in a photovoltaic module, utilizing the string current as its energy source. As a result, measurements do not require a power supply and can be performed during the normal operation of a PV string. Throughout the paper, this method is compared to a more conventional approach that relies solely on a power supply to generate the current signal. Capturing a sequence of images while modulating the current with different waveforms allows the application of the Fast Fourier Transform to suppress background signals caused by sunlight, resulting in high-quality EL images. Experimental results demonstrate that the proposed method delivers imaging quality comparable to that achieved with a power supply, while effectively detecting a broad range of solar cell failures. Furthermore, the calculated signal-to-noise ratio for both approaches yields similar values, indicating comparable quality in quantitative terms. Finally, square wave modulation has shown slightly better performance than other waveforms, such as sinusoidal and half-sinusoidal modulation.

1. Introduction

According to the International Energy Agency (IEA), photovoltaic (PV) power generation accounted for 5.4% of global electricity demand in 2023 [1]. Moreover, PV technology is expected to become the largest renewable energy source by 2029, surpassing wind and hydropower [1]. Proper operation and maintenance of PV power plants requires inspection techniques for PV modules [2,3,4,5], which are considered the most vulnerable components of any PV plant to faults, as they are exposed to various environmental stressors such as hail, moisture or ultraviolet (UV) radiation.
The implementation of inspection techniques enables the detection of faults and anomalies, improving PV power plant operation, reducing safety risks and maximizing energy output [2,3,6]. Inspection techniques can be categorized into electrical measurements and imaging techniques. Current–Voltage (I–V) curve analysis is the primary electrical measurement performed in PV power plants [3], providing quantitative data that can be compared to manufacturer specifications for fault detection and degradation analysis [3]. While I–V curve measurements require system disconnection and can be time-consuming, imaging techniques offer the potential to inspect multiple modules in a shorter time, making them a cost-effective tool for fault detection [3], particularly when unmanned aerial vehicles (UAVs) are used [3,7].
Common imaging techniques include thermography and luminescence inspections [3]. Thermography is widely used in utility-scale PV power plants, as thermal cameras can be easily integrated into UAVs, enabling fast and cost-effective inspections during normal operation of the power plant [8,9]. Luminescence imaging has also gained popularity in recent years, as it can detect a broader range of faults compared to infrared imaging due to its higher spatial resolution [10,11]. However, outdoor luminescence measurements are more challenging, which limits their applicability for field inspections.
Luminescence imaging is based on capturing the emission generated by solar cells when exposed to different energy sources. Luminescence emission can be induced either by electrical excitation, where a current is injected into the PV device, known as electroluminescence (EL), or by illuminating the PV device with an appropriate light source, referred to as photoluminescence (PL). Both EL and PL imaging can detect a wide range of failures and anomalies in solar cells, including delamination, potential-induced degradation, cracks, cell inhomogeneities, corrosion, diode faults and soldering issues, among others [10,12,13].
For silicon solar cells, the peak luminescence emission wavelength is 1150 nm [14]. In contrast, Cadmium Telluride (CdTe) solar cells exhibit a luminescence peak around 800 nm [15]. Regarding silicon technology, two types of sensors are suitable for luminescence applications: silicon and Indium Gallium Arsenide (InGaAs) sensors [10,16]. Silicon sensors are more affordable and offer high resolution, but their low sensitivity to luminescence emission requires long exposure times and a dark environment. Meanwhile, InGaAs sensors have a sensitivity that closely matches the luminescence emission of silicon solar cells, making them suitable for measurements under high irradiance conditions and short exposure times, although they are more expensive and have lower resolution.
Conventional luminescence measurements have traditionally been performed at night, using power supplies as excitation sources to achieve the EL effect by injecting current [10,12], typically around the module’s short-circuit current. The need for nighttime measurements, module disconnection and external power supplies limits the applicability of this technique.
In recent years, several approaches have been proposed to overcome the limitations of conventional luminescence imaging techniques. Related studies that have developed alternative methods for luminescence imaging in PV power plants are summarized in Table 1. When measurements are performed during daytime, extracting the EL or PL signal from the background becomes challenging, as sunlight emission intensity is significantly higher than luminescence signal intensity [12,13]. Therefore, InGaAs cameras are used for high-irradiance measurements to maximize the luminescence-to-background signal ratio. Additionally, the use of a suitable bandpass filter to block unwanted wavelengths improves this ratio and enhances measurement quality [17].
Daylight measurements typically involve modulating the PL or EL signal and acquiring a sequence of images in which luminescence emission alternates between high and low signal intensity states. The image sequence is digitally processed for filtering and background removal. Modulation is primarily achieved by adjusting the operating point of the PV device using different methods [12]. Between short-circuit (SC) and maximum power point (MPP) conditions, luminescence emission is nearly absent. Maximum PL emission occurs near open-circuit (OC) conditions, while EL emission is achieved when PV devices operate at voltages higher than OC voltage, inducing a reverse current and causing the module to behave as a load. Therefore, by appropriately adjusting the operating point of the PV devices under test, it is possible to modulate both EL and PL signals.
Table 1 also presents the main features of each technique, including their capability to perform measurements during night, day or both, as well as whether they are based on EL or PL imaging. It also highlights whether signal modulation, and therefore a sequence of images, is required or not. Additionally, the table shows the hardware required for each approach and whether measurements can be performed during the normal operation of the power plant without disconnections. Finally, the type of camera and optical filter used in each case is also included.
This article presents a significant improvement over a previously developed technique [34]. The novelty of the presented approach relies on the generation of an arbitrary current signal in a solar module by using the string current as an energy source for self-powered signal modulation and image acquisition. This method is based on an electronic board connected within the PV string, enabling EL measurement without disconnections and during the normal operation of the power plant. Additionally, an FFT approach is introduced to remove the background signal while the EL signal is modulated according to any periodic signal, which means another improvement in comparison with the previous work [34]. The self-powered approach is also compared with a conventional method based on a programmable power supply. The second section of the manuscript describes the equipment used, the tested PV configuration, and the electronic board topology, as well as the FFT-based processing. The third section presents the results obtained for both the conventional and self-powered approaches, while the final section includes a detailed discussion and conclusions regarding the proposed method.

2. Materials and Methods

The current experiment is divided into two main steps: the imaging acquisition technique, where both a self-powered approach and a conventional approach based on a power supply have been tested, and a processing method using the FFT, which has been employed for processing the sequence of images obtained using both approaches.

2.1. Imaging Acquistion Set-Up

The conventional setup for acquiring EL images under daylight conditions consists of a programmable power supply (EA ELEKTRO-AUTOMATIK EA-PSB 10200-25 2U 1500W) directly connected to the PV module under analysis. In this study, a 235 Wp polycrystalline PV module (Trina Solar TSM-235-PC05A) was examined. This conventional approach requires disconnecting the PV module from the string and using either a generator or a grid connection to power the supply.
The self-powered method relies on an electronic board that can be integrated into each PV module within a string. The board topology, shown in Figure 1, is based on a half-controlled H-bridge and an LC (L-inductor C-capacitor) low-pass filter. The half-controlled H-bridge enables bidirectional current flow through the tested PV module. When MOSFETs M1 and M2 are turned on, current flows through the module in the normal direction, allowing it to operate as a generator. Conversely, when M1 and M2 are off, current flows in the opposite direction, causing the module to behave as a load, thereby inducing EL effect. Finally, if only one of the MOSFETs (M1 or M2) is turned on, the module is bypassed, and no current flows through it.
By controlling the MOSFETs (Metal-Oxide-Semiconductor Field-Effect Transistor) with pulse-width modulation (PWM) signals and incorporating an LC low-pass filter with a cutoff frequency lower than the PWM frequency, an arbitrary current signal can be modulated within the tested PV module. The present implementation involves a 5 kHz PWM signal and a LC low-pass filter with 0.8 kHz cutoff frequency. Since EL signal emission is directly proportional to the current injection, signal modulation is inherently achieved.
In the self-powered approach, the tested PV module (Trina Solar TSM-235-PC05A) is integrated into a string of 10 modules optimized by a PV string inverter. Modulation is performed while the inverter remains in operation, enabling real-time measurements without requiring module disconnection. The acquisition system for the self-powered approach is shown in Figure 2, where a laptop is used as the control system to automate the acquisition of the image sequence and to control the electronic board for proper signal modulation. Additionally, the board must be connected to both the tested PV module and the remaining modules in the string.
The acquisition system consists of a tripod and an InGaAs camera (Hamamatsu C12741-03) with a resolution of 640 × 512 pixels, a maximum frame rate of 60 frames per second (fps) and a 14-bit depth. The camera lens is equipped with an optical bandpass filter that blocks wavelengths outside the 1100 nm–1250 nm range. The camera exhibits high sensitivity at the EL emission wavelength (1150 nm for silicon solar cells), which, combined with the optical filter, enhances the signal-to-background ratio. This is particularly critical when measurements are performed under high irradiance conditions.
While the current and signal are modulated either by the power supply or the electronic board, the camera captures a sequence of consecutive images at its maximum frame rate, with a fixed exposure time of 2 ms for all measurements. The camera’s shutter has been adjusted to ensure an appropriate histogram, with the average pixel intensity cantered around the mid-range. All images were acquired under high irradiance conditions (1030–1150 W/m2) around midday, with stable irradiance and clear-sky throughout the acquisition period. It has been done to achieve similar irradiance conditions during all the measurements.
In both approaches, the modulated signal has a frequency of 4 Hz. This frequency was selected to acquire enough images per cycle to observe signal variations. At 4 Hz and a maximum frame rate of 60 fps, 15 images are captured per cycle, which is adequate to represent the periodic variation of the signal. Three different waveforms were modulated in both approaches: square wave, sine wave and half-sine wave, to assess potential differences between them. All the measurement parameters, PV characteristics and weather conditions are summarized in Table 2.

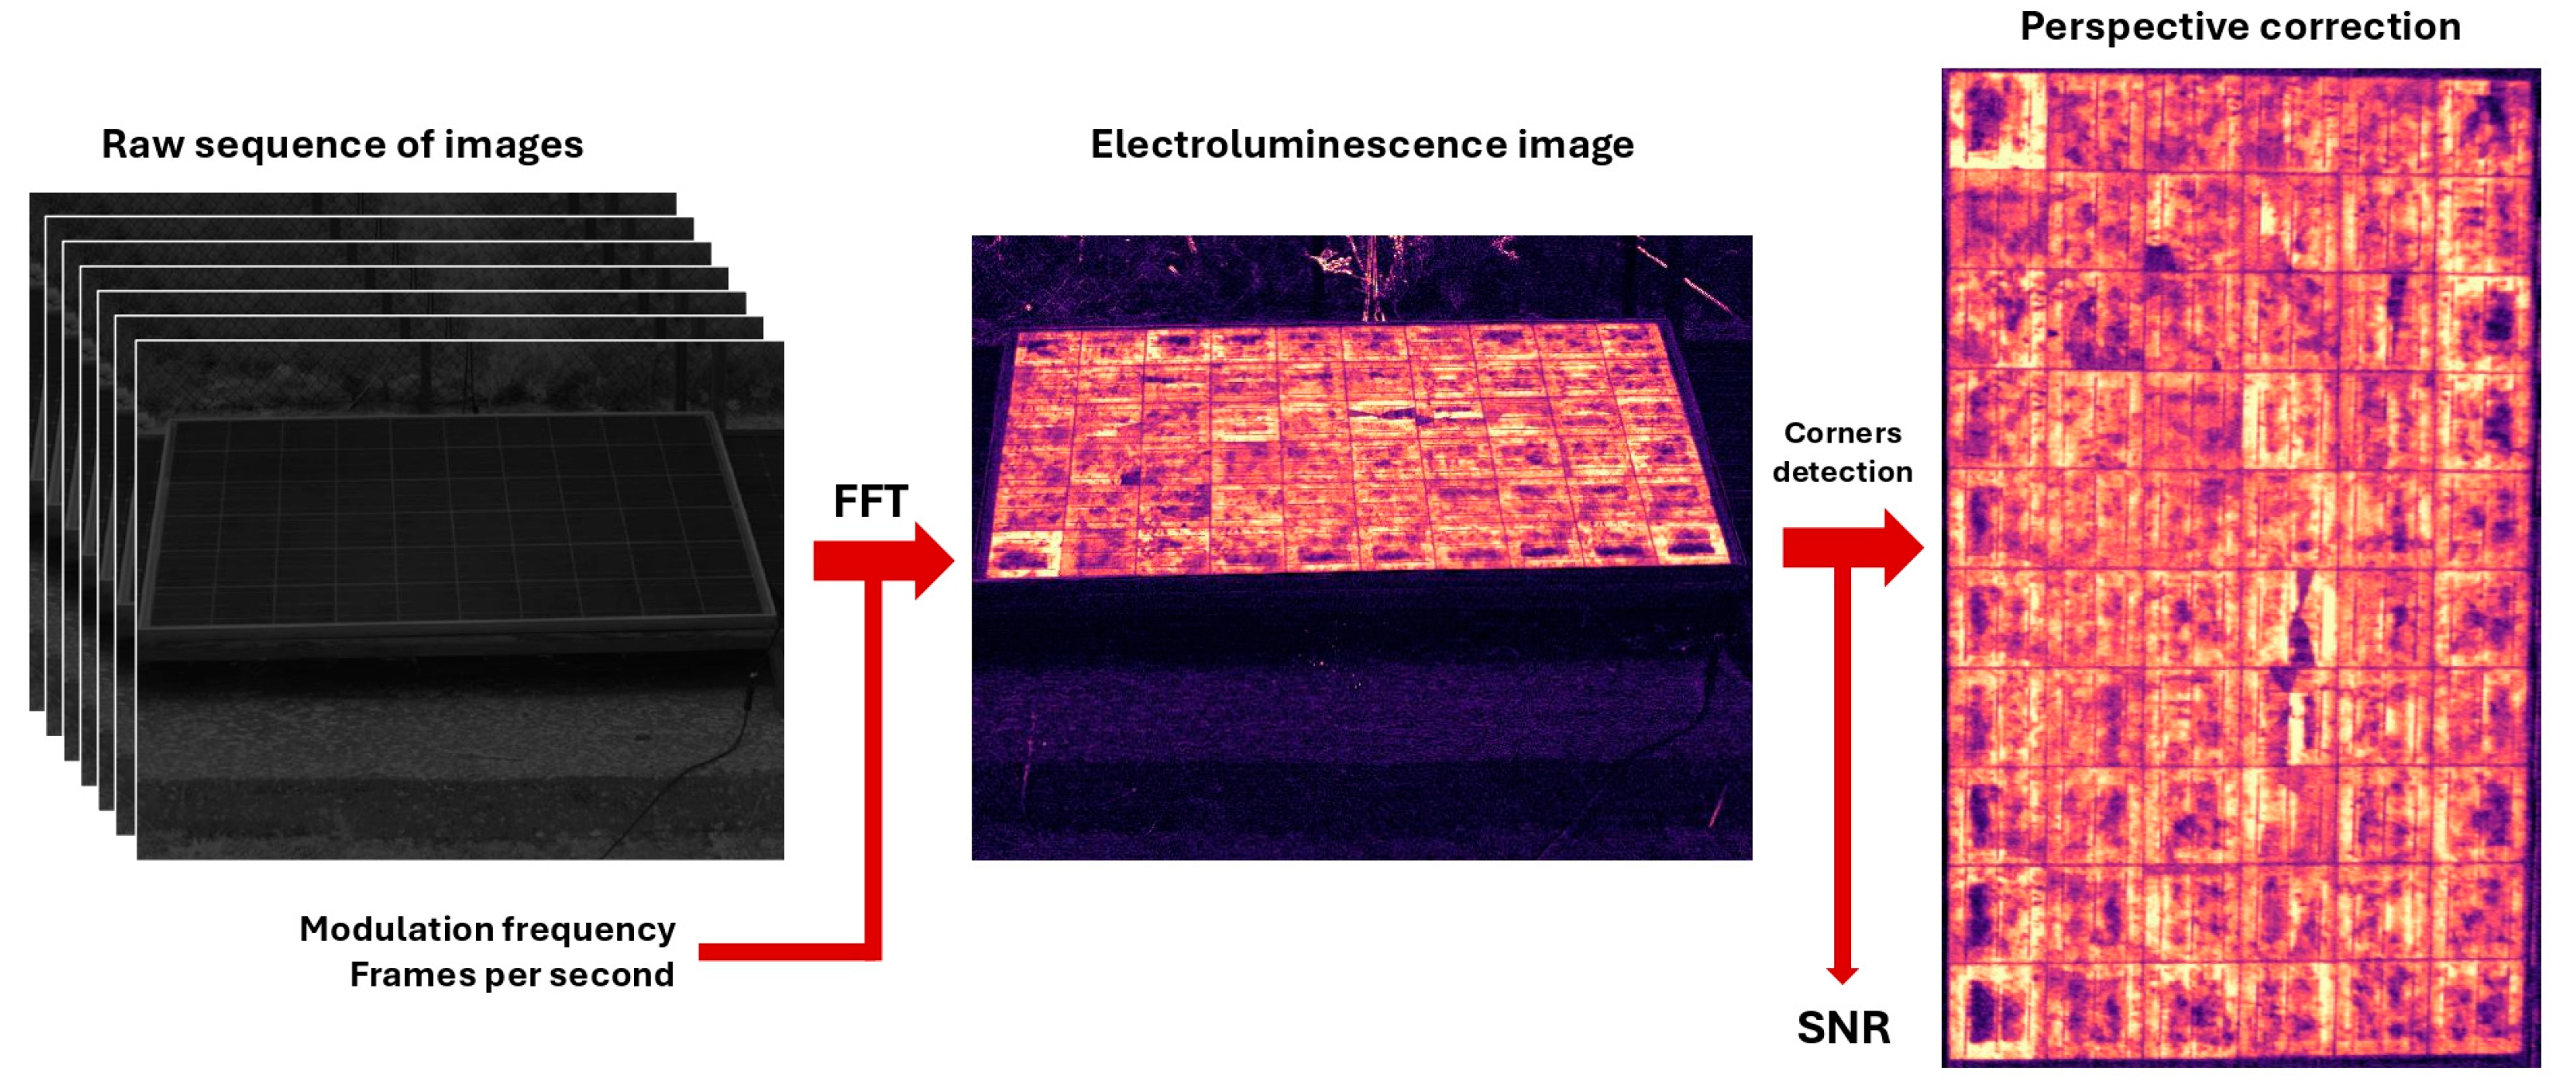
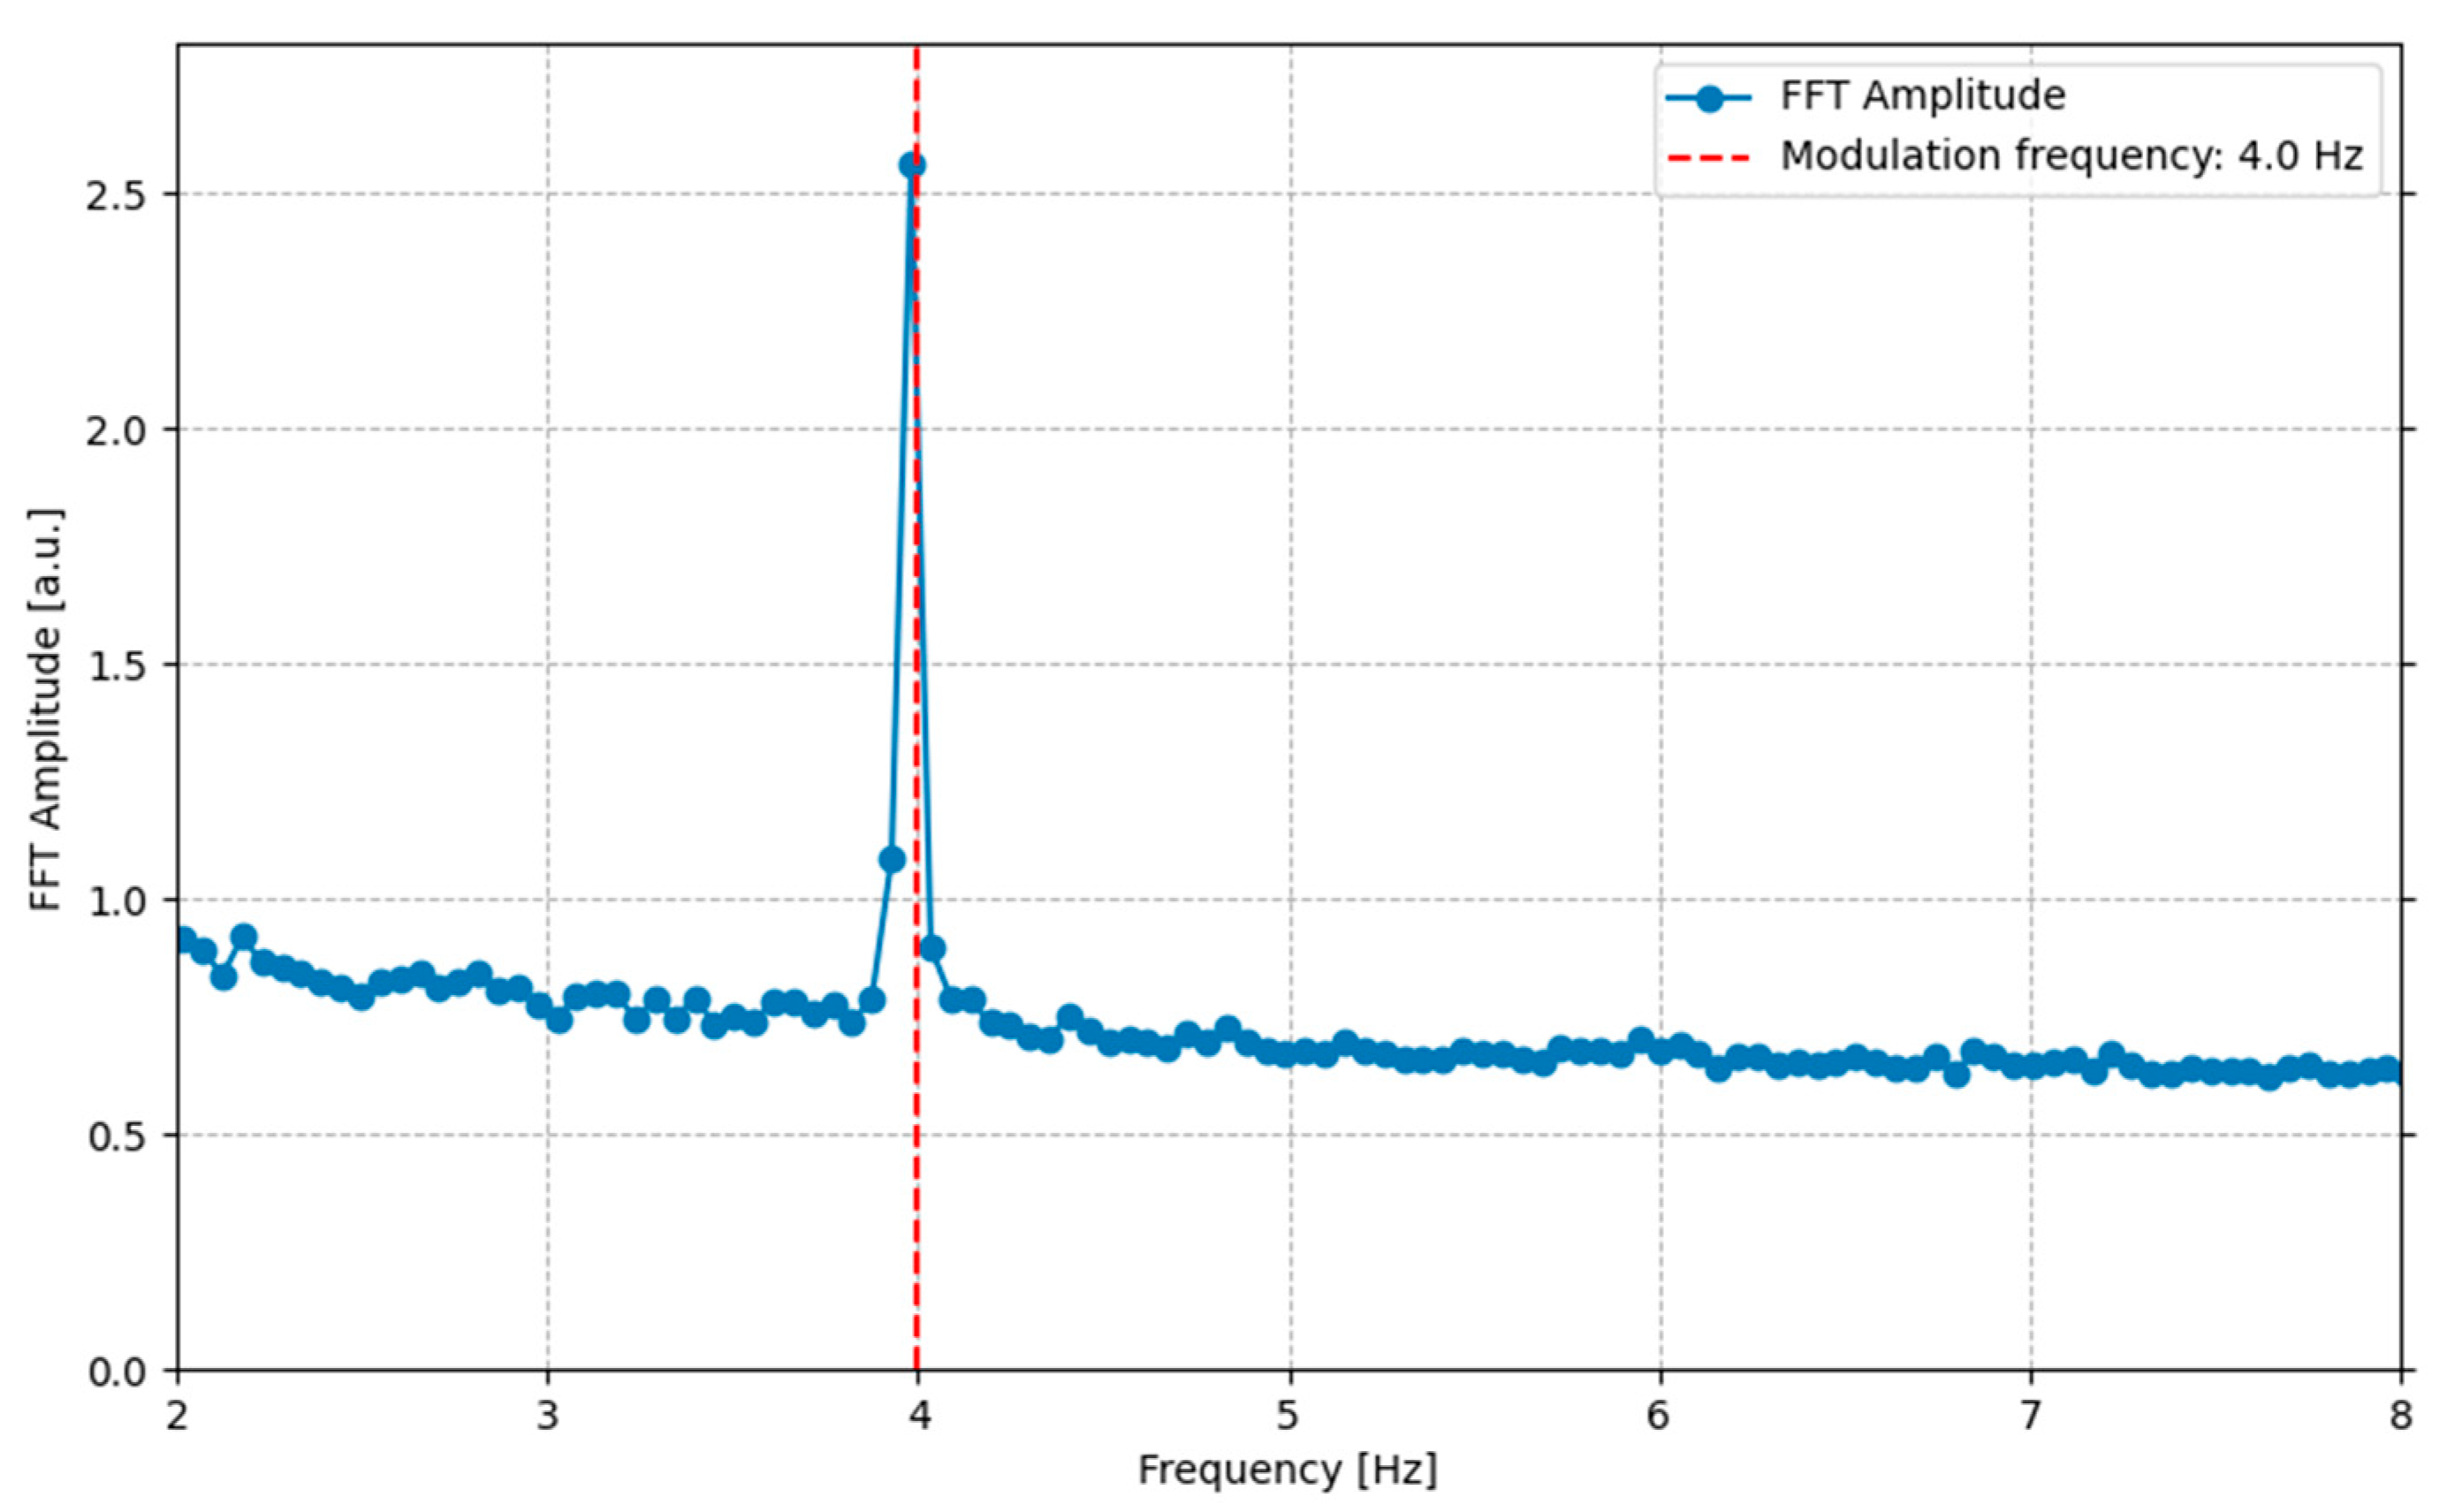
2.2. FFT Imaging Processing

Once the image sequence has been automatically acquired, a Python (version 3.13.3) script is used to process the pictures. Common processing approaches are based on square wave signal modulation, where each image is classified as either a high or low emission state [12]. High and low signal images are averaged separately and then subtracted to extract the luminescence signal. The implementation of fast FFT for processing not only allows the extraction of the luminescence signal waveform used during modulation but also eliminates the need to classify the images within the sequence.
The FFT is applied to each pixel individually, analyzing the evolution of its intensity throughout the sequence. The pixel intensities in the final EL image correspond to the amplitude of the FFT at the index associated with the modulation frequency (4 Hz), where a peak is expected. Therefore, background signals generated by sunlight can be removed.
The python script is also able to automatically adjust the brightness of the final EL picture and apply a perspective correction and crop by identified solar module corners.
In order to quantitatively evaluate the quality of the final EL image, the signal-to-noise ratio (SNR) can be calculated using the FFT [35]. The SNR of each pixel is determined using the following Equation (1):
S N R = 10 l o g 10 P e a k   a m p l i t u d e 2 V a r N o i s e
where the peak amplitude is defined as the difference between the amplitude at the modulation frequency (f) and the average amplitude within the frequency range [f/2, 2f], excluding the modulation frequency itself (f). The noise is estimated as the variance of the amplitude within the same frequency range [f/2, 2f], also excluding the modulation frequency (f). To calculate the SNR of the entire image, the pixel SNR values corresponding to the PV module area are averaged, ensuring that the signal evolution in non-relevant pixels is not considered. In this SNR approach, a value higher than 10 dB can be considered indicative of a sufficiently high-quality image. The flow diagram of the processing approach implemented can be seen in Figure 3.

3. Results

Experimental results have shown that both approaches are able to provide high-quality EL images that can be used for fault detection with similar quality.

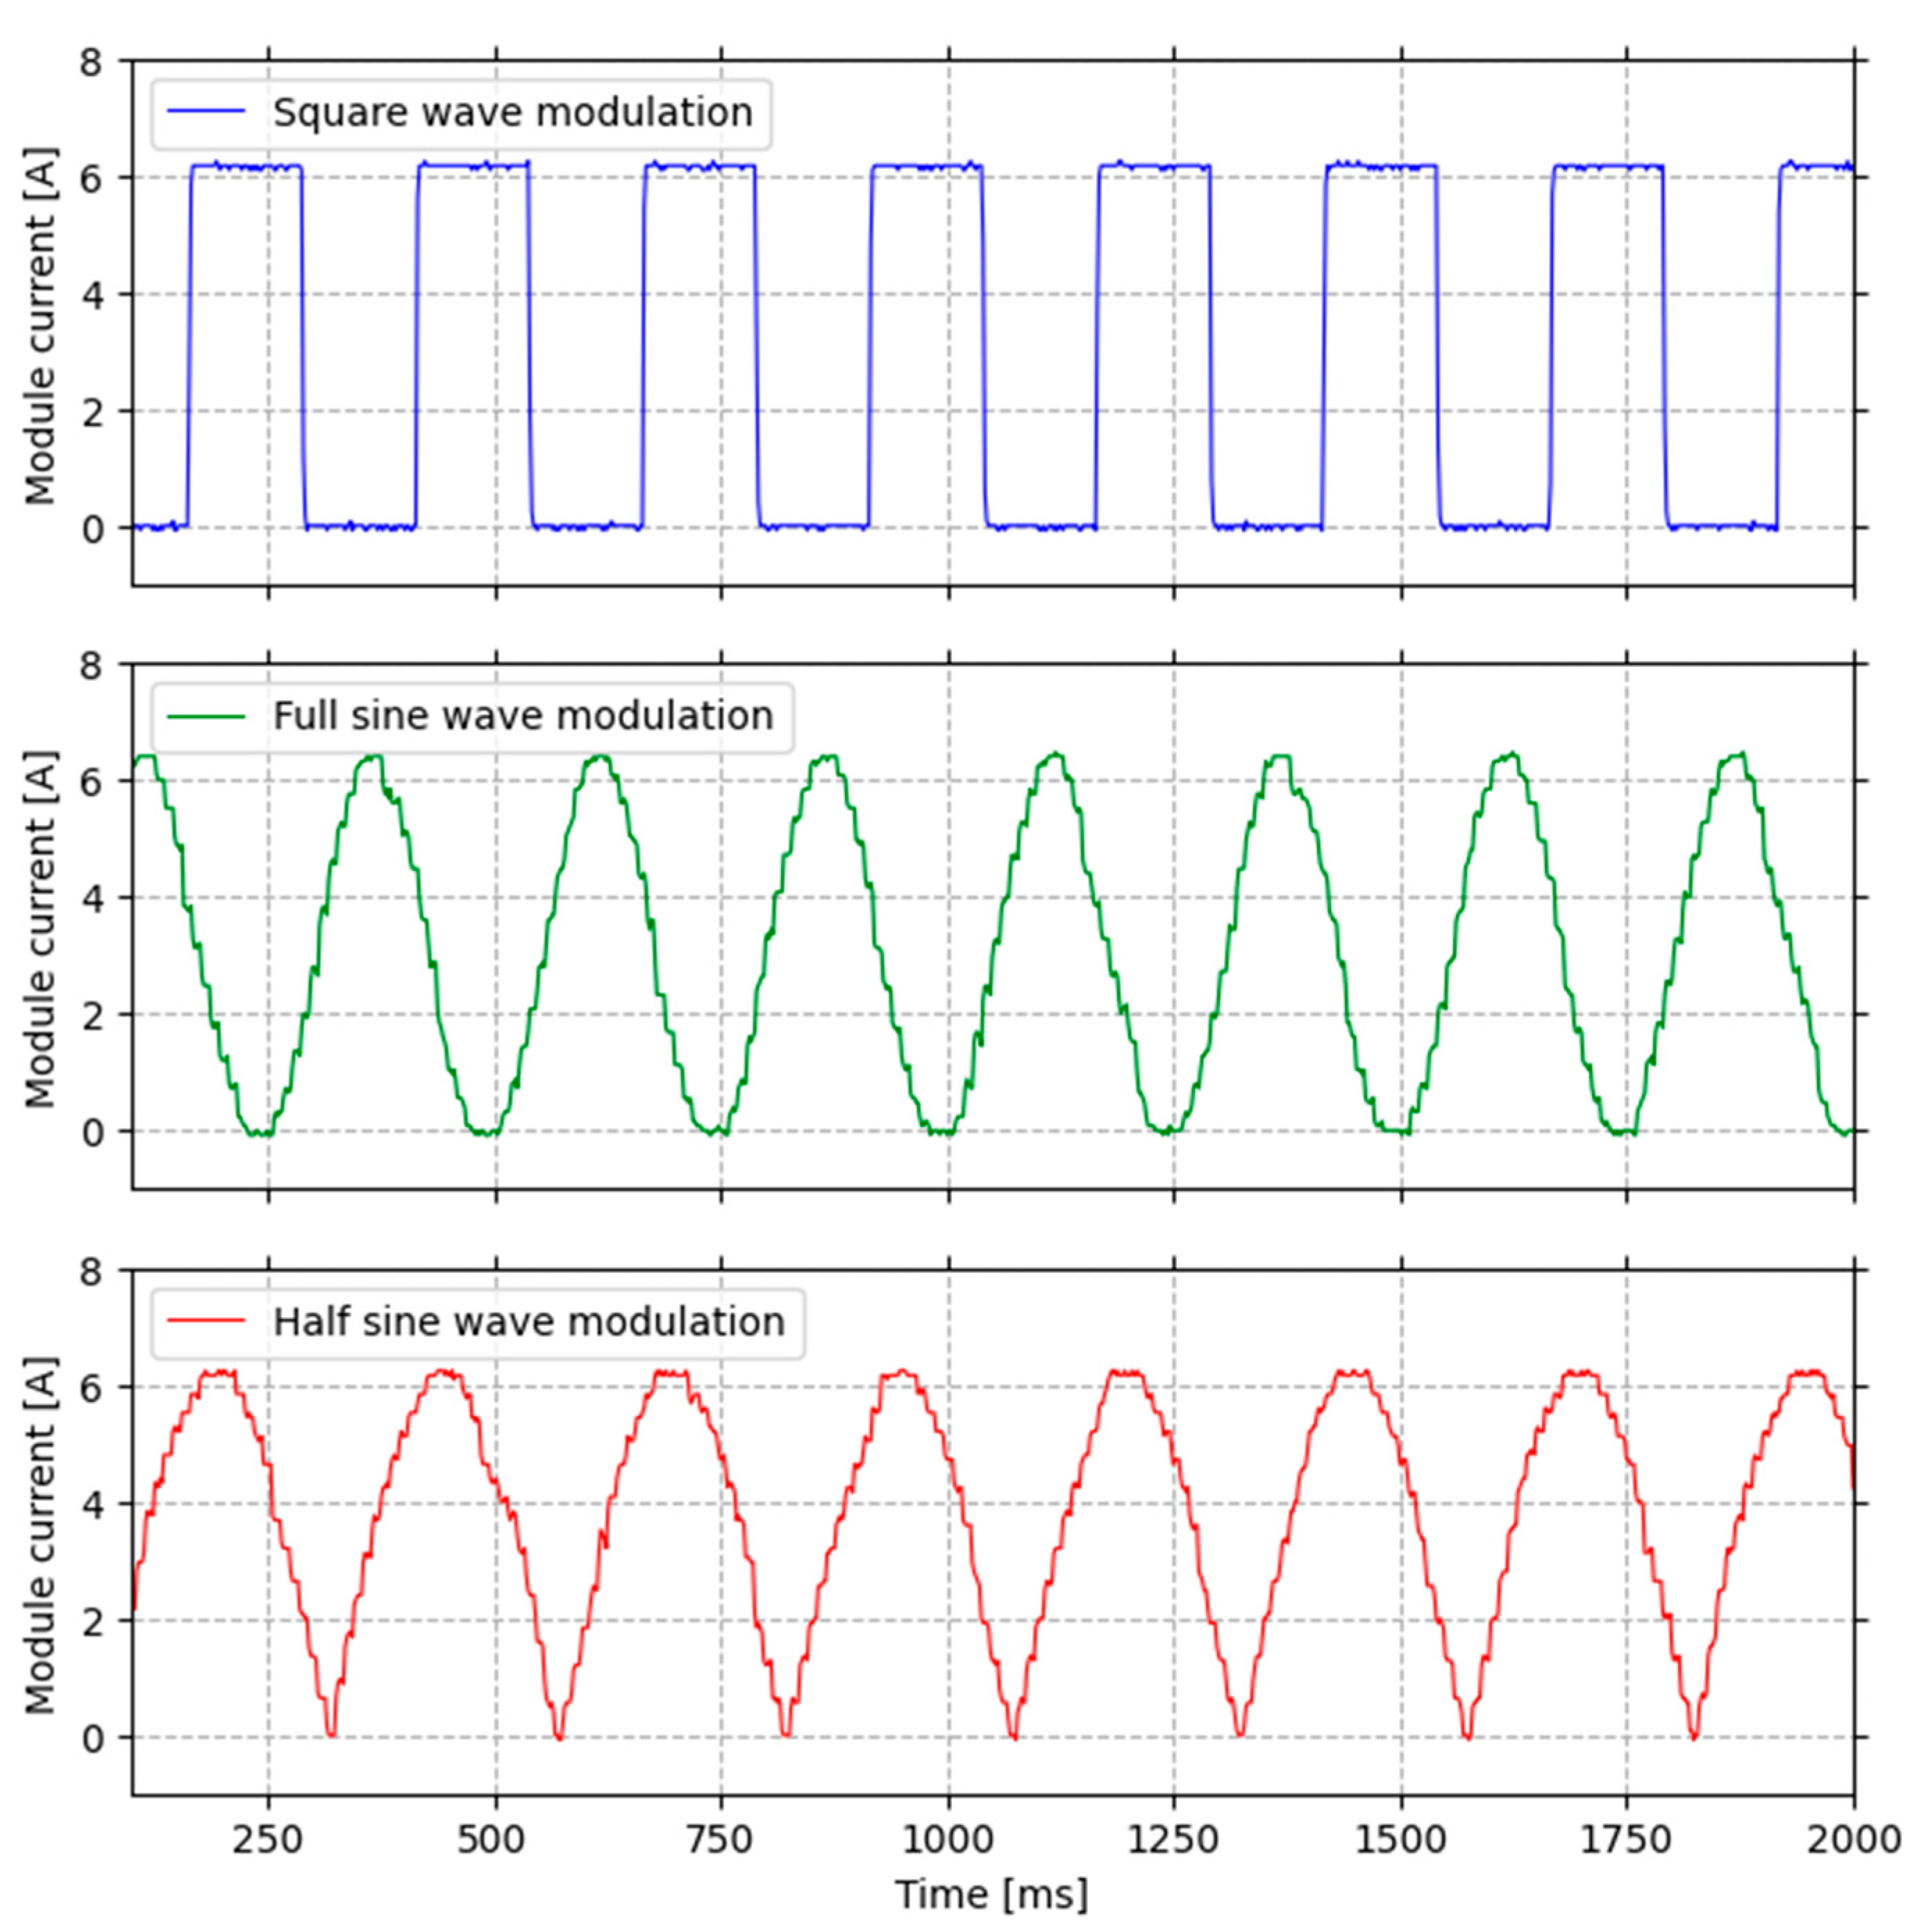
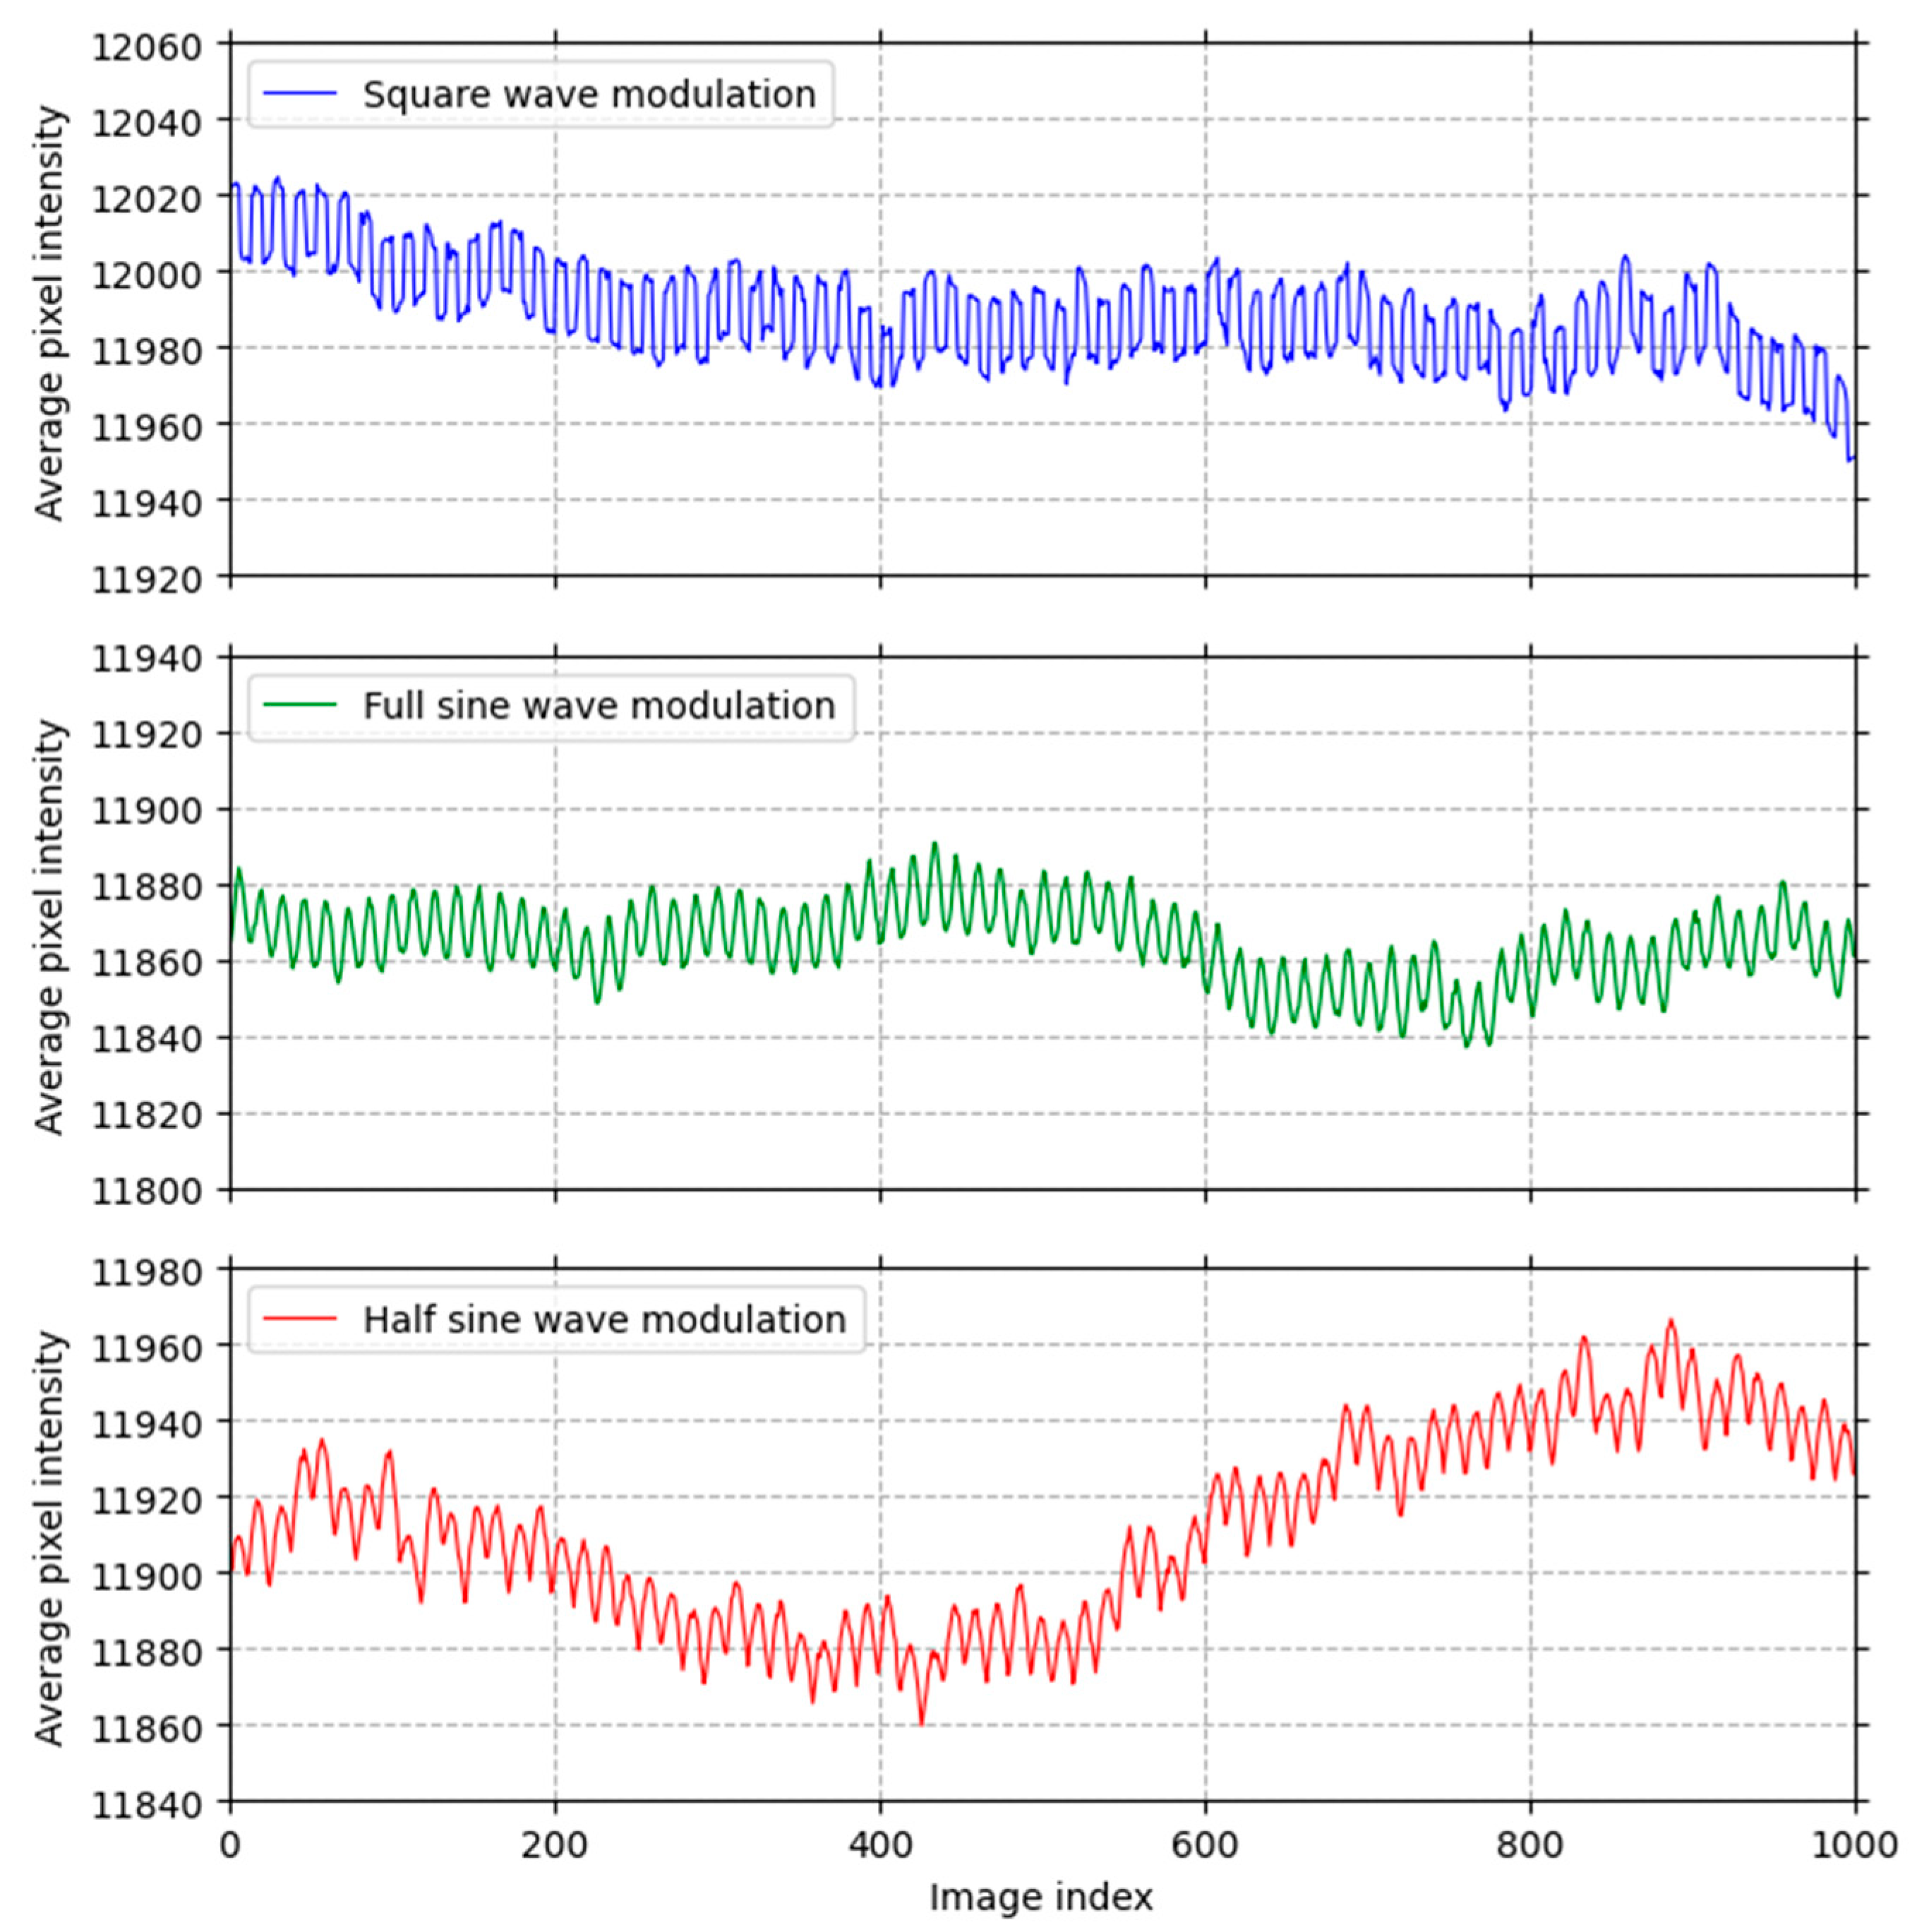
3.1. Current and Signal Modulation

Experimental results have demonstrated that the electronic board is capable of modulating current injection in the tested configuration, thereby affecting the EL signal itself. Figure 4 shows three oscilloscope measurements monitoring the current in the tested PV module using the electronic board for self-powered modulation. Some noise is observed, particularly in the half- and full-sine modulations. This noise could be reduced by using a higher PWM frequency, employing a low-pass filter with a lower cutoff frequency, or increasing the execution speed of the code, which allows changing the duty cycle of the MOSFETs a higher number of times per second. However, the noise will be partially or entirely filtered by the camera, as it integrates the signal during the exposure time of each capture.
Once the image sequence has been acquired, the evolution of the average pixel intensity throughout the sequence can be analyzed. Figure 5 illustrates this evolution during the measurement process with different modulation types. In all cases, it can be observed that the EL signal to be extracted corresponds to an average value of around 20 digital counts, compared to the background signal generated by the sun, which ranges from 10,000 to 12,000 digital counts. This means that the EL signal accounts for only 0.15–0.2% of the total signal, which may complicate its extraction, as even minor noise can significantly affect results. It is important to note that a higher ratio of background to EL signal may be observed when testing other modules, as monocrystalline solar cells, particularly those with PERC and TOPCon technologies, exhibit higher luminescence intensities.
Moreover, Figure 5 shows how the background signal also varies during the evolution of the measurement, which can be explained by minor changes in irradiance. These changes may affect the quality of the measurement, as rapid fluctuations in irradiance would lead to larger changes in pixel intensity than those generated by the signal modulation, making sunlight background extraction impossible.
The FFT allows transforming the signal evolution from the time domain to the frequency domain. Therefore, a signal peak corresponding to the modulation frequency (4 Hz) is expected to be found. By performing the FFT on the average pixel intensity of all the images in the sequence and plotting the FFT amplitude (see Figure 6), it is possible to detect this signal peak as well as signal transmission at different wavelengths, which correspond to noise.

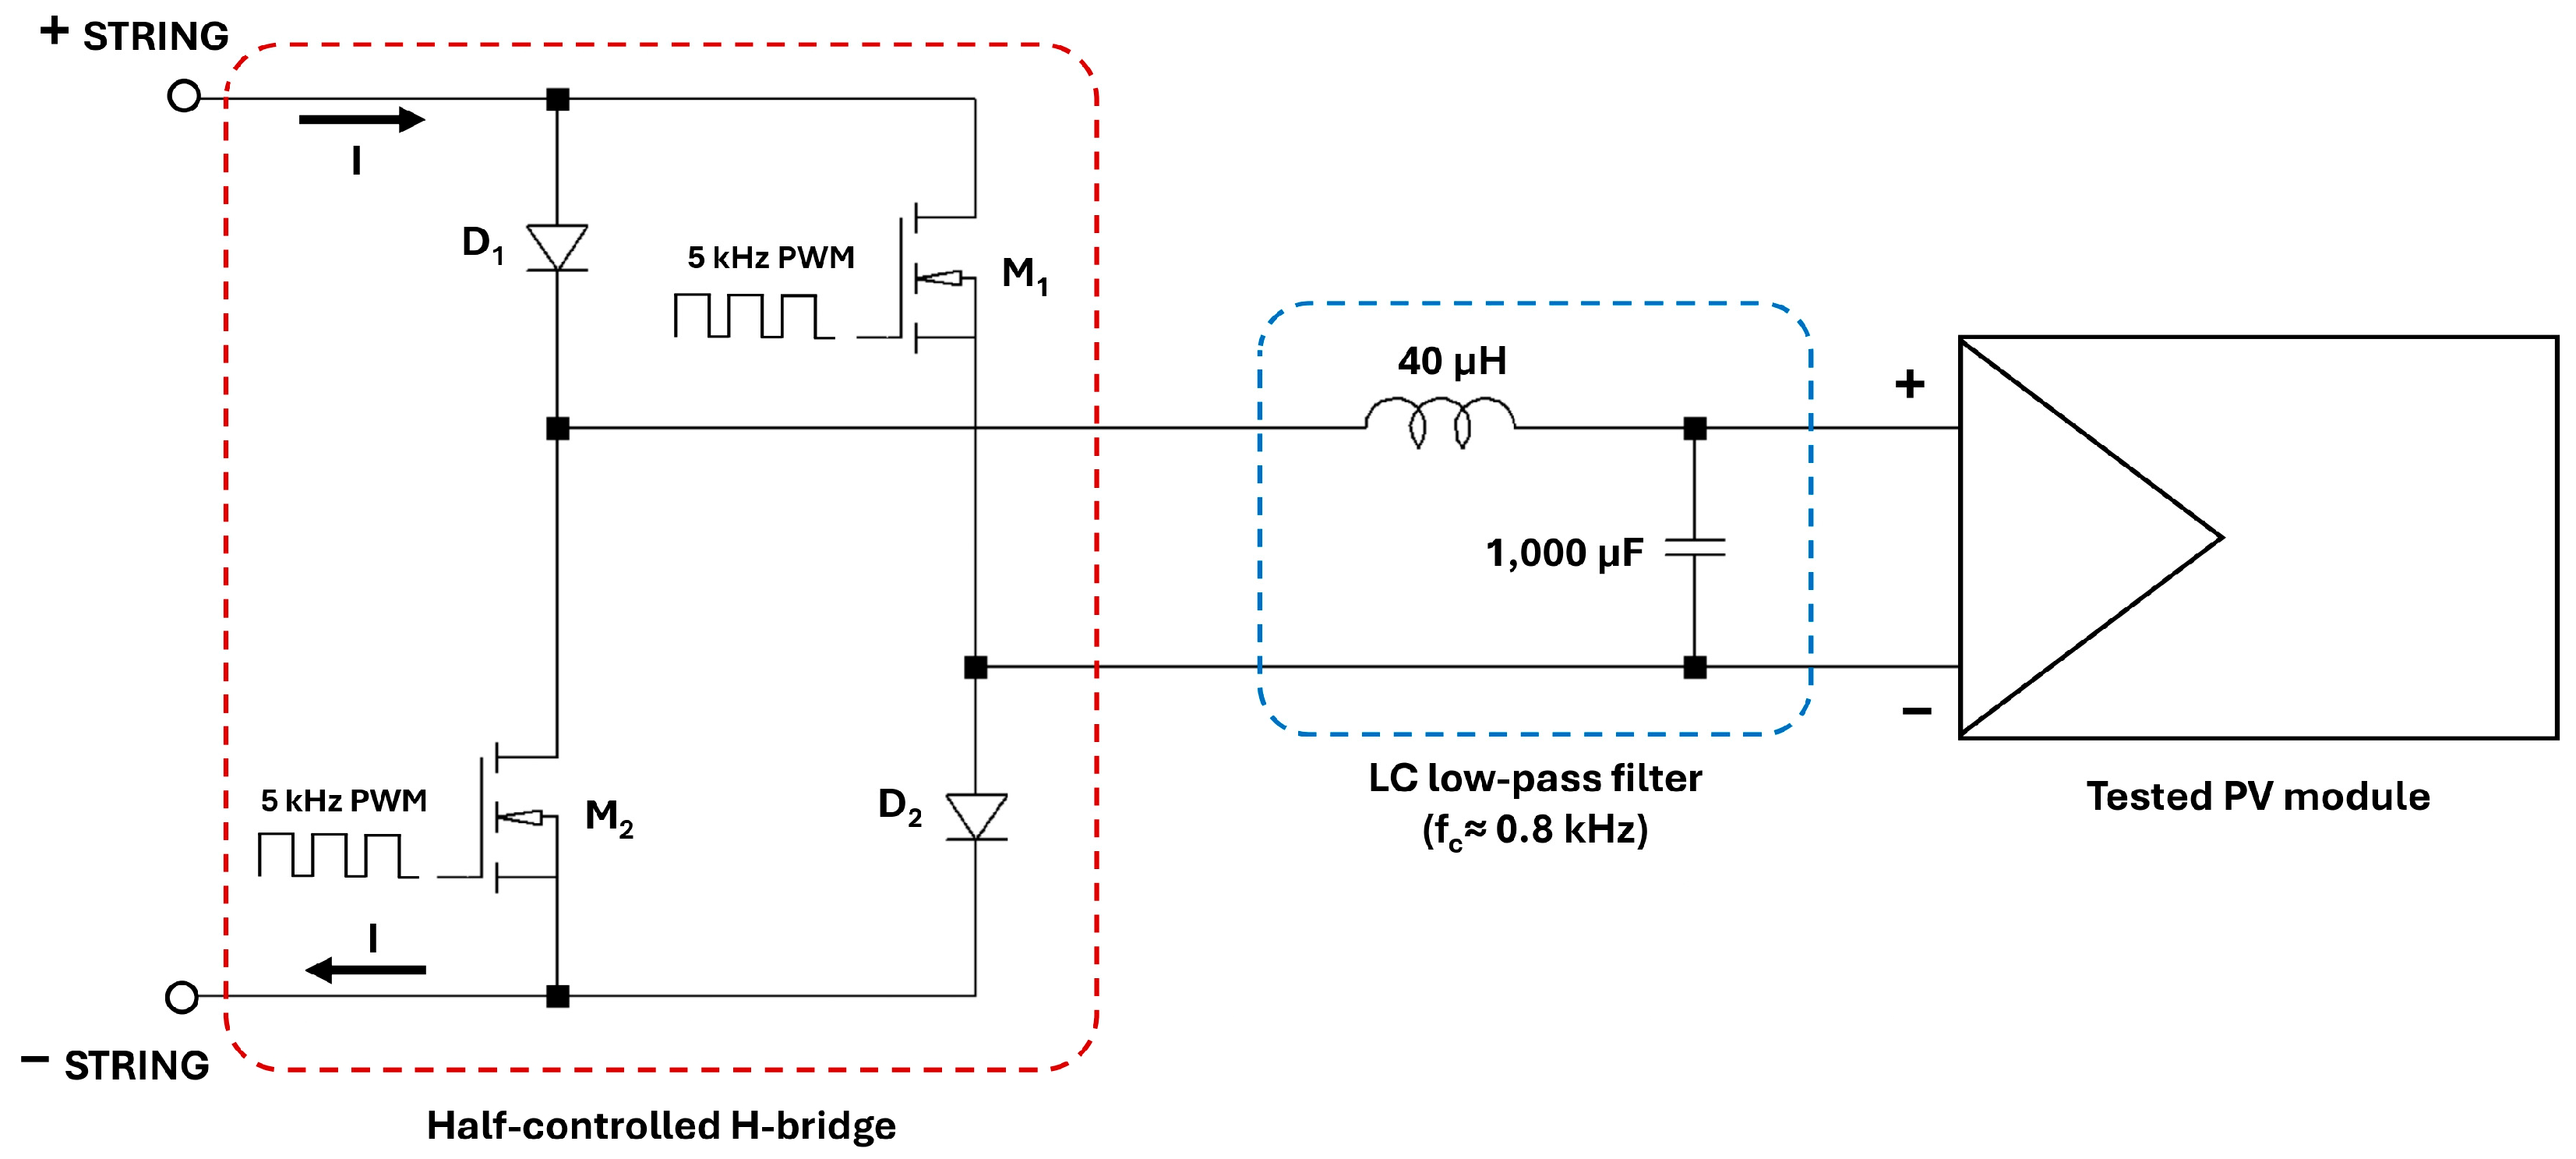
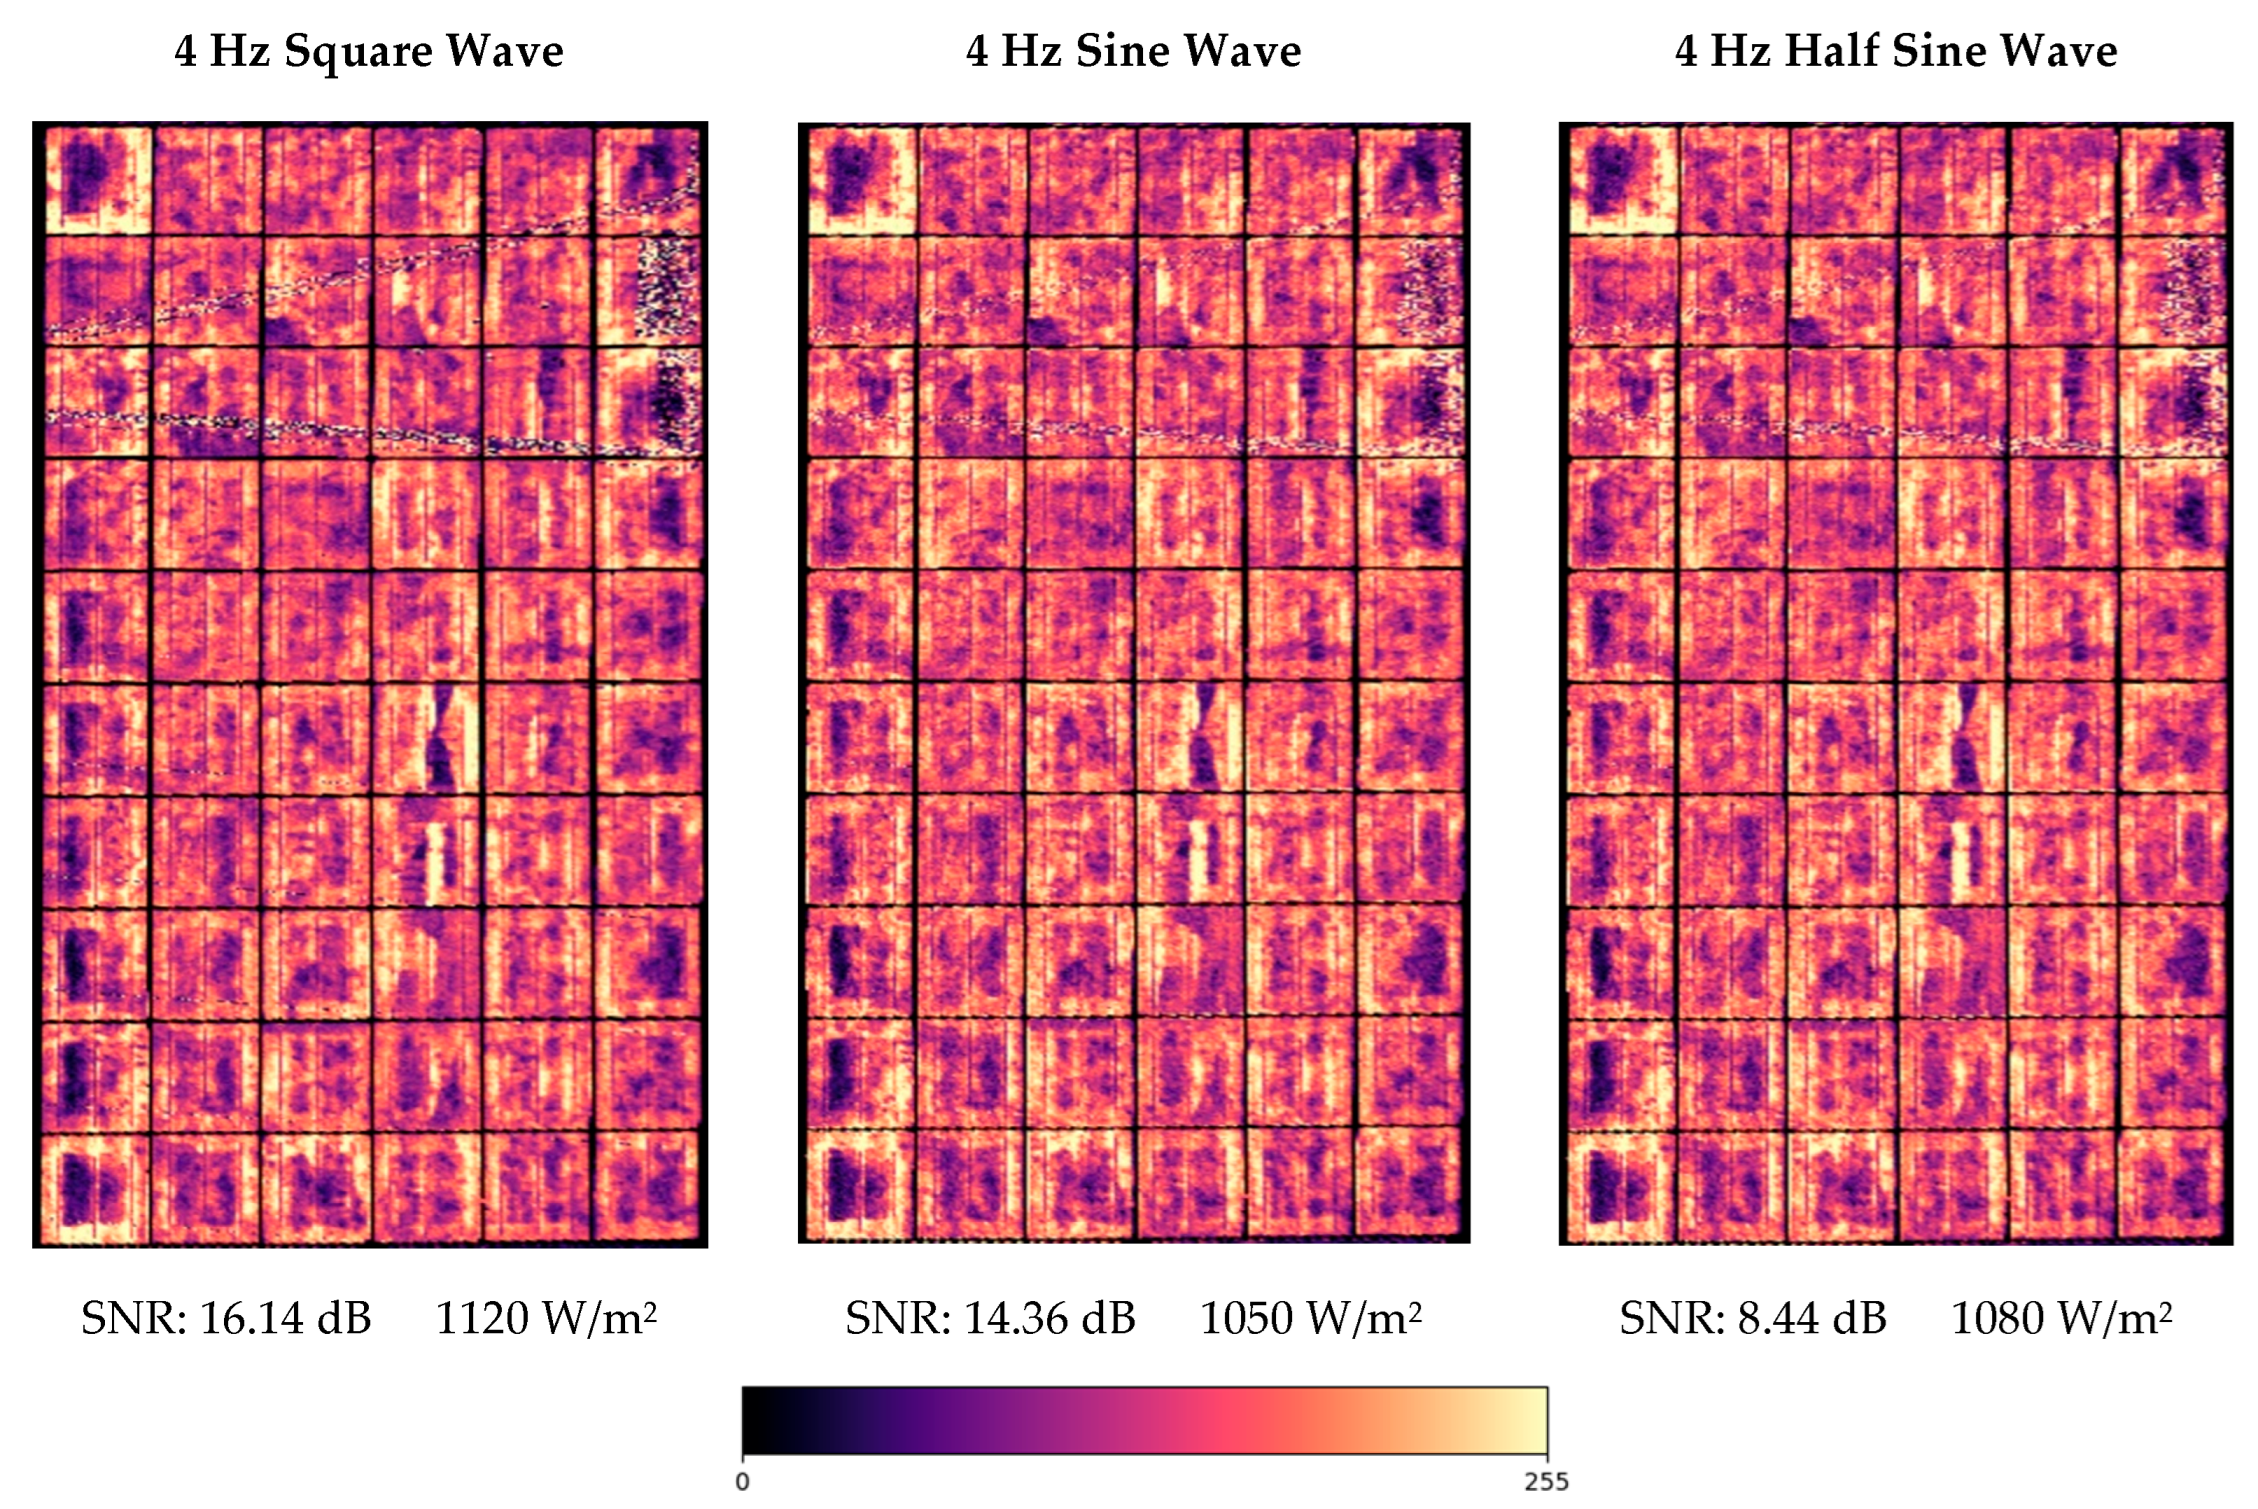
3.2. Conventional Power Supply Aproach

The conventional power supply approach has provided EL pictures with enough quality to be used as tool for monitoring and detecting failures in PV modules as Figure 7 shows. Identification of patterns in these EL images enables fault detection. Regions with low signal intensity (dark areas) can be associated with regions within the solar cell that do not contribute to power generation. Conversely, solar cells with high and homogeneous signal intensity indicate a good state of health and performance. All wave modulation, including square, full sine and half sine, has allowed a successful El signal extraction by using the FFT. Even when irradiance is higher than 1000 W/m2 and therefore the ratio between EL signal and background signal in minimized, the processing approach is able to extract the EL signal, providing good enough SNR (>10 dB). Note that square modulation led to slight better results in terms of SNR, although all pictures have similar qualitative quality, it being difficult to detect major differences between them.

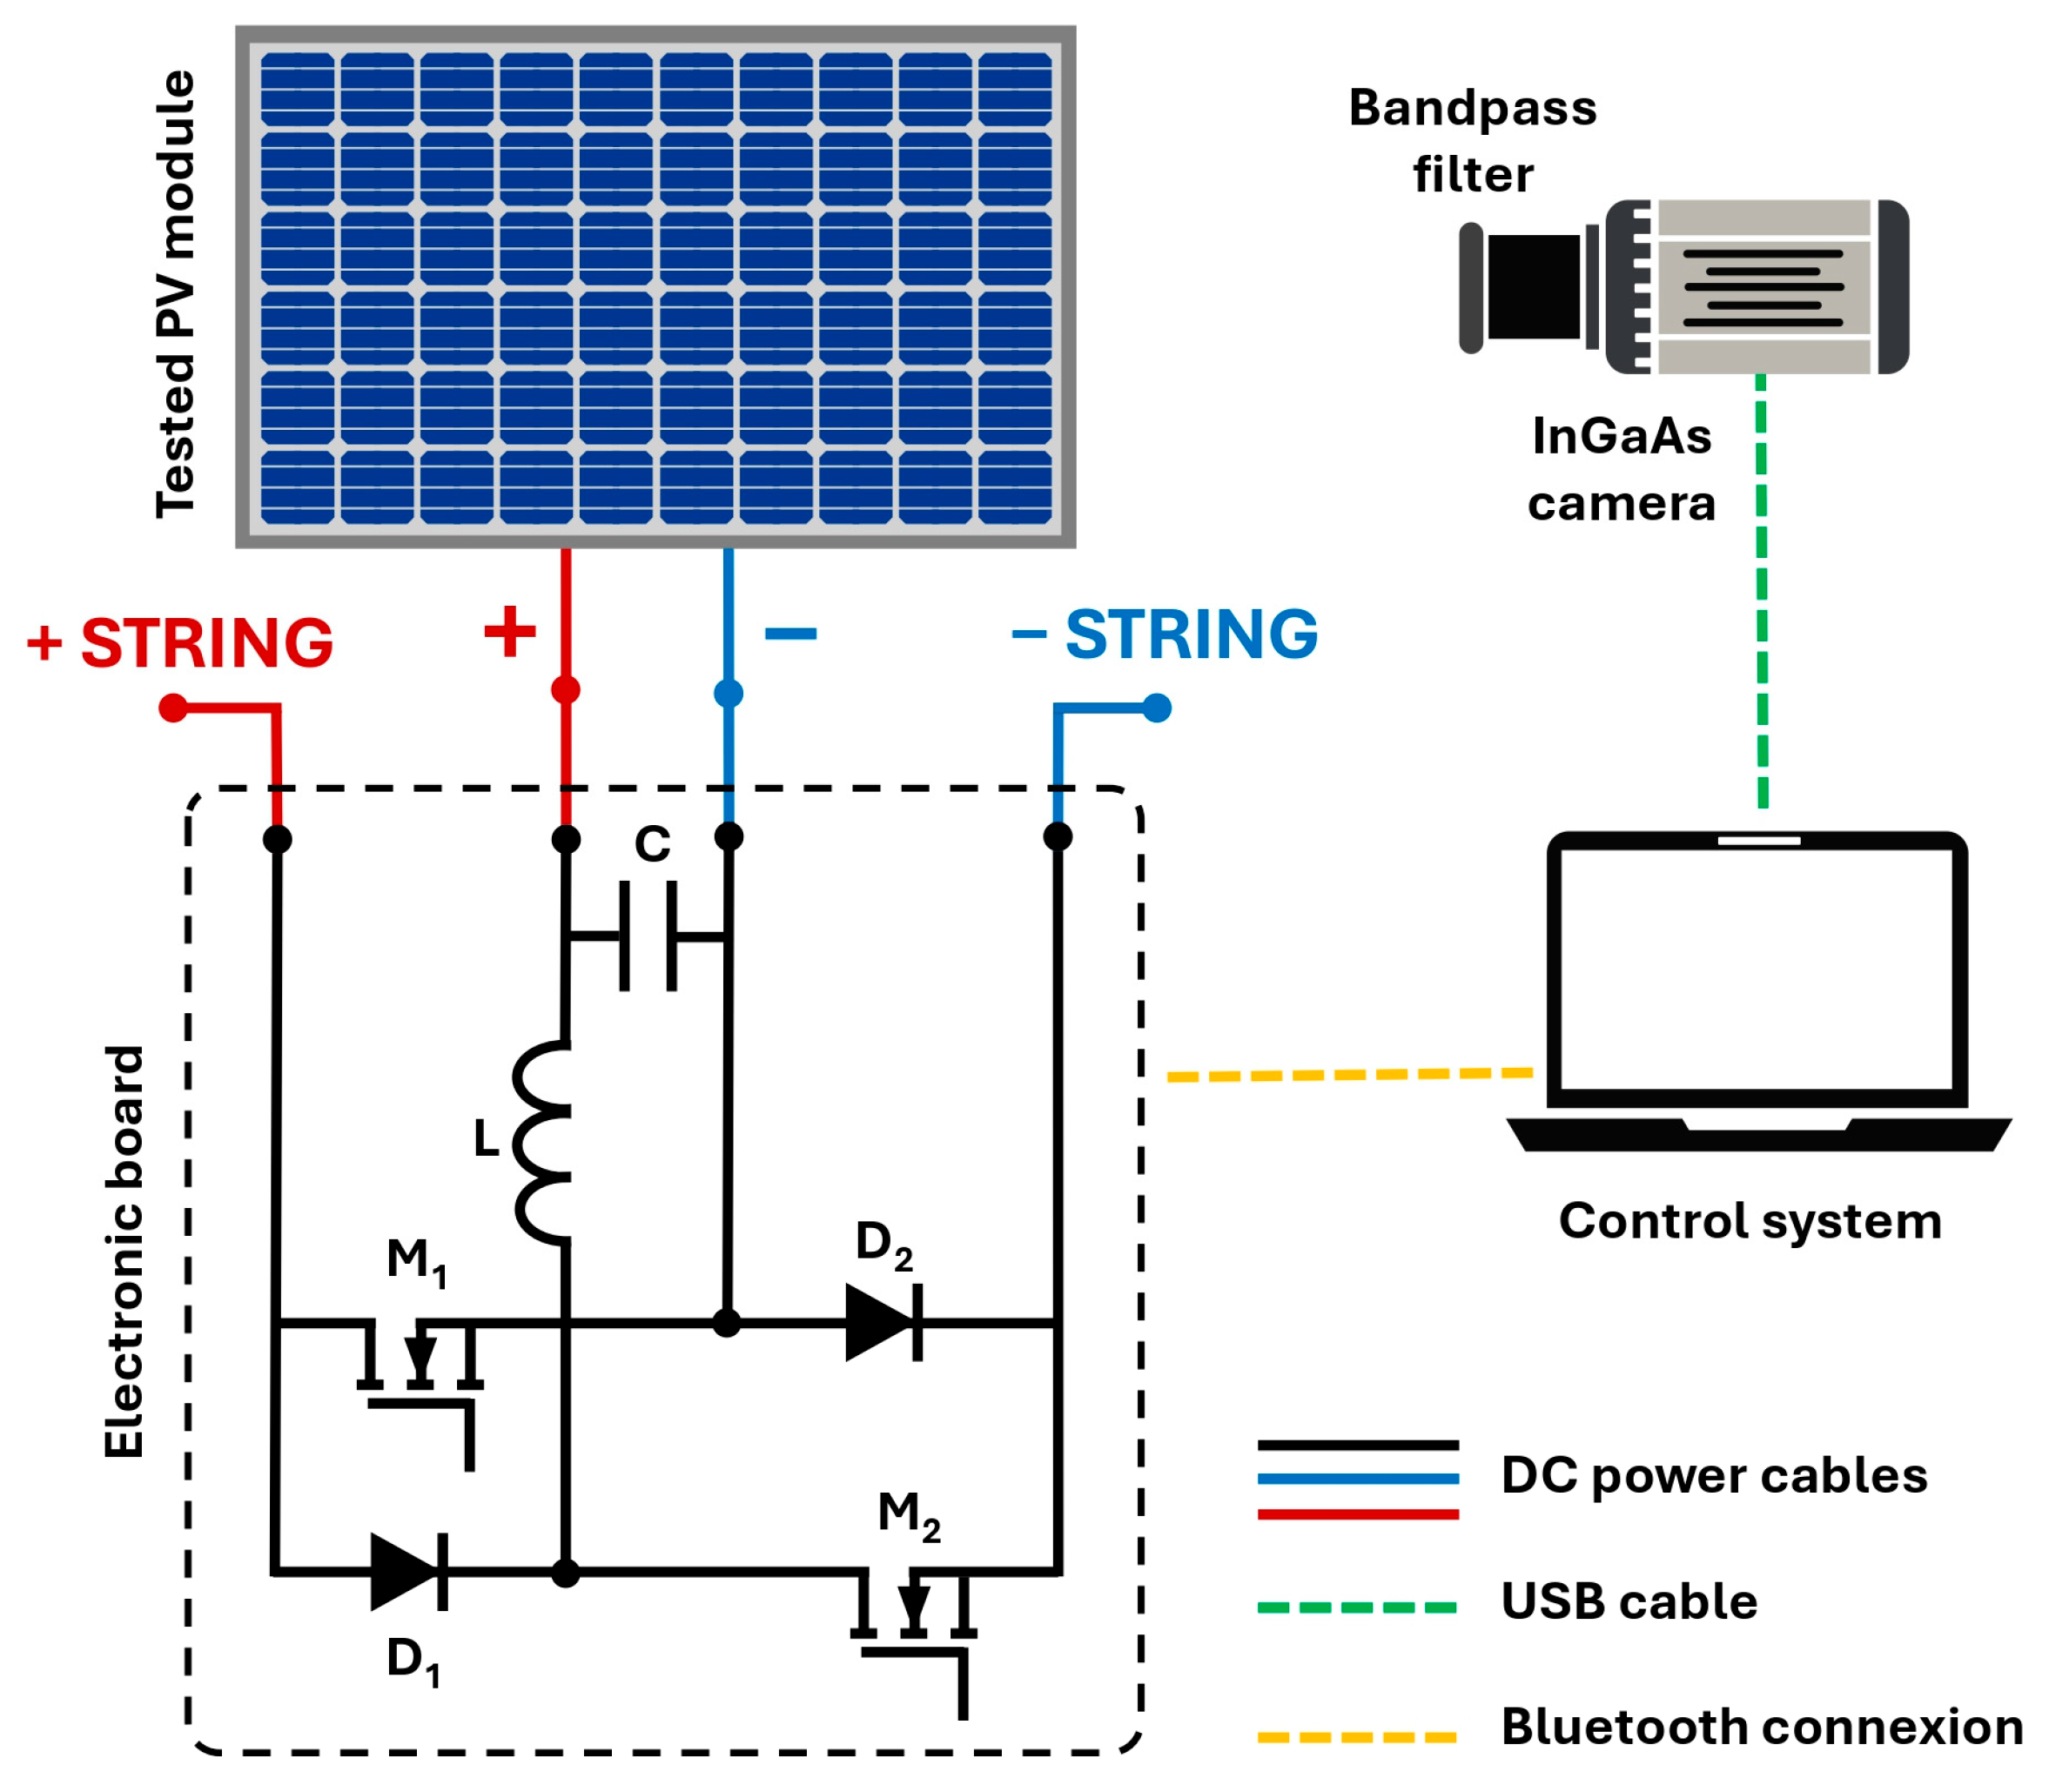
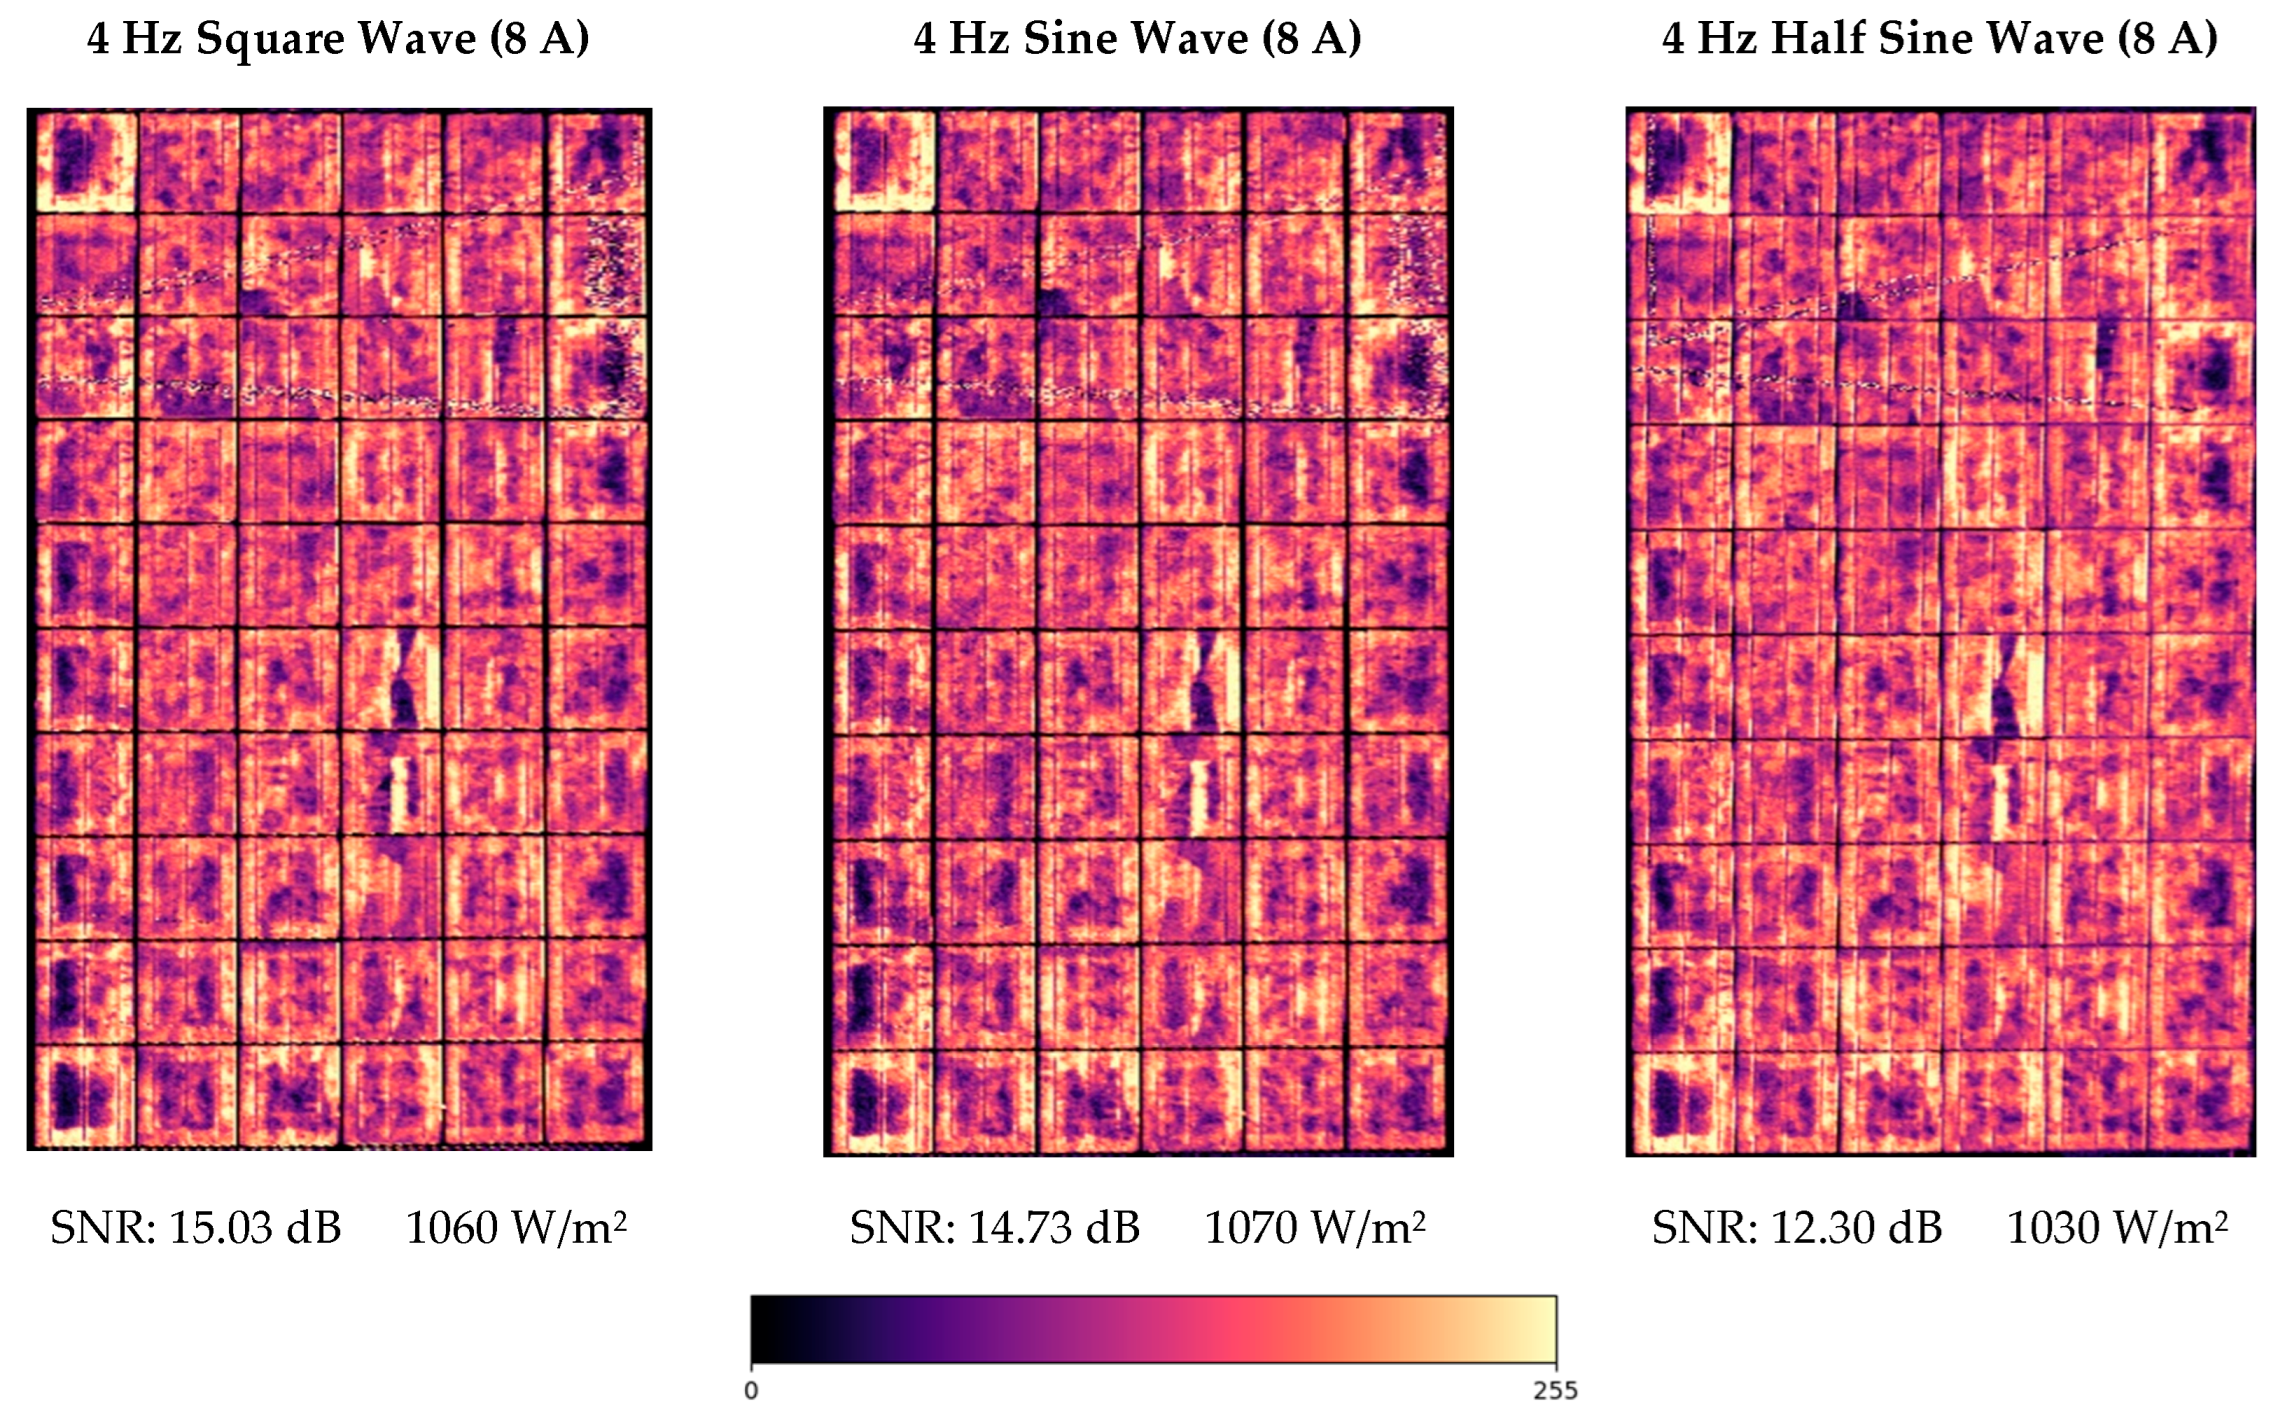
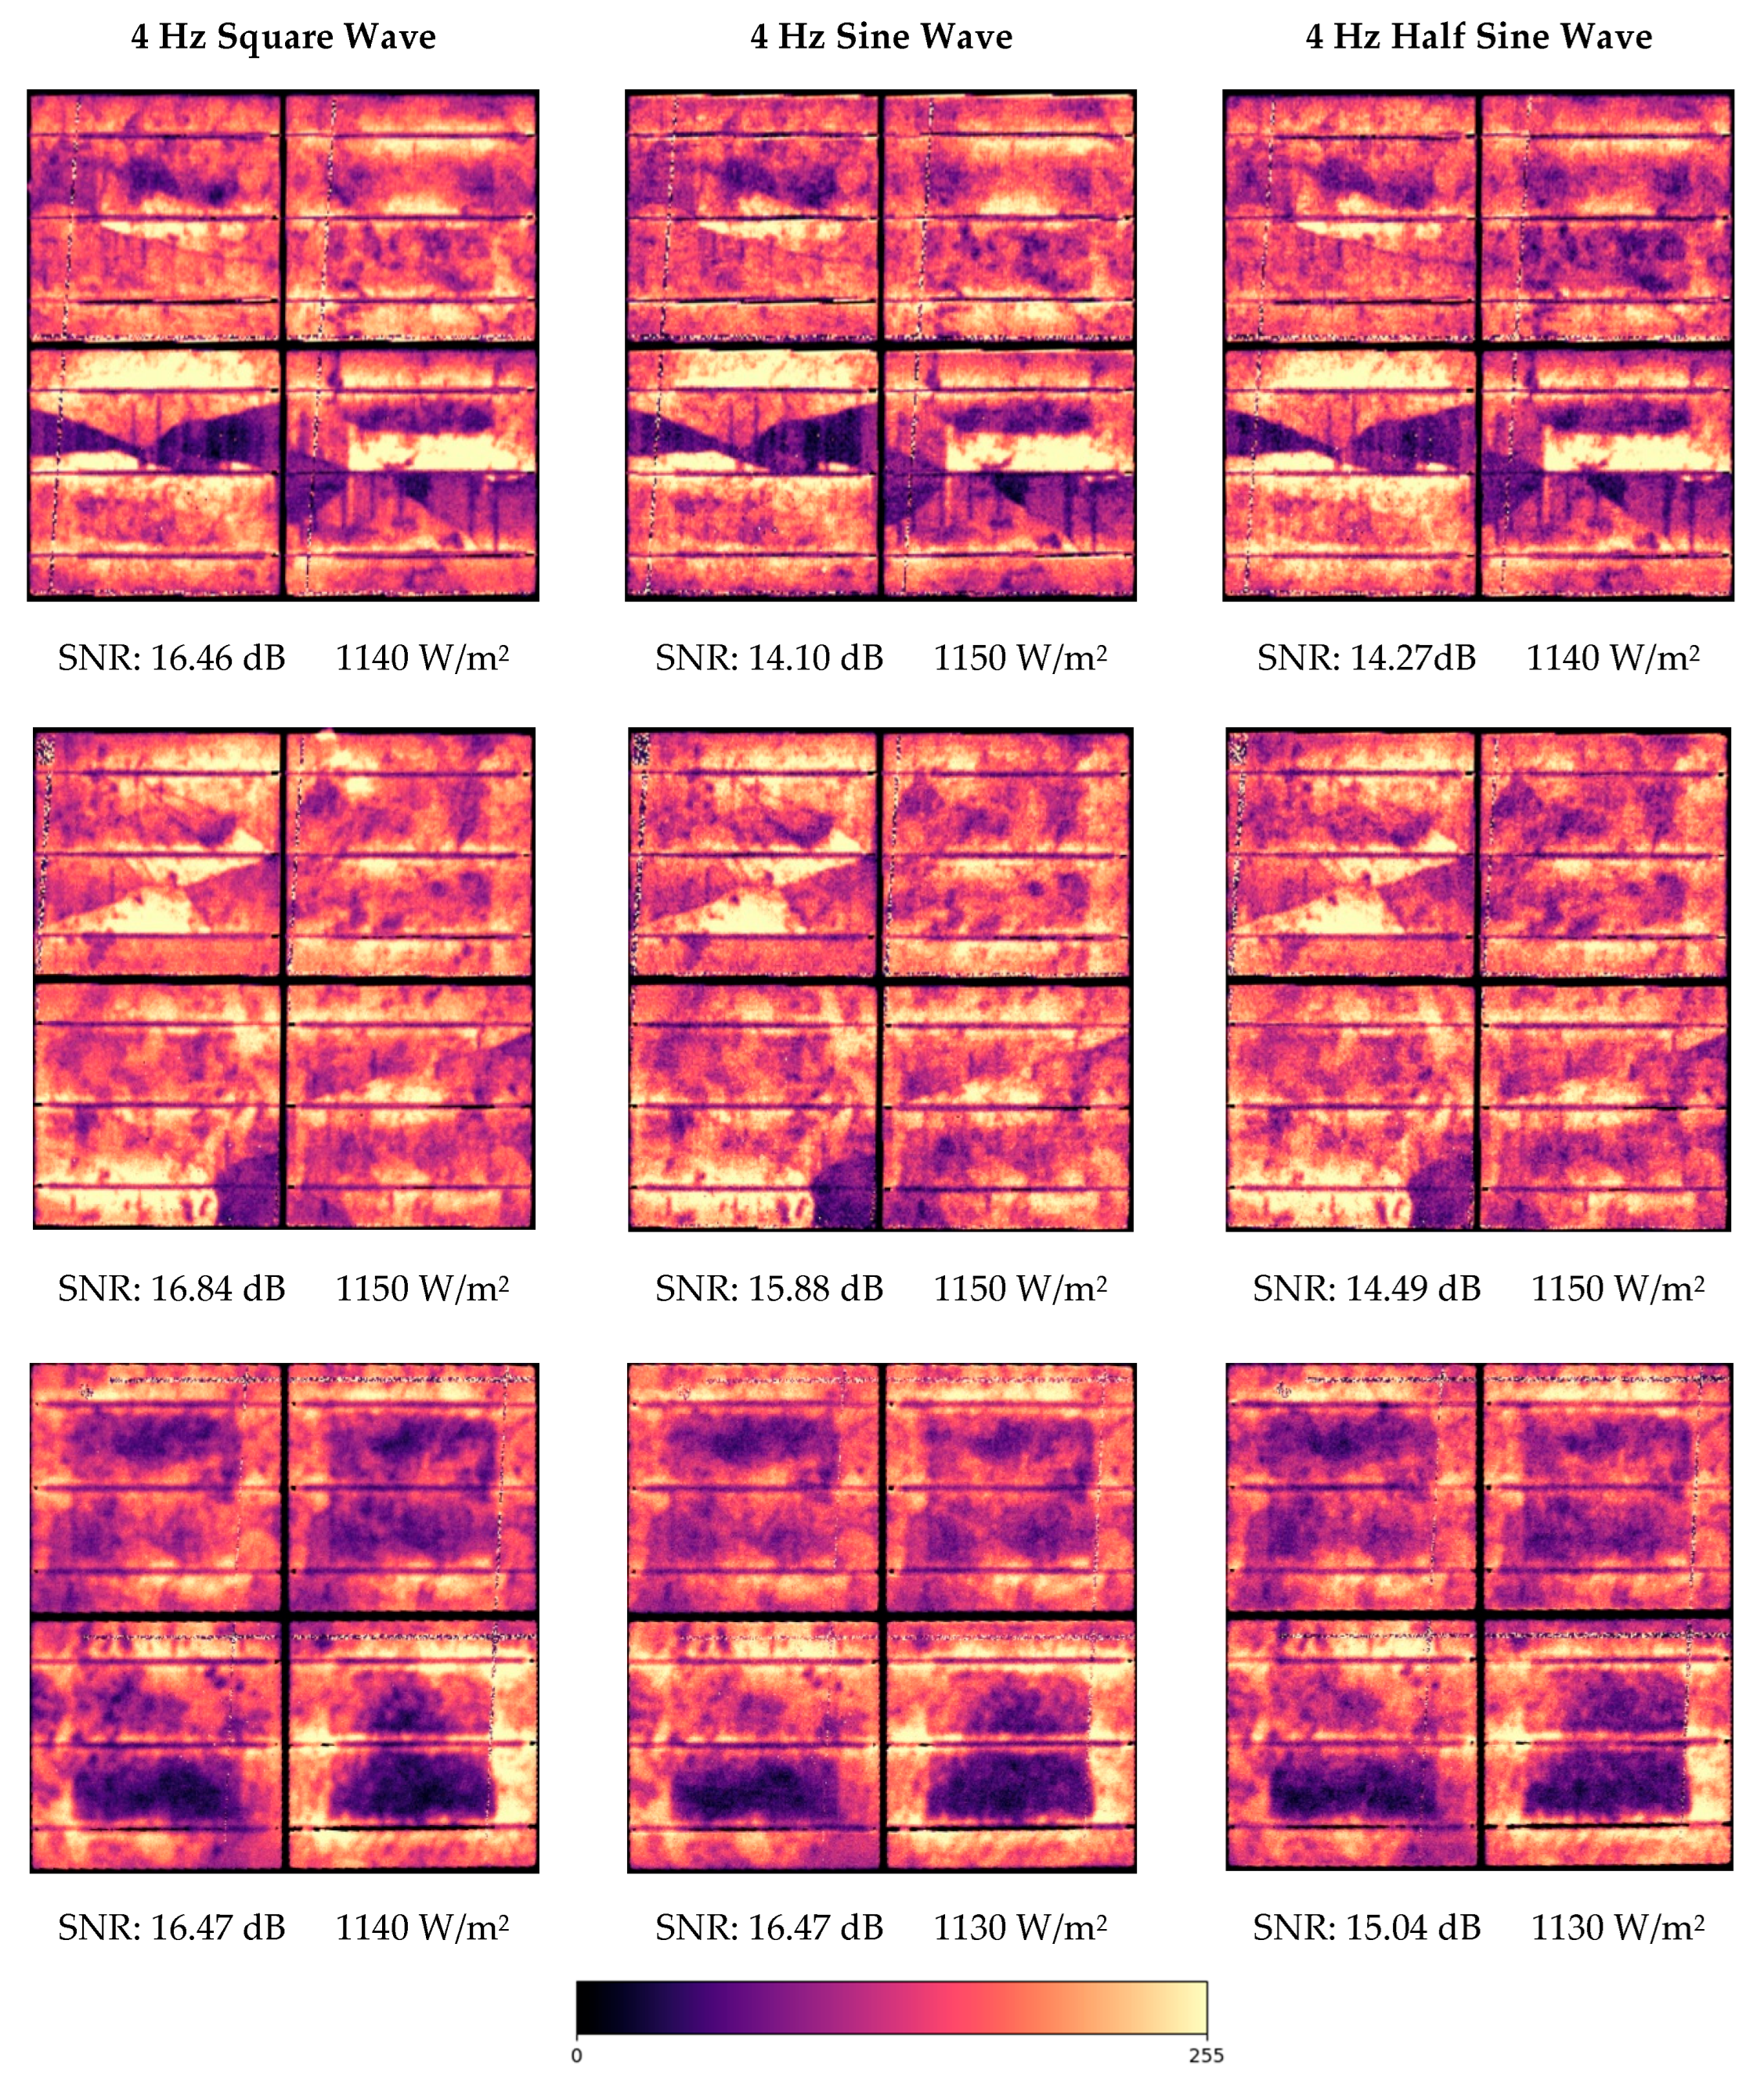
3.3. Self-Powered Electronic Board Aproach

Experimental results have also demonstrated that the modulation of the EL signal using the developed electronic board for self-powered modulation achieves similar results to the conventional approach using a power supply, as shown in Figure 8. Not only is the visual quality comparable to the conventional approach, but the SNR also indicates similar quantitative quality in both methods. The same trend, which identifies square modulation as providing the best SNR results, was also observed in this experiment.
Detailed pictures of some of cells of the PV module above have also been acquired using the self-powered approach. The increase in resolution in terms of pixels per cm2 allows a better identification of possible faults that appear in solar cells. Figure 9 includes, for all the modulation, three groups of four cells that present some anomalies. The first row shows solar cells with some cracks that have led to the creation of isolated areas where current can be extracted/injected and therefore EL signal is low resulting in dark areas. The second row includes a solar cell (bottom-left solar cell) where one of the corners is inactive. Finally, the third row shows two cells (bottom solar cells) with clear inhomogeneities. That patron of inhomogeneities is observed in the cells close to the PV module frame, which may indicate derivation issues.
Regarding the computational cost of the processing approach using the FFT, a total processing time of 6.5 s was reported for analyzing 1000 images of 640 × 512 pixels on an Intel Core i7-11800H processor. Most of the computation time is spent applying the FFT to all pixels, allowing the estimation of the computational cost function as shown in Equation (2).
T N , p = c · p · N l o g 2 N
where T(N, p) represents the processing time as a function of the number of images to be processed (N) and the number of pixels per image (p), and c is a constant that depends on the FFT implementation and hardware characteristics. For the current experiments using the aforementioned processor and a python script with NumPy library for FFT calculation, constant c corresponds to 2·10−9 s·pixel−1. Therefore, processing half the images would result in a total processing time of 2.9 s.

4. Discussion and Conclusions

Performing EL measurements in PV power plants under high irradiance conditions can be challenging, as the EL signal must be modulated for background removal. Nevertheless, EL imaging remains a powerful tool for fault detection and optimizing PV plant operation. Therefore, developing new approaches that enable EL image acquisition during normal PV plant operation is highly desirable.
This article has demonstrated that it is possible to modulate an arbitrary current injection in a single solar module using an electronic device that relies on the string current for self-powered modulation. The ability to modulate current using other PV modules as an energy source enables EL signal modulation without the need for an external power supply. This approach is more practical for PV power plant inspections, as it eliminates the need for disconnection, enhancing EL measurements during normal operation.
Although current and string voltage variations are observed during modulation, the PV inverter continues operating. In this scenario, the analyzed case represents the worst-case condition, as a single inverter tracks the MPP of only 10 modules. Using a larger inverter could help reduce voltage and current fluctuations.
Since the injected current is directly proportional to the EL signal intensity, one might assume that the self-powered approach only works under high irradiance conditions. However, the background signal also varies linearly with irradiance, resulting in similar signal-to-background ratios across different irradiance levels. This allows the self-powered approach to be used in a wide range of scenarios. Note that wind can also significantly affect image processing, as it may cause vibrations in grass and surrounding vegetation (visible in the raw images), leading to signal variations close to the modulation frequency. Therefore, it is crucial to crop the images to analyze only the area corresponding to the solar module.
The main limitation of the proposed approach is that it requires integrating a small electronic device into each PV module. Although this could have a significant cost impact, the proposed topology has strong potential for integration into module-level solar optimizers or micro-inverters, which are becoming increasingly popular. In this context, since a single electronic device would be required for each module, incorporating the proposed solution could have a minimal impact on the overall cost of the system. The total cost of the board hardware is approximately $16; however, it can be reduced to less than $10 if the design is optimized for cost (e.g., selecting alternative MOSFETs, increasing the PWM frequency to reduce the size of the LC filter, etc.). Furthermore, integration into other module-level electronics, such as microinverters or solar optimizers, allows for the omission of certain components such as the microcontroller, communication module, or power supply module, which could reduce the cost to less than $8 per board.
Comparing the proposed approach with conventional measurements using a programmable power supply to modulate the EL signal, similar results can be expected from both methods. In qualitative analysis, both approaches produce comparable images, effectively revealing failures within solar cells. To quantitatively assess potential differences, the SNR was calculated across several scenarios. In this regard, both methods also yield similar results. It is important to note that the quantitative analysis of EL images is inherently complex and may not always be fully representative. However, it can serve as an indicator of measurement quality.
The use of FFT has proven to be effective in successfully removing the background signal using different waveforms, including square wave, full sine wave and half sine wave. Even when the ratio between the EL signal and the background signal is below 0.2%, FFT can provide high-quality results by analyzing signal transmission at the modulation frequency. The tested waveforms have produced similar images, with square wave modulation showing slightly better results in term of SNR. However, all waveforms delivered sufficiently high-quality outcomes and similar qualitative quality.
Future work will focus on two key points: analyzing image quality under a wide range of irradiance levels and other weather conditions; and integrating the proposed electronics or their variations into devices such as module-level solar optimizers or micro-inverters, in order to enable luminescence measurements under high irradiance conditions in a more economically feasible manner.

Author Contributions

Conceptualization, A.R.-P., J.I.M.-A. and V.A.-G.; methodology, A.R.-P.; software, A.R.-P.; validation, A.R.-P., A.Z.V.-B. and L.H.-C.; formal analysis, A.R.-P.; investigation, A.R.-P.; resources, A.R.-P.; data curation, A.R.-P.; writing—original draft preparation, A.R.-P.; writing—review and editing, V.A.-G., Á.L.Z.-L. and L.H.-C.; supervision, V.A.-G. and L.H.-C.; funding A.R.-P., V.A.-G. and L.H.-C. All authors have read and agreed to the published version of the manuscript.

Funding

This research was funded by MCIU with grant number FPU21/04288; by MCIU/AEI/10.13039/501100011033, FEDER, EU with grant number PID2023-148369OB-C43 (DETECCION-FV-N); and U.T.E. Duques de Soria.-ARCOR, S.L.U. Y Hermanos Rubio Grupo Constructor HERCE, S.L. with grant reference DETECTA-PV–UVa.

Institutional Review Board Statement

Not applicable.

Informed Consent Statement

Not applicable.

Data Availability Statement

The data that support the findings of this study are openly available under the DOIs 10.5281/zenodo.15095306 and 10.5281/zenodo.15095552.

Acknowledgments

The authors acknowledge the support provided by the Thematic Network 723RT0150 “Red para la integración a gran escala de energías renovables en sistemas eléctricos (RIBIERSE-CYTED)” financed by the call for Thematic Networks of the CYTED (Ibero-American Program of Science and Technology for Development) for 2022.

Conflicts of Interest

The authors declare no conflicts of interest.

Abbreviations

The following abbreviations are used in this manuscript:
CdTeCadmium Telluride
ELElectroluminescence
FFTFast Fourier Transformation
InGaAsIndium Gallium Arsenide
I-VCurrent-Voltage
LCL-inductor C-capacitor
MOSFETMetal-Oxide-Semiconductor Field-Effect Transistor
MPPMaximum Power Point
MPPTMaximum Power Point Tracking
PERCPassivated Emitter and Rear Contact
PLPhotoluminescence
PVPhotovoltaic
PWMPulse Width Modulation
TOPConTunnel Oxide Passivated Contact
UAVsUnnamed Aerial Vehicles
UVUltraviolet

References

  1. IEA. Electricity 2024 Analysis and Forecast to 2030; IEA: Paris, France, 2023. [Google Scholar]
  2. Waqar Akram, M.; Li, G.; Jin, Y.; Chen, X. Failures of Photovoltaic Modules and Their Detection: A Review. Appl. Energy 2022, 313, 118822. [Google Scholar] [CrossRef]
  3. Köntges, M.; Jahn, U.; Berger, K.A.; Friesen, T. Review of Failures of Photovoltaic Modules; SUPSI: Verscio, Switzerland, 2014. [Google Scholar]
  4. Høiaas, I.; Grujic, K.; Imenes, A.G.; Burud, I.; Olsen, E.; Belbachir, N. Inspection and Condition Monitoring of Large-Scale Photovoltaic Power Plants: A Review of Imaging Technologies. Renew. Sustain. Energy Rev. 2022, 161, 112353. [Google Scholar] [CrossRef]
  5. Peinado Gonzalo, A.; Pliego Marugán, A.; García Márquez, F.P. Survey of Maintenance Management for Photovoltaic Power Systems. Renew. Sustain. Energy Rev. 2020, 134, 110347. [Google Scholar] [CrossRef]
  6. Hong, Y.-Y.; Pula, R.A. Methods of Photovoltaic Fault Detection and Classification: A Review. Energy Rep. 2022, 8, 5898–5929. [Google Scholar] [CrossRef]
  7. Niccolai, A.; Gandelli, A.; Grimaccia, F.; Zich, R.; Leva, S. Overview on Photovoltaic Inspections Procedure by Means of Unmanned Aerial Vehicles. In Proceedings of the 2019 IEEE Milan PowerTech, Milan, Italy, 23–27 June 2019; pp. 1–6. [Google Scholar]
  8. Kandeal, A.W.; Elkadeem, M.R.; Kumar Thakur, A.; Abdelaziz, G.B.; Sathyamurthy, R.; Kabeel, A.E.; Yang, N.; Sharshir, S.W. Infrared Thermography-Based Condition Monitoring of Solar Photovoltaic Systems: A Mini Review of Recent Advances. Sol. Energy 2021, 223, 33–43. [Google Scholar] [CrossRef]
  9. Schirripa Spagnolo, G.; Del Vecchio, P.; Makary, G.; Papalillo, D.; Martocchia, A. A Review of IR Thermography Applied to PV Systems. In Proceedings of the 2012 11th International Conference on Environment and Electrical Engineering, Venice, Italy, 18–25 May 2012; pp. 879–884. [Google Scholar]
  10. Ulrike Jahn, M.H.; Köntges, M.; Parlevliet, D.; Pagg, M.; Tsanakas, I.; Stein, J.S.; Berger, K.A.; Ranta, S.; French, R.H.; Richter, M.; et al. Review on Infrared and Electroluminescence Imaging for PV Field Applications; IEA: Paris, France, 2018. [Google Scholar]
  11. Dhimish, M.; Badran, G. Investigating Defects and Annual Degradation in UK Solar PV Installations through Thermographic and Electroluminescent Surveys. NPJ Mater. Degrad. 2023, 7, 14. [Google Scholar] [CrossRef]
  12. Redondo-Plaza, A.; Zorita-Lamadrid, Á.L.; Hernández-Callejo, L.; Alonso-Gómez, V. Inspection Techniques in Photovoltaic Power Plants: A Review of Electroluminescence and Photoluminescence Imaging. Renew. Energ. 2024, 2, 27533735241282603. [Google Scholar] [CrossRef]
  13. Kunz, O.; Schlipf, J.; Fladung, A.; Khoo, Y.S.; Bedrich, K.; Trupke, T.; Hameiri, Z. Outdoor Luminescence Imaging of Field-Deployed PV Modules. Prog. Energy 2022, 4, 042014. [Google Scholar] [CrossRef]
  14. Fuyuki, T.; Kondo, H.; Yamazaki, T.; Takahashi, Y.; Uraoka, Y. Photographic Surveying of Minority Carrier Diffusion Length in Polycrystalline Silicon Solar Cells by Electroluminescence. Appl. Phys. Lett. 2005, 86, 262108. [Google Scholar] [CrossRef]
  15. Weber, T.; Albert, A.; Ferretti, N.; Roericht, M.; Krauter, S.; Grunow, P. Electroluminescence Investigation of Thin Film Modules. In Proceedings of the EUPVSEC 2011, Hamburg, Germany, 5–9 September 2011. [Google Scholar]
  16. Colvin, D.J.; Schneller, E.J.; Horner, G.S.; Gabor, A.M.; Davis, K.O. Evaluating Impact on Electroluminescence Image Quality and Quantitative Analysis Using Different Camera Technologies. In Proceedings of the 2021 IEEE 48th Photovoltaic Specialists Conference (PVSC), Fort Lauderdale, FL, USA, 20–25 June 2021; pp. 1057–1061. [Google Scholar]
  17. dos Reis Benatto, G.A.; Kari, T.; Del Prado Santamaría, R.; Mahmood, A.; Stoicescu, L.; Spataru, S.V. Evaluation of Daylight Filters for Electroluminescence Imaging Inspections of Crystalline Silicon Photovoltaic Modules. Solar RRL 2025, 9, 2400654. [Google Scholar] [CrossRef]
  18. Stoicescu, L.; Reuter, M.; Werner, J.H. DaySy: Luminiscence Imaging of PV Modules in Daylight. In Proceedings of the 29th European Photovoltaic Solar Energy Conference Exhibition, Amsterdam, The Netherlands, 22–26 September 2014. [Google Scholar]
  19. Guada, M.; Moretón, Á.; Rodríguez-Conde, S.; Sánchez, L.A.; Martínez, M.; González, M.Á.; Jiménez, J.; Pérez, L.; Parra, V.; Martínez, O. Daylight Luminescence System for Silicon Solar Panels Based on a Bias Switching Method. Energy Sci. Eng. 2020, 8, 3839–3853. [Google Scholar] [CrossRef]
  20. Kropp, T.; Berner, M.; Stoicescu, L.; Werner, J.H. Self-Sourced Daylight Electroluminescence From Photovoltaic Modules. IEEE J. Photovolt. 2017, 7, 1184–1189. [Google Scholar] [CrossRef]
  21. Bhoopathy, R.; Kunz, O.; Juhl, M.; Trupke, T.; Hameiri, Z. Outdoor Photoluminescence Imaging of Photovoltaic Modules with Sunlight Excitation. Prog. Photovolt. Res. Appl. 2018, 26, 69–73. [Google Scholar] [CrossRef]
  22. Bhoopathy, R.; Kunz, O.; Juhl, M.; Trupke, T.; Hameiri, Z. Outdoor Photoluminescence Imaging of Solar Panels by Contactless Switching: Technical Considerations and Applications. Prog. Photovolt. Res. Appl. 2020, 28, 217–228. [Google Scholar] [CrossRef]
  23. Kunz, O.; Rey, G.; Juhl, M.K.; Trupke, T. High Throughput Outdoor Photoluminescence Imaging via PV String Modulation. In Proceedings of the 2021 IEEE 48th Photovoltaic Specialists Conference (PVSC), Fort Lauderdale, FL, USA, 20–25 June 2021; pp. 346–350. [Google Scholar]
  24. Ballestín-Fuertes, J.; Muñoz-Cruzado-Alba, J.; Sanz-Osorio, J.F.; Hernández-Callejo, L.; Alonso-Gómez, V.; Morales-Aragones, J.I.; Gallardo-Saavedra, S.; Martínez-Sacristan, O.; Moretón-Fernández, Á. Novel Utility-Scale Photovoltaic Plant Electroluminescence Maintenance Technique by Means of Bidirectional Power Inverter Controller. Appl. Sci. 2020, 10, 3084. [Google Scholar] [CrossRef]
  25. Kunz, O.; Rey, G.; Bhoopathy, R.; Hameiri, Z.; Trupke, T. Outdoor PL Imaging of Crystalline Silicon Modules at Constant Operating Point. In Proceedings of the 2020 47th IEEE Photovoltaic Specialists Conference (PVSC), Calgary, AB, Canada, 15 June–21 August 2020; pp. 2140–2143. [Google Scholar]
  26. Doll, B.; Wittmann, E.; Lüer, L.; Hepp, J.; Buerhop-Lutz, C.; Hauch, J.A.; Brabec, C.J.; Peters, I.M. Aerial Photoluminescence Imaging of Photovoltaic Modules. Phys. Status Solidi (RRL)–Rapid Res. Lett. 2023, 17, 2300059. [Google Scholar] [CrossRef]
  27. Doll, B.; Hepp, J.; Hoffmann, M.; Schuler, R.; Buerhop-Lutz, C.; Peters, I.M.; Hauch, J.A.; Maier, A.; Brabec, C.J. Photoluminescence for Defect Detection on Full-Sized Photovoltaic Modules. IEEE J. Photovolt. 2021, 11, 1419–1429. [Google Scholar] [CrossRef]
  28. Weber, J.W.; Kunz, O.; Knaack, C.; Chung, D.; Barson, A.; Slade, A.; Ouyang, Z.; Gottlieb, H.; Trupke, T. Daylight Photoluminescence Imaging of Photovoltaic Systems Using Inverter-based Switching. Prog. Photovolt. Res. Appl. 2024, 32, 643–651. [Google Scholar] [CrossRef]
  29. Vuković, M.; Eriksdatter Høiaas, I.; Jakovljević, M.; Svarstad Flø, A.; Olsen, E.; Burud, I. Photoluminescence Imaging of Silicon Modules in a String. Prog. Photovolt. Res. Appl. 2022, 30, 436–446. [Google Scholar] [CrossRef]
  30. Vuković, M.; Jakovljević, M.; Flø, A.S.; Olsen, E.; Burud, I. Noninvasive Photoluminescence Imaging of Silicon PV Modules in Daylight. Appl. Phys. Lett. 2022, 120, 244102. [Google Scholar] [CrossRef]
  31. Vuković, M.; Hillestad, M.; Jakovljević, M.; Flø, A.S.; Olsen, E.; Burud, I. Photoluminescence Imaging of Field-Installed Photovoltaic Modules in Diffuse Irradiance. J. Appl. Phys. 2023, 134, 074903. [Google Scholar] [CrossRef]
  32. Vuković, M.; Wiig, M.S.; dos Reis Benatto, G.A.; Olsen, E.; Burud, I. A Review of Imaging Methods for Detection of Photoluminescence in Field-Installed Photovoltaic Modules. Prog. Energy 2024, 6, 032001. [Google Scholar] [CrossRef]
  33. Rey, G.; Kunz, O.; Green, M.; Trupke, T. Luminescence Imaging of Solar Modules in Full Sunlight Using Ultranarrow Bandpass Filters. Prog. Photovolt. Res. Appl. 2022, 30, 1115–1121. [Google Scholar] [CrossRef]
  34. Redondo-Plaza, A.; Morales-Aragonés, J.I.; Gallardo-Saavedra, S.; Mateo-Romero, H.F.; Araujo-Rendón, S.; Zorita-Lamadrid, Á.L.; Alonso-Gómez, V.; Hernández-Callejo, L. Passive Electroluminescence and Photoluminescence Imaging Acquisition of Photovoltaic Modules. Sensors 2024, 24, 1539. [Google Scholar] [CrossRef]
  35. dos Reis Benatto, G.A.; Kari Hass, T.; Del Prado Santamaria, R.; Viorel Spataru, S. Daylight Electroluminescence Imaging Methodology Comparison. In Proceedings of the 40th European Photovoltaic Solar Energy Conference and Exhibition, Lisbon, Portugal, 18–22 September 2023. [Google Scholar]
Figure 1. Topology of the electronic board for self-powered signal modulation.
Applsci 15 04606 g001
Figure 2. Acquisition setup for EL imaging using the self-powered approach.
Applsci 15 04606 g002
Figure 3. Processing approach flow diagram.
Applsci 15 04606 g003
Figure 4. Module current for square, full sine and half sine wave modulation (Measured with oscilloscope RS PRO Siglent SHS820X).
Applsci 15 04606 g004
Figure 5. Signal evolution in image sequences for square, full sine and half sine modulation.
Applsci 15 04606 g005
Figure 6. Average FFT transformation for a sequence of 1000 images with 53 fps and 4 Hz of modulation frequency using a square wave.
Applsci 15 04606 g006
Figure 7. EL images using conventional approach with power supply using different waveforms. Exposure time of 2 ms, 53 fps and 1000 images per sequence.
Applsci 15 04606 g007
Figure 8. EL images using self-powered approach based on the electronic board. Exposure time of 2 ms, 53 fps and 1000 images per sequence.
Applsci 15 04606 g008
Figure 9. Detailed images of damaged solar cells using the self-powered approach. Exposure time of 2 ms, 53 fps and 1000 images per sequence.
Applsci 15 04606 g009
Table 1. Summary of studies proposing alternative luminescence imaging methods for PV power plant inspection.
Ref./YearEL/PLDay/NightExcitation SourceEquipment for
Modulation
PV Module DisconnectionCamera SensorFilter
[18,19]
2014
EL/PLDay/nightPower supply (EL) or electronic board (PL)Power supply (EL) or electronic board (PL)RequiredInGaAs sensor
Optical bandpass filter
Optical bandpass
filter
[20]
2017
ELDayPV module currentElectronic boardRequiredInGaAs sensor
Optical bandpass filter
Optical bandpass
filter
[21,22,23]
2018
PLDaySunlightOptical solar cell
controllers
Not requiredInGaAs sensor
Optical bandpass filter
Optical bandpass
filter
[24]
2020
ELNightBidirectional
inverter
No modulation neededNot requiredInGaAs-
[25]
2020
PLDaySunlightTwo optical filtersNot requiredInGaAs sensor
Optical bandpass filters
Two bandpass
optical filters
[26,27]
2021
PLNightLED lightingNo modulation neededNot requiredInGaAs or
Silicon
Optical lowpass
filter
[28,29]
2022
PLDaySunlightPV Inverter
(MPPT functionality)
Not requiredInGaAs sensor
Optical bandpass filter
Optical bandpass
filter
[30,31,32]
2022
PLDaySunlightPV Inverter (I-V curve sweep functionality)Not requiredInGaAs sensor
Optical bandpass filter
Optical bandpass
filter
[33]
2022
PLDaySunlightNo modulation neededNot requiredInGaAs sensorUltranarrow optical bandpass filter
[34]
2024
EL/PLDaySunlight (PL) or
PV string current (EL)
Electronic boardNot requiredInGaAs sensor
Optical bandpass filter
Optical bandpass
filter
Table 2. Summary of camera settings, modulation parameters, PV characteristics and weather conditions during the measurements.
Camera Parameters (Hamamatsu C12741-03)
Image size640 × 512 pixels
Stack size1000 images
Exposure time2 ms
Acquisition speed53 fps
FilterBandpass filter (1100 nm–1250 nm)
Signal modulation parameters
Frequency4 Hz
WaveformsSquare, half sine and full sine
PV characteristics (Trina Solar TSM-235-PC05A)
Module Power (STC)235 V
Module VOC (STC)37.2 V
Module ISC (STC)8.55 A
String size10 modules
Inverter typeString inverter
Weather conditions
Irradiance1030–1150 W/m2
CloudinessClear-sky conditions
Temperature≈14 °C
Disclaimer/Publisher’s Note: The statements, opinions and data contained in all publications are solely those of the individual author(s) and contributor(s) and not of MDPI and/or the editor(s). MDPI and/or the editor(s) disclaim responsibility for any injury to people or property resulting from any ideas, methods, instructions or products referred to in the content.

