1. Introduction
The natural and strategic characteristics, from an economic development perspective, make coastal areas places with high potential for the development of human activities [
1,
2,
3]. They represent areas with significant natural interest, hosting unique ecosystems with high and rich biodiversity [
2,
4]. Additionally, the characteristics of their landscapes, represented by the interaction of abiotic elements (beaches, dunes, cliffs, and marshes) and biotic elements (flora and fauna), enhance the need for conservation and a sustainable use of the coastal environment together with the economic use of ecosystem services [
5,
6].
Historically, and increasingly over the past few decades, coastal areas have housed large population centres of high socioeconomic importance. The location and logistic, industrial, and productive opportunities (agriculture and fishing), along with the increase in tourism, concentrate nearly 11% of the world’s population in coastal areas (around 896 million people), according to 2020 data [
7]. This upward trend in terms of population and economic activity development, which in many cases requires the development of infrastructure (buildings, factories, and communication routes), generates negative impacts related to the degradation of coastal ecosystems [
8,
9].
The current global dynamics show an increase in the likelihood of extreme weather events [
2,
5]. Coastal areas are therefore particularly sensitive to natural hazards such as storms, rising sea levels, or mass movements, all of which are becoming more severe [
2,
5,
10]. This increase in coastal vulnerability to growing hazards related to global change results in a deterioration of the environment’s adaptive capacity [
11,
12,
13]. Consequently, it exacerbates the economic impacts on agricultural (food security), energy, tourism, and urban activities, as well as on people or the natural environment [
11,
12,
13,
14,
15]. Recognizing the external processes responsible for triggering natural hazards becomes a practice of special necessity and importance to reduce or mitigate the impact of these events, whether fully or partially [
16,
17,
18]. The southeast margin of the Ría de Arosa represents an environment of high ecological importance, characterized by protected natural spaces (PNS) of the Umia-Grove Intertidal Complex, the Ons-Grove Complex, a set of geological interest sites (geosites), and extensive areas of high landscape quality [
19,
20]. Natural hazards, particularly coastal flooding, mass movements (e.g., landslides and rockfalls), or soil loss, are particularly relevant issues in this area due to its geographic configuration and the high population density recorded. In line with this fact, the degradation of its ecosystems, particularly wetlands, can directly affect the regenerative capacity of the coast and its resilience against extreme natural events or anthropogenic activities [
11,
12,
13]. Consequently, it may jeopardize not only biodiversity but also the ecosystem services important to the local population.
The rapid advancement of digital tools in recent decades, especially Geographic Information Systems (GIS), has made these technologies essential for land-use planning and decision-making processes. GIS enables the rapid and cost-effective management of large volumes of geospatial information, allowing for its organization, visualization, querying, integration, and analysis [
21]. This ability to model and visualize scenarios for territorial planning enhances the transparency and reproducibility of the resulting outputs [
22].
Multi-Criteria Decision Analysis (MCDA) is a decision-support tool applicable to various contexts and particularly useful in spatial planning [
23]. It provides a systematic approach for integrating multiple spatial data layers, each representing different suitability criteria, to produce a composite map indicating the degree of suitability of each evaluated parcel [
23]. MCDA is especially effective in helping decision-makers analyze complex problems in a more visual, simple, and comprehensible way [
24]. Recent studies addressing multi-risk assessments have successfully applied this and other similar methodologies, such as the Analytic Hierarchy Process (AHP), Equal Weighting Method (EWM), Weighted Overlay Analysis (WOA), and Boolean analysis [
20,
25,
26,
27,
28,
29,
30].
This study aims to develop a methodology that, using various MCDA-related techniques, produces land use recommendation and limitation mapping (at 1:50,000 scale and 1 × 1 m pixel resolution). This map integrates areas of high conservation quality and zones of significant natural hazard, which are unsuitable for anthropogenic development. The resulting cartography can be considered a novel, high-resolution, easy-to-understand tool designed to support sustainable territorial planning in the early stages of project development. It serves as a preliminary diagnostic tool that allows for the detailed definition of conservation and management strategies in the study areas [
31,
32].
Furthermore, this study introduces a land use limitation degree mapping, a novel tool designed to identify parcels with significant restrictions due to environmental, risk-related, or legal factors. Through Boolean analysis, the overlaid information layers from the land use recommendation and limitation mapping are integrated. The resulting areas are classified according to the severity of the constraints (high, medium, or low), providing a solid basis for informed decision-making, sustainable planning, and conservation strategies. Based on the characteristics of each area, appropriate measures will be proposed to guide the development of specific activities, often highlighting the need for Strategic Environmental Assessments (SEA) or Environmental Impact Assessments (EIA) [
33,
34,
35].
Although numerous studies have applied GIS and MCDA-based approaches to land-use planning [
36,
37,
38], this research stands out by integrating conservation quality values and natural hazards, with high spatial resolution and up-to-date data. Therefore, the main objective is to develop an effective, easily replicable methodology for sustainable spatial planning that considers environmental protection and natural risk management, promoting responsible land use aligned with the ecological management priorities of the area.
Study Zone
The Ría de Arosa, located on the northwest coast of the Iberian Peninsula, is one of the largest and most important of the Rías Bajas in Galicia (
Figure 1). This estuary is the result of the flooding caused by rising sea levels of ancient river valleys during the Quaternary period. It delineates its northern margin in the province of La Coruña and its southern margin in the province of Pontevedra. The entire study focuses on the southeast margin of the estuary, which encompasses approximately 9600 hectares and a stable population of 57,358 inhabitants, distributed among municipalities such as Cambados, El Grove, Villanueva de Arosa, Arousa, Sangenjo, and Portonovo. In this territory, the population density reaches 598 inhabitants per km
2, well above the national average (96 inhabitants per km
2) (data from the National Institute of Statistics (INE),
https://www.ine.es/, accessed on 25 October 2024). These figures do not account for the notable population increase during the summer months due to the tourist influx.
From a climatic perspective, the area is influenced by the moderating effect of the Atlantic Ocean, which favours mild and humid conditions throughout the year. It is classified as type Csb according to the Köppen classification [
39]. The average temperature in summer is 19.3 °C, while in winter it drops to 9 °C. Precipitation is abundant, with an annual average of 1455 mm, especially intense during the autumn months when it exceeds 200 mm/month (information prepared by the State Meteorological Agency (AEMET),
https://www.aemet.es/es/serviciosclimaticos/datosclimatologicos, accessed on 25 October 2024).
The region is part of the Iberian Massif, specifically the Galicia Trás-os-Montes Zone, belonging to the internal domain of the Variscan orogeny. In this area, Palaeozoic metasediments converge with granite outcrops, notably the Caldas de Reyes batholith [
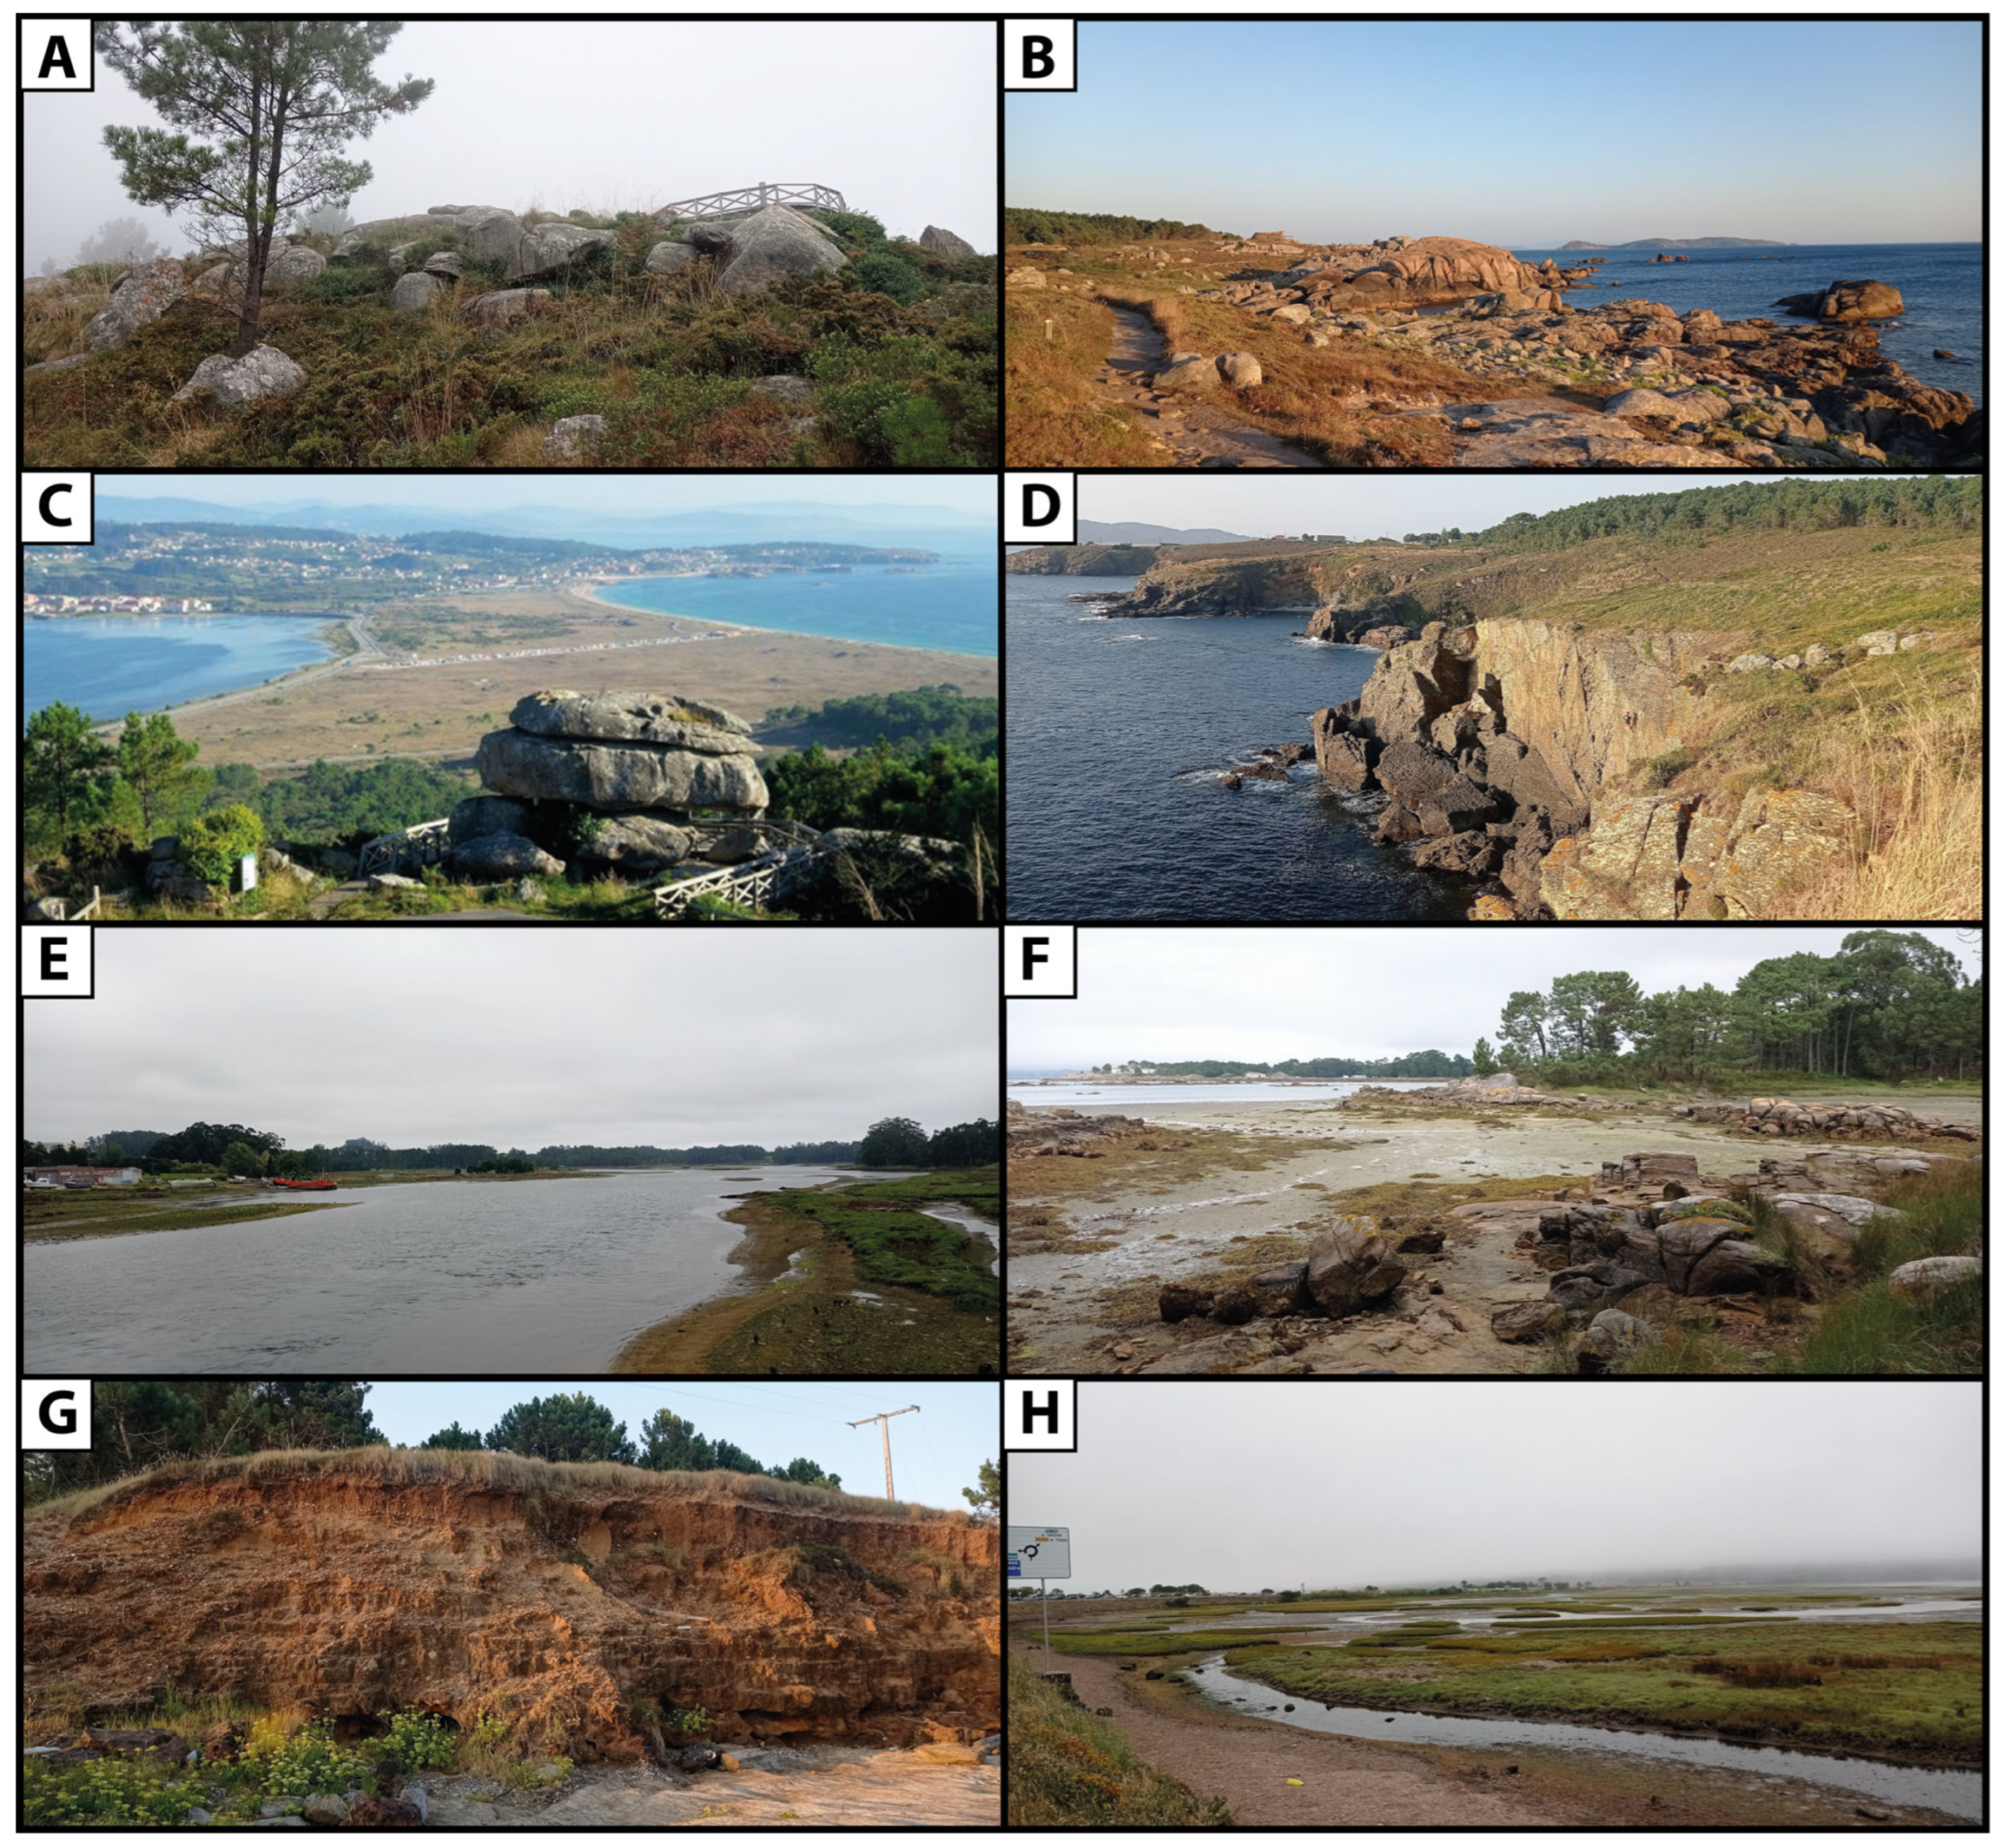
40]. The geomorphology of the area is characterized by a generally smooth relief, with significant granite and metamorphic outcrops forming ridges, summits, and hills [
37]. The relief results from continuous modelling through weathering and differential erosion due to the interaction between climatic conditions, geology, and coastal action, leading to extensive peneplains, marine terraces, and residual landforms of varying dimensions, including inselbergs (granite domes), along with rocky outcrops and tors, especially in more evolved areas [
41,
42,
43]. The coastline is shaped by depositional environments where beaches, dune systems, and marshes are found. In La Lanzada, a tombolo has formed, connecting the El Grove Peninsula with the Castrove Peninsula, upon which extensive dune fields develop. The coastal relief, combined with tidal activity and sedimentary dynamics, has favoured the formation of “rasas” or marine terraces. A total of 14 landscape units are defined in this region, all representative of the area based on their geomorphological characteristics and vegetation [
20]. Around the study area and along the bay of Umia-Grove, there are two protected areas under the Natura 2000 Network: the Umia-O Grove Intertidal Complex (Special Protection Area for Birds (SPA)) and the Ons-O Grove Complex (Special Area of Conservation). Both safeguard the important wetland and intertidal ecosystems, enhancing the interest related to the local botany and fauna. The soils in the area vary according to the substrate type. Acidic and poorly developed soils, such as Leptosols and Umbrisols, develop over granite outcrops, while similar soils are found in metamorphic areas. In the coastal and marsh areas, Arenosols and Fluvisols predominate, derived from recent Quaternary deposits [
44,
45].
2. Materials and Methods
The methodology described here aims to develop land use recommendation and limitation mapping, as well as land use limitation degree mapping, for the southeastern margin of the Ría de Arosa (scale 1:50,000) (Coordinate system: Projected coordinates, ETRS89/UTM Zone 29N). To achieve this, comprehensive fieldwork was conducted, structured in various campaigns with specific objectives focused on improving the understanding of the physical environment and the external processes affecting it. This preliminary fieldwork was complemented by a photo-interpretation analysis of orthophotos (both historical aerial photographs from the American flight series (1956–1957), with an estimated spatial resolution between 0.5 and 1 m per pixel, and recent ones from the Spanish National Aerial Orthophotography Plan (PNOA), with a spatial resolution of 25 cm per pixel), along with an analysis of a high-resolution digital elevation model (DEM) (1 × 1 m pixel) produced from LIDAR satellite data. The integration of these sources allowed for a detailed recognition, greater accuracy in synthesis, and improved resolution of the thematic maps of the physical environment factors, which play a key role in this study.
Simultaneously with the field data collection, an exhaustive bibliographic and digital review was carried out, incorporating relevant thematic maps, such as the Spanish Forest Map (MFE) and the Land Occupation Information System of Spain (SIOSE). All this information was integrated into a rigorous and structured geodatabase.
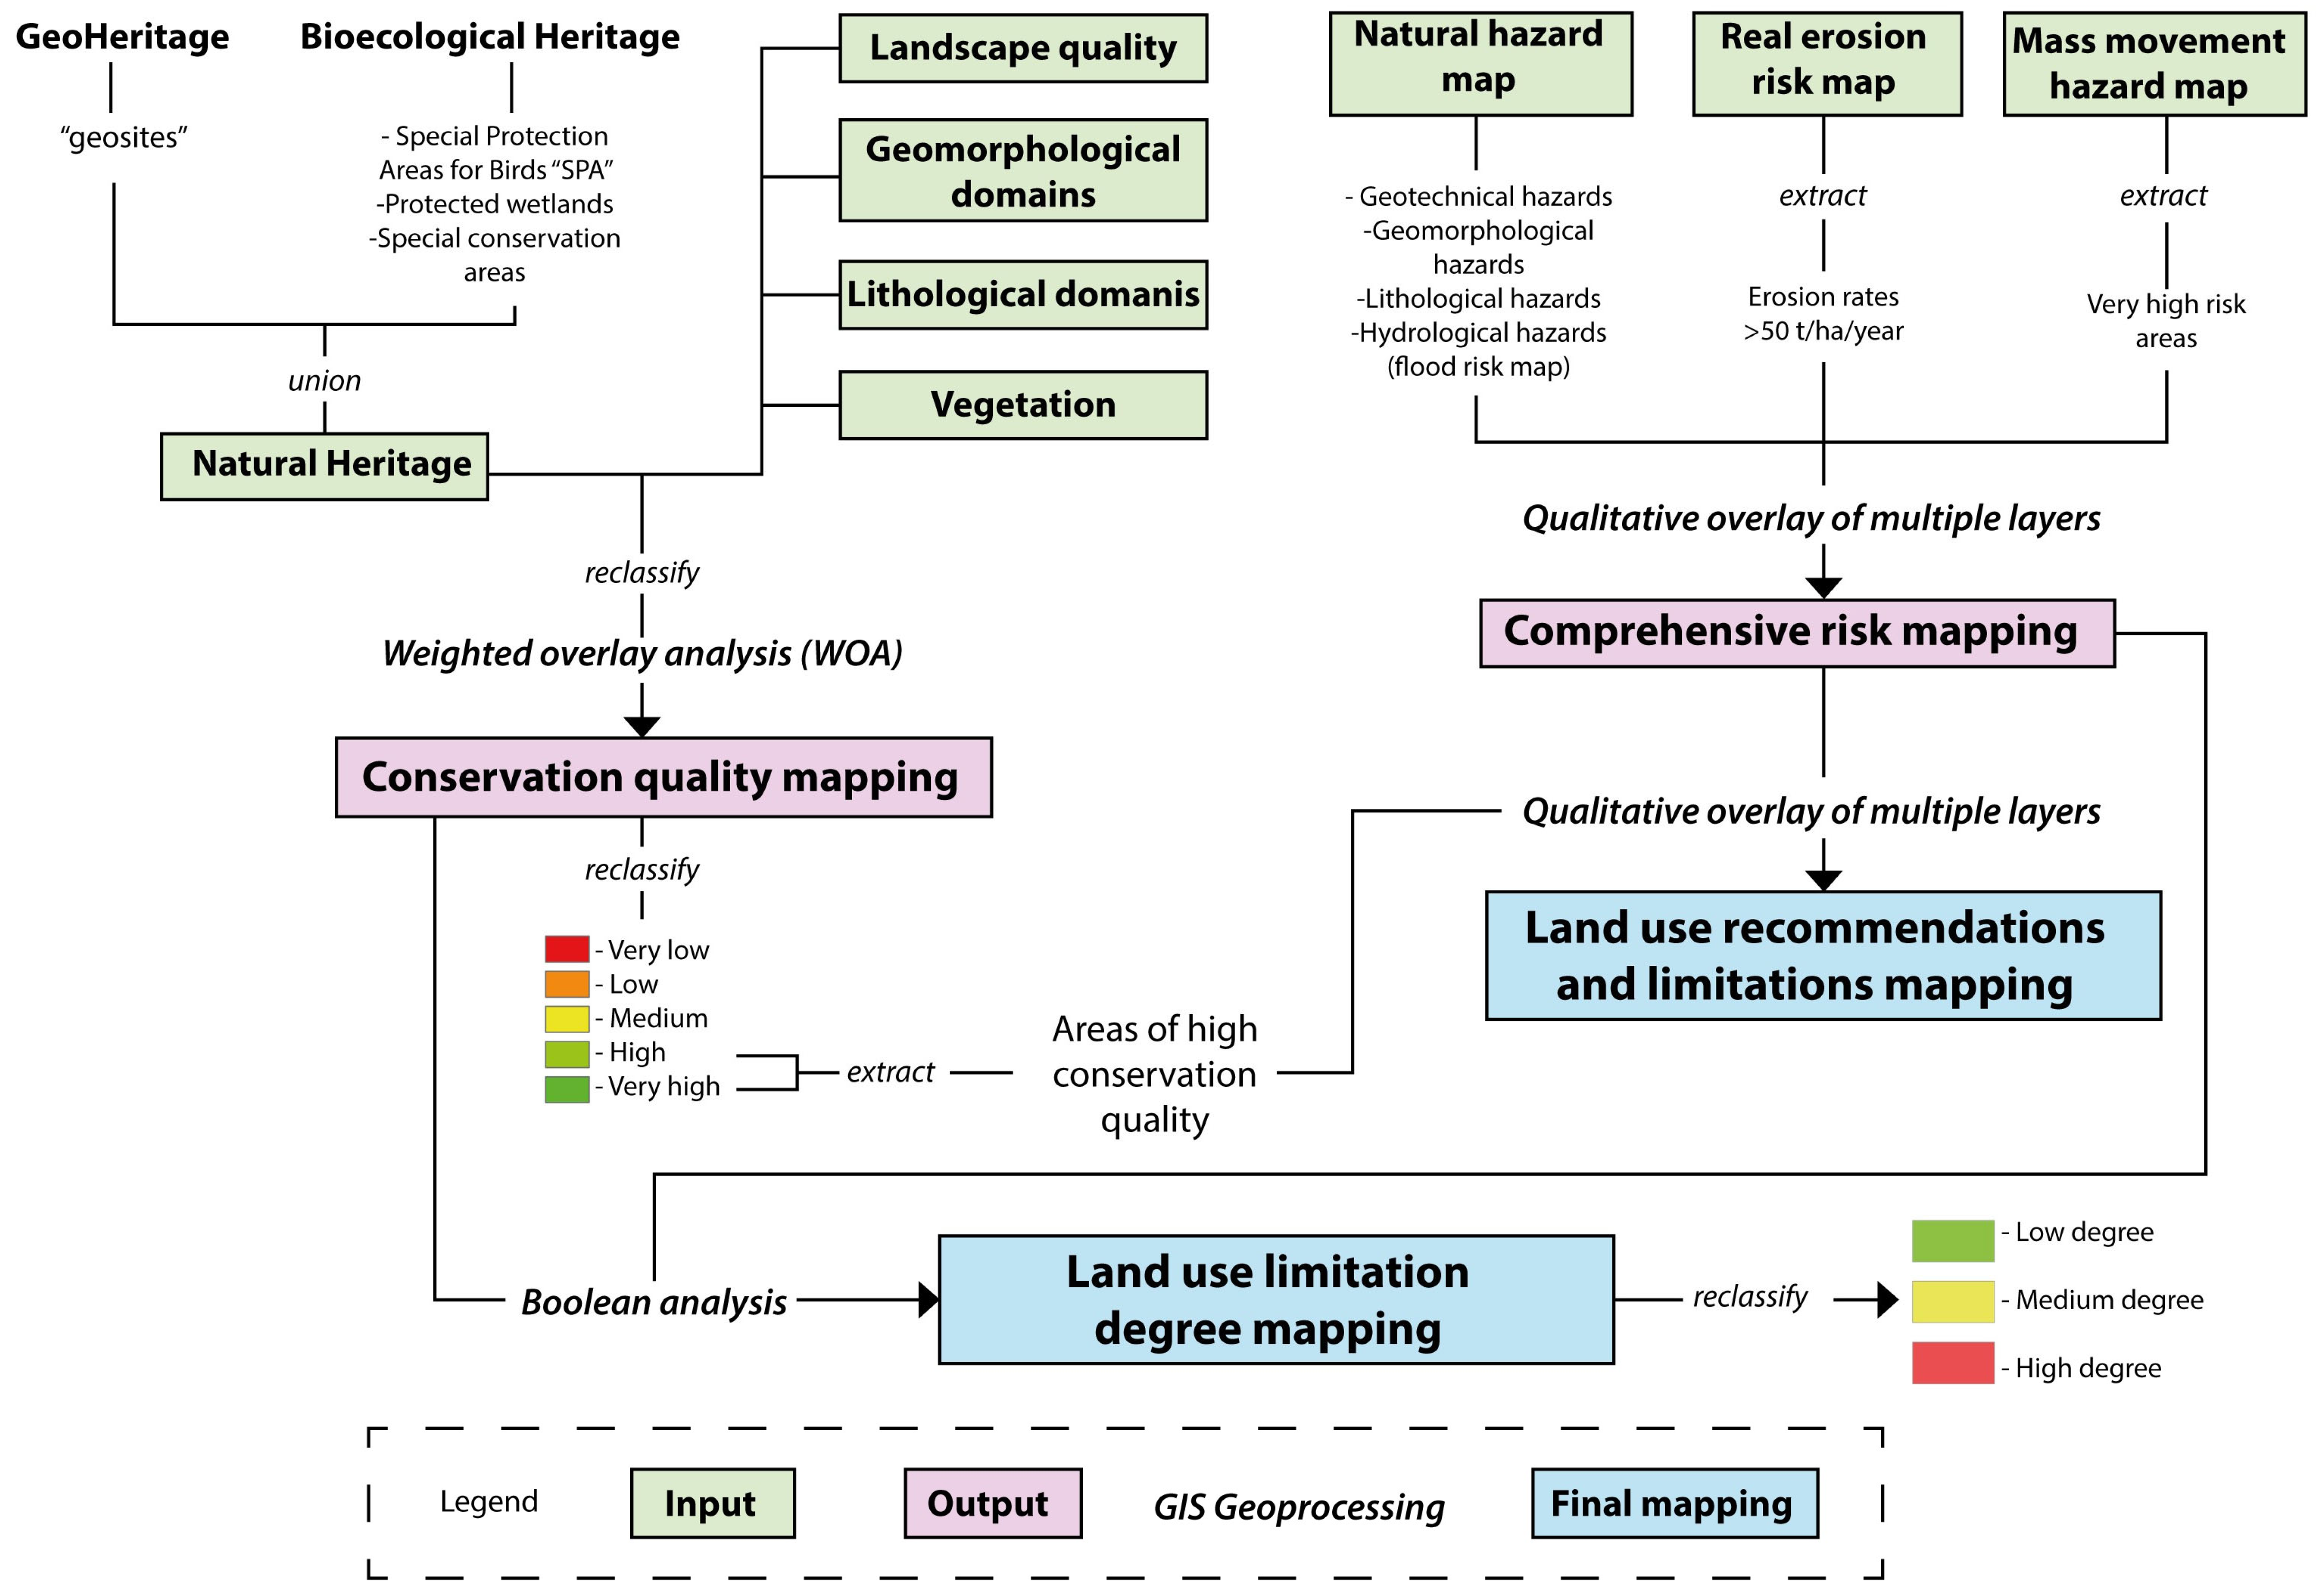
Subsequently, spatial analysis was performed using a Geographic Information System (GIS) (ArcGIS Pro 3.4.2 ©) (
Figure 2). This GIS methodology allows for the integration and overlay of the different thematic maps of the study area through spatial analysis techniques. It is based on a multi-criteria decision-making (MCDM) analysis through the combination of multiple layers of information, applying quantitative methods (Weighted Overlay Analysis—WOA) and qualitative methods (Qualitative Overlay Analysis—QOA) depending on the nature of the data.
By combining both cartographies, the land use recommendation and limitation mapping and the land use limitation degree mapping are produced. This methodological approach enables the development of a transparent and replicable process, facilitating its interpretation and application in various contexts. Its objective is to provide a clear and accessible tool for territorial planning, allowing the direct identification of priority areas for public agencies, environmental stakeholders, and the public, even for those without prior knowledge of environmental geology and geological hazard management.
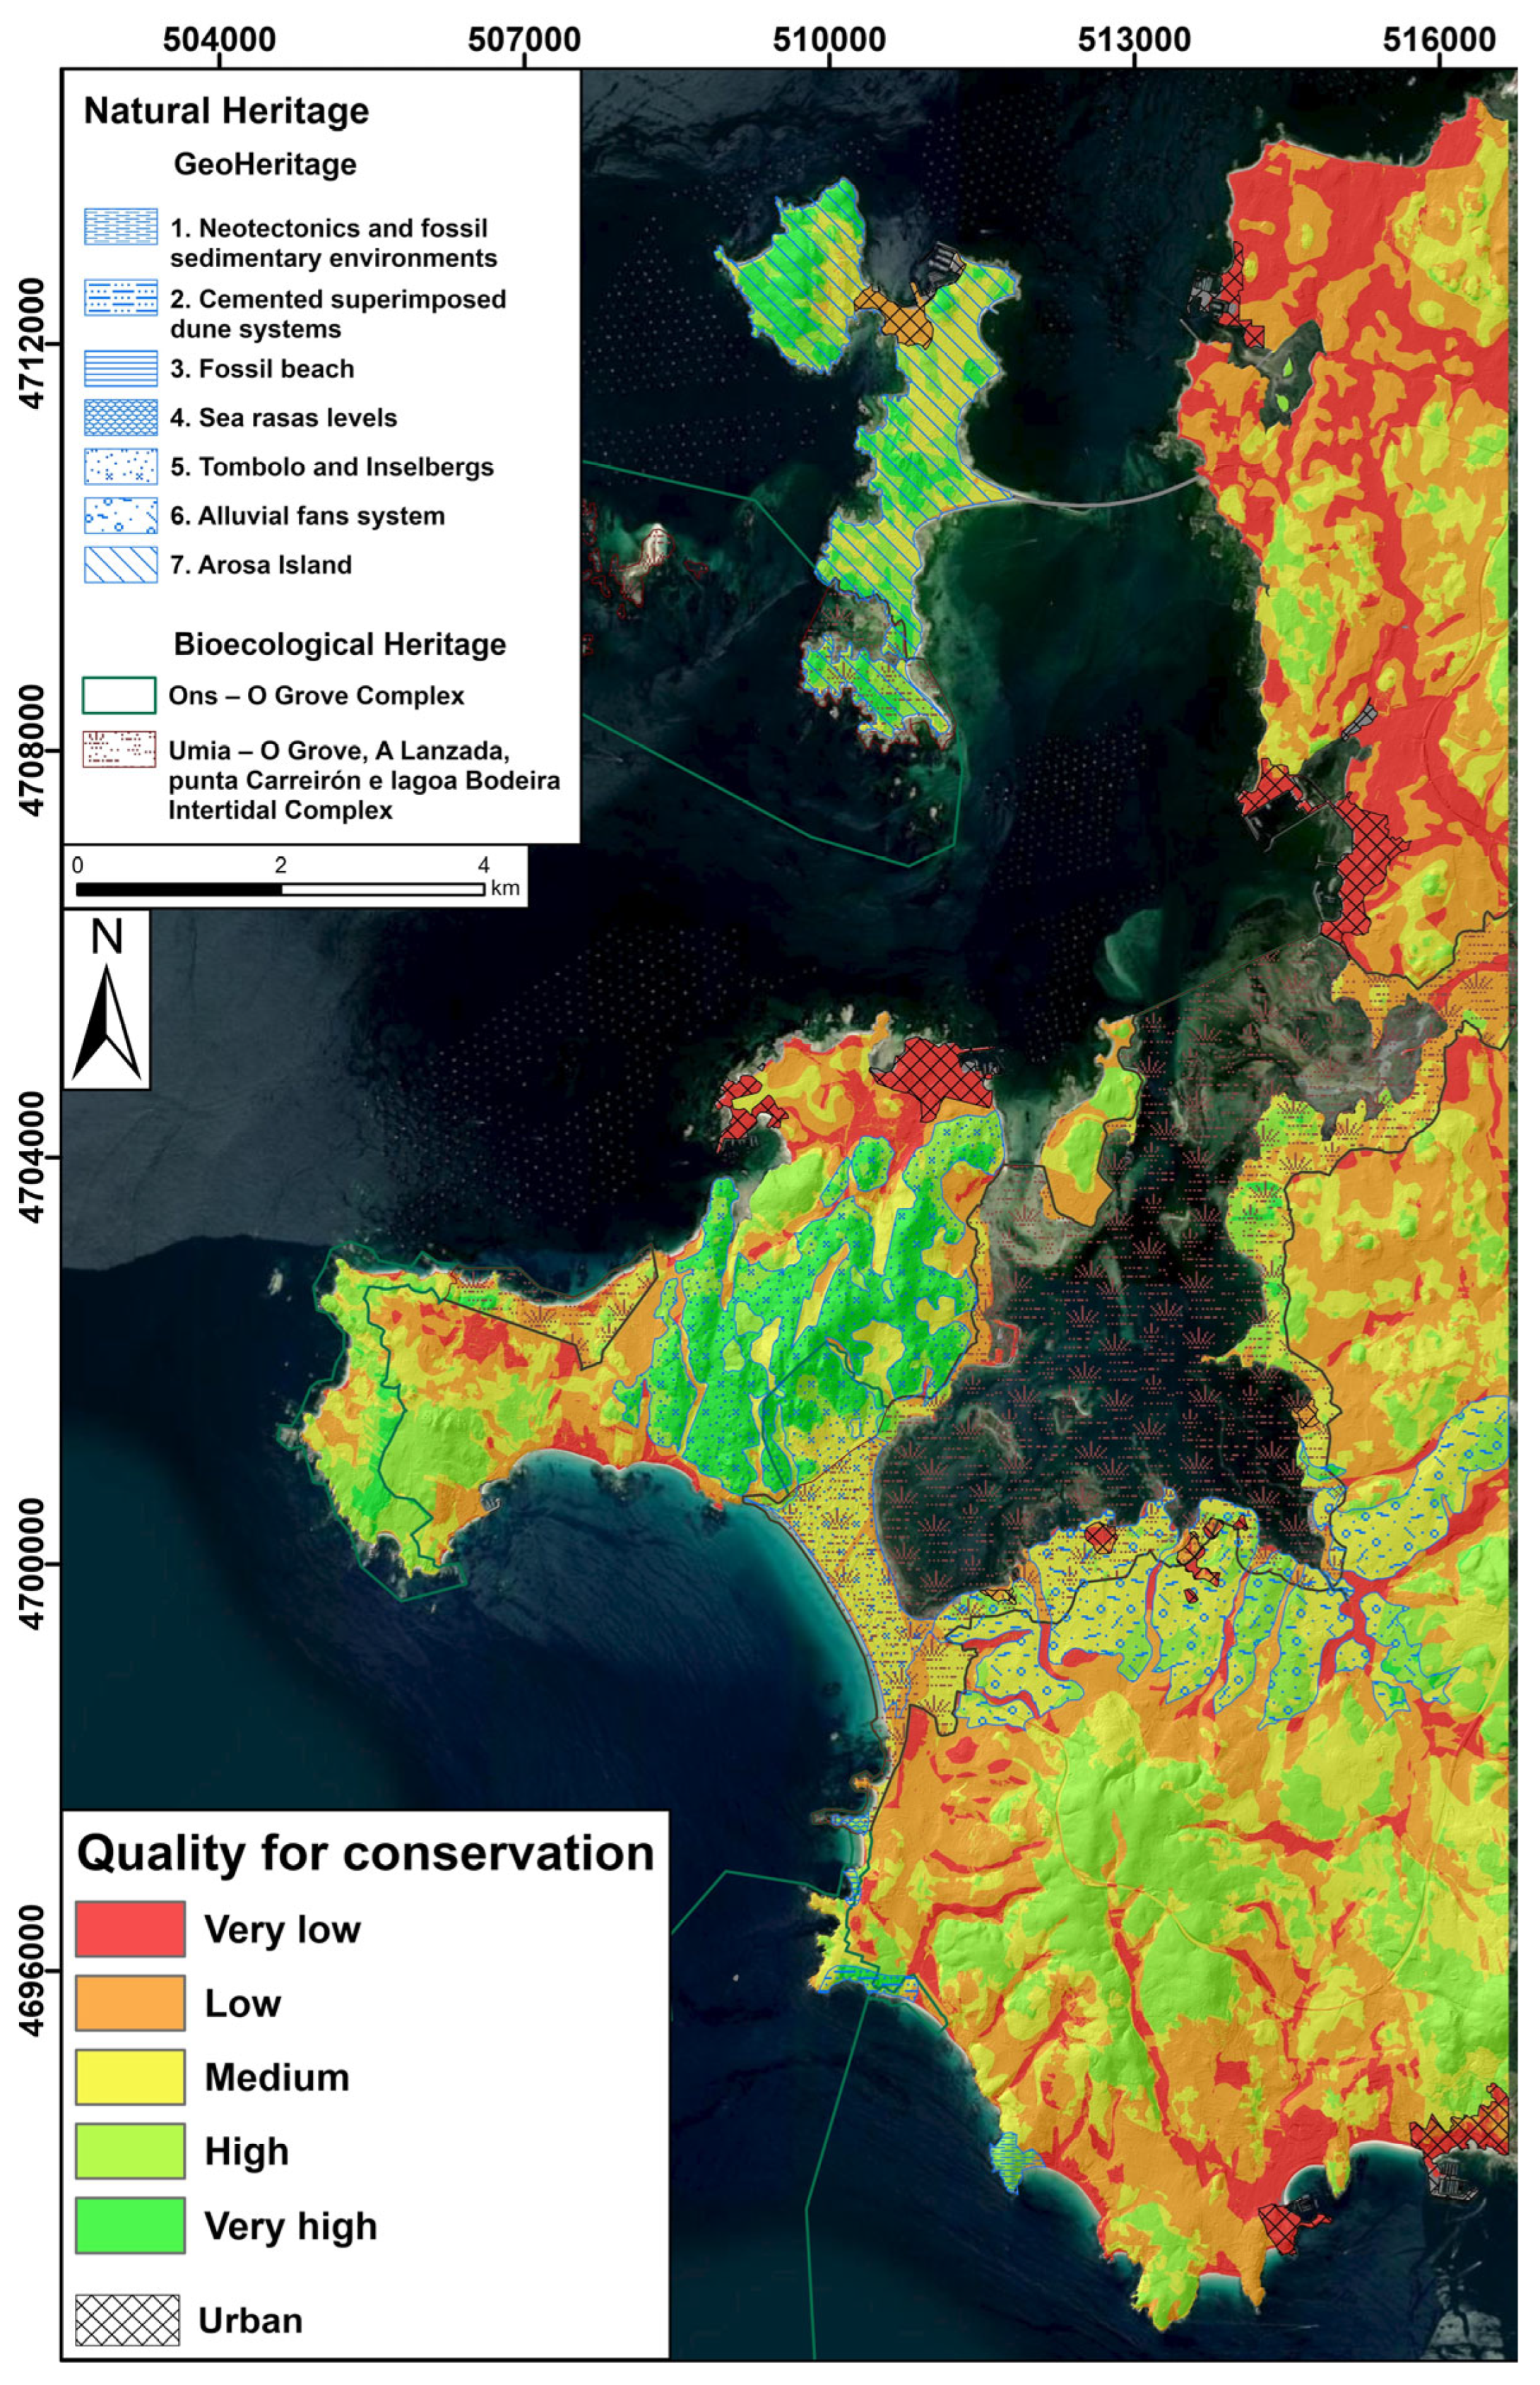
2.1. Conservation Quality Mapping
The high level of knowledge of the inherent factors of the physical environment—abiotic (lithology and geomorphology), biotic (vegetation), landscape, and natural heritage—allows the development of Conservation Quality Mapping (CQM). This process employs a Weighted Overlay Analysis (WOA) method, which assigns a rank to each attribute and a weight to each factor according to its relevance, based on its uniqueness in the territory. This evaluation considers characteristics such as visual perception, naturalness, and heritage rank, which are closely related to the territory’s ability to absorb impacts.
- 1.
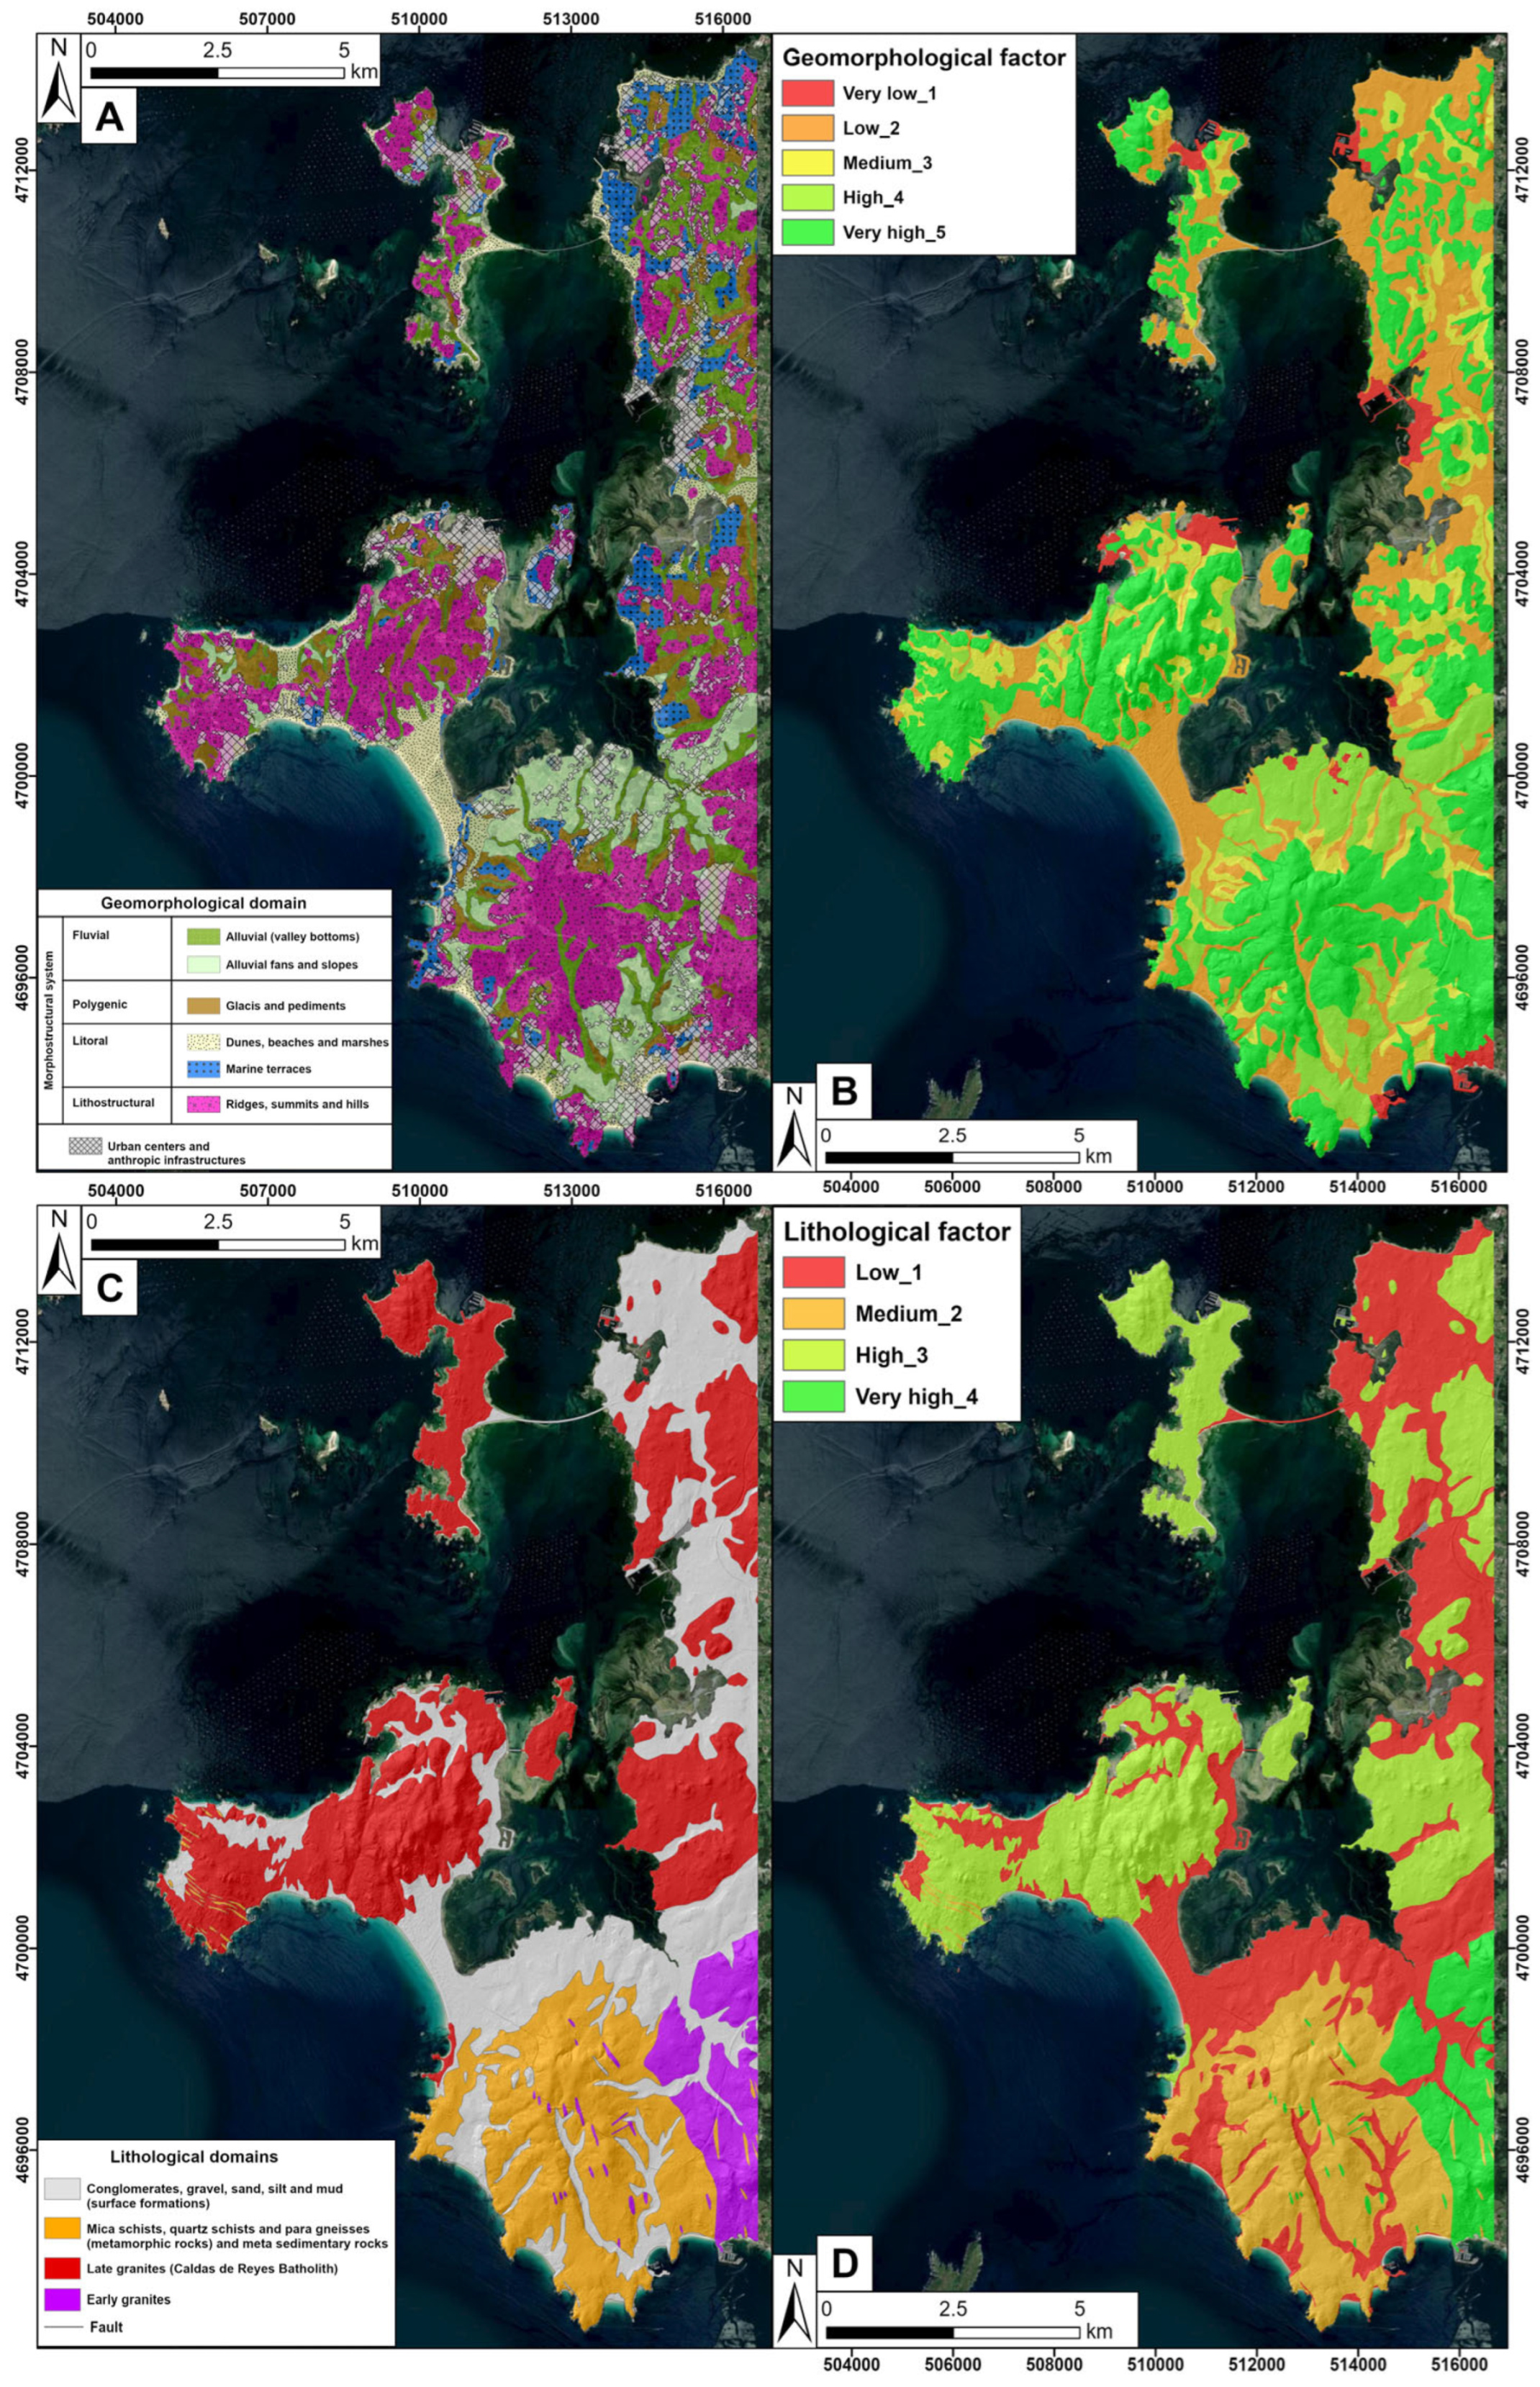
Conservation Quality of Geomorphological Domains: the geomorphological domains map simplifies the most representative morphological elements of the territory, facilitating the interpretation and manipulation of geoinformation [
46]. This simplification process of the geomorphological map allows for the generation of polygons that better define the terrain’s relief characteristics. Based on these polygons, a more precise evaluation of this physical parameter can be made (
Table 1).
Given the importance of geomorphology in shaping the landscape, this factor is considered one of the most significant when assessing conservation quality. The highest ranks are assigned to areas with greater topographic prominence, corresponding to summits, ridges, and hills where granite landforms such as domes or inselbergs are distinguished (rank 5). Areas with less pronounced topographic contrast receive lower conservation quality ranks. In the study area, the lowest ranks correspond to coastal morphogenetic system features (e.g., beaches, dunes, and marine terraces) (rank 2). Anthropized areas receive the lowest score, as no significant landforms are identified (rank 1).
Table 1.
Assessment of Geomorphological Domains for Conservation Quality.
Table 1.
Assessment of Geomorphological Domains for Conservation Quality.
| Geomorphological Domains | Weighting |
|---|
| Ridges, hills, inselbergs, and summits | 5 |
| Alluvial fans and slopes | 4 |
| Glacis and pediments | 3 |
| Marine terraces and surfaces | 2 |
| Dunes, beaches, marshes, and valley floors | 2 |
| Urban centres and anthropic infrastructures | 1 |
- 2.
Conservation Quality of Lithological Domains: the geological formations of the territory are evaluated based on their perceptual relevance (e.g., relief and colour) and intrinsic characteristics (e.g., shape and resistance). These formations are scored on a scale from 1 to 4 and assigned a weight of 4 (
Table 2), which is lower than the geomorphology factor due to its reduced influence on shaping the relief.
The highest ranks are given to granite lithologies, which are associated with the most representative granite landforms in the study area. Additionally, the chromatic and intrinsic characteristics (e.g., greater resistance to weathering) of early granitoids justify their maximum rank (4). Conversely, poorly consolidated or unconsolidated surface formations closely linked to the coastal morphostructural system receive the lowest rank (1) due to their minimal perception.
Table 2.
Assessment of Lithological Domains for Conservation Quality.
Table 2.
Assessment of Lithological Domains for Conservation Quality.
| Lithological Domains | Weighting |
|---|
| Early granites (enriched in feldspar phenocrysts) | 4 |
| Lete granites | 3 |
| Metamorphic rocks (slates and shales) | 2 |
| Conglomerates, gravel, sand, silt, and mud | 1 |
- 3.
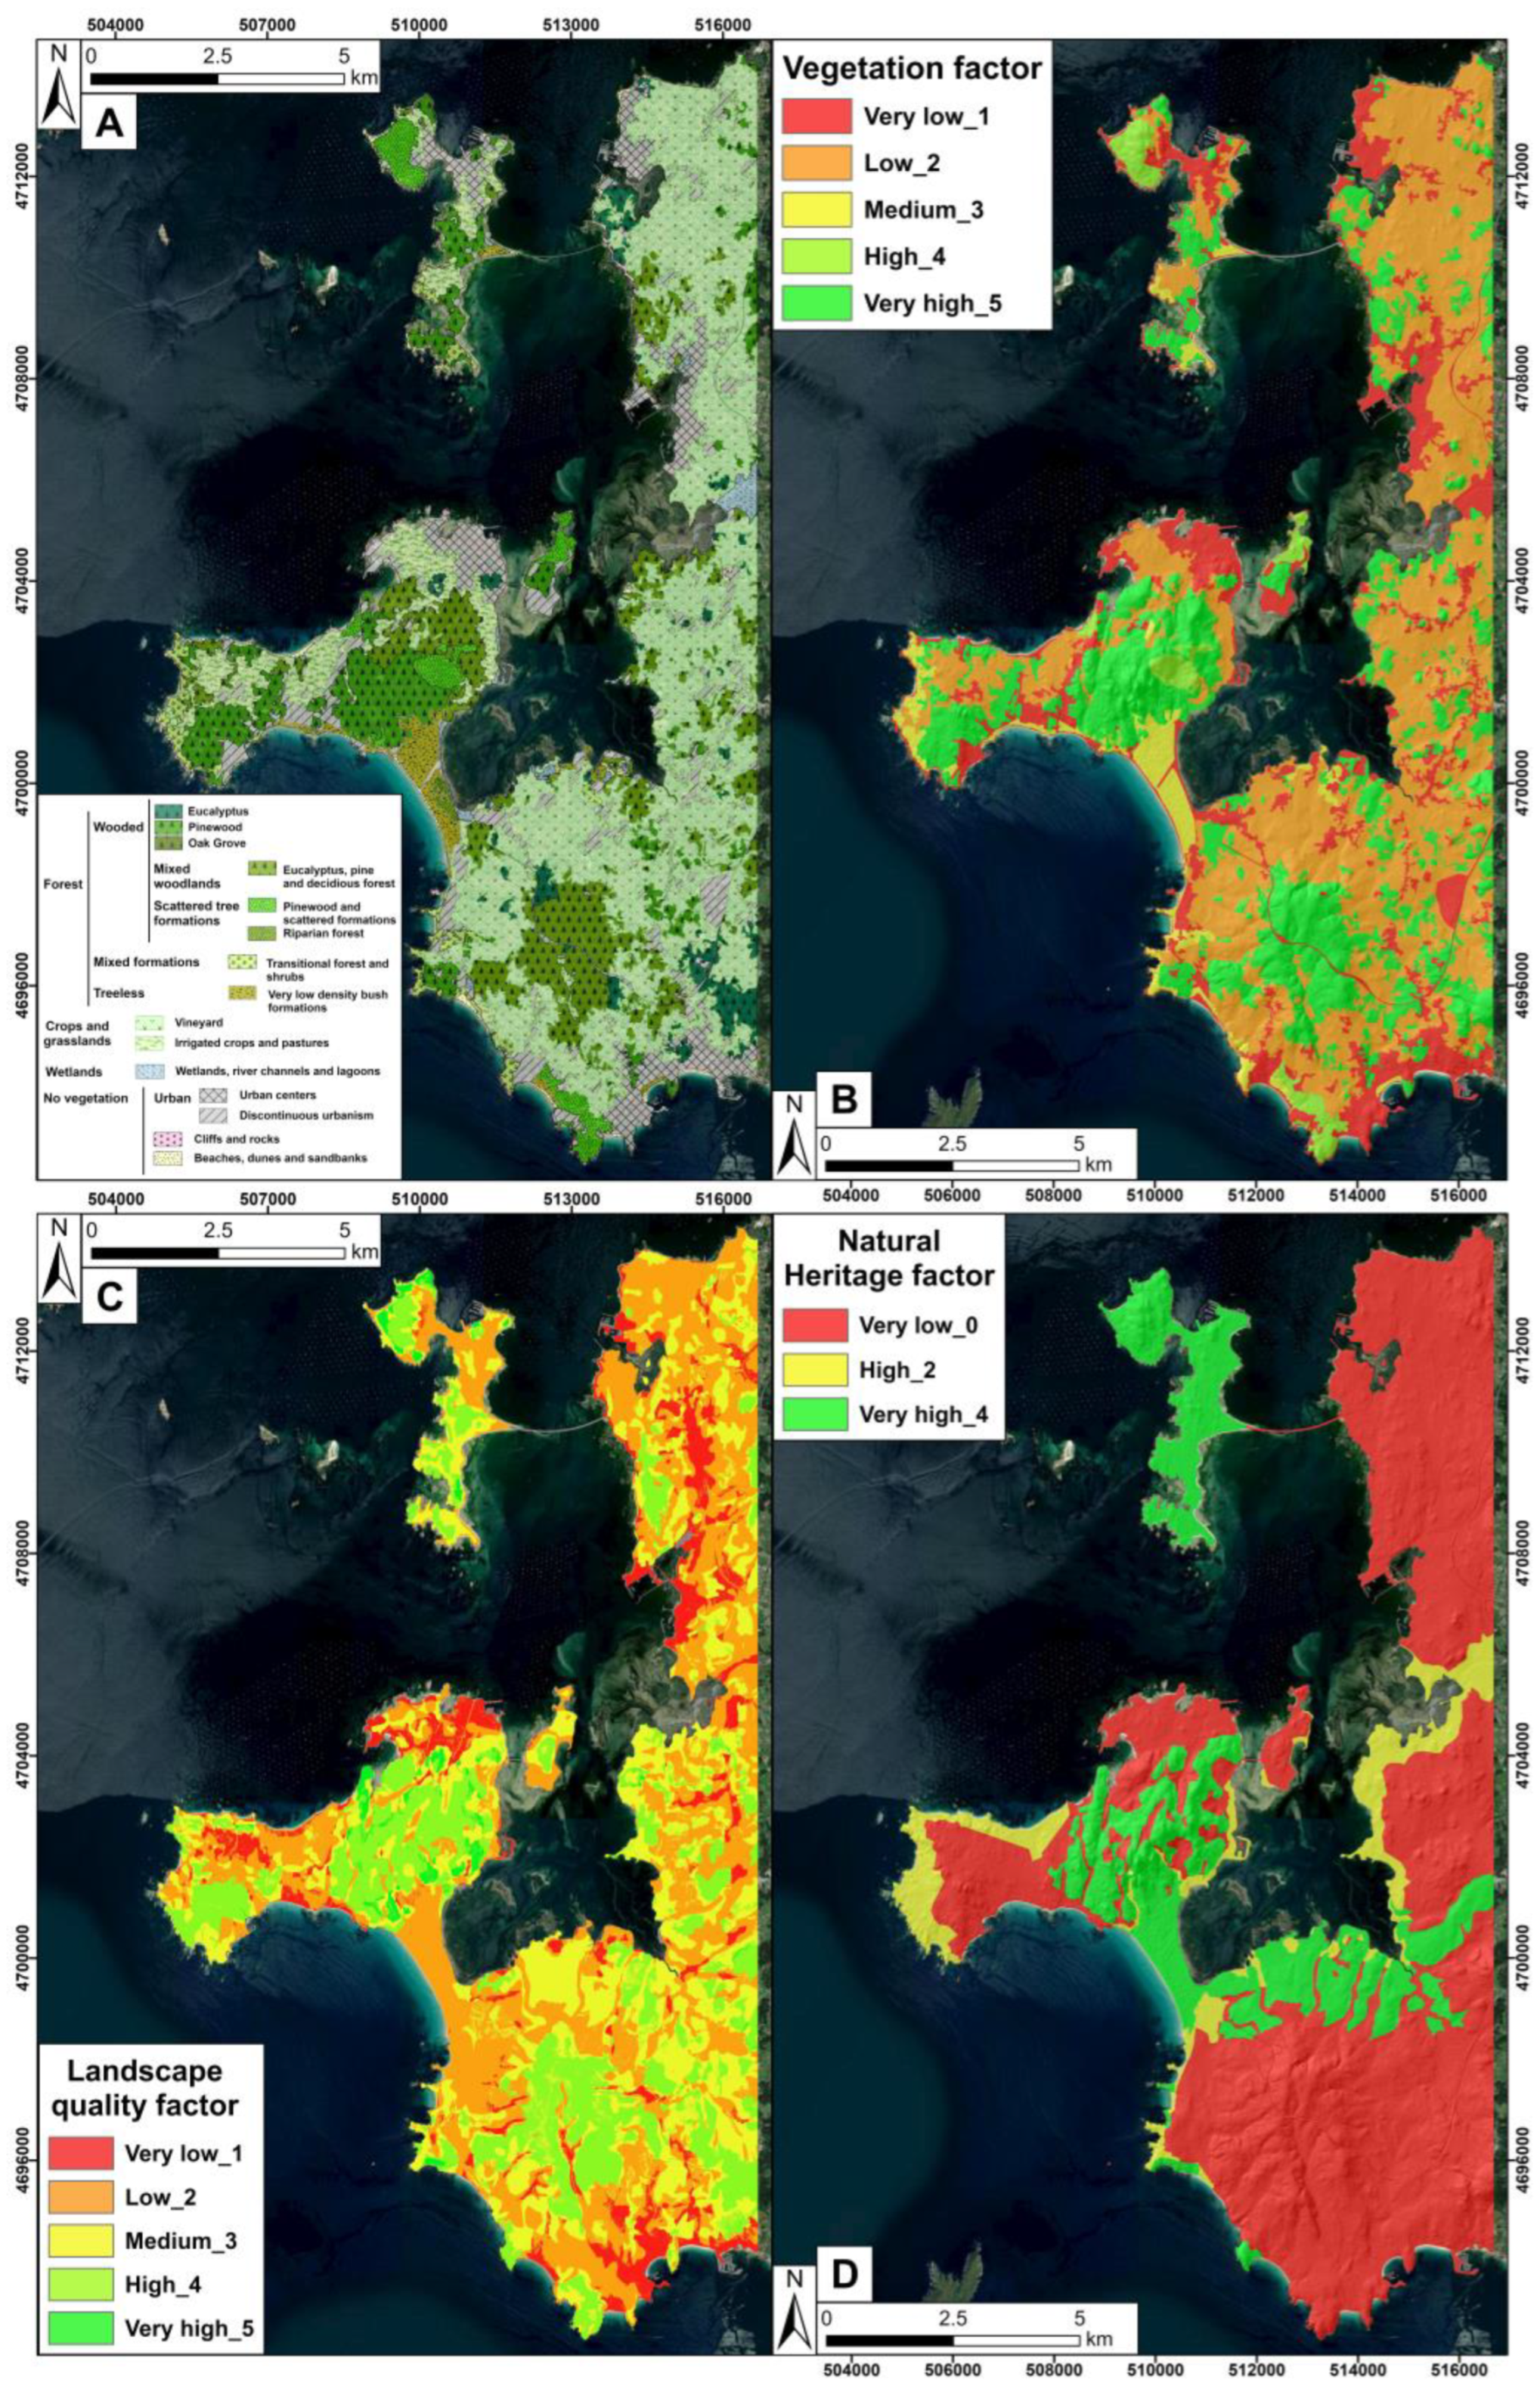
Vegetation Conservation Quality: vegetation is a key factor in environmental conservation (weight 5) and is closely linked to naturalness (landscape visibility), scientific significance, and environmental and socioeconomic importance. In this study, the ecological importance of each vegetation unit is derived from the Spanish Forest Map (1:50,000 scale) (
https://www.miteco.gob.es/es/biodiversidad/servicios/banco-datos-naturaleza/informacion-disponible/mfe50.html, accessed on 15 March 2025). This ecological importance is assessed based on two primary aspects: species composition and vegetation structure.
- a.
The specific composition of the plant quality factor is studied based on two subfactors: plant grouping and plant diversity. The plant grouping of the plots is classified according to the type of formation: tree, shrub, mixed, or non-vegetated (
Table 3). Diversity is assessed based on the greater or lesser number of plant species found in each plot (
Table 4).
- b.
Vegetation structure measures the plant density of each plot or the number of elements found within it. It is assessed based on the percentage of vegetation cover (FCC) (
Table 5). The stratification or vertical structure of a plot is measured based on the visual impact of each plot (
Table 6).
To obtain the Vegetation Conservation Quality (VCQ) result, a Weighted Overlay Analysis (WOA) is used for these four subfactors (Equation (1)):
The results are reclassified into five groups and scored from 1 to 5 based on their lowest or highest quality (
Table 7).
Table 3.
Assessment of the Plant Grouping for the Vegetation Quality Factor.
Table 3.
Assessment of the Plant Grouping for the Vegetation Quality Factor.
| Plant Grouping | Weighting |
|---|
| Tree formations | 5 |
| Bush or shrub formations | 4 |
| Subshrub formations | 3 |
| Grasslands, crops, and fallow | 2 |
| Not vegetated | 0 |
Table 4.
Assessment of plant diversity for the Vegetation Quality Factor.
Table 4.
Assessment of plant diversity for the Vegetation Quality Factor.
| Plant Diversity | Weighting |
|---|
| 3 plant species | 4 |
| 2 plant species | 3 |
| 1 plant specie | 2 |
| No plant species | 0 |
Table 5.
Assessment of plant density for the Vegetation Quality Factor.
Table 5.
Assessment of plant density for the Vegetation Quality Factor.
Table 6.
Assessment of plant stratification for the Vegetation Quality Factor.
Table 6.
Assessment of plant stratification for the Vegetation Quality Factor.
| Plant Stratification | Weighting |
|---|
| Woody strata (Tree formations) | 4 |
| Shrub strata (Shrub and subshrub formations) | 3 |
| Herbaceous strata (Grasslands, crops, and fallow) | 2 |
| Not vegetated | 0 |
Table 7.
Assessment of the vegetation factor for Conservation Quality.
Table 7.
Assessment of the vegetation factor for Conservation Quality.
| Vegetation Factor | Weighting |
|---|
| Very High | 5 |
| High | 4 |
| Medium | 3 |
| Low | 2 |
| Very Low | 1 |
- 4.
The landscape quality map is the result of a Weighted Overlay Analysis (WOA) process, which combines, through weighted summation, the information represented in multiple inherent layers of the biotic and abiotic physical environment (factors) to obtain a concrete result. It is generated from the combination of intrinsic and extrinsic quality maps and then reclassifies the results into five ranges from very low to very high [
20] (
Table 8).
- 5.
Natural Heritage Conservation Quality: the bioecological heritage of the area is represented by a Special Protection Area for Birds (SPA) (Complexo Intermareal Umia-O Grove) and a Special Area of Conservation (SAC) (Complexo Ons-O Grove), both designated under the Natura 2000 Network. The geological heritage consists of seven geosites [
19], which have been evaluated based on their scientific, educational, and touristic attributes [
47]. Areas containing geosites are assigned to a rank of 4, as they represent locations of high significance and unique landscape features. Protected natural areas are assigned a rank of 2, as they represent high ecological significance zones. However, in the study area, these correspond to coastal zones with low topographic prominence (
Table 9).
The Weighted Overlay Analysis (WOA) of these various factors allows the identification of areas with significant natural relevance that should be recognized as priority zones for protection, geoconservation, monitoring, or rehabilitation (Equation (2)). This last intervention is only considered when active methods are required [
48,
49,
50,
51]. The resulting map is reclassified into five classes, ranging from very low to very high conservation quality.
Table 9.
Assessment of the natural heritage factor for conservation quality.
Table 9.
Assessment of the natural heritage factor for conservation quality.
| Natural Heritage | Weighting |
|---|
| GeoHeritage (geosites) | 4 |
| Biological Heritage (ZEPA and ZEC) | 2 |
| Other zones | 0 |
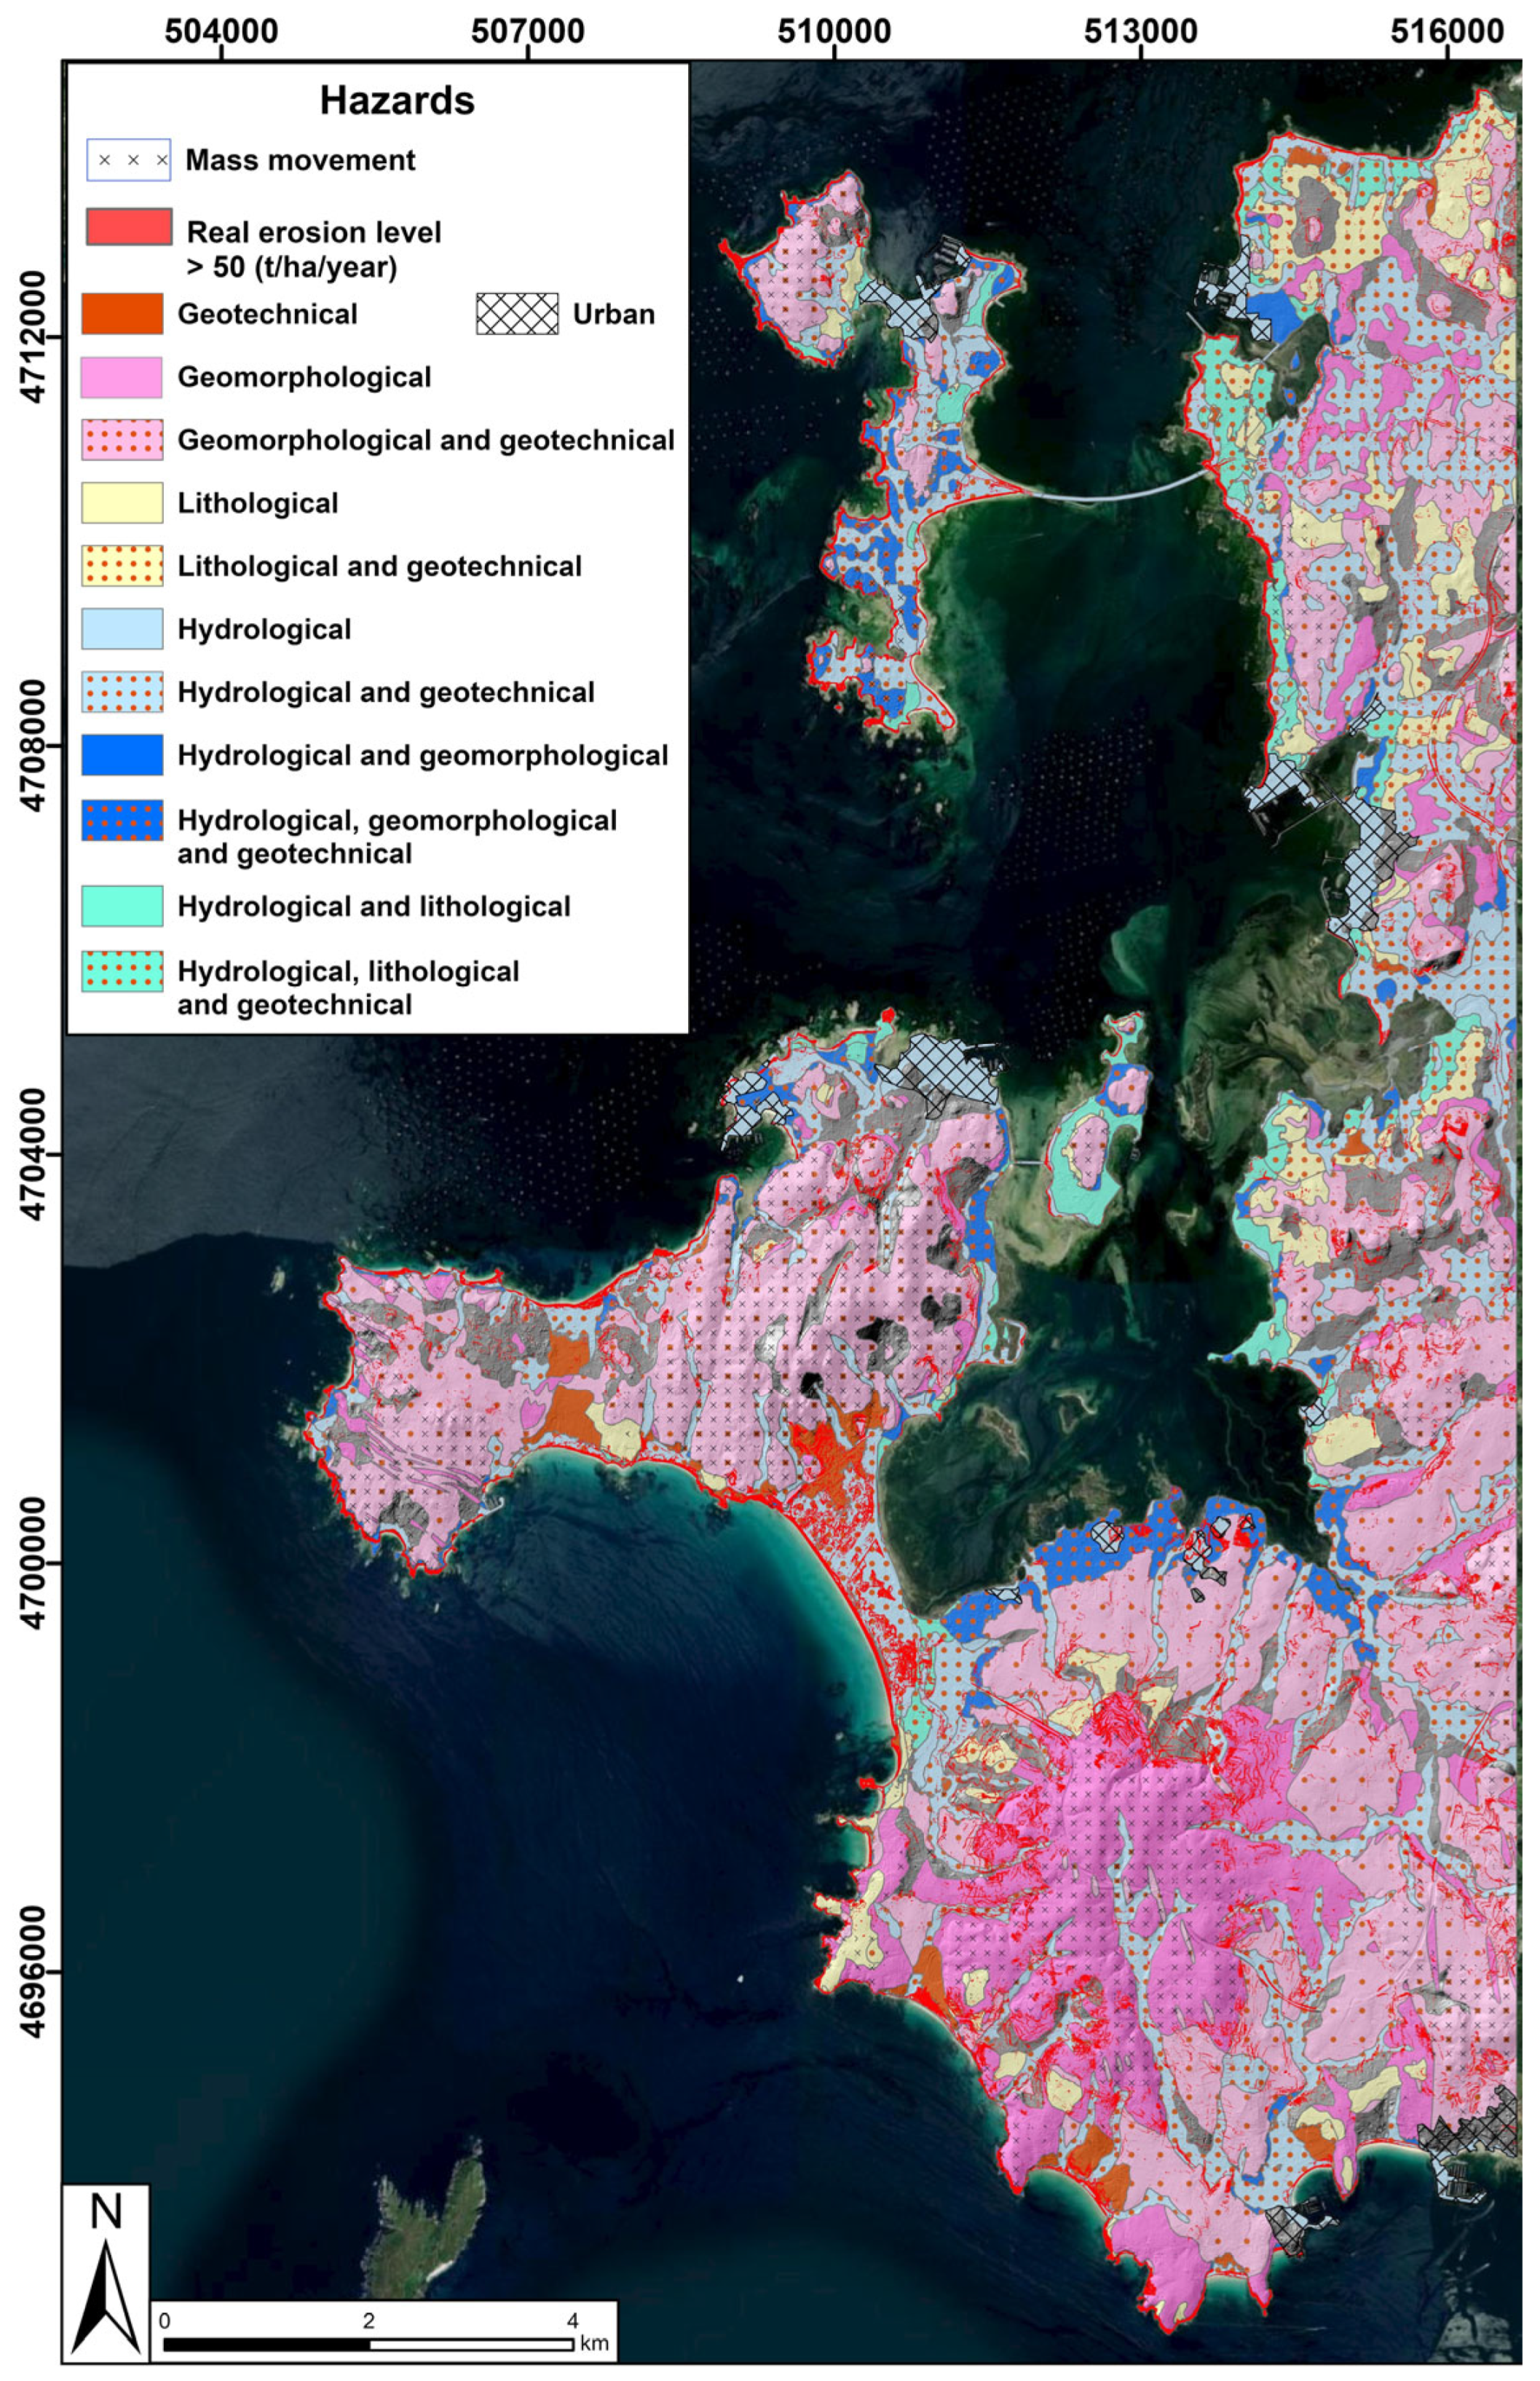
2.2. Comprehensive Risk Mapping
The detailed work carried out in the study area concerning the recognition of active processes, as well as the analysis of vulnerability and/or hazards related to a specific natural risk, has separately allowed for the identification of locations with the highest probability of occurrence of these phenomena. The purpose of the comprehensive risk mapping is to combine, through qualitative overlay, all the layers encompassing the different analyzed natural hazards and to display, using patterns and colours, the areas most affected by these risks. This way, it becomes possible to recognize areas with a high potential for socioeconomic losses and, more importantly, for loss of human lives. The mappings that are overlaid here include: coastal flooding risk mapping, real erosion risk mapping, mass movement risk mapping, and finally, natural hazard mapping [
52,
53,
54,
55].
2.2.1. Flood Risk Map
The results obtained in the study area are represented through the Flood Hazard Index (FHI) [
56]. This analysis considered parameters, such as significant wave height (Fw), sea level change (Fsl), and the extreme tide range (Ftr), to estimate the hazard of flooding in different scenarios [
56]. In this case, scenarios with a return period of twenty-five years (‘Xa’) and one hundred years (‘Xb’) are considered, which generate very high and high risk [
52].
2.2.2. Real Erosion Risk Map
The real soil erosion map of the SE of the Ría de Arosa was created using the Revised Universal Soil Loss Equation (RUSLE) [
57,
58]. To calculate the rates of real erosion, values for rainfall erosivity (R-Factor), soil erodibility (K-Factor), slope length and steepness (LS-Factor), ground cover (C-Factor), and conservation practices (P-Factor) were used. Values above 50 t/ha/year (>3.85 mm/year) for soil loss (>high) [
54] are extracted and used in comprehensive risk mapping.
2.2.3. Mass Movement Hazard Map
The risk from mass movements was assessed according to the guidelines established by the United Nations Office for Disaster Risk Reduction (UNDRR) [
59]. The mass movement hazard map is generated through a combination matrix of the susceptibility map and the triggering values of the processes (rainfall and seismic). Susceptibility is the result of a bivariate statistical process [
60,
61] that combines inherent terrain elements with historically generated mass movements in the region. This results in a quantitative predictive model of the spatial probability of a region experiencing rock, debris, or soil displacement [
62].
The evaluation of the surfaces is closely related to the geological, geomorphological, and land use characteristics of the studied area. For the triggering factors’ data, rainfall data are first taken from the model of the Centre for Studies and Experimentation of Public Works (CEDEX) regarding the impact of climate change on maximum precipitation in Spain (2021–2022) [
63]. For seismic triggers, values from the Seismic Hazard Map of Spain (2015) are used, which provide maximum ground acceleration (PGA) data with a return period of 475 years [
64].
These values were classified into four hazard categories (low to very high), focusing on the areas with the highest hazard range for this study [
53].
2.2.4. Natural Hazard Map
The last map used is the natural hazard map [
50]. This map combines lithological, geomorphological, geotechnical, and hydrological criteria. It is based on the prior creation of the geotechnical characterization map, which allows for a relationship between this mapping and the construction capabilities of the area [
55]. This map shares similarities with the comprehensive risk mapping, as it sectorial represents the areas where one or more possible external geodynamic processes responsible for generating these potential natural hazards are recognized [
55].
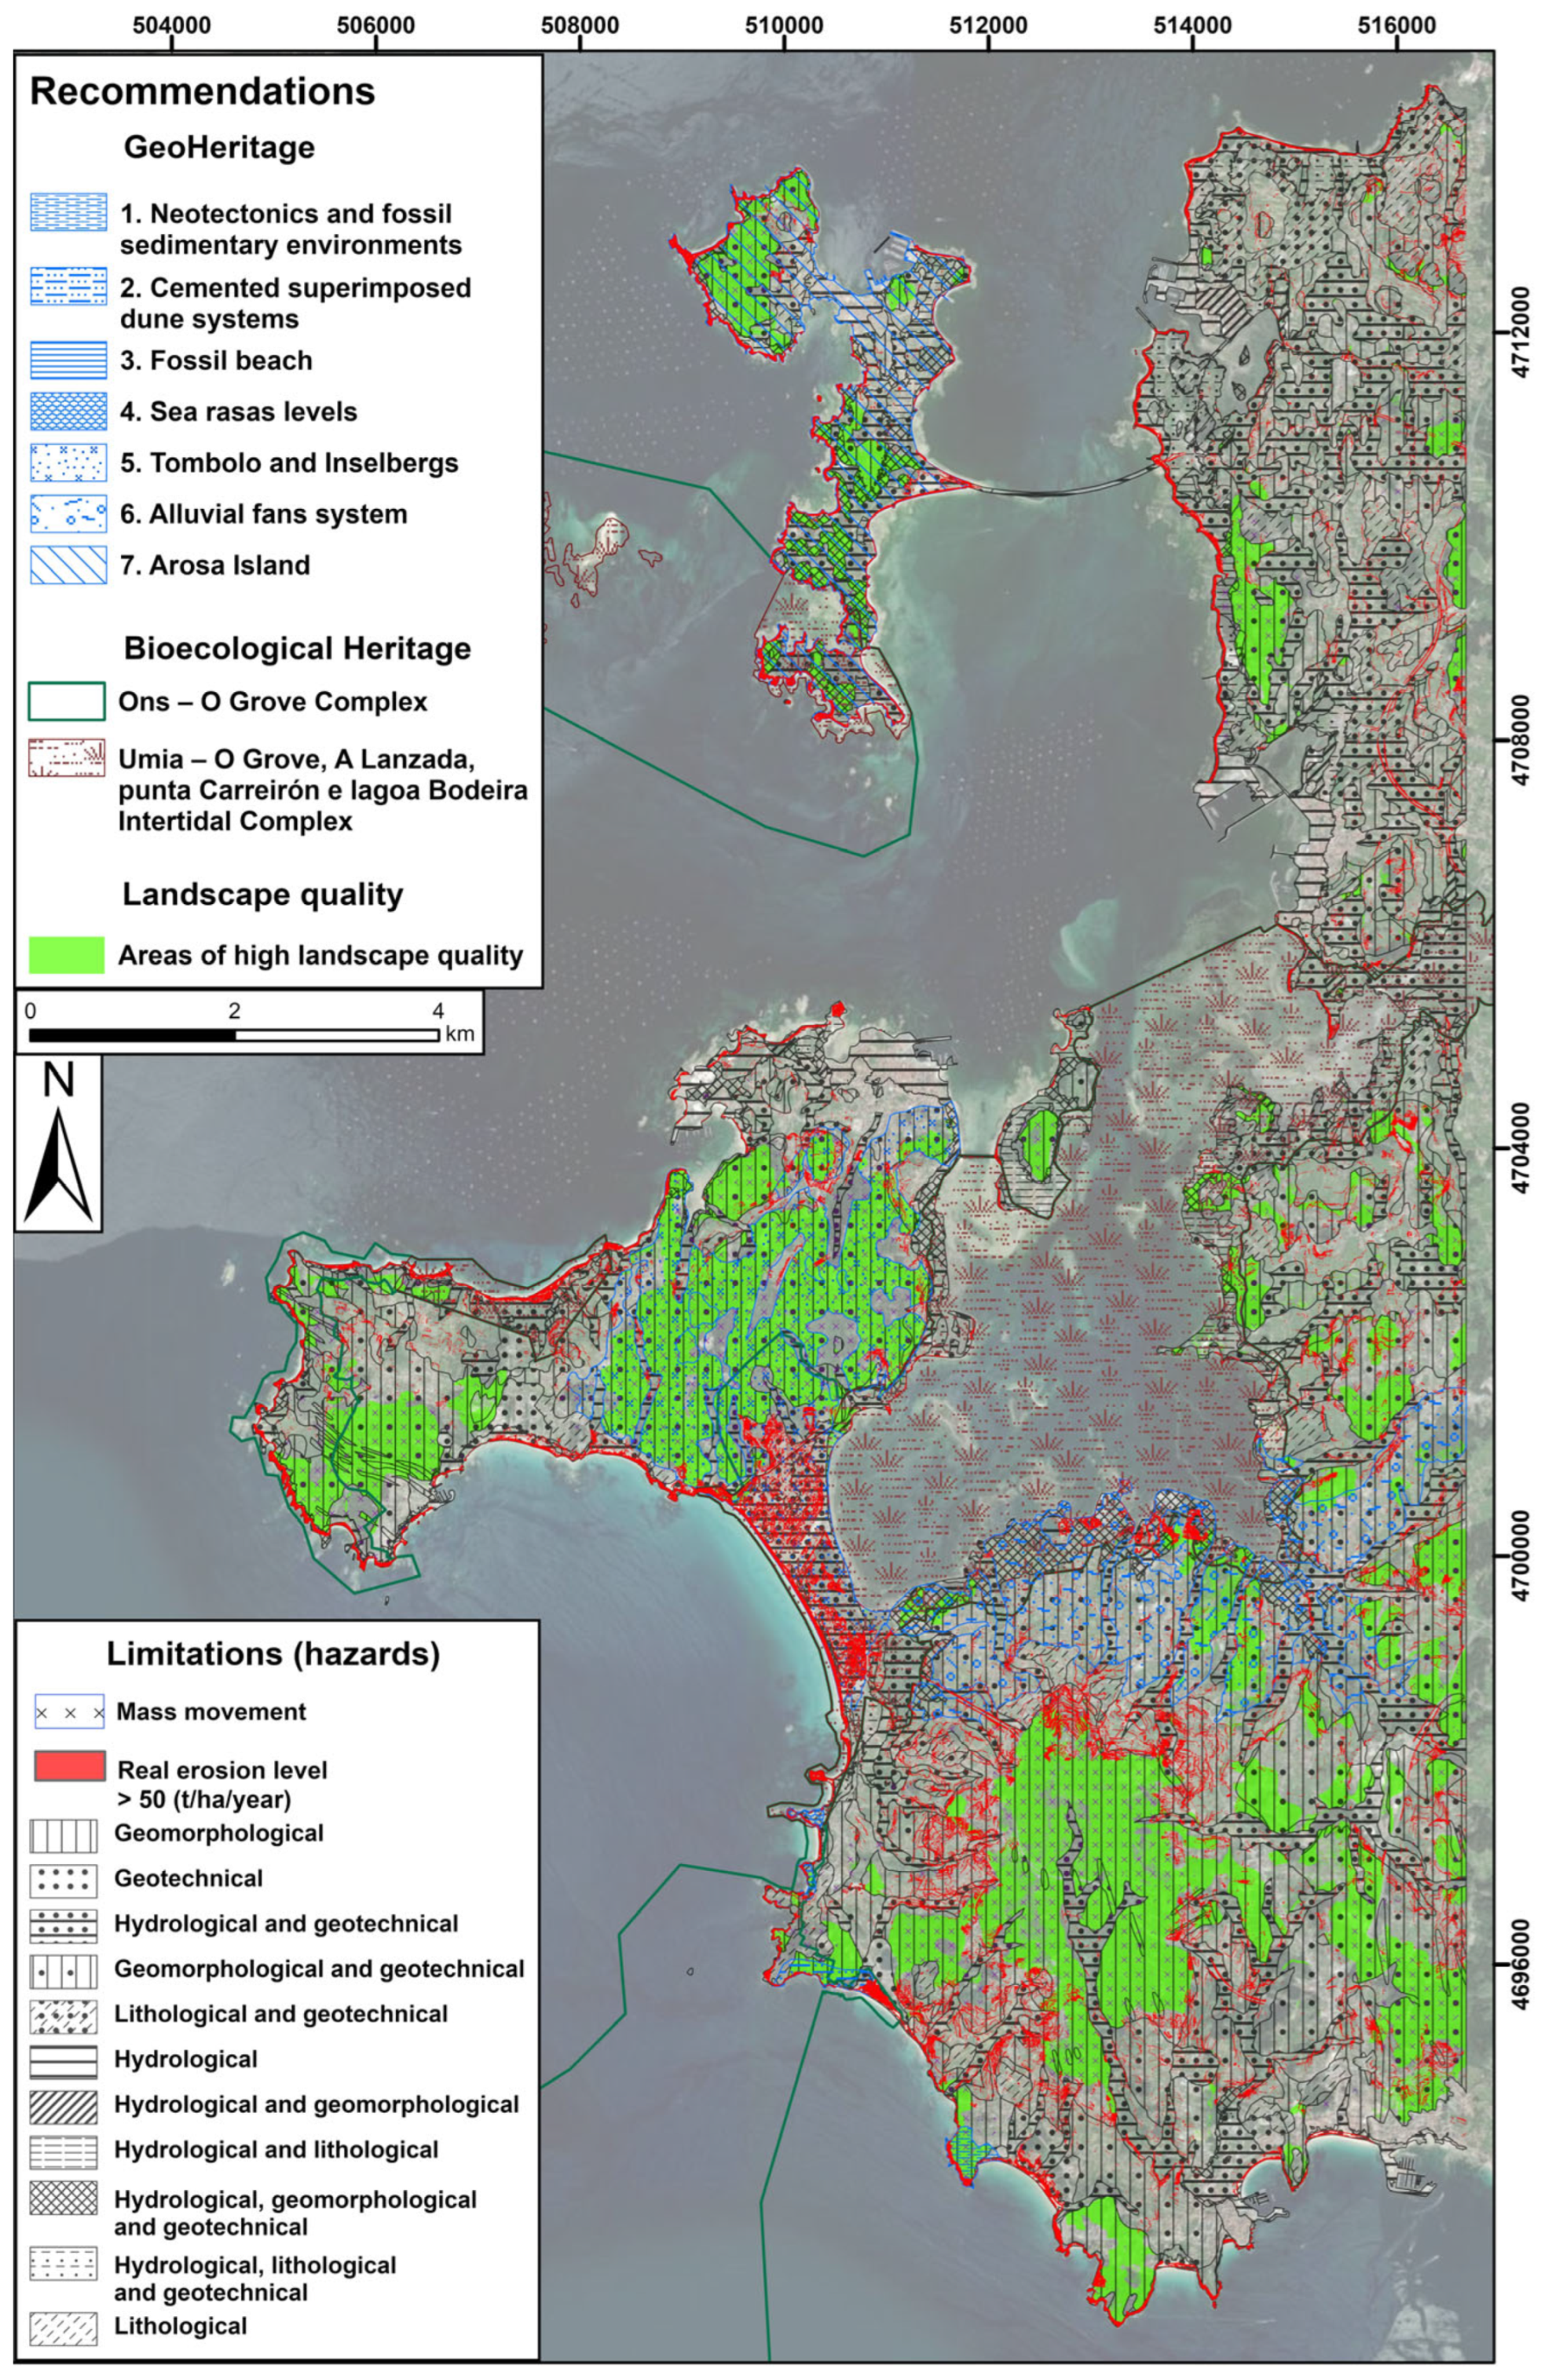
2.3. Land Use Recommendations and Limitations Mapping
Finally, both mappings (conservation quality mapping and comprehensive risk mapping), through qualitative overlay, allow for the joint recognition of areas where high conservation priority exist, where one or more possible geological hazards act, and where both combine. Green shades are used to highlight areas of high landscape quality, while different patterns in different colours (black, purple, or red) are applied to indicate geological hazards. This is all done to facilitate the reading of the final mapping.
2.4. Land Use Limitation Degree Mapping
Once the land use recommendations and limitations mapping are completed, the next objective is to determine the degree of territorial limitation based on the overlap of the two layers that comprise it. For this purpose, the land use limitation degree mapping is generated for the southeastern margin of the Ría de Arosa. This process involves a Boolean analysis through data combination geoprocessing based on specific conditions of the study area [
21].
The goal of this method is to identify areas with high and very high conservation quality where natural hazards have also been detected. Both layers are reclassified to be treated as categorical layers, allowing the application of Boolean operations [
21].
The following combination matrix shows the values assigned to areas that meet the predefined criteria: 1 for areas with high or very high conservation quality, 0 for areas without high or very high conservation quality, 1 for areas with natural hazard presence, and 0 for areas without natural hazard presence (
Table 10). This layer overlap results in a total of four different scenarios: 1-1, 1-0, 0-1, and 0-0.
The first scenario represents areas where high and very high conservation quality (1) and natural hazard presence (1) are identified. Using the Raster Calculator, the intersection of both layers is performed, and areas where the resulting value is equal to 2 are extracted. These areas are reclassified as high land-use limitation zones.
To identify areas where there is a natural hazard presence (1) but no high or very high conservation quality (0), the Raster Calculator is used to perform the intersection, assigning a “0” value to the conservation quality layer (“quality_file” == 0). Similarly, to obtain areas with high and very high conservation quality (1) but no natural hazard presence (0), the same procedure is applied by assigning a “0” value to the hazard layer (“hazards_file” == 0). These areas represent the medium land-use limitation degree.
Finally, low land-use limitation zones are identified by extracting areas where the intersection of both layers (“quality_file” and “hazards_file”) is equal to 0, indicating that no areas of high and very high conservation quality (0) or natural hazard presence (0) have been detected.
4. Conclusions
The multi-criteria decision-making analysis carried out on the southeastern margin of the Arosa Estuary, using the GIS techniques WOA, QOA, and a Boolean analysis with a combination matrix, has allowed the different layers of the conservation quality mapping to be linked with the comprehensive risk mapping. Thanks to this methodology, it has been possible to identify priority areas for conservation and those with significant restrictions due to natural risks. This methodological approach has facilitated effective modelling that is of high resolution, easy to update, and quick to implement. For these reasons, it can be considered a valuable tool that can be applied in various contexts and future environmental studies focused on sustainable territorial planning and the conservation of natural resources.
The areas of high conservation quality stand out as places to implement actions focused on recreational activities. Areas of special natural significance, such as the Island of Arosa or the inland and coastal zones of the El Grove and Castrove Peninsulas, are ideal for developing recreational areas such as swimming zones, resting places, picnic areas, and, where natural risks are not so high, campsites or interpretation centres. Implementing geotourism as a general tool for promoting the territory is a technique that has been developed in recent years and has been effective from the standpoint of social awareness and the maintenance of geologically interesting sites [
19,
49].
On the other hand, areas that present better conditions for the development of anthropogenic activities, such as agriculture, industry, or urban development, are associated with territories of low ecological and scenic importance and a lower propensity for natural risks. The inland corridor located in the northeastern coastal margin, which connects the municipality of Villanueva de Arosa with Cambados and extends to the marshland influence area at the mouth of the Umia River, is the most favourable territory for the development of anthropogenic activities.
The results obtained through this methodology have enabled the development of land use recommendation and limitation mapping that clearly and at high resolution integrate environmental, conservation, and risk-related criteria. This tool has proven to be highly useful in early planning phases, providing an objective and easily interpretable territorial diagnosis to guide decision-making and the prioritization of management strategies.
As in any applied research, the proposed approach presents certain limitations, particularly regarding the availability and quality of geospatial data. In this specific case, the study benefited from a strong background of previous research and detailed knowledge of the area, allowing for a high level of cartographic precision. However, replicating this methodology in other regions may require specific data collection campaigns or preliminary fieldwork, especially in contexts with limited spatial information.
These considerations open the door to future improvements, such as process automation, threshold optimization, and the implementation of more robust validation mechanisms, including sensitivity analysis, methodological comparisons, or validation through real-world data and expert review.
In addition, a complementary challenge toward enhancing the scalability of this work lies in the potential integration of the generated cartography with BIM methodologies. This connection would allow the territorial information to be transferred into three-dimensional models of the built environment, strengthening infrastructure design in line with the specific conditions of each area. Beyond its technical value, this integration offers a more holistic vision of the planning process, contributing a multidisciplinary approach that bridges spatial analysis with architecture, engineering, and built environment management. Recent studies have highlighted the potential of GIS–BIM integration as a tool to connect territorial-scale decisions with actionable solutions in the constructed environment [
65].


 ,
, 

