1. Introduction
The safe operation of cables is always critical in low-voltage distribution networks [
1]. Cables offer advantages such as a small footprint and high reliability; however, low-voltage cables are often installed in complex environments near areas of daily living and work, making their insulation more vulnerable to mechanical damage from excavation, compression, and other external forces [
2,
3]. Insulation defects can lead to arc discharges and leakage currents, which may ignite cable insulation materials or nearby combustible substances, thus posing a significant fire hazard [
4]. The statistics indicate that from 2011 to 2016, a total of 524,000 electrical fires occurred in China, with those caused by low-voltage distribution lines accounting for over 50% of all electrical fires annually. Among these, insulation degradation was a major contributing factor [
5].
Unlike medium-voltage and high-voltage cables, low-voltage cables operate at lower voltages. Insulation defects in low-voltage cables are particularly prone to intermittent arcs in wet environments, such as exposure to rainwater [
1,
6,
7]. In the incipient stages of a fault, these intermittent arcs typically last for a very short duration and often fail to trigger overcurrent protection devices [
8]. For Residual Current Devices (RCDs) used to detect leakage currents, their high sensitivity may lead to nuisance tripping when natural leakage currents are excessively high [
9]. RCDs are also not applicable for the TN-C (Terre Neutral Combined) and TN-C-S (Terre Neutral Combined-Separated) systems with multiple grounding points [
10,
11]. Therefore, studying the characteristics of incipient faults in low-voltage cables is crucial for the early detection of defective cables, thereby reducing the risk of electrical fires caused by insulation defects and enhancing the safety of low-voltage distribution networks [
12,
13].
Researchers have conducted studies on incipient faults in cables. Zhipeng Yu et al. [
14,
15,
16] investigated the evolution of incipient faults in cable joints under humid conditions through fault simulation experiments, dividing the fault process into three sub-stages. They also analyzed the non-electrical characteristics of incipient faults, including insulation erosion, liquid electrode displacement, and deformation. Furthermore, based on their experimental research on incipient faults in medium-voltage cable joints, they examined the characteristics of fault resistance and the influence of external parameters, such as transmission line properties, on fault resistance. They proposed a fault identification device structure along with corresponding detection logic. Jinsuo Li et al. [
17] obtained typical voltage and current waveforms due to incipient fault through experiments, extracted disturbance signals using time-domain analysis, and proposed a voltage disturbance model. Lulu Li et al. [
18] experimentally observed intermittent internal arcs in cables, classified incipient fault signals into three primary forms, and developed corresponding models. Jannati M et al. [
19] introduced an incipient fault detection method based on cumulative summation and neural networks, enabling high-speed detection and effectively distinguishing incipient faults from other signals in distribution systems. Studies [
20,
21,
22] applied deep learning methods, using convolutional neural networks and deep generative models to extract features of incipient fault signals, followed by various classifiers for fault identification. However, all the above research focuses on MV cables. The limited literature regarding LV-cable incipient faults and their study results is summarized as follows. Van Deursen et al. [
1] conducted corrosion experiments by immersing damaged aluminum-core cables in liquid and observed short-duration intermittent currents. Similar current peaks were also recorded during long-term on-site monitoring. Xilan Xie [
23] experimentally identified the occurrence of self-recoverable internal arc discharges in low-voltage defective cables. The associated voltage and current waveforms showed multiple arc-like transient disturbances. S. M. Rowland et al. [
24] investigated the leakage current, partial discharge, and arcing generated in oil-impregnated paper insulation cables in water immersion conditions and the effect of core temperature on fault signals. B. Kruizinga [
25] discussed the degradation mechanism of cable insulation under different factors such as liquid conductivity, soil type, and insulation material, and confirmed that cable insulation degradation is mainly caused by arcing under wet conditions.
It can be seen that research on low-voltage cables remains insufficient, particularly regarding the voltage and current characteristics during the development of incipient faults. Moreover, no widely accepted incipient fault model has been established so far, hindering the development of effective detection methods. To address these gaps, this study investigates the voltage and current characteristics of single-phase incipient faults commonly occurring in cross-linked polyethylene (XLPE) cables with insulation defects. These characteristics are correlated with the typical stages of initial cable faults, while also considering the influence of various factors on fault characteristics. Thus, cable incipient models are proposed based on the experimental results for further research on cable incipient fault detection methods. This paper is arranged as follows.
Section 2 explains the experimental setup and the parameters of the cable samples and the experimental conditions.
Section 3 presents the experimental results and analyzes the main findings.
Section 4 presents the simulation results and analysis, which support the experimental findings.
Section 5 proposes incipient fault models for LV XLPE cables.
Section 6 provides the application results of the proposed model.
Section 7 concludes the paper.
2. Experimental Platform
2.1. Insulation Defective Cable
Low-voltage cables are primarily composed of three components: the conductor, the insulation layer, and the outer sheath. To enhance the cable’s resistance to pressure, armored cables, which have a metal sheath placed between the insulation layer and the outer sheath, are also commonly used. Depending on the application requirements, cables can be categorized into types such as single-core, double-core, and three-core cables, etc. The cross-sectional structure of a three-core low-voltage XLPE cable is illustrated in
Figure 1.
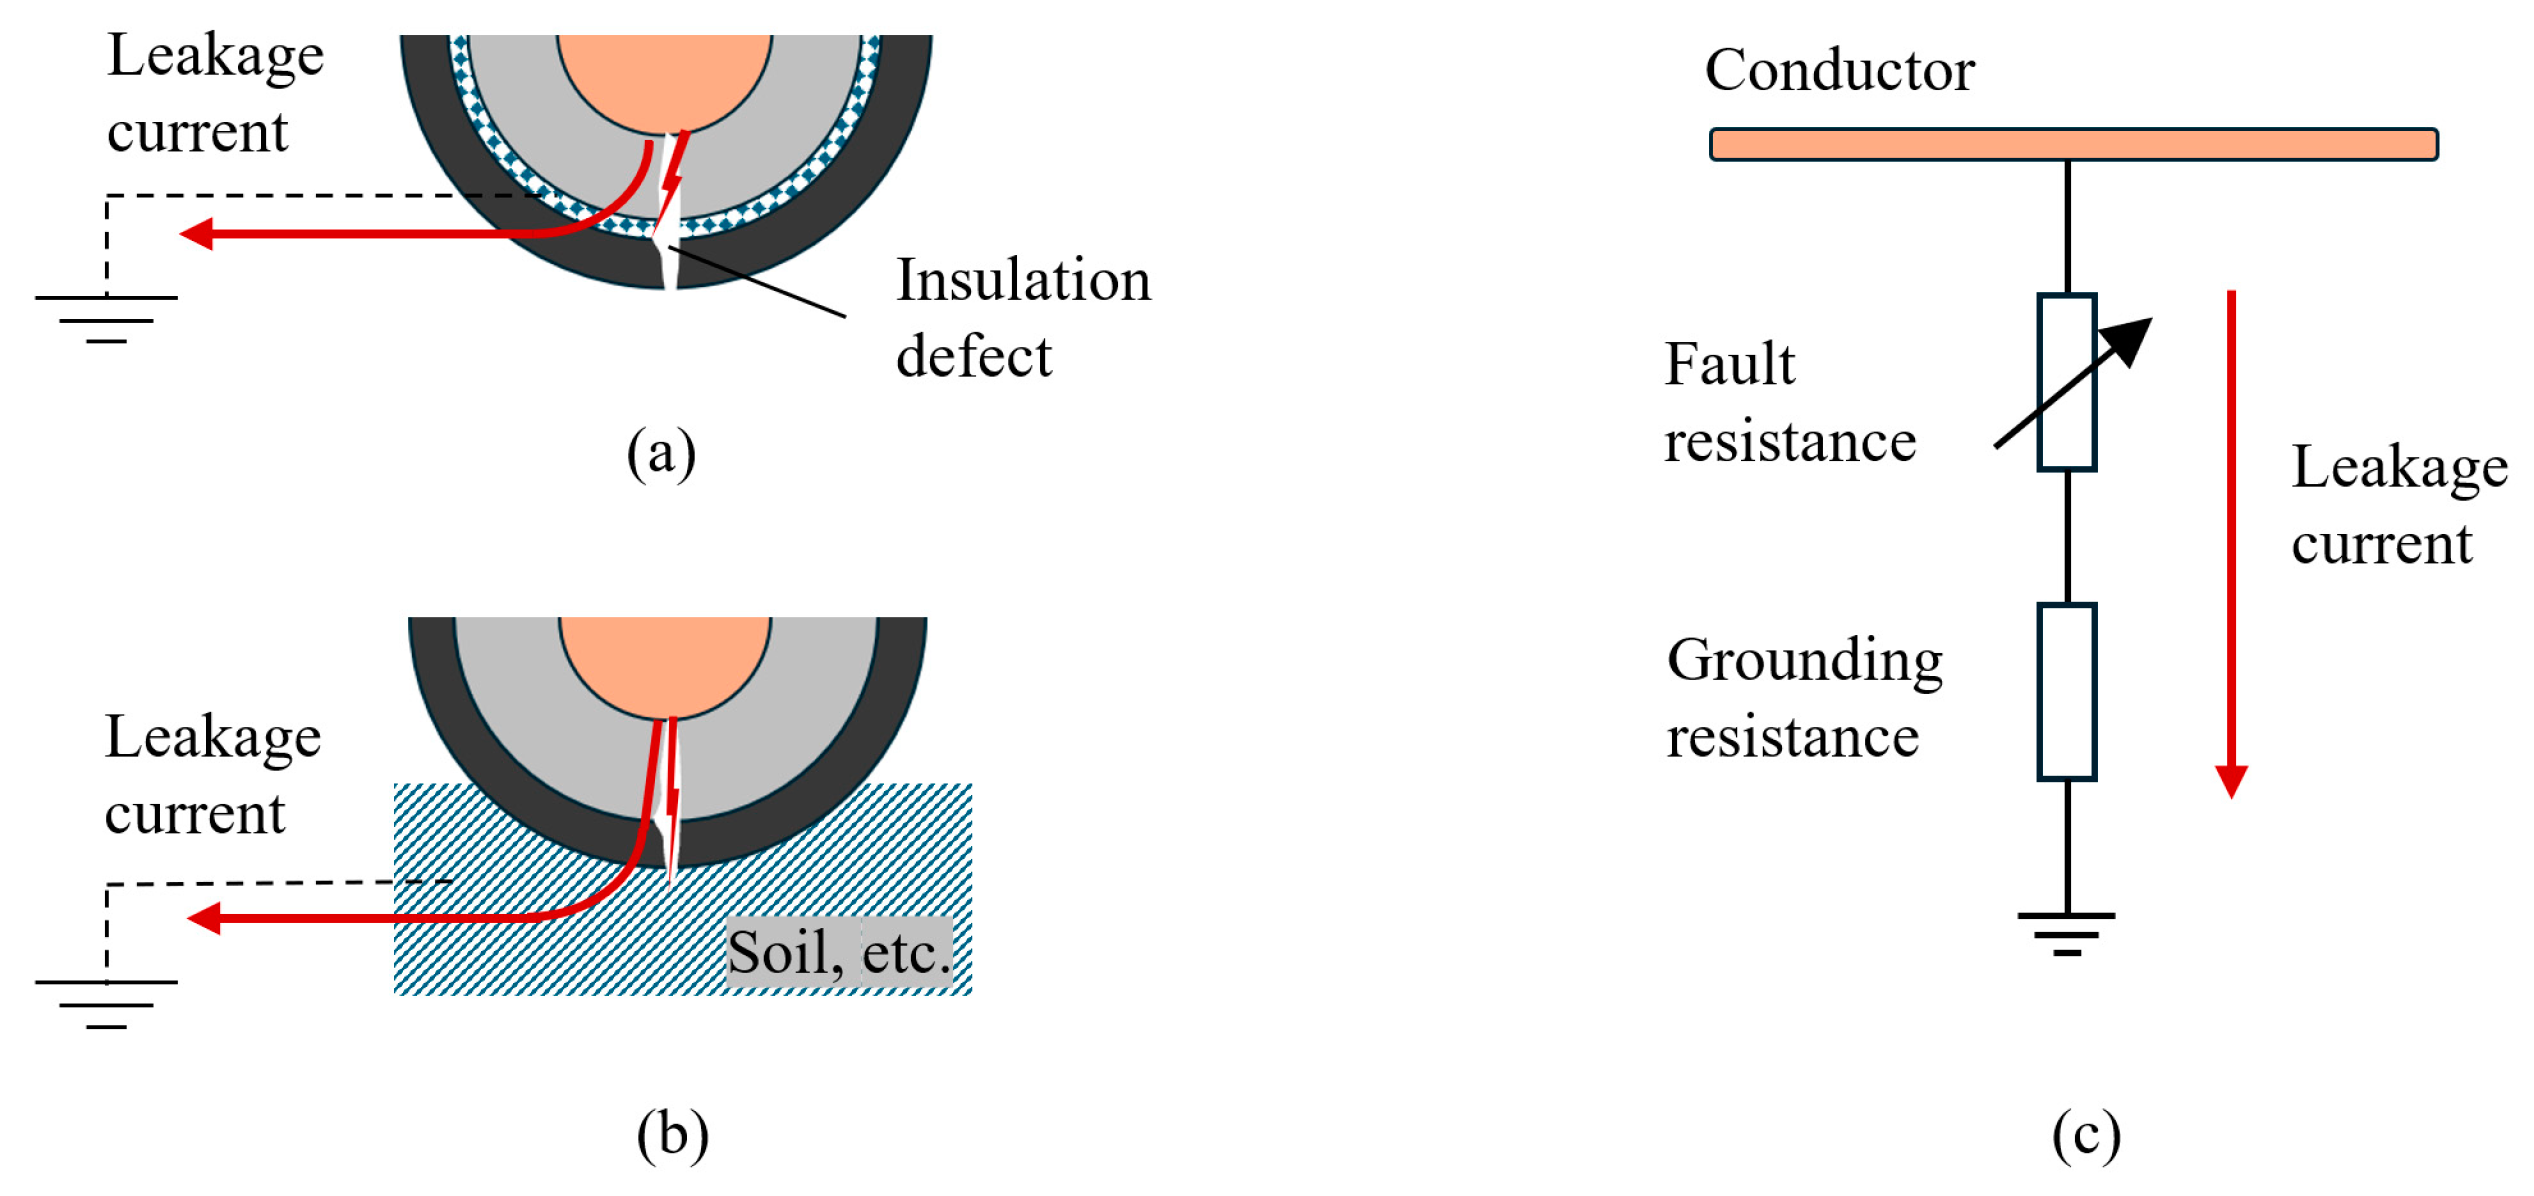
Independent of the number of conductors in a cable, single-phase incipient faults induced by insulation defects typically occur either between the conductor and the metallic sheath or between the conductor and the surrounding medium. The entire conductive path consists of fault resistance and grounding resistance, as shown in
Figure 2. For cables with a metallic sheath or on a metallic tray, the leakage current flows through a low-resistance grounding path, with the resistance typically being less than 10 Ω. However, if a cable without a metallic sheath is directly laid on or buried in sand, soil, cement, etc., the grounding resistance may reach hundreds of ohms. Considering the actual cable installation situations, the experimental platform was designed as described in
Section 2.2.
2.2. Experimental Platform and Setup
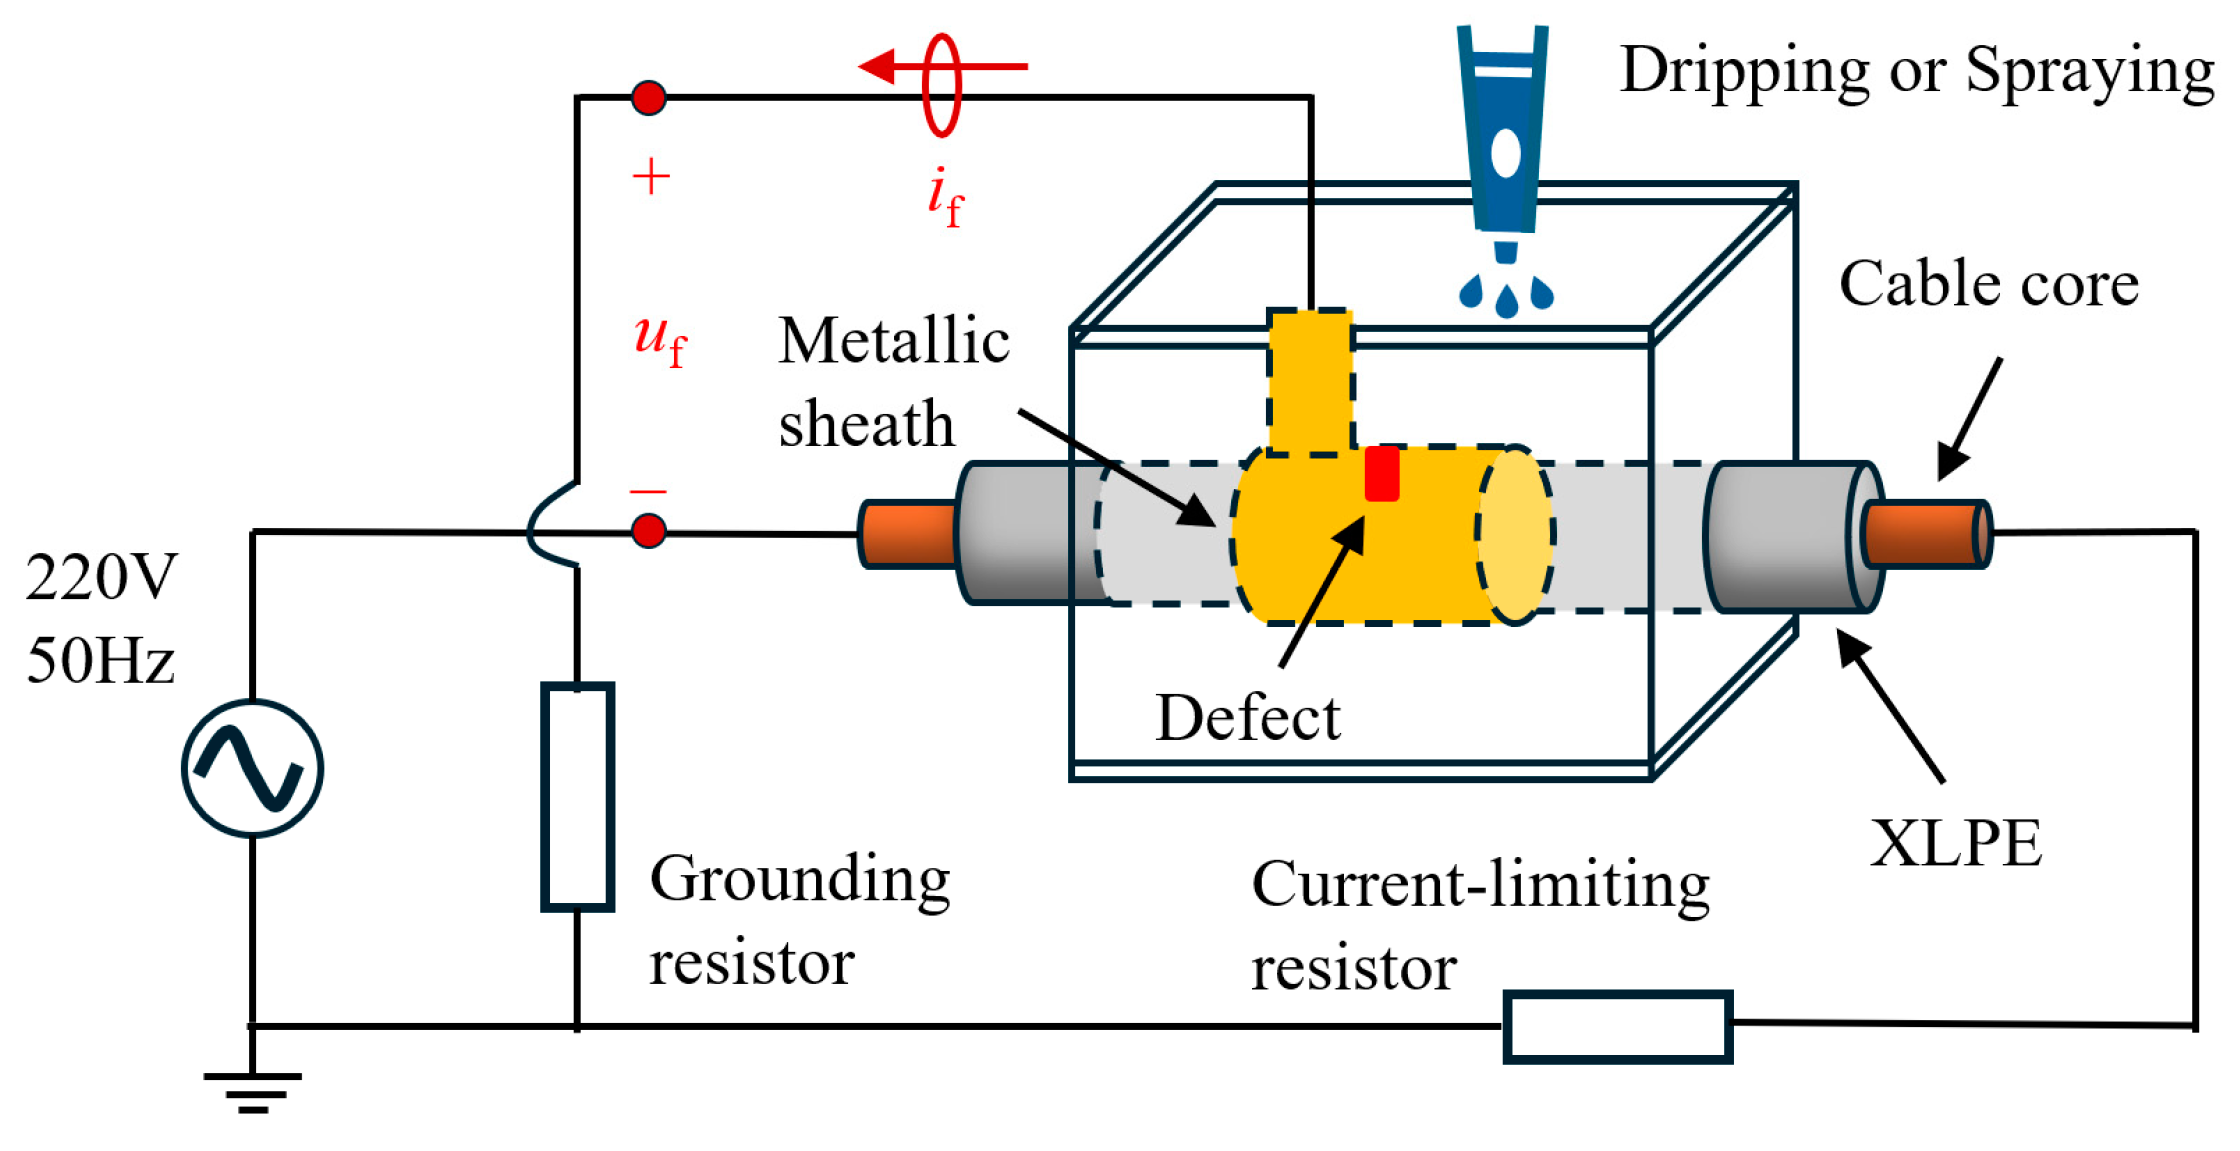
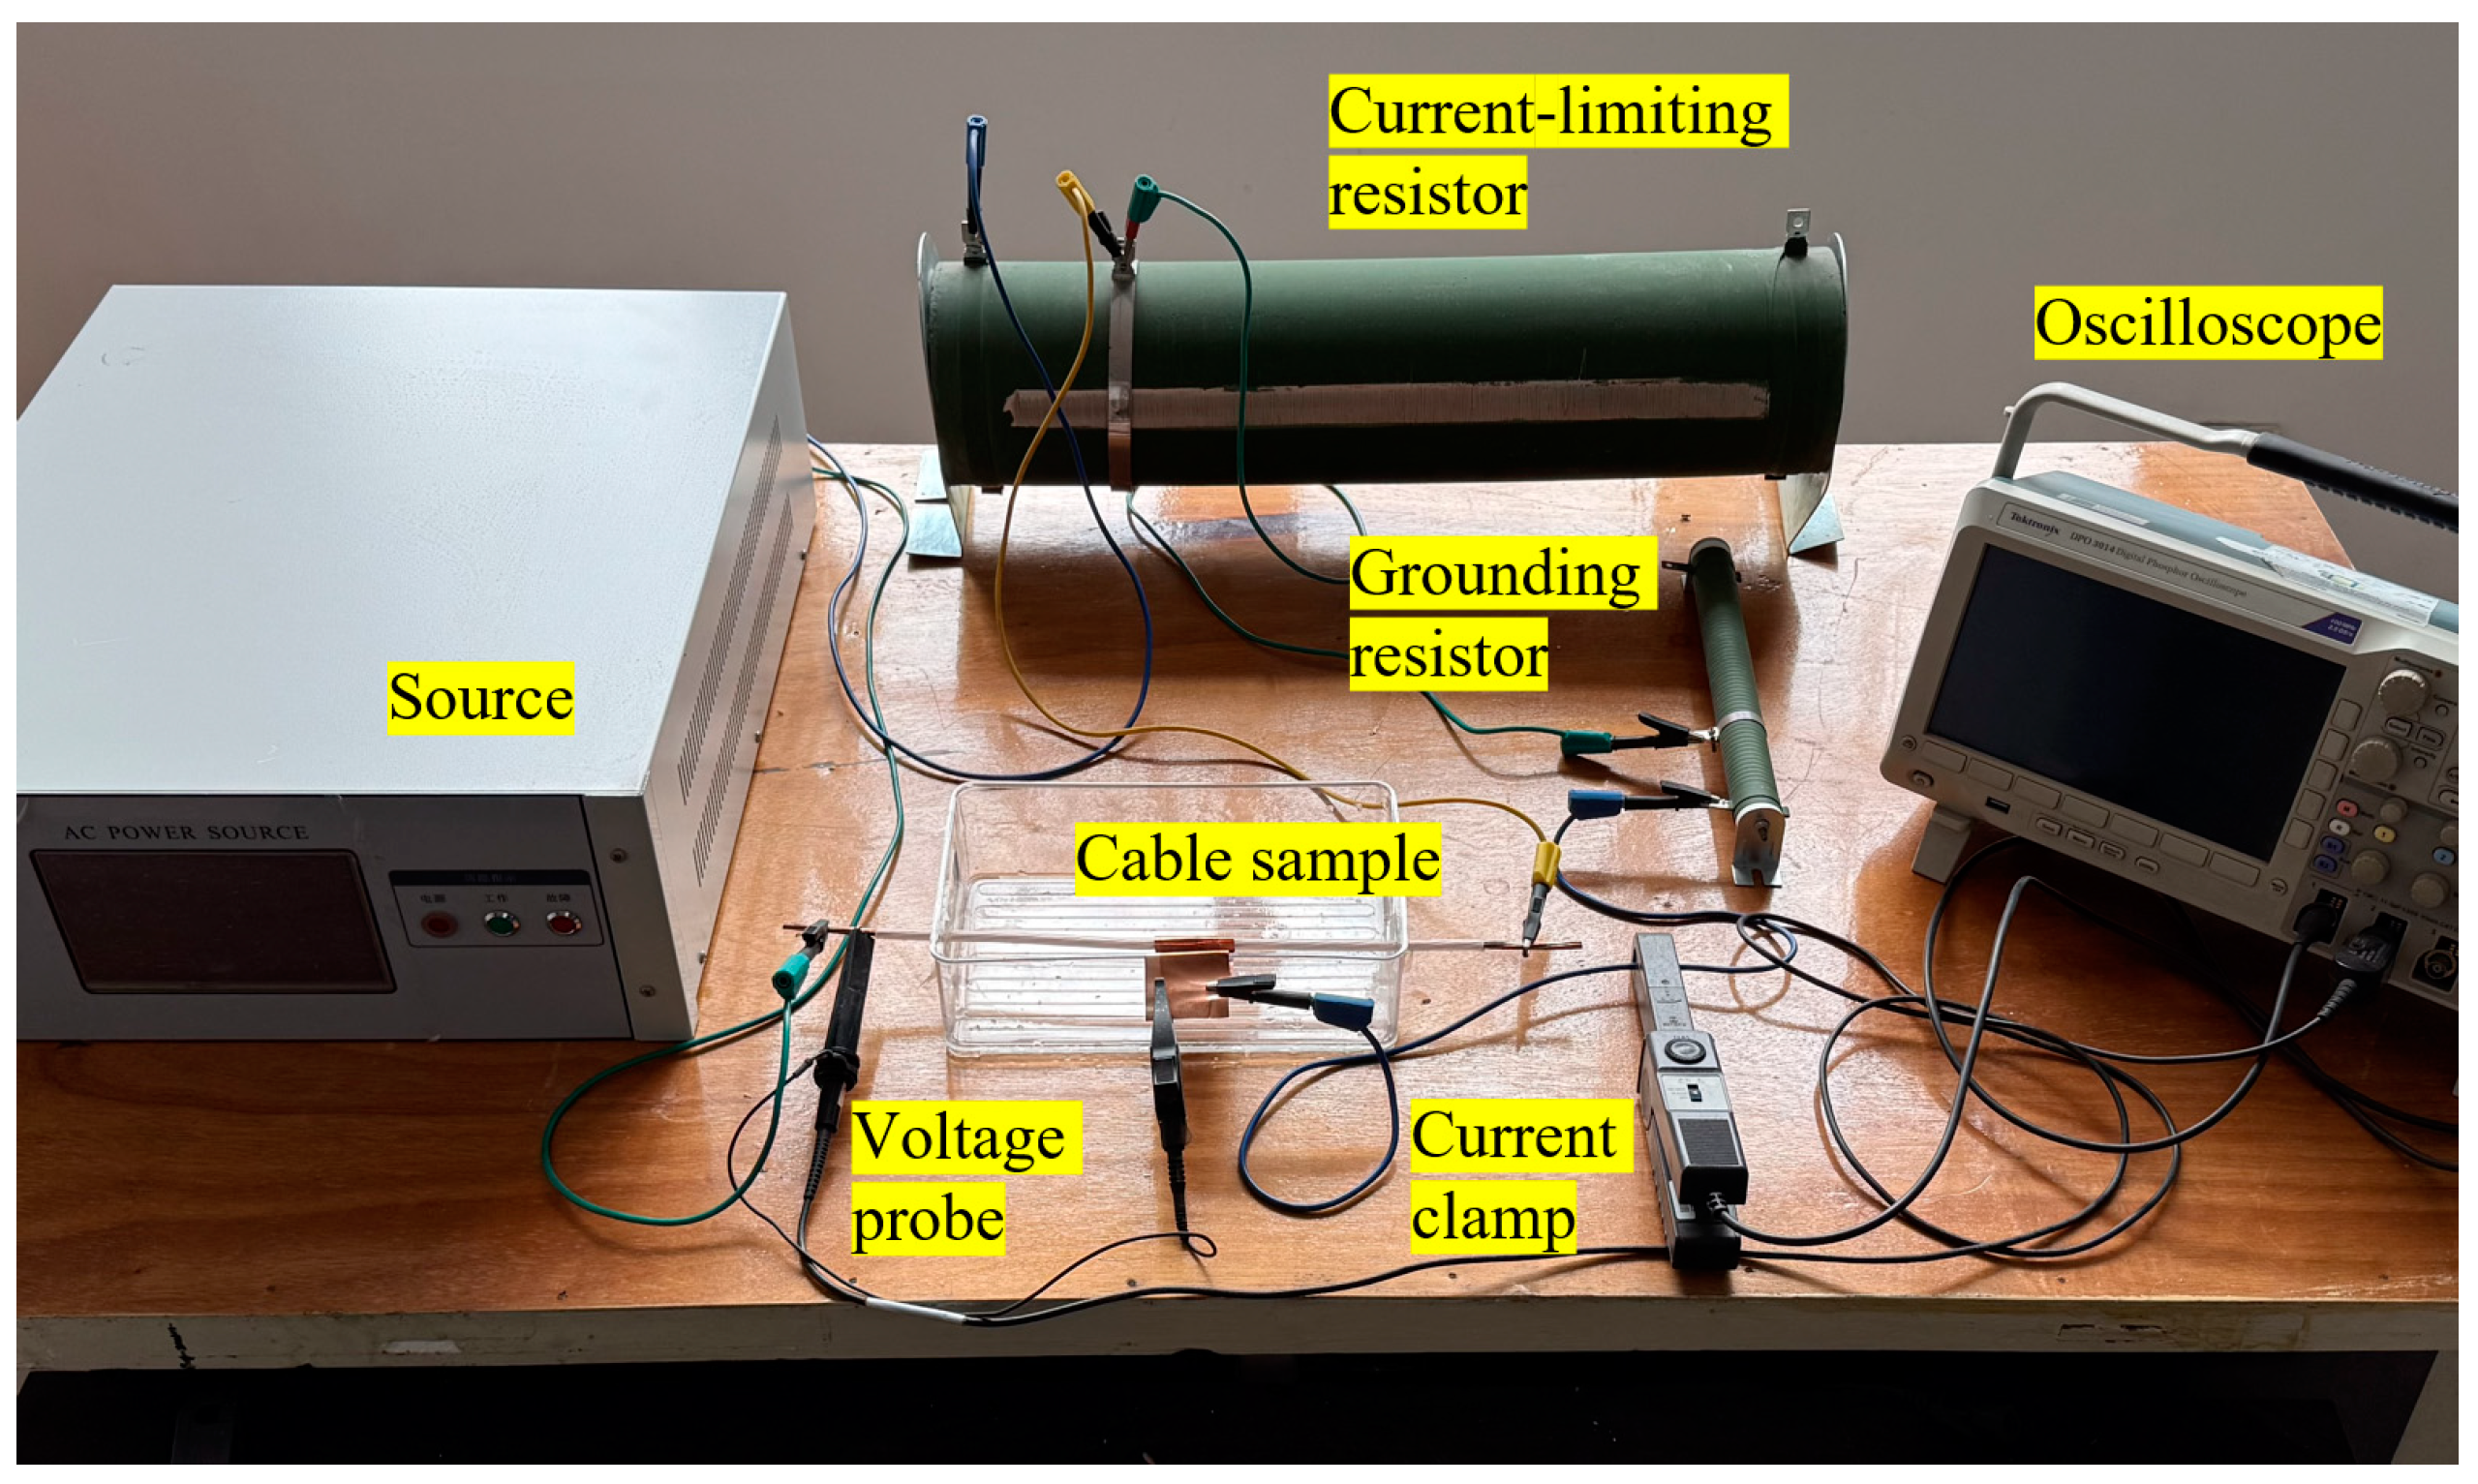
An experimental setup for testing these faults was established, as shown in
Figure 3. This setup is designed to observe the fault voltage
uf and leakage current
if of insulation-defective cables under various conditions. The experiment employs an Anmutake ATA20003 adjustable AC power supply (manufactured by Anmutake, Shenzhen, China) as a voltage source, providing a single-phase power frequency voltage with an RMS value adjustable from 0 to 300 V for the cable samples. Voltage and current are measured using a Tektronix TPP0051 medium-voltage probe (manufactured by Tektronix, Oregon, USA) and a Tektronix A622 current clamp (manufactured by Tektronix, Oregon, USA), respectively. The voltage and current waveforms are observed and recorded using a Tektronix DPO3014 oscilloscope (manufactured by Tektronix, Oregon, USA), with a waveform recording sampling rate of 25 kHz. The experimental platform is illustrated in
Figure 4.
The cable sample used in the experiment is one phase from a commonly used YJV22-0.6/1 kV four-core low-voltage XLPE cable (manufactured by Buke, Nanjing, China). A 35 cm length cable is extracted for the experiment, with 5 cm of insulation stripped from both ends of the sample to expose the conductor for connection to the main circuit. A 1–2 mm notch is made at the center of the cable sample using a cutter to simulate an insulation defect. One end of the cable sample is connected to the power supply, and the other end is connected to a 200 Ω current-limiting resistor. A copper metal layer is wrapped around the defect area of the cable, and a corresponding notch is made. A grounding resistance is connected to form a discharge path to ground at the cable’s insulation defect, with the grounding resistance set to 10, 30, 70, and 120 Ω.
The following methods are used to simulate different wet environments:
Liquid penetration condition: saltwater is added dropwise at a rate of 1 drop per 10 s around the defect to simulate the slow penetration of liquid into the cable’s insulation defect. This is to mimic the situation in which the cable is surrounded by shallow water, such as rainwater.
Humid air exposure condition: the cable is placed in a sealed glass box, and saltwater mist is used to control the humidity within the box, simulating the cable being exposed to a humid air environment.
Liquid immersion condition: the cable insulation defect is fully submerged in water to simulate the situation where the cable is in standing water.
The conductivity of rainwater generally does not exceed 0.5 mS/cm, while polluted rainwater can reach up to 2 mS/cm. Considering the potential accumulation of contaminants in cable ducts or trenches, the conductivity of mixed contaminated liquids is even higher. Therefore, salt solutions with conductivities of 0.2, 1, 3, and 5 mS/cm are selected to simulate the wet environment the cable is exposed to.
The experimental steps are as follows:
- 4.
Place the prepared cable sample under the preset different wet conditions for the experiment.
- 5.
After powering on, monitor and record the voltage between the conductor and the metal layer in real-time using the oscilloscope, and the current flowing into the ground through the preset grounding resistance. Continue observing until the cable experiences a permanent fault or the discharge phenomenon completely disappears.
- 6.
Use multiple cable samples to obtain multiple sets of data, ensuring the reliability and repeatability of the experimental results.
3. Experimental Results
Through the experimental process described above, 15 sets of reproducible independent waveform data were collected, capturing the progression from intermittent arc generation to permanent fault. The following analysis focuses on the incipient fault development process and characteristics under different humidity conditions, as well as the impact of the grounding resistance and liquid conductivity on waveform characteristics.
3.1. Liquid Penetration Condition
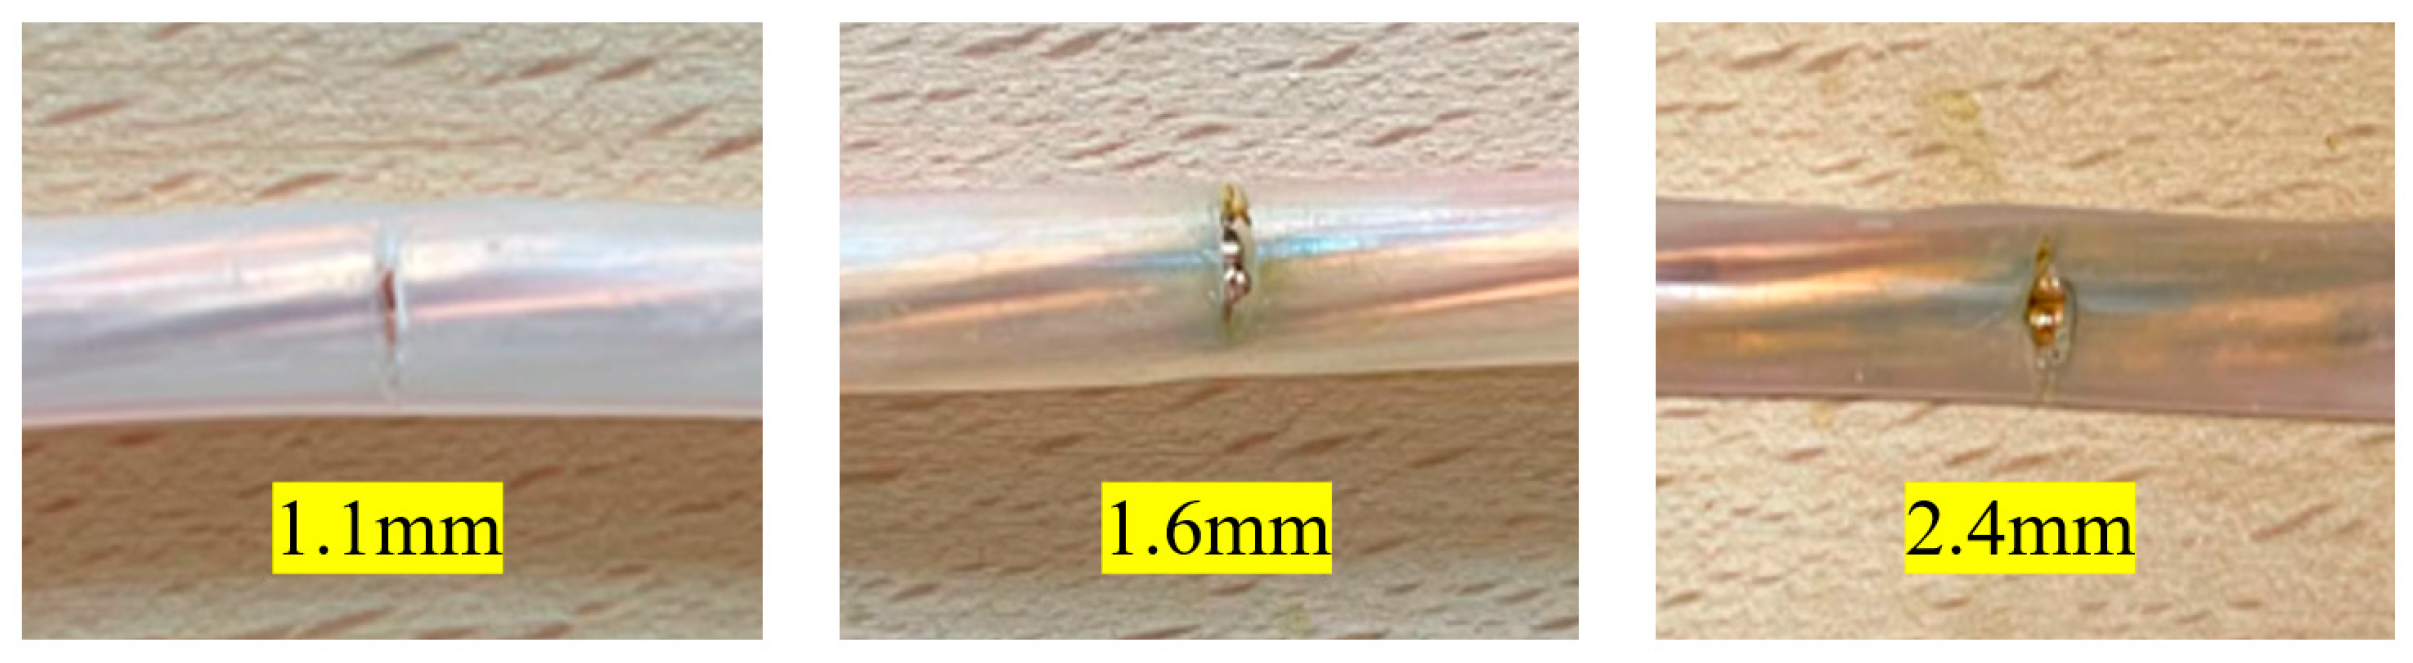
The typical results are presented as follows. In the experiment, saline with a conductivity of 3 mS/cm was used, and the grounding resistance was set to 30 Ω. During the experimental process, first, the discharge arc can be observed occasionally. As the discharge process was going on, the insulation defect expanded due to erosion, allowing more liquid to gradually penetrate the defect.
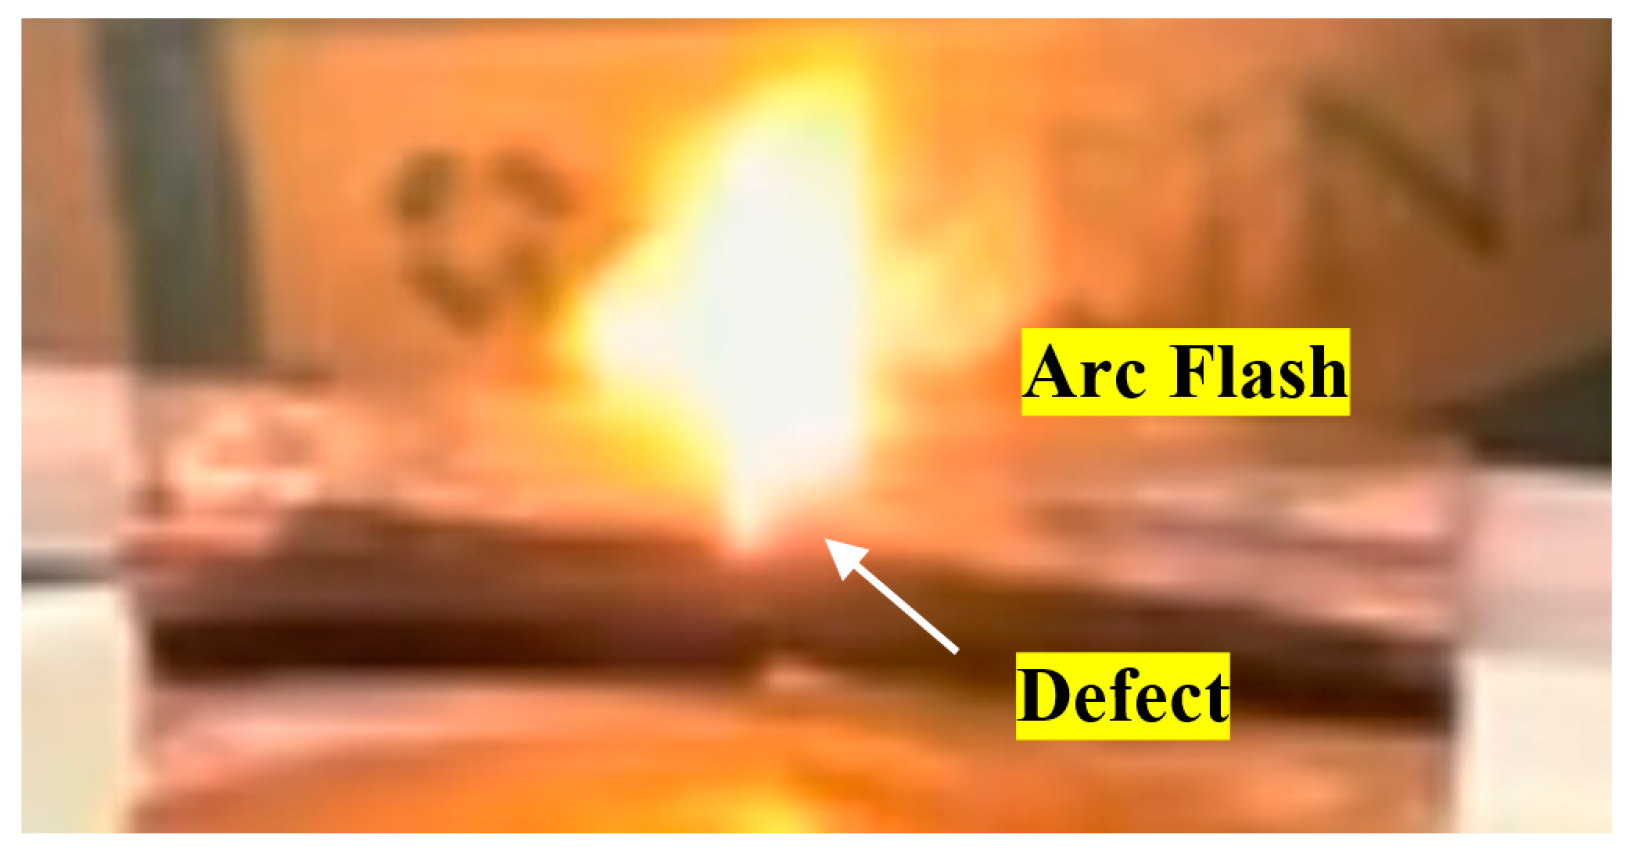
Figure 5 illustrates the change in the size of an insulation defect in a sample cable, increasing from the initially set 1.1 mm to 2.4 mm. Intermittent, distinct arc flashes were clearly observed at the insulation defect, accompanied by sharp sounds resulting from the rapid expansion of gas, as well as small amounts of liquid ejected from the defect. The arc generation phenomenon is shown in
Figure 6.
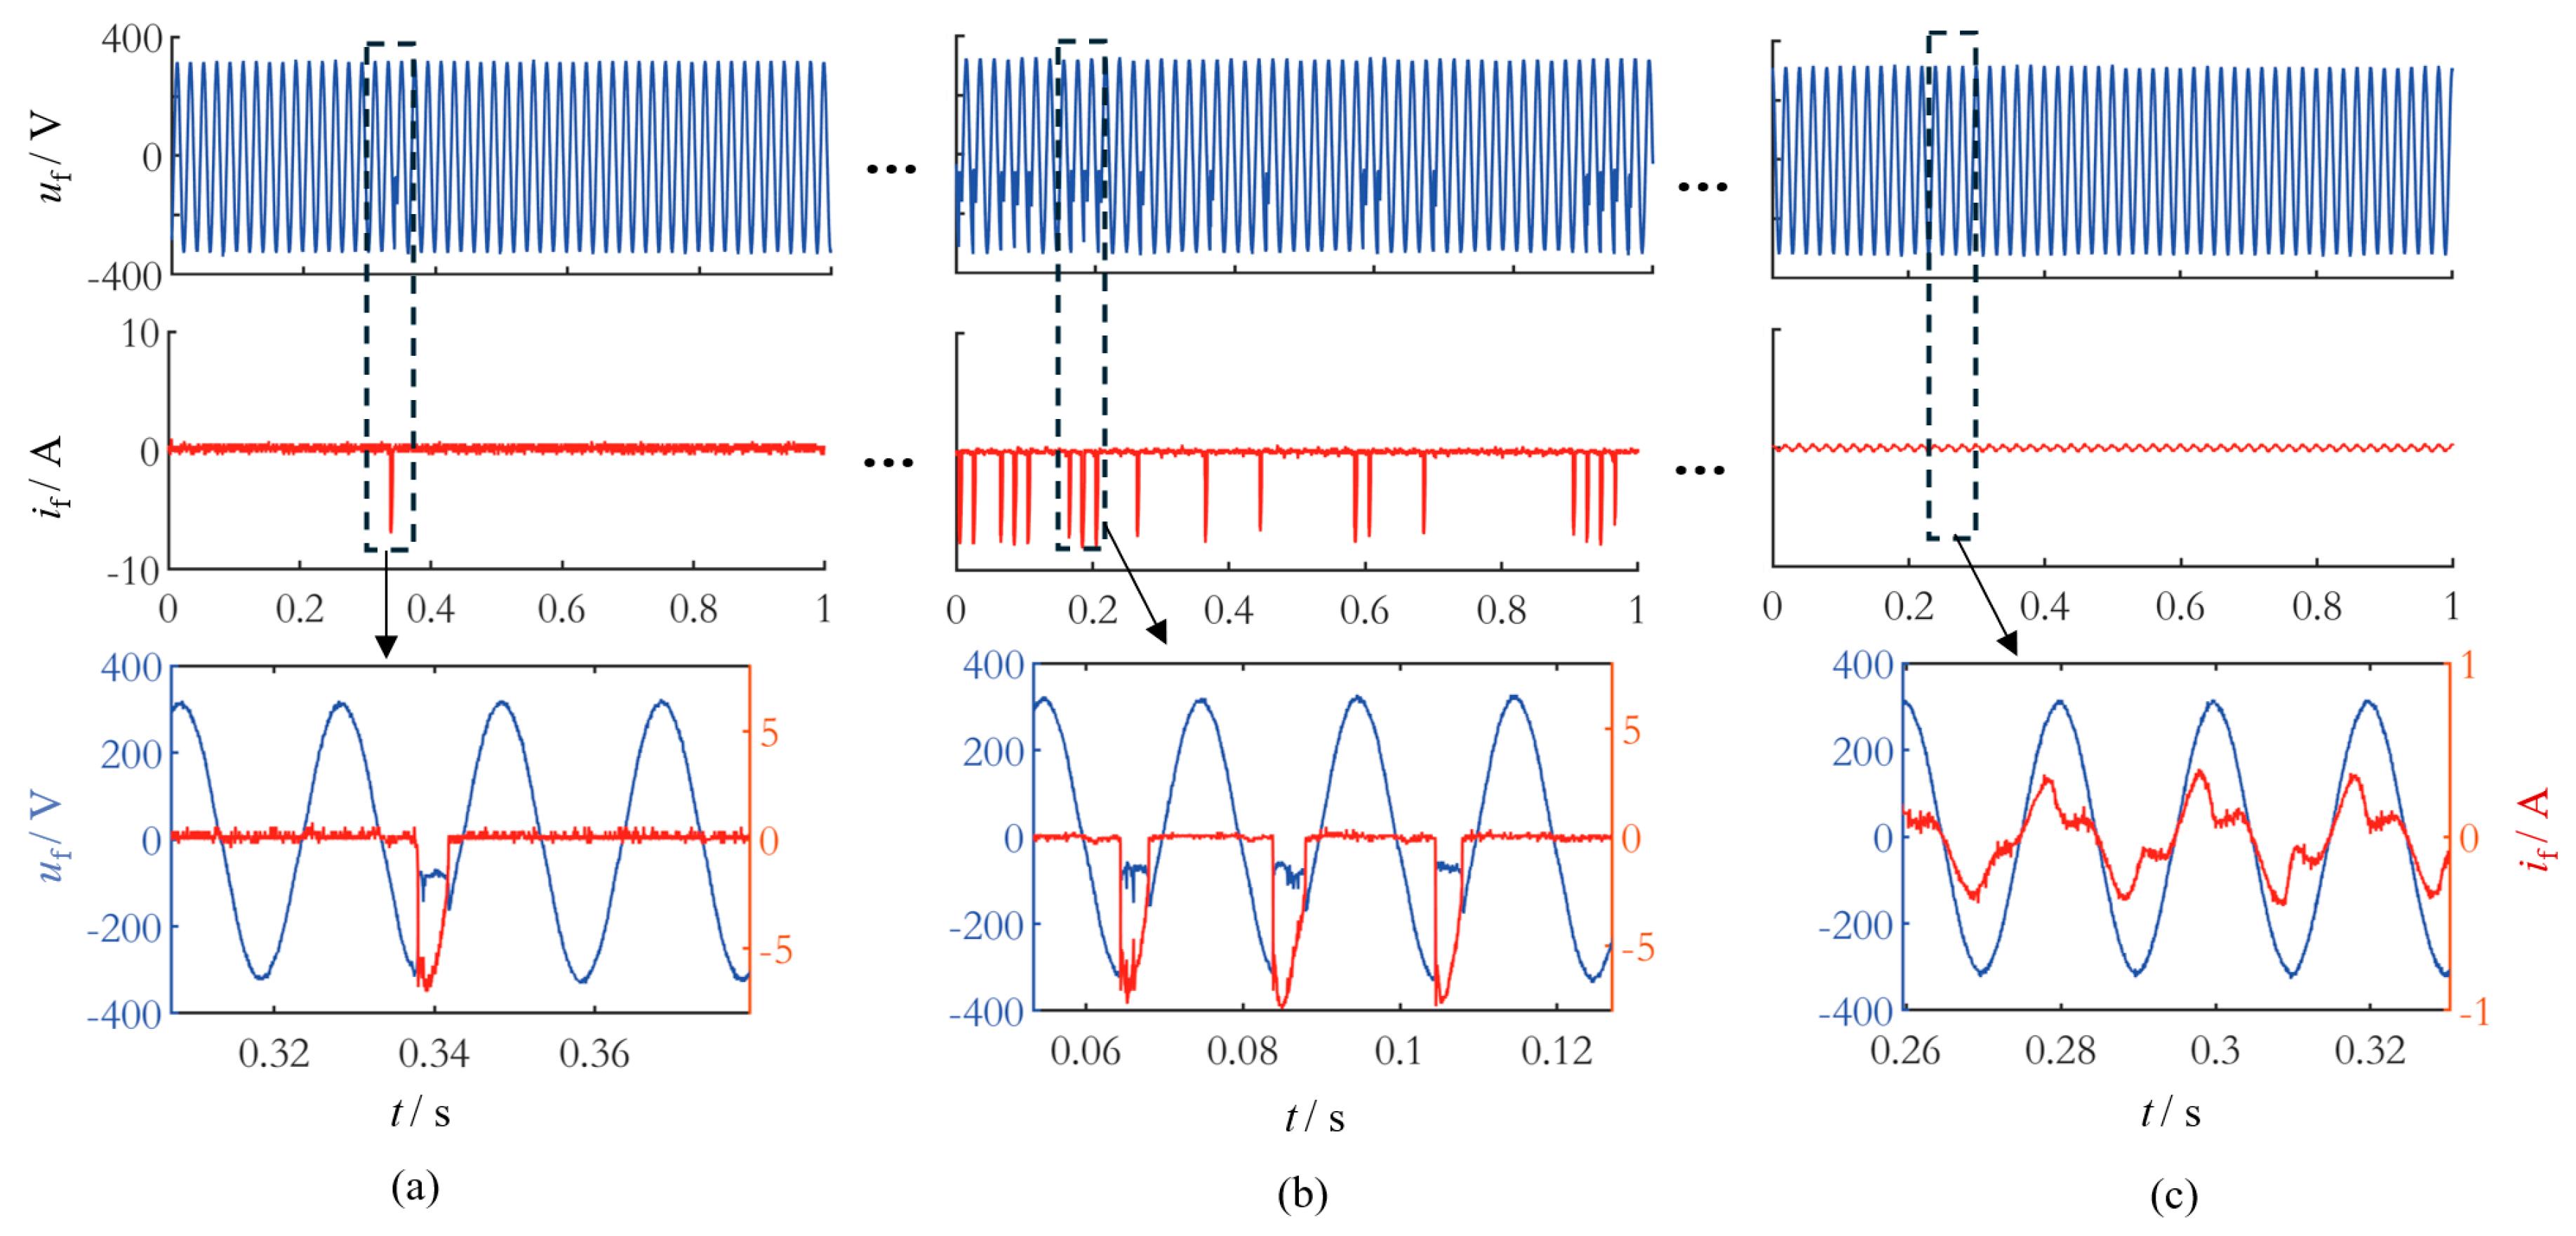
Based on changes in the insulation defect and the characteristics of voltage and current waveforms, the discharge evolution process during liquid penetration into the insulation defect can be divided into three stages. Taking a sample cable that experienced intermittent discharge leading to a sustained fault as an example, the typical waveforms corresponding to these three stages are presented in
Figure 7.
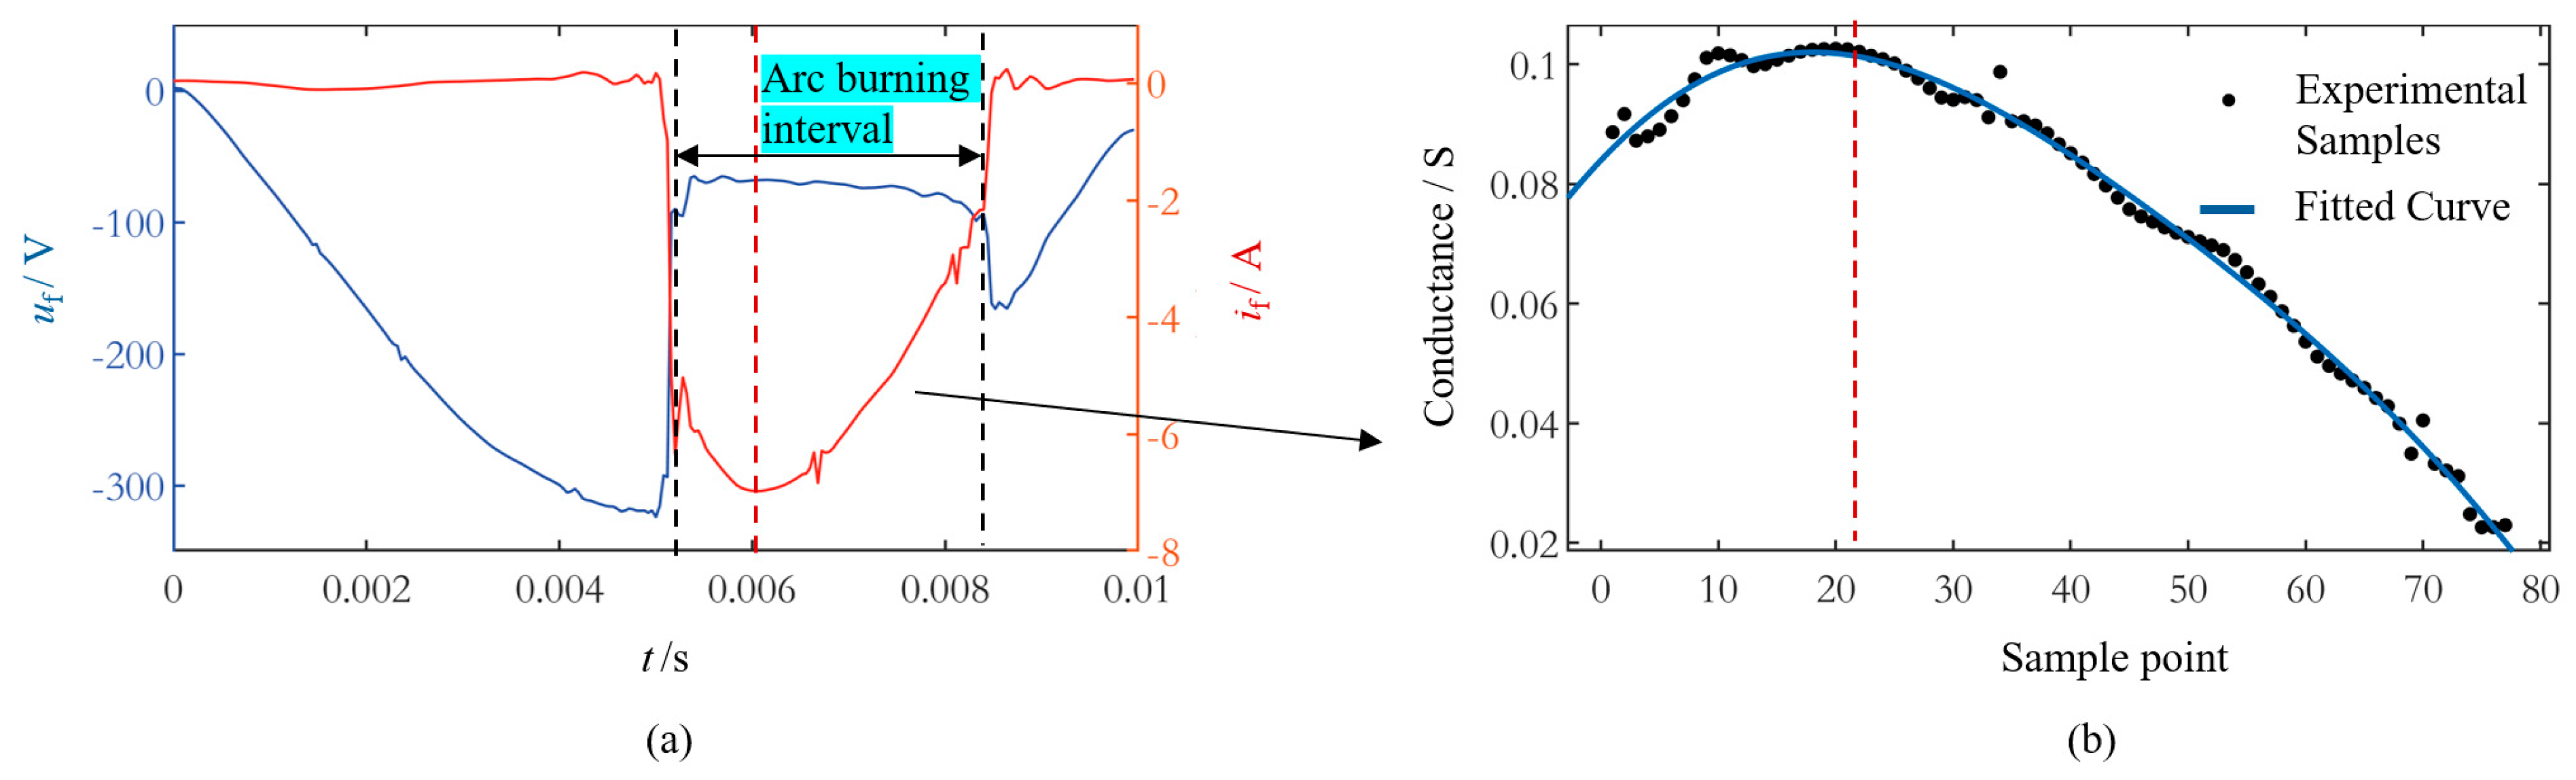
In the first stage, when the insulation defect is relatively narrow, the voltage waveform exhibits a temporary drop at the voltage peak during sub-cycle arc generation, lasting approximately 1/4 of a cycle. Simultaneously, the current appears in a pulsed form with an amplitude of 6–8 A. The arc voltage waveform is relatively smooth and approximately semi-arc shaped. During discharge, the voltage between the conductor core and the metal layer drops instantaneously, while the current rises sharply. After a certain period, the arc extinguishes, causing the voltage to recover and the current to return to nearly zero until the next discharge occurs. In this stage, the interval between two intermittent arcs is relatively long, ranging from several tens of minutes to several hours.
In the second stage, the degree of insulation degradation intensifies due to continuous erosion, leading to an increase in defect width and allowing more liquid to penetrate. At this stage, the discharge remains primarily characterized by intermittent sub-cycle arcs, with current pulses maintaining the same amplitude of 6–8 A and waveform characteristics as observed in the first stage. The frequency of arc occurrences increases significantly, with the time interval between two arcs reducing from tens of minutes to several cycles or a few seconds. Compared with the first stage, the widening of the defect mainly affects the frequency of arc occurrences, while the amplitude and the waveform of the pulse current show no significant changes.
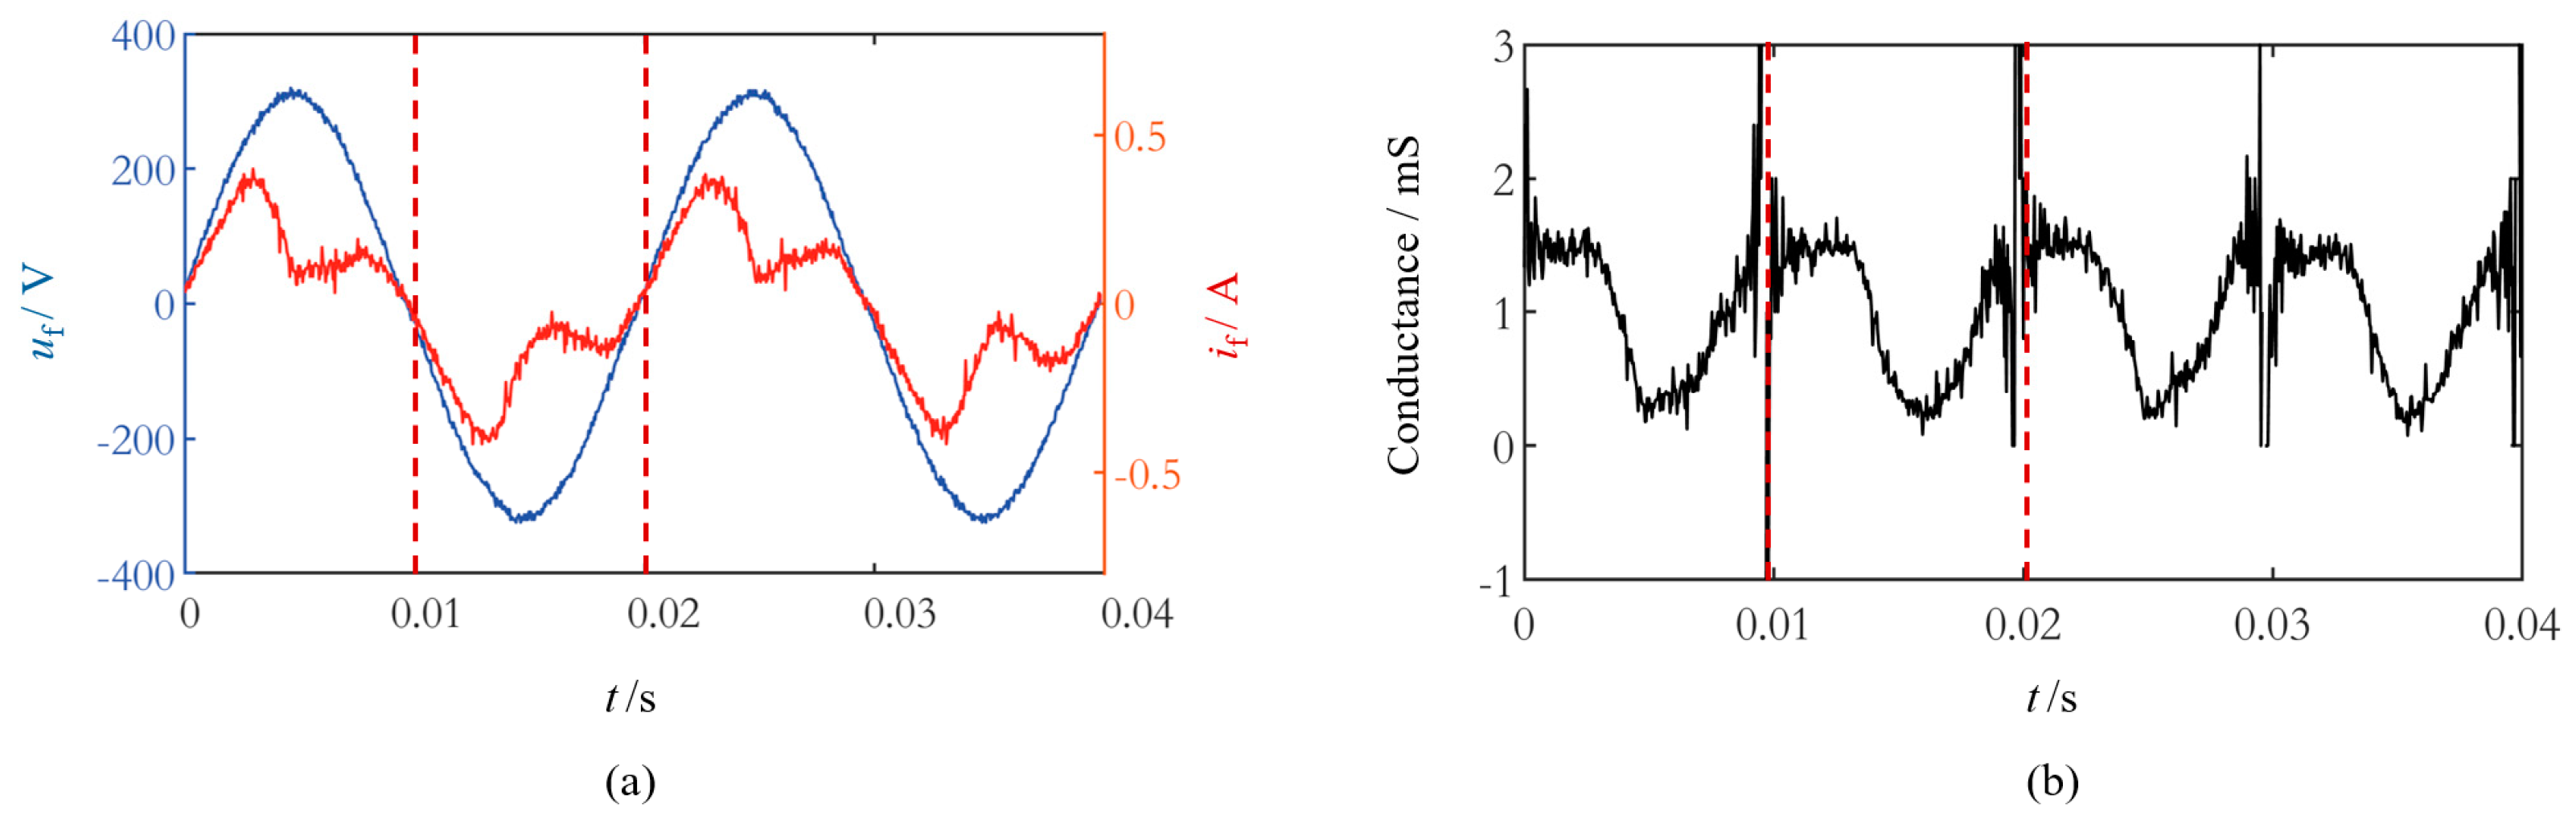
In the third stage, as the defect continues to expand and becomes gradually filled with sufficient liquid, the conductor core and the metallic layer can establish brief direct conduction. Compared to the previous stages, the discharge waveform undergoes significant changes, exhibiting a periodic current with an amplitude of approximately 0.4 A and an absence of voltage disturbances. Meanwhile, the frequency of intermittent arc occurrences dramatically decreases. This is because the entire defect area remains filled with liquid, turning the intermittent discharge status into a stable insulation leakage status.
3.2. Humid Air Exposure Condition
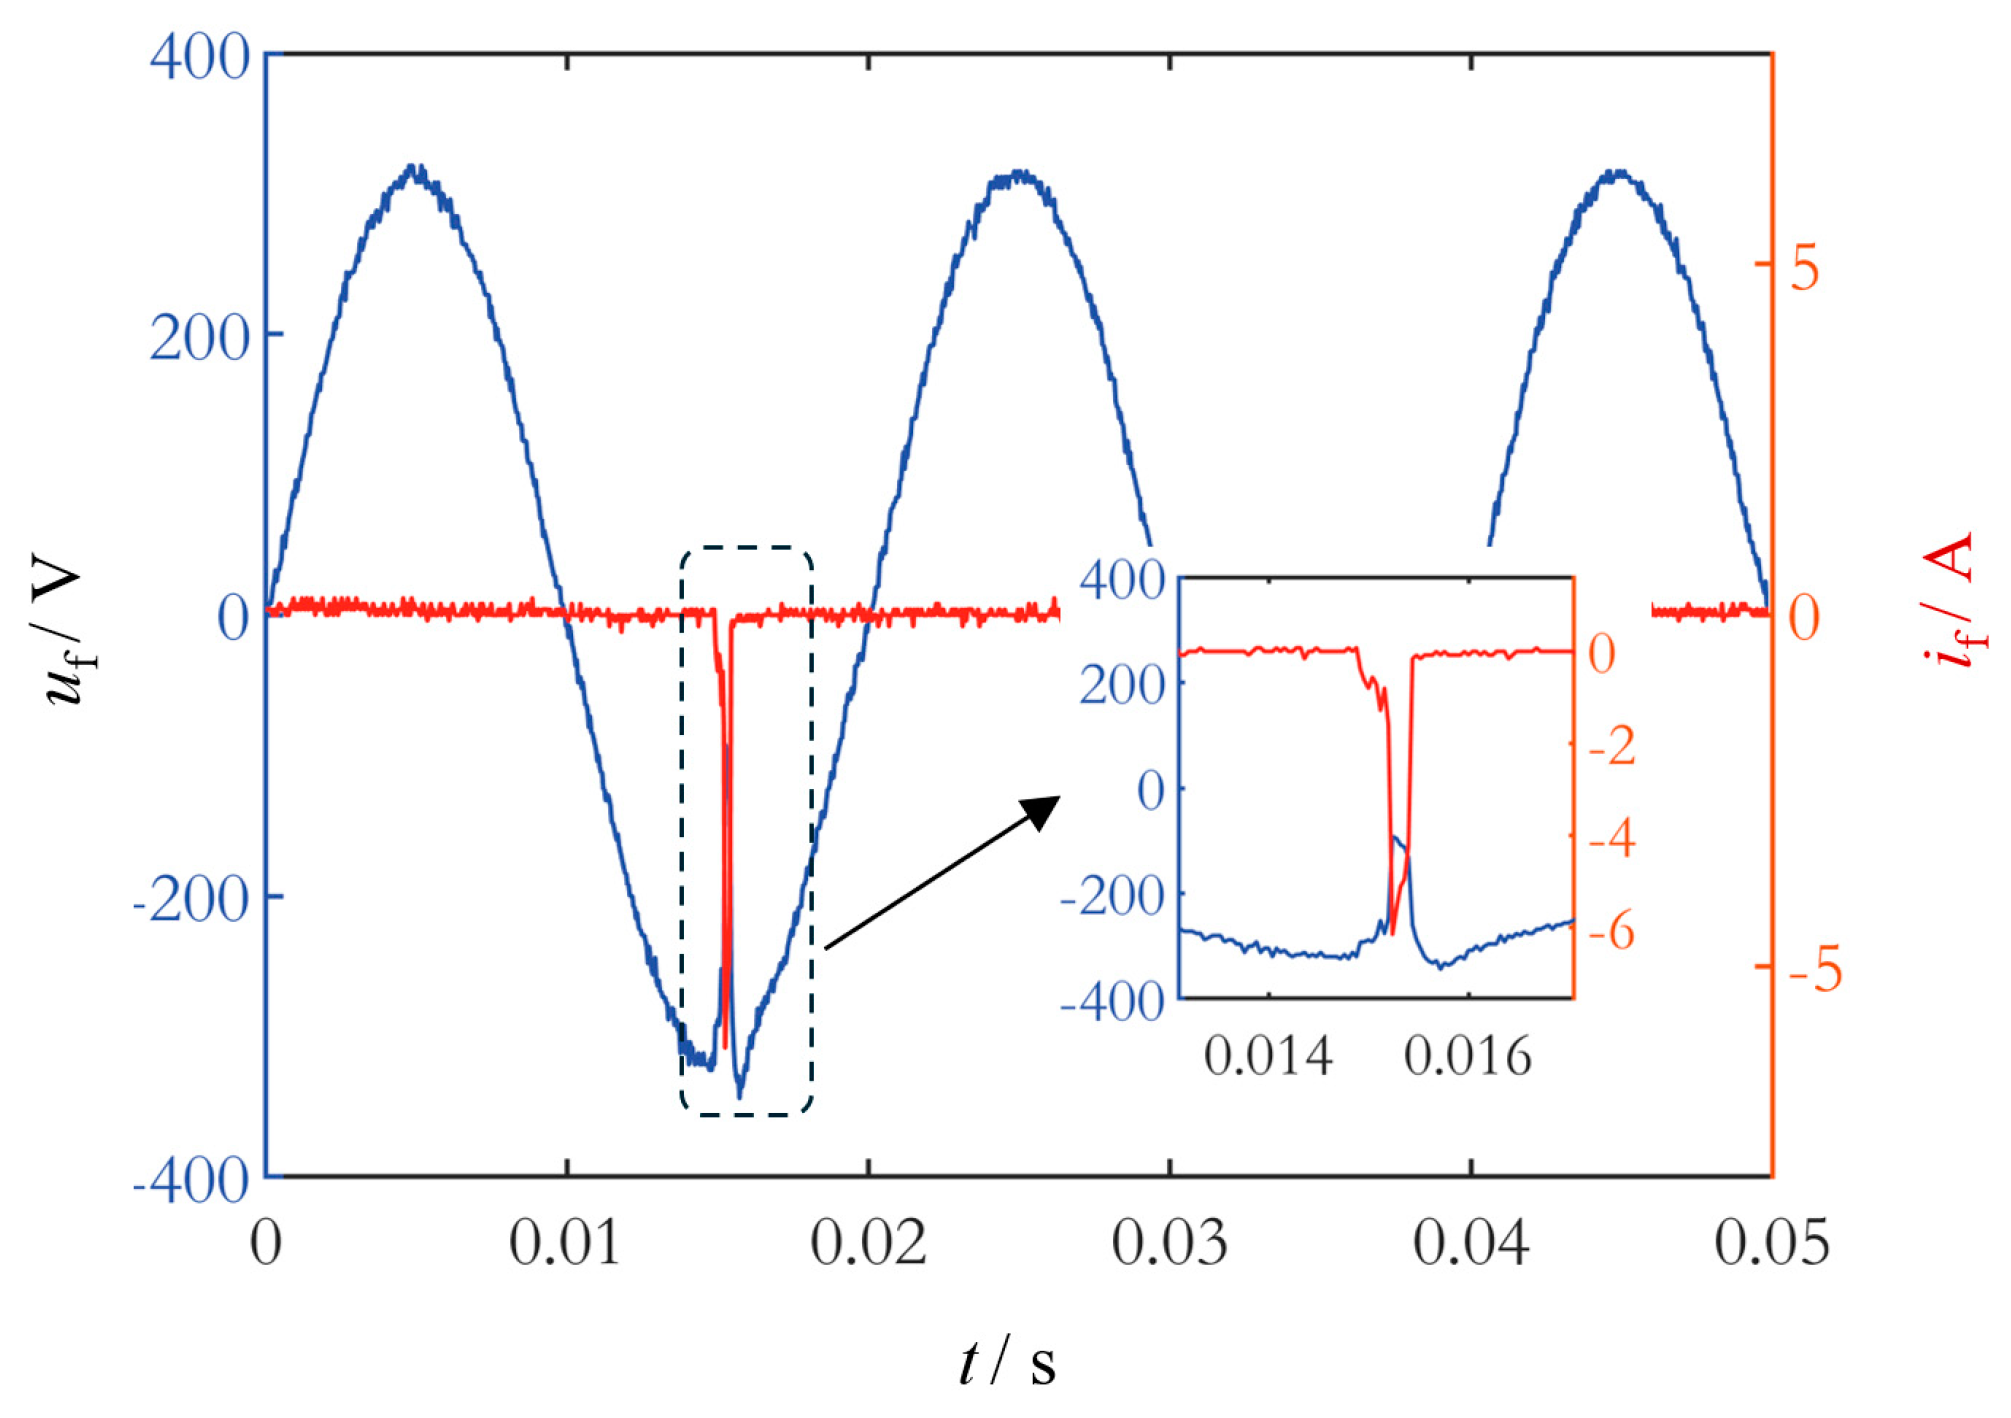
The defective cable was placed in a sealed glass chamber, with a defect width of 1.2 mm. The sprayed mist had a liquid conductivity of 3 mS/cm, and the grounding resistance was 30 Ω. The initial relative humidity inside the chamber was 55%. During the continuous pressurization process, no discharge phenomenon was observed. As the mist spraying continued, gradually increasing the humidity inside the chamber, a small amount of liquid condensation was observed on the cable surface. When the relative humidity exceeded 80%, intermittent sub-cycle arcs, as shown in
Figure 8, were observed. These arcs were accompanied by sharp sounds but exhibited no significant arc flashes. In this case, the defect area was noticeably moist, indicating that moisture accumulation contributed to arc generation. Compared to the sub-cycle arcs caused by direct liquid penetration into the defect, arcs extinguished rapidly after initiation, with a duration of approximately 0.5 ms. In terms of waveform characteristics, these arcs also occurred at the voltage peak, with the current displaying a narrow pulse shape. The amplitude of these sub-cycle arc currents was similar to that of sub-cycle arcs in the first and second stages in 3.1, ranging from approximately 6 to 8 A.
Due to the slow accumulation of moisture at the site of the defect in humid air, the arc discharge rapidly evaporates the accumulated liquid. As a result, only intermittent arcs occur throughout the experiment, with the time interval between two arcs generally reaching several hours. Higher relative humidity facilitates liquid accumulation at the defect. When the relative humidity approaches saturation (>90%) and water mist continuously surrounds the cable defect, the interval between two arcs can be reduced to tens of minutes. Under these conditions, a cable sample generated six arcs during a five-hour experimental period. However, the change in the defect width was negligible, and the sample did not reach the stage where a continuous leakage current was generated. This indicates that the duration of each arc was very short, resulting in limited ablation of the insulation.
3.3. Liquid Immersion Condition
The defective cable was fully immersed in liquid with a conductivity of 3 mS/cm and a defect width of 1.2 mm. The grounding resistance was 30 Ω. Under these conditions, typically no more than five intermittent arcs were observed before transitioning rapidly into a sustained periodic leakage current phase.
Figure 9 presents the sub-cycle arc waveform and periodic current waveform obtained under immersion conditions, which exhibit the same characteristics as those observed under liquid penetration conditions. Compared to the gradual penetration of liquid into insulation defects, immersing defective cable in water allows the liquid to fill the defect more rapidly, leading to a quicker transition into a sustained current leakage status.
3.4. Influence of Grounding Resistance
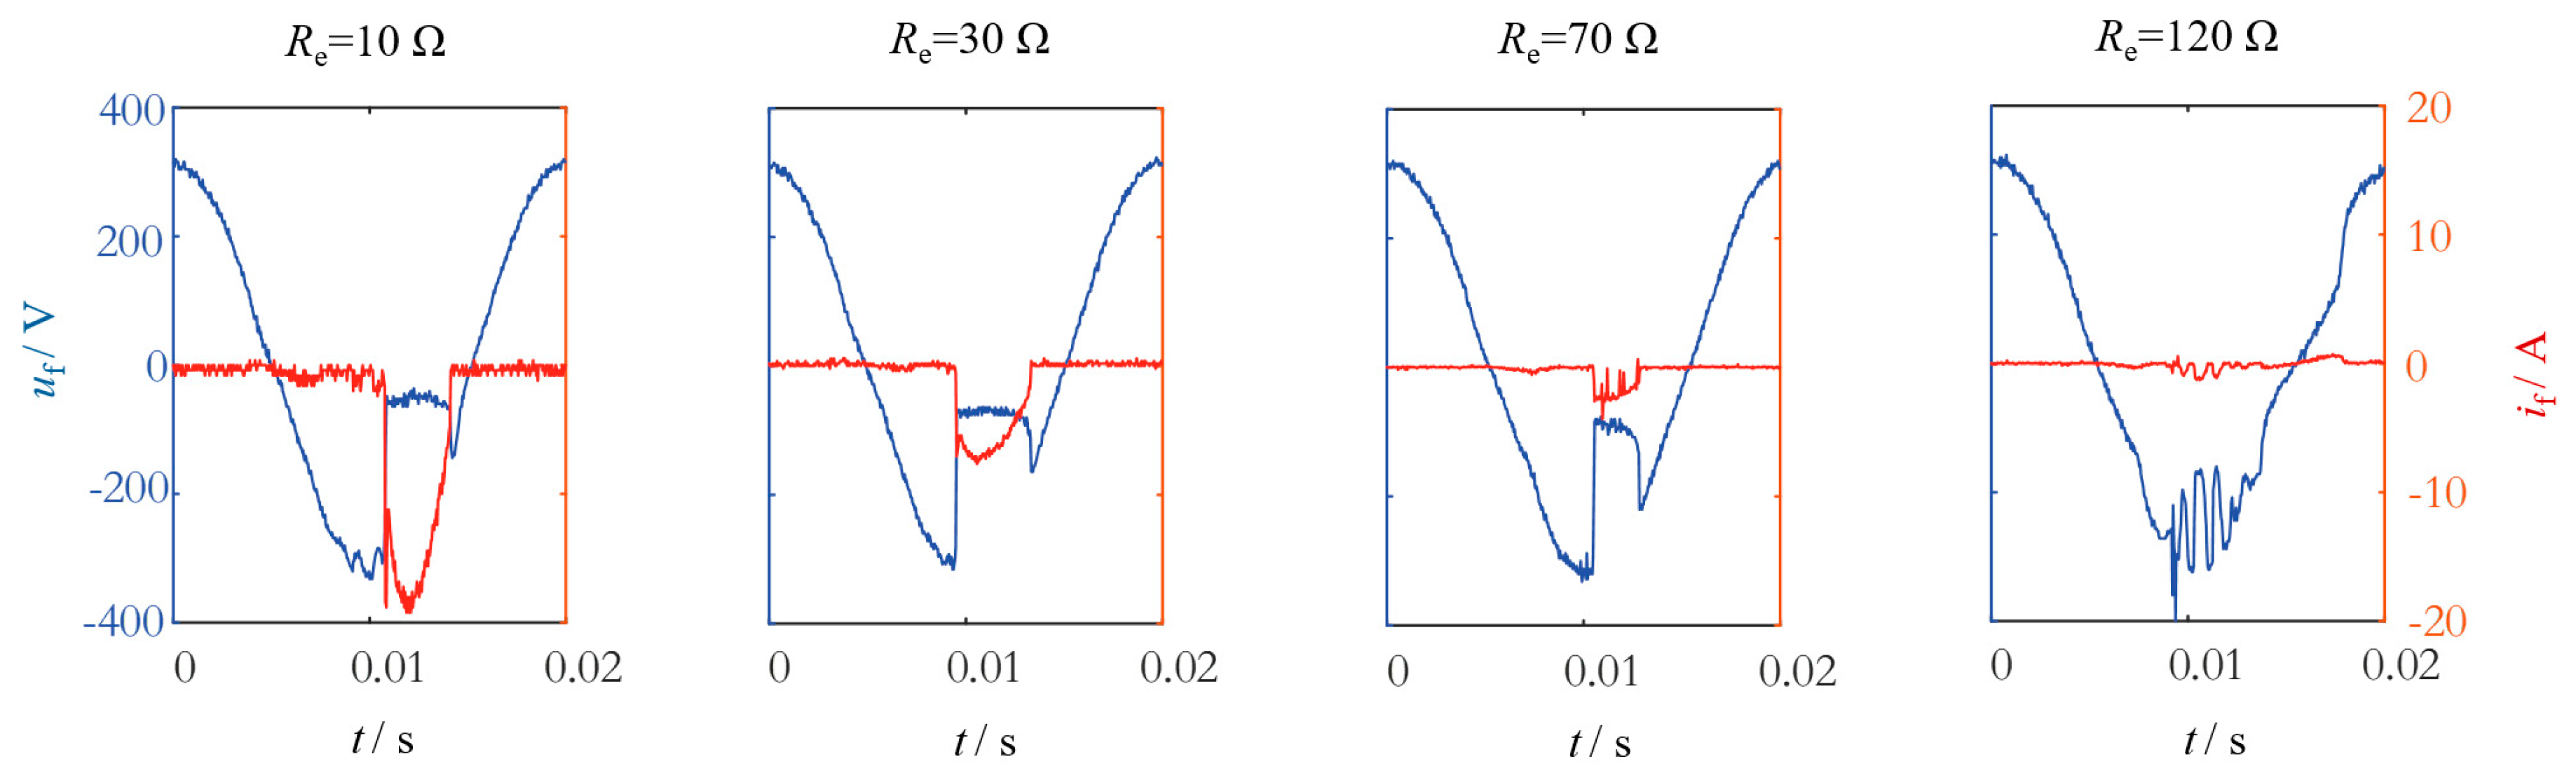
As shown in
Figure 10, for the first two stages of 3.1 and the first stage of 3.3, sub-cycle arc waveforms were recorded under different grounding resistances, with a cable defect width of 1.5 mm. The arcs were generated under liquid penetration conditions, with a liquid conductivity of 3 mS/cm and grounding resistances set to 10 Ω, 30 Ω, 70 Ω, and 120 Ω. The experimental results indicate that as the grounding resistance increases from 10 Ω to 30 Ω, the arc current gradually decreases due to the current-limiting effect of the resistance. The current amplitude reduces from 19 A to 8 A, while the arc voltage and current maintain smooth variations, suggesting that the arc remains relatively stable during combustion. At a grounding resistance of 70 Ω, the voltage and current waveforms exhibit high-frequency components, indicating an unstable arc. When the grounding resistance reaches 120 Ω, voltage and current waveforms show more pronounced fluctuations, with the current amplitude remaining low, peaking at approximately 1 A. This suggests that high grounding resistance significantly suppresses the discharge process, making it difficult for the arc current to form a stable flow. Since arc generation requires sufficient current to sustain ionization in the defect, the entire process remains weak and unstable. Additionally, the number of observed arc occurrences is significantly reduced.
As shown in
Figure 11, for humid air exposure conditions (3.2), sub-cycle arc waveforms were recorded under different grounding resistances, with a cable defect width of 1.2 mm. The arcs were generated in humid air conditions with a relative humidity of 85% and a liquid conductivity of 3 mS/cm. Compared to the variation pattern of the arc in liquid penetration conditions, the common characteristic between the two is that their amplitudes decrease as the grounding resistance increases. However, due to the extremely short duration of transient arcs, the increase in grounding resistance does not significantly affect the waveform shape, and the current consistently maintains a pulse-like form.
As shown in
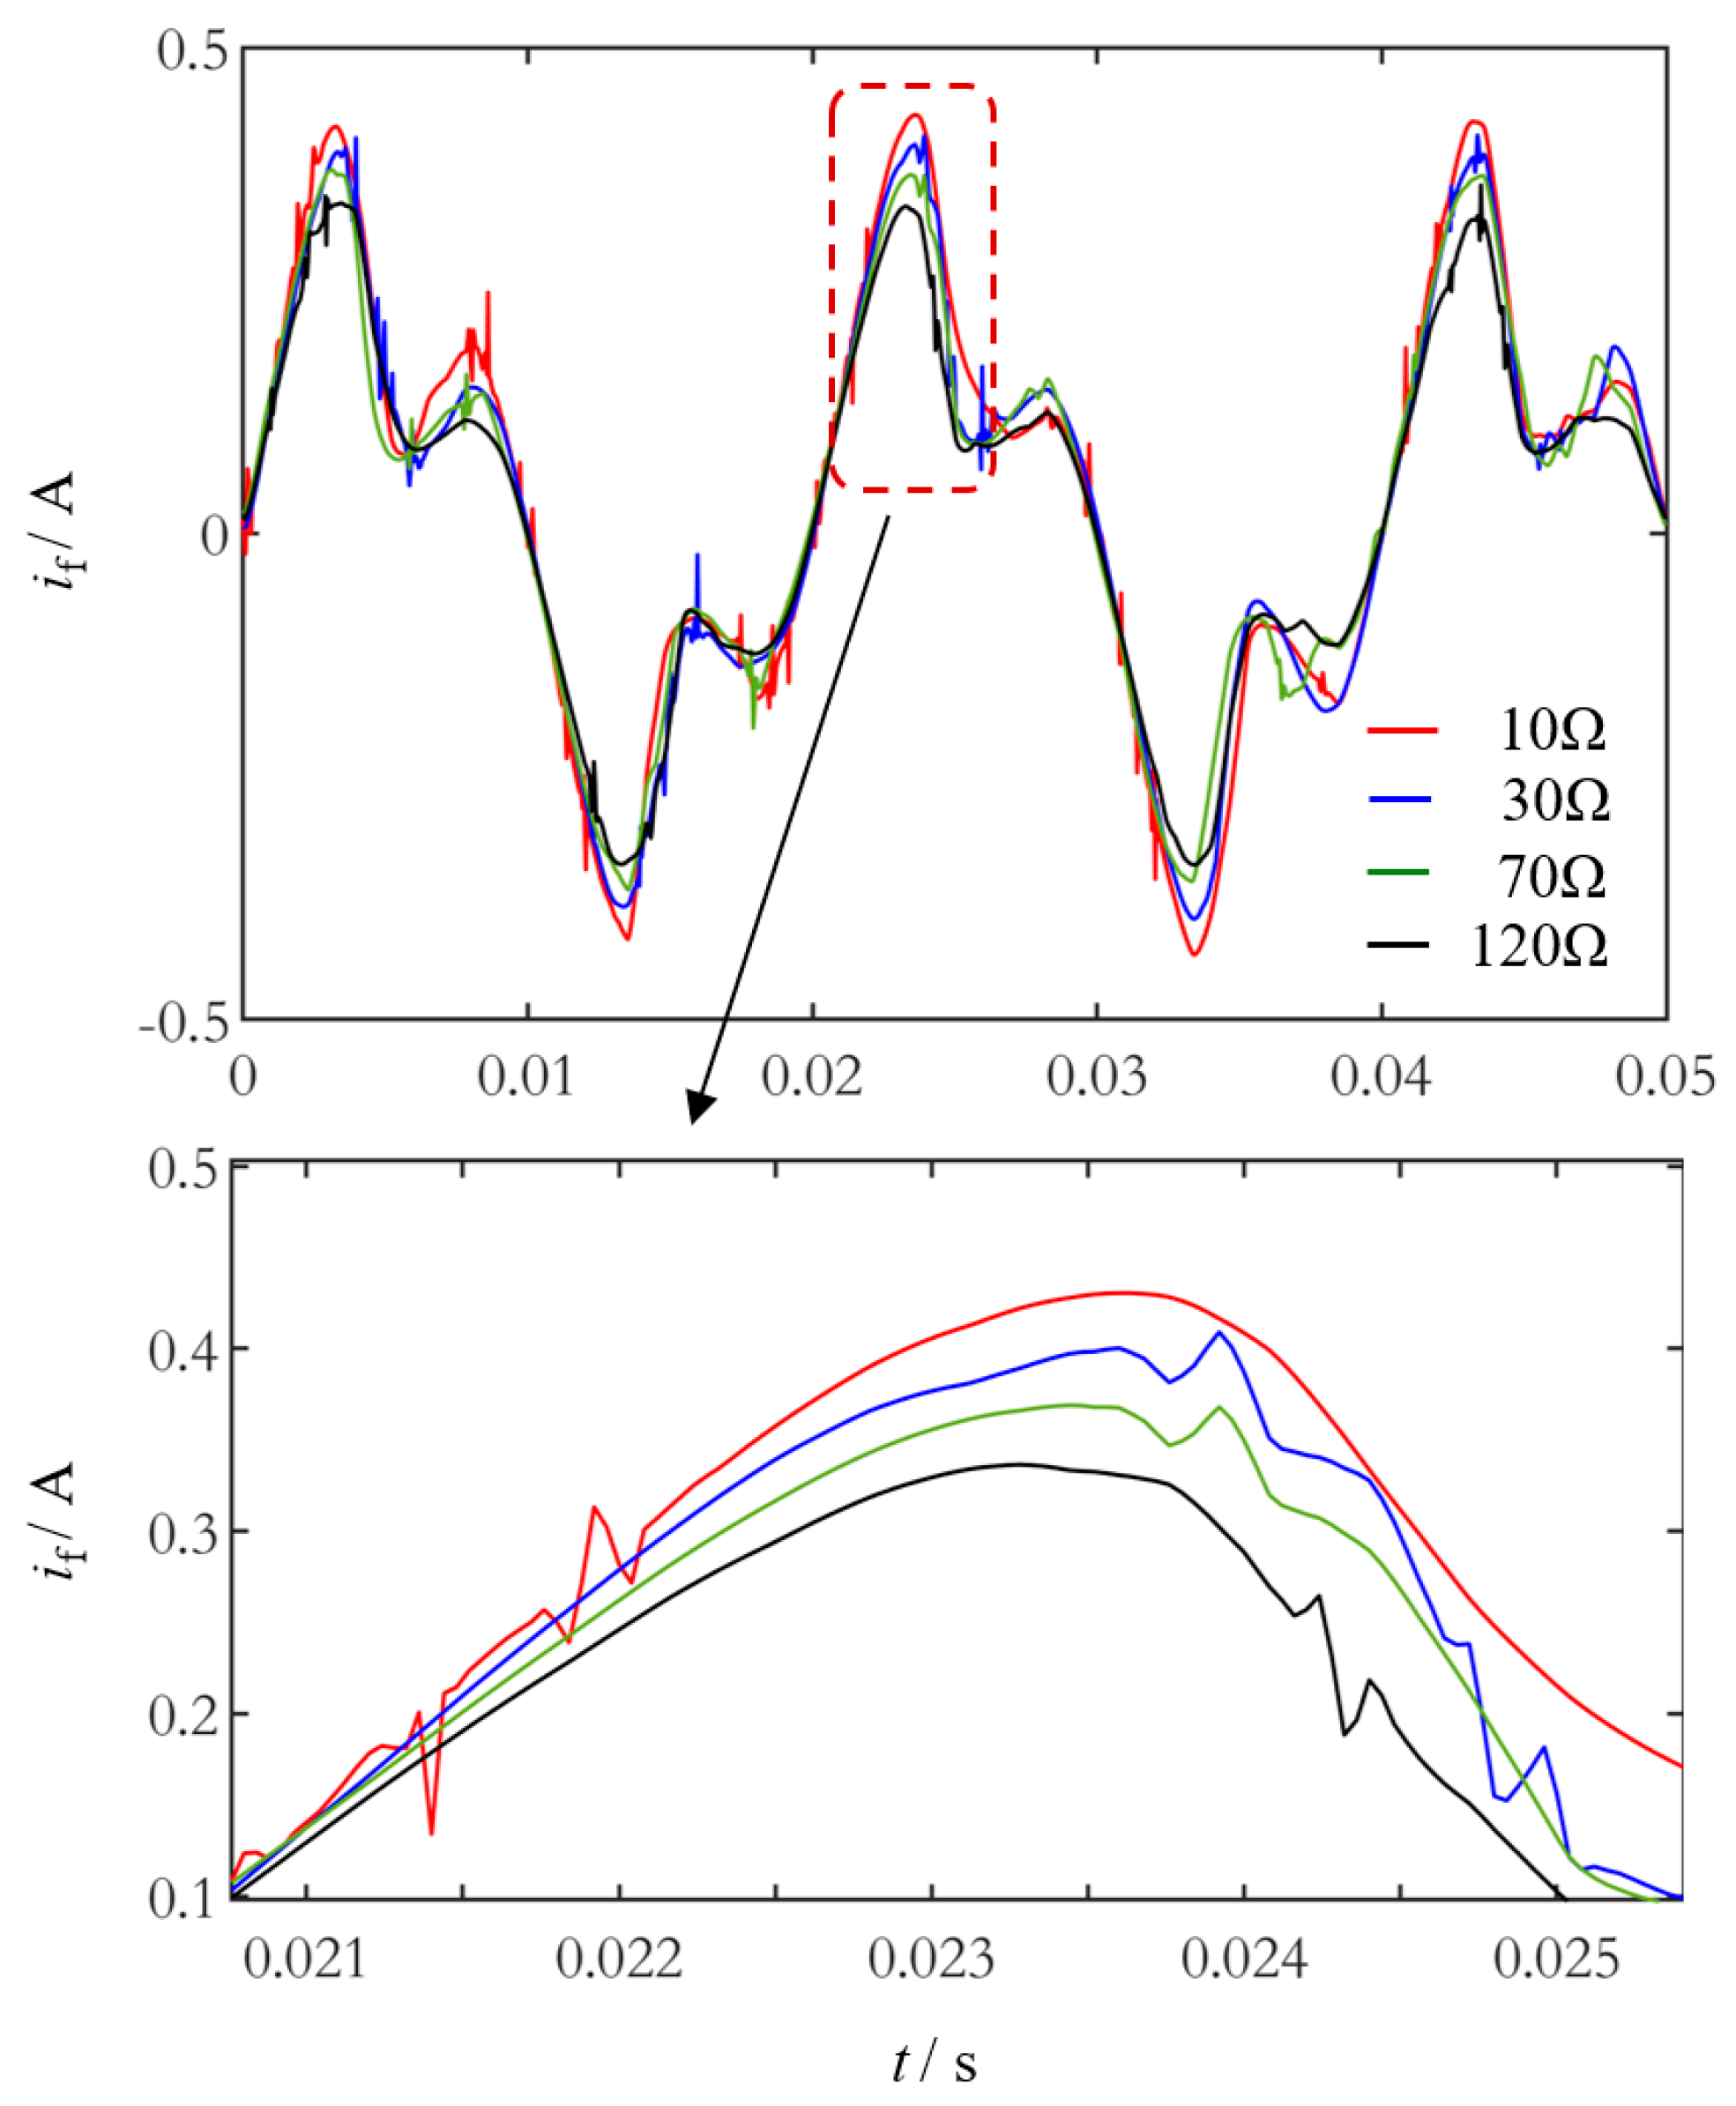
Figure 12, for the third stage of 3.1 and the second stage of 3.3, periodic current waveforms were recorded under different grounding resistances, with an insulation defect width of 2.2 mm. The cable was fully immersed in water with a conductivity of 3 mS/cm. Unlike arc discharge conditions, where the arc state is significantly affected by current amplitude, in this case, the liquid within the insulation defect behaves as a persistent nonlinear resistor. The series-connected grounding resistance only influences the current amplitude without significantly altering the waveform shape. The calculations indicate that the minimum fault resistance formed by the liquid in the insulation defect is approximately 700 Ω. Consequently, as the grounding resistance increases from 10 Ω to 120 Ω, the peak current decreases by only a few milliamps.
3.5. Influence of Liquid Conductivity
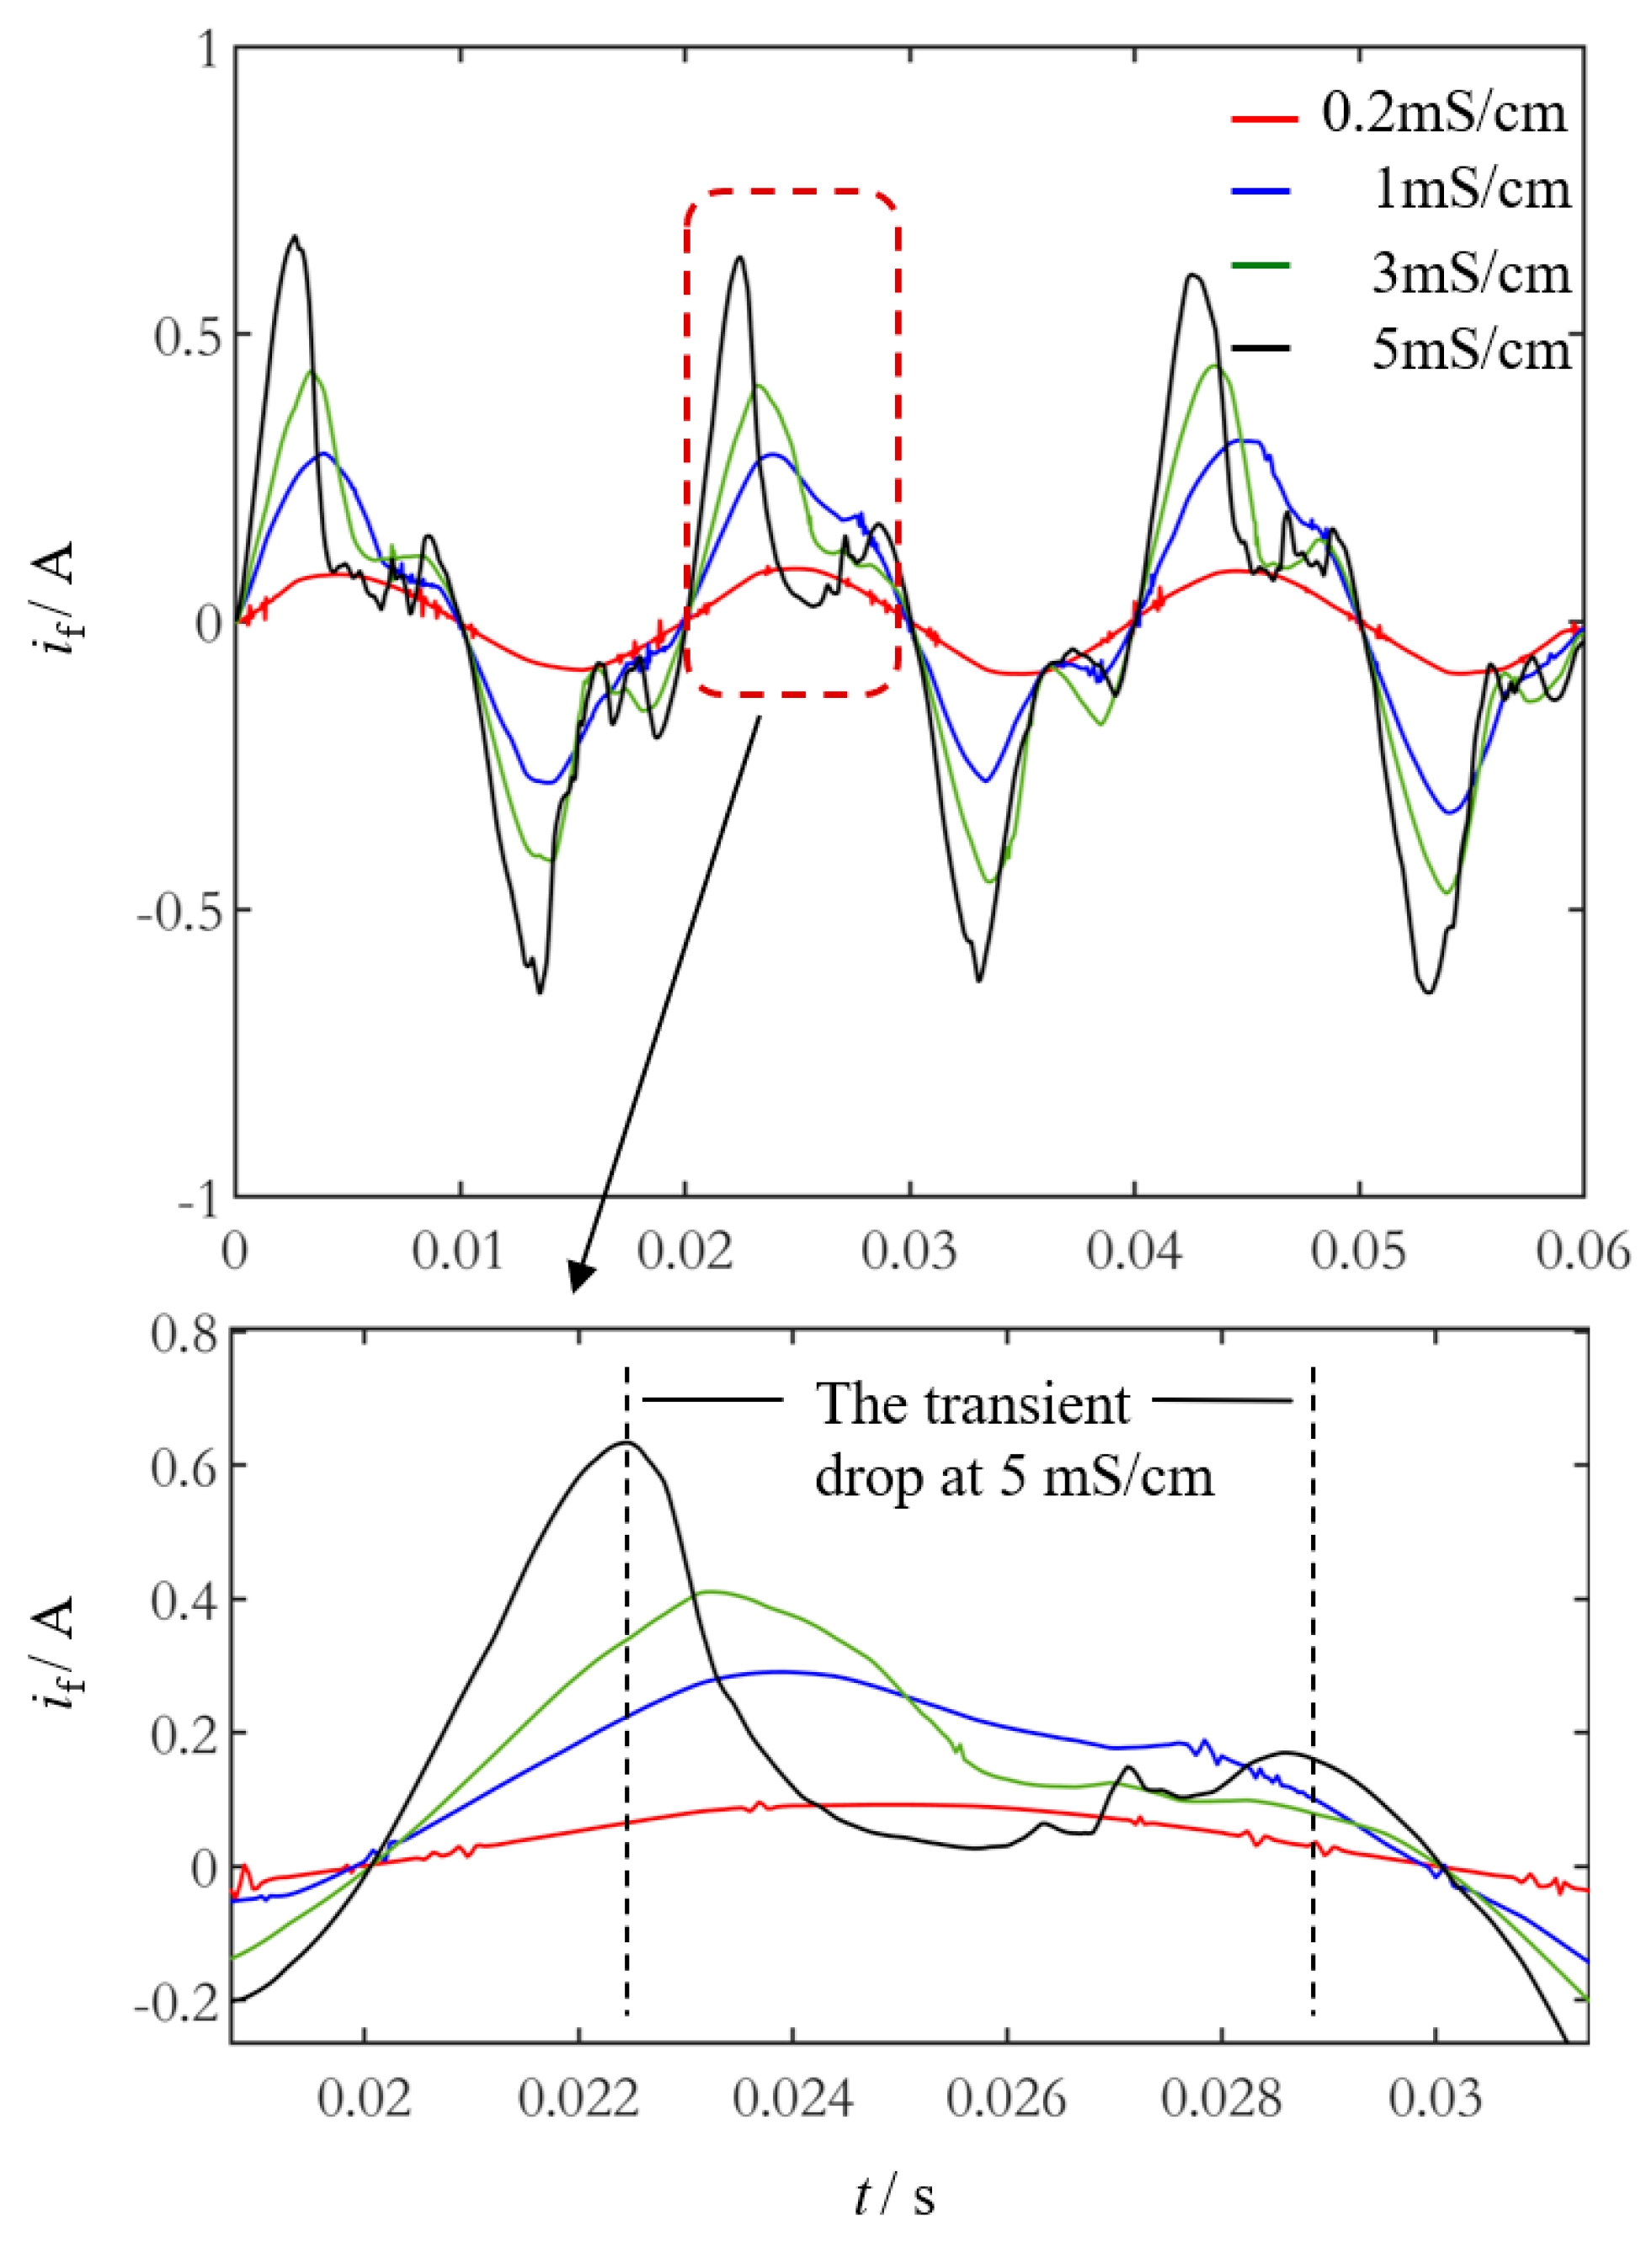
The periodic current waveforms under different liquid conductivities are shown in
Figure 13. The cable defect width is 2.2 mm, the grounding resistance is 30 Ω, and the cable is immersed in water. The liquid conductivity values are set to 0.2, 1, 3, and 5 mS/cm. From the current waveforms, it can be observed that higher liquid conductivity leads to more pronounced current distortion. When the liquid conductivity is 0.2 mS/cm, the current waveform is approximately sinusoidal. As liquid conductivity increases, the current amplitude rises. However, looking into the detailed waveforms, the current exhibits a notch when the voltage approaches the peak. The higher the conductivity, the larger the current notch will be. When the conductivity reaches 5 mS/cm, the notch duration extends beyond a quarter of a cycle. A distinct double-peak phenomenon is observed for the notch current, characterized by a higher left peak and a lower right peak. This unique phenomenon highlights the significant impact of liquid conductivity on leakage current distortion. The underlying physical process will be further discussed in
Section 4.2.
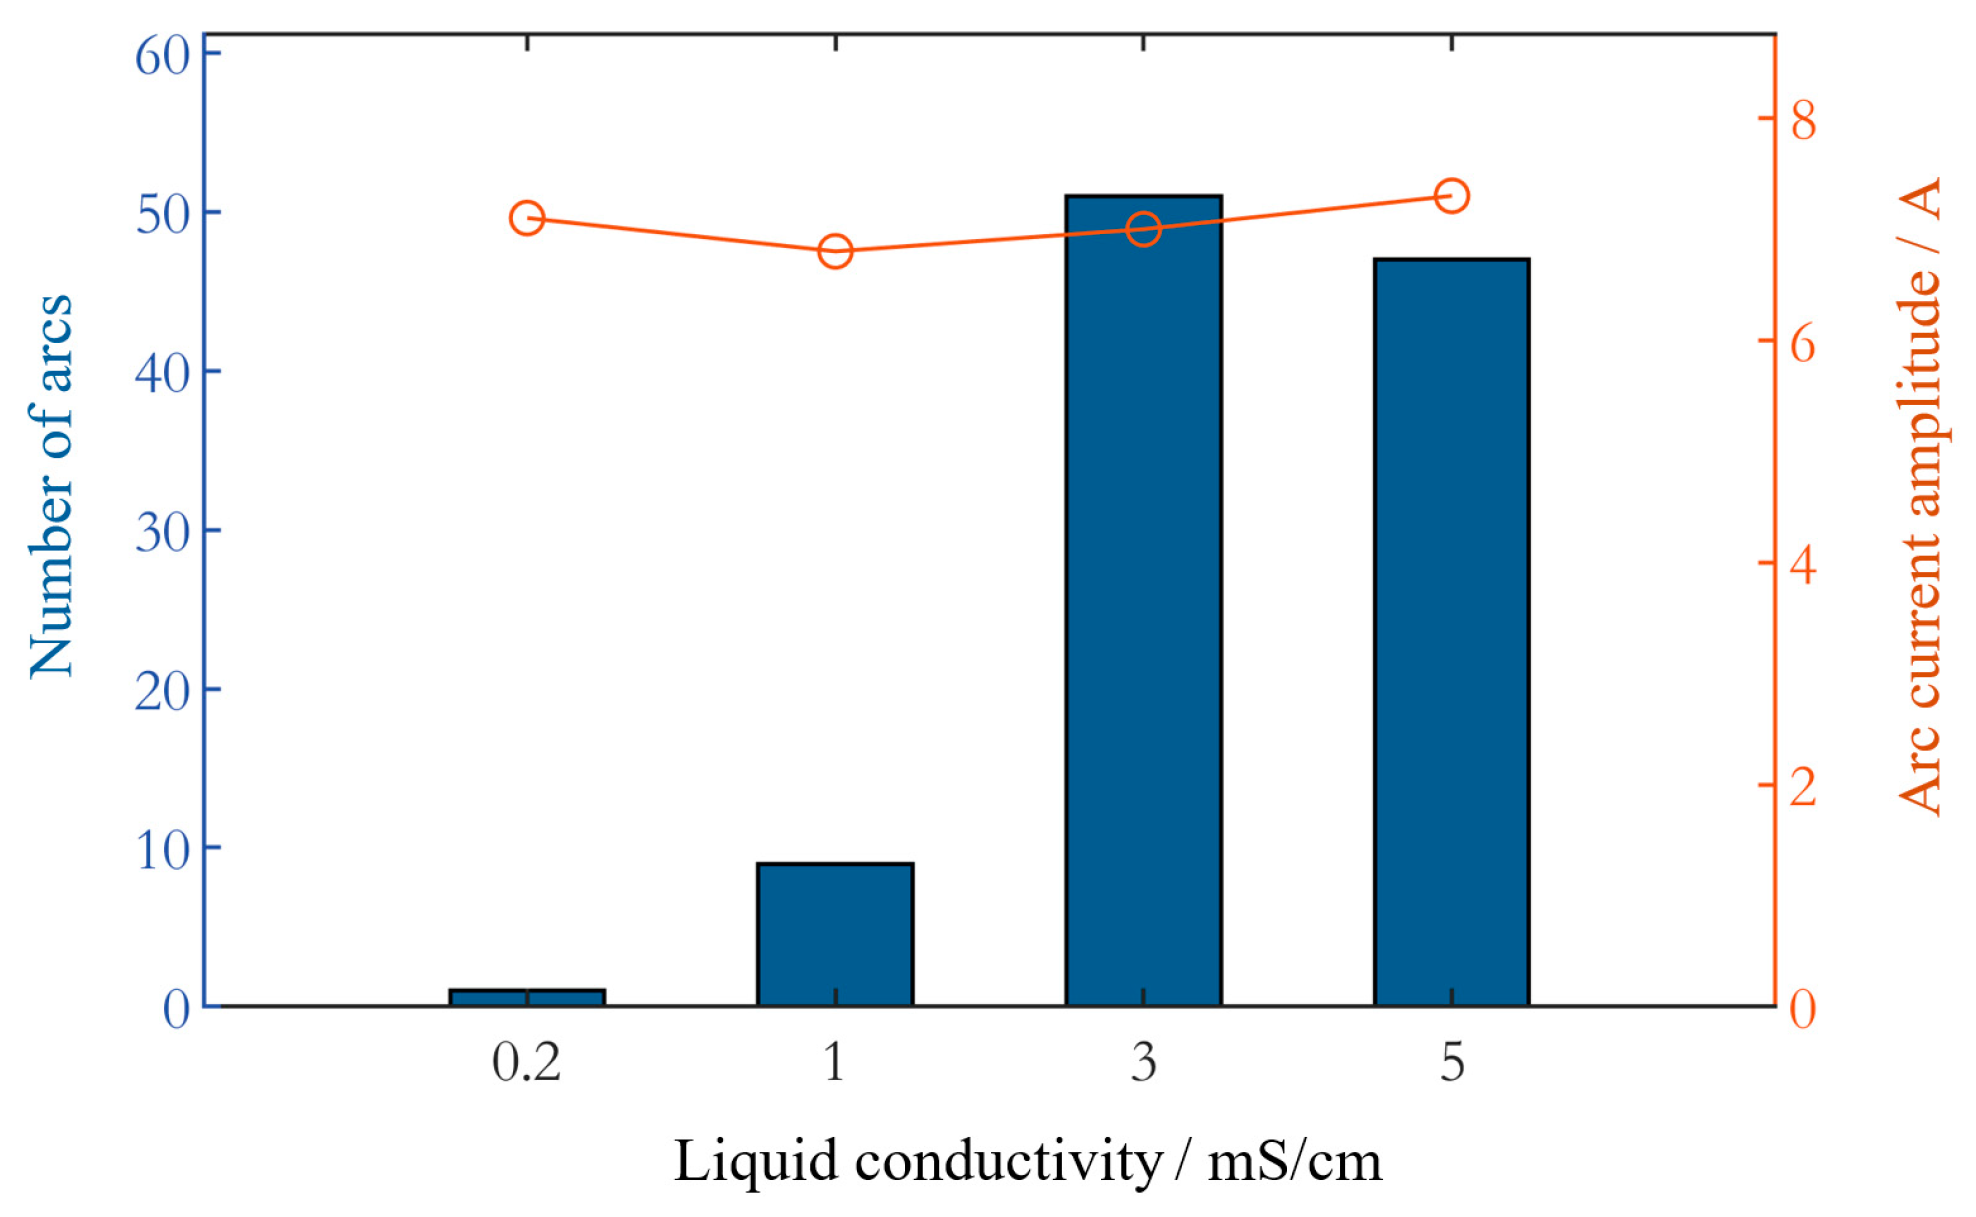
Figure 14 presents the statistical results of intermittent arc occurrences over one hour under different liquid conductivities. The cable defect width is 1.8 mm, and arcs are generated under water penetration conditions with a grounding resistance of 30 Ω. When the liquid conductivity is below 0.2 mS/cm, intermittent arcs are rarely observed. As the conductivity increases to 3 mS/cm, the number of arcs rises significantly, reaching approximately 50. However, when the conductivity further increases to 5 mS/cm, the number of arcs remains the same as that at 3 mS/cm. Despite the increase in liquid conductivity, no significant change is observed in the magnitude of arc current, which remains in the range of 6–8 A, nor is there any noticeable change in current shape. These results indicate that liquid conductivity primarily affects arc generation but has little influence on arc current magnitude.
4. Simulations and Analysis
For intermittent arcs, the variation of the electric field within the cable insulation defect is the decisive factor in arc breakdown. For periodic current, the directional movement of ions in the liquid within the defect forms the fault current, and current distortion is directly related to ion migration. To further understand the phenomenon observed in the experiments, the electric field simulations and analysis of the ion migration are conducted.
4.1. Electric Field Simulation in Defect
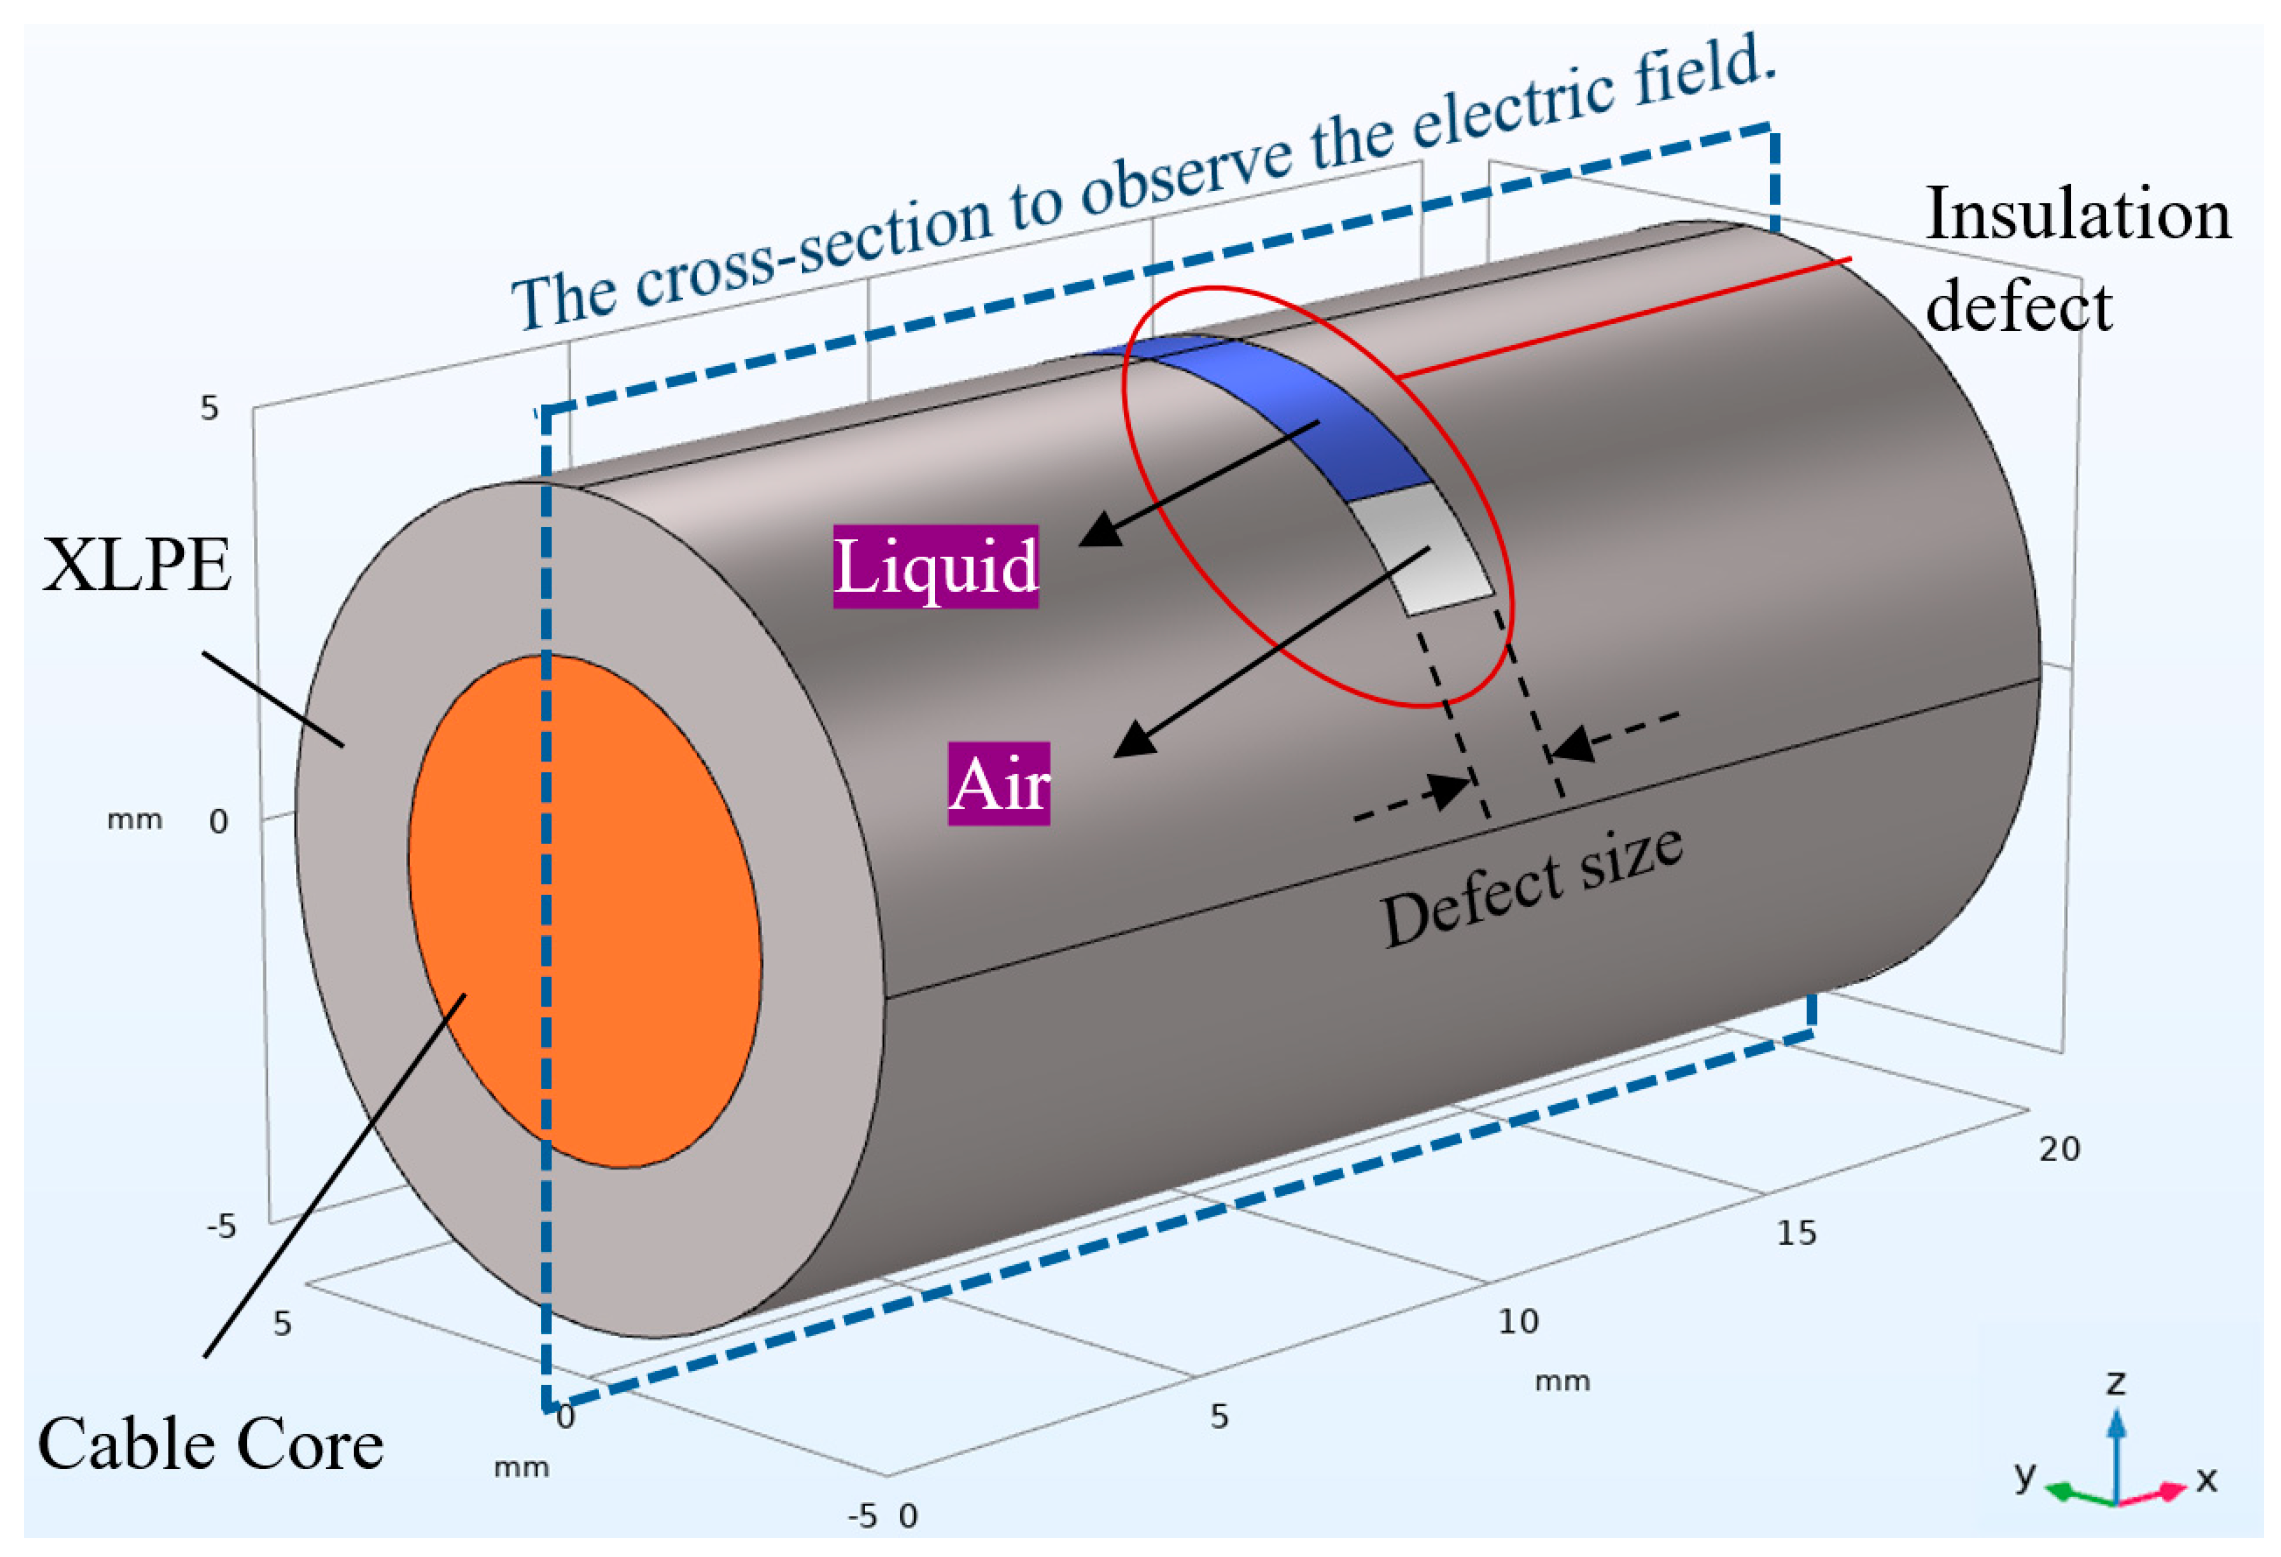
To simulate the electric field distribution within the insulation defect, the COMSOL Multiphysics 6.2 simulation software was used for modeling and analysis. Since the insulation defect region is the primary discharge area, a segment of the cable near the defect was selected for simulation, as shown in
Figure 15. The main components of the simulation model are the cable conductor and the XLPE insulation layer. A through-defect penetrating the insulation layer is placed at the center of the model, with a variable size. The defect region is divided into two parts: the upper part is filled with water, and the lower part with air. The thicknesses of the water and air layers are adjustable to simulate the gradual intrusion of water into the defect. Since breakdown typically occurs near the voltage peak, where the electric field strength is at its maximum, the analysis can be simplified to focus on the electric field distribution at the voltage peak under electrostatic conditions. The relative permittivity of air is set to 1, that of the liquid to 80, and that of XLPE to 2.2, with a thickness of 2 mm. The cable core material is copper, modeled as an equipotential body with a potential of 318 V, while the liquid layer is set to a ground potential.
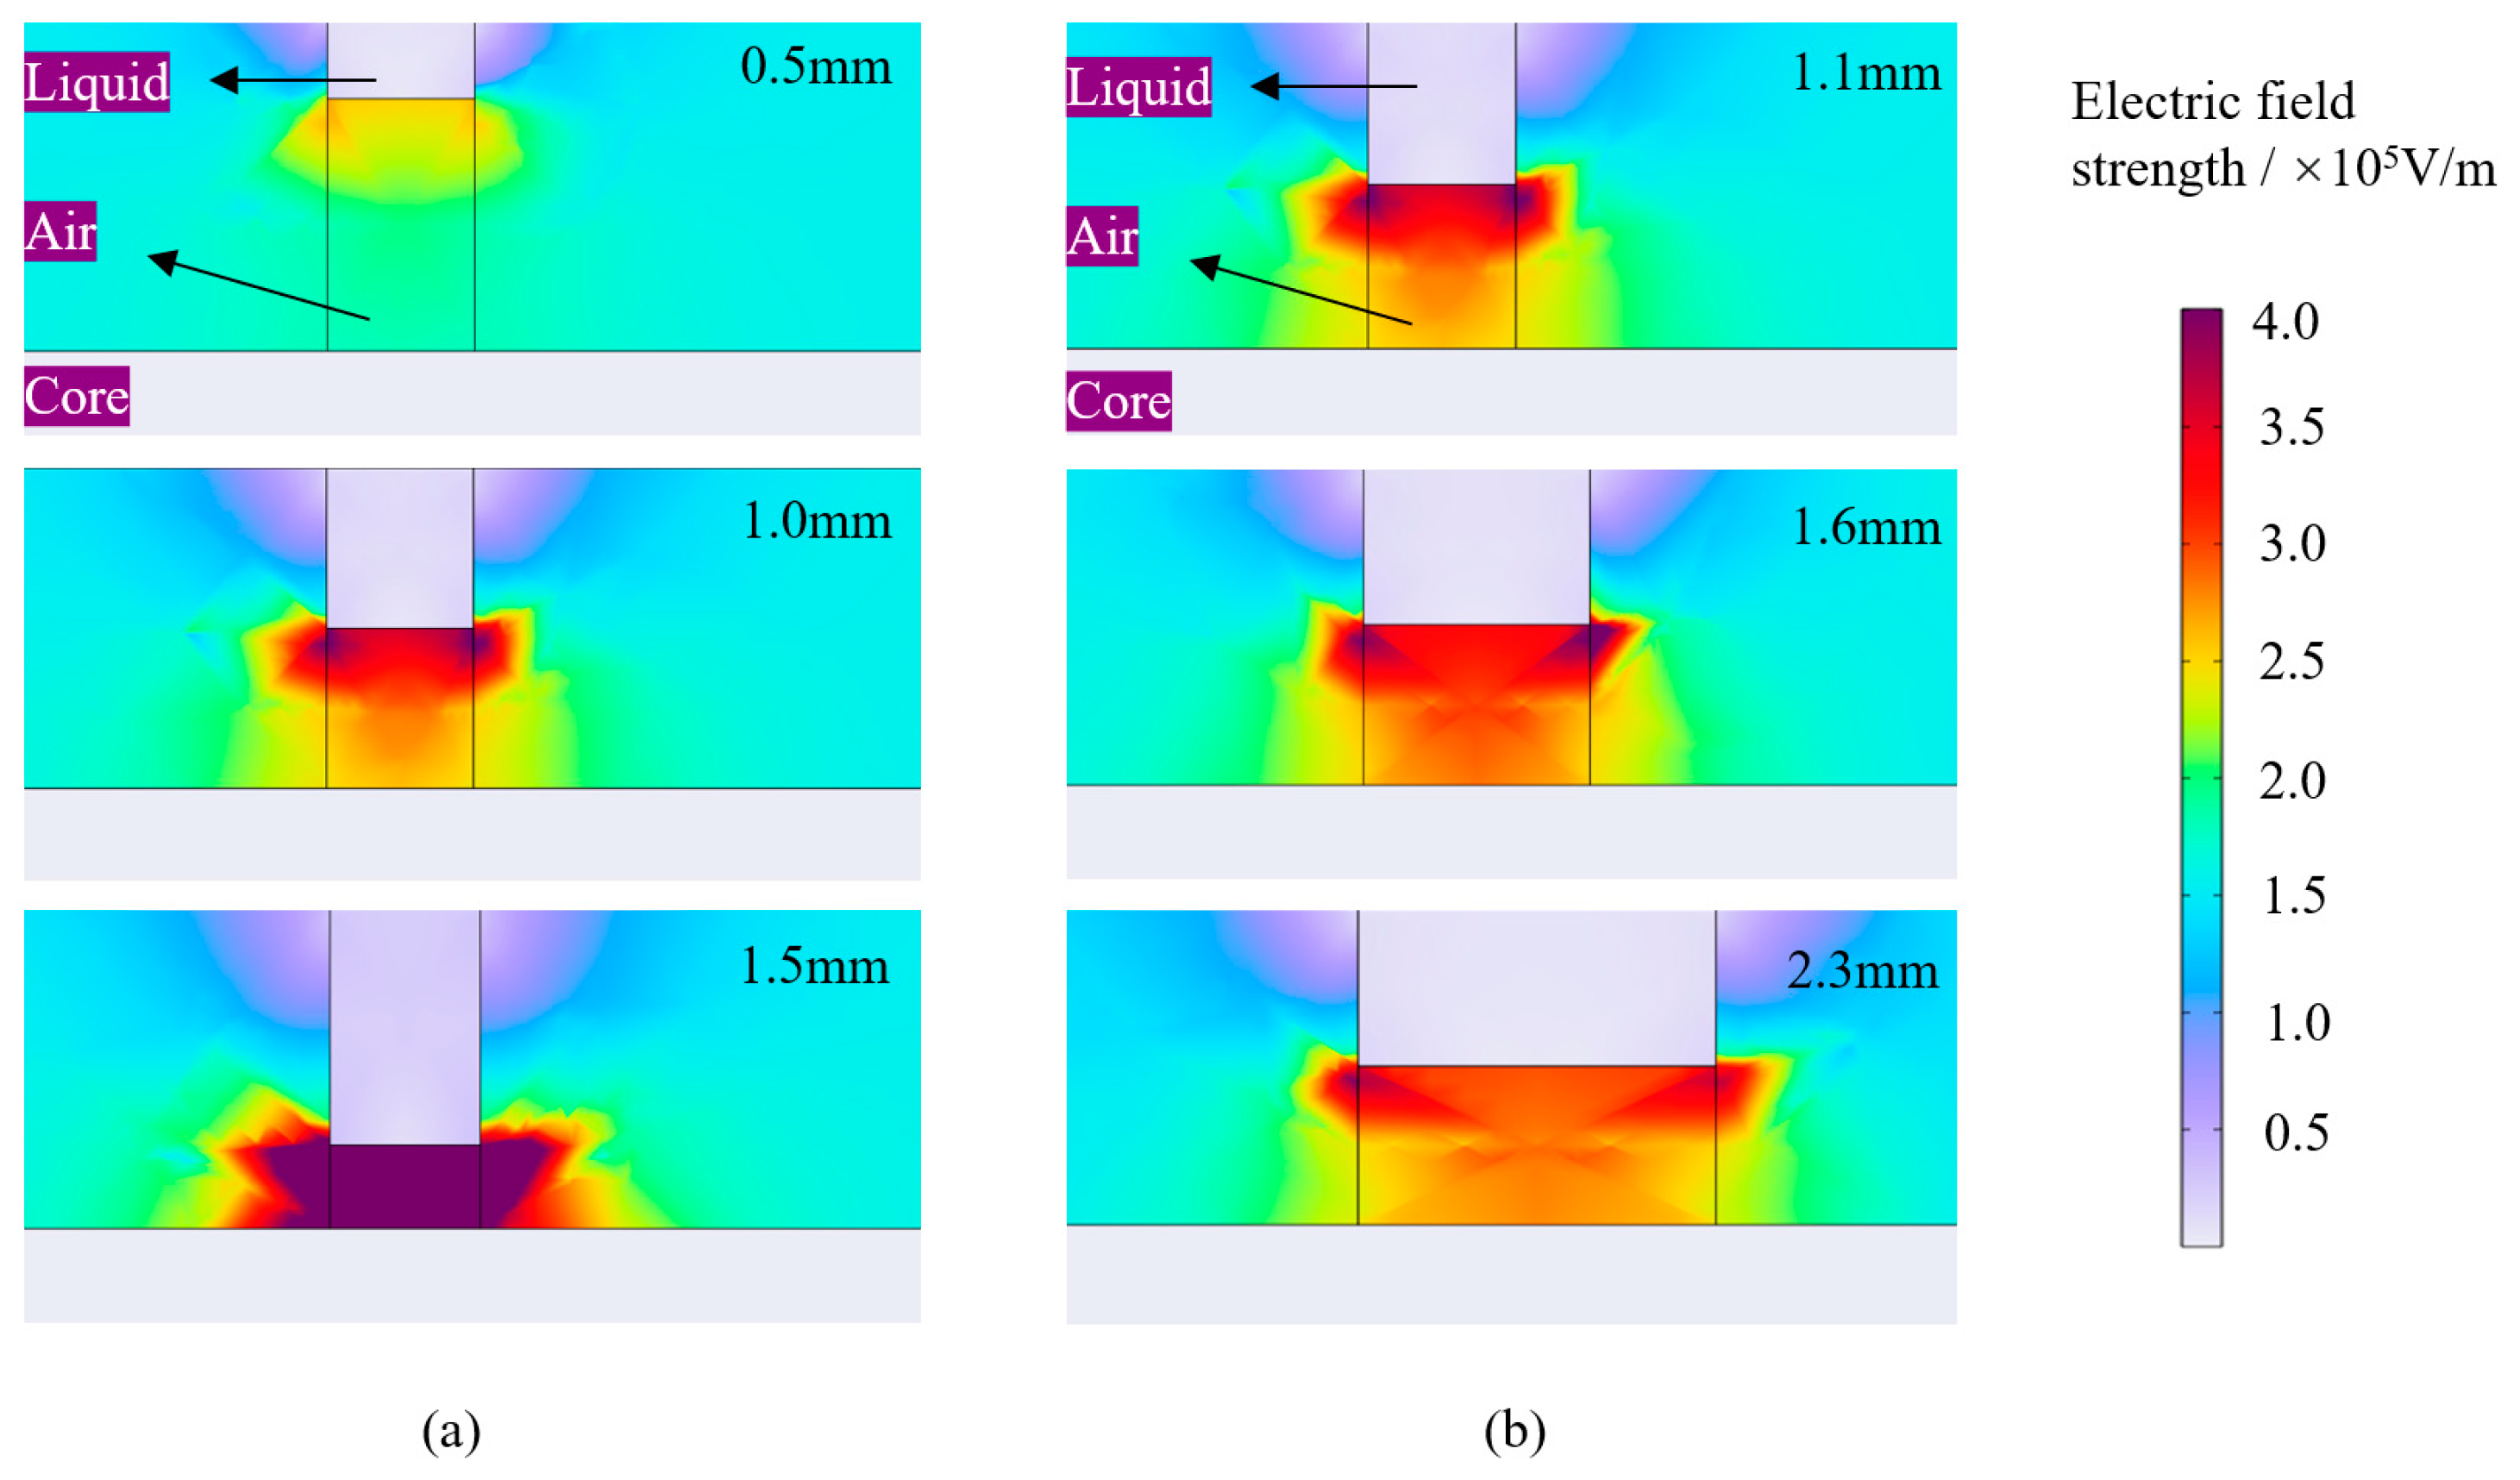
As the liquid gradually penetrates the insulation defect, the thickness of the water layer increases while the thickness of the air layer decreases. The electric field distributions corresponding to different water layer thicknesses within the defect are shown in
Figure 16a, with the defect width fixed at 1.1 mm. As the water layer becomes thicker, the electric field distribution changes significantly. When the water layer thickness reaches 0.5 mm, the electric field shows a certain degree of concentration at the interface between the water and air layers. However, the overall field strength remains relatively low, around 2.5 kV/cm, with the field near the conductor core at approximately 1.5 kV/cm. As the water layer thickness increases to 1.0 mm, the concentration of the electric field at the interface becomes more pronounced, forming a localized high-field region where the maximum electric field strength at the interface reaches 4–5 kV/cm. When the water layer thickness further increases to 1.5 mm, the electric field strength around the entire air column reaches 4–5 kV/cm. In highly non-uniform electric fields, the breakdown strength of air is approximately 3–10 kV/cm, which can lead to electrical breakdown and the formation of an arc within the defect.
The electric field distribution for different insulation defect sizes is shown in
Figure 16b, with the water layer thickness maintained at 1 mm. When the defect width is 1.1 mm, the electric field is concentrated at the interface between the water layer and the air layer. As the defect width increases to 1.6 mm, the degree of field non-uniformity decreases, with the high-field region concentrated at the interface among the air, water, and insulating medium. Further increasing the defect width to 2.3 mm results in a more uniform electric field distribution within the air layer. The increase in defect width allows the electric field to be more evenly distributed throughout the defect area, thereby reducing the concentration of local field strength and lowering the likelihood of breakdown occurrence. On the other hand, a wider defect facilitates greater liquid infiltration and contact with the conductor core, creating a direct conductive path between the core and the ground through the liquid, leading to leakage current and a decrease in arc occurrence frequency.
4.2. Analysis of Periodic Current Distortion
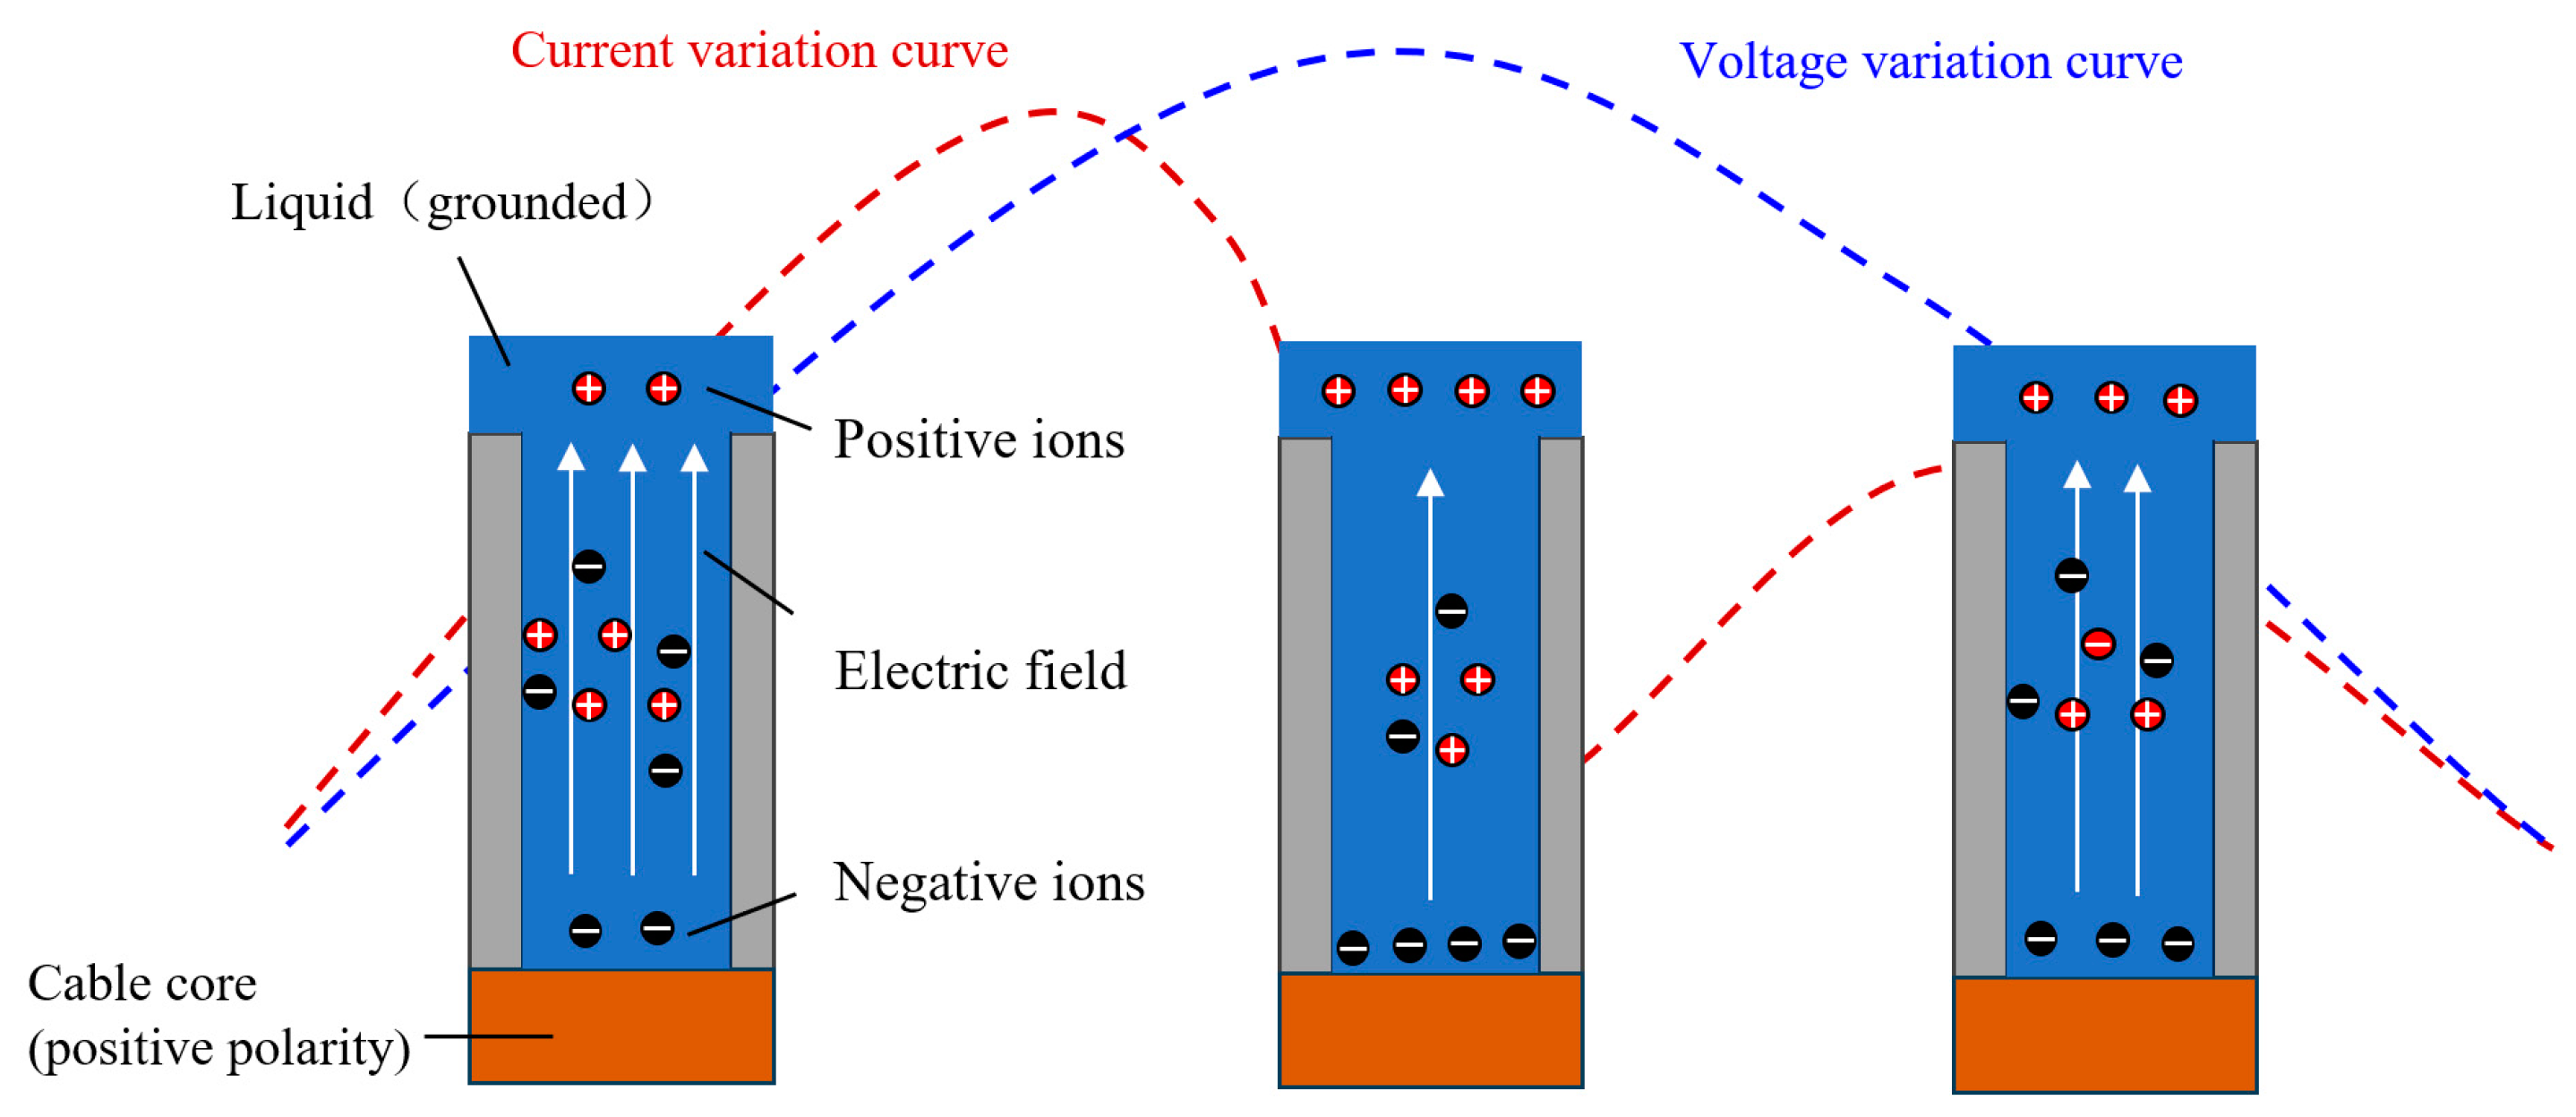
The experimental results indicate that the waveform of the periodic fault current is directly related to the liquid conductivity, meaning that the ion concentration in the liquid influences the degree of current distortion. When the cable core meets the liquid, it acts as an electrode, and the charge distribution on its surface causes the rearrangement of ions within the liquid. Under the influence of the electric field, positive and negative ions in the liquid undergo directional migration, forming a current. Oppositely charged ions accumulate on the surface of the cable core, thereby affecting both the electric field strength and the magnitude of the current.
During half a cycle, as the voltage gradually increases, the electric field strength near the surface of the cable core (under positive polarity) intensifies. At this stage, negative ions in the liquid migrate toward the surface of the cable core under the influence of the electric field, while positive ions move toward the grounded liquid end. The higher the ion concentration, the greater the number of ions migrating per unit time, resulting in a larger current. As the voltage approaches its peak, many ions rapidly accumulate on the metal surface of the cable core. These accumulated ions generate an electric field component opposite to the externally applied electric field, weakening the electric field within the defect and hindering further ion migration in the liquid, thereby reducing the current. A higher ion concentration leads to a greater accumulation of ions, producing a stronger opposing electric field, which causes the current to decrease more quickly and significantly. After the voltage surpasses its peak and begins to decrease, the ion accumulation rate slows, while the rate at which ions leave the cable core surface relatively increases. As a result, the number of accumulated ions on the electrode surface stops increasing and instead begins to decrease. With fewer accumulated ions, the strength of the opposing electric field generated by these ions gradually weakens. Under the remaining external electric field, the ions in the solution can gradually resume migration, leading to a renewed increase in current. The entire physical process is illustrated in
Figure 17.
6. Application of the Incipient Fault Model
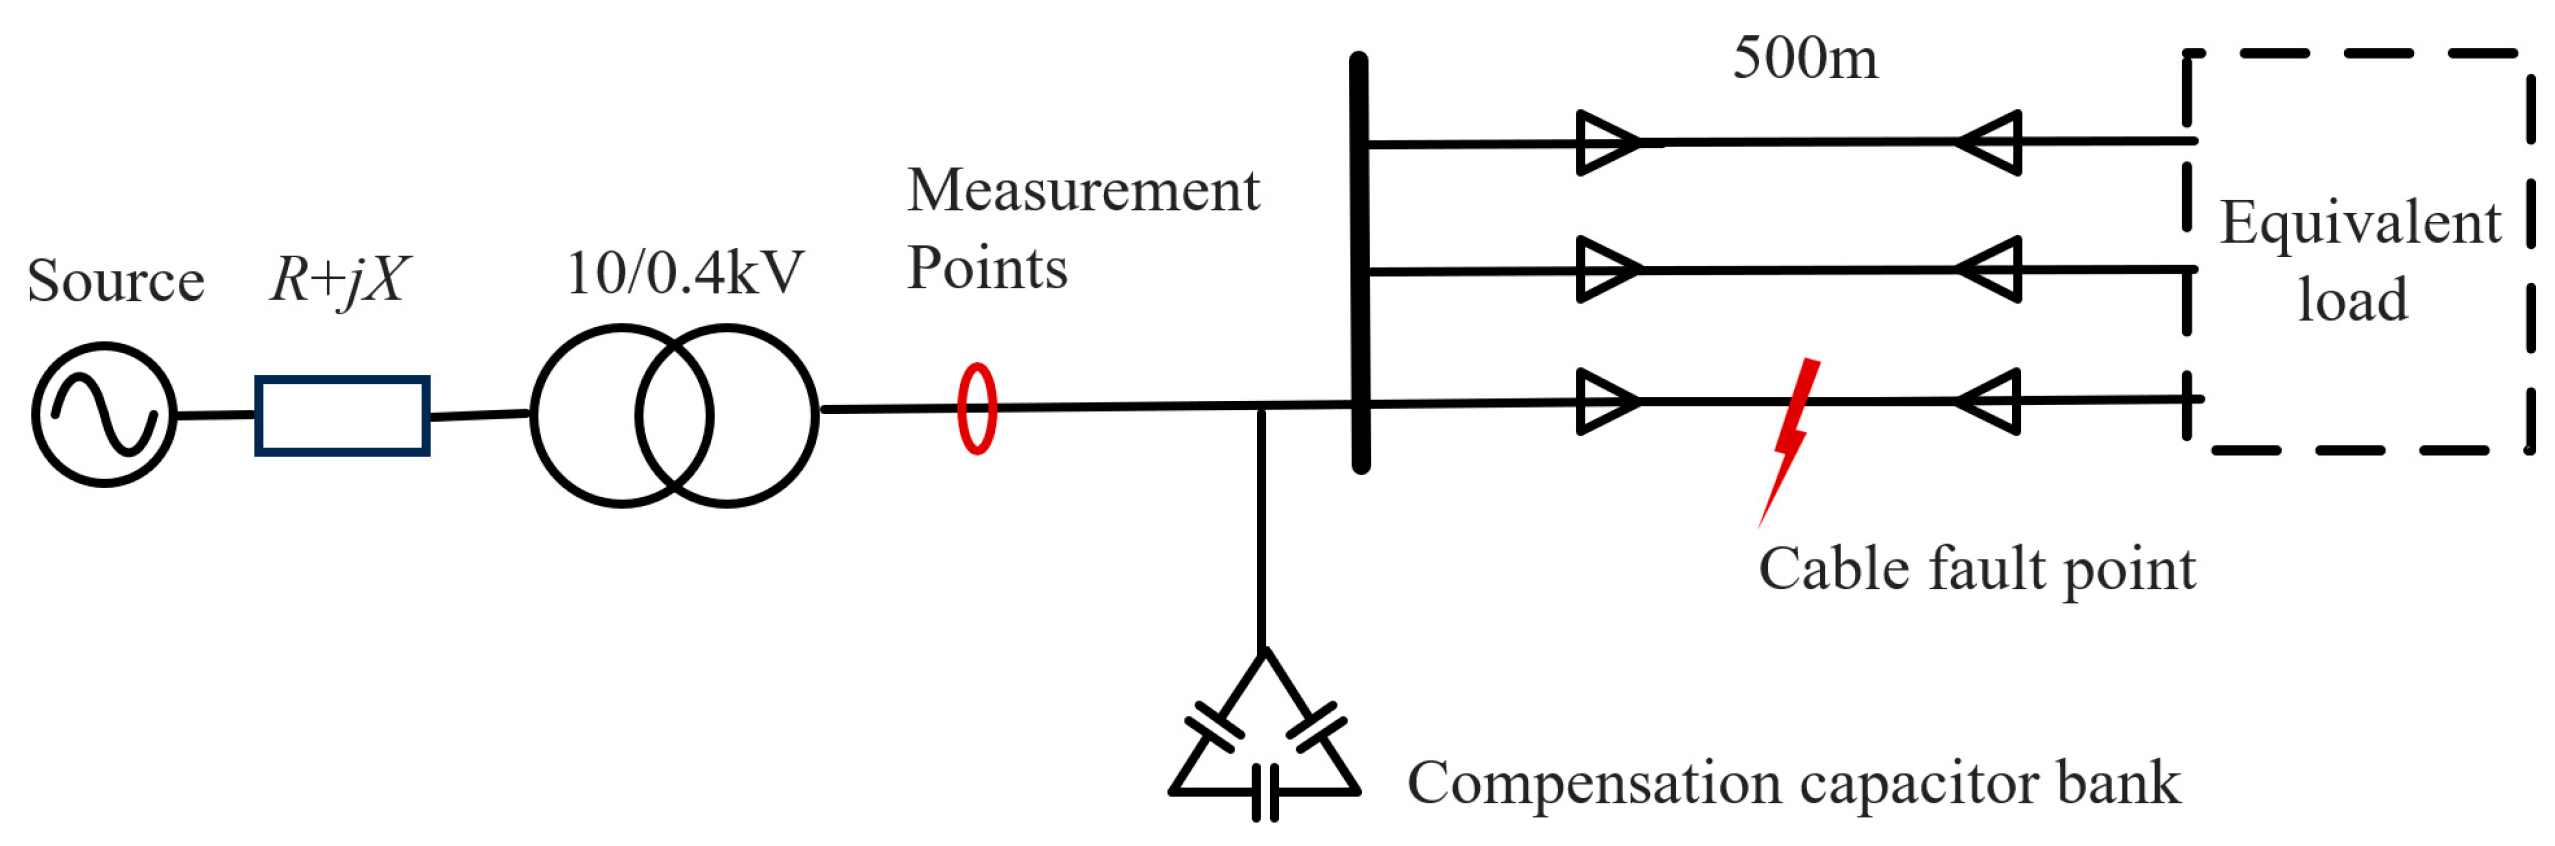
This section shows a cable incipient fault model application case. A low-voltage distribution system, as shown in
Figure 22, is established in Simulink. The system parameters are as follows: The 10 kV system has an equivalent resistance of 0.05 Ω, an equivalent inductance of 1.58 mH, and a short-circuit capacity of 200 MVA. The transformer has a turn ratio of 10/0.4 kV and a capacity of 60 kVA. The system consists of three branch lines, each with a length of 0.5 km. The per-unit-length parameters are: resistance of 0.3 Ω/km, inductance of 0.08 mH/km, and capacitance of 0.2 μF/km. Each line carries a load of 10 kW, resulting in a total system equivalent load of 30 kW with a power factor of 0.88. A power factor compensation capacitor bank with a capacity of 5 kvar is employed, targeting a power factor of 0.93.
In the simulation, the grounding resistance is set to 10 Ω, and the fault point is positioned at the midpoint of the cable. The parameters used in the model are shown in
Table 3 to simulate the typical incipient fault waveforms described in
Section 3.1. Since incipient faults typically occur near the voltage peak, the fault resistance is inserted at the fault point during the peak. At the measurement point located at the sending end of the cable, phase-to-ground voltages and phase currents are recorded.
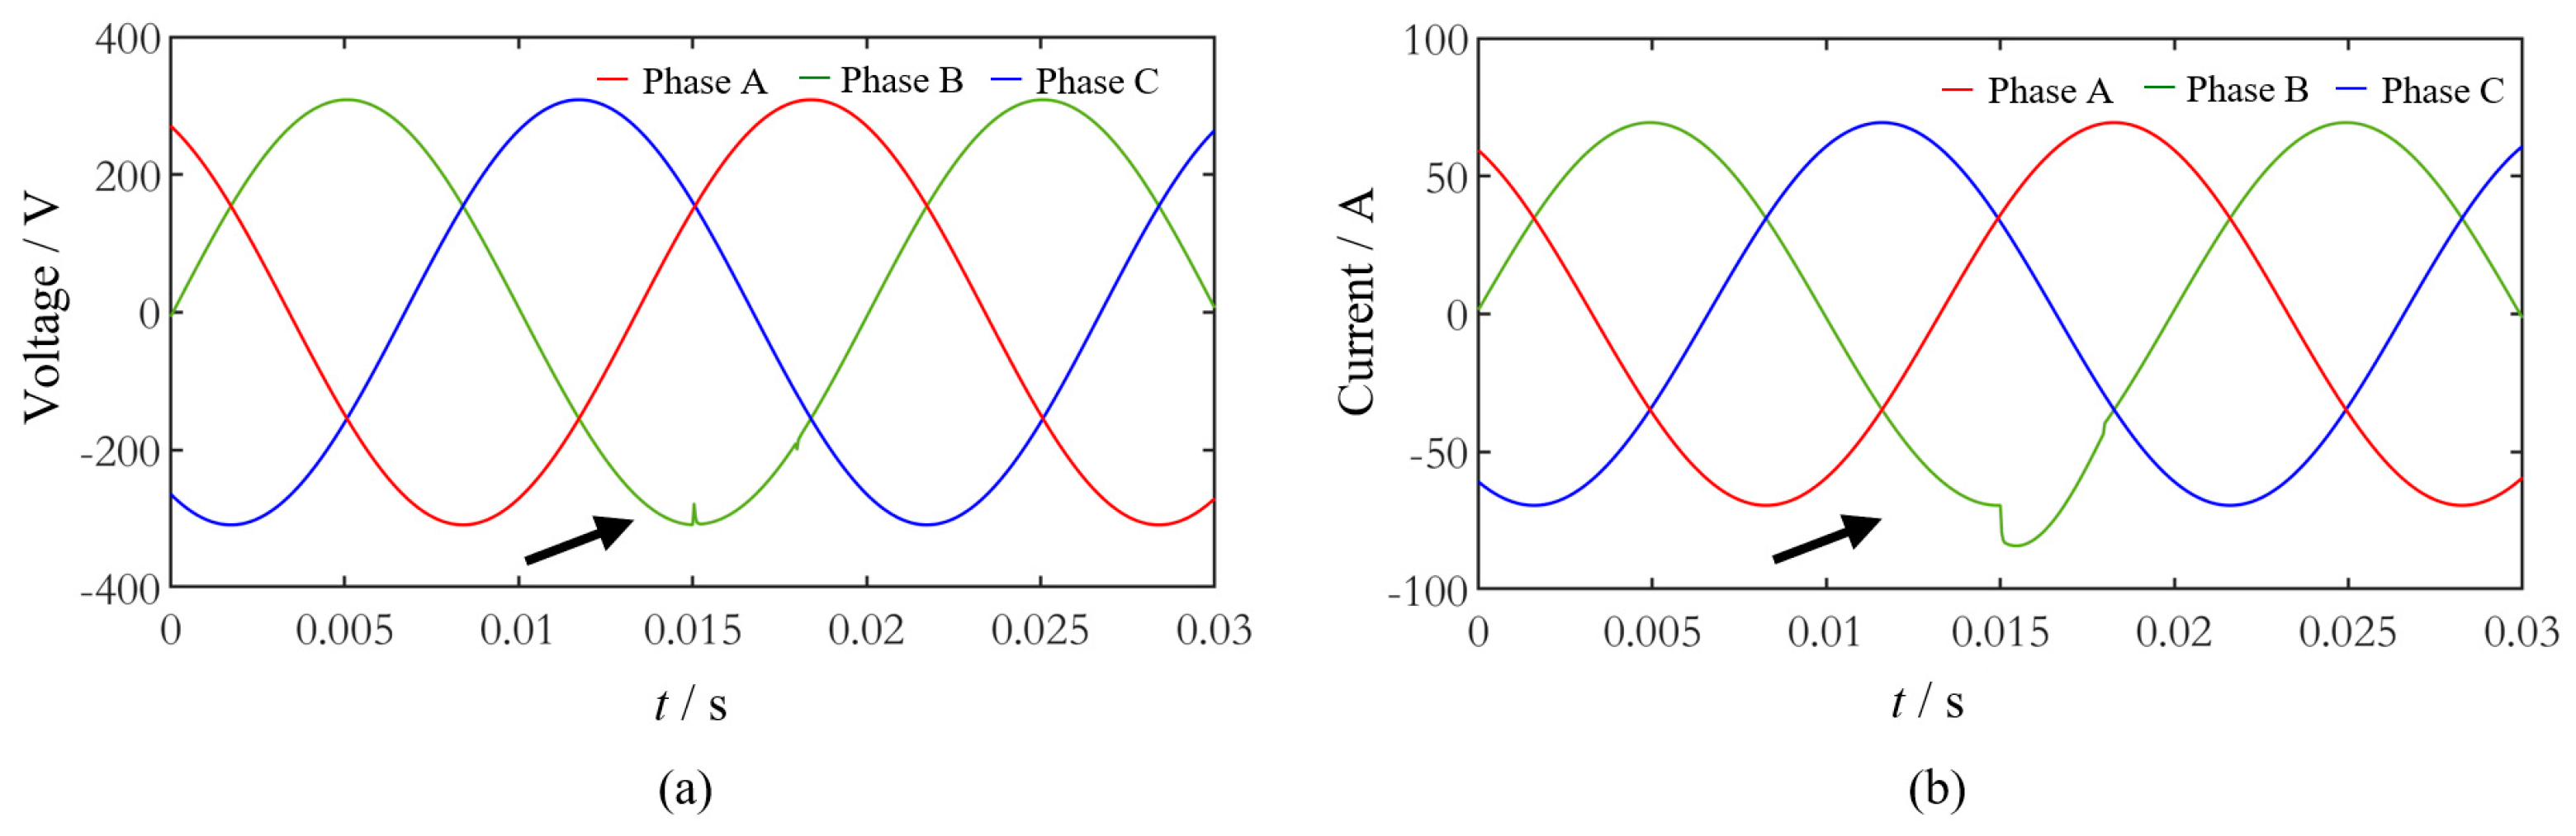
For sub-cycle arcs, when the incipient fault occurs, the fault-phase current measured at the sending end of the line increases suddenly, while the impact on the normal-phase current is negligible. However, due to the low internal impedance and high short-circuit capacity of the power supply side, the voltage disturbances measured at the sending end of the line are relatively small. As a result, the fault-phase voltage exhibits only minor disturbances, as shown in
Figure 23. For periodic fault currents, since their amplitude is generally within 2 A, the voltage and current waveforms at the sending end do not exhibit significant changes.
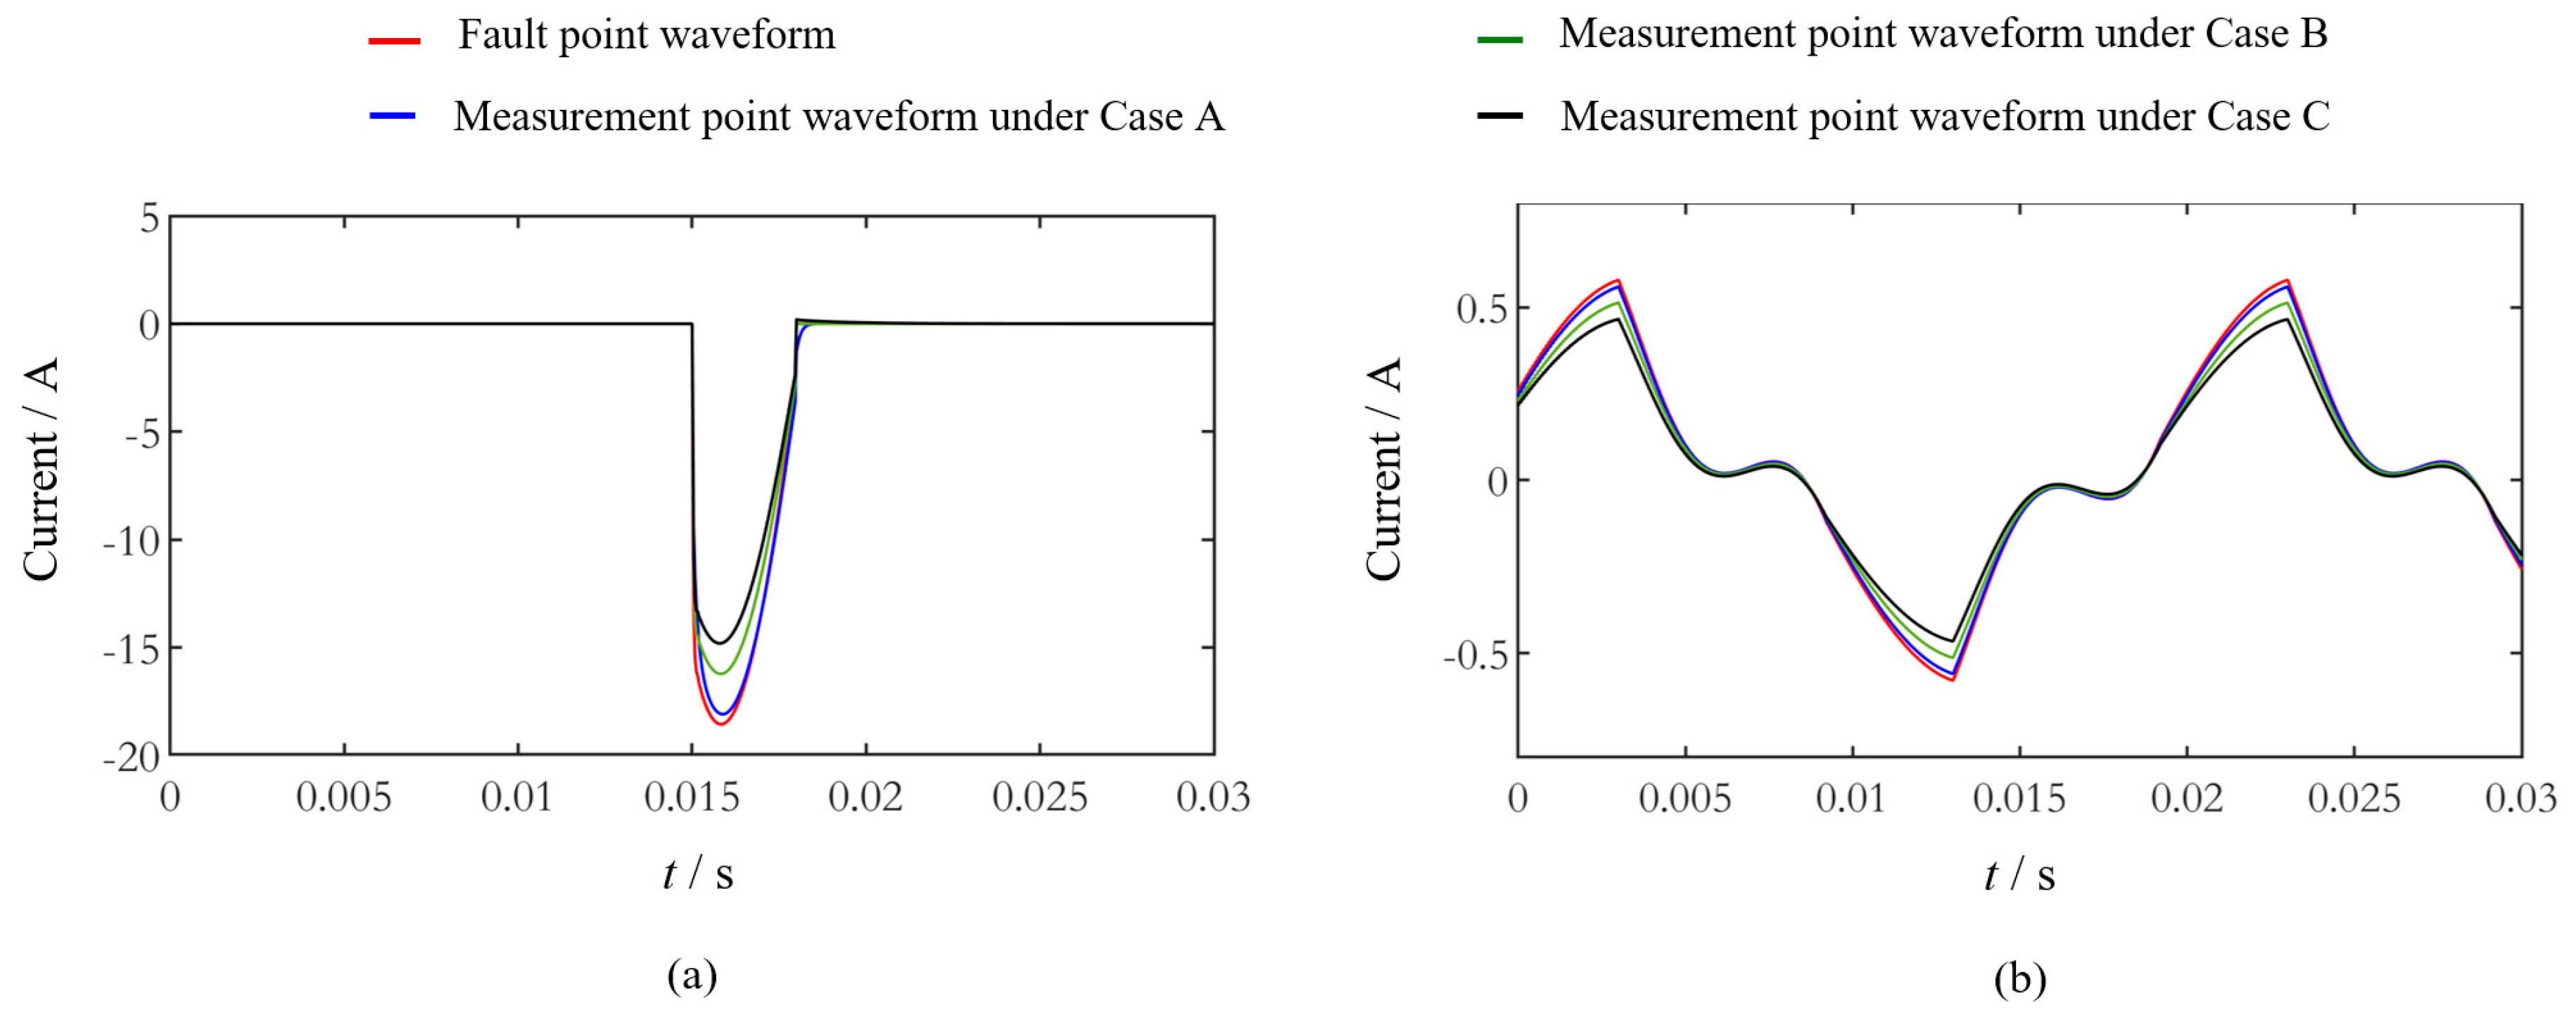
To analyze the characteristics of disturbances measured at the sending end under different system parameters, the incipient fault current is extracted by computing the phasor summation of the measured three-phase currents and is compared with the fault point current.
Table 4 presents three sets of system parameters and calculates the normalized mean square deviation (MSD) between the fault point and sending-end waveforms under sub-cycle arc faults (
σ1) and periodic current faults (
σ2). The results indicate that as the system capacity increases, the MSD between the fault point and sending-end waveforms gradually increases, suggesting that system parameters significantly influence fault waveform propagation.
Figure 24 compares the fault point and sending-end waveforms under three different system parameters. It can be observed that as system capacity increases, the waveform shape at the sending end remains largely unchanged, but its amplitude gradually decreases. Specifically, when the transformer capacity is 500 kVA, the measured sub-cycle current amplitude at the sending end is reduced by 22% compared to the fault point current amplitude, while the periodic current amplitude decreases by 19%.
These findings suggest that in practical engineering applications, leakage currents at the fault point may reach the threshold, but the measured amplitude at the system’s sending-end protection devices may be insufficient to trigger protection mechanisms. Moreover, larger system capacities increase the likelihood of undetected long-term leakage currents, which have significant implications for subsequent fault detection research.
7. Conclusions
This study examines the characteristics of the voltage/current during incipient faults in LV XLPE cables under different wet environments. Research on incipient faults in LV cables remains limited, and the findings of this work provide new experimental evidence and fault modeling insights. The main conclusions and contributions are summarized as follows:
(1) The LV cable incipient fault due to insulation defects exhibits two types of voltage/current waveforms: (a) sub-cycle disturbances at the early stages of the incipient fault; (b) periodic distorted currents (constant leakage currents) at the final stage of the incipient fault. This behavior differs from the commonly held view that cable incipient faults typically evolve into sustained arcing breakdowns in their final phase.
(2) The influence of different conditions on incipient fault characteristics is investigated. Different wet environment conditions primarily affect the frequency of sub-cycle disturbances. Grounding resistance has a significant impact on the magnitude and shape of the arc current, while the conductivity of the surrounding liquid primarily influences arc generation and periodic current distortion.
(3) A new conductivity-controlled model for LV cable incipient faults is proposed to account for the distinctive voltage/current characteristics observed. The model captures the typical fault stages under different wet environments. Although the model is relatively simple in form, it closely matches the experimental waveforms.
(4) Simulation studies based on this model indicate that early fault voltage/current signals can be detected at the sending end of the cable in typical LV distribution systems. However, as the system capacity increases, the signal amplitude tends to decrease accordingly.
Although this work presents new findings on incipient faults in LV XLPE cables, the experiments are limited to single-phase faults. In multi-core cables, inter-phase incipient faults may occur, and their characteristics warrant further investigation. Additionally, how to effectively detect early fault signals at the sending end of the cable remains an open research question for future work.


