Article

Stability Analysis of the Backfill Roof with Basket Weave Drift Layout in Underhand Drift-and-Fill Mining

1
School of Civil and Resource Engineering, University of Science and Technology Beijing, Beijing 100083, China
2
BGRIMM Technology Group, Beijing 100160, China
3
National Centre for International Research on Green Metal Mining, Beijing 100160, China
*
Author to whom correspondence should be addressed.
Appl. Sci. 2025, 15(8), 4487; https://doi.org/10.3390/app15084487
Submission received: 16 March 2025 / Revised: 13 April 2025 / Accepted: 17 April 2025 / Published: 18 April 2025

Abstract

:
The stability of a backfill roof is critical to ensure safe production in underhand drift-and-fill mining. In this method, the basket weave drift layout is widely accepted. However, there is currently limited research on the displacement distribution and strength requirement of the backfill roof with this drift layout. To address the gap, a three-dimensional numerical model was established with FLAC3D, with the Maoping Lead–Zinc Mine as the engineering background, to investigate the stability of a backfill roof with the basket weave drift layout. In numerical simulations, an iterative search method was applied to determine the strength requirements of the backfill roof. The results show that the displacement of the backfill roof with the basket weave drift layout shows columnar or strip-like distribution patterns. The strength requirements (unconfined compressive strength) of the backfill roof in limited equilibrium for drift sizes of 3.5 m × 3.0 m, 4.5 m × 4.0 m, and 5.5 m × 5.0 m were determined to be 1.34 MPa, 1.57 MPa, and 2.38 MPa, respectively. A comparison was also made between the strength requirement predicted by traditional analytical solutions and those obtained from numerical simulations, which shows that traditional solutions tend to yield conservative results. The method and analysis process employed in this study can provide valuable references for backfill strength design in mines using underhand drift-and-fill mining.

1. Introduction

Underhand drift-and-fill mining provides a suitable solution for the extraction of fractured and/or highly stressed ore bodies [1,2]. The strong selective mining capabilities, high ore recovery rates, and minimal void exposure have led to its widespread application in underground metal mines [3]. In this method, the stope is mined layer by layer in a top-down sequence, and each layer is further divided into a series of parallel drifts. The primary drifts are excavated and filled with cemented backfill first, followed by the excavation of secondary drifts. Once all the ore in the layer has been replaced by the cemented backfill that is capable of providing a stable artificial roof for working underneath, the excavation can proceed to the next layer. This process is repeated until the entire ore body within the stope is excavated. Except for in the initial layer, personnel and equipment consistently operate under the constructed backfill roof [4,5]. Therefore, the key to successful implementation of this method lies in the roof’s stability.
Given the typically used primary-and-secondary mining sequence, interfaces will form between the backfill in adjacent drifts [6]. Since the interface generally has a lower strength than the backfill matrix [7], the presence of these interfaces can significantly reduce the continuity and integrity of the backfill roof. To mitigate their potential negative impact, the traditional aligned drift layout is often adjusted to a staggered drift layout, or the basket weave drift layout [1,2], as shown in Figure 1. In practice, the basket weave drift layout is extensively implemented in numerous mines, including the Jinchuan Nickel Mine [8], the Maoping Lead–Zinc Mine [9], and the Wushan Copper Mine [10]. Due to its widespread adoption, it is imperative to conduct an in-depth stability analysis for the backfill roof with the basket weave drift layout.
The stability of a backfill roof is intrinsically related to its strength. A reasonable evaluation of the required strength for roof stability is an integral part of backfill design [11,12,13,14]. To achieve this, analytical methods and numerical simulation are commonly employed. Analytical methods generally model the roof as a beam or plate and utilize elasticity theory to calculate the stress components and derive the strength requirement of the backfill roof. Although analytical methods can rapidly evaluate the strength requirement, their underlying assumptions often limit their applicability. In the basket weave drift layout, the drift driving directions in the adjacent layers are alternating and perpendicular to each other, and the displacement distribution of the backfill roof will differ from those in cases with consistent driving directions, such as aligned or staggered drift layout. In such scenarios, the beam or plate models in analytical methods may fail to accurately capture the actual loading conditions of the backfill roof. Although some numerical simulations have been conducted to study roof stability, they have typically assessed stability based on stress or plastic zone distributions, resulting in highly subjective analysis outcomes [15,16,17]. There is currently limited research on the displacement distribution and strength requirement analysis of backfill roofs with the basket weave drift layout.
This paper introduces an iterative search method for assessing the strength requirement of the backfill roof in numerical simulations. This method can effectively eliminate the subjectivity in traditional roof stability analysis. The method is applied to determine the strength requirements of the backfill roof with the basket weave drift layout in the Maoping Lead–Zinc Mine. A comparison was also made between strength requirements obtained from the numerical simulation and those predicted by traditional analytical solutions. The methodology and analysis process employed in this study can provide valuable references for optimizing drift size and backfill strength design in mines utilizing the underhand drift-and-fill mining method.

2. Numerical Simulation with FLAC3D

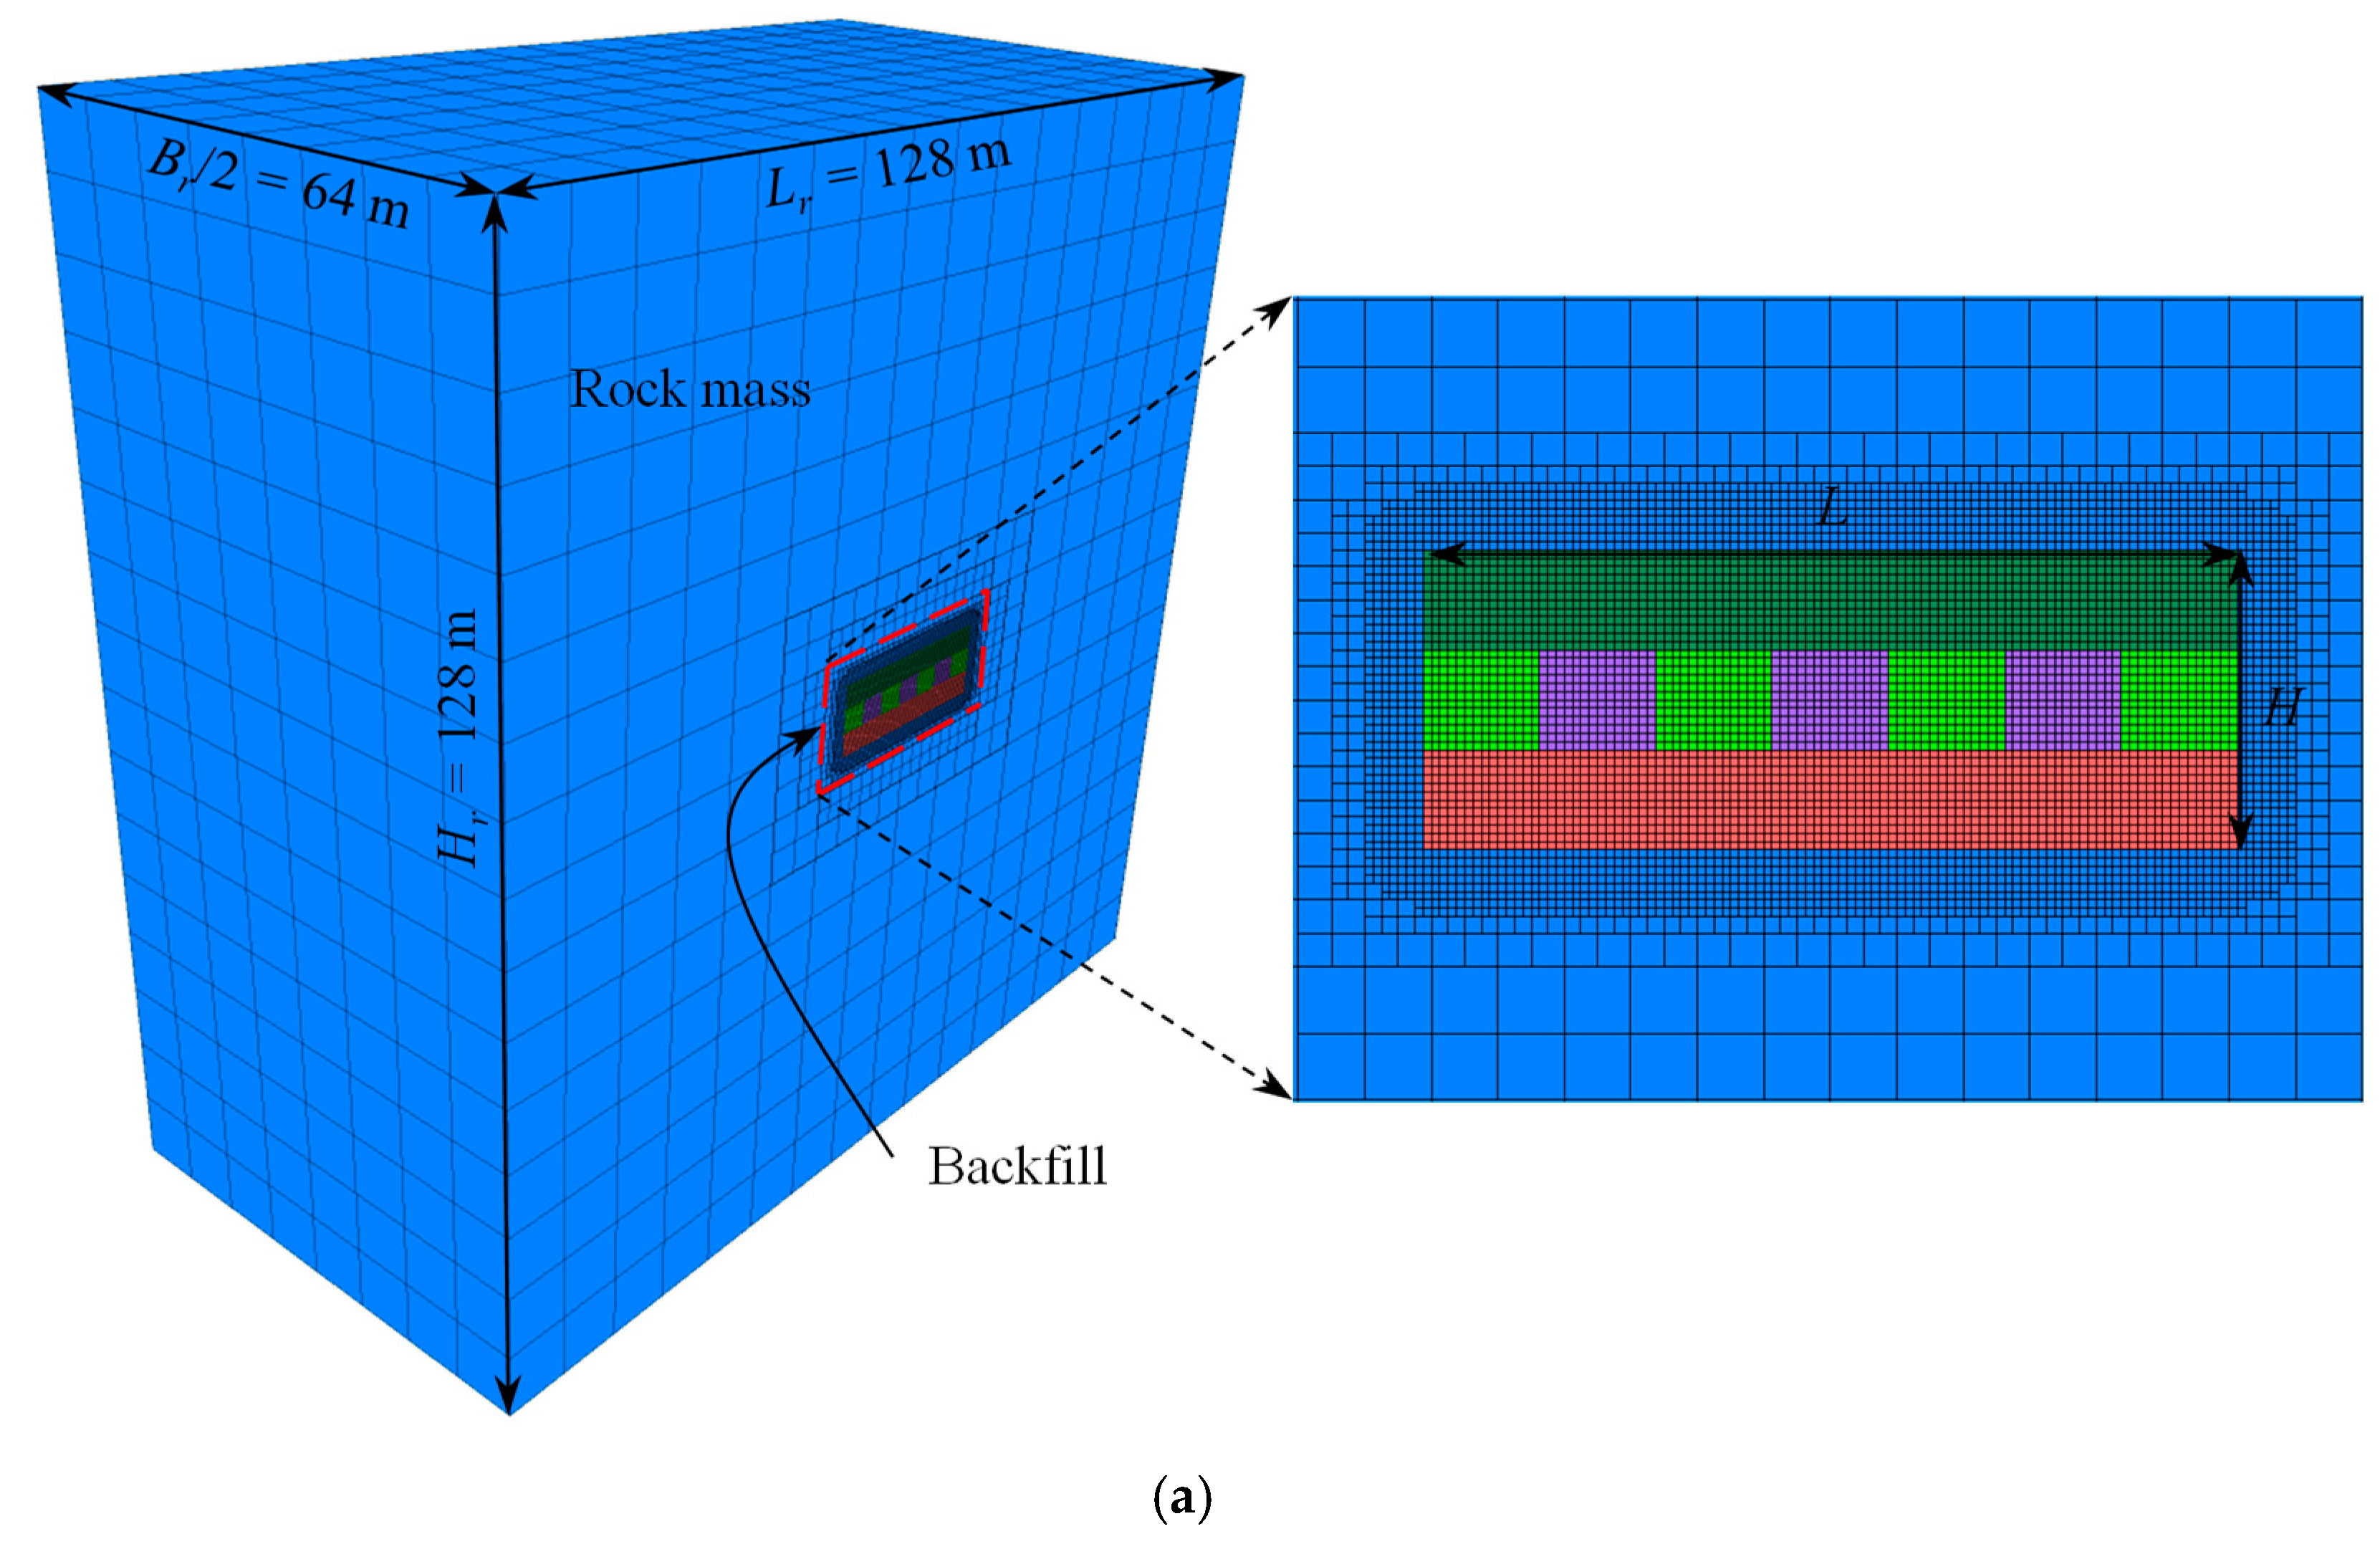
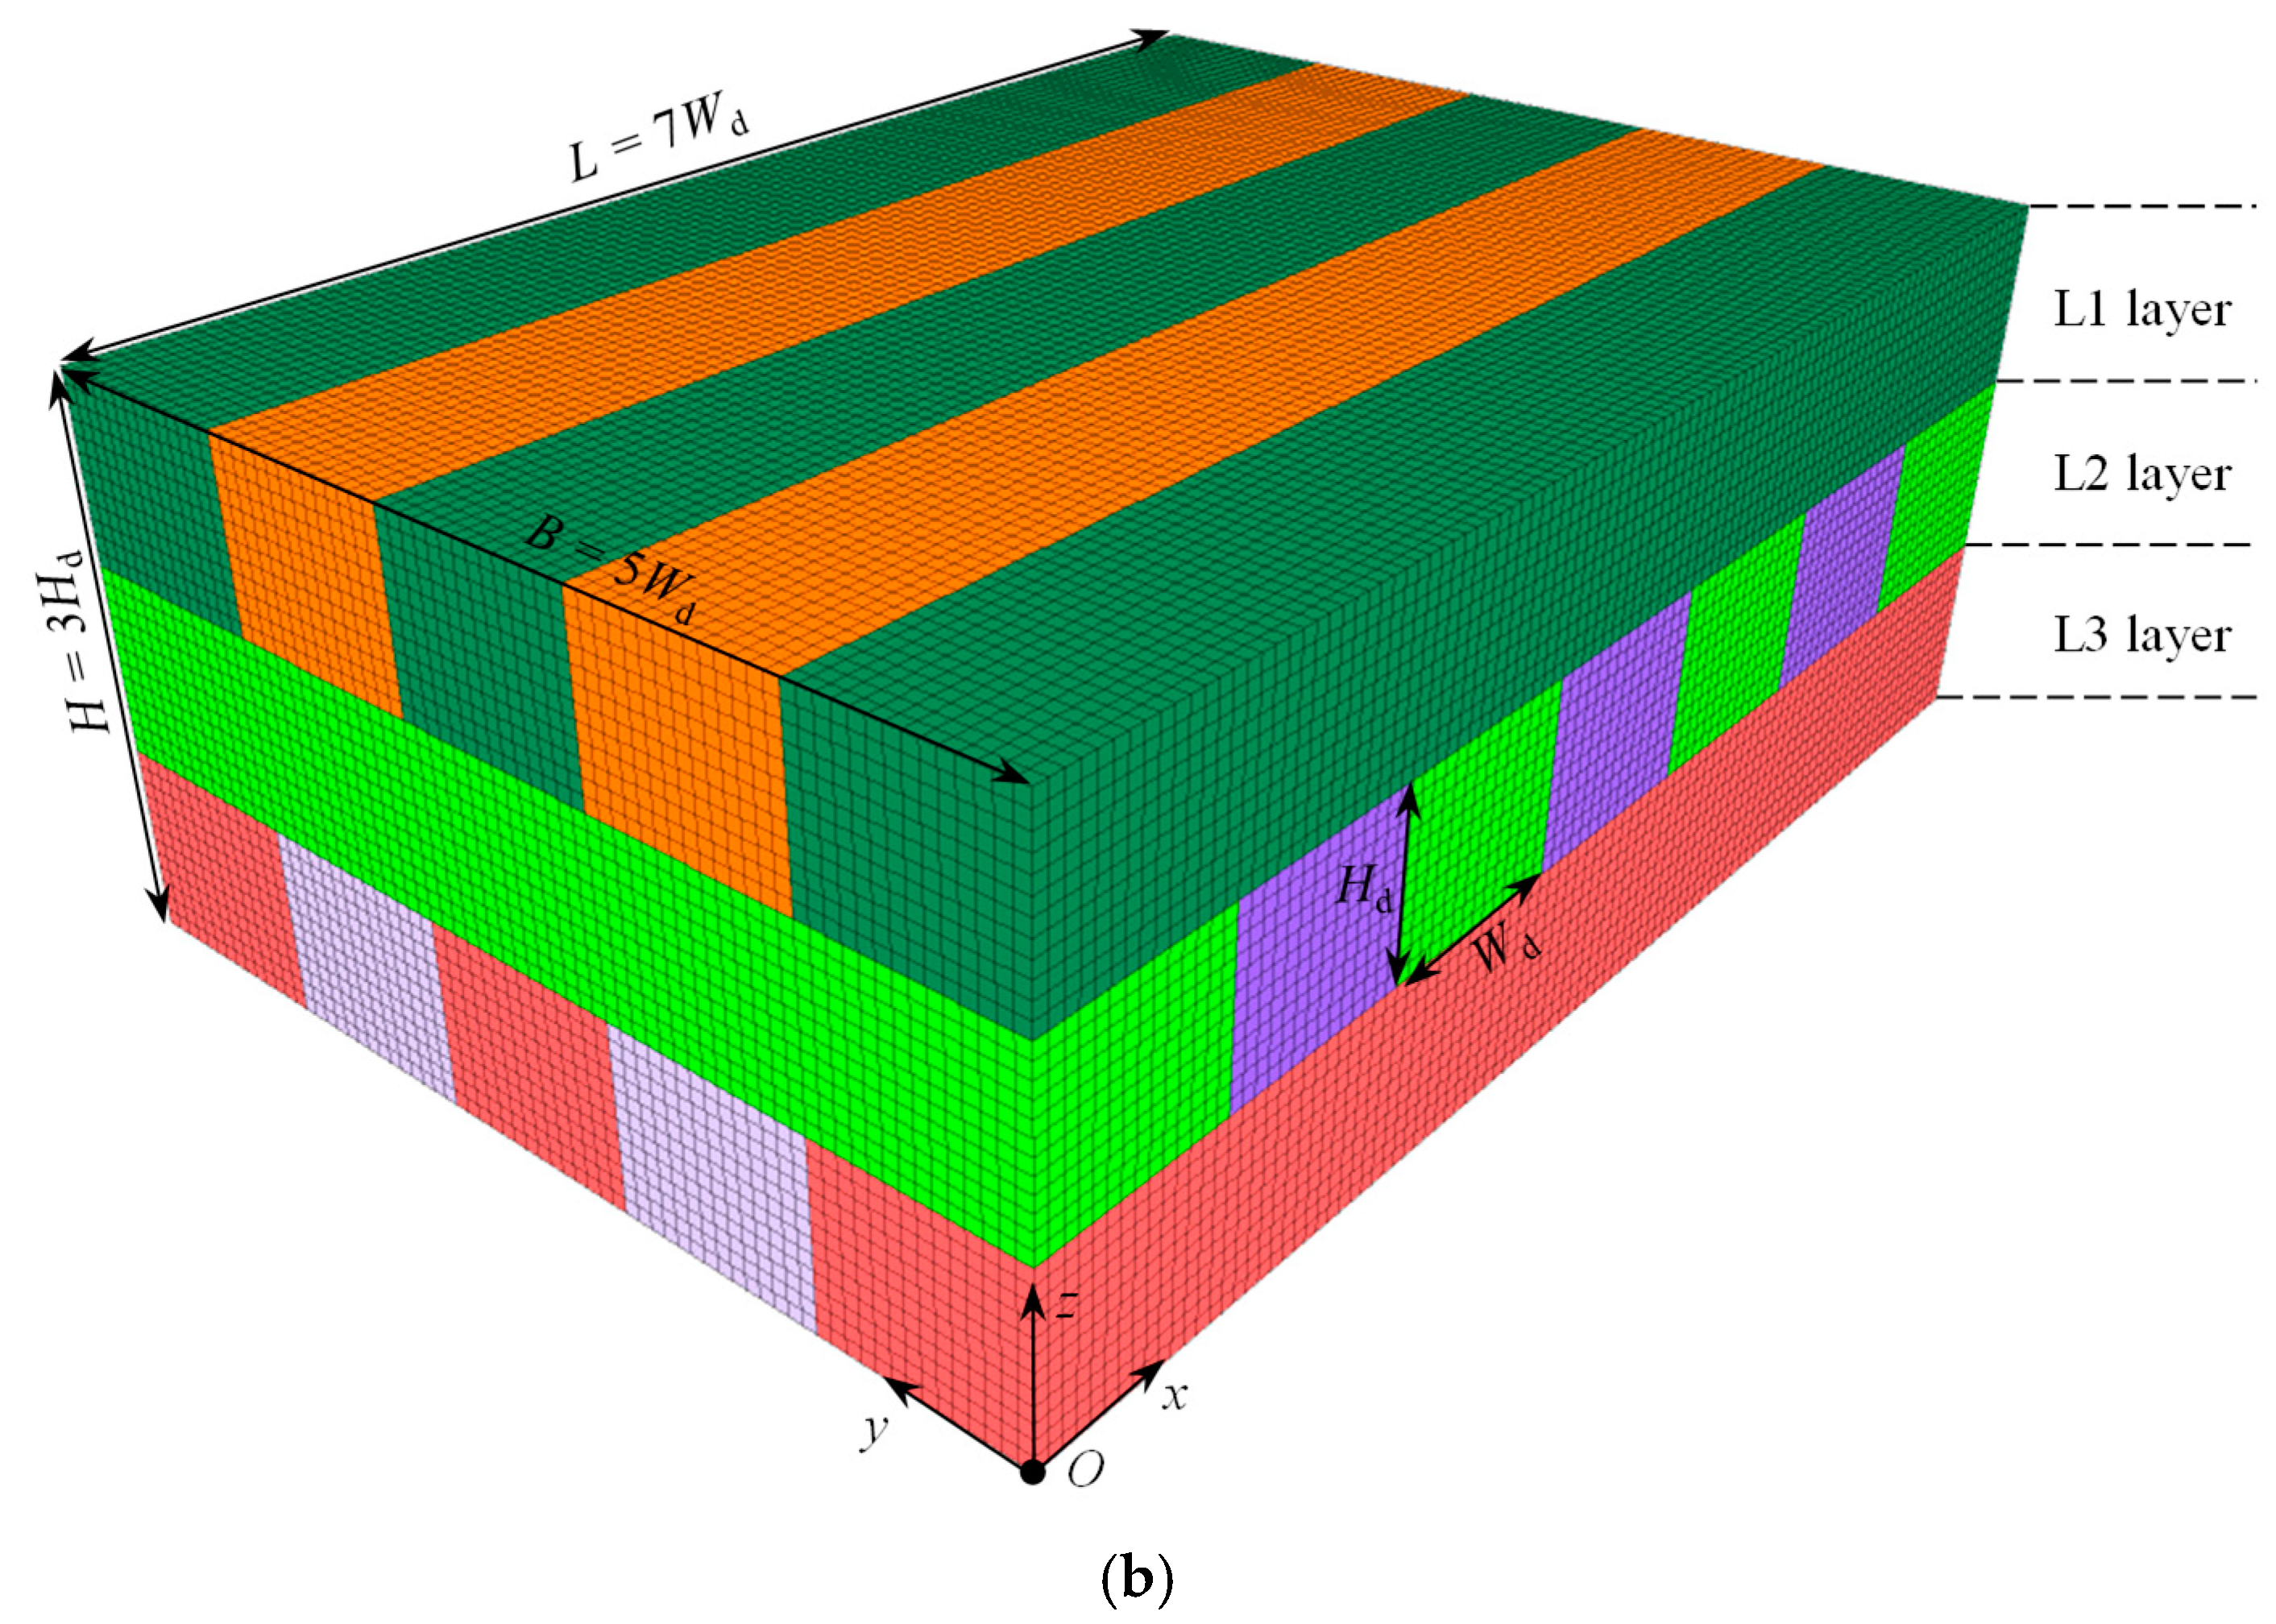
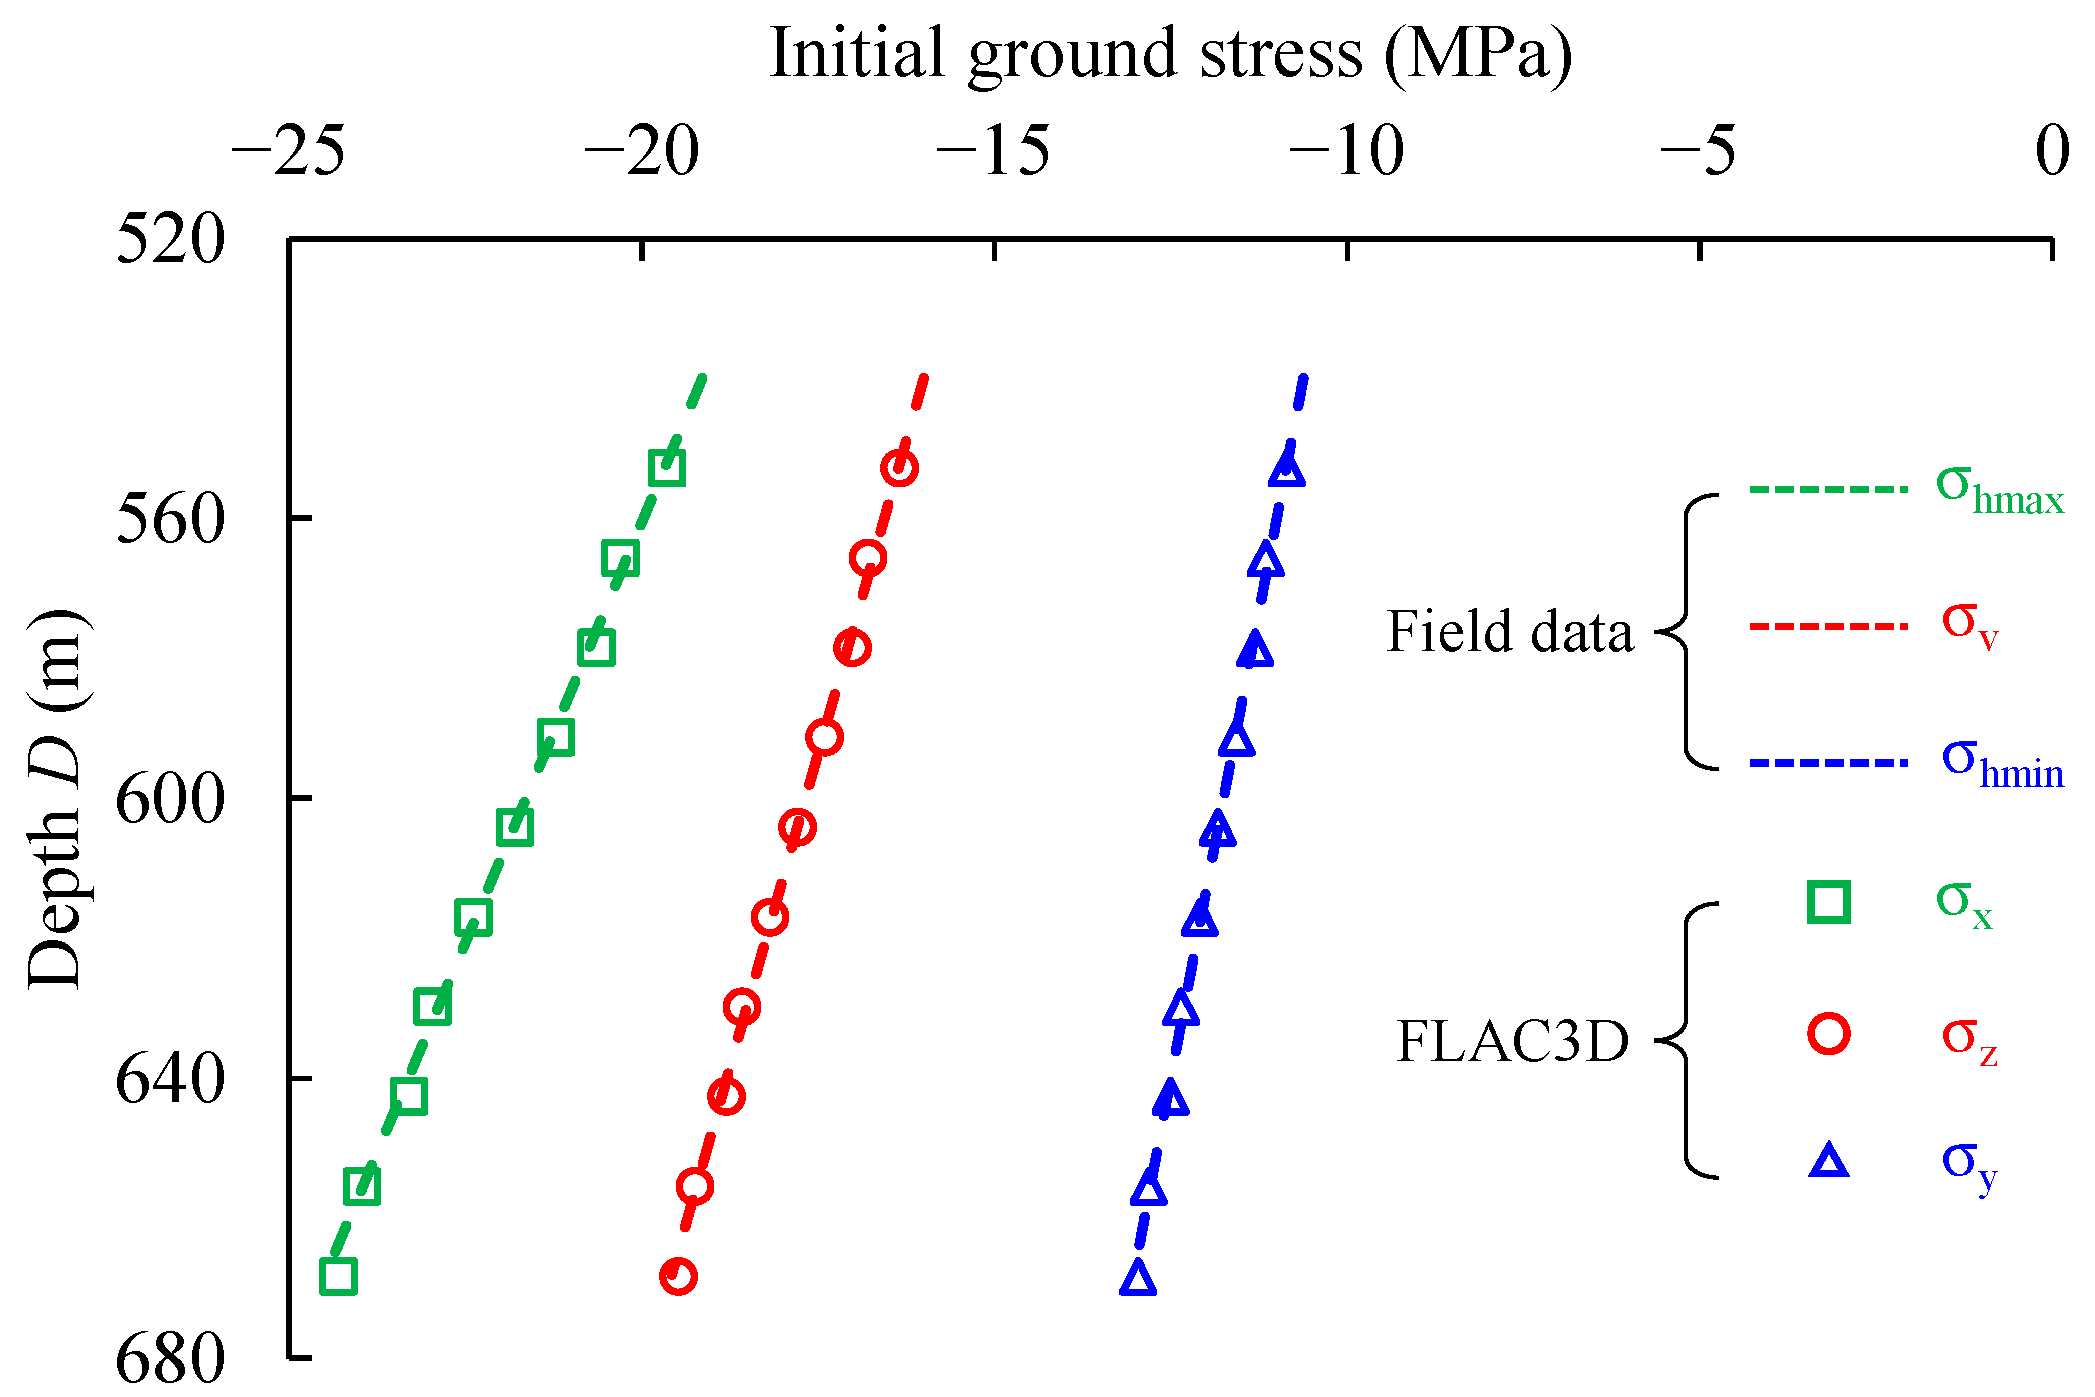
2.1. Numerical Model

Figure 2 shows the numerical model built with FLAC3D (v6.00) of the stope with a basket weave drift layout surrounded by a rock mass. Figure 2a illustrates half of the established model prior to excavation. The sizes of the numerical model are set as Lr = Br = Hr = 128 m to minimize boundary effects. The model comprises two regions: the ore rock in the stope and the surrounding rock mass. During subsequent mining and backfilling operations, ore rock in the stope is progressively replaced by the backfill. As shown in Figure 2b, the stope consists of three layers, labeled L1, L2, and L3 from top to bottom. Among them, L1 and L3 contain five drifts oriented along the x-axis, while L2 contains seven drifts oriented along the y-axis. Drifts in adjacent layers are arranged perpendicularly to simulate the basket weave drift layout. All drifts have identical dimensions, with a span of Wd and a height of Hd.
The numerical model employs cubic mesh elements. Based on comprehensive sensitivity analysis, the mesh size in the stope region is determined to be 0.25 m, while the maximum mesh size in the surrounding rock region is set to 8 m. An octree meshing technique is implemented to ensure a transition between the varying mesh sizes in these regions [18].
The numerical model assumes that both the surrounding rock and backfill are continuous, homogeneous, isotropic elastoplastic materials that obey the Mohr–Coulomb (MC) strength criterion. The MC model has been widely used for modeling backfill material due to its generality and simplicity and shows good agreement with experimental results [12,19]. Therefore, the MC model is applied to the surrounding rock, while the Mohr–Coulomb tension (MohrT) model is used for the backfill. In FLAC3D, the standard MC model tends to produce excessive dilation in materials experiencing tensile failure due to irreversible tensile plastic strains. The MohrT model, an extension of the MC model, is designed to better simulate tensile failure by treating tensile plastic strains as reversible [18]. Given that tensile failure commonly occurs in the backfill roof, the MohrT model is employed to represent the backfill.
Table 1 summarizes the physical and mechanical parameters of the rock mass and backfill used in the numerical model. The cohesion and tensile strength of the backfill are not predefined but are progressively adjusted through an iterative search process to evaluate the strength requirement. Generally, the tensile strength of the backfill is 1/10 of its uniaxial compressive strength (UCS) [20,21]. According to the MC criterion, the tensile strength of the backfill is determined using the following equation [22,23]:
σ t = c 5 t a n ( 45 ° + φ 2 )
where σt, c, and ϕ represent the tensile strength, cohesion, and friction angle of the backfill, respectively.
The depth D (m) is measured from the ground surface to the origin (point O in Figure 2b) of the built model. The modeled stope is located at a depth of around 600 m at the Maoping Lead–Zinc Mine. To set the gravity properly along the negative direction of the z-axis, a surcharge is applied to the top boundary of the model to simulate the overburden, as the model height is limited compared to the stope depth. For other boundary conditions, no displacement constraints are applied to the top boundary, while the x-, y-, and z-axes displacements are fixed at the bottom boundary of the model. Additionally, normal displacements are restricted while the z-axis displacements can occur freely at the four lateral boundaries. To account for the mechanical influence of the overlying backfill on the top surface of L1, it is simplified as a uniformly distributed load in the numerical model. The uniform load is set to q = 1 MPa, which corresponds to the self-weight of a 60-m-high backfill (calculated as ρgh = 1780 kg/m3 × 10 m/s2 × 60 m = 1.068 MPa).
In situ stress measurements have been conducted at the Maoping Lead–Zinc Mine and a linear regression equation describing the variation of ground stress with depth was derived:
σ hmax = 40 + 0.04172 D σ hmin = 20 + 0.01876 D σ v = 30 + 0.028 D
where σhmax and σhmin represent the measured maximum and minimum horizontal stress, respectively; σv is the vertical stress.
The σhmax, σhmin, and σv are employed to generate the initial values of the stress components σx, σy, and σz in the numerical model. Specifically, the coefficients 0.04172, 0.01876, and 0.028 in Equation (2) are used to compute the gravity-induced stress gradients of the σx, σy, and σz, and the initial ground stress can form due to the gravity and the applied surcharge on the top boundary of the model. To examine the validity of the formed initial stress based on the in-site data, stress components are extracted along a vertical line connecting the centroids of the model’s top and bottom surfaces. These values are then compared with the ground stress obtained from Equation (2). The average interpolation method in FLAC3D is used to extract the stress components and for the subsequent contours, which means the values of zone-based data are averaged to grid points and linearly interpolated to the zone interior [18].
Figure 3 compares the initial ground stress generated by the numerical model with the field-measured values. Their excellent agreement verifies the reliability of the constructed numerical model, the applied boundary conditions, and the formation of the initial stress.
After the initial stress is formed in the numerical model, the following steps are used to simulate the process of mining and backfilling:
(1) Excavate a 0.5-m-thick layer of the rock mass above the stope region and apply a vertical uniformly distributed load q = 1 MPa on the top surface of the orebody. Once the numerical model reaches equilibrium, reset the displacements and velocities of all nodes to simulate the displacement release of rock mass after the excavation.
(2) Excavate the primary drifts in one step at the L1 layer and solve the model to an equilibrium state. Subsequently, fill the primary drifts and solve the model again. Repeat the mining and filling process for the secondary drifts at L1.
(3) Repeat Step 2 to complete the mining and filling process for the drifts at L2 and L3, respectively.
Following the above procedures, numerical studies were conducted to determine the strength requirements of the backfill roof for different drift sizes: (1) 3.5 m × 3.0 m (drift width × drift height), (2) 4.5 m × 4.0 m, and (3) 5.5 m × 5.0 m. For each case, a three-dimensional numerical model was established in FLAC3D, and the strength requirements of the backfill roof were determined using the introduced iterative search method.

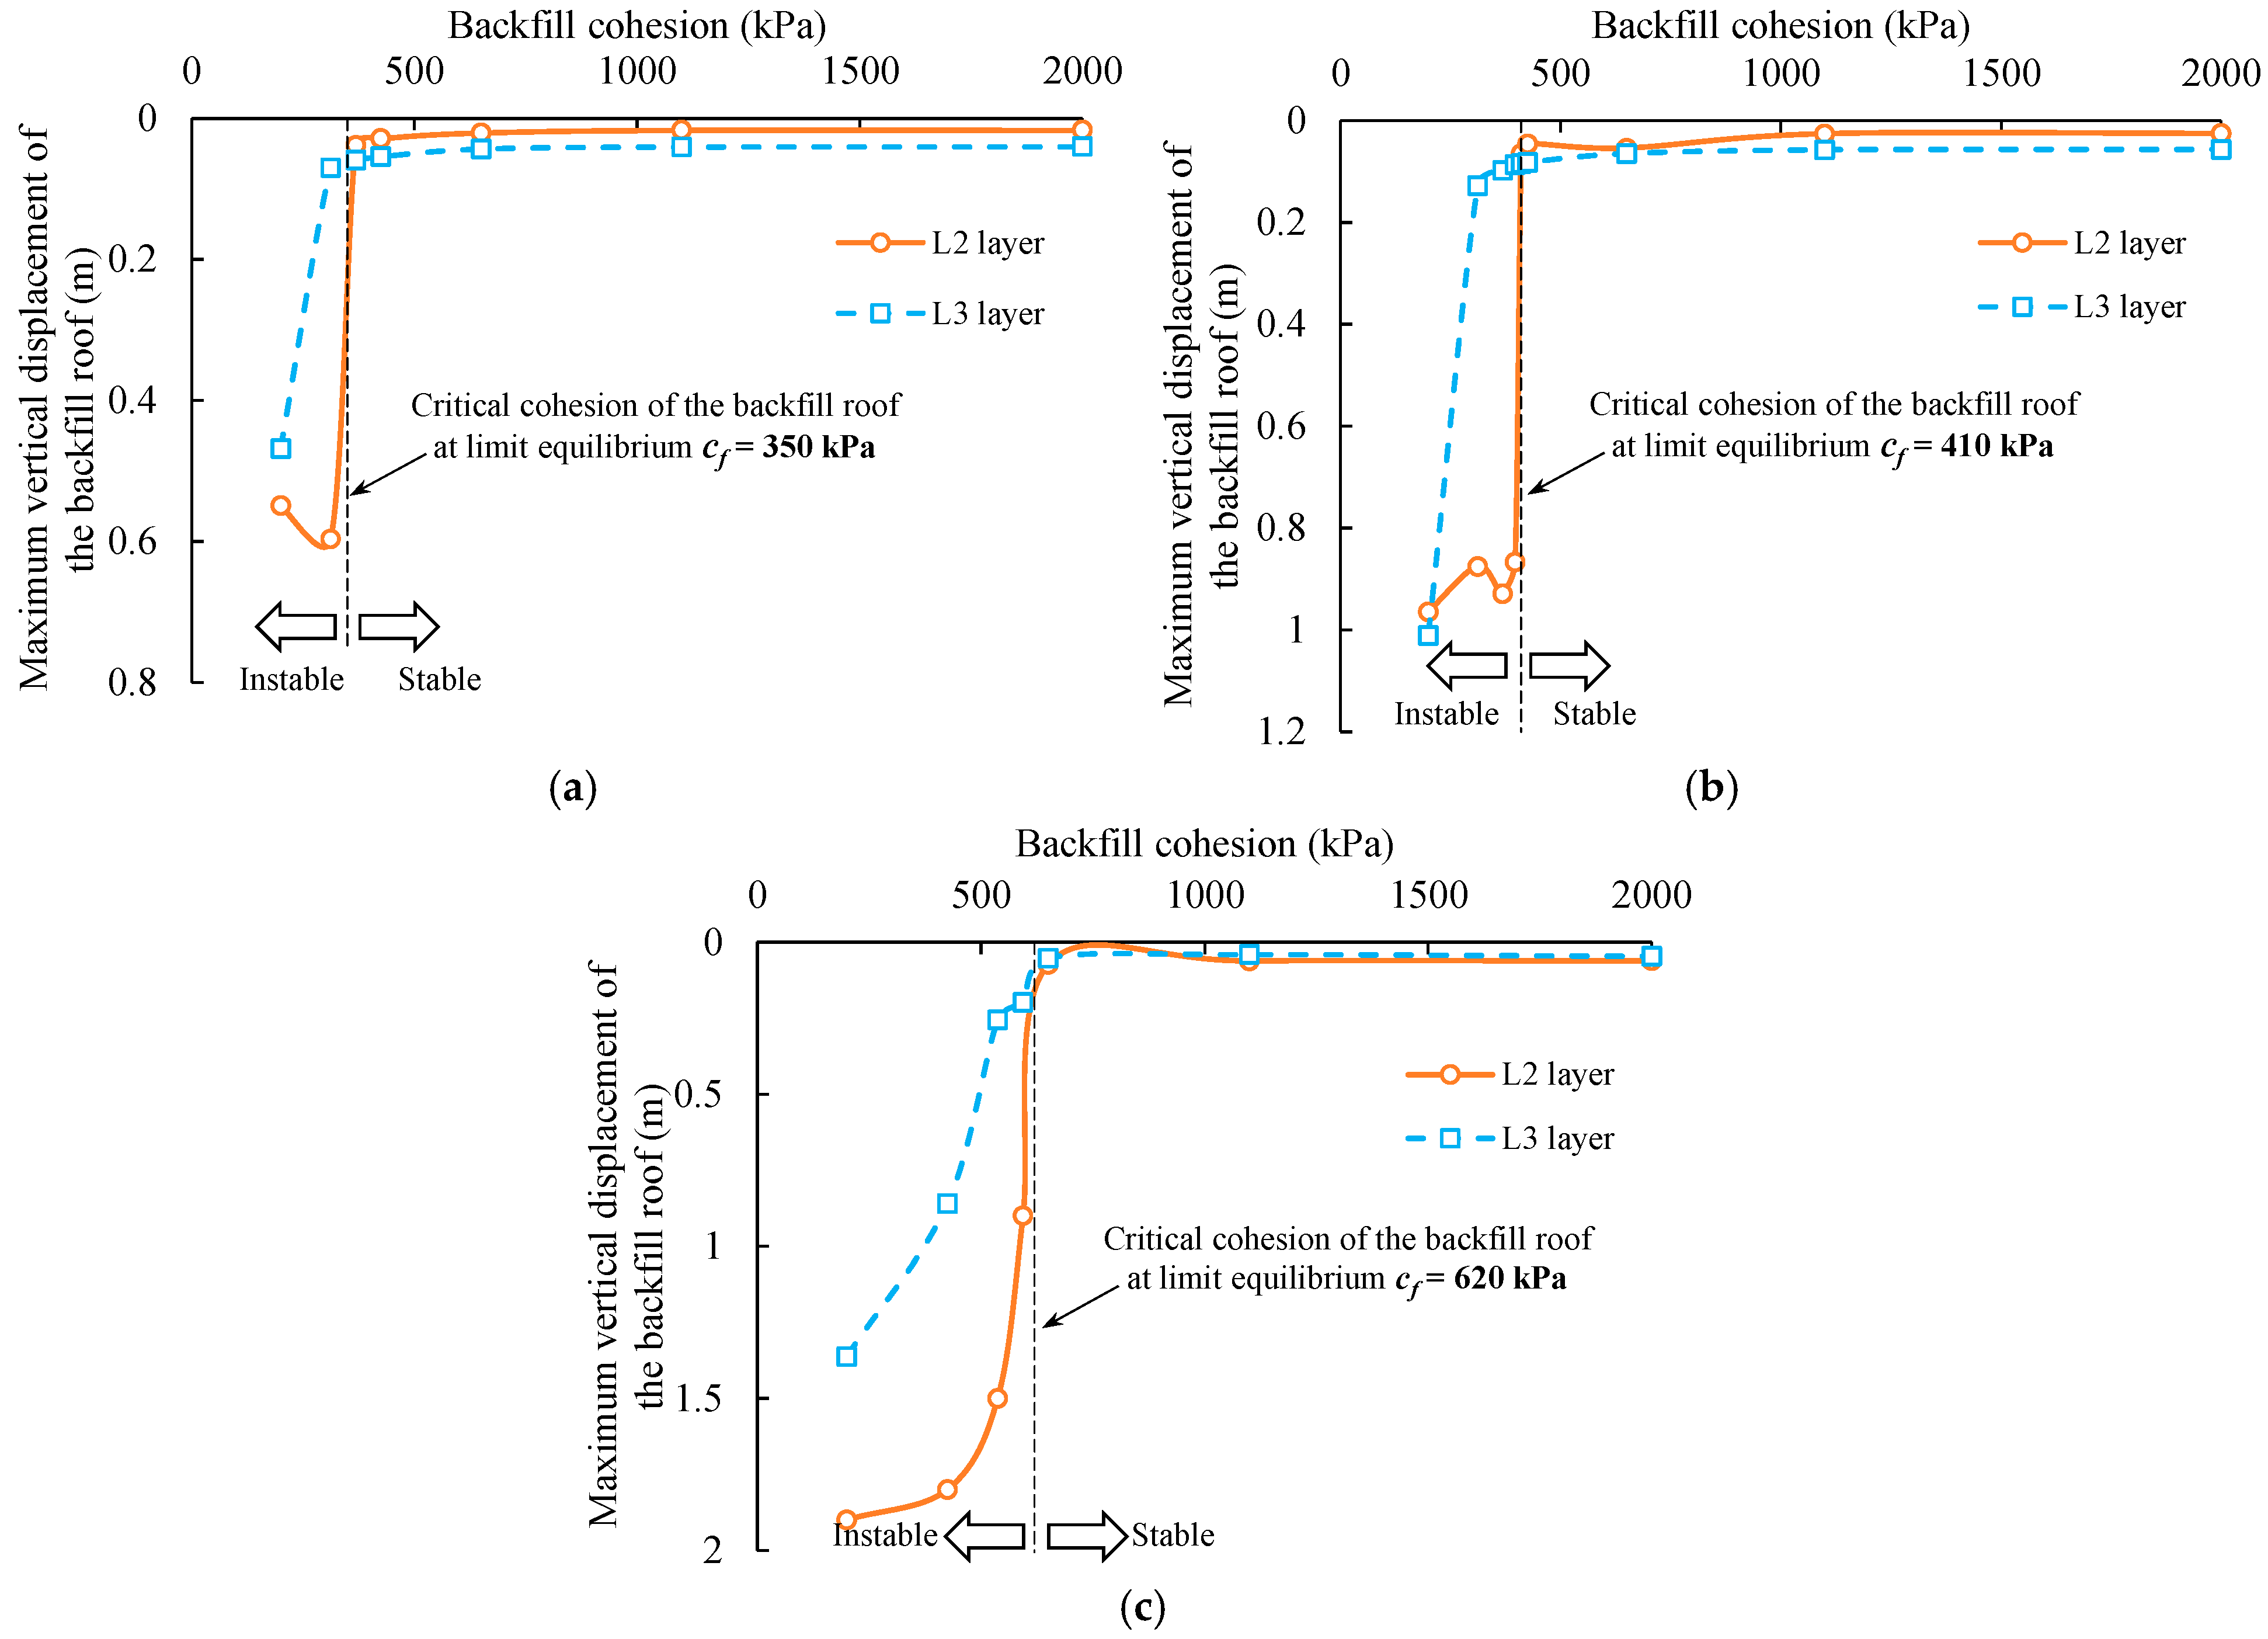
2.2. The Iterative Search Method for Assessing the Strength Requirement of Backfill Roof

In the stability analysis of the backfill roof, some studies [24,25] have traditionally relied on the examination of plastic zone expansion to evaluate the roof state. When a massive plastic zone occurs in the backfill roof, it can be confidently concluded that the roof has become unstable. In contrast, if minor plastic zones are localized and only appear at specific locations, estimation of the roof’s stability becomes challenging. Due to the absence of a quantitative metric linking the extent of plastic zones to the stability of the backfill roof, judgments based on plastic zone analysis remain highly subjective.
Some studies [11,12,13,22] reported that displacement can provide valuable insights into the state of side-exposed backfill, which correlates the displacement at critical locations of the backfill with its stability, thereby reducing the subjectivity in stability assessment and evaluation of the strength requirement. It is intuitive that the exposed backfill with sufficiently high strength can remain stable without significant displacement under its self-weight or external loads. Conversely, significant deformation occurs when the exposed backfill possesses low strength. Therefore, theoretically, there is a critical strength of the backfill roof at which it is in a state of limit equilibrium. When the strength of the backfill decreases from this critical value, the backfill roof changes from a stable state to an unstable state. This critical value represents the strength requirement for the backfill roof to maintain limit equilibrium.
Building on this concept, an iterative search method for assessing the strength requirements through numerical simulation is introduced. In this method, the cohesion c is employed to represent the backfill strength, as the MC strength criterion is applied to model the backfill in numerical simulations. This approach has been widely accepted in previous studies that utilized numerical modeling with the MC model to evaluate the strength requirement for backfill with side or base exposure [11,12,13,14]. Therefore, the critical cohesion (cf) can be estimated through the following steps:
(1) Choose the initial search range. The critical cohesion should fall within the initial search range. In most cases, an initial search range of 200~2000 kPa is suitable for backfill roofs [23,26].
(2) Update the search range and approximate the critical cohesion. The midpoint of the current search range is assigned with the cohesion of the backfill roof, and the mining and filling processes for each layer are simulated. The maximum vertical displacement of the backfill roof under the current cohesion value is extracted, and any abrupt changes in displacement are examined. If a sudden change in displacement is observed, the current cohesion value is set as the lower bound of the search range. If no abrupt change occurs, the current cohesion value is set as the upper bound. This process is repeated to progressively narrow the search range and converge toward critical cohesion.
(3) Determine the critical cohesion from the cohesion–displacement curve. After a number of iterations, the figure for variations of the maximum displacement of the backfill roof with different cohesion can be plotted. From the cohesion–displacement curve, the cohesion corresponding to the point of abrupt displacement change is identified as the critical cohesion (i.e., strength requirement) for the backfill roof.

3. Numerical Results

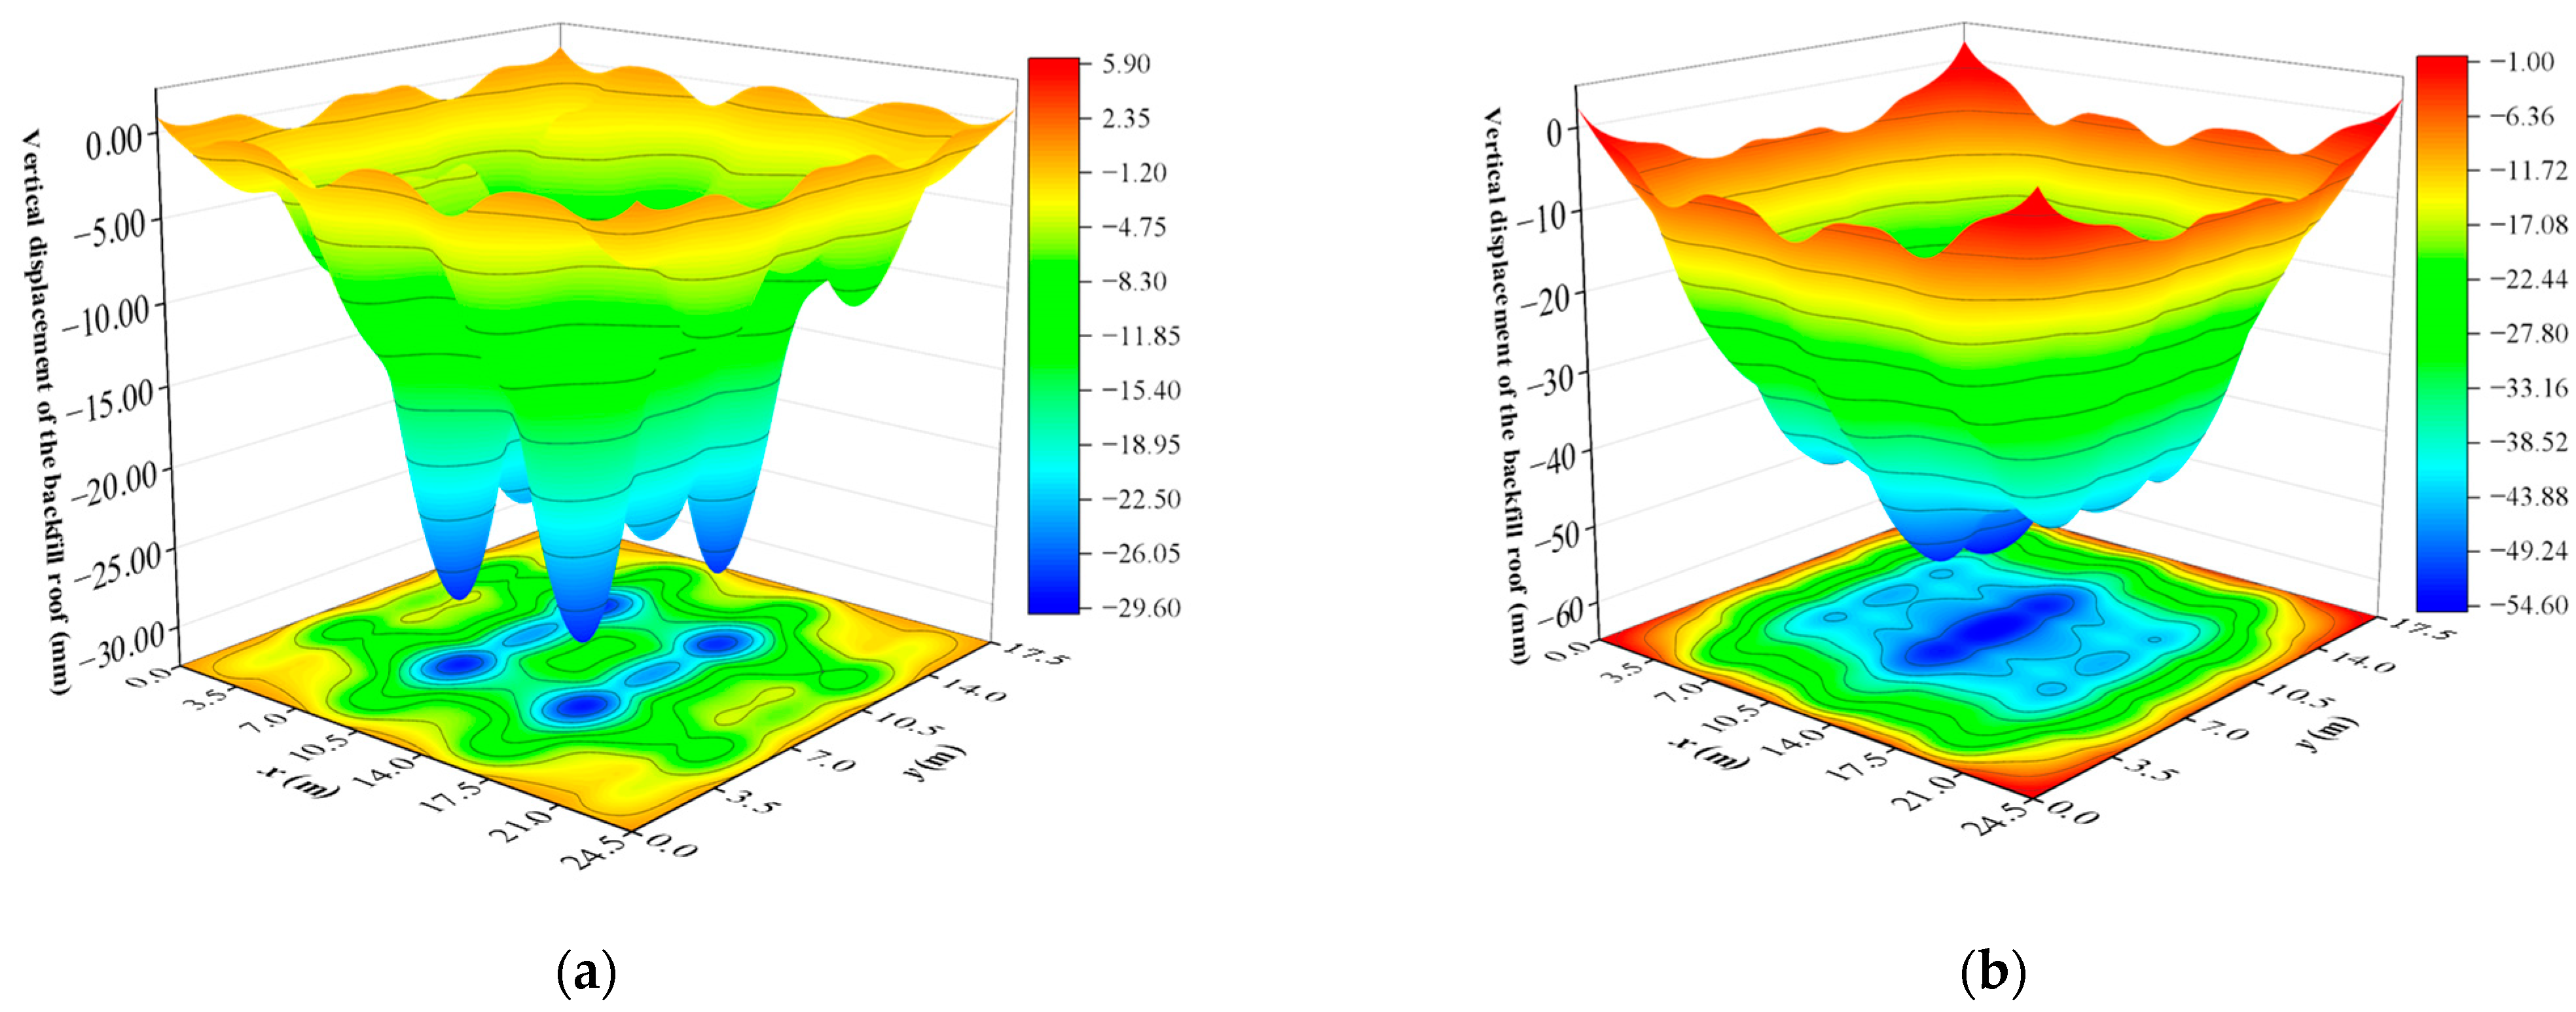
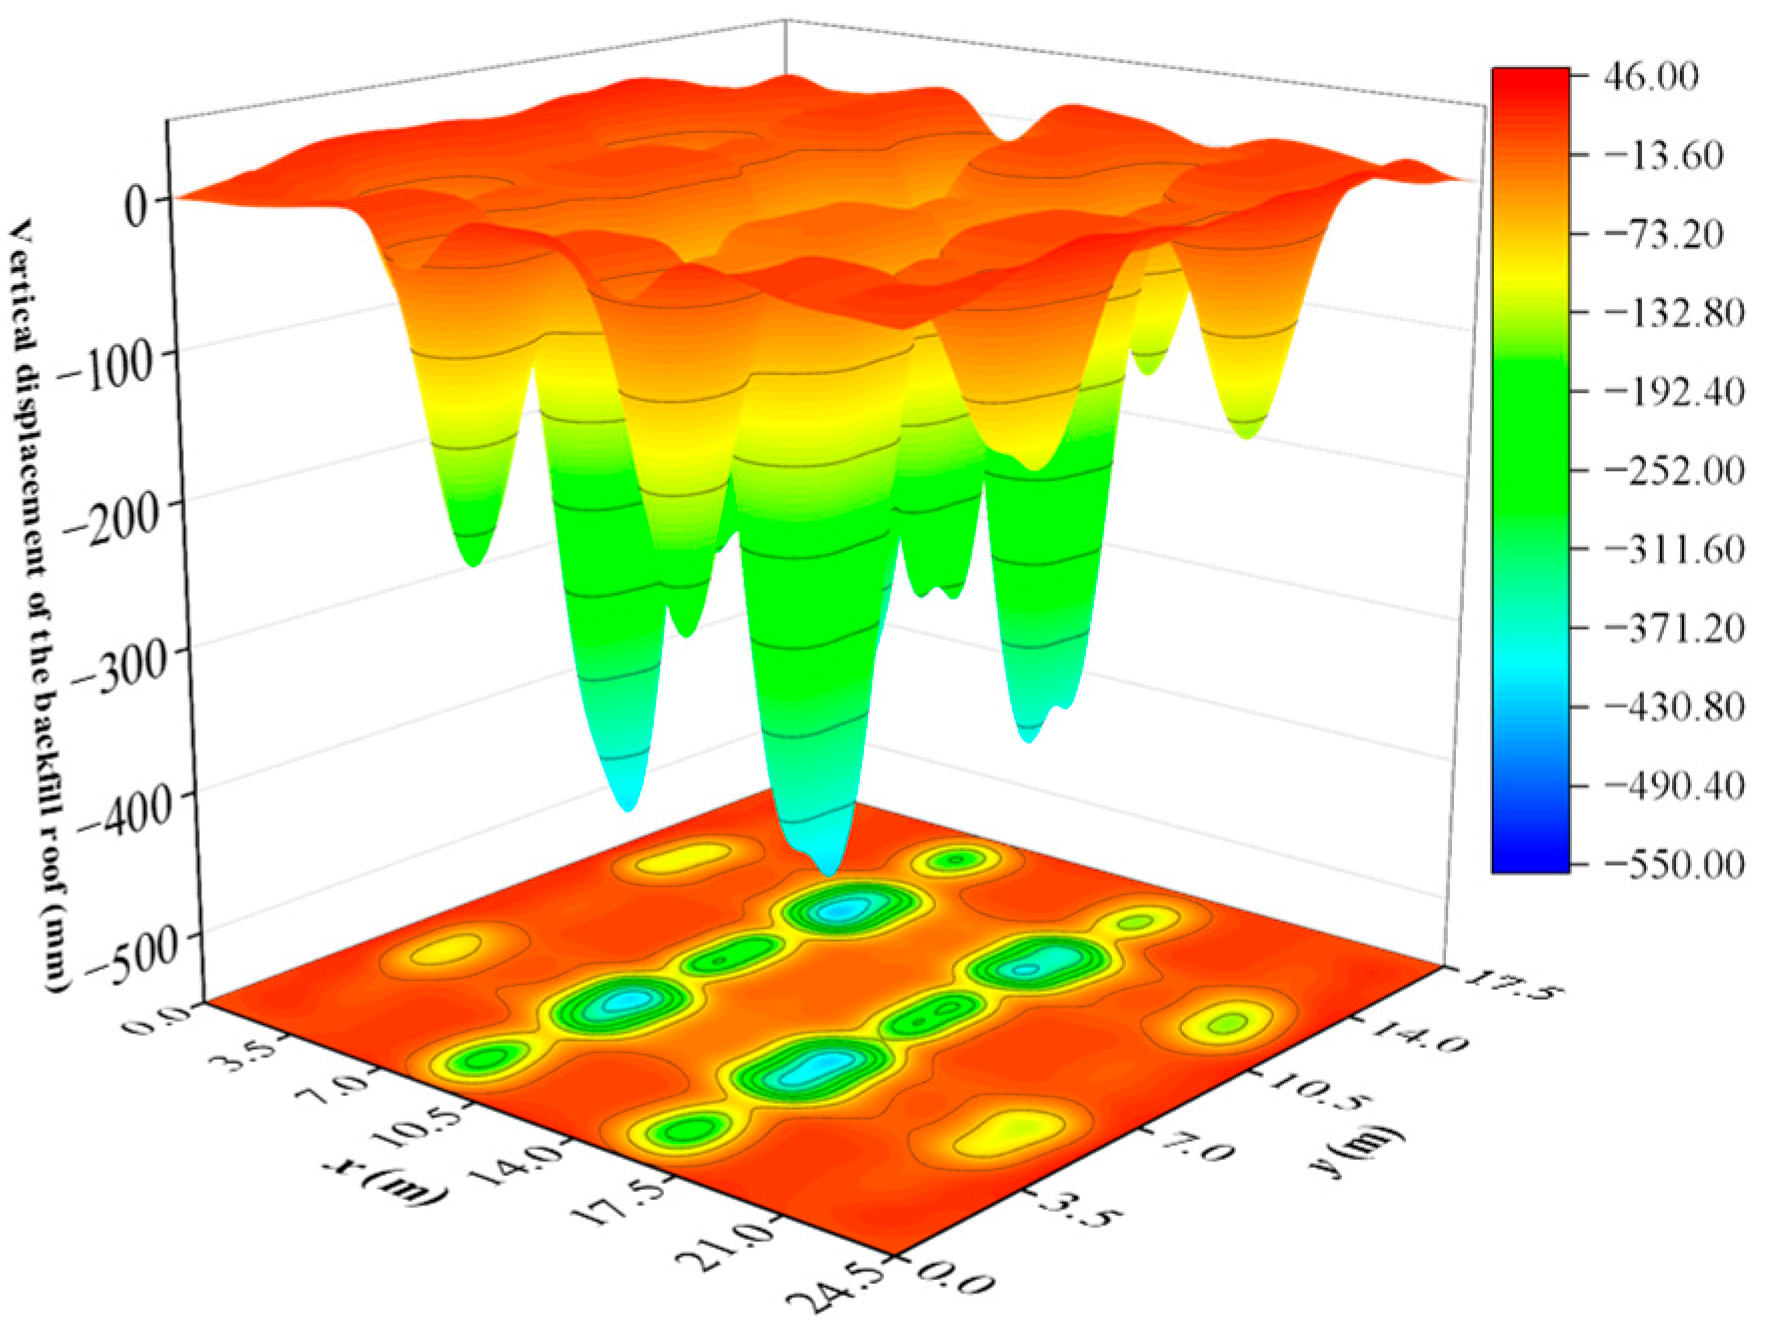
3.1. Displacement Distribution Characteristics of the Backfill Roof

This section analyzes the displacement distribution characteristics of the backfill roof with the basket weave drift layout in stable and unstable states. The numerical results presented are based on the case with a drift size of 3.5 m × 3.0 m.
Figure 4 illustrates the vertical displacement distribution of the backfill roof at L2 and L3 (monitoring planes located at z = 6 m and 3 m, respectively) after the secondary drifts at L3 are excavated. The cohesion of the backfill roof was assigned a value of 425 kPa, under which no plastic failure occurs. The vertical displacements vary smoothly across different locations of the roof and exhibit a downward-concave distribution pattern. In Figure 4a, certain areas of the roof at L3 exhibit higher vertical displacement, which leads to a columnar distribution pattern. The maximum displacement of 2.9 cm takes place near the intersection of the secondary drifts of L3 and L2. In Figure 4b, the vertical displacement of the roof at L2 shows a strip-like distribution parallel to the y-axis, with a maximum value of 5.4 cm located in the central drift of L2. These are similar to previous observations that the vertical displacement of the backfill roof exhibits a wave-like distribution along the direction of drift width [25,27]. However, they did not give further explanations of the findings.
These two displacement distribution patterns arise from the superposition of vertical displacements of the roofs at L2 and L3 with the basket weave drift layout. As shown in Figure 2b, the drifts at L2 are parallel to the y-axis and the vertical displacement of the roof exhibits a strip-like distribution parallel to the y-axis. Similarly, the drifts at L3 are oriented to the x-axis, and the vertical displacement of the roof should exhibit a strip-like distribution parallel to the x-axis. However, due to the superposition of vertical displacements of the roof at L2, the final distribution pattern appears columnar. This indicates that the basket weave drift layout can disperse deformations of the roof exposed in a single void drift and transform the vertical displacement distribution from a strip-like pattern to a columnar pattern.
Figure 5 presents the vertical displacement distribution of the yielded backfill roof with cohesion of 200 kPa. It is evident that the roof displacement still exhibits a columnar distribution; however, the displacements in the failure zones are significantly larger than those in adjacent areas, with a maximum displacement of 55 cm. This suggests that, for the basket weave drift layout, the superposition of vertical displacements makes the roof near the intersection of secondary drifts at adjacent layers more susceptible to deformation and failure. In other words, the roof stability for the basket weave drift layout approaches that of an intact roof, which is consistent with the findings reported by Zhao et al. [15].

3.2. Strength Requirements of the Backfill Roof with the Basket Weave Drift Layout

Table 2 presents the iterative search process for assessing the strength requirement of the backfill roof in the case with a drift size of 3.5 m × 3.0 m. Initially, the search range for the backfill cohesion was determined as 200~2000 kPa. During the iterative process, this range was progressively narrowed to approximate the critical cohesion of the backfill roof under limit equilibrium. After each simulation was completed, the maximum vertical displacement of the roofs at L2 and L3 was extracted, and the variations of the maximum vertical displacement of the backfill roof with different cohesion were plotted, as shown in Figure 6a.
Figure 6a shows that the vertical displacements of the roofs at both L2 and L3 remain below 10 cm when the backfill cohesion is greater than 350 kPa. Within this range, the vertical displacements show no significant change as the backfill cohesion decreases, indicating that the backfill roof remains in a stable state. However, when the cohesion reaches 350 kPa, a sharp increase in roof displacement occurs, rising from less than 10 cm to over 60 cm for both layers. When the cohesion falls below 350 kPa, the vertical displacements of the roofs at both layers remain consistently above 50 cm, signifying that the roof has failed and become unstable. Consequently, the strength requirement of the backfill roof with a drift size of 3.5 m × 3.0 m is determined as cf = 350 kPa.
Figure 6b,c illustrates the variations in the maximum vertical displacement of the backfill roof with different cohesion in cases with drift sizes of 4.5 m × 4.0 m and 5.5 m × 5.0 m, respectively. It is evident that a sharp change in displacement occurs at c = 410 kPa and 620 kPa, and the strength requirements of the backfill roof were determined accordingly. Clearly, the strength requirement increases with the drift size. This aligns with previous reports that the required strength of base-exposed backfill increases with the span [23,28].

4. Discussion

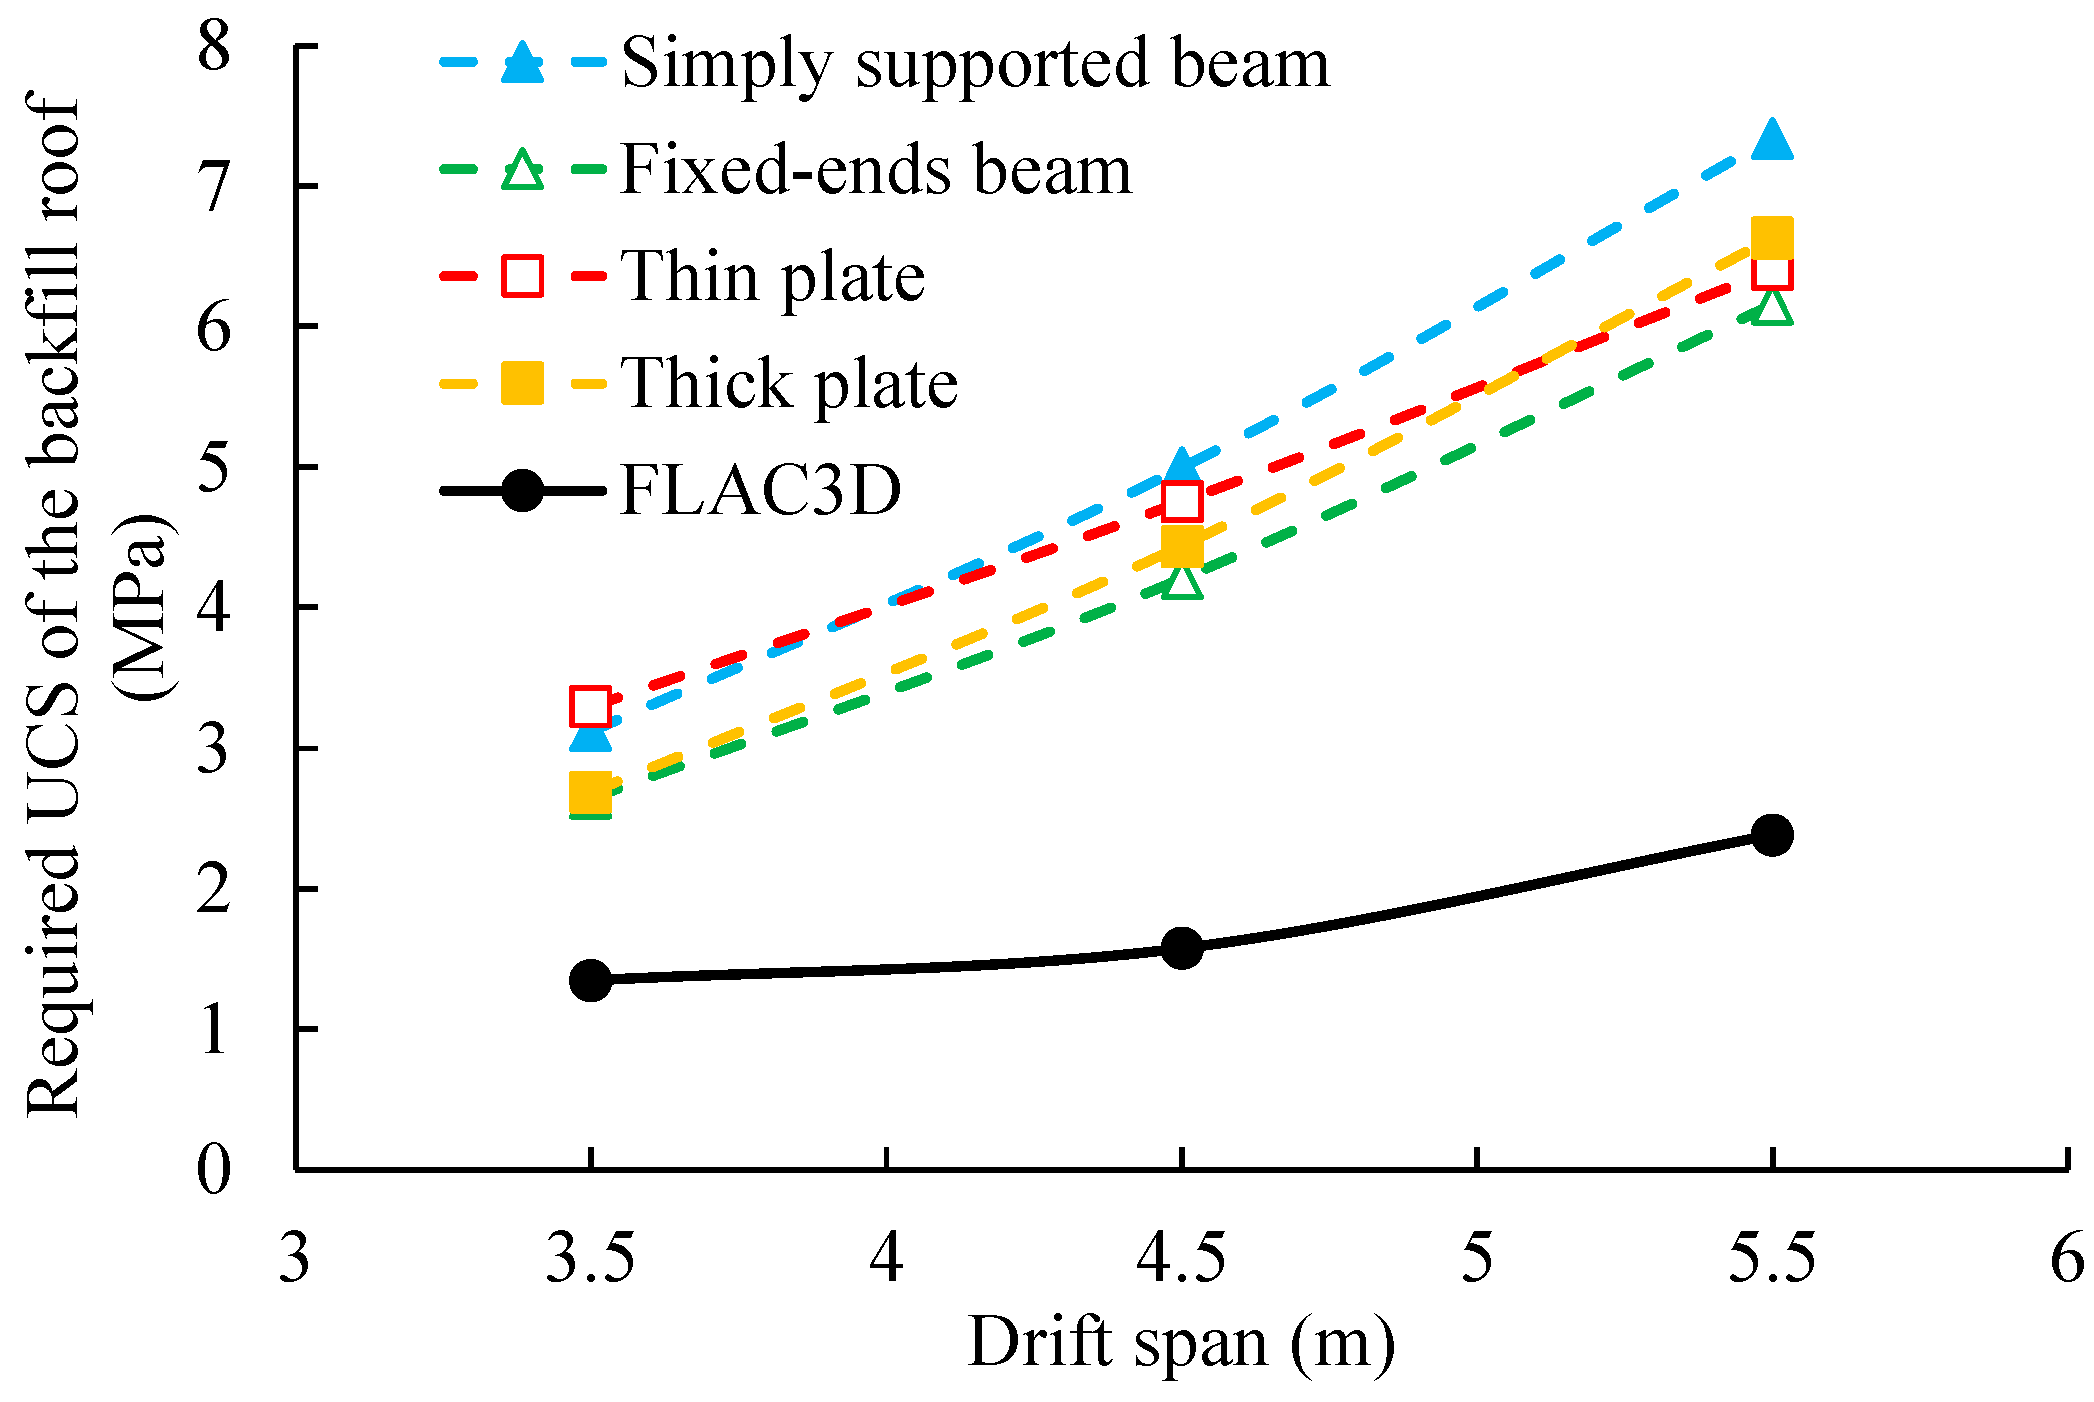
4.1. Comparison of the Numerical Results with Analytical Solutions

The strength requirement of the backfill roof with the basket weave drift layout in underhand drift-and-fill mining has been investigated through numerical simulations with FLAC3D. The iterative search method used, which determines the stability state based on sharp changes in roof displacement, can effectively incorporate the influence of specific loading conditions into the estimation of strength requirements for the backfill roof.
In addition to numerical simulation methods, analytical methods are also commonly used to assess the strength requirement of the backfill roof. Commonly adopted analytical solutions include the simply supported beam model [29], the fixed-ends beam model [30], the thin plate model [31], and the thick plate model [5,32]. Using these models, the stress components within the backfill roof under external loads can be calculated, enabling the determination of the maximum tensile stress. Since the tensile strength of cemented backfill is typically about 1/10 of its UCS [20,21], tensile failure is generally regarded as the dominant factor contributing to roof instability. Therefore, when the maximum tensile stress within the backfill roof exceeds the tensile strength, the roof is considered unstable. Based on this criterion, the strength requirement of the backfill roof can be determined in terms of the tensile strength.
(1) The simply supported beam model
The simply supported beam model is widely used to estimate the strength requirement of the backfill roof, as shown in Equation (3)
σ t > 3 W 2 4 H 2 + 1 5 q
where σt is the tensile strength of the backfill roof (Pa); W and H are the span and height of the drift (m); and q is the uniform load on the top surface of the backfill roof (Pa).
(2) The fixed-end beam model
The fixed-end beam model was proposed by Mitchell [30] to evaluate the strength requirement of sill mats and has been extended to assess the strength requirement of the backfill roof over the drift void, as shown in Equation (4)
σ t > L 2 2 d 2 q σ c
where L and d are the span and height of the sill mat (m) and σc is the rock closure stress applied to lateral ends of the sill mat (Pa).
(3) The thin plate model
In the thin plate model, the backfill roof is simplified as a uniformly loaded thin plate on an elastic foundation, and the strength requirement is given by Equation (5)
σ t > 3 ( 1 μ 2 ) E j E L h 1 3 M 1 2 W 2 4 + 3 W 2 3 ( 1 μ 2 ) E j E L h 1 3 M 1 4 + 3 h 1 2 3 ( 1 μ 2 ) E j E L h 1 3 M 1 4 3 ( 1 μ 2 ) E j E L h 1 3 M 1 4 W 2 + 1 W 2 q
where μ, EL, and h1 are Poisson’s ratio, Young’s modulus (Pa), and the thickness of the bearing layer (m) of the backfill roof, respectively. Ej and M are Young’s modulus (Pa) and the height (m) of the foundation.
(4) The thick plate model
In the thick plate model, the strength requirement of the backfill roof is calculated using Equation (6)
σ t > max ( σ x m a x , σ y m a x ) σ x m a x = 96 q π 4 H 2 b 2 + μ a 2 a 2 b 2 ( 1 / a ) 2 + ( 1 / b ) 2 2 b 2 + 9 μ a 2 3 a 2 b 2 ( 1 / a ) 2 + ( 3 / b ) 2 2 9 b 2 + μ a 2 3 a 2 b 2 ( 3 / a ) 2 + ( 1 / b ) 2 2 + b 2 + μ a 2 a 2 b 2 ( 3 / a ) 2 + ( 3 / b ) 2 2 σ y m a x = 96 q π 4 H 2 a 2 + μ b 2 a 2 b 2 ( 1 / a ) 2 + ( 1 / b ) 2 2 9 a 2 + μ b 2 3 a 2 b 2 ( 1 / a ) 2 + ( 3 / b ) 2 2 a 2 + 9 μ b 2 3 a 2 b 2 ( 3 / a ) 2 + ( 1 / b ) 2 2 + a 2 + μ b 2 a 2 b 2 ( 3 / a ) 2 + ( 3 / b ) 2 2
where σxmax and σymax are the maximum stresses in the two horizontal directions of the backfill roof (Pa); a, b, and H are the drift span (m), drift length (m), and drift height (m); and E and μ are Young’s modulus (Pa) and Poisson’s ratio of the backfill roof.
The strength requirement determined through numerical simulation using the iterative search method is expressed in terms of backfill cohesion, whereas the strength requirements derived from existing analytical solutions are represented by tensile strength. In practical backfill strength design, the UCS is more widely accepted as the primary strength parameter for backfill. Using the Mohr–Coulomb criterion (Equation (1)), both backfill cohesion and tensile strength can be converted into UCS.
Figure 7 illustrates the variations of the required UCS of the backfill roof with different drift spans, as obtained from the numerical simulation and analytical solutions (Equations (3)–(6)), respectively. The parameters used in the analytical solutions are consistent with those employed in numerical modeling. As shown in Figure 7, the strength requirements provided by the analytical solutions are consistently higher than those obtained from numerical results. This discrepancy may be attributed to the following reasons:
(1) The effects of rock closure induced by the excavation of drifts. In numerical modeling, the backfill roof is subjected to significant horizontal compressive pressure due to rock closure caused by drift excavation. This places the backfill roof in a triaxial stress state, thereby reducing the required strength for the roof to remain stable. Studies conducted by Fan et al. [14,33] have demonstrated that rock closure significantly influences the failure modes and strength requirements of base-exposed backfill. These impacts from rock closure are not involved in the existing analytical solutions, which employ a simple instability criterion for the backfill roof. Consequently, the analytical solutions tend to yield conservative results.
(2) The effects of abutment supports on the backfill roof with the basket weave drift layout. As shown in Figure 4, the basket weave drift layout can disperse deformations of the roof exposed in a single void drift. This is achieved through the perpendicular arrangement of drifts between adjacent layers. In Figure 1c, the backfill roof is intermittently supported by the abutments. However, existing analytical solutions neglect the effects of abutment supports by simplifying the boundary conditions as either fixed or simply supported, without considering abutment deformation or abutment width. Previous studies have shown that the stress within the roof can transfer to the abutments after the secondary drifts are excavated [27,34,35]. Since the numerical simulation fully incorporates the influence of abutment supports, strength requirements that more closely reflect the actual loading conditions of the backfill roof are yielded.
As discussed above, the inherent limitations of traditional analytical solutions can lead to an unreliable evaluation of the strength requirements. In contrast, numerical simulation offers superior capability in modeling the actual loading conditions of backfill roofs, thereby yielding more reliable results. Notably, the iterative search method used in the numerical simulation for the basket weave drift layout can be further extended to determine the strength requirement of the backfill roof across various mining configurations and operational conditions. Therefore, it provides a valuable methodological reference for the backfill design in practice.

4.2. Limitations

The geometry of the stope and drifts are assumed to be vertical, and the secondary drifts are simplified with identical dimensions of the primary drifts in numerical modeling. In practice, the drift walls exhibit irregular geometries and inclinations, and the primary and secondary drifts generally differ in size. The influence of the drift inclination and the varied drift size require further investigation.
The backfill and rock mass are modeled as homogeneous, isotropic materials obeying the Mohr–Coulomb criterion. In practical stopes, the drift backfill is non-homogeneous and anisotropic due to segregation and the staged filling strategy [16,36]. The stress–strain behavior of the backfill can be more complicated in plasticity. Furthermore, natural joints and fractures within the rock mass are not accounted for in the current simulation.
We attempted to validate the numerical simulations by comparing the numerical results with field data obtained from a published study by Hu et al., who conducted field measurements on the overlying load and stress state of the cemented paste backfill roof at the Jinchuan Nickel Mine using underhand drift-and-fill mining [32]. Strain gauges and pressure sensors were installed in the backfill roof at 48# and 40# Stopes to collect the stress and strain data, and further details about the measurement can be found in Hu’s study [32]. The measured overlying load, maximum vertical displacement, and maximum tensile stress of the backfill roof were compared with those obtained from the numerical simulation for the case with drift sizes of 3.5 m × 3.0 m, as shown in Figure 8.
In Figure 8, the maximum tensile stresses from the numerical results align well with those monitored at 48# and 40# Stopes. However, there are noticeable differences in the maximum vertical displacement and overlying load. These discrepancies are understandable because the physical and mechanical parameters, constitutive model, and initial ground stress adopted in the numerical model were not specifically selected based on the Jinchuan Nickel Mine (these parameters are also unavailable in Hu’s study [32]). Nevertheless, as shown in Figure 8, the numerical results and field data remain within a similar order of magnitude, which, to some extent, validates the rationality of the numerical simulation conducted in this study. It is anticipated that further field monitoring at the Maoping Lead–Zinc Mine will allow for the use of parameters that better reflect the specific engineering conditions of the mine, thereby providing additional verification for the numerical simulation.
This study provides a detailed analysis of the stability of the backfill roof with the basket weave drift layout from a safety perspective. However, it does not explore the practical implications and constructability of this drift layout in terms of mining process convenience, production management, or costs. For this drift layout, the drifts are designed to be perpendicular to those in the upper layer, and then the drift driving directions in the adjacent layers are alternating during stoping. While this design contributes to stability, it not only introduces significant challenges for production management but also complicates the selection of ore pass locations, potentially resulting in higher production costs. Further research is necessary to jointly consider the practical implications and constructability of this layout while optimizing both the drift layout and the strength requirement of the backfill roof.

5. Conclusions

This study investigated the displacement distribution and strength requirement of a backfill roof with the basket weave drift layout through numerical simulations conducted with FLAC3D. The main conclusions are summarized as follows:
(1) The displacement of the backfill roof with the basket weave drift layout exhibits columnar or strip-like distribution patterns. Due to the superposition of displacements, the basket weave drift layout can disperse deformations of the roof. However, this also makes the roof near the intersection of secondary drifts at adjacent layers more susceptible to deformation and failure.
(2) The strength requirement of the backfill roof increases with drift size. At the Maoping Lead–Zinc Mine, the required UCS of the backfill roof in limit equilibrium for drift sizes of 3.5 m × 3.0 m, 4.5 m × 4.0 m, and 5.5 m × 5.0 m was determined as 1.34 MPa, 1.57 MPa, and 2.38 MPa, respectively.
(3) The applicability of traditional analytical solutions was evaluated in assessing the strength requirements of the backfill roof with the basket weave drift layout. It shows that traditional analytical solutions tend to yield conservative estimates compared to numerical simulations.
(4) The iterative search method for determining the strength requirements of a backfill roof can reduce the subjectivity in stability analysis. It provides a valuable methodological reference for backfill design in practice.

Author Contributions

Conceptualization, G.L.; formal analysis, Q.M.; funding acquisition, G.L. and X.Y.; methodology, Q.M.; resources, X.Y.; software, X.Y.; supervision, X.Y. and W.S.; validation, Q.M.; visualization, Q.M.; writing—original draft, Q.M. and G.L.; writing—review and editing, Q.M. and G.L. All authors have read and agreed to the published version of the manuscript.

Funding

This research was funded by the Deep Earth Probe and Mineral Resources Exploration—National Science and Technology Major Project (Grant No. 2024ZD1003705) and the Beijing Nova Program (Grant No. 20220484057).

Institutional Review Board Statement

Not applicable.

Informed Consent Statement

Not applicable.

Data Availability Statement

The original contributions presented in this study are included in the article. Further inquiries can be directed to the corresponding author.

Acknowledgments

The authors sincerely thank Lijie Guo for his invaluable guidance and support in this research. His expertise and encouragement were instrumental to the work.

Conflicts of Interest

Authors Qinghai Ma, Guangsheng Liu, Xiaocong Yang were employed by the company BGRIMM Technology Group. The remaining author declares that the research was conducted in the absence of any commercial or financial relationships that could be construed as a potential conflict of interest.

References

  1. Darling, P. SME Mining Engineering Handbook, 3rd ed.; Society for Mining, Metallurgy, and Exploration, Inc.: Denver, CO, USA, 2011. [Google Scholar]
  2. Hustrulid, W.A.; Bullock, R.L. Underground Mining Methods: Engineering Fundamentals and International Case Studies; Society for Mining, Metallurgy, and Exploration, Inc.: Littleton, CO, USA, 2001. [Google Scholar]
  3. Kumar, D.; Singh, U.K.; Singh, G.S.P. Laboratory characterization of cemented rock fill for underhand cut and fill method of mining. J. Inst. Eng. India Ser. D 2016, 97, 193–203. [Google Scholar] [CrossRef]
  4. Wang, X.; Guo, P.; Huang, W.; Chen, Z.; Chen, Q.; Zhao, K. Stability calculation of backfill roof in downward roadway under multifactor influence. Rock Soil Mech. 2022, 43, 3453–3462. [Google Scholar] [CrossRef]
  5. Wang, J.; Qiao, D.; Li, G.; Liu, Y.; Zhang, X. Strength model and its application of downward drift filling roof based on thick plate theory. J. China Coal Soc. 2022, 48, 28–36. [Google Scholar] [CrossRef]
  6. Williams, T.J.; Brady, T.M.; Bayer, D.C.; Bren, M.J.; Pakalnis, R.C.; Marjerison, J.A.; Langston, R.B. Underhand cut and fill mining as practiced in three deep hard rock mines in the United States. In Proceedings of the 109th Canadian Institute of Mining Annual General Meeting, Montreal, QC, Canada, 29 April–2 May 2007. [Google Scholar]
  7. Guo, S.; Fall, M.; Haruna, S. Interface shear behavior of cementing underground mine backfill. Int. J. Geomech. 2020, 20, 04020230. [Google Scholar] [CrossRef]
  8. Lu, X. Research on Optimization of Stoping Drifts Parameters by Downward Cemented Filling Method in Jinchuan No. 2 Mining Area. Master’s Thesis, Wuhan University of Science and Technology, Wuhan, China, 2022. [Google Scholar]
  9. Sun, C.; Luo, L.; Liang, Y. Application of downward horizontal layered drift cementing andfilling mining method in Maoping lead zine mine. China Min. Mag. 2023, 32, 382–385. [Google Scholar]
  10. Li, M.; Mo, J.; Zhou, C. Stability analysis of full tailing paste filling roof in Wushan Copper Mine. Copp. Eng. 2023, 182, 126–130. [Google Scholar]
  11. Liu, G.; Li, L.; Yang, X.; Guo, L. Required strength estimation of a cemented backfill with the front wall exposed and back wall pressured. Int. J. Min. Miner. Eng. 2018, 9, 1–20. [Google Scholar] [CrossRef]
  12. Wang, R.; Zeng, F.; Li, L. Stability analyses of side-exposed backfill considering mine depth and extraction of adjacent stope. Int. J. Rock Mech. Min. Sci. 2021, 142, 104735. [Google Scholar] [CrossRef]
  13. Ma, Q.; Liu, G.; Yang, X.; Guo, L.; Andy, F. Stability of base-exposed backfill roof considering interfaces between adjacent drifts in underhand drift-and-fill mining. J. Rock Mech. Geotech. Eng. 2025. accepted. [Google Scholar]
  14. Fan, C.; Li, L.; Liu, G.; Yang, X.; Guo, L.; Tang, J. Analytical solution for estimating the minimum required strength of sill mat by considering failure due to rock wall closure. J. Rock Mech. Geotech. Eng. 2024, 17, 996–1007. [Google Scholar] [CrossRef]
  15. Zhao, K.; Liang, N.; Zeng, P.; Wang, W.; Gong, C.; Xiong, L.; Liu, H. Research on optimization and numerical simulation of layout scheme of mining approach in downward slicing and filling method. Appl. Sci. 2023, 13, 8688. [Google Scholar] [CrossRef]
  16. Gao, T.; Sun, W.; Liu, Z.; Cheng, H. Investigation on fracture characteristics and failure pattern of inclined layered cemented tailings backfill. Constr. Build. Mater. 2022, 343, 128110. [Google Scholar] [CrossRef]
  17. Zhu, B.; Gao, T.; Li, Y.; Ge, C.; Zhang, B.; Sun, W. Study on stability of inclined layered cemented backfill in downward drift. Min. Res. Dev. 2024, 44, 1–12. [Google Scholar]
  18. Itasca. FLAC3D-Fast Lagrangian Analysis of Continua, User’s Guide; Itasca Consulting Group: Minneapolis, MN, USA, 2019. [Google Scholar]
  19. Liu, G.; Li, L.; Yang, X.; Guo, L. Stability analyses of vertically exposed cemented backfill: A revisit to Mitchell’s physical model tests. Int. J. Min. Sci. Technol. 2016, 26, 1135–1144. [Google Scholar] [CrossRef]
  20. Guo, L.; Peng, X.; Zhao, Y.; Liu, G.; Tang, G.; Pan, A. Experimental study on direct tensile properties of cemented paste backfill. Front. Mater. 2022, 9, 864264. [Google Scholar] [CrossRef]
  21. Grabinsky, M.W.F.; Jafari, M.A.; Pan, A.N. Cemented paste backfill (CPB) material properties for undercut analysis. Mining 2022, 2, 103–122. [Google Scholar] [CrossRef]
  22. Talibe Keita, A.M.; Jahanbakhshzadeh, A.; Li, L. Numerical analysis of the stability of arched sill mats made of cemented backfill. Int. J. Rock Mech. Min. Sci. 2021, 140, 104667. [Google Scholar] [CrossRef]
  23. Pagé, P.; Li, L.; Yang, P.; Simon, R. Numerical investigation of the stability of a base-exposed sill mat made of cemented backfill. Int. J. Rock Mech. Min. Sci. 2019, 114, 195–207. [Google Scholar] [CrossRef]
  24. Xing, C.; Gao, M.; Qiu, Y.; Yu, L.; Zhang, Y.; Xue, C.; Peng, K. Study of deep-mine ore rock failure mechanism using downward approachfilling mining method by numerical simulation. Gold 2024, 45, 58–63. [Google Scholar]
  25. Wang, K.; Liu, L.; He, J.; Li, X.; Ran, J. Numerical simulation of approach rock stability under interlocking vertical mining of adjacent layered approaches. Min. Metall. 2024, 33, 503–507. [Google Scholar]
  26. Caceres, C.A. Effect of Delayed Backfill on Open Stope Mining Methods. Master’s Thesis, The University of British Columbia, Vancouver, BC, Canada, 2005. [Google Scholar]
  27. Lin, H.; Yang, Y.; Chen, C.; Ding, C. Influence of mining sequence of branch on stope pressure behaviour on continuous mining and continuous backfilling. Processes 2024, 12, 442. [Google Scholar] [CrossRef]
  28. Caceres, C.; Moffat, R.; Pakalnis, R. Evaluation of flexural failure of sill mats using classical beam theory and numerical models. Int. J. Rock Mech. Min. Sci. 2017, 99, 21–27. [Google Scholar] [CrossRef]
  29. Han, B. Reliability Analysis of Filling Body in Jinchuan No.2 Mining Area and Optimization of Mining Ground Pressure Control in 1 # Ore Body. Ph.D. Thesis, Central South University, Changsha, China, 2004. [Google Scholar]
  30. Mitchell, R.J. Sill mat evaluation using centrifuge models. Int. J. Min. Sci. Technol. 1991, 13, 301–313. [Google Scholar] [CrossRef]
  31. Huang, Y.; Sun, H.; Liu, W. Discussion on the mechanics model of underhand drift-and-fill mining. Nonferrous Met. 1999, 51, 1–4. [Google Scholar]
  32. Hu, Y.; Han, B.; Zhang, B.; Li, K. Force analysis and strength determination of the cemented paste backfill roof in underhand drift cut-and-fill stopping. Appl. Sci. 2023, 13, 855. [Google Scholar] [CrossRef]
  33. Fan, C.; Li, L.; Yang, X.; Liu, G.; Guo, L.; Tang, J. Analytical solution for determining wall closure associated with stope excavation underneath sill mat constructed by cemented backfill. J. Rock Mech. Geotech. Eng. 2024, 17, 983–995. [Google Scholar] [CrossRef]
  34. Dong, L.; Zhang, Y.; Chen, Z.; Kou, Y.; Pei, Z. Dynamic stress characterization and instability risk identification using multisource acoustic signals in cut-and-fill stopes. Sci. Rep. 2024, 14, 16499. [Google Scholar] [CrossRef]
  35. Hao, J.; Chen, A.; Li, X.; Bian, H.; Shi, Y.; Wang, X.; Zhao, J.; Liu, H. A case study of pillar extraction techniques based on strip-filling and second-mining method. Front. Earth Sci. 2022, 10, 1051245. [Google Scholar] [CrossRef]
  36. Chen, S.; Jin, A.; Zhao, Y.; Li, H.; Wang, J. Mechanical properties and deformation mechanism of stratified cemented tailings backfill under unconfined compression. Constr. Build. Mater. 2022, 335, 127205. [Google Scholar] [CrossRef]
Figure 1. Drift layout commonly adopted in underhand drift-and-fill mining method: (a) aligned drift layout, (b) staggered drift layout, and (c) basket weave drift layout.
Applsci 15 04487 g001
Figure 2. A numerical model established in FLAC3D of the stope with a basket weave drift layout surrounded by the rock mass: (a) the model domain and meshing; (b) the basket weave drift layout.
Applsci 15 04487 g002aApplsci 15 04487 g002b
Figure 3. Comparison between initial ground stress generated in numerical models and those obtained from on-site data.
Applsci 15 04487 g003
Figure 4. Vertical displacement distribution of the backfill roof at (a) L3 and (b) L2 after the excavation of secondary drifts at L3 (backfill cohesion c = 425 kPa).
Applsci 15 04487 g004
Figure 5. Vertical displacement distribution of the backfill roof at L3 after the excavation of secondary drifts at L3 (backfill cohesion c = 200 kPa).
Applsci 15 04487 g005
Figure 6. Variations in the maximum vertical displacement of backfill roof with different cohesion for cases with drift sizes of (a) 3.5 m × 3.0 m, (b) 4.5 m × 4.0 m, and (c) 5.5 m × 5.0 m.
Applsci 15 04487 g006
Figure 7. Variations in the required UCS of the backfill roof with different drift spans, obtained by numerical simulation and analytical solutions (Equations (3)–(6)), respectively.
Applsci 15 04487 g007
Figure 8. Comparison of numerical results with field data measured at Jinchuan Nickel Mine [32].
Applsci 15 04487 g008
Table 1. Parameters of the rock mass and backfill used in numerical simulations.
MaterialDensity
(kg⋅m−3)
Posson’s RatioFriction Angle
(°)
Cohesion
(MPa)
Young’s Modulus
(GPa)
Tensile Strength
(MPa)
Rock mass28000.3351.98101.25
Backfill17800.2733/0.315/
Table 2. Iterative search process for evaluation of the strength requirement of the backfill roof with a drift size of 3.5 m × 3.0 m.
No.Backfill Cohesion
(kPa)
Roof StabilityBackfill Cohesion for Next
(kPa)
Note
1200unstable2000confirm the lower bound
22000stable1100 = (200 + 2000) ÷ 2confirm the upper bound
31100stable650 = (200 + 1100) ÷ 2current range [200, 1100]
4650stable425 = (200 + 650) ÷ 2current range [200, 650]
5425stable312.5 = (200 + 425) ÷ 2current range [200, 425]
6312.5unstable368.75 = (312.5 + 425) ÷ 2current range [312.5, 425]
7368.75stable340.625 = (312.5 + 368.75) ÷ 2current range [312.5, 368.75]
8340.625stable
Disclaimer/Publisher’s Note: The statements, opinions and data contained in all publications are solely those of the individual author(s) and contributor(s) and not of MDPI and/or the editor(s). MDPI and/or the editor(s) disclaim responsibility for any injury to people or property resulting from any ideas, methods, instructions or products referred to in the content.

