1. Introduction
Raman spectroscopy is a powerful, non-invasive analytical technique that provides detailed molecular information about biological samples, making it particularly valuable in biomedical research. By measuring the inelastic scattering of monochromatic light, Raman spectroscopy generates spectral fingerprints that reflect the biochemical composition of cells, tissues, and biofluids. This capability has led to its widespread application in, among others, cellular biology [
1,
2], disease diagnosis [
3,
4], and drug development [
5,
6].
However, the complexity and high dimensionality of Raman spectral data pose significant challenges in data interpretation. Spectra often contain overlapping peaks, autofluorescence, and noise background, along with an intrinsic variability due to the heterogeneity of biological samples. Primarily, raw data need to be preprocessed with background reduction (such as polynomial subtraction or similar techniques) and somehow normalized in intensity to reduce, as much as possible, the presence of non-Raman signals and signal differences due to different optical parameters (laser power, integration time, variations in focusing on the sample). However, after the most efficient preprocessing and in the presence of clean Raman signals, the extraction of meaningful insights from Raman imaging datasets of complex biological samples requires the use of computational approaches, such as machine learning and, more recently, deep learning techniques. Among machine learning approaches, K-means clustering analysis (KCA) can still be considered an effective unsupervised method for analyzing Raman hyperspectral images.
K-means clustering is a widely used partitioning algorithm that groups data points into clusters based on spectral similarity. By minimizing intra-cluster variance, it allows for the identification of distinct biochemical regions within a Raman image, facilitating the differentiation of cellular components, disease states, or metabolic processes. Compared to other clustering techniques such as hierarchical clustering or Gaussian mixture models, K-means offers computational efficiency and scalability, making it suitable for large Raman imaging datasets.
However, the choice of distance metric in K-means clustering has crucial importance in achieving a meaningful segmentation of Raman data. Different metrics, such as Euclidean distance or polar distance (cosine function), can significantly impact the clustering outcome by influencing how spectral similarities and differences are measured. Selecting an appropriate metric ensures that biologically relevant spectral variations are effectively captured, leading to improved cluster separability and the more accurate identification of biochemical structures within the sample.
In the last two decades, several efforts have been made to introduce non-Euclidean metrics in the framework of clustering analysis, and limiting the view to angular-based metrics, several works have been proposed, like polar coordinates for circular clustering [
7] and for density peaks clustering [
8], polar transforms with k-means segmentation [
9], and clustering using polar self-organizing maps [
10]. Also, efforts for exploring and exploiting asymmetries have been proposed, like asymmetric self-organizing maps [
11], unsupervised anisotropic clustering [
12], the asymmetric K-means algorithm [
13], and K-means clustering on asymmetric data [
14]. However, in these latter works on asymmetric clustering, all the proposed methods develop a non-metric use of data asymmetry by introducing Gaussian kernels or dissimilarity measures.
In this study, we develop an asymmetric metric distance to improve clustering performance, and an introduced ad hoc parameter called eccentricity will move from Euclidean to polar distance through different asymmetry degrees. By applying K-means clustering to the Raman imaging of cell samples, we explore the optimization of two clustering parameters, the eccentricity and the number of clusters. We show that an appropriate choice of the eccentricity parameter significantly enhances the quality of image segmentation compared to both Euclidean and polar metrics, and could improve the ability to distinguish subtle biochemical variations inside the cells. These results could contribute to the advancement of computational Raman microspectroscopy for biomedical applications.
2. Materials and Methods
2.1. Cell Culturing and Fixation
Two cell lines were used for this work, specifically human hepatocarcinoma cells HepG2 and human hepatic stellate cells LX-2.
The HepG2 cell lines were purchased from the American Type Culture Collection (ATCC, Manassas, VA, USA) and were grown in a humidified incubator (95% O2, 5% CO2) at 37 °C in Minimum Essential Medium (MEM, Corning 10-009-CV), supplemented with 10% FBS (SIAL) and 1% penicillin/streptomycin (100 μg/mL) (SIAL).
LX-2 cells were grown at 37 °C in a humidified atmosphere containing 5% CO2 in complete Dulbecco’s Modified Eagle Medium (DMEM, 4.5 g/L glucose, phenol red, no L-glutamine, no sodium pyruvate) supplemented with 1% v/v penicillin/streptomycin mixture (penicillin: 10,000 U/mL, streptomycin: 10,000 µg/mL), 1% v/v of L-glutamine (200 nM), and 2% v/v fetal bovine serum (FBS) (LX-2 cells, DMEM, FBS penicillin, streptomycin, and L-glutamine were all from Merck Millipore, Darmstadt, Germany).
For all cell cultures, sterilized CaF2 slides (from Crystran Ltd., Dorset, UK) were used as substrates inside the culturing wells because of the negligible Raman signal of CaF2. Moreover, all cell media were replaced with serum-free and phenol-red-free DMEM (from HyClone, Logan, UT, USA) supplemented with 1% v/v penicillin/streptomycin and 1% v/v L-glutamine before the Raman experiments to reduce possible interfering signals from the media.
2.2. Raman Measurements
Raman microspectroscopy was carried out by means of an Alpha 300-R instrument (Witec GmbH, Ulm, Germany), using a 532 nm laser. A laser power of 10 mW/cm2 was set over the sample, with a typical integration time of 1 s per single spectrum. During Raman experiments, the fixed cells were maintained in a PBS (1×) solution. A 60×/1.00 NA water immersion objective was used to focus the incident laser on the sample. According to diffraction laws, the minimum achievable spot size under optimal conditions with this optical setup was approximately 0.35 µm. Raman maps were acquired by scanning the sample under the laser focus according to a measurement grid with a pixel size of 0.40 µm and collecting one Raman spectrum per pixel. The software used for Raman measurements was Witec Control 1.60.
2.3. Raman Preprocessing
Raman images were obtained from hyperspectral datasets using multivariate analysis applied to preprocessed spectra. The same preprocessing steps were applied to all spectra. Initially, the water background signal was subtracted from all spectra, followed by polynomial baseline subtraction to account for potential autofluorescence effects. Subsequently, the spectra of each map were normalized to the maximum spectral area, ensuring comparability between Raman datasets acquired at different times. All data preprocessing as well as KCA was performed with Raman-Tool-Set software v.3.1, freely available [
15].
3. Anisotropic Distance Metric
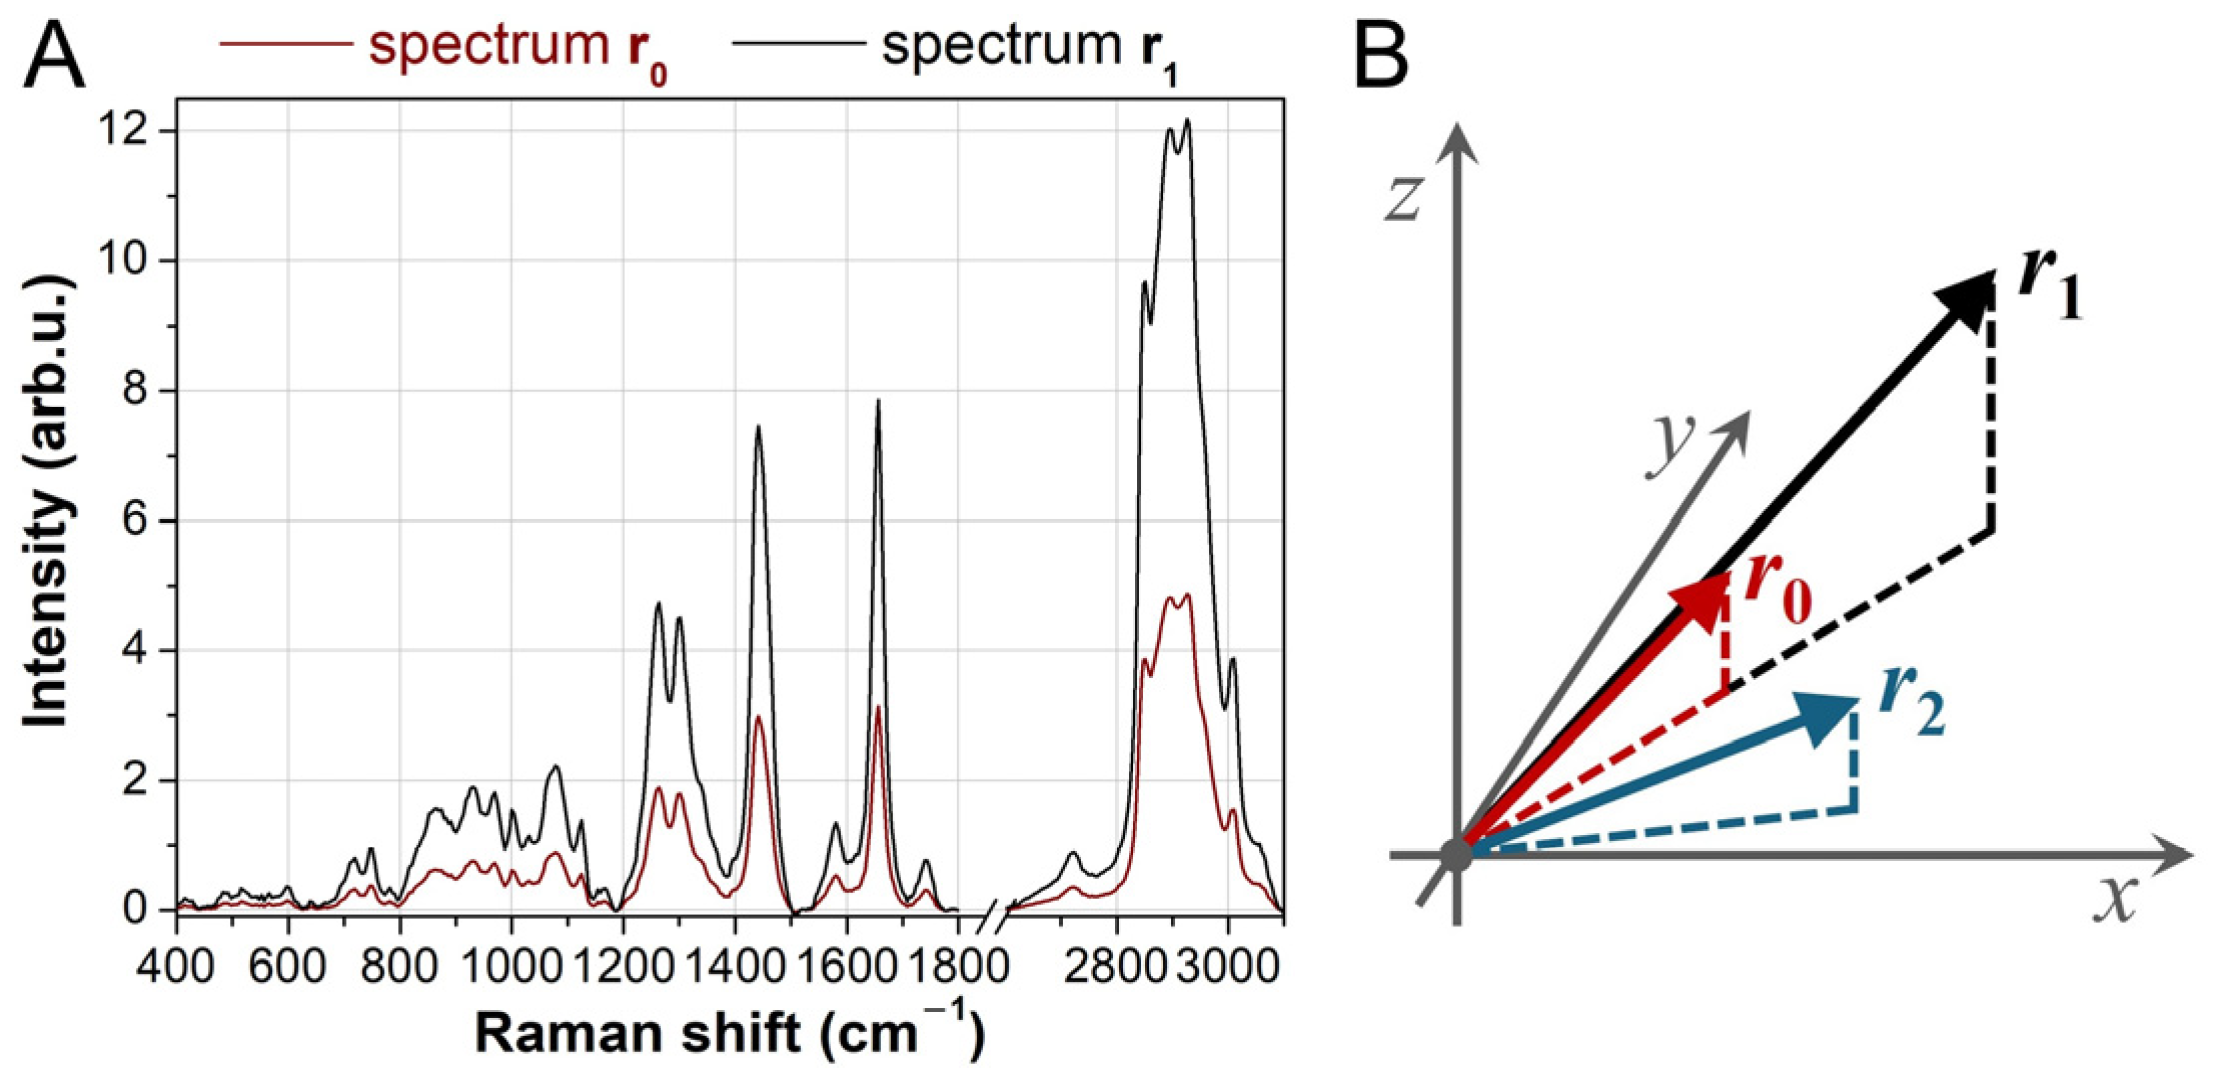
In vibrational spectroscopy, each spectrum can be represented as a point in an N-dimensional space, where N is the number of acquired intensities. Thus, each spectrum can be expressed as an array, denoted as r. Since vibrational intensities are strictly positive, all components of r are positive.
When applying clustering or other machine learning techniques, a distance metric is required to compare spectra. Incorporating prior knowledge of the data structure can be beneficial in defining an appropriate metric. Two spectra,
r0 and
r1, convey the same chemical information if they exhibit the same relative peak ratios, even if their absolute intensities differ (
Figure 1). Mathematically, such spectra can be expressed as:
where
c is a scalar greater than 1. In this case, both spectra originate from the same molecular species, with the only difference being concentration (higher for
r1 if
c > 1), which affects the overall intensity. Representing
r0 and
r1 as vectors in a coordinate system, they share the same direction and lie on the same straight line originating from the origin. Conversely, a spectrum
r2 that deviates significantly in angle from
r0 represents a different chemical composition. Therefore, an ideal distance metric should reflect this data structure.
For simplicity, we consider a three-dimensional (3D) case. Given a reference spectrum
r0 in a 3D space, the distance to another spectrum
r is computed using a metric matrix. The displacement vector is:
The Euclidean distance
d is typically given by:
which can be rewritten as the dot product:
Introducing a metric matrix
M, the generalized distance is:
where the Euclidean metric matrix
MEU is simply the identity matrix:
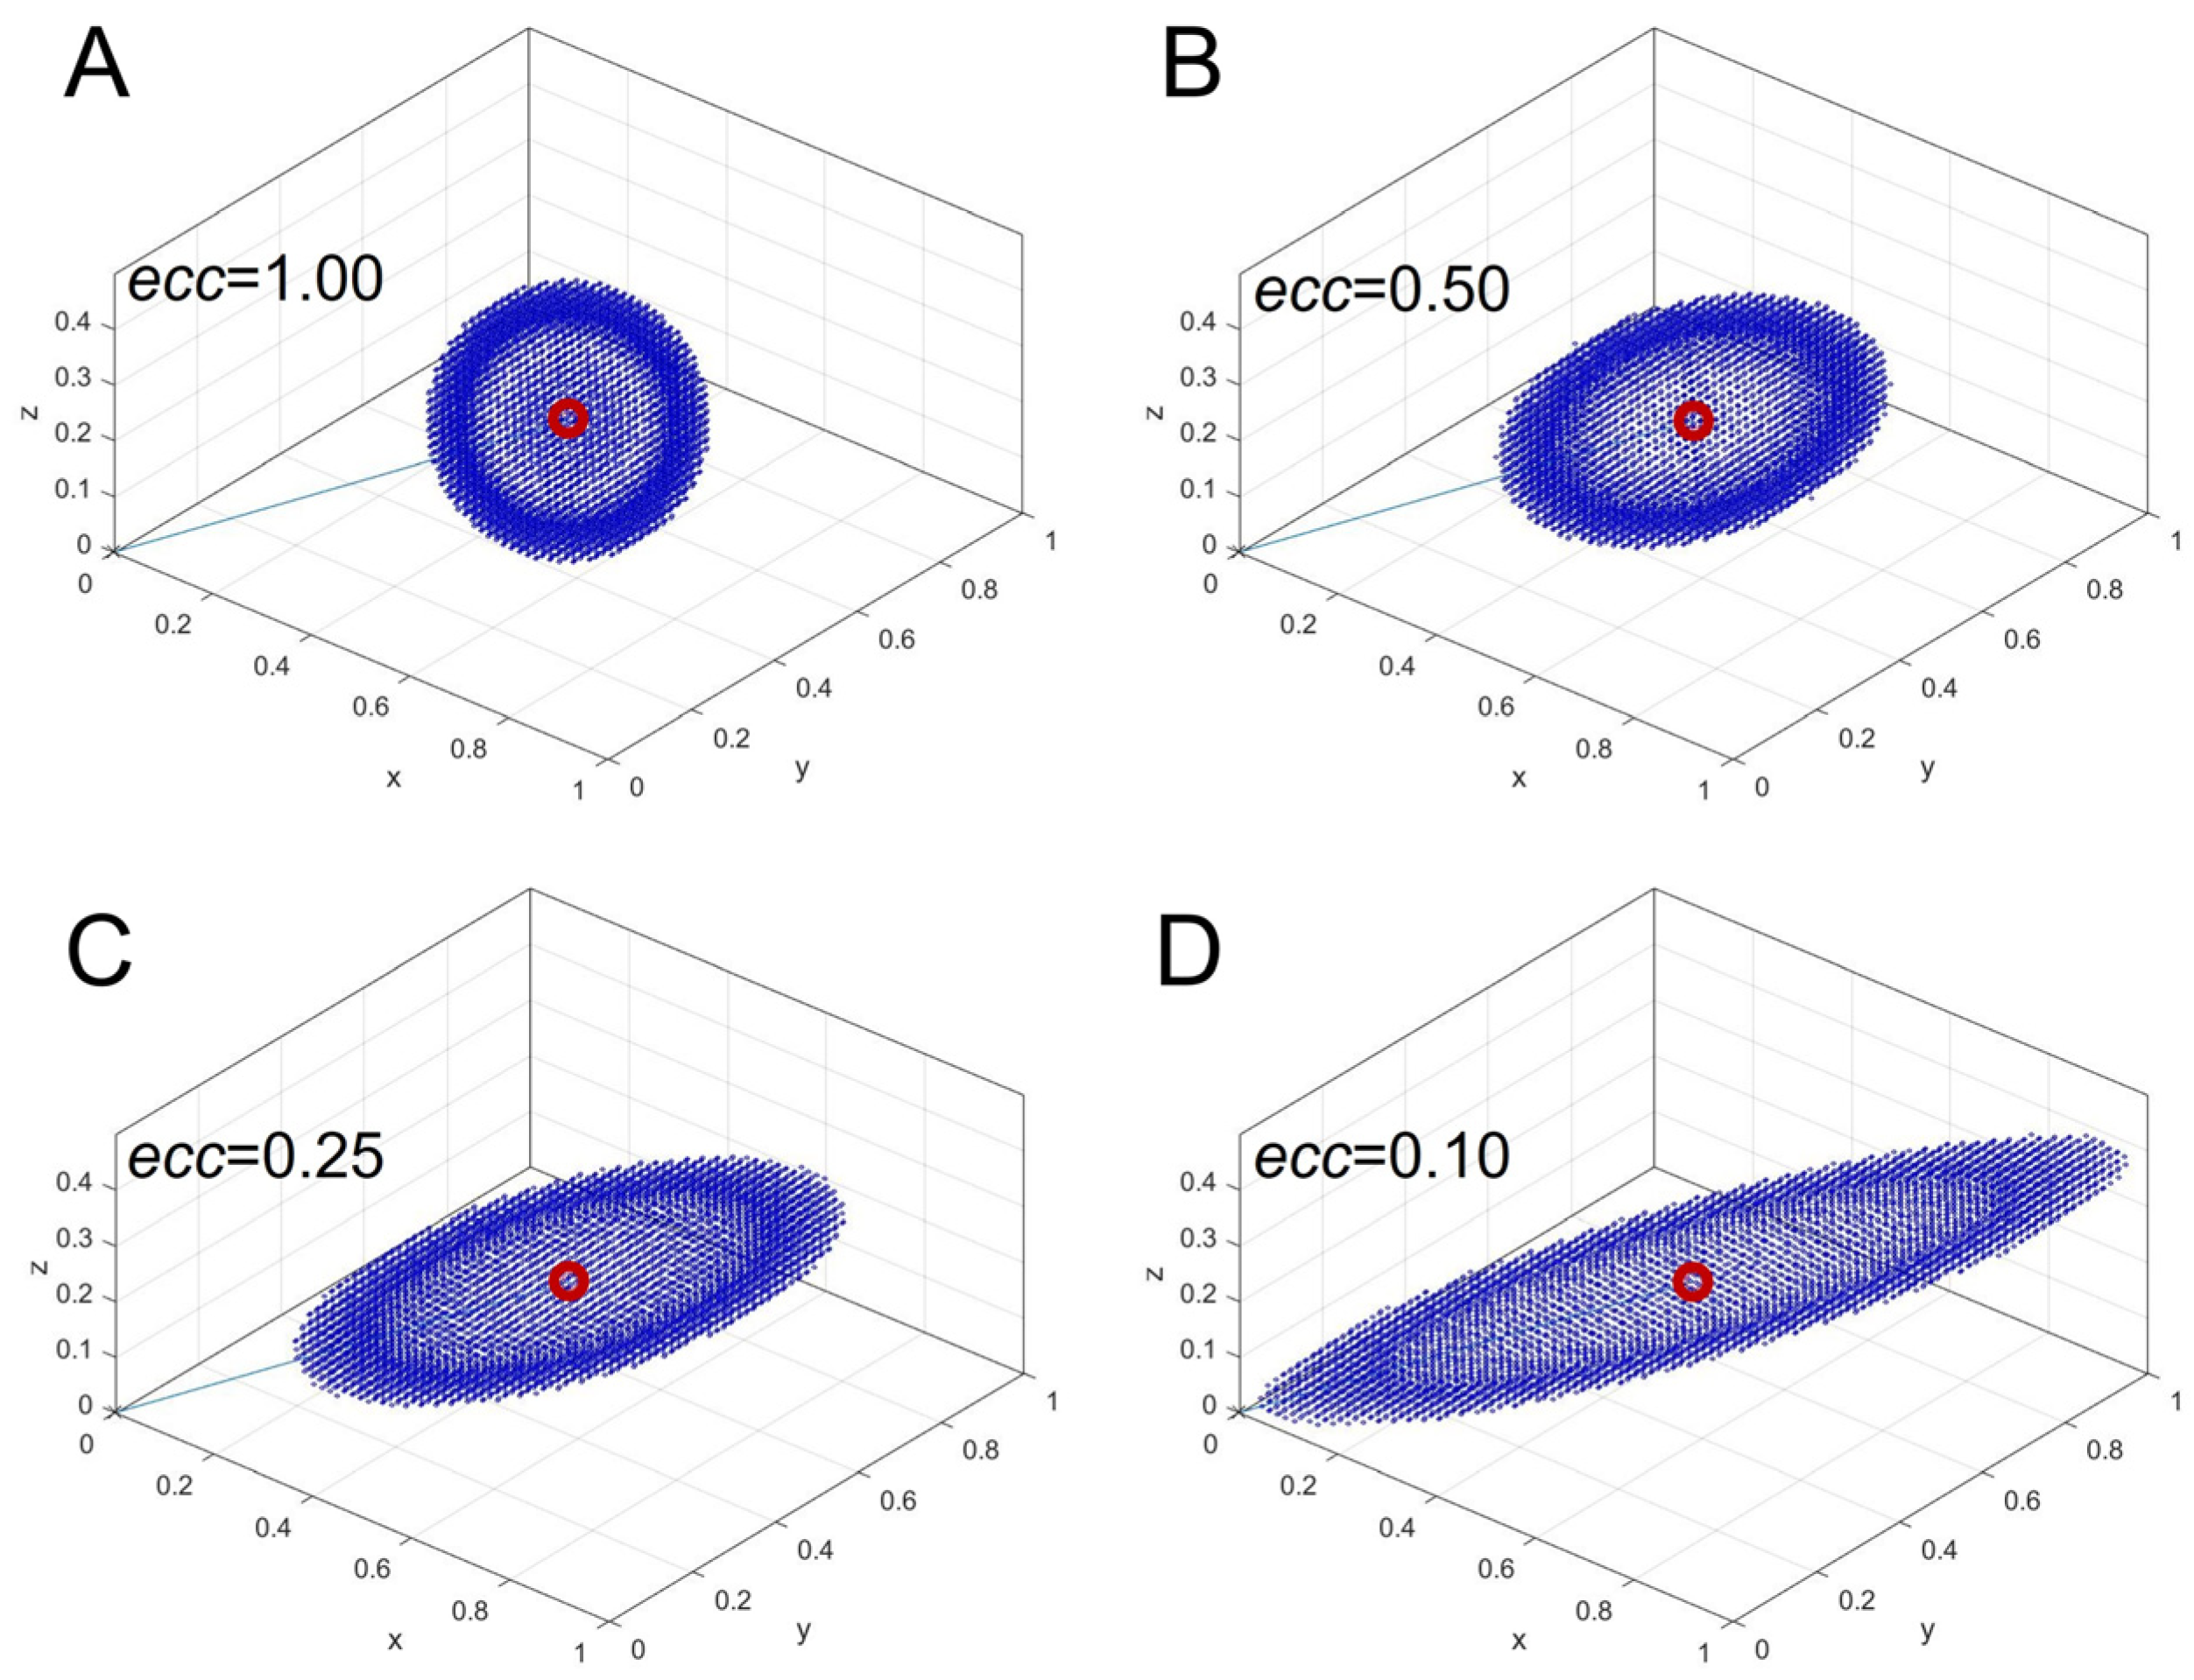
This defines an isotropic distance, meaning all points equidistant from
r0 form a sphere centered at
r0 (
Figure 2A). However, this standard distance metric does not account for the underlying data structure. To incorporate anisotropy, we define an asymmetric metric matrix
MAS, which produces ellipsoidal isodistance surfaces instead of spherical ones.
The desired anisotropic distance metric forms a prolate ellipsoid with its major axis aligned with
r0. To control elongation, we introduce an eccentricity parameter,
ecc, which defines the ratio between minor and major axes.
Figure 2 illustrates the effect of varying
ecc, with panels B, C, and D corresponding to
ecc = 0.50, 0.25, and 0.10, respectively. The most elongated ellipsoid is represented by
ecc = 0.10.
These surfaces indicate that all blue points in
Figure 2 have the same computed distance
d from
r0, based on the chosen metric. When using the Euclidean matrix (
Figure 2A), the isodistance surface remains a sphere (indicating isotropic distance), whereas with the asymmetric matrix (
Figure 2B–D), the sphere deforms into an ellipsoid (indicating an anisotropic distance). In this formulation, points aligned with
r0 along the major axis are assigned smaller distances, while points deviating from
r0 along the minor axes are assigned larger distances. This ensures that the metric prioritizes spectral similarity based on relative peak ratios rather than absolute intensity differences.
If
r0 lies on the
x axis, the asymmetric metric matrix that produces the desired result in 3D is given by:
where 1/
eccx determines the elongation along the
x axis (such that a smaller
eccx results in a larger elongation), and
eccx corresponds to the eccentricity parameter
ecc introduced earlier, i.e.,
eccx =
ecc. For the other axes we set
eccy =
eccz to obtain a prolate ellipsoid shape. These parameters can be collectively denoted as
ecc⊥. Moreover, to prevent volume scaling when transitioning from spherical to ellipsoidal isodistance surfaces, we impose the asymmetric metric matrix
T to be unitary by applying the following condition:
which simplifies to
Solving for
ecc⊥, we obtain:
This result implies that only a single eccentricity parameter, ecc, needs to be specified along the axis of r0, while the others are uniquely determined.
To compute the distances from
r0 using the metric matrix
T, we apply:
yielding isodistance surfaces in the form of prolate ellipsoids with the major axis aligned to
x axis. However, this formulation is only valid when
r0 lies on the
x axis. To extend the approach for a generic
r0, we first apply a rotation matrix
R, which aligns
r0 with the
x axis:
Then, the asymmetric matrix
T is used to compute the distances between the rotated vectors:
Substituting
Δr′ =
RΔr yields:
Thus, the desired asymmetric metric matrix,
MAS, applicable to any arbitrary
r0, is given by:
Since T is a positive definite matrix and the application of a rotation R preserves the positive definiteness of T, the resulting matrix MAS remains positive definite and constitutes a valid metric matrix.
Extending this approach to
N-dimensions is straightforward. The matrix
T in
N-dimensions is given by:
where the unitary condition results in:
Instead, the
N-dimensional rotation matrix
R is computed using the general method proposed in ref. [
16].
4. Results
4.1. Asymmetric Metric Matrix Benchmark, Compared with Eculidean and Polar Metrics
We performed K-means clustering analysis on the Raman hyperspectra of cells using the asymmetric metric matrix MAS to compute the distances between spectra. First, we compared Euclidean and pure polar distances with asymmetric distances, varying the eccentricity parameter ecc. A Raman dataset recorded over a HepG2 cell was used for this test.
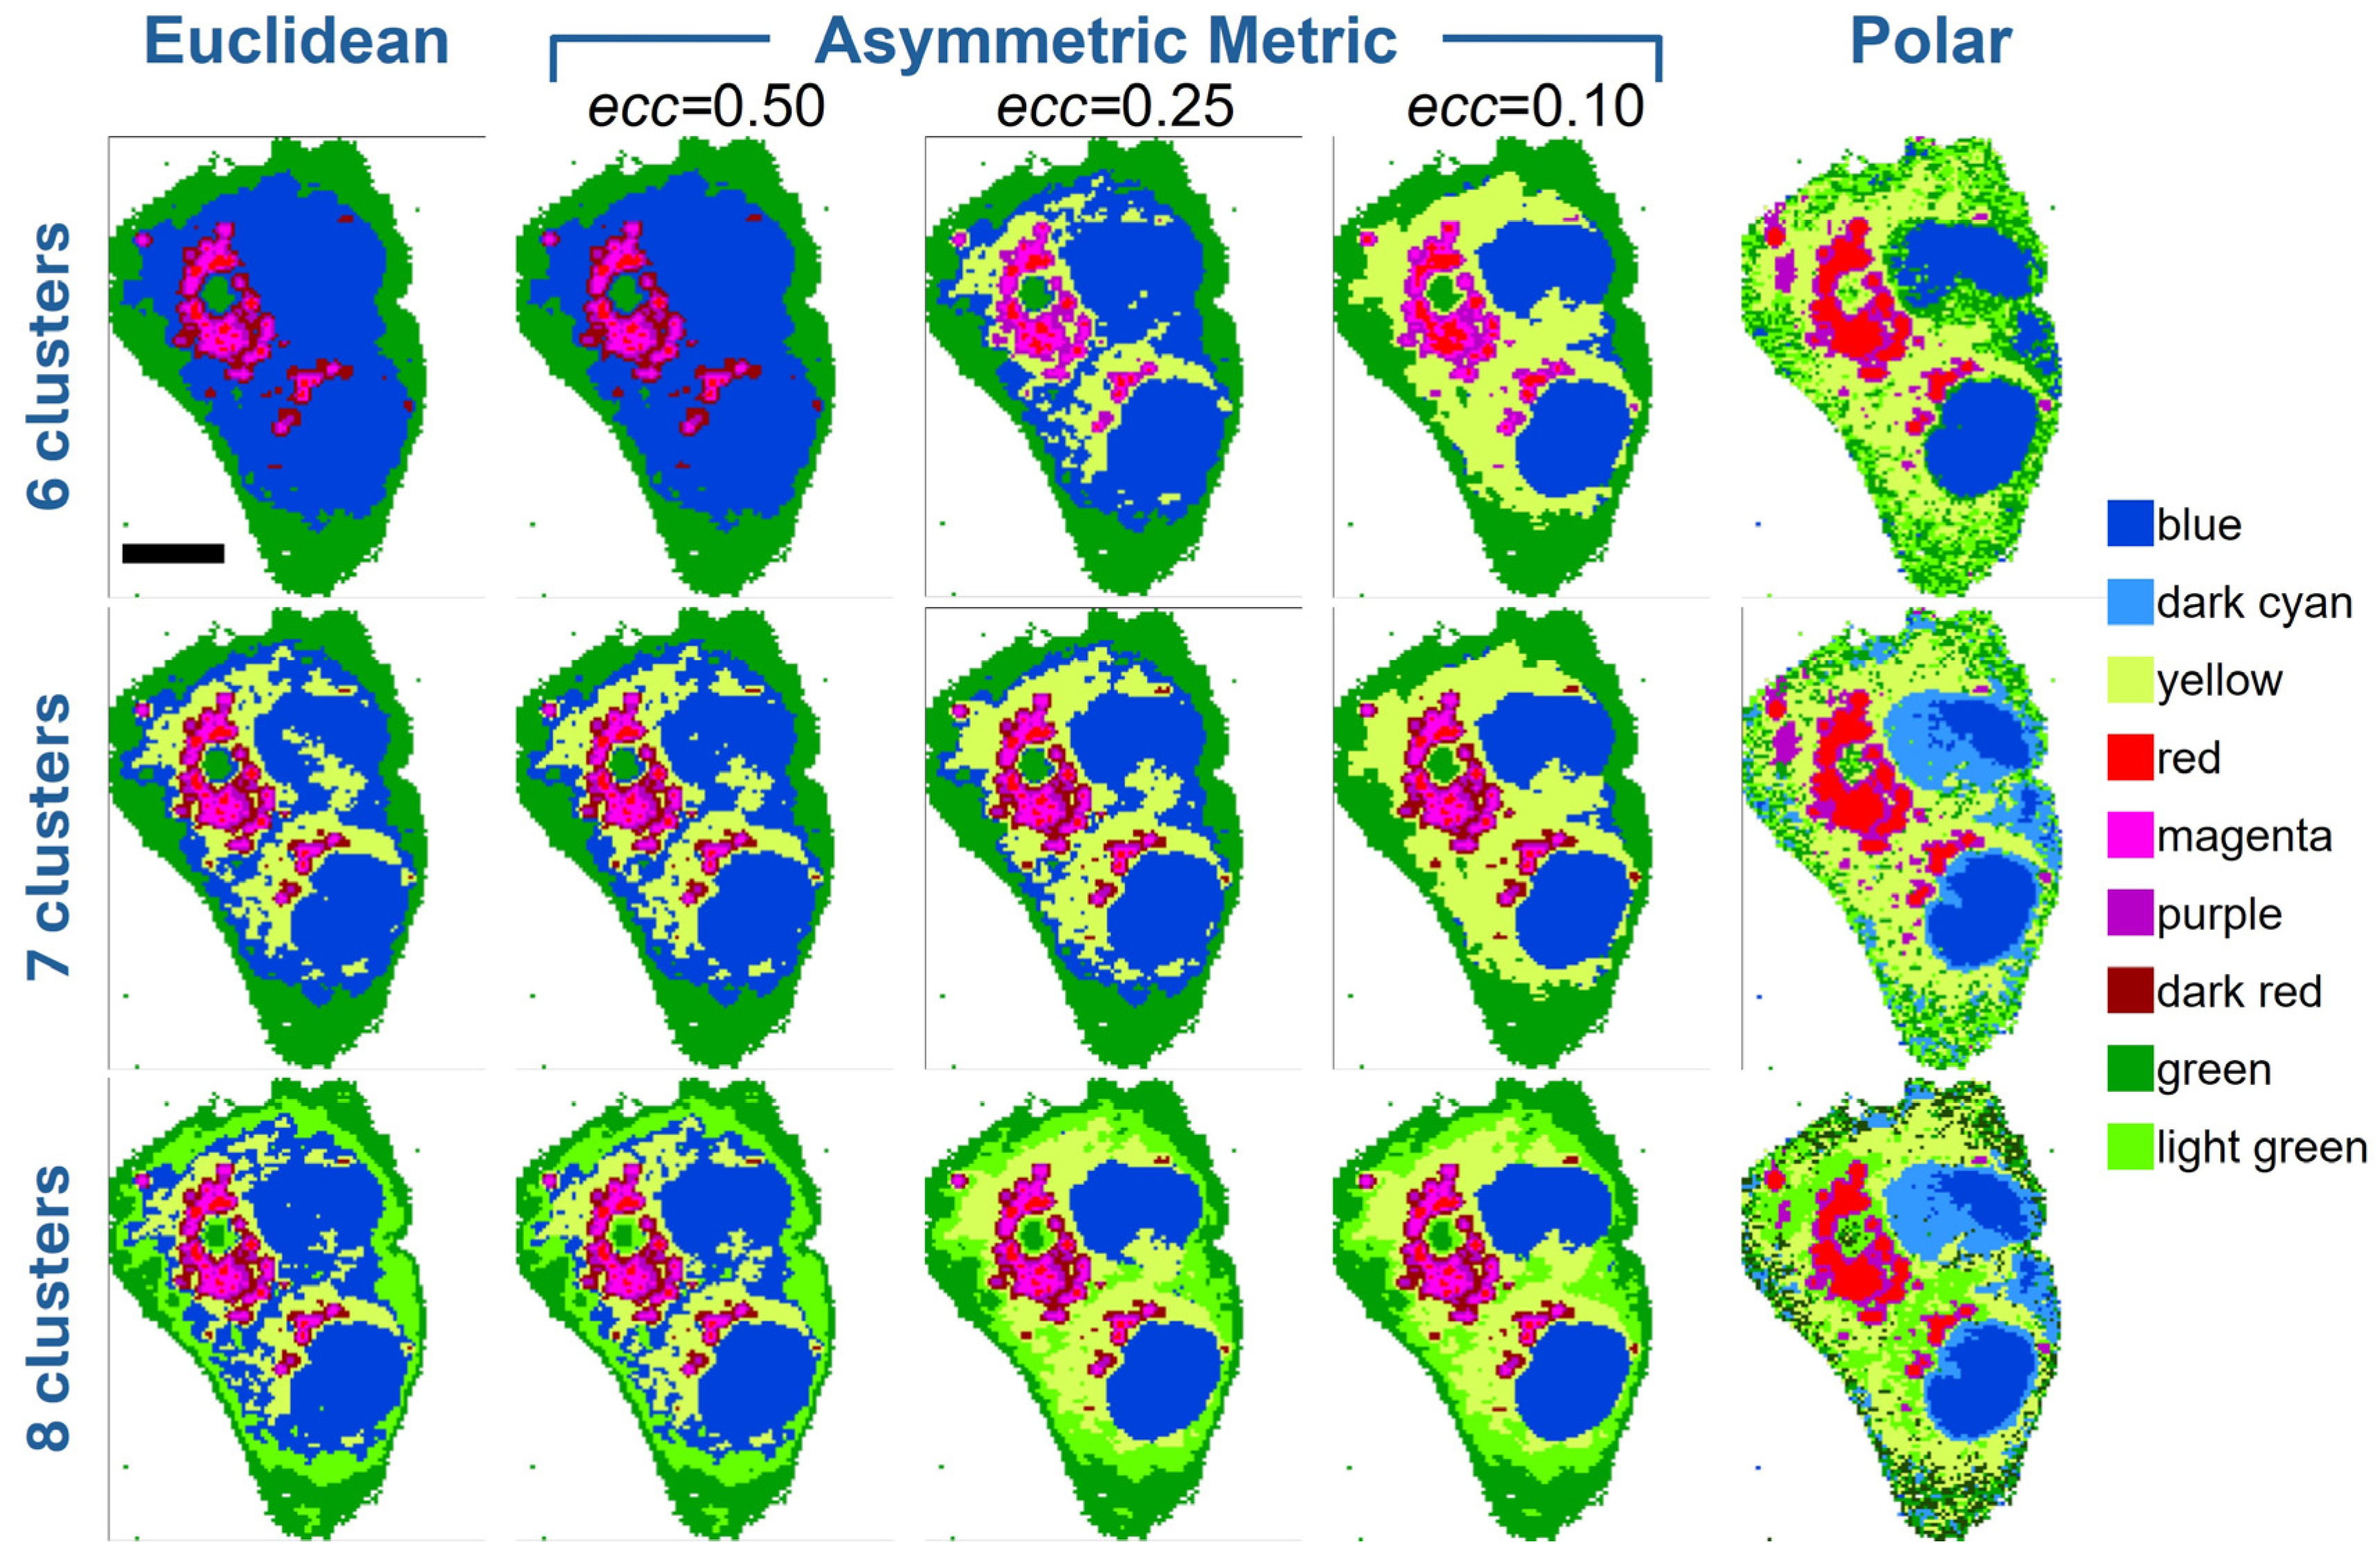
Figure 3 presents the results obtained with the different metrics for some cluster numbers (six, seven, and eight clusters). For all cluster numbers, we observe that Euclidean distance and the asymmetric distance with
ecc = 0.50 (first two columns of
Figure 3) produce remarkably similar results. This indicates that the KCA algorithm does not perform significantly differently when using these two metrics. The reason becomes clear when observing the isodistance surfaces (
Figure 2A,B), with
ecc = 1.00 corresponding to Euclidean distance, and
ecc = 0.50, which still results in a near-spherical shape. Indeed, with
ecc = 0.50 the ratio between the major and minor axes of the prolate ellipsoid is not so pronounced and the isodistance surface is not so far from the sphere of Euclidean metric.
The results change significantly when decreasing to
ecc = 0.25 and even more to
ecc = 0.10. Even with six clusters, the asymmetric metric with
ecc = 0.25 highlights subcellular regions (yellow areas in the picture of
Figure 3) that are not detected with Euclidean and
ecc = 0.50 metrics, while preserving the general structure of other regions (blue, reddish, and green areas). It is important to note that all images in the first row of
Figure 3 correspond to clustering with six clusters. But for Euclidean and
ecc = 0.50 metrics, we have four different reddish colors (dark red, purple, red, and magenta), while in the case of
ecc = 0.25, we have only three reddish colors (purple, red, and magenta) along with one additional yellow cluster. This means that
ecc = 0.25 improves segmentation by reducing redundant clusters (the four reddish tones in the Euclidean and
ecc = 0.50 metrics) and enhancing the detection of biochemical differences due to spectral vector orientation. This capability is even more pronounced at
ecc = 0.10 (again with six clusters): the corresponding image shows well delimited and clean subcellular regions, where blue and reddish areas are better defined within a more extended yellow region (see below in the text for color assignment).
The pure polar metric can be regarded as an extreme case of the asymmetric metric, where the ellipsoid becomes highly elongated, approaching a straight-line form. This is just a point of view for comparison with the asymmetric metric. Mathematically, the pure polar distance is a cosine-based metric that considers only angular deviations between spectral vectors. In the last image of the first row (
Figure 3), the pure polar result appears excessively noisy: while the reddish and blue areas are well defined, the yellow and green regions are mixed. Moreover, only two reddish colors (red and purple) remain, and a light green cluster is added. This evident deterioration in segmentation is likely due to the exclusive reliance of the polar metric on vector orientation, without consideration of spectral intensity (i.e., vector magnitude).
When moving to seven clusters (second row of
Figure 3), we first note that the additional cluster results in a yellow area, like that mentioned above, in the case of Euclidean and
ecc = 0.50 asymmetric metrics. While in the case of
ecc = 0.25 and
ecc = 0.10 asymmetric metrics, the additional cluster is found as a fourth reddish tone. The conclusion is that adding one cluster allows Euclidean and
ecc = 0.50 metrics to recover one chemical information missing with six clusters (the yellow area), while the
ecc = 0.25 and
ecc = 0.10 are forced to add a redundant cluster among the reddish tones. Further, we can note that all these metrics produce similar results with seven clusters (first four images of the second row), but again the
ecc = 0.25 and
ecc = 0.10 metrics lead to better-defined subcellular regions. The image of pure polar metric with seven clusters is still noisy, and the blue area is divided into two sub-regions.
4.2. Biochemical Assignment of Clustered Regions
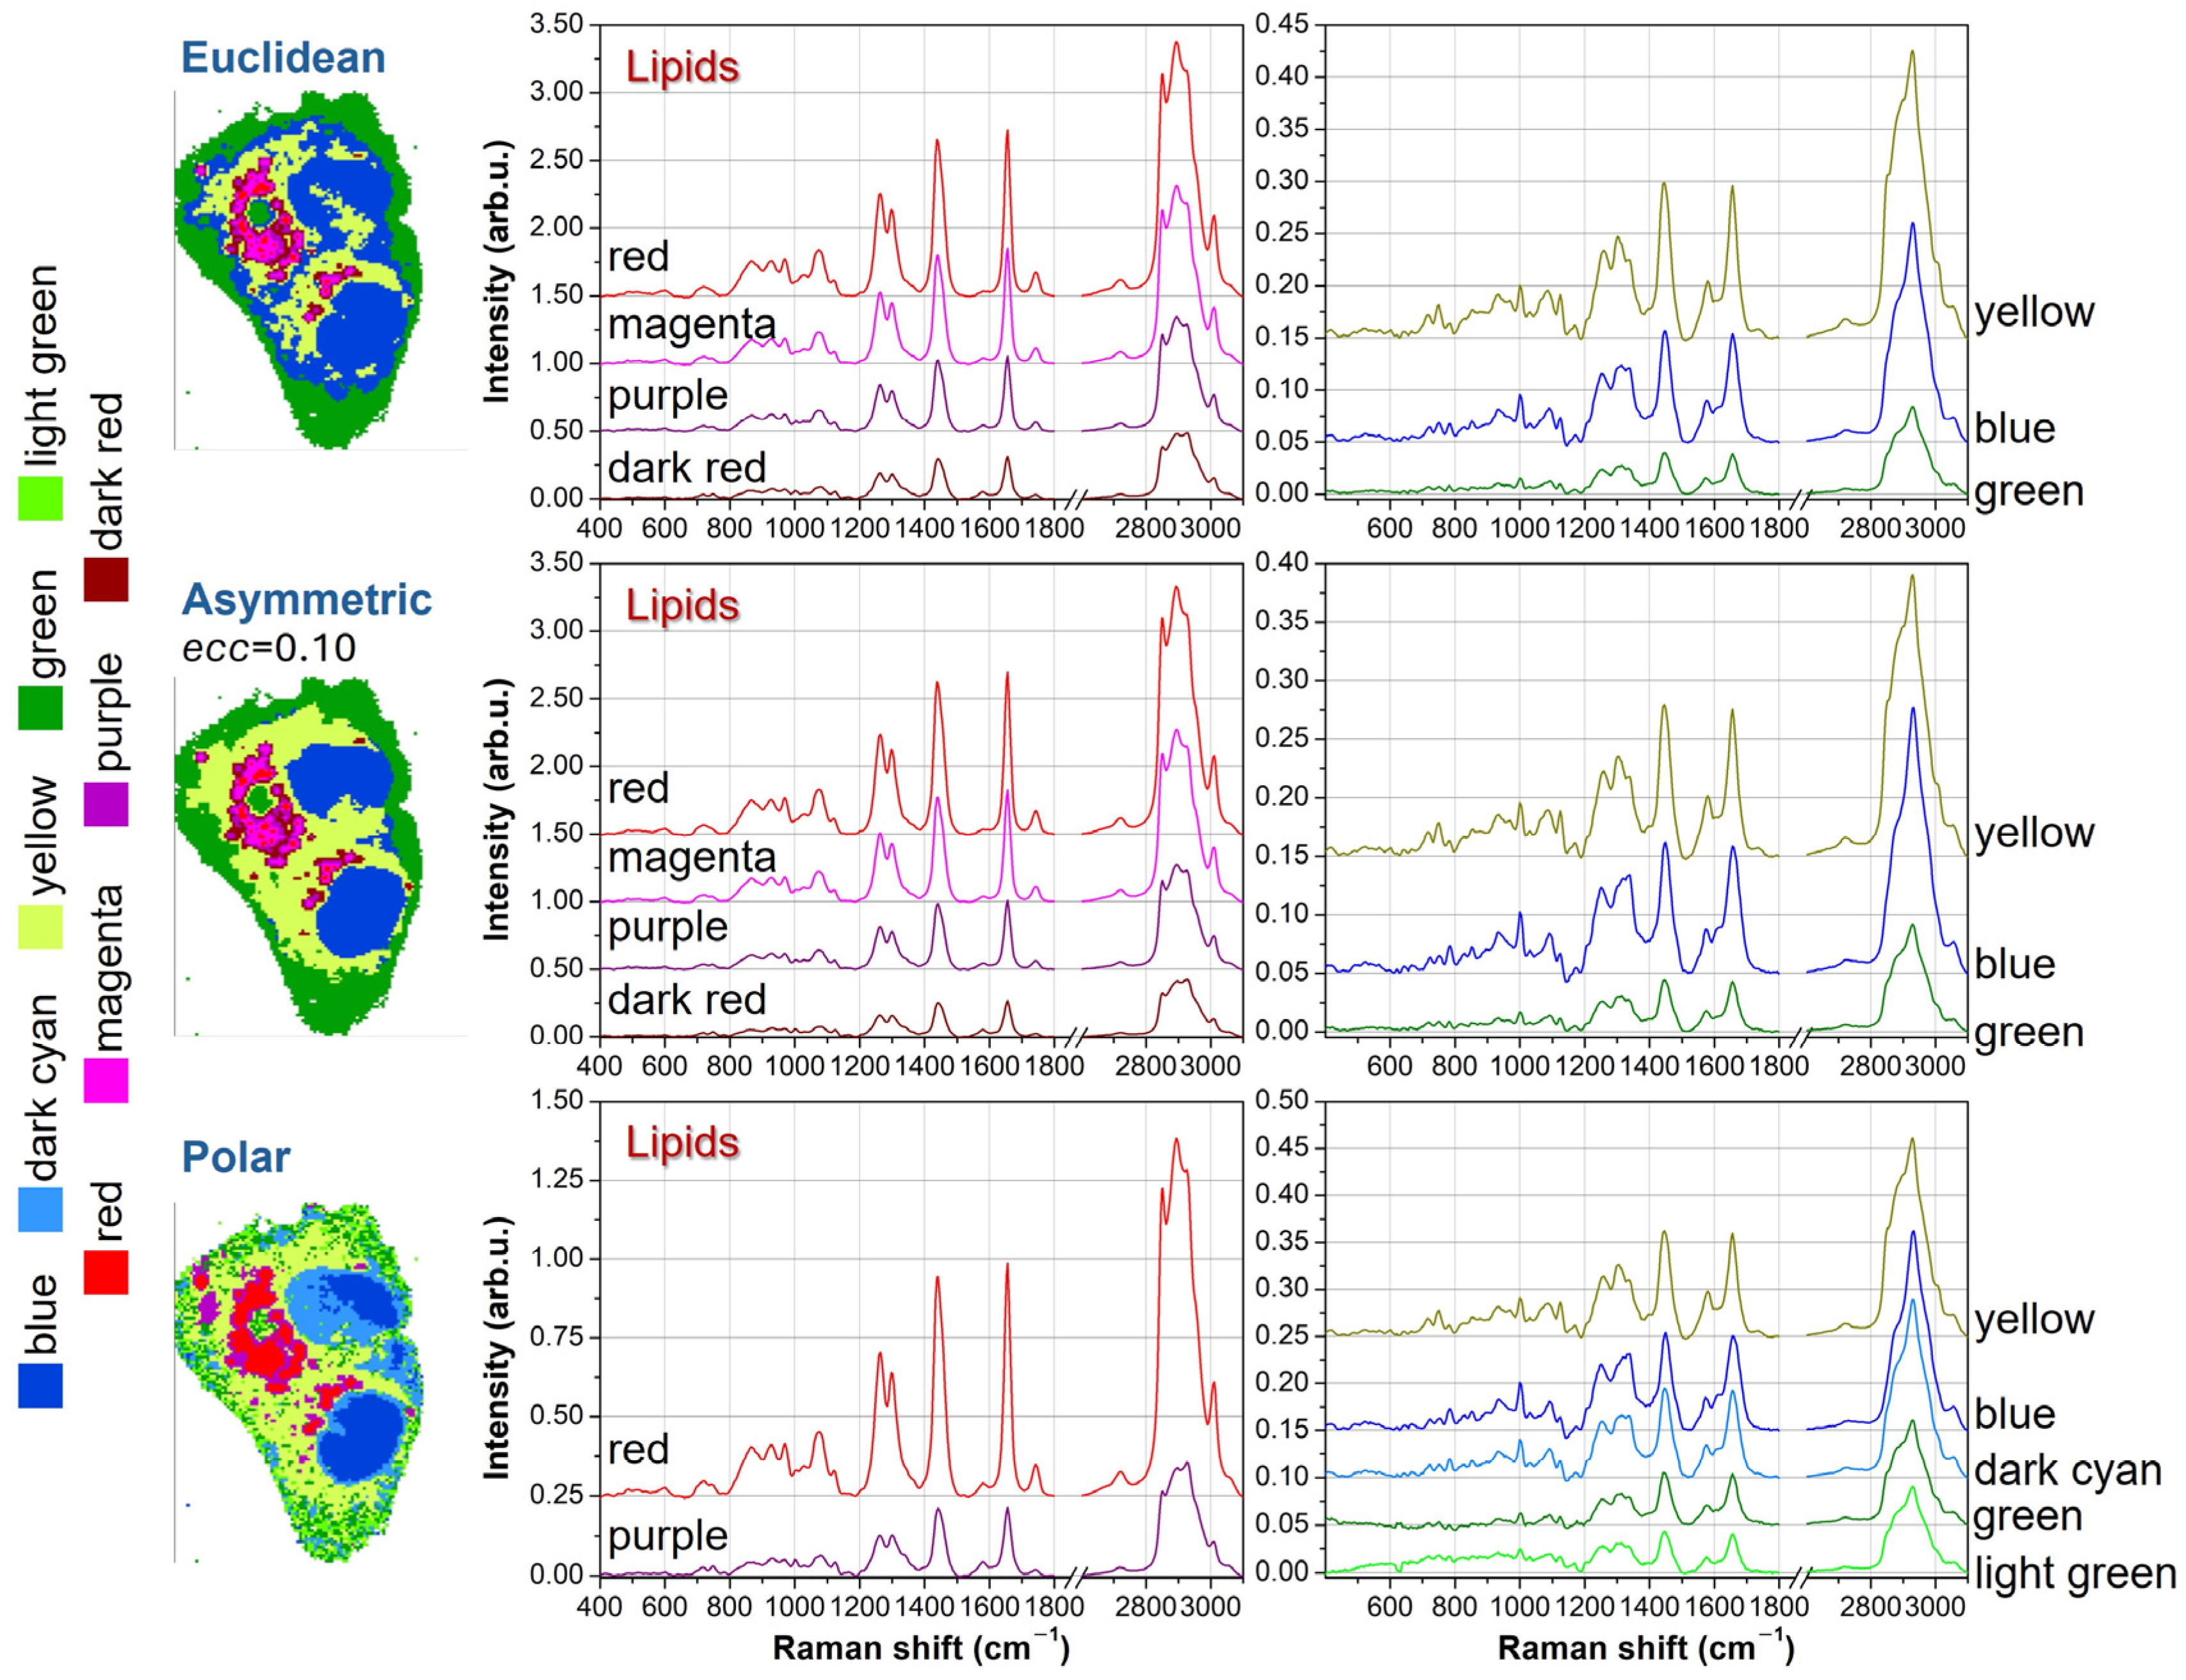
To elucidate the chemical meaning of the different clusters and to check redundant segmentation,
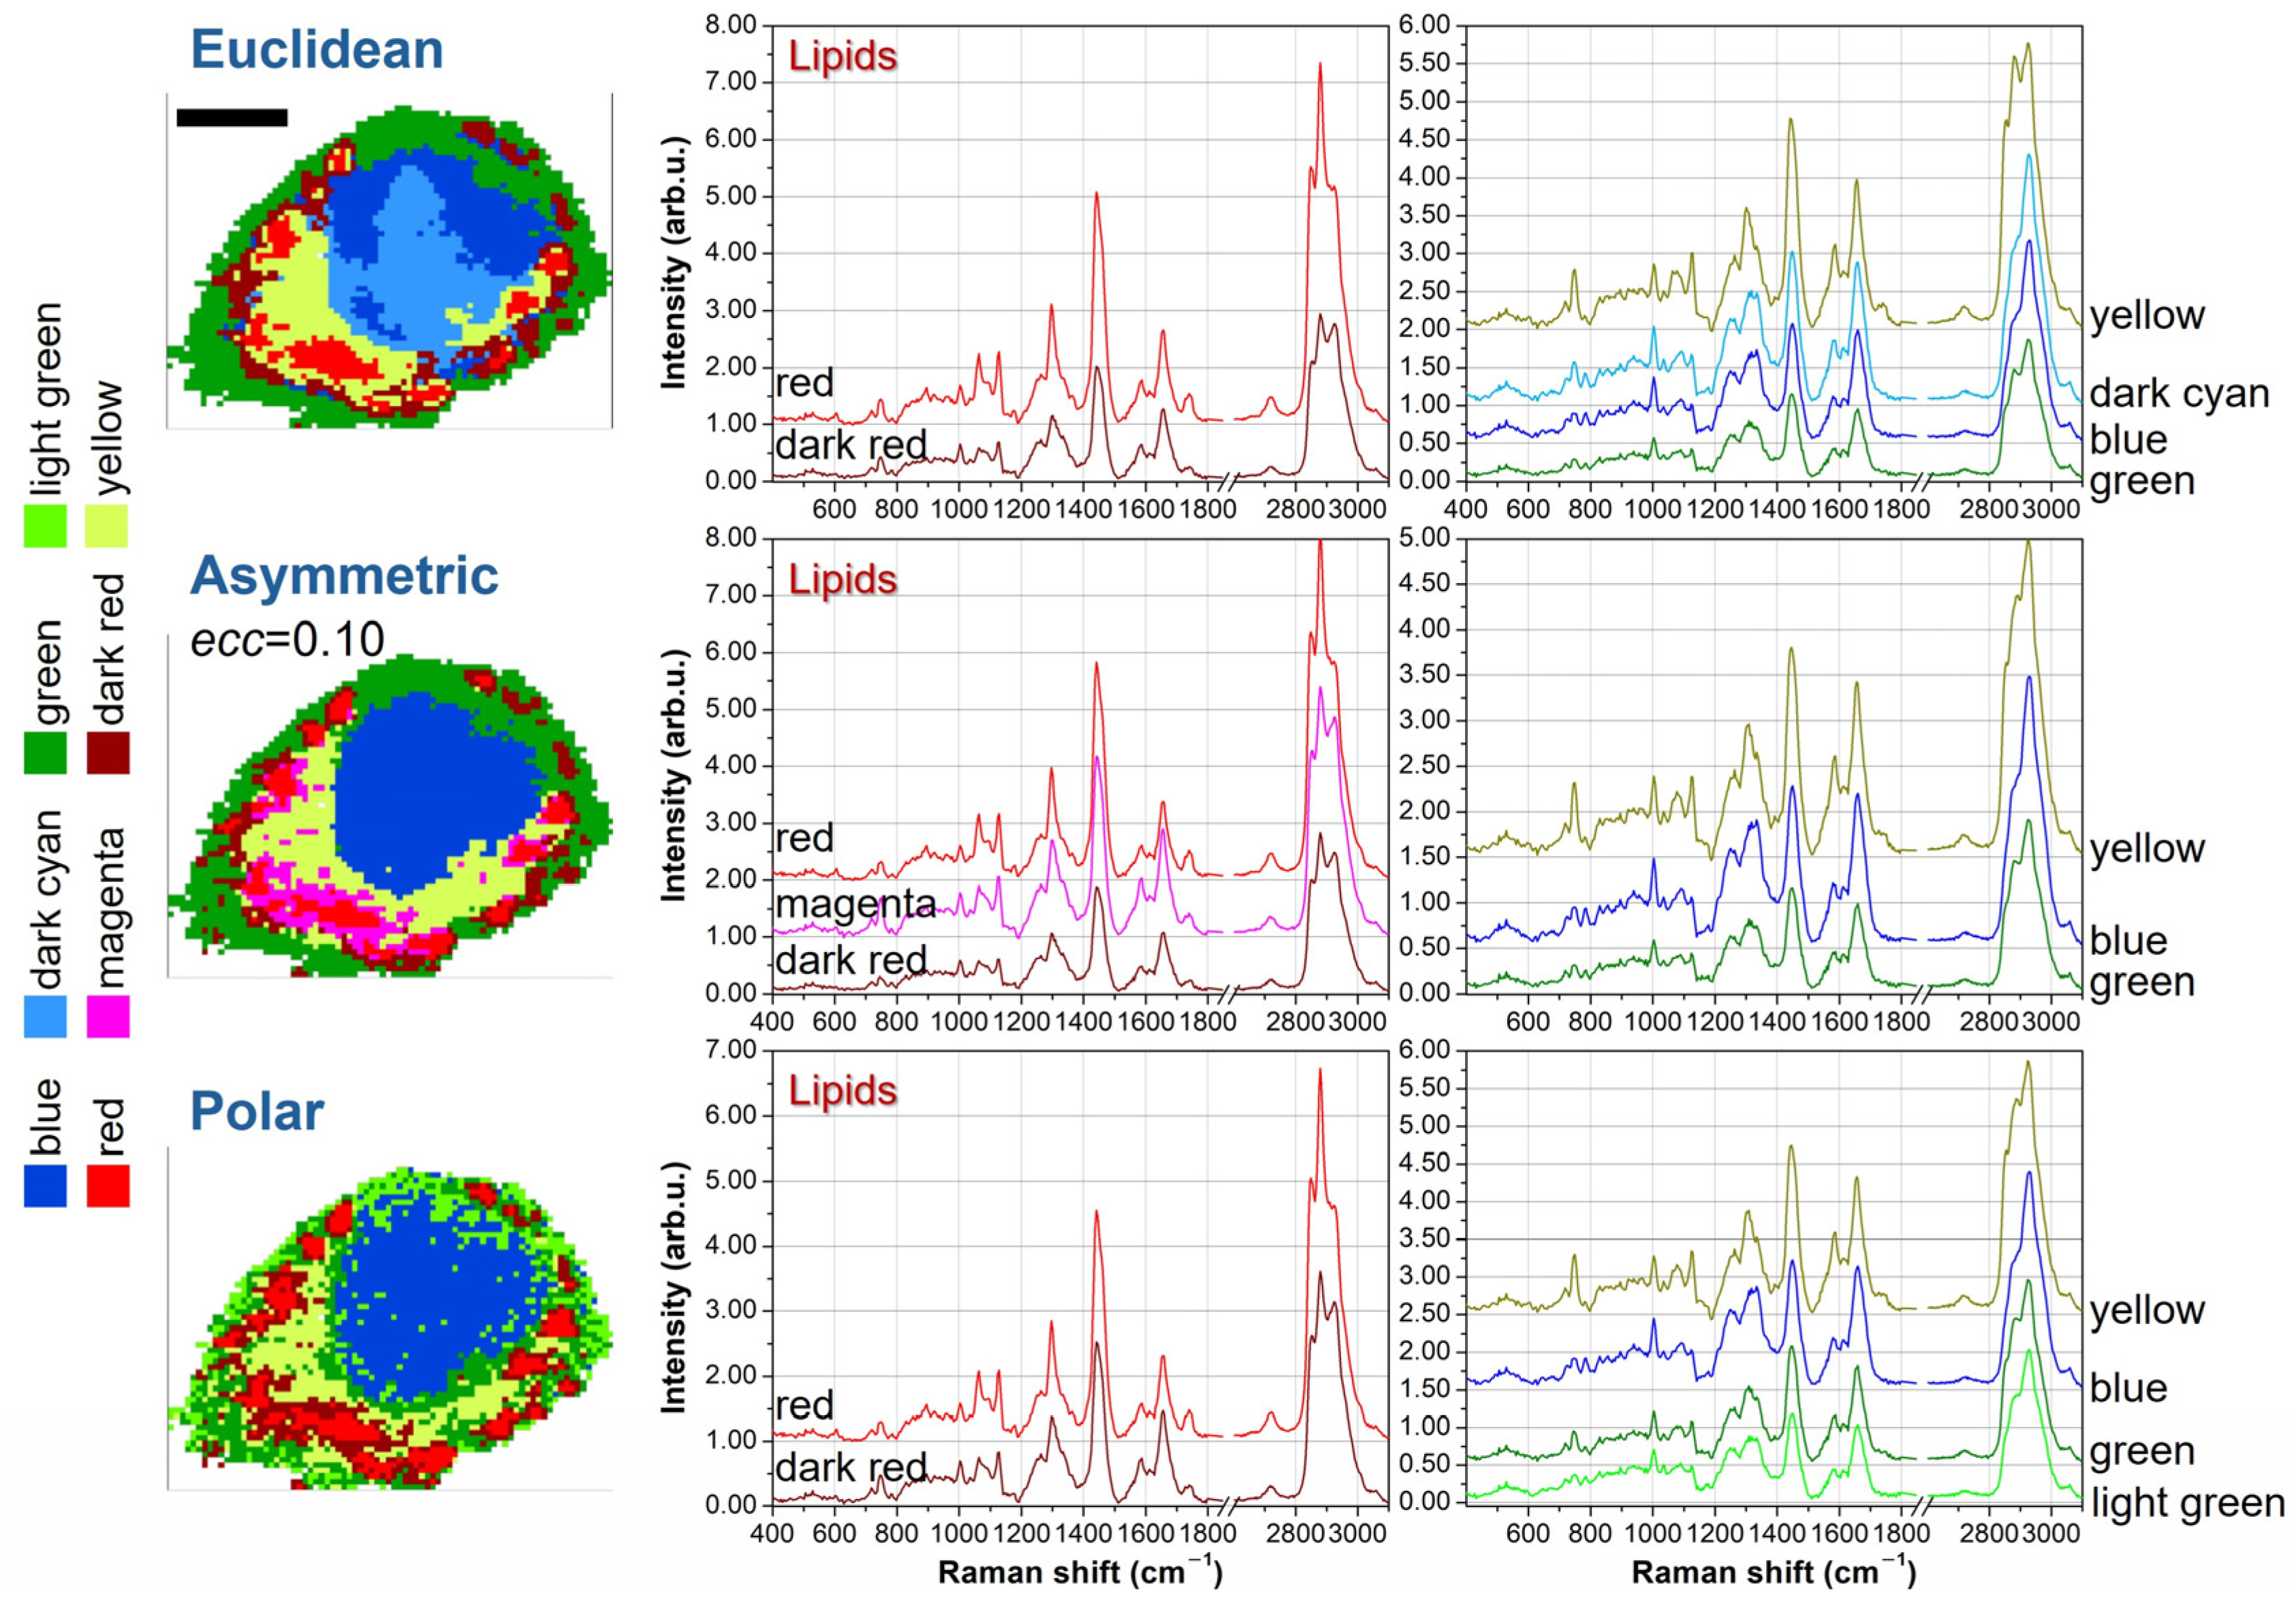
Figure 4 shows the average spectra for the seven-cluster case. Since some clustering results are similar to each other, we examine the average curves resulting from Euclidean, asymmetric with
ecc = 0.10, and polar metrics. Further, for clarity’s sake, we divide the lipid-originated spectra (reddish tones) from other biological contributions.
For all reddish spectra, we can see the presence of clear peaks at 2850 and 2880 cm
−1, which are well-known spectral markers for lipid molecules [
17,
18]. Moreover, the peaks at 1265 and 1300 cm
−1 are also related to lipids vibrations, and their intensity ratio
I1265/
I1300 correlates directly with the unsaturation degree [
19]. Another indicator for the presence of C=C double bonds in lipids is the intensity of the 1660 cm
−1 peak compared with the intensity at 1445 cm
−1 [
19]. However, this marker is more useful in the context of pure molecule analysis than in cellular datasets, because in cellular and tissue samples, protein vibrations also contribute to the 1660 cm
−1 intensity. Among the other average spectra, the yellow curve is characterized by peaks at 750, 1130, and 1582 cm
−1, which are typical vibrations of Cytochrome C and can be ascribed to mitochondria [
20,
21,
22], both in perinuclear regions (endoplasmic reticulum) and in cytoplasmic regions (branched to cytoskeleton). The blue spectrum exhibits characteristic peaks of DNA bases at 785, 1340, and 1575 cm
−1 [
23,
24], and, therefore, blue clusters can be assigned to nuclear regions. Finally, the green curve resembles the average Raman signal of the overall cell, but with a significantly smaller intensity. These features, along with the outer location of green clusters, suggest that this signal is originated by the thinner parts of the external cell membrane. The just described spectral features are shared among the average spectra obtained with the different metrics.
At this point, we would like to mention that, although Raman microspectroscopy offers high chemical specificity and can, in principle, provide molecular fingerprints of proteins as well, in complex biological samples, such as whole cells and/or tissues, protein signals are generally less distinctive compared to those of lipids or nucleic acids. Raman bands associated with proteins are often more difficult to resolve due to overlap with other cellular components, and the most prominent protein-related Raman feature, the Amide I band (1600–1700 cm
−1), would require spectral deconvolution (e.g., using Gaussian or Pseudo-Voigt fits) to extract information about protein secondary structures [
25]. However, such further spectral analysis would be beyond the scope of the present work.
In
Figure 4, the lipid spectra for Euclidean and
ecc = 0.10 asymmetric metrics can be considered redundant. As an example, if we consider the
I1265/
I1300 ratio and the 2850 and 2880 cm
−1 intensities, the red and magenta curves (the first two from the top) are quite overlapping each other, while the dark red curve (the bottom one) is significantly different from the others. The purple curve is a kind of hybridization between the red-magenta curves and the dark-red one, thus representing a kind of transition curve but it does not bring any new chemical information. Instead, the other curves (yellow, blue, and green) are strictly necessary to properly address nuclear, mitochondrial, and outer membrane regions. Conversely, the polar metric with seven clusters correctly addresses the lipidic compartment, assigning only two curves ascribable to different unsaturation degrees. But two redundant curves are introduced, one in the nuclear region and another in the outer membrane. The nuclear region is divided into two parts, but the corresponding average spectra (blue and dark cyan curves) do not exhibit significant differences. A similar argumentation holds for the division of the outer membrane and the corresponding green and light green curves.
4.3. Concluding Remarks on Asymmetric Metric Benchamrk
In summary, seven clusters are needed for Euclidean and ecc = 0.50 asymmetric metrics to detect the presence of mitochondria signals, but at the expense of redundant segmentation in the lipidic regions, with four clusters assigned to lipids. On the other hand, ecc = 0.25 and even more ecc = 0.10 asymmetric metrics properly address mitochondria signals already with six clusters, and only a slight redundancy is present in the lipidic region with three clusters. Passing to seven clusters for ecc = 0.25 and 0.10 is not helpful and only increases the redundancy in the lipidic segmentation. The polar metric with six and seven clusters reveals the presence of mitochondria and works fine in the segmentation of lipidic signals, assigning only two clusters to lipids. But redundancy is produced in the other regions: in the case of seven clusters, nearly overlapping average spectra are assigned in both nuclear and outer membrane regions, while in the case of six clusters, this redundancy is present in the outer membrane. However, the main disadvantage of polar clustering is the excessive noise of the produced images, with mixed clusters and not well-defined subcellular regions.
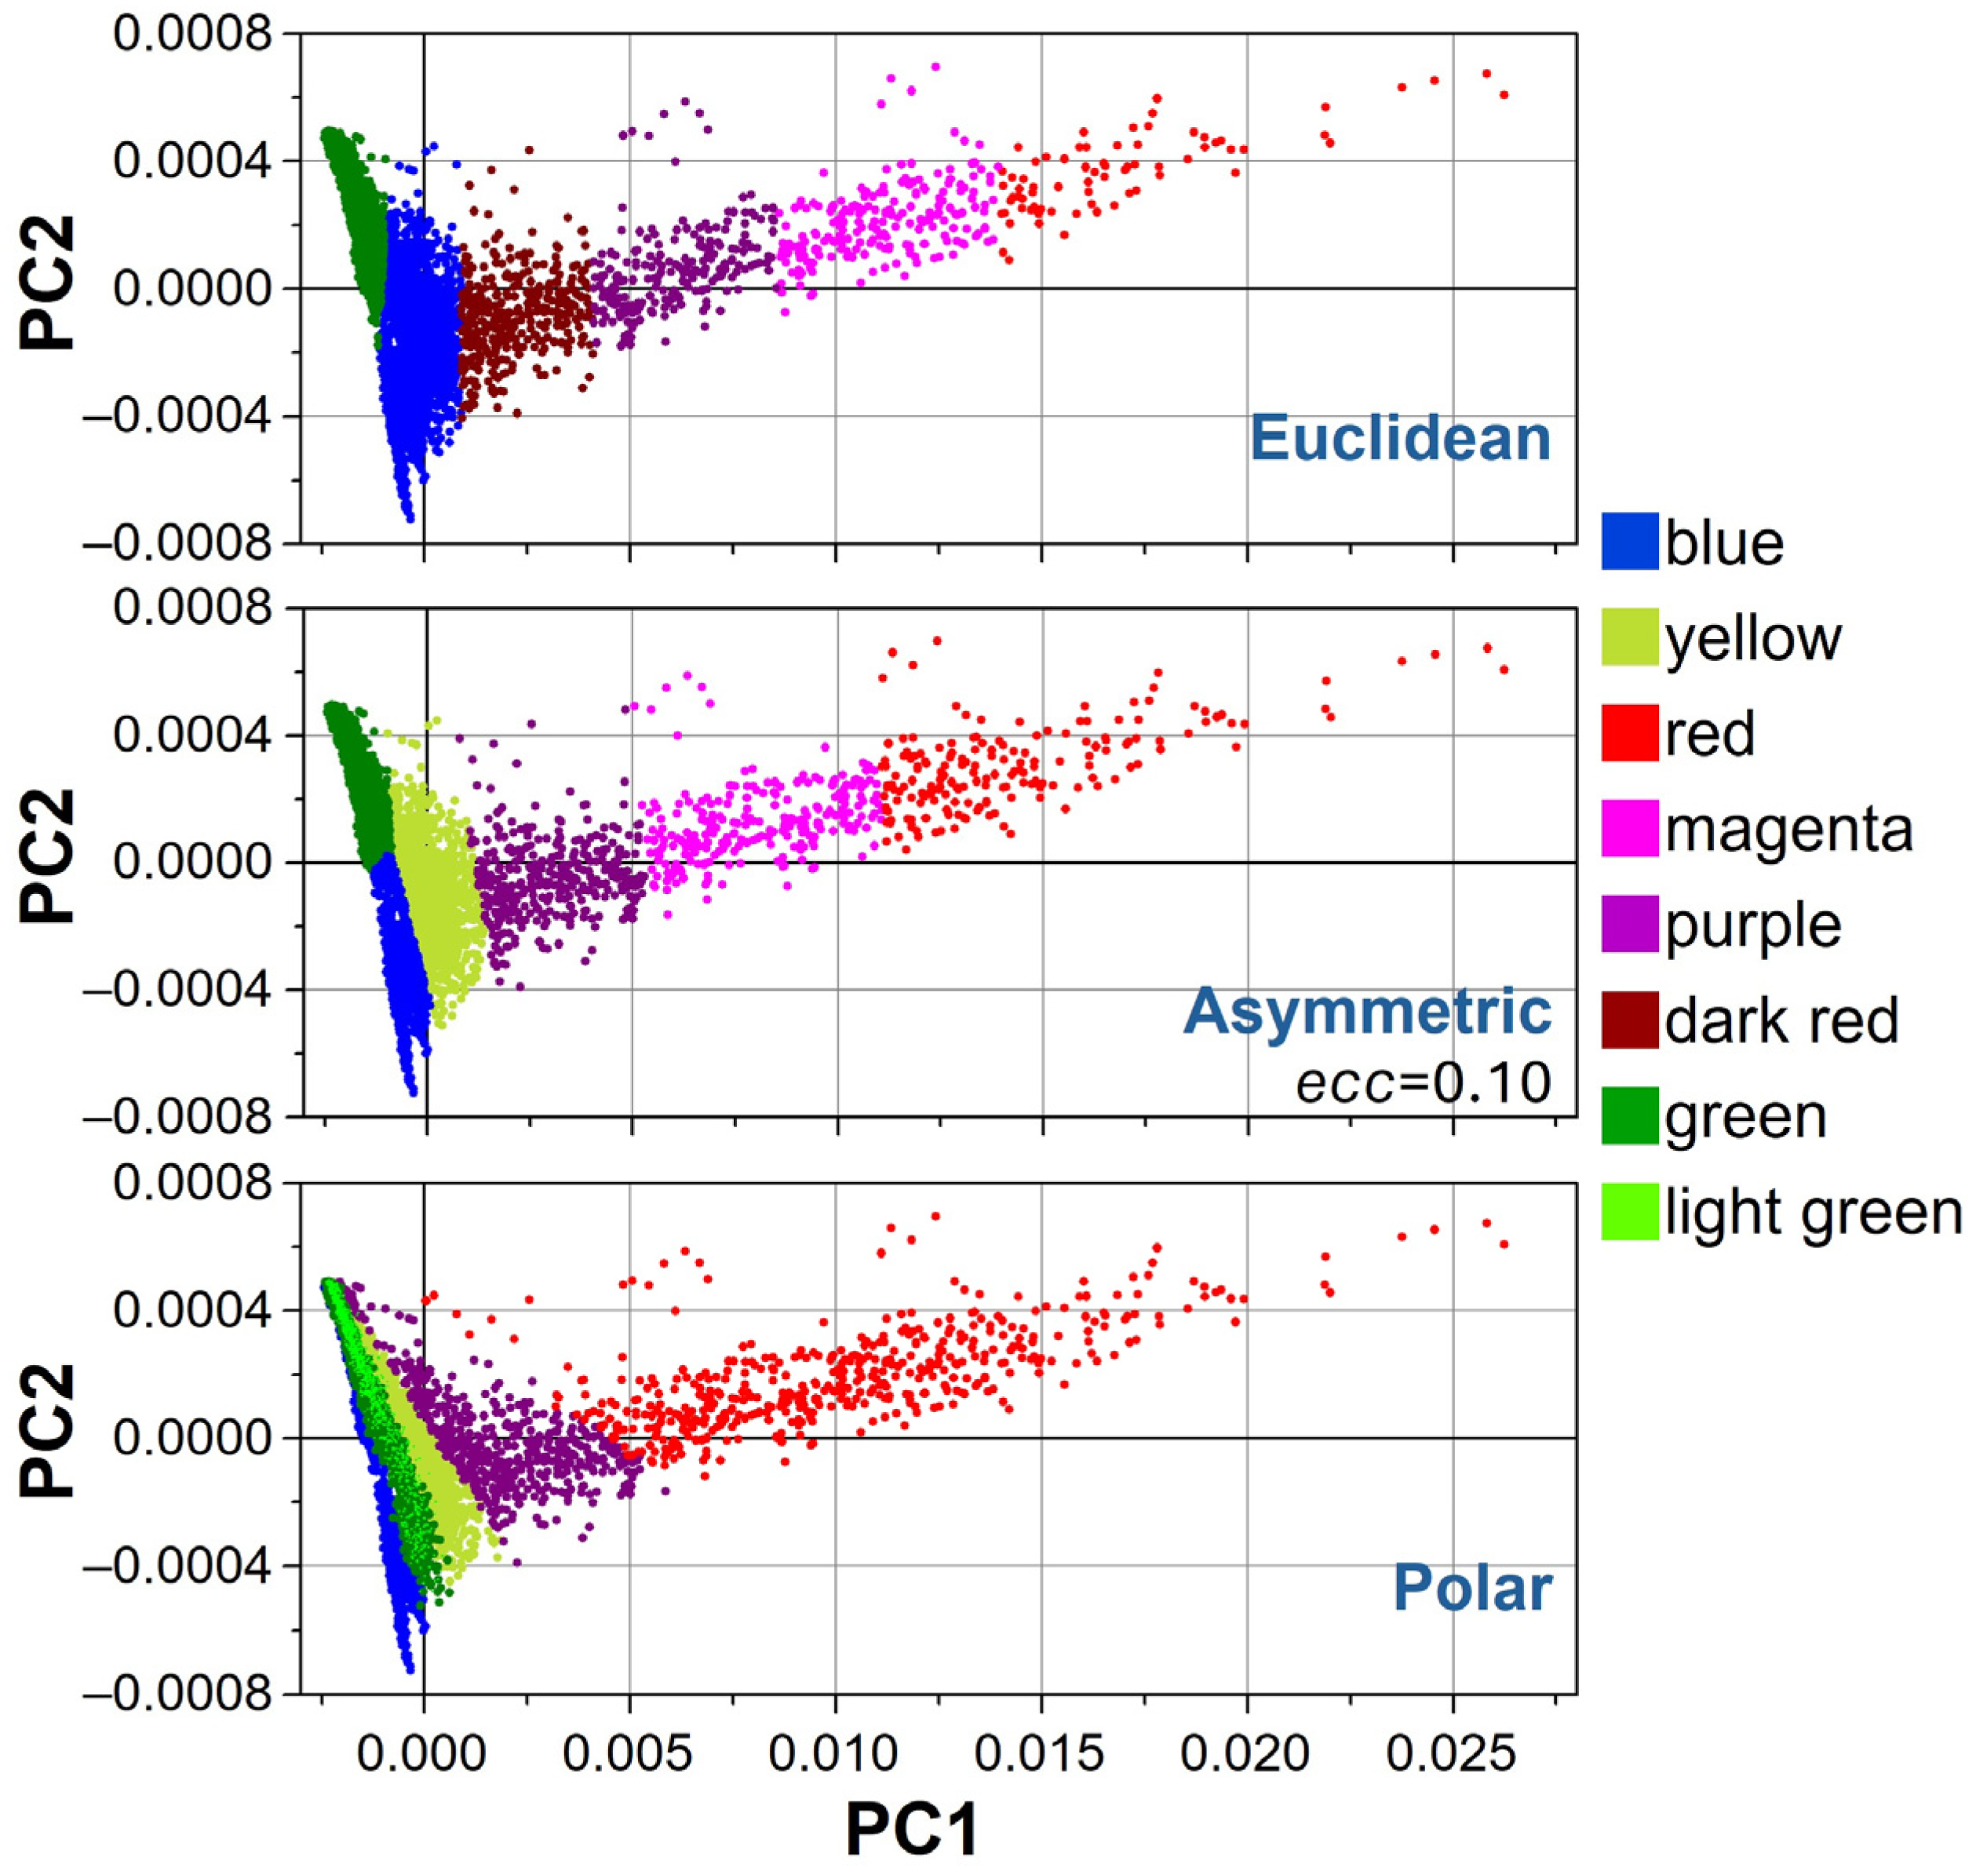
The segmentation accuracy is assessed, in the case of six clusters, by projecting the clusters onto the first two principal components (PCs) computed by Principal Component Analysis (PCA). Unfortunately, there is no ground truth to compare with, and many internal metrics used for segmentation accuracy in the absence of ground truth, like the Dunn Index, the Silhouette method, the Davies-Bouldin Index, and the Calinski-Harabasz Index, are based on intra-cluster and inter-cluster characteristic distances. The effectiveness of these internal metrics with Euclidean distance reflects their fundamental reliance on symmetric distance metrics. In our case, an asymmetric distance metric is employed for clustering, which could impair the reliability of such indices (Dunn, DBI, CHI, and the Silhouette method).
Instead, the projection of clusters on PCs (
Figure 5) provides a visual inspection of how the clustering behaves under different distance metrics. Since the PC1 axis is much more elongated than it appears in the figure (note the different scales for PC1 and PC2 scores), the Euclidean metric (top panel) fails to identify the yellow cluster dominated by mitochondrial signal, and merges it with the blue cluster dominated by nuclear signals. Since the Euclidean distance is isotropic and the PC1 axis dominates in terms of variance, clustering segmentation is primarily driven along the PC1 direction in the case of Euclidean distance. Conversely, the polar metric (bottom panel) is sensitive only to directional information (cosine similarities) and not to spectral vector magnitudes. It correctly addresses lipidic signals using only two clusters (red and purple symbols), but leads to significant overlap among mitochondria, cytosol, and membrane regions (yellow, green, and light green clusters). The proposed asymmetric distance offers a compromise between the Euclidean and polar cases by tuning the eccentricity parameter
ecc. In the figure, clustering with
ecc = 0.10 is shown (middle panel). Mitochondrial (yellow), nuclear (blue), and membrane (green) regions are clearly separated, while lipidic signals are assigned to three clusters (red, magenta, and purple symbols), which are less redundant than the four clusters of the Euclidean case. Hence, PCA projection suggests that the asymmetric distance improves the separation of relevant biochemical regions without producing excessive redundancy compared to the Euclidean and polar metrics.
Finally, the test performed with eight clusters (last row of
Figure 3) produces redundancy with all metrics, but to different extents. Compared to the seven-cluster attempt, Euclidean and asymmetric metrics introduce a new redundancy in the outer membrane, where an unnecessary division into two regions (green and light green) can be observed. The polar metric, while preserving the lipidic segmentation to two clusters, produces an excessive redundancy in the outer membrane (where three clusters are assigned), and, consequently, a higher degree of noise affects the resulting cell image.
4.4. Further Validation by Analysing LX-2 Cells upon Treatment
Here, we propose a further example of K-means clustering with an asymmetric metric, still in the field of cellular spectral analysis. The cell under study is an LX-2 cell after proper treatment with Retinol and Palmitic acid (ROL+PA) [
26]. LX-2 cells are human hepatic stellate cells (HSCs). HSCs are usually in a quiescent state, characterized by high expression of lipid droplets (LDs) for storing vitamin A. Upon liver injury, HSCs transdifferentiate towards a so-called active state, characterized by both high fibrogenesis and loss of LDs. In this active state, HSCs are a crucial player in originating and sustaining liver fibrosis. Upon specific treatments, or as the liver injury subsides, active HSCs could be reverted to a quiescent-like state, restoring a high expression of LDs. LX-2 cells are partly active HSCs, and when treated with a combination of Retinol and Palmitic acid are reverted to a quiescent-like state.
Figure 6 shows the results achieved by KCA with six clusters performed on the Raman hyperspectra recorded over an LX-2 cell after ROL+PA treatment. Euclidean,
ecc = 0.10 asymmetric, and polar metrics have been used for KCA. As in the former case, by comparing the image obtained for Euclidean and asymmetric metrics, we can notice that subcellular regions are better defined in the case of asymmetric distance. The Euclidean metric leads to two subregions in the nuclear area, but with neatly overlapping average spectra (dark cyan and blue curves). Instead, the asymmetric metric correctly assigns a single cluster to the nuclear region, surrounded by a yellow area ascribable to the presence of CytC (mitochondria). The yellow average spectrum obtained with asymmetric metric has a spectral behavior that better resembles the pure CytC spectrum, while the yellow curve for Euclidean metric is partly a mixture of CytC and lipid spectra, as denoted by large intensities at 2850 and 2880 cm
−1. This is likely due to an overlap of the yellow cluster with lipid regions. This issue is better solved by asymmetric distance, which introduces a transition region (the magenta cluster in the second row of
Figure 5) between LDs and mitochondria.
The last row of the figure shows the results attained using the polar metric. We find again a noisy image, as observed above, with some mixing regions in the outer part of the cell where two redundant clusters (green and light green) are assigned. Correctly, a single cluster is assigned to the nuclear region, but its border is rough and irregular. A similar conclusion holds for the CytC area, whose average spectrum is as clean as that of asymmetric distance, but whose shape is fragmented and intermixed with the green clusters.
5. Discussion
Within the k-means clustering framework, the proposed asymmetric distance metric captures directional relationships in the data, a property particularly important for Raman signals characterized by gradual chemical or structural gradients. Although the core of this study is the direct comparison of clustering metrics within the KCA framework, in this section we briefly discuss how our approach relates to dimensionality reduction and clustering techniques commonly employed in Raman hyperspectral analysis.
Principal Component Analysis (PCA) is frequently used to reduce the dimensionality of Raman datasets prior to clustering [
27,
28,
29]. However, PCA projects the data onto orthogonal components that maximize variance, which can result in the loss of fine spectral features critical for accurate biochemical discrimination. In contrast, the present approach operates directly in the original spectral space without dimensionality reduction, thereby preserving subtle but potentially important variations.
t-Distributed Stochastic Neighbor Embedding (t-SNE) [
30,
31] and Uniform Manifold Approximation and Projection (UMAP) [
32,
33,
34] are powerful non-linear dimensionality reduction techniques that have been used to visualize high-dimensional spectral data. However, these methods are primarily designed for visualization rather than clustering. Moreover, t-SNE and UMAP embeddings can distort global structures, potentially obscuring underlying chemical relationships.
Hierarchical Clustering Analysis (HCA) has also been applied in Raman hyperspectral studies [
35,
36]. Compared to KCA, HCA does not require the number of clusters to be specified a priori, but it becomes computationally intensive for large datasets. Like KCA, HCA is highly sensitive to the choice of distance metric. However, KCA only requires local distance computations between data points and centroids, and can naturally incorporate a directional, asymmetric attraction toward centroids. In contrast, HCA relies heavily on a precomputed global distance matrix, and classical linkage criteria assume symmetric distances, such as Euclidean distance. As a result, applying an asymmetric distance in HCA could introduce ambiguities during the merging of clusters, making KCA a more appropriate framework for direct use of directional information in the data.
In summary, compared to commonly used dimensionality reduction and clustering techniques in Raman imaging, the main advantages of the proposed asymmetric clustering approach are: (i) it preserves full spectral resolution without the need for dimensionality reduction; (ii) it introduces directionality into the distance calculation, improving sensitivity to gradual biochemical changes. Future work could explore further applications of the asymmetric distance, such as its integration after PCA-based dimensionality reduction or its combination with hierarchical methods adapted to asymmetric distance.
6. Conclusions
In this study, we demonstrated that the incorporation of an asymmetric metric matrix into K-means clustering significantly enhances the segmentation quality of Raman imaging data from cells. By systematically varying the eccentricity parameter (ecc), we evaluated the impact of this novel distance metric on the clustering performance compared to conventional Euclidean and polar metrics.
Our results indicate that the asymmetric metric provides a more refined and biologically meaningful segmentation of cellular regions, particularly at intermediate values of eccentricity (ecc = 0.25 and ecc = 0.10). At these settings, the algorithm effectively distinguishes subcellular structures, such as lipidic compartments, mitochondria, and nuclear regions, while minimizing redundant segmentation. Furthermore, this improved segmentation is achieved with a lower number of clusters compared to the Euclidean metric, which requires additional clusters to resolve the same biochemical features. This highlights the efficiency of the asymmetric metric in capturing relevant spectral variations without excessive cluster fragmentation. In contrast, the polar metric, although effective in distinguishing lipid compartments, introduced excessive noise and instability in clustering results.
Moreover, we observed that increasing the number of clusters beyond an optimal threshold does not necessarily improve segmentation accuracy. Instead, excessive clustering introduces redundancy, particularly in lipid-rich regions and the outer membrane. This finding suggests that the choice of both an appropriate distance metric and an optimal cluster number is crucial for obtaining biologically interpretable results in Raman-based cell imaging.
Overall, the implementation of asymmetric metric distances in K-means clustering represents a promising approach for cellular analysis through Raman microimaging. By providing a flexible and tunable metric, this method enhances spectral biochemical differentiation while preserving a more regular shape of cellular subregions. Future work may explore the extension of this approach to other spectral imaging techniques and its potential integration with advanced machine learning techniques for automated biochemical characterization of cells. Additionally, further research could investigate the application of asymmetric metrics in other clustering techniques or mathematical frameworks where distance metrics play a critical role, such as hierarchical clustering, graph-based segmentation, or manifold learning.


