Abstract
When optical signals are transmitted in the atmosphere, they will be affected by atmospheric turbulence, causing phenomena such as light intensity flickering and light spot drift, resulting in signal intensity attenuation. In this paper, a 0.8 km and a 4 km corner reflector array experimental return link were built. Under different weather conditions, the experiment obtained light intensity data samples and echo spot video data. It analyzed the light intensity flicker and spot drift characteristics and laws of Gaussian beams under different weather conditions. The results show that the turbulence intensity increases with an increase in link distance. At the same time, the atmospheric refractive index structure constant gradually decreases in the order of sunny, light rain, moderate rain, heavy rain, and cloudy. The light intensity distribution of the 0.8 km link is weakly undulating, and the light intensity distribution of the 4 km link is moderately undulating. The distribution of the centroid range of the light spot also decreases in the order of sunny days, light rain days, moderate rain days, heavy rain days, and cloudy days, and as the link distance increases, the distribution range of the centroid of the light spot under the same weather conditions also increases. Studying the reflection characteristics of laser echoes is of great significance to wireless optical communication systems. It brings important technological breakthroughs to large-scale, high-speed wireless optical communication technology and plays an important role in the development of wireless optical communication technology.
1. Introduction
In Optical Wireless communications, atmospheric turbulence can cause the optical signal at the receiving end to have varying degrees of amplitude flicker, beam expansion, and drift, which greatly limits the practical application of Optical Wireless communications [1]. In recent years, scholars at home and abroad have carried out experimental research on the characteristics of laser transmission light waves in Optical Wireless communications. In 2007, Arnold Tunick conducted a field experiment on a 2.33 km link to study the law of light intensity scintillation and found that light intensity scintillation obeys a log-normal distribution under weak turbulence, and that temperature is the main factor affecting the atmospheric refractive index structure constant [2,3]. In 2007, F. S. Vetelino et al. conducted an experiment to study the relationship between the intensity flicker characteristics and the receiving aperture [4]. In 2016, Wang Hongxing and his colleagues built a laser transmission platform in three different underlying surface environments: near the sea, on the beach, and on the road. They also conducted experimental measurements on the characteristics of beam drift and spot expansion [5]. In 2018, Wang Yuru and others designed a laser detection imaging experiment on a return path. By observing the complete far-field laser spot in Hefei, they conducted a statistical analysis of the light intensity distribution characteristics in the image. By fitting the method, they obtained the ideal point scintillation index of the center of the spot and then inferred the value of the turbulent refractive index structure constant and the atmospheric coherence length [6]. In 2021, Wu Pengfei built a laser transmission experiment with a transmission distance of 2.5 km in Xi’an. Through the light intensity images recorded at the receiving end, he used the scintillation method to calculate the atmospheric refractive index structure constant in Xi’an city during the experimental period. He also compared and analyzed the changes in atmospheric turbulence at night under three weather conditions, sunny, cloudy, and hazy, as well as the statistical characteristics of the light intensity scintillation of the laser beam [7]. In 2021, Samuel O A. conducted an experimental study on the impact of atmospheric turbulence on the link performance of free-space optical communication systems over South Africa, analyzing the Rytov variance, logarithmic irradiance, signal-to-noise ratio, bit error rate, fading loss, and power flicker index at different wavelengths under weak-turbulence conditions [8]. In 2022, Jiang Nan designed a turbulence simulation device using thermal resistors and fans and built an indoor experimental system for laser transmission. He studied the intensity distribution of the laser wavefront through experiments and analyzed the relationship between the beam drift and intensity fluctuations at four wavelengths with temperature and wind speed [9]. In 2022, Ke Xizheng and others regarded the scintillation effect as multiplicative noise in the transmission of optical communication systems, derived a multiplicative noise model for atmospheric turbulence, and conducted experimental measurement research [10]. In 2023, Zhang Junxin and others built a laser active-illumination beacon atmospheric coherence length measurement system based on 3M reflective film, realizing the detection system’s single-end configuration of transceiver integration. The atmospheric coherence length was measured by switching between active illumination beacons and traditional 650 nm laser beacons [11]. In 2024, Li Xinmiao et al. derived an expression for the variance in the drift angle of a beam under deep turbulence conditions. A return path laser imaging detection system was built, and echo images and the atmospheric coherence length of the laser spot at different times on the 1 km and 7 km transmission paths were experimentally obtained. The results showed that the drift angle mean-square error and the atmospheric coherence length have obvious periodicity over time, and the two change synchronously, but with opposite trends [12].
Although the impact of atmospheric turbulence on laser transmission has been widely studied, existing results still have two major limitations. Most experiments are limited to a single transmission distance, and there is a lack of comparative analysis of long- and short-distance links, resulting in the lack of a quantitative model for the variation in turbulence intensity with distance. Existing studies usually assume static meteorological conditions and ignore the compound effects of multiple weather conditions on link stability in actual environments. Re-entry transmission technology using single-ended laser transmission and reception can effectively carry out long-distance atmospheric remote sensing detection, turbulence monitoring, and laser communication even under changing geographical conditions. Therefore, in-depth exploration of the influence of the atmosphere on the transmission characteristics of the laser beam in the re-entry path is of great significance to the development of related technologies. Corner reflectors are mature and reliable passive jammers. Due to their special structure, they can generate strong radar echo signals in the direction of radar illumination, simulating the radar scattering characteristics of targets much larger than their size. They are often used to jam and deceive the terminal guidance radars of anti-ship missiles [13]. In addition, traditional single-reflector backhaul solutions are susceptible to multipath interference and cannot easily meet the high signal-to-noise ratio requirements of long-distance links. To address the above gaps, this paper proposes a dual-distance backhaul experimental framework based on a corner reflector array. Through experimental measurements of 0.8 km and 4 km links, the system reveals the influence of transmission distance and weather conditions on turbulence intensity, the light intensity scintillation index, and the spot drift range. Compared with single-link research, this work further verifies the advantages of corner reflector arrays in suppressing signal attenuation and improving backhaul efficiency, and provides key design criteria for infinite optical communication systems in complex environments. This research not only provides a measured basis for the optimization of related links, but also lays a theoretical and technical foundation for future fields such as optical measurement, communication link design, and target detection in more complex environments. It has important academic value and engineering significance.
2. Basic Principles
2.1. Light Intensity Flicker Characteristics
The phase and amplitude of the light beam during transmission cause the light intensity at the receiving end to fluctuate randomly over time. The flicker index is widely used as an indicator to measure light intensity fluctuations, and is often used to evaluate the impact of atmospheric turbulence on the transmission of optical signals. In engineering, the flicker index is usually used to characterize light intensity fluctuations, and its expression is [14]
where is the ensemble average, that is, the statistical average over a long period, and I represents the light intensity.
2.2. Atmospheric Turbulent Channel Model
The atmospheric refractive index structure constant is an important parameter reflecting the characteristics of atmospheric optical turbulence and quantitatively describes the intensity of optical turbulence. This paper uses the scintillation method to measure [15], and its expression is
where L is the link length, and are the transmitter aperture size and receiver aperture size, respectively, and is the logarithmic amplitude variance [16]
where is the mean light intensity, and s is the standard deviation of light intensity.
The atmospheric refractive index structure constant is the core parameter for evaluating the characteristics of atmospheric optical turbulence. Based on Davis’ theory, turbulence is divided into three categories: ≥ 2.5 × 10⁻¹³ m−2/3 is strong turbulence; 6.4 × 10⁻¹⁷ m−2/3 ≤ < 2.5 × 10⁻¹³ m−2/3 is moderate turbulence; < 6.4 × 10⁻¹⁷ m−2/3 is weak turbulence. Its specific value is affected by a combination of factors such as weather conditions, geographical location, and surface characteristics.
2.3. Light Intensity Flicker Probability Density Distribution Characteristics
For atmospheric turbulence, probability distribution is the most basic method to describe its statistical characteristics. The probability models describing the received light intensity distribution include the log-normal model and the Gamma–Gamma model, which correspond to the probability density distribution of light intensity fluctuations in weak turbulence and medium–strong turbulence, respectively. In a weakly turbulent environment, the probability density function (PDF) of light intensity fluctuations obeys the log-normal distribution and can be expressed as [17]
where I is the received light intensity, and is the logarithmic variance in the received light intensity.
The probability density function of the Gamma–Gamma distribution model can be expressed as [18]
where Γ(·) is the Gamma function; Kn(·) is the modified Bessel function of the second order; and α and β are parameters for measuring the characteristics of large-scale and small-scale eddies in atmospheric turbulence, respectively, which can be calculated by the following formula in general
where is the Rytov variance.
2.4. Spot Drift Centroid Distribution Characteristics
In the process of in-depth research on the light spot drift phenomenon, we usually use the method of monitoring the changes in the center of mass position of the light spot to quantitatively describe the drift behavior of the light spot. In actual experiments, the grayscale value of the spot image is proportional to the incident light intensity, so the statistical analysis of the spot image intensity is an analysis of the pixel grayscale value of the spot image. Usually, the spot drift can be described by the change in the centroid position of the spot. The centroid position of the spot is defined as [19]
where xc and yc are the coordinates of the center of mass in the horizontal and vertical directions, respectively, and I is the light intensity of the light spot.
For a grayscale image, the size of which is pixels, let the grayscale value corresponding to pixel be ; then, the centroid position of the grayscale image is
where M and N are the pixel values of the image; m and n are the coordinate values of the pixel points; and I is the grayscale value of the pixel.
3. Experimental Scenario and Configuration
We built an optical platform as shown in Figure 1. In order to maintain stability, the transmitting system and the receiving system were fixed on the same optical platform. In the transmitting system, we selected a solid laser with a wavelength of 532 nm, a transmitting power of 1 W, and a beam diameter of 5 mm as the light source. After the laser signal is emitted from the transmitting end, it first passes through a Maka optical telescope (i.e., Maksutov-Cassegrain optical telescope) with an aperture of 105 mm. The beam passes through the Maka optical telescope to collimate it, and the divergence angle becomes smaller. After the beam quality is improved, it is transmitted through the atmospheric channel. A corner reflector array is placed at the reflecting end to ensure that the laser return path is similar to the original transmission path. At the receiving end, the laser signal is focused again by the Maka optical telescope, and then directly incident on the PD300 optical power meter probe. The noise value of the PD optical power meter probe is ±300 fW/s, the sampling frequency is 50 Hz, and the accuracy is ±3%. When measuring the spot image, we replaced the optical power meter probe with a CCD camera; the sampling frequency of the CCD camera is 30 Hz, and the accuracy is ±1%. The experiment was repeated several times. In addition, we also recorded the meteorological parameters during the experiment in detail to provide a reference for subsequent data processing and analysis. Laser spot drift may be caused by many factors, such as laser instability, optical system design, environmental vibration, and air disturbance. In order to study the influence of laser performance on spot stability, this study strictly controlled the experimental environment. In our experiment, we selected a laser with high stability to ensure the stability of the light intensity output by the laser and avoid fluctuations in laser performance caused by temperature changes. We used an optical platform with a shock-absorbing design. The optical platform was placed in the teaching building, and the environment was relatively stable. In order to minimize the interference of background light, we installed a filter behind the Maka optical telescope at the receiving end, placed the entire signal-receiving device in a self-made dark box, and selected a period of weak background light for the experiment, thereby ensuring an adequate signal-to-noise ratio of the signal.
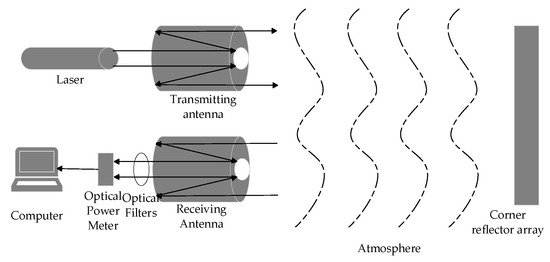
Figure 1.
Schematic diagram of laser measurement experimental system.
Measurement Link Selection
From October 2023 to July 2024, the experimental team conducted experiments on return path laser transmission in Beilin District, Xi’an City, Shaanxi Province. During this period, two return path laser transmission measurement experimental links with different distances were established, and multiple measurement experiments were conducted at night to collect a large amount of light intensity data. The specific conditions of the two links are as follows:
Link 1: The transmitting end is located on the 8th floor of Discipline Building No. 2, Jinhua Campus, Xi’an University of Technology, and the reflecting end is located on the 11th floor of the Teaching Building No. 6, Jinhua Campus, Xi’an University of Technology. The overall link length is 0.4 km, and return path two-way transmission is adopted. The transmission distance is 0.8 km. The link is about 40 m above the ground. The underlying surface of the transmission path is mainly composed of buildings and trees. The transmission field of view meets the requirements of the laser transmission experiment.
Link 2: The transmitting end is located on the 8th floor of Building 2 of the Jinhua Campus of Xi’an University of Technology, and the reflecting end is located on the rooftop of Building B of Xinyayuan Community in Beilin District, Xi’an. The overall link length is 2 km, and the return path is used for two-way transmission. The transmission distance is 4 km, and the link height is about 100 m above the ground. The underlying surface of the transmission path is mainly the cement floor of the building, and the transmission field of view meets the requirements of the laser transmission experiment.
4. Analysis and Discussion
4.1. Flicker Index Under Different Weather Conditions
In practical applications, the lower the scintillation index value, the better the atmospheric transmission conditions and the higher the transmission stability of the optical signal. The experimental team conducted multiple experiments on two experimental links, a 0.8 km return path and a 4 km return path, and carried out laser transmission tests on sunny days, snowy days, light rain days, moderate rain days, heavy rain days, and cloudy nights. The definitions of rainy days are as follows: a lightly rainy day has 12 h precipitation of 0.1 to 9.9 mm, a moderately rainy day has 12 h precipitation of 10.0 to 14.9 mm, and a heavily rainy day has 12 h precipitation of 15.0 to 29.9 mm. The relevant test link conditions and flicker index data are listed in Table 1 and Table 2, respectively. The table records the temperature, wind speed, and AQI (Air Quality Index).

Table 1.
Experimental weather conditions and scintillation indexes of Link 1 samples T1~T12.
Table 2.
Experimental weather conditions and scintillation indexes of Link 2 samples T13~T22.
It can be seen from the flicker index of the measurement samples in Table 1 and Table 2 that the flicker index of the 0.8 m link measurement samples T1~T12 fluctuates randomly between 0.1~0.4, and the flicker index of the 4 km link measurement samples T13~T22 fluctuates randomly between 0.2~0.6. Therefore, the light intensity distribution of the 0.8 km link is weakly fluctuating, the light intensity distribution of the 4 km link exhibits medium fluctuation, and the flicker index increases with an increase in the transmission distance. At the same time, in the samples measured by Link 1, the flicker index on sunny days, snowy days, light rain days, and moderate rain days is significantly higher than that on heavy rain days and cloudy days. In the samples measured by Link 2, the flicker index on heavy rain days is also the lowest, followed by cloudy days, and the flicker index on sunny days is significantly higher than that in other weather conditions. Under the same weather conditions, the scintillation index will be lower in data samples with higher humidity.
4.2. Atmospheric Refractive Index Structure Constant
This paper uses the scintillation index method to measure the atmospheric refractive index structure constant to evaluate the turbulence conditions in different weather conditions in the current area. This method first needs to record the mean light intensity received by the optical power meter and the calculated standard deviation s, and then substitute them into (3) to obtain the logarithmic amplitude variance . Then, the logarithmic amplitude variance , the communication transmission distance L, the receiving port diameter, and the transmitting port diameter are used to obtain the precise value of the atmospheric refractive index structure constant . The receiving port diameter of 105 mm, and the transmitting port diameter of 5 mm. To obtain the law of refractive index variation in the atmospheric turbulent structure under different weather conditions, 22 groups of experimental data (T1–T22) were selected from the collected data for processing to obtain the mean value of light intensity and its standard deviation. The results are shown in Table 3 and Table 4.
Table 3.
Atmospheric refractive index structure constants of Link 1 sample T1~T12.
Table 4.
Atmospheric refractive index structure constants of Link 2 samples T13~T22.
During the experiment, to calculate the changes in turbulence in the current area under different sampling points, it is necessary to organize the measurement samples collected in the experiment. First, the light intensity value is normalized. Then, during the data processing, we further divide the light intensity value into several groups and then calculate its mean and standard deviation. The value of is calculated with the help of Formulas (2) and (3). Finally, the changes in under different weather conditions can be obtained, as shown in Figure 2 and Figure 3.
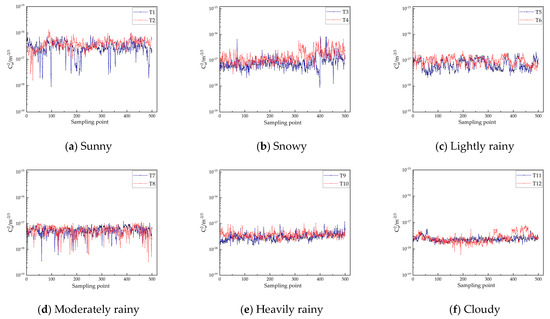
Figure 2.
Refractive index structure constant of the sample measured in Link 1.
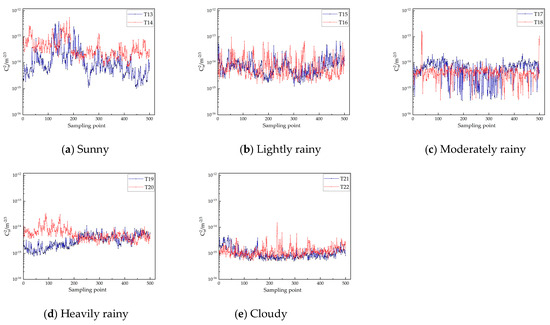
Figure 3.
Refractive index structure constant of the sample measured in Link 2.
Combining Table 3 and Table 4 with Figure 2 and Figure 3, it can be seen that the values of the 0.8 km return path link measurement samples are mainly concentrated in the range of 1 × 10⁻¹⁸ m−2/3 ~ 1 × 10⁻¹⁶ m−2/3, and only a small part of is less than 1 × 10⁻¹⁸ m−2/3 or greater than 1 × 10⁻¹⁶ m−2/3. The maximum value of is 1.30 × 10⁻¹⁶ m−2/3, which occurs on a sunny day, and the minimum value of is 3.61 × 10⁻¹⁹ m−2/3, which occurs on a moderately rainy day. The fluctuation range of the curve values of the 4 km return path link measurement sample is mostly concentrated in the range of 11 × 10−15 m−2/3 ~ 1 × 10⁻¹³ m−2/3. The maximum value of is 5.42 × 10⁻¹³ m−2/3, which occurs on a sunny day. The value on a sunny day is larger than that in other weather conditions. The minimum value of is 3.47 × 10⁻¹⁶ m−2/3, which occurs on a moderately rainy day. The comparison of the atmospheric refractive index of chain transmission links shows that the longer the transmission link is, the greater the turbulence intensity is. At the same time, the experimental samples of different link lengths show that the values on sunny days, snowy days, lightly rainy days, and moderately rainy days are significantly higher than the values on heavily rainy days and cloudy days. At the same time, we found that under the same weather conditions, the higher the humidity, the smaller the value of .
According to Davis’ inequality, the intensity of atmospheric turbulence during the test period was divided into two categories. In the Link 1 measurement samples, 66 values belonged to the moderate-turbulence category (accounting for 1.01% of the total samples), and 5934 values belonged to the weak-turbulence category (accounting for 98.99% of the total samples). There was no strong turbulence. In the Link 2 measurement samples, 12 values belong to the category of strong turbulence (accounting for 0.24% of the total samples), and 4988 values belong to the category of moderate turbulence (accounting for 99.76% of the total samples).
4.3. Light Intensity Fluctuation Probability Density Distribution Characteristics
To date, there has been extensive research on the probability distribution characteristics of light intensity flicker. It is generally believed that in areas with weak light intensity flicker, the probability distribution of light intensity flicker follows a log-normal distribution, and its probability density function can be expressed as follows: From weak fluctuations to strong fluctuations, the probability distribution of light intensity flicker follows a Gamma–Gamma distribution [20]. Under strong fluctuation conditions, the probability distribution of light intensity fluctuations follows the K distribution; when the communication link length reaches several thousand meters, in the turbulent saturation zone, the probability distribution of light intensity fluctuations exhibits a negative exponential distribution [21].
This paper normalizes the light intensity data under several different weather conditions, including sunny days, light rain days, moderate rain days, heavy rain days, and cloudy days, to ensure that we can more accurately analyze and understand the statistical characteristics of light intensity changes. After normalization, we further identified the highest and lowest values in these light intensity data, which helped us understand the overall range of light intensity fluctuations. To study the distribution characteristics of light intensity in more detail, we adopted a systematic method based on the amount of data collected in the experiment and evenly divided the data into 20 intervals of equal length. We statistically analyzed the distribution frequencies of light intensity values at various intervals under these different weather conditions, and based on this, we drew a light intensity PDF graph to intuitively show how the frequency is distributed as the number of samples changes. Finally, we determined initial estimates of the parameters of the probability density function under different weather conditions. By applying the log-normal distribution model and the Gamma–Gamma distribution model, we performed a nonlinear fitting analysis to accurately depict the specific probability density distribution characteristics of light intensity fluctuations under different weather conditions. In addition, to evaluate the fitting effect of the light intensity frequency distribution under three different weather conditions, this paper uses an important statistic, goodness of fit , as a key reference. The closer the value of is to 1, the closer the fitting result is to the actual distribution value, that is, the higher the degree of fitting is, the closer it is to the ideal state. Its expression is as follows:
where D(Y) and D(y) are the variances in Y and y, respectively.
This paper normalized the collected light intensity data, counted the frequency of the processed data, and then drew a probability density distribution diagram of the normalized light intensity. In addition, nonlinear fitting of log-normal distribution and Gamma–Gamma distribution was performed on the data, and the fitting results are shown in Figure 4 and Figure 5. To clearly show the degree of fit between the intensity frequency distribution, the log-normal distribution, and the Gamma–Gamma distribution, the goodness-of-fit values R12 and R22 of the 0.8 km link and the 4 km link are displayed in Table 5 and Table 6.
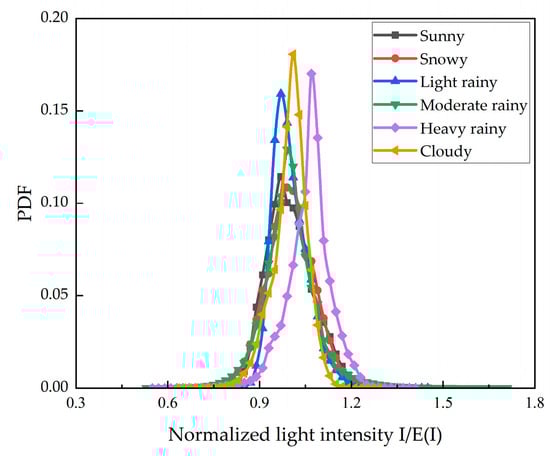
Figure 4.
Probability density distribution of Link 1.
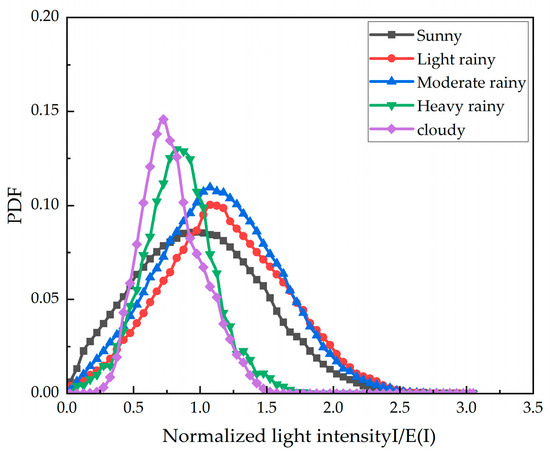
Figure 5.
Probability density distribution of Link 2.
Table 5.
Link 1 probability density distribution fitting parameters.
Table 6.
Link 2 probability density distribution fitting parameters.
It can be observed from Table 5 and Table 6 and Figure 4 and Figure 5 that the light intensity fluctuation of Link 2 is greater than that of Link 1, and in both links, the light intensity fluctuation decreases in the order of sunny days, light rain days, moderate rain days, heavy rain days, and cloudy days. In Link 1, the light intensity fluctuation on snowy days is second only to that on sunny days. In Link 1, under different weather conditions, the fitting effect of the log-normal distribution of the light intensity probability density distribution diagram is better than that of the Gamma–Gamma distribution, and the goodness of fit of the log-normal distribution is more than 0.98, which shows that under the condition of weak light intensity fluctuation, the light intensity value generally follows the law of log-normal distribution. On sunny and snowy days, the probability distribution of light intensity fluctuations is closer to the log-normal distribution. In Link 2, when the experimental background is sunny, lightly rainy, and moderately rainy, the probability density distribution of the measured samples is more consistent with the Gamma–Gamma distribution, and when the experimental background is heavily rainy and cloudy, the probability density distribution of the measured samples is more consistent with the log-normal distribution. This phenomenon can be attributed to the cumulative effect of turbulence scale in long-distance transmission. As the link distance increases, the phase disturbance of the light wavefront increases, resulting in a significant joint effect of large-scale and small-scale turbulent vortices, which is consistent with the applicability of the Gamma–Gamma model to moderate and strong turbulence. In contrast, in the weak-turbulence environment of short-distance links, the light intensity fluctuation is mainly dominated by a single-scale vortex, and is therefore closer to a log-normal distribution.
4.4. Distribution Characteristics of Light Spot Centroid Drift
In the process of in-depth research on the light spot drift phenomenon, we usually use the method of monitoring the changes in the center of mass position of the light spot to quantitatively describe the drift behavior of the light spot. In the experimental setting, there is a linear correspondence between the grayscale value of the spot image and the intensity of the incident light, which indicates that statistical analysis of the light intensity of the spot image is essentially an analysis of the grayscale value of each pixel in the image. We use the grayscale centroid algorithm to extract the centroid of the light spot. Usually, by observing the changes in the position of the centroid of the light spot, we can effectively describe the phenomenon of light spot drift. Table 7 shows the weather conditions when Link 1 and Link 2 measured the spot samples. T23~T27 are samples of Link 1, and T28~T32 are samples of Link 2.
Table 7.
Weather conditions of samples T23~T32 of Link 1 and Link 2.
A 256 × 256 pixel window was selected to observe the areas of 0.8 km and 4 km transmission distances. Taking the lower left corner of the image as the origin, the centroid data were converted to the actual scale, and the data within the same transmission distance were restricted to the same coordinate scale. To ensure the consistency of the data, samples at around 9 pm in each weather condition were selected as observation objects. Figure 6 is a distribution diagram of the centroid of the light spot on a sunny day at a transmission distance of 0.8 km, and Figure 7 is a distribution diagram of the centroid of the light spot on a cloudy day at a transmission distance of 4 km. It can be seen from the two figures that whether at a distance of 0.8 km or 4 km, the range of the centroid distribution decreases in the order of sunny days, light rain days, moderate rain days, heavy rain days, and cloudy days. The size of the centroid position distribution range reflects the difference in turbulence strength to a certain extent, which is consistent with the law obtained above.
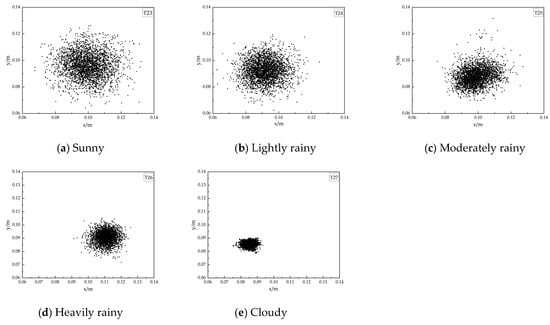
Figure 6.
Centroid distribution of measurement samples of Link 1.
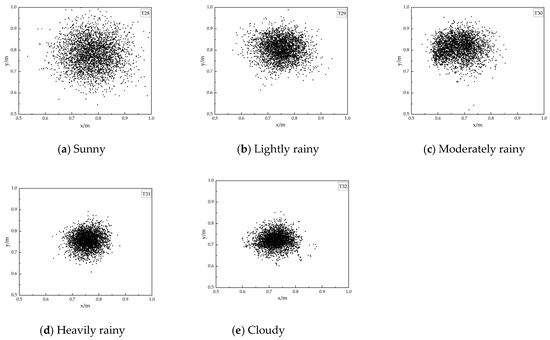
Figure 7.
Centroid distribution of measurement samples of Link 2.
The changes in the light spot center under different weather conditions are shown in Figure 8 and Figure 9, which are the x direction and y direction coordinates of the light spot center of the two links, respectively. In most samples, the fluctuation amplitude of the light spot center position in the x direction is significantly larger. In each group of light spot center change graphs, the amplitude of curve fluctuation also decreases in the order of sunny day, light rain day, moderate rain day, heavy rain day, and cloudy day. Figure 10 and Figure 11 show probability density distribution diagrams of the light spot centroid coordinates in different weather conditions for the two links, which are the probability density distributions of the light spot centroid in the x direction and the y direction, respectively. A total of 3000 sets of samples were collected for each set of data. It can be seen from the figures that under the same weather conditions, the probability density distribution interval in the x direction is larger than the probability density distribution interval in the vertical direction, and the peak probability value of the probability density in the x direction is mostly smaller than the peak probability value in the y direction. In most data, the drift amount in the horizontal direction is often greater than the drift amount in the vertical direction, indicating that the x direction is more significantly affected by turbulence than the y direction. The peak probability values of each weather type gradually increase from sunny to light rain, moderate rain, heavy rain, and cloudy, corresponding to the gradual decrease in the centroid distribution range.
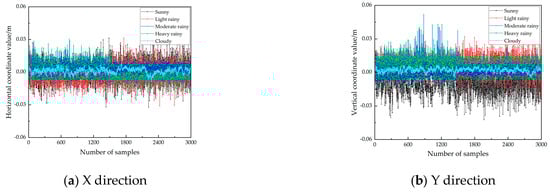
Figure 8.
Changes in the coordinates of the spot center of Link 1.
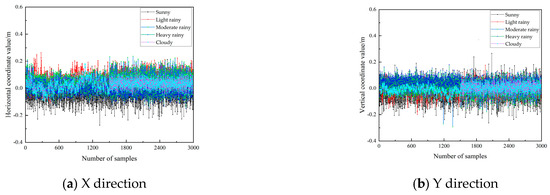
Figure 9.
Changes in the coordinates of the spot center of Link 2.
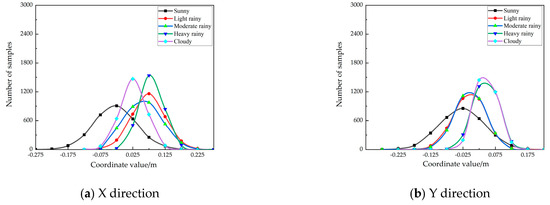
Figure 10.
Probability density distribution of the center coordinates of the light spot of Link 1.
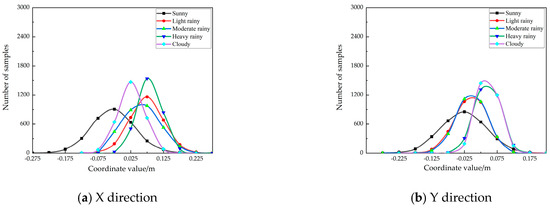
Figure 11.
Probability density distribution of the center coordinates of the light spot of Link 2.
5. Conclusions
This paper built two return path wireless optical experimental links, carried out laser transmission experiments in the Xi’an Beilin area, analyzed the fluctuation characteristics of light intensity and light spot drift under different weather conditions and transmission distances, and specifically analyzed the scintillation index of laser echo, atmospheric refractive index structure constant, light intensity probability density distribution, and light spot centroid distribution.
The experimental results show the following: (1) The scintillation index increases in the order of cloudy, heavy rain, moderate rain, light rain, and sunny conditions. The atmospheric refractive index structure constant increases with the distance of the transmission link. The turbulence measured on the 0.8 km link belongs to the weak-turbulence region, and the turbulence measured on the 4 km link belongs to the medium-turbulence region. (2) The probability density distribution of light intensity of the 0.8 km link in the measurement samples obeys the log-normal distribution, and the probability distribution of light intensity of the 4 km link obeys the Gamma–Gamma distribution on sunny, lightly rainy, and moderately rainy days. The light intensity fluctuations of the two links in different weather conditions increase in the order of cloudy, heavily rainy, moderately rainy, lightly rainy, and sunny. (3) In the two links, the drift amount of the light spot in the horizontal direction is often greater than the drift amount in the vertical direction. The horizontal direction is more significantly affected by turbulence than the vertical direction. The range of the centroid distribution of the light spot increases with the increase of the link range, and the range of the centroid distribution of the light spot increases in the order of cloudy, rainy, medium rainy, light rainy, and sunny days. The experimental results show that the accuracy of the link design and the optimized layout of the corner reflectors have a significant impact on the strength and stability of the echo signal, especially under the conditions of atmospheric turbulence and multipath effects. This study obtained the relationship between turbulence intensity, transmission distance, and weather type through dual-distance, multi-weather corner reflector array experimental measurements, providing valuable experimental data and theoretical support for future high-precision optical measurements and an optimized design of long-distance links. In this paper, the impact of changes in temperature, humidity, and wind speed on the experimental data is not accurately considered. In future studies, we plan to expand the experimental link to a longer measurement distance of 10 km or more, and consider parameters such as changes in temperature, humidity, and wind speed to explore the laser echo reflection characteristics of the corner reflector array in a richer environment. This will also bring many technical challenges, such as signal attenuation and noise interference over longer paths, the impact of atmospheric turbulence on signal stability, and further requirements for link alignment accuracy.
Author Contributions
Conceptualization, X.K. and X.L.; Data Curation, X.K. and X.L.; Formal Analysis, X.K.; Funding Acquisition, X.K. and J.L.; Investigation, X.K.; Methodology, X.K. and X.L.; Project administration, X.L.; Resources, X.L.; Software, X.L.; Supervision, X.K.; Validation, X.K., X.L., J.L. and R.W.; Writing—Original Draft, X.L.; Writing—Review and Editing, X.K., X.L., J.L. and R.W. All authors have read and agreed to the published version of the manuscript.
Funding
This study was funded by the National Natural Science Foundation of China [No. 61377080]; the Special Research Program of the Shaanxi Provincial Department of Education [22JK0530]; the Xi’an Science and Technology Plan Project [No. 23KGDW0018-2023]; the Natural Science Basic Research Program of Shaanxi [Program No. 2024JC-YBMS-557, 2024JC-YBMS-562]; the Shaanxi Fundamental Science Research Project for Mathematics and Physics [Grant No. 23JSQ024]; the Key Industrial Innovation Projects in Shaanxi Province [No. 2017ZDCXL-GY-06-01]; the Xi’an Science and Technology Plan [22GXFW0115]; and the Scientific Research Team of Xi’an University [D202309].
Institutional Review Board Statement
Not applicable.
Informed Consent Statement
Not applicable.
Data Availability Statement
The data or code cannot be made publicly available. Data sharing does not apply to this article because of the limitations of our patent work.
Conflicts of Interest
The authors declare no conflicts of interest.
References
- Ke, X.Z.; Wu, J.L.; Yang, S.J. Research progress and prospects of atmospheric turbulence for wireless optical communications. J. Radio Sci. 2021, 36, 323–339. [Google Scholar]
- Tunick, A. Statistical analysis of optical turbulence intensity over a 2.33 km propagation path. Opt. Express 2007, 15, 3619–3628. [Google Scholar] [CrossRef] [PubMed]
- Tunick, A. Statistical analysis of measured free-space laser signal intensity over a 2.33 km optical path. Opt. Express 2007, 15, 14115–14122. [Google Scholar] [CrossRef] [PubMed]
- Frida, S.V.; Young, C.; Andrews, L.; Recolons, J. Aperture averaging effects on the probability density of irradiance fluctuations in moderate-to-strong turbulence. Appl. Opt. 2007, 46, 2099–2108. [Google Scholar]
- Wang, H.X.; Song, B.; Wu, X.J.; Liu, M. Experimental study on beam drift and spot expansion under different underlying surfaces. Laser Optoelectron. Prog. 2016, 53, 70–76. [Google Scholar]
- Wang, Y.R.; Mei, H.P. Experimental study on imaging spot and intensity fluctuation of turbulent atmospheric reentry path. J. Atmos. Environ. Opt. 2018, 13, 241–249. [Google Scholar]
- Wu, P.F.; You, G.Y.; Li, T. Experimental study on atmospheric turbulence and light intensity scintillation characteristics in Xi’an at night. Optoelectron. Laser 2021, 32, 1221–1228. [Google Scholar]
- Hayal, M.R.; Yousif, B.; Azim, M.A. Performance Enhancement of DWDM-FSO Optical Fiber Communication Systems Based on Hybrid Modulation Techniques under Atmospheric Turbulence Channel. Photonics 2021, 21, 464. [Google Scholar] [CrossRef]
- Jiang, N.; Li, X.Y.; Niu, C.H.; Liu, X. Experimental study on the influence of atmospheric turbulence on laser spatial transmission characteristics. Laser Technol. 2022, 46, 708–712. [Google Scholar]
- Ke, X.Z.; Liao, Z.W.; Liang, J.Y.; Wang, R.; Ding, D.Q. Research on the measurement of atmospheric turbulence noise in wireless optical communication. J. Radio Sci. 2024, 39, 225–236. [Google Scholar]
- Zhang, J.X.; Mei, H.P.; Reng, Y.C.; Rao, R.Z. Measurement of atmospheric coherence length of laser active illumination reentry path. Acta Opt. Sin. 2023, 43, 37–44. [Google Scholar]
- Li, X.M.; Mei, H.P.; Zhang, J.X. Experimental study on drift characteristics of laser round-trip transmission under deep turbulence conditions. Infrared Laser Eng. 2024, 53, 181–190. [Google Scholar]
- Xin, J.Y.; Gu, J.H.; Yang, J.; Cong, Z.; Ding, D.Z. Research on corner reflector array arrangement design and scattering characteristics. J. Radio Sci. 2025, 40, 63–71. [Google Scholar]
- Gao, C.; Ma, J.; Tan, L.Y. Arrival angle fluctuation of a beam propagating in a strong turbulent region. High Power Laser Part. Beams 2006, 18, 891–984. [Google Scholar]
- Zhou, L.L.; Xun, J.P.; Yang, H.F.; Shi, Q.Y.; Dai, Y.H. Analysis of outage probability of coherent optical communication system with aiming error in exponential Weber channel. Laser Optoelectron. Prog. 2017, 54, 77–83. [Google Scholar]
- Wang, H.Q.; Li, Y.; Hu, Q. Experiment on the characteristics of nighttime light intensity fluctuation in Lanzhou area. Acta Photonica Sin. 2018, 47, 194–201. [Google Scholar]
- Wang, H.X.; Song, B.; Wu, X.J.; Liu, M. Analysis of the impact of pointing error on the bit error rate performance of maritime wireless optical communication. Acta Opt. Sin. 2016, 36, 0901001. [Google Scholar]
- Ke, X.Z.; Ding, D.Q. Optical Wireless Communications, 2nd ed.; Science Press: Beijing, China, 2022. [Google Scholar]
- Rao, R.Z. Modern Atmospheric Optics; Science Press: Beijing, China, 2012. [Google Scholar]
- Jiang, Y.; Ma, J.; Tan, L.; Yu, S.; Du, W. Measurement of optical intensity fluctuation over an 11.8km turbulent path. Opt. Express 2008, 16, 6963–6973. [Google Scholar] [CrossRef] [PubMed]
- Zhang, W.T.; Zhu, B.H. Research on the influence of atmospheric turbulence on laser signal transmission. J. Univ. Electron. Sci. Technol. China 2007, 36, 784–787. [Google Scholar]
Disclaimer/Publisher’s Note: The statements, opinions and data contained in all publications are solely those of the individual author(s) and contributor(s) and not of MDPI and/or the editor(s). MDPI and/or the editor(s) disclaim responsibility for any injury to people or property resulting from any ideas, methods, instructions or products referred to in the content. |
© 2025 by the authors. Licensee MDPI, Basel, Switzerland. This article is an open access article distributed under the terms and conditions of the Creative Commons Attribution (CC BY) license (https://creativecommons.org/licenses/by/4.0/).