Article

Updating Financial Contingency in Execution of Typologically Diverse Construction Projects

Department of General Construction, Faculty of Civil Engineering, Wroclaw University of Science and Technology, 50-370 Wrocław, Poland
*
Author to whom correspondence should be addressed.
Appl. Sci. 2025, 15(8), 4445; https://doi.org/10.3390/app15084445
Submission received: 15 March 2025 / Revised: 7 April 2025 / Accepted: 15 April 2025 / Published: 17 April 2025
(This article belongs to the Special Issue Technology and Organization Applied to Civil Engineering)

Abstract

:
The article presents research findings on updating financial contingency estimates for typologically diverse construction projects. The research was carried out from 2006 to 2024 on a sample of 41 investment tasks, represented by five different construction sectors, in which 547 measurements were made of the deviation of the earned cost of construction works from its planned values. The study found significant variability in the cost performance index (CPI) across different construction types. Box plots were determined, and their statistical interpretation made it possible to determine the actual financial contingency, the variation in which in the groups of residential, office and hotel buildings, as well as shopping and logistics centres, is in the range of 3% to 30%. The article concludes with recommendations for banks financing investment tasks in the direction of making financial contingency more realistic when making sustainable lending decisions.

1. Introduction

In the case of financing a construction project with funds from a bank loan, cost overruns can have far-reaching consequences for the economic efficiency of the investment task. Therefore, it was considered worthwhile to look at cost deviations at different stages of the course of projects and their impact on the final cost of the investment.
Among the well-known and widely used methods and tools for studying the cost of construction projects are the method based on the analysis of the curve of the cumulative cost of implementing a construction project (the S-curve method) and the earned value method. The cumulative cost S-curve represents the progress of a construction project from the start of construction work until its completion. The cumulative cost is the sum of the cost incurred by all resources assigned to the task. Based on financial data collected on an ongoing basis, it is possible to generate and compare curves of planned and actual cost [1]. The earned value method (EVM), on the other hand, is a well-known project management methodology, recommended by well-known methodologies such as PMBoK Guide [2] and IPMA [3], which integrates cost, schedule and technical performance [4,5]. The earned value method is a method of measuring the progress of a project [6], and consists of controlling the investment task by cyclically comparing the actually completed scope of work with its planned completion time and planned cost of implementation, according to the adopted planned material and financial schedule developed at the beginning of the construction project [7]. This method makes it possible to calculate cost and schedule deviations, as well as performance indicators and forecasts of the cost and duration of a construction project [8,9]. It also allows early determination of project performance indicators, which is helpful in planning possible corrective actions.
A study of the course of cumulative cost S-curves used to track the progress of works in the EVM showed that the cumulative planned cost S-curve and the cumulative actual cost S-curve are two different curves that do not coincide [10]. This is a commonly observed phenomenon, indicating the existence of deviations of the actual cost from the value of the planned cost [11,12]. For bank-financed projects, the size of these deviations will have a significant impact on their payback period [13]. Excessive overspending will require the annexation of contracts with financial institutions in order to raise additional funds to complete implementation [14]. In extreme cases, this may involve stopping work and potentially not completing the project. Since cost overruns are now a common phenomenon in most construction projects, based on their own analysis, banks allow the extension of investment financing beyond the value of the planned cost [15]. This usually amounts to 3% of the budget planned for the project. This is the assumed permissible increase in cost overspending by construction project financing institutions, which in financial engineering terminology is referred to as the financial contingency. In order to determine the scale of deviations and relate this to the size of the financial contingency, it is necessary to seek an answer to the following question: what deviations in the actual cost of a construction project from its planned cost will be included in the assumed financial contingency of various construction sectors?
The purpose of this research was to determine the magnitude of the deviations of the actual cost from the planned cost and to make the financial contingency realistic, which is still an unsolved problem to this day. In order to achieve the stated goal, a tool in the form of a box chart was used, which, in a compact and clear form, allows relevant information on the course of cost overruns in construction projects to be presented. Cost overruns are a common problem in construction projects, often leading to serious financial and operational challenges. While the acceptable extent of cost overspending can vary depending on many different factors, studies can be found in the literature that provide a range of information on typical ranges and contributing factors. Independent studies by [16,17] have shown that cost overruns in construction projects occur when actual costs exceed initial budget estimates, leading to financial difficulties, delays and disagreements among stakeholders. In addition, the team in [16] analyzed the impact of project management techniques on cost overspending in construction projects, aiming to identify different techniques used at different stages of construction projects and analyze their impact on the cost effectiveness of construction projects.
A number of publications attempt to identify the causes of cost overruns. One study [18] stressed the importance of identifying and addressing the key factors contributing to cost overspending and delays in major construction projects. In addition, it recommended strategies to mitigate factors contributing to cost overruns, such as involving all stakeholders in the planning process, using project management tools, setting realistic schedules, effective change management processes and ensuring sufficient budget allocation by conducting accurate cost estimates and setting aside contingency funds. As part of a strategy to reduce cost overspending at work, ref. [19] proposed control measures for critical cost overrun risk factors, providing guidelines to help contractors minimize cost overruns on construction projects. In contrast, ref. [20] found in their study that contractor involvement at an early stage, and collaboration across the project team, can potentially reduce cost overspending in public construction projects.
Subsequent publications have identified factors contributing to cost overruns in construction projects. Inaccurate cost estimating; inadequate planning and scheduling; unrealistic contract duration and requirements; frequent changes in the scope of work; inadequate availability of labour/skills and inflation affecting the cost of machinery, labour, materials and transportation were identified as major causes [17,18,21]. Other important factors include design changes, political interference, specification changes, changes in the scope of work, inadequate project planning, poor communication and coordination, changes in project scope, lack of skilled labour, insufficient budget allocation and payment delays [18,21,22].
In one publication [23], the authors found that cost overspending is a serious problem in construction, leading to financial losses and affecting project completion, quality and stakeholder satisfaction. A study in which 27 higher education construction projects were analyzed found that about 93% of construction projects experienced cost overruns, with most of the overspending ranging from 5% to 10%, highlighting the widespread impact of cost overruns on construction projects. This is confirmed by a study [24] focused on the problem of cost overspending occurring in large construction projects. Data were collected through a structured survey of clients, consultants and contractors in southern Malaysia. The survey results showed that 96% of respondents agreed that most construction projects face cost overruns ranging from 5% to 10% of the contract amount. At the same time, strategies have been identified to reduce the risk of significant cost overspendings by standardizing project practices, particularly reducing frequent changes and reworking and using effective resource planning to ensure better allocation and utilization of resources and proper financial management.
Cost variances also have a significant impact on the course of construction projects when they are financed with funds raised in the form of loans from banks. Proper cash flow management is key to ensuring that a construction project completes on time and within budget. Poor financial management can put a contractor or developer in a situation where it will not be possible to finance the project due to insufficient liquidity or excessive debt beyond financial capacity [25]. A key element in the financing of construction projects through bank loans is the institutional control of their progress, covering almost all aspects. One study [26] presents technical, financial and organizational methods for developing feasibility studies for construction projects in accordance with the requirements of the Bank Investment Supervision. These include the analysis and evaluation of various aspects, such as the project implementation plan, geotechnical and environmental conditions, designs, permits, contracts and the effects of local government decisions, among others. In turn, in the article [27], the authors emphasize that rigorous monitoring of construction projects aims at ensuring the proper use of resources and minimizing investment risks. This significantly affects cost deviations and is closely linked to the financial contingency assumed by banks.
Based on the extensive state of knowledge, there is a lack of information on the link between cost deviation and the amount of the financial contingency. The lack of research in this area can lead to the erroneous determination of its level, which, if the cost deviation is too high, can cause problems with the completion of the investment and its profitability. The research objective was to indicate the limit amount of deviation in the actual cost of a construction project from its planned cost, measured in quartiles of the time of implementation of this project, at which the resulting deviations will be the same as the planned cost. The research effect was the determination of updated investment contingencies, the inclusion of which will result in a more accurate calculation of the planned cost of implementation, i.e., a smaller deviation in the actual financial outlays from those assumed in selected typological groups. Such a realization of financial contingencies leads to an increase in the efficiency of project implementation, reduced financial losses and improved work planning. The results of the research can provide valuable information to investors and managers, helping them to make optimal decisions regarding resource allocation, planning budgets and investment schedules.

2. Methods

2.1. Research Sample

The research was based on the developed reliable knowledge base [28]. The data included in the knowledge base (the analyzed research sample) was collected by the research team from 2006 to 2024. They constitute a comprehensive knowledge base on the course of 41 various construction projects, which can be classified into 5 typological groups in accordance with the division proposed in the Polish Classification of Construction Objects [29], reflecting the selected typological groups in Poland. The division into individual typological groups and the number of investments included in them are shown in Table 1.
The first typological group (group M) included residential, multi-family buildings. The total number of them accumulated in this group was 14. The average cost of implementation of projects in this group was PLN 17,684,301.93, and the average implementation time was about 18 months. The total cost of implementation of all projects amounted to PLN 247,580,227. The total time of their implementation comprised 254 months.
The second group (group O) consisted of office buildings. Their total number accumulated in this area was 4. The average cost of implementation of projects in this group was 41,518,299.71 PLN, and the average implementation time was about 30 months. The total cost of implementation of all projects was PLN 166,073,198.83. Their total implementation time was 121 months.
The third research group included hotel buildings (group H). A total of 9 projects were collected in it. The average cost of their implementation was PLN 33,283,067.24, and the average implementation time was about 19 months. The total implementation cost of all projects was PLN 299,547,605.18 The total implementation time of all hotel projects was 178 months.
Shopping centres (group G) were analyzed within the fourth separate group of projects. The total number of them accumulated in this typological group was 8. The average cost of realization of ventures in this group was PLN 65,965,340.49, and the average realization time was about 15 months. The total cost of implementation of all projects was PLN 527,722,723. Their total implementation time was 121 months.
The last research group included logistics centres (group L). A total of 6 projects were included in it. The average cost of their implementation was PLN 22,232,458, and the average implementation time was about 9 months. The total implementation cost of all ventures was 133,394,749. The total implementation time of all hotel ventures was 55 months.
The total cost of implementation of the research sample, falling between 2006 and 2024, amounted to PLN 1,374,318,504.34. The total implementation time of all projects was 729 months.
The acquired research material also includes data on projects that can be assigned to other typological groups, but they did not expand the research sample due to their unitary nature.

2.2. Survey Tool

The planned cost of the investment is estimated on the basis of a pre-determined schedule, which includes the execution of all necessary works within a specified time. The database was built from the actual costs of construction works by conducting monthly, direct technical and financial inspections on construction sites of investments carried out as part of the duties of the Bank Investment Supervision (BIS). The planned works and financial schedules developed by the investors before the commencement of works and information on the actual course of implementation from monthly statements and protocols confirming the quantitative performance of works were analyzed. These materials were developed for the purposes of monthly settlements of remuneration between the investor and the contractor. On the basis of the documentation prepared in this way, measurements were made, which were then placed in the database. Each cost value, which is the equivalent of one measurement for a single construction project, consisted of several dozen measurements of the progress of works. Since the measurements were carried out for individual types of works, their number reached several thousands in the entire research sample.
The resulting amount is an assumed, deterministic value, which does not take into account many random factors that may occur during the implementation of the investment. Therefore, in bank-financed investments, a financial contingency of 3% is provided, regardless of the type of project. This is a value resulting from internal procedures and financial risk analysis adopted by the bank. Since each construction project, even belonging to the same group of facilities, will be characterized by an individual course of both cost and schedule overruns, it is worth looking at how these values correspond with each other in relation to characteristic points on the timeline and incidence ranges.
Among the tools used in the analysis and exploration of data obtained from surveys or measurements is the box plot. This allows the presentation of up to nine different statistical parameters of the analyzed data on a single graph (Figure 1).
A, A’—An upper or lower extreme observation being one or more elements of a research sample obtaining results that satisfy a certain inequality. The inequality determining the upper extreme observation takes the form of (1):
X ≥ Q3 + 3 × IQR,
where X—result of the research sample, Q3—3rd quartile value, IQR—quarter range.
The inequality describing the lower extreme observation characterizes the inequality (2):
X ≤ Q1 + 3 × IQR,
where X—result of the research sample, Q1—1st quartile value, IQR—quarter range.
The interquartile range (IQR) is defined as the difference between the values of the Q3 quartile and the Q1 quartile.
B, B’—an outlier observation, also known as an outlier, is a result outside the box that satisfies one of the inequalities, depending on its location. A top outlier observation is characterized by satisfying an inequality (3):
X ≥ Q3 + 1.5 × IQR,
where X—result of the research sample, Q3—3rd quartile value, IQR—quarter range.
The inequality qualifying the result of the research sample as an outlier is presented by the relation (4):
X ≤ Q1 + 1.5 × IQR,
where X—result of the research sample, Q1—1st quartile value, IQR—quarter range.
C, C’—the highest and lowest score that is not an outlier, also referred to as a “whisker” is, in the case of the top score, the largest value obtained that no longer fits into the inequality defined by the Formulas (1) and (2). The lowest score, on the other hand, is the smallest value not covered by the inequalities defined by relations (3) and (4).
D, D’—the upper and lower range of the box. Both parameters are represented, respectively, by the values obtained for the third quartile (Q3) and the first quartile (Q1) is the range between the value of 25% and 75% of the distribution of all values.
E—the horizontal line inside the box represents the median value, the middle value of the distribution of all elements.
Analyzing data using box plots allows attention to be focused on a significant portion of the information gleaned from the research by omitting values that significantly deviate from the average in a given group.

3. Results

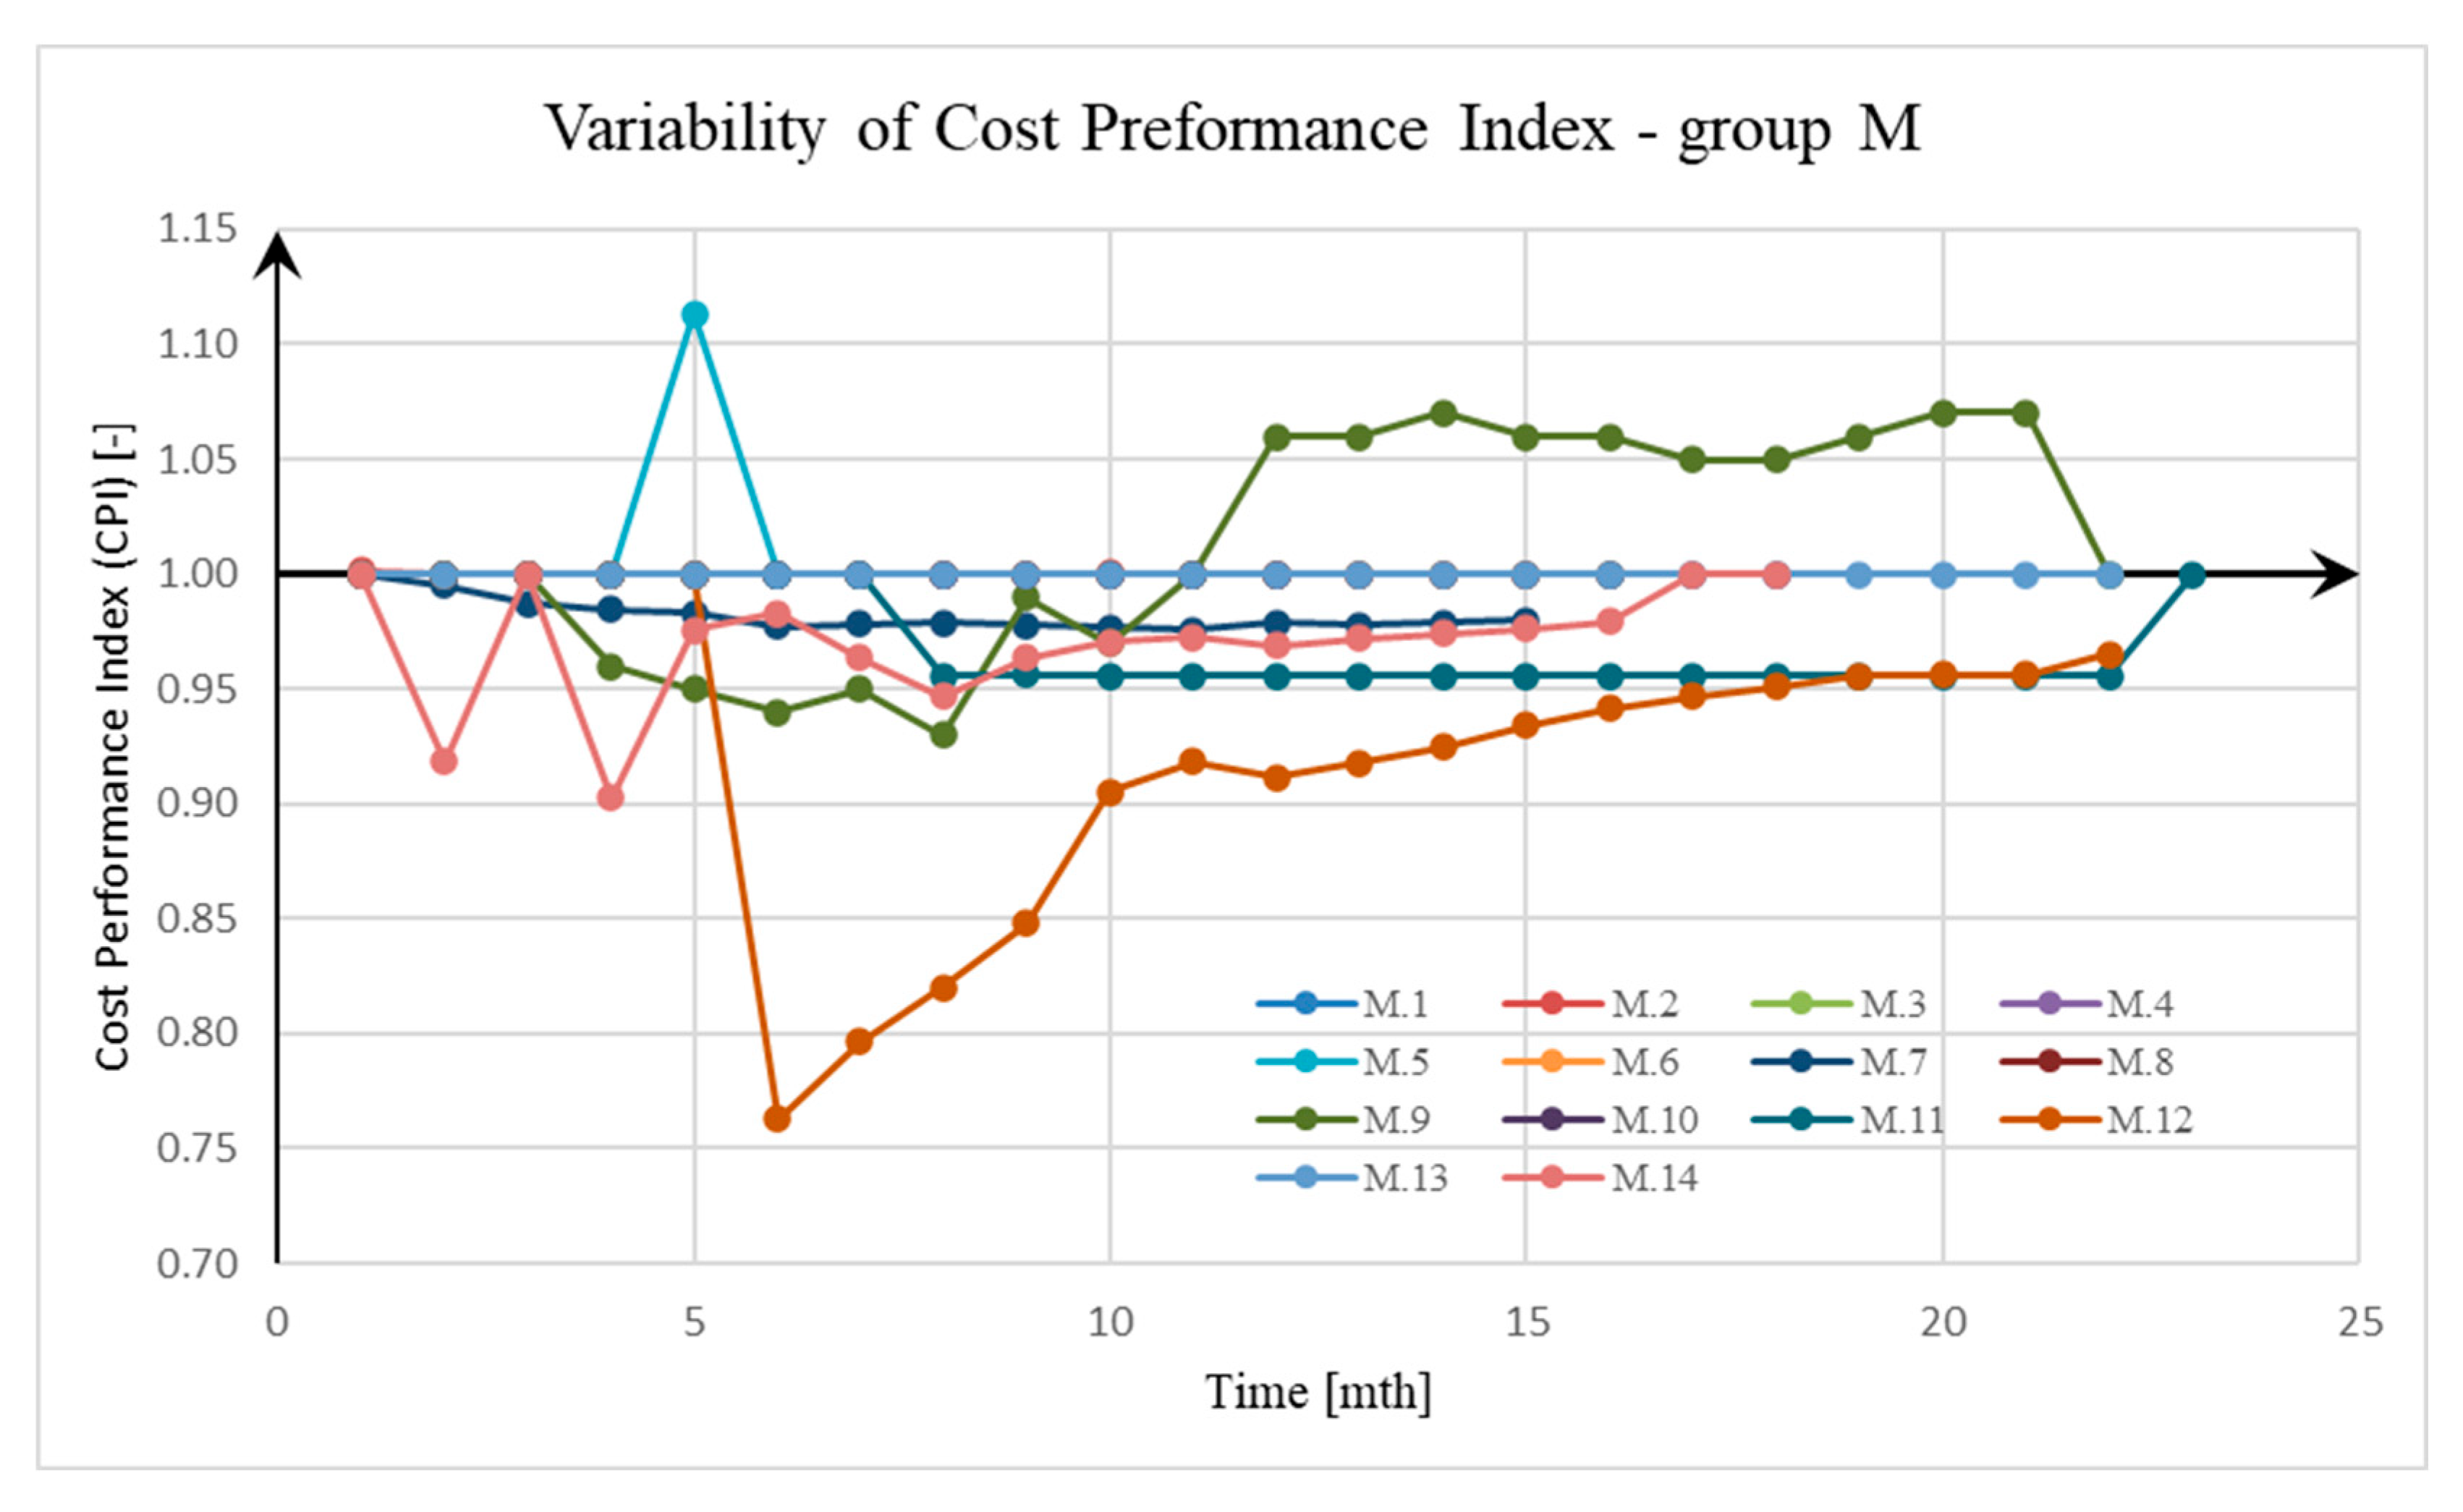
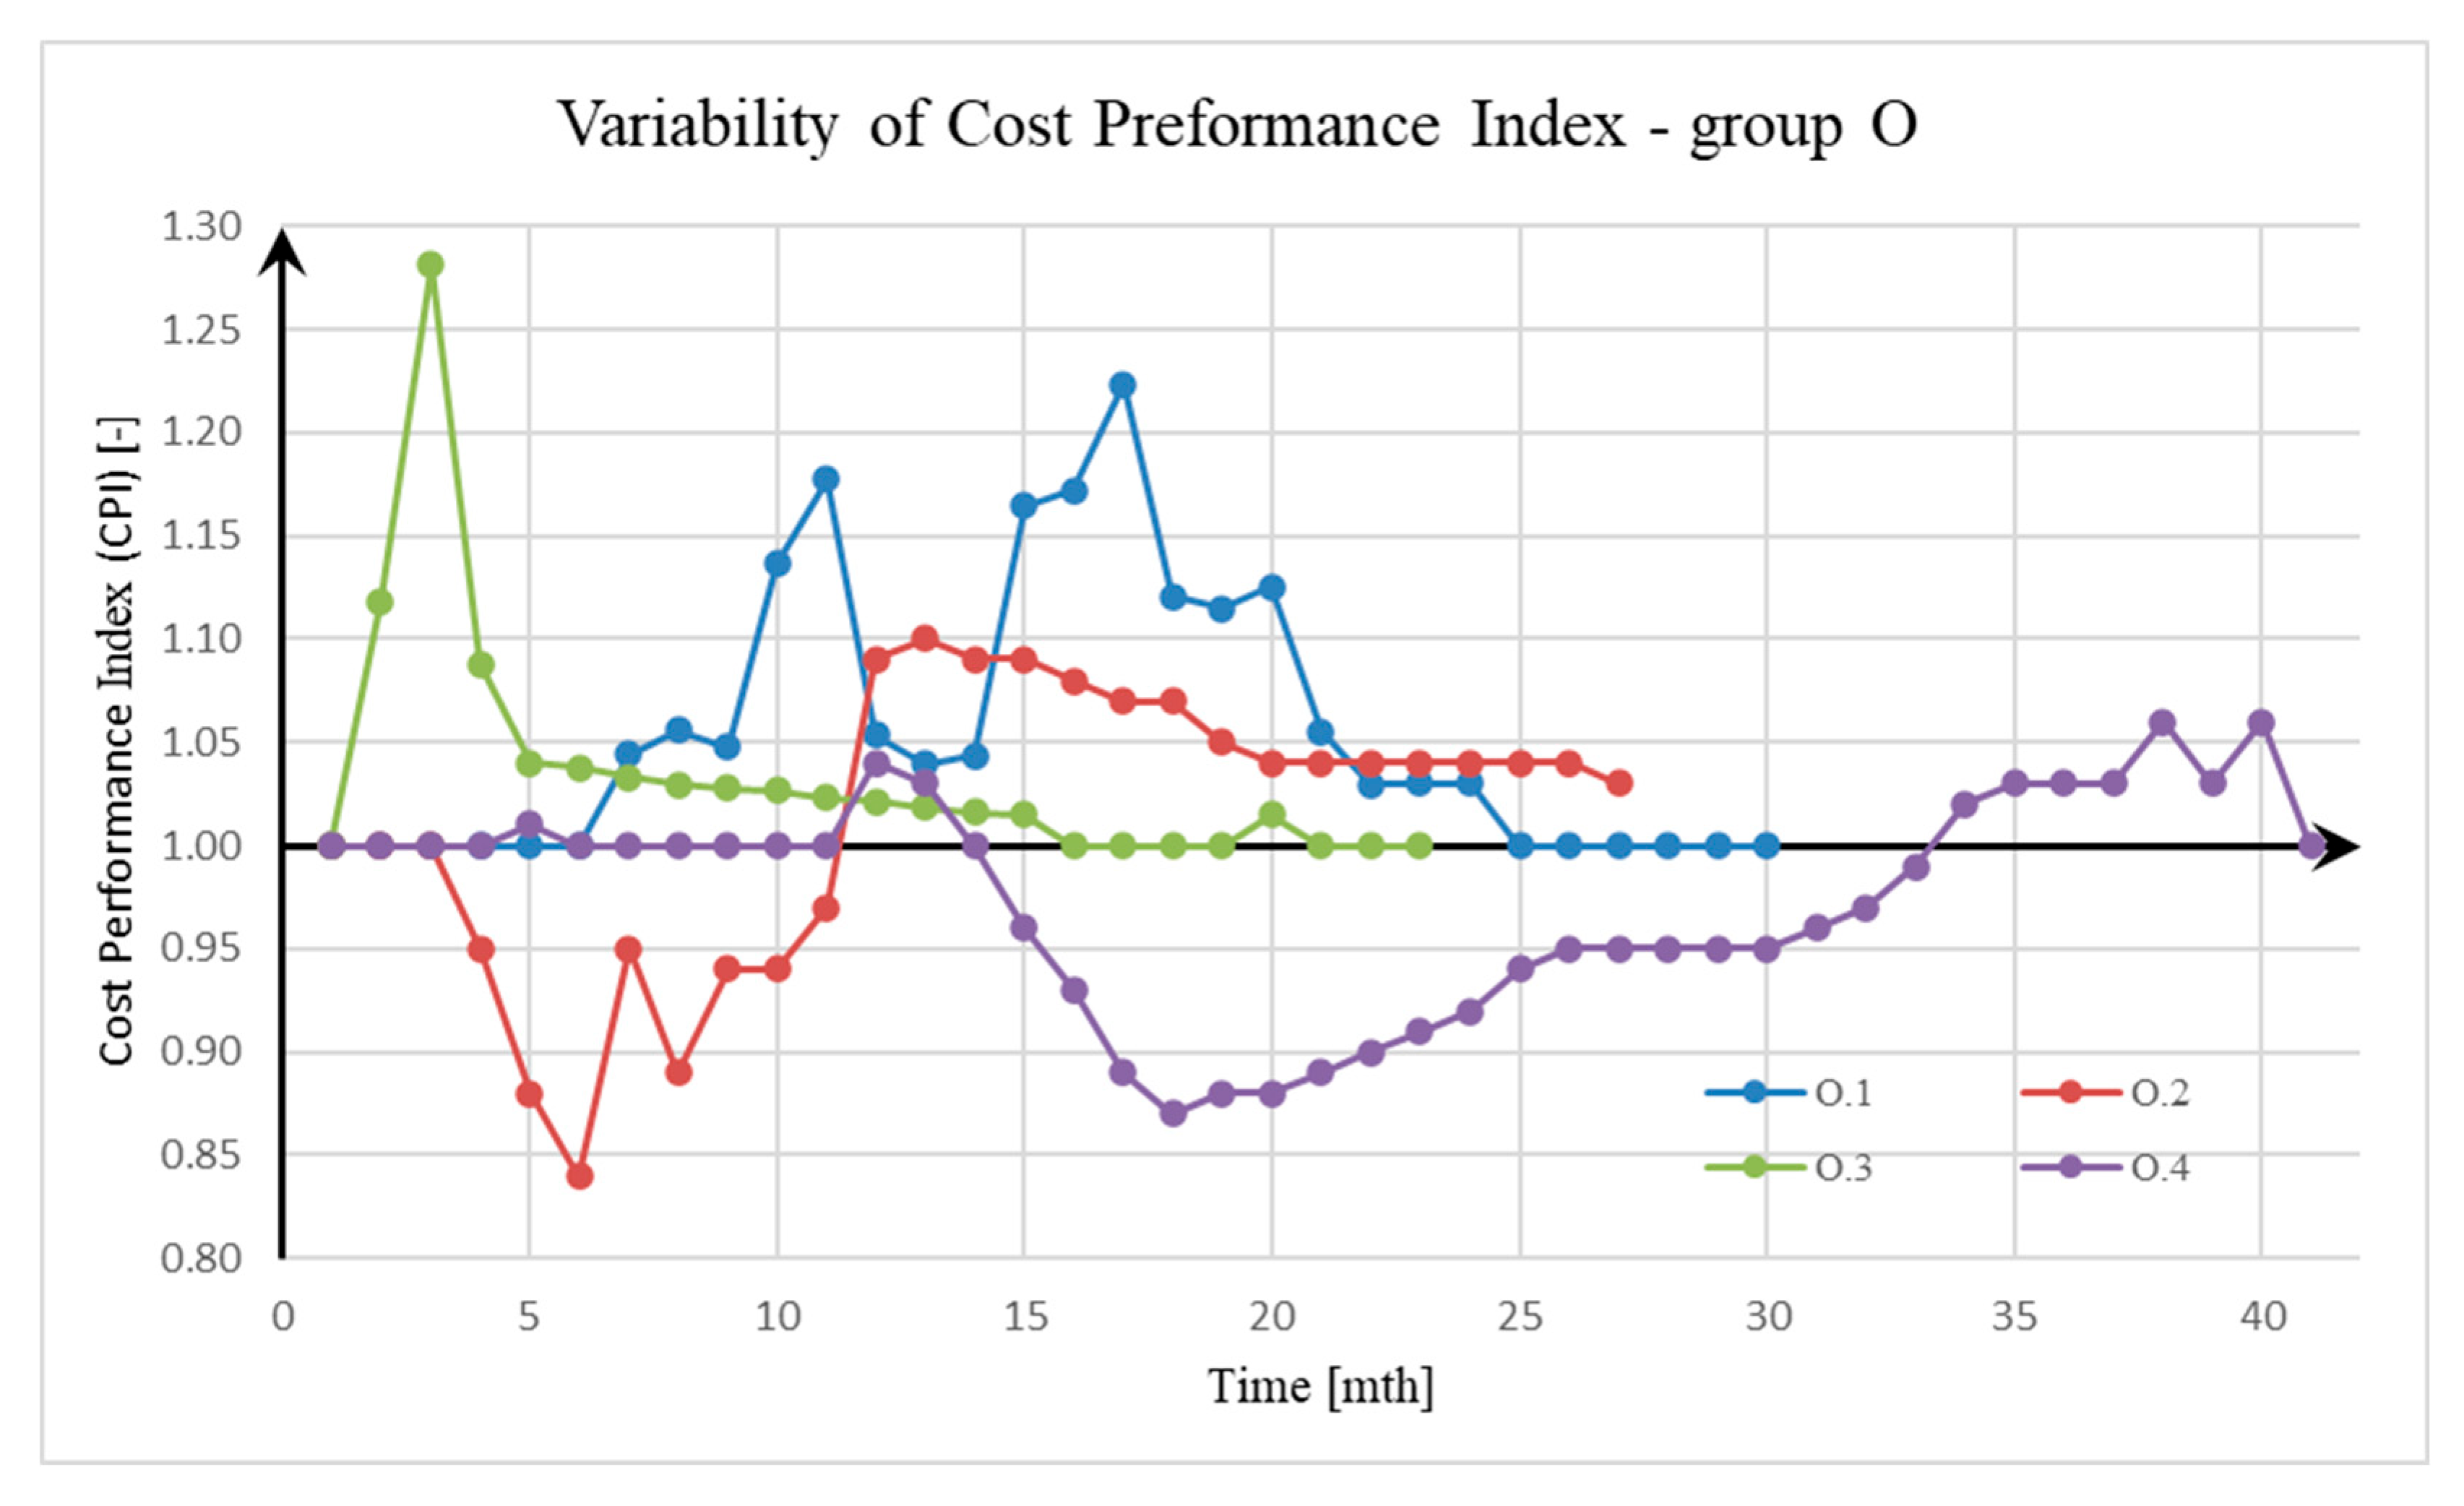
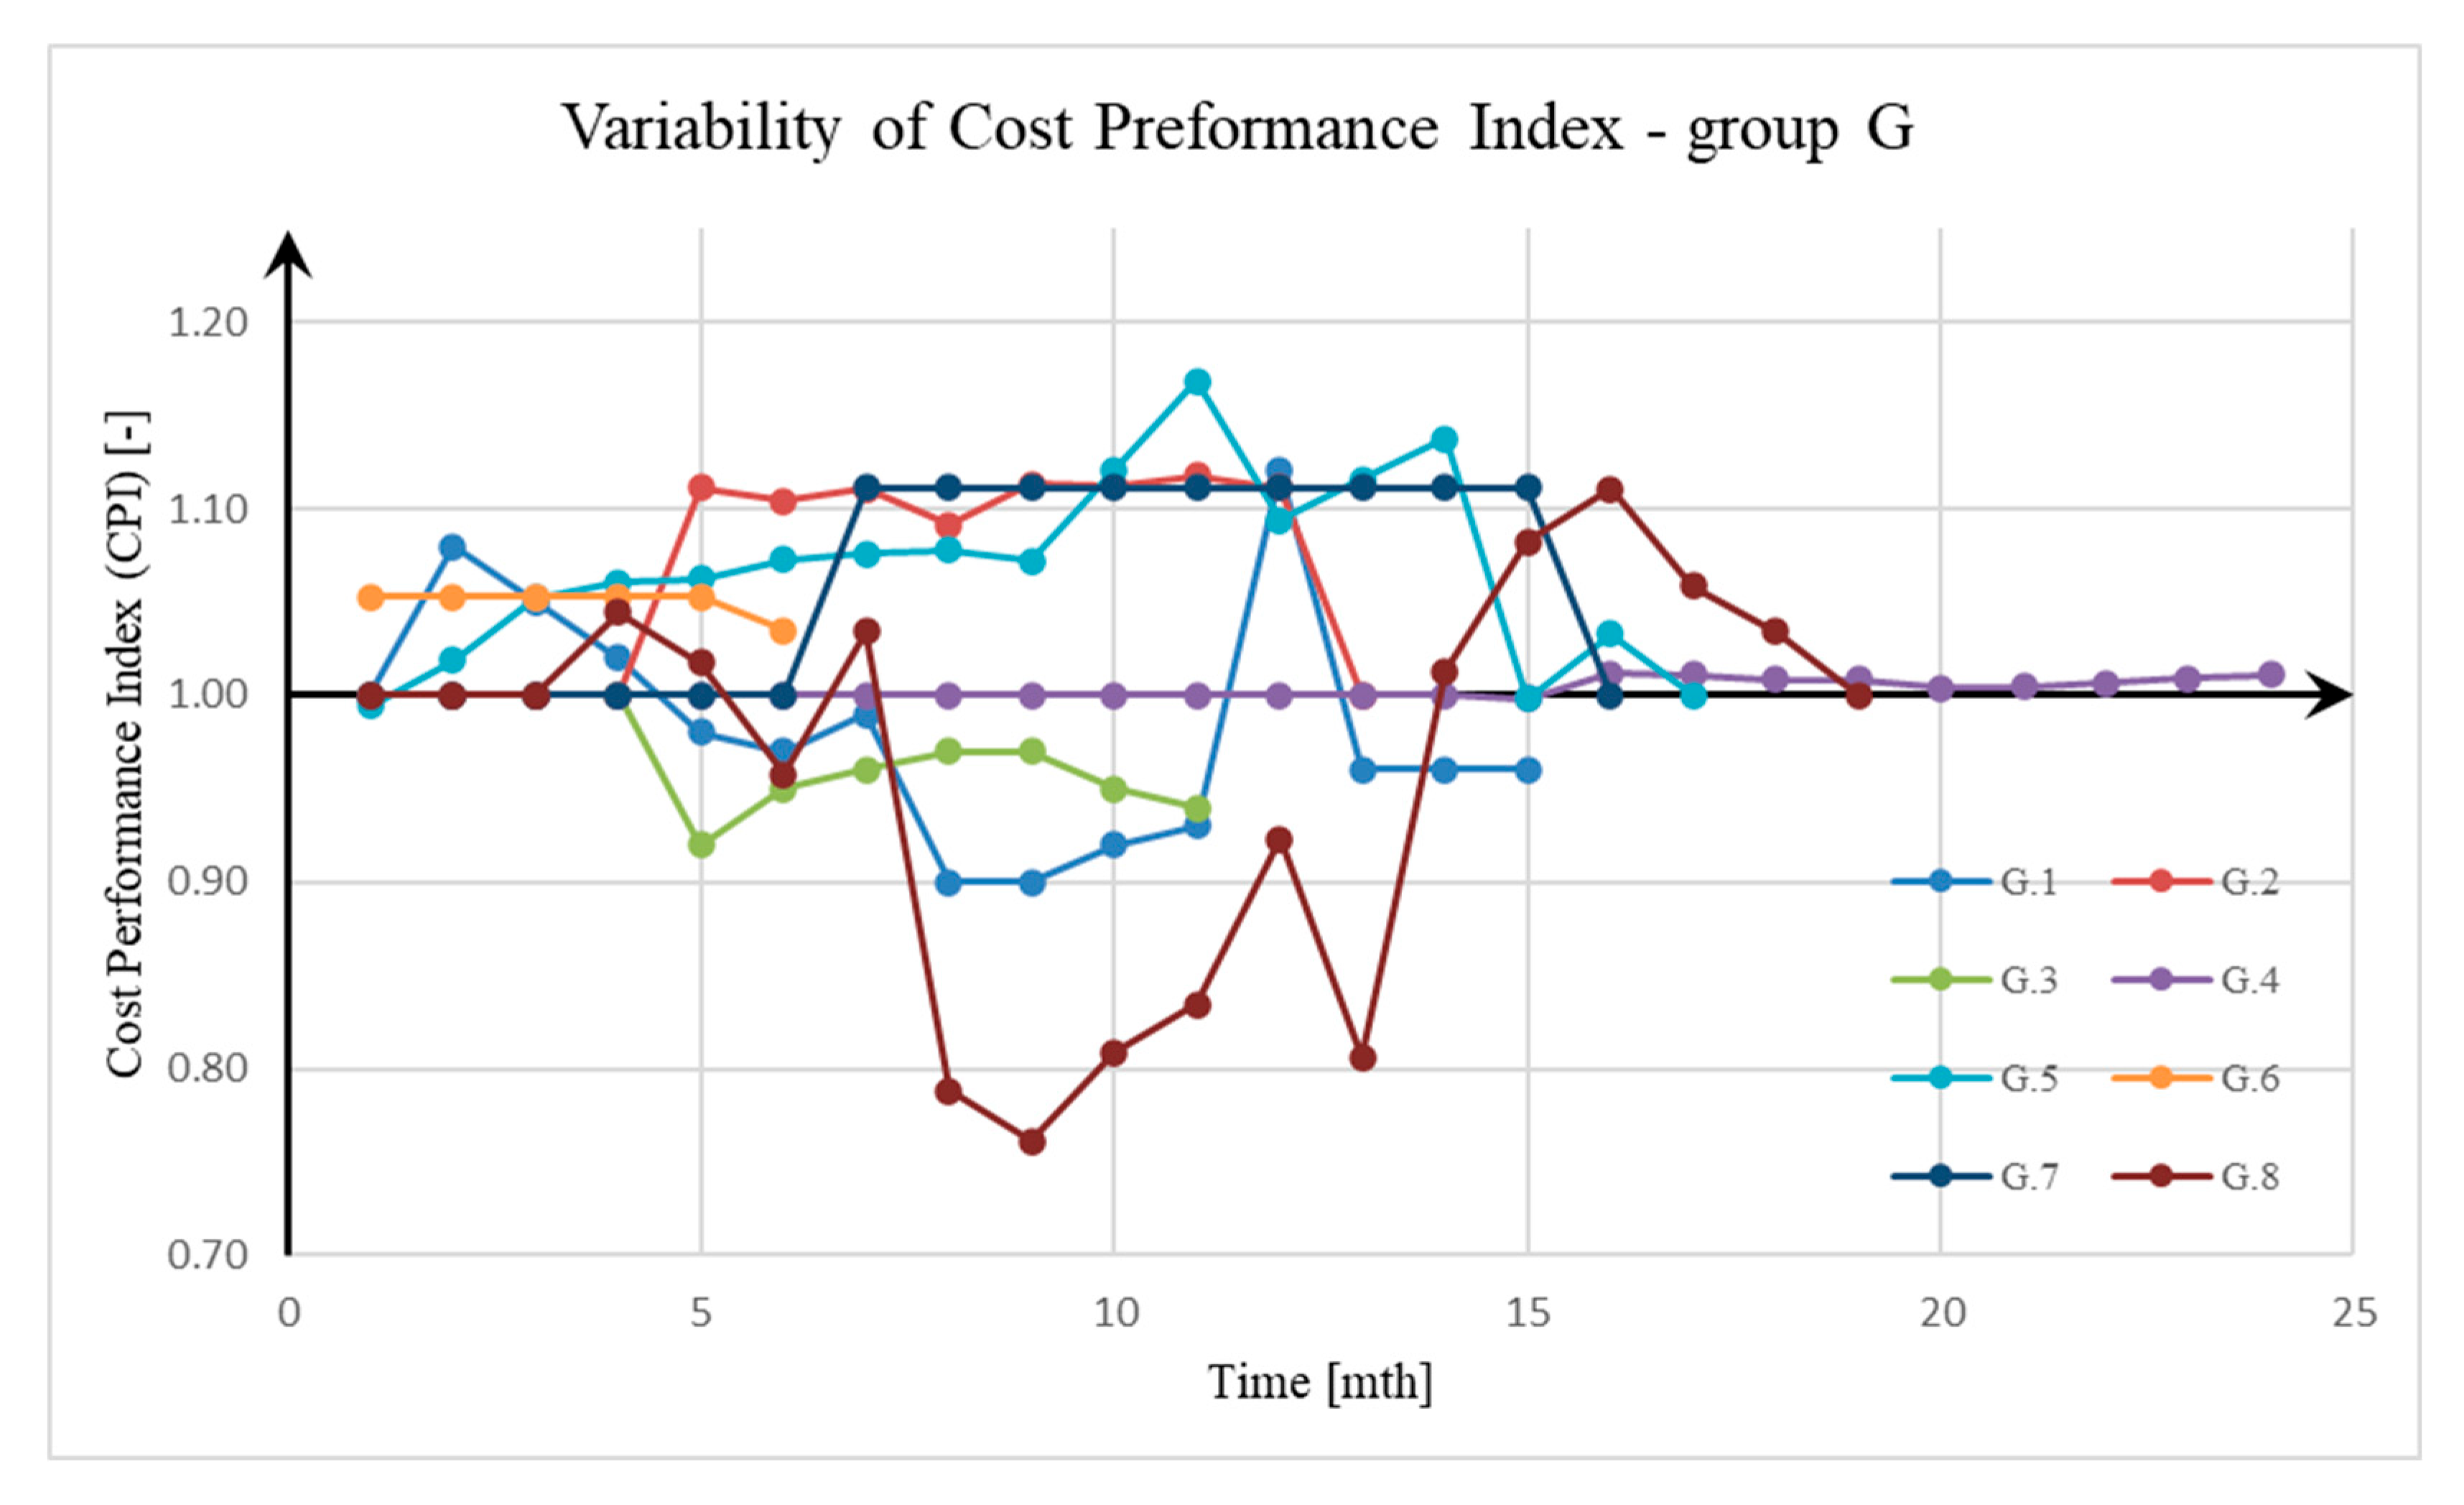
3.1. Cost Performance Index (CPI) in Diversified Construction Projects

An inevitable effect of any construction project is deviations from the planned cost and deadline, which are the result of many different factors that can affect the course of the investment process. Having at our disposal accurate data from 41 construction projects, summaries were developed showing in a clear way the magnitude of deviations of cost and deadline from planned values by means of cost performance indices (CPI). Cost performance index (CPI) represents the cost efficiency of a project. It expresses the ratio of the value earned (BCWP) to the actual cost of work performed (ACWP). CPI > 1 means that the project is being implemented cost-effectively, while CPI < 1 indicates budget overruns.
CPI = BCWP/ACWP,
where BCWP—budgeted cost of work performed, ACWP—actual cost of work performed.
The CPI investment cost realization index is presented in graphs according to the time of investment realization. The results of the analyses are presented by group of projects. A graph of the variation in the cost realization index in the group of residential buildings (M) is shown in Figure 2. Eight projects experienced no deviations. Among the others, the occurrence of higher deviation values was observed in the initial period of their course, which then gradually reduced.
In the case of the office building group (O) (Figure 3), deviations of the index were observed in 75% of the ventures. The vast majority of the observed deviations were characterized by CPI values greater than 1.
The group of hotel buildings (H), for which the results of observations are shown in Figure 4, was characterized by the occurrence of CPI deviations for each project. The overwhelming number of projects showed a high variability of the index value in the range of 0.8–1.05. The values of one project (H.1) significantly deviated from the others, reaching values in the range of 0.67–1.24.
A group of shopping centres, for which the results are presented in Figure 5, is characterized by a large variation in the CPI cost deviation index. All ventures showed CPI deviations whose course varied strongly in terms of value.
The last separated group of projects, logistics centres (L), is characterized by the most stable course of CPI values (Figure 6). More than half of the analyzed projects did not show any deviation of CPI during the entire implementation. One investment showed a fluctuating course of CPI values.
Based on observations of the course of CPI variability in diversified construction projects, the following conclusions and observations were made:
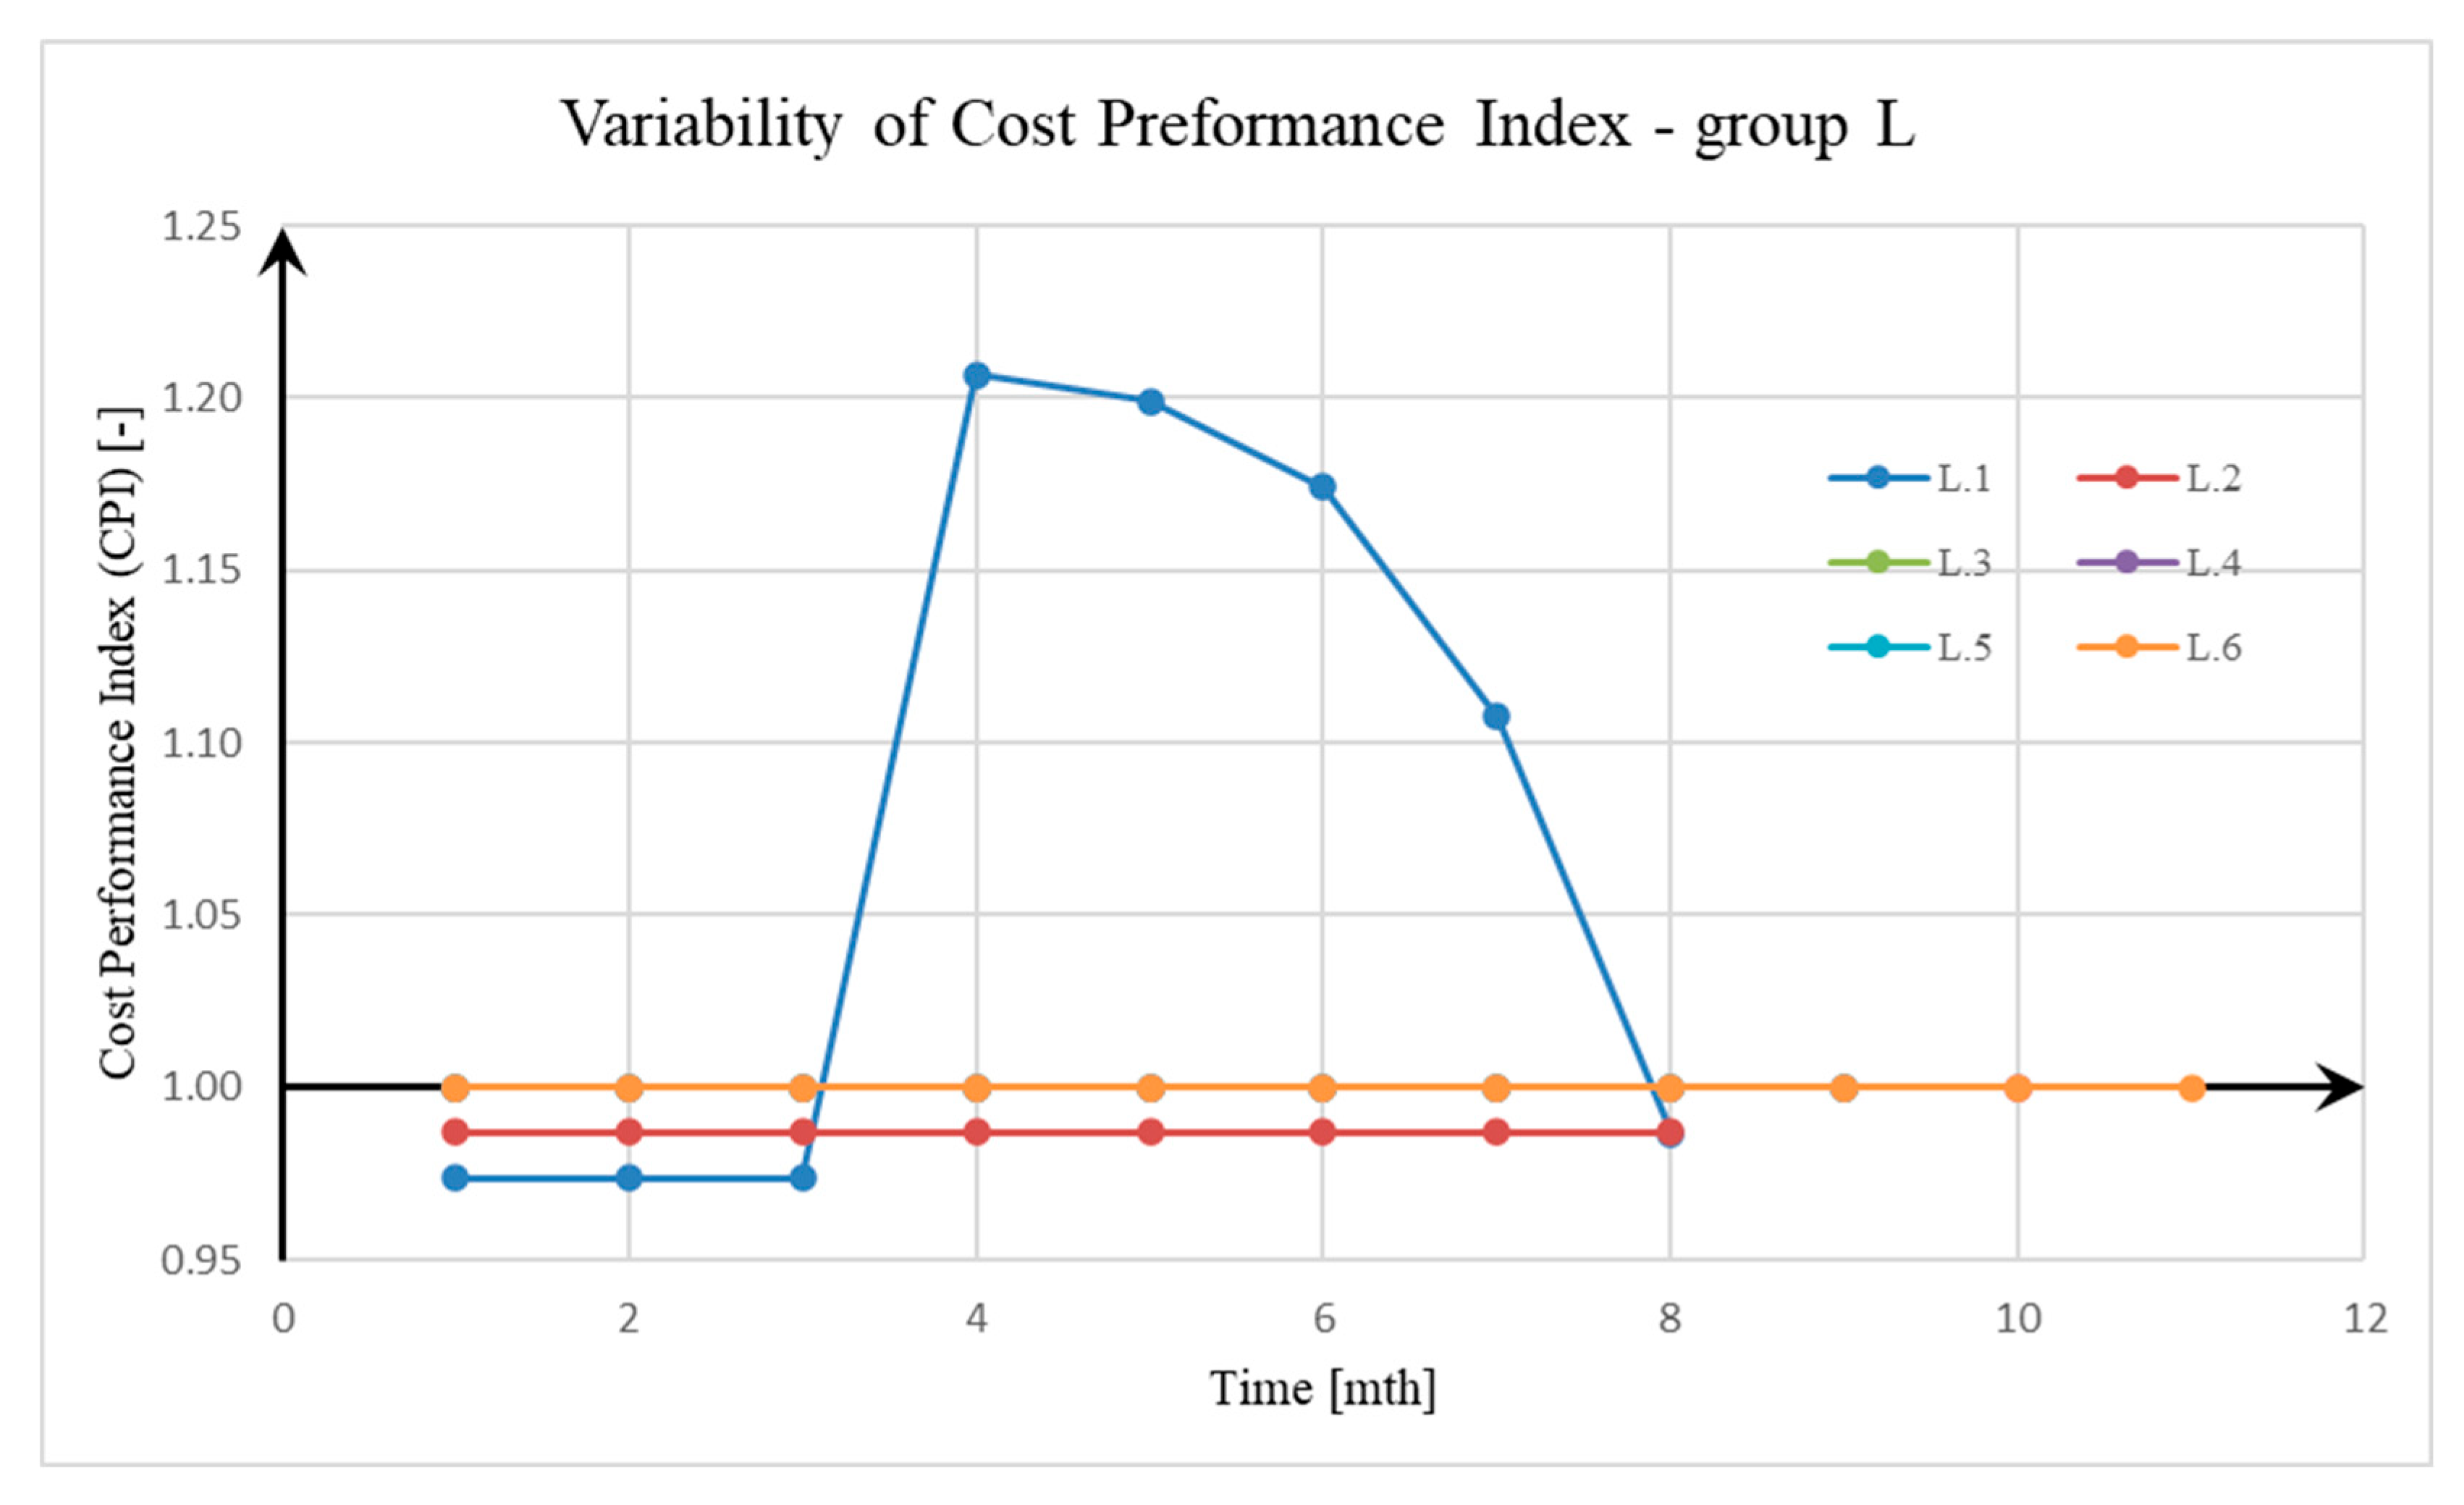
  • The cost performance indexes in the various groups of facilities show great variation both in terms of the values obtained and the observed course;
  • The values of the cost performance index are characterized by greater and more chaotic dynamics of variation than the corresponding values of the schedule performance index. This shows the absence of a direct relationship between cost and schedule overruns;
  • The course of the values of the individual indicators shown in the charts indicates the values of the CPI at a given, well-defined moment in the life of the investment and does not directly indicate the ultimate cost and schedule overruns of the investment;
  • The course of CPI volatility is complex in nature and shows great variation even within groups of facilities. This does not allow any trend to be determined.

3.2. Analysis of Cost Overruns by Investment Group

Box plots were made for all the groups of facilities selected for analysis based on the values of CPI cost overrun indicators determined for each investment in each month of its implementation. The function of box plots ideally fits the main goal of the research works, which is updating financial contingency in execution of construction projects. The bottom whisker value of the box plot, which belongs to the typologically consistent group of already executed construction projects, indicates the maximum level of the assumed financial contingency for future projects in the same group. This is why box plots were chosen over alternatives like histograms or scatter plots. The charts were additionally plotted with a financial contingency level of 3% and corresponding to the value of CPI = 0.97, which was marked with a red line. Values less than “1” indicate cost overspending.
In the group of residential buildings (M), box plots were made, showing the ranges of the course of cost overruns (Figure 7). Juxtaposition of the graphs of individual investments shows that in the case of eight projects, their course took place without any disturbances associated with cost deviation. In four cases, values were observed that exceeded the value of 0.97 accepted as the financial contingency. The median values determined for the cost deviations of these investments showed that, in each case, at least half of them were on the overshoot side.
The occurrence of outlier observations in investment M.12 and the long “whiskers” marking the 1.5 quartile gap indicates significant outliers. The varying magnitude of the quartile range in each investment indicates the different course of each investment.
For the group of office buildings (O), box plots showing the distribution of cost overruns are shown in Figure 8. Observation of individual plots indicates the presence of deviations both in the direction of cost savings incurred relative to planned costs and in the direction of cost overspending.
Analogously to the group of residential buildings (M), the varying size of the quarterly spread in individual investments indicates their different course. The presence of “whiskers”, especially in investments O.1, O.2 and O.4, indicates the presence of extreme values that significantly deviate from the average values represented by the boxes.
In the case of investments O.2 and O.4, there was a cost deviation resulting in an overrun of the financial contingency. The value representing the highest overspending, represented in the charts by the lower “whiskers”, was 0.84. Analyzing the medians, it was observed that, in three cases, the average values of cost deviations obtained CPI values greater than “1”, which means that savings occurred.
The group of hotel buildings (H) is represented by nine developments. Box plots developed based on CPI values for these projects are included in Figure 9. Observations indicate the occurrence of overruns in about 80% of the investments in this group.
In almost all the projects studied, deviations occurred on both the overrun and savings sides. One investment showed significant variation in CPI values. Seven projects showed overspendings of the financial contingency level. In five cases, median analysis showed that more than half of the results obtained exceeded the adopted financial contingency level of 0.97.
The group that includes shopping centres (G) is represented by eight developments. Box plots developed based on CPI values for these ventures are included in Figure 10. Observation of the plots showed that five ventures did not exceed the planned cost, and the measured deviations were on the side of savings. Three ventures exceeded the financial contingency threshold of 0.97. As in the groups of ventures presented earlier, the Q1–Q3 ranges of the CPI run (boxes) in each venture varied, as did the group of shopping centres (G). Observations of the median in ventures that exceeded the financial contingency indicate that more than half of the values scored outside its range.
Logistics centres (L) are a group of ventures characterized by high stability of CPI values. Box plots developed on their basis of CPI values for these ventures are included in Figure 11. The vast majority of ventures proceeded in accordance with the planned budget, showing no fluctuations in CPI. Only one project experienced significant fluctuations in CPI (0.97–1.19), with its values not exceeding the level of the adopted financial contingency.
Analyzing the box plots developed for each group of construction projects, the following conclusions were made:
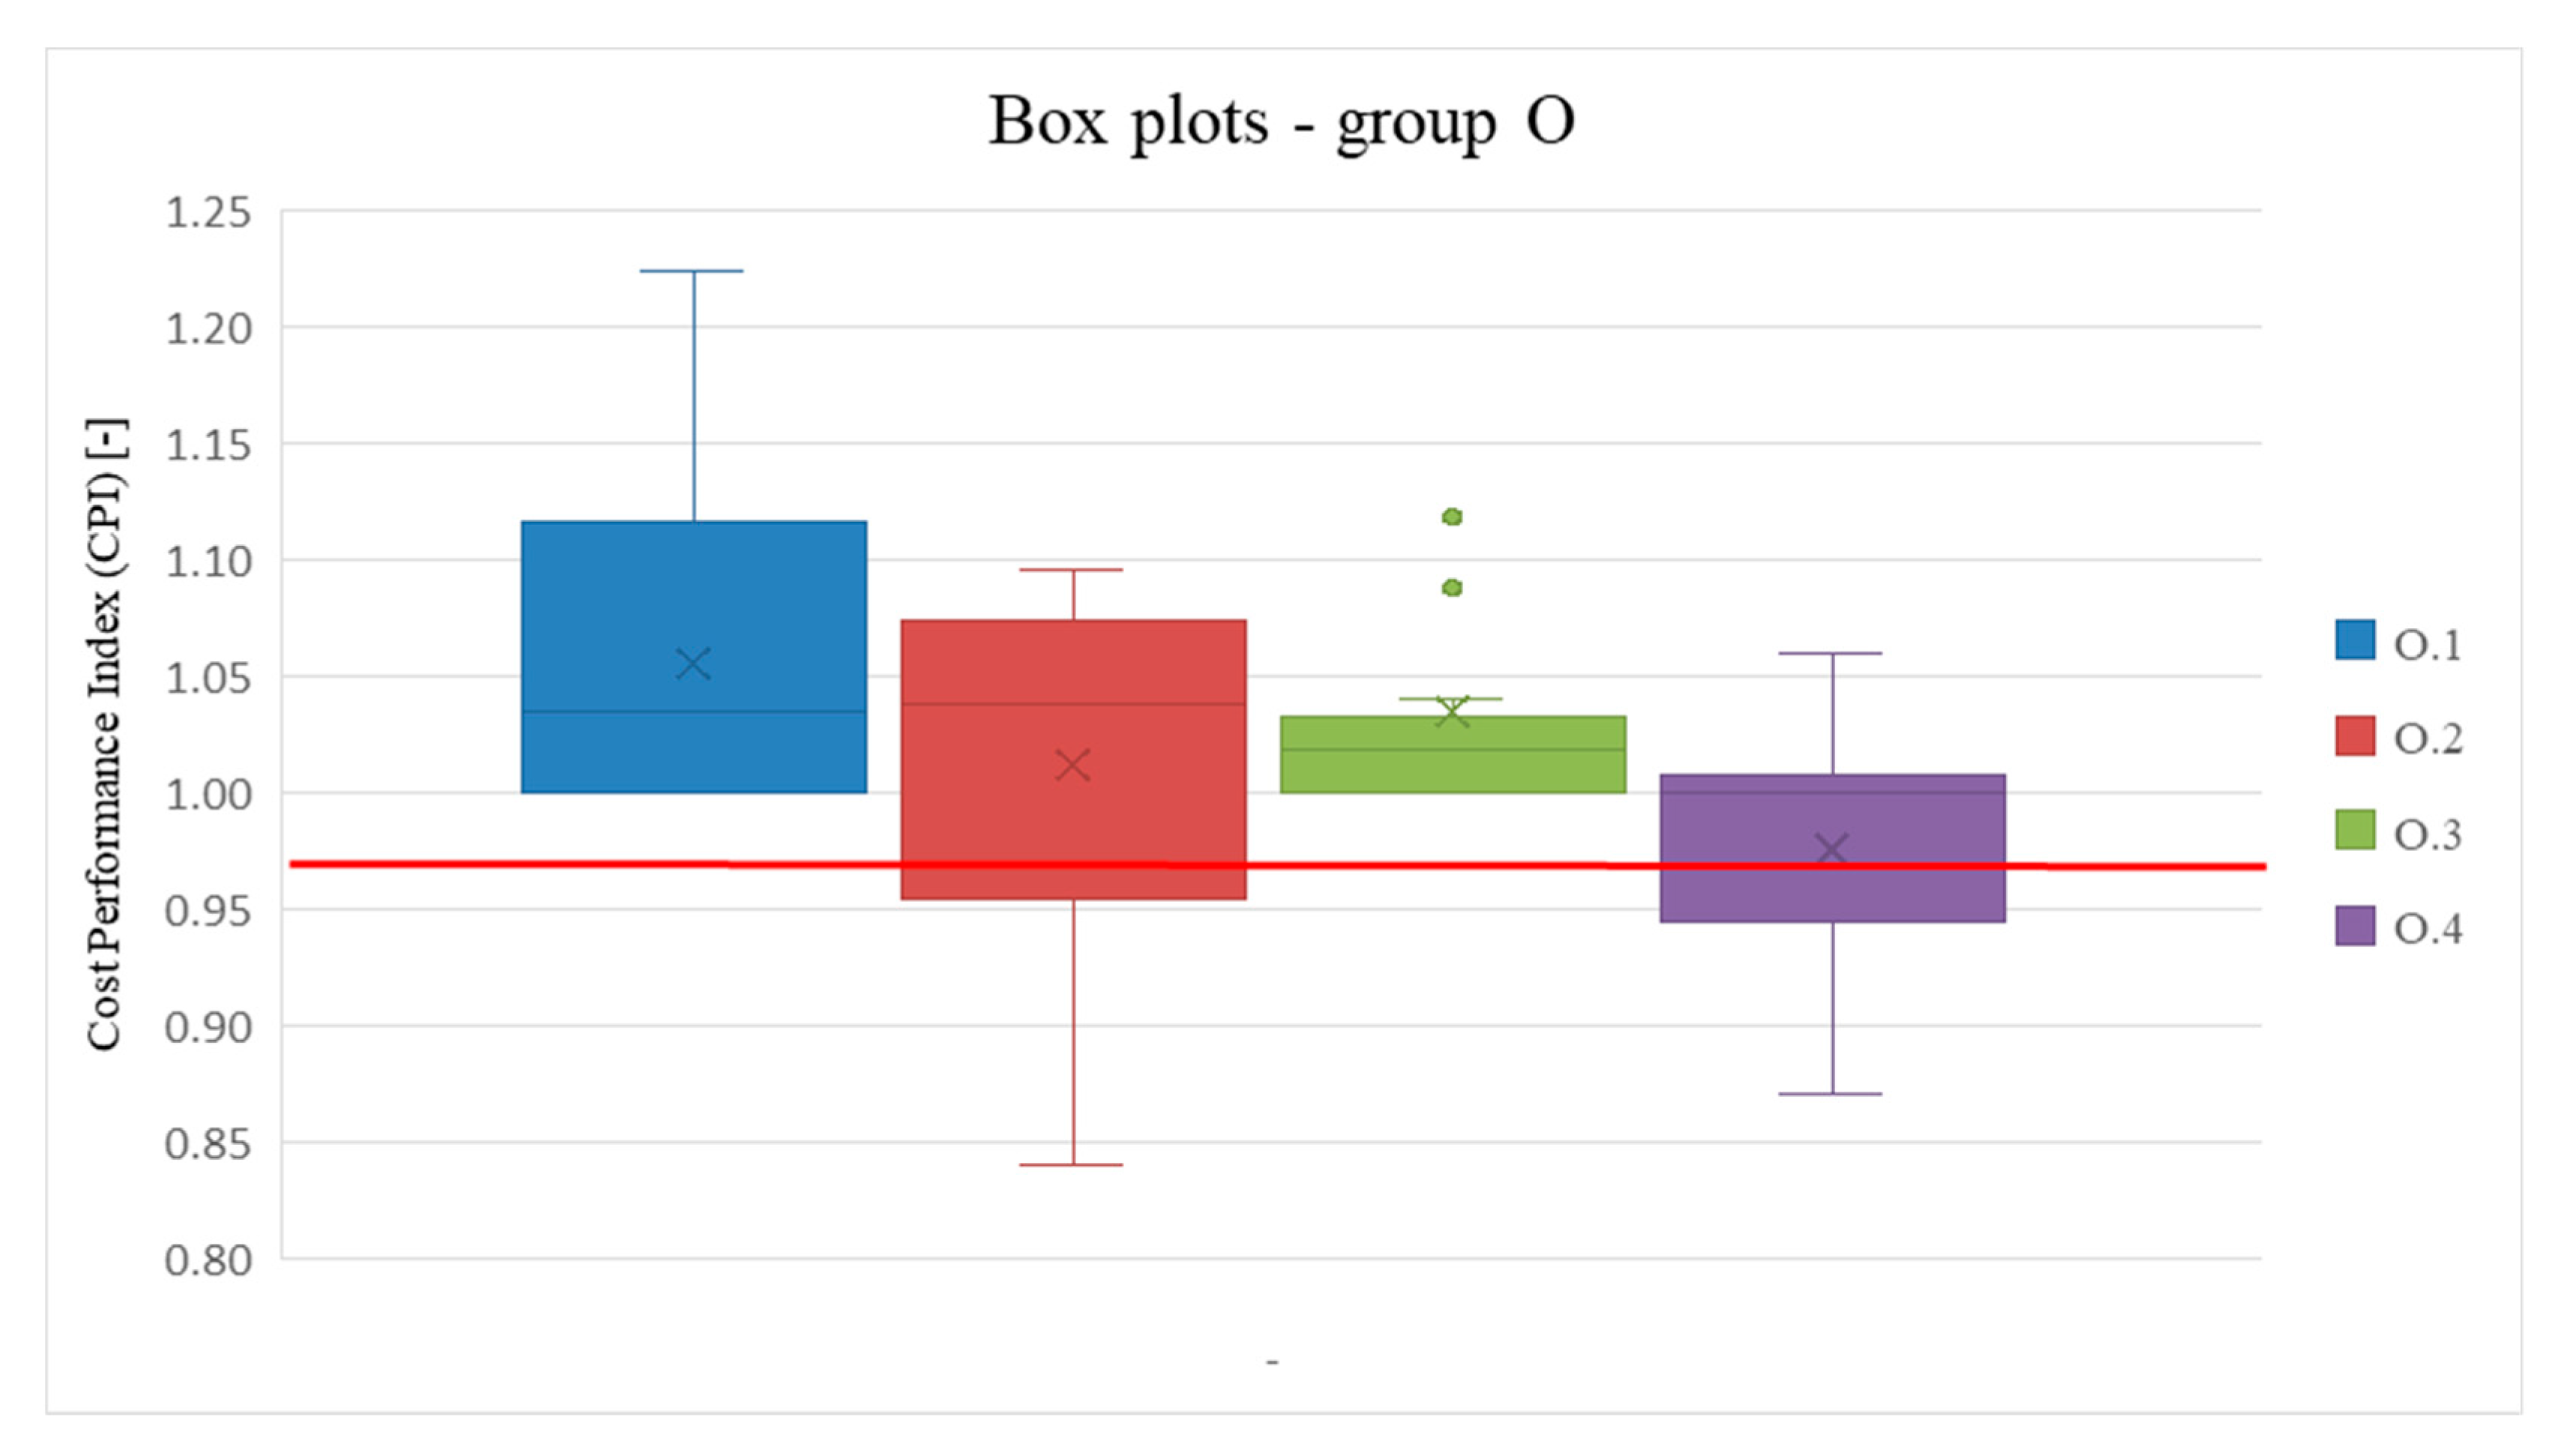
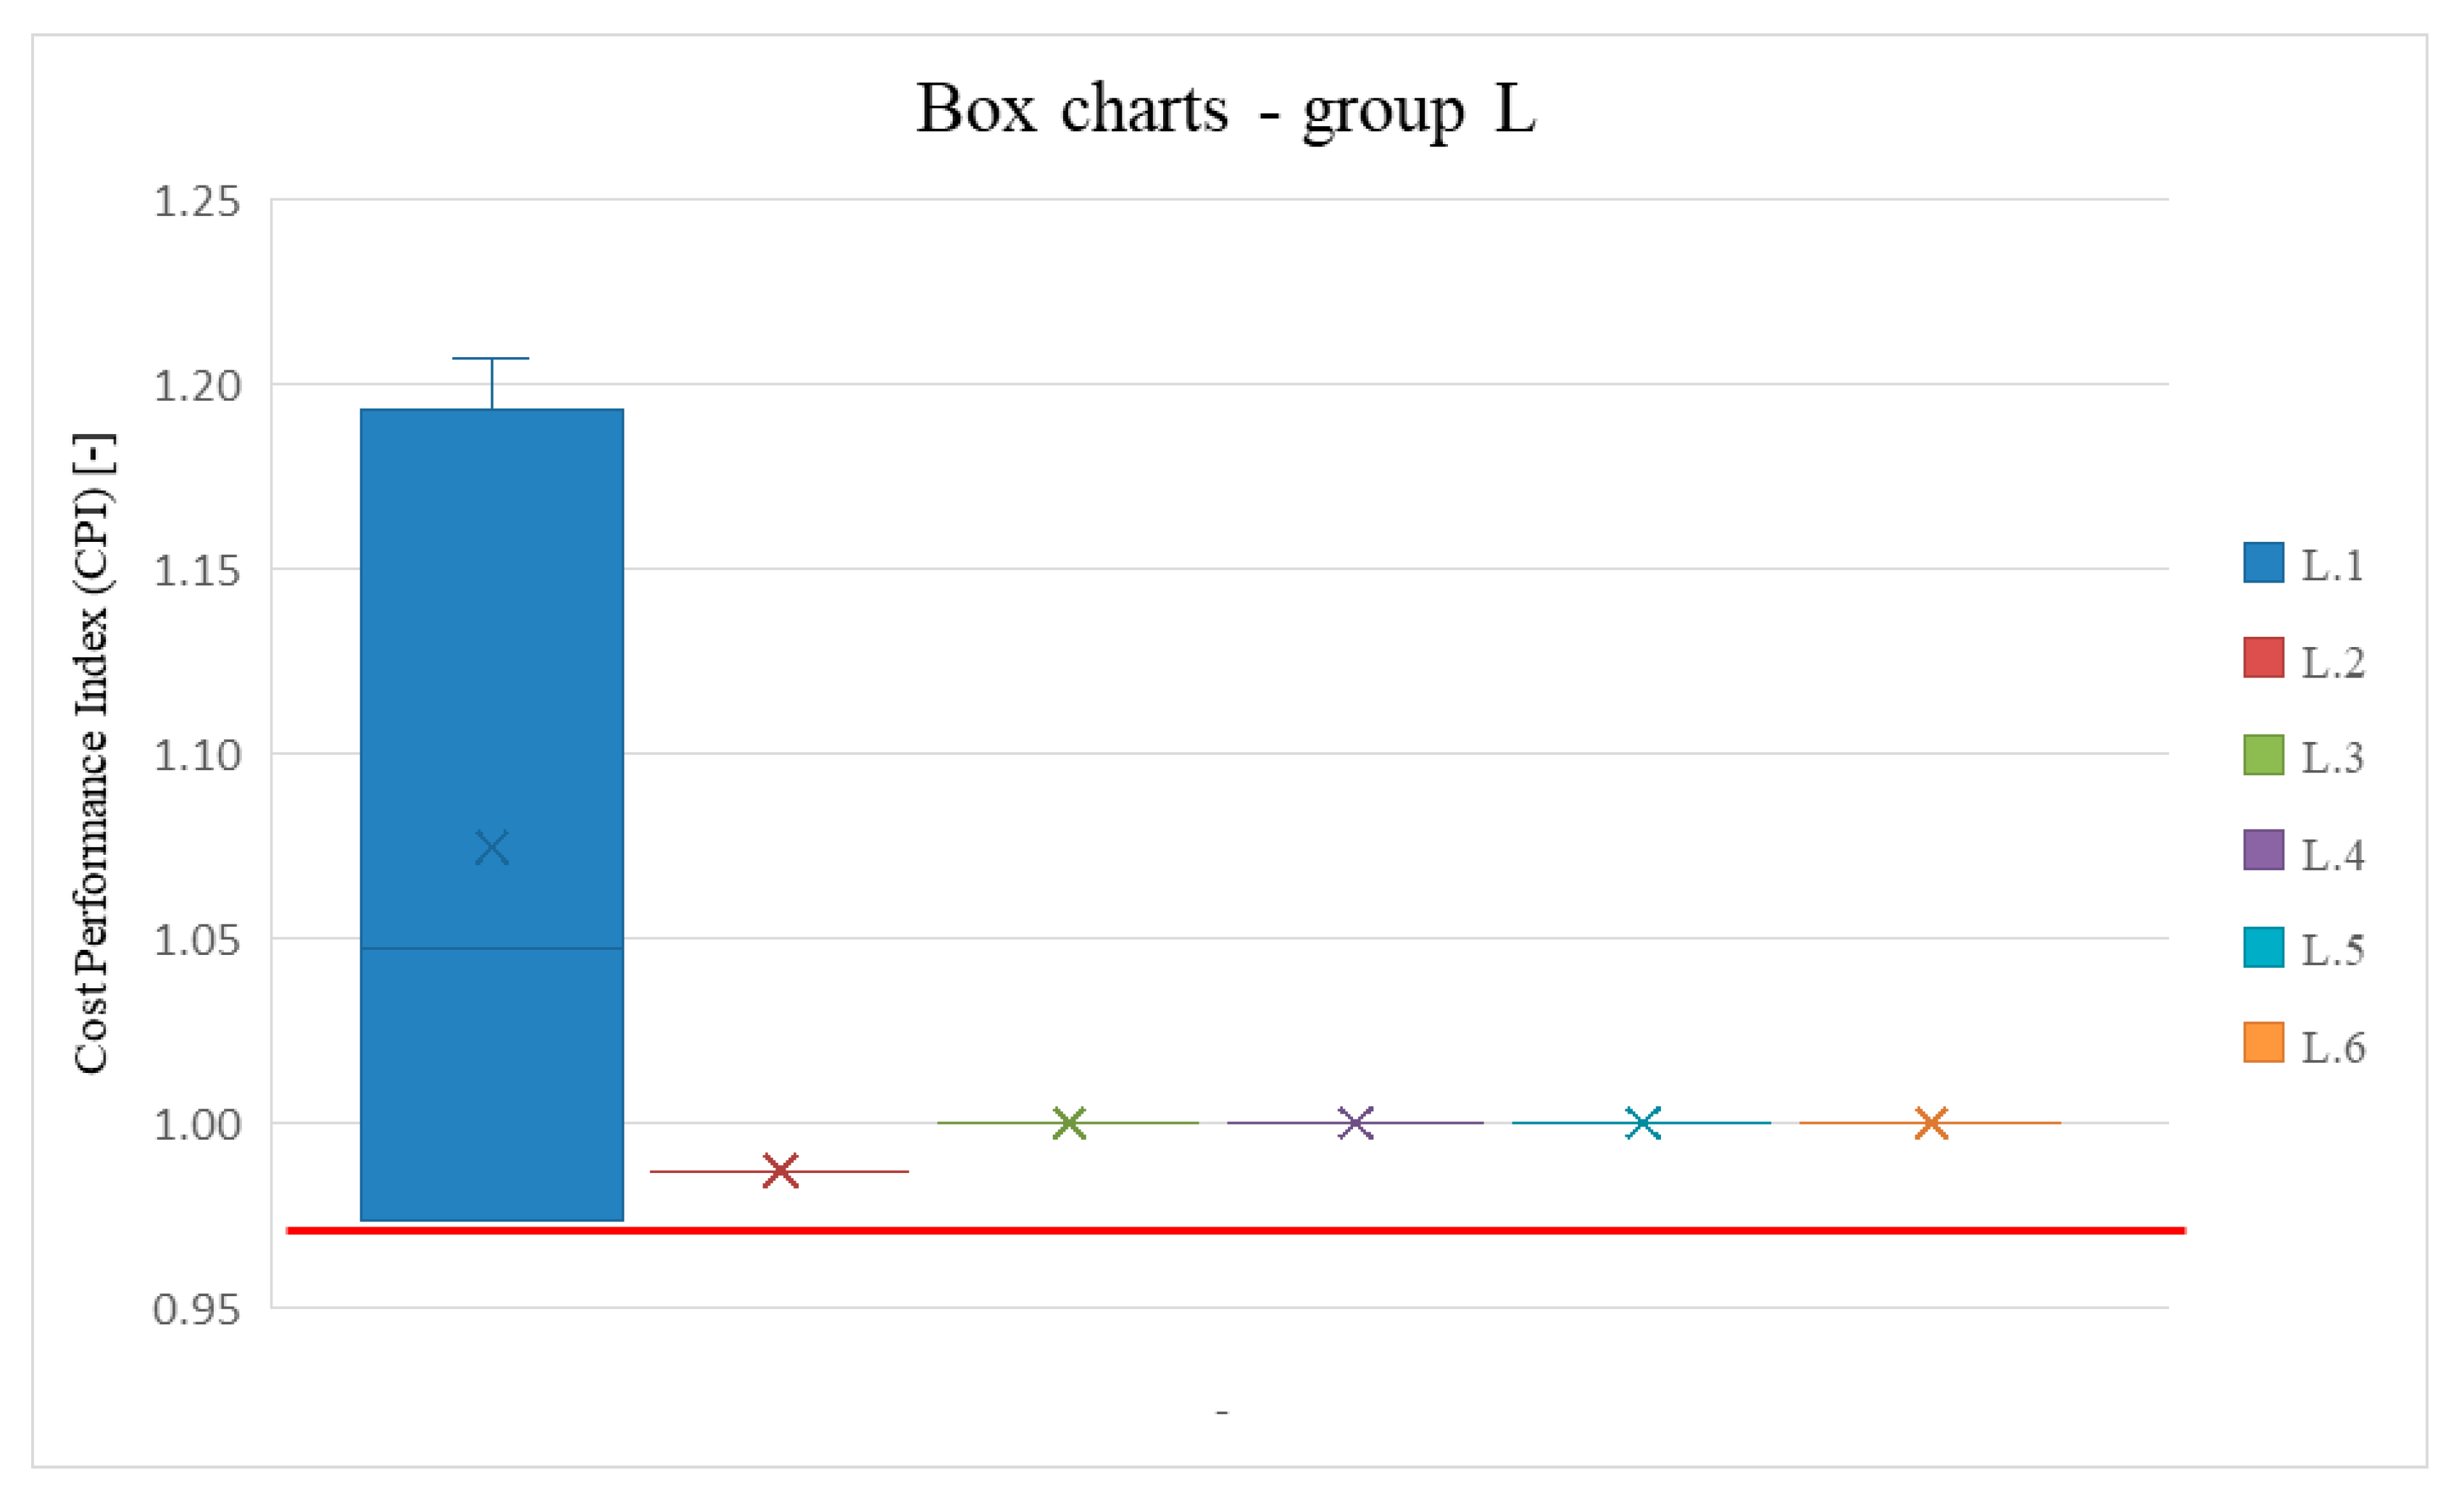
  • The ranges of CPI values observed in the identified investment groups are characterized by wide variation between individual projects;
  • Except for the group of logistics centres (L), it was observed that the number of projects with cost overruns above the financial contingency level was in the range of 30–50%. The exception was the group of hotel buildings (H), where more than 70% of the projects showed significant overruns of this parameter. Such a high number of overruns observed in each audit period had a significant impact on the final cost of implementation and its deviation from the planned cost and the financial contingency;
  • The distribution of CPI values against the financial contingency, observed in the box plots, indicates the possibility that the final cost of the project may not be maintained at the planned level.

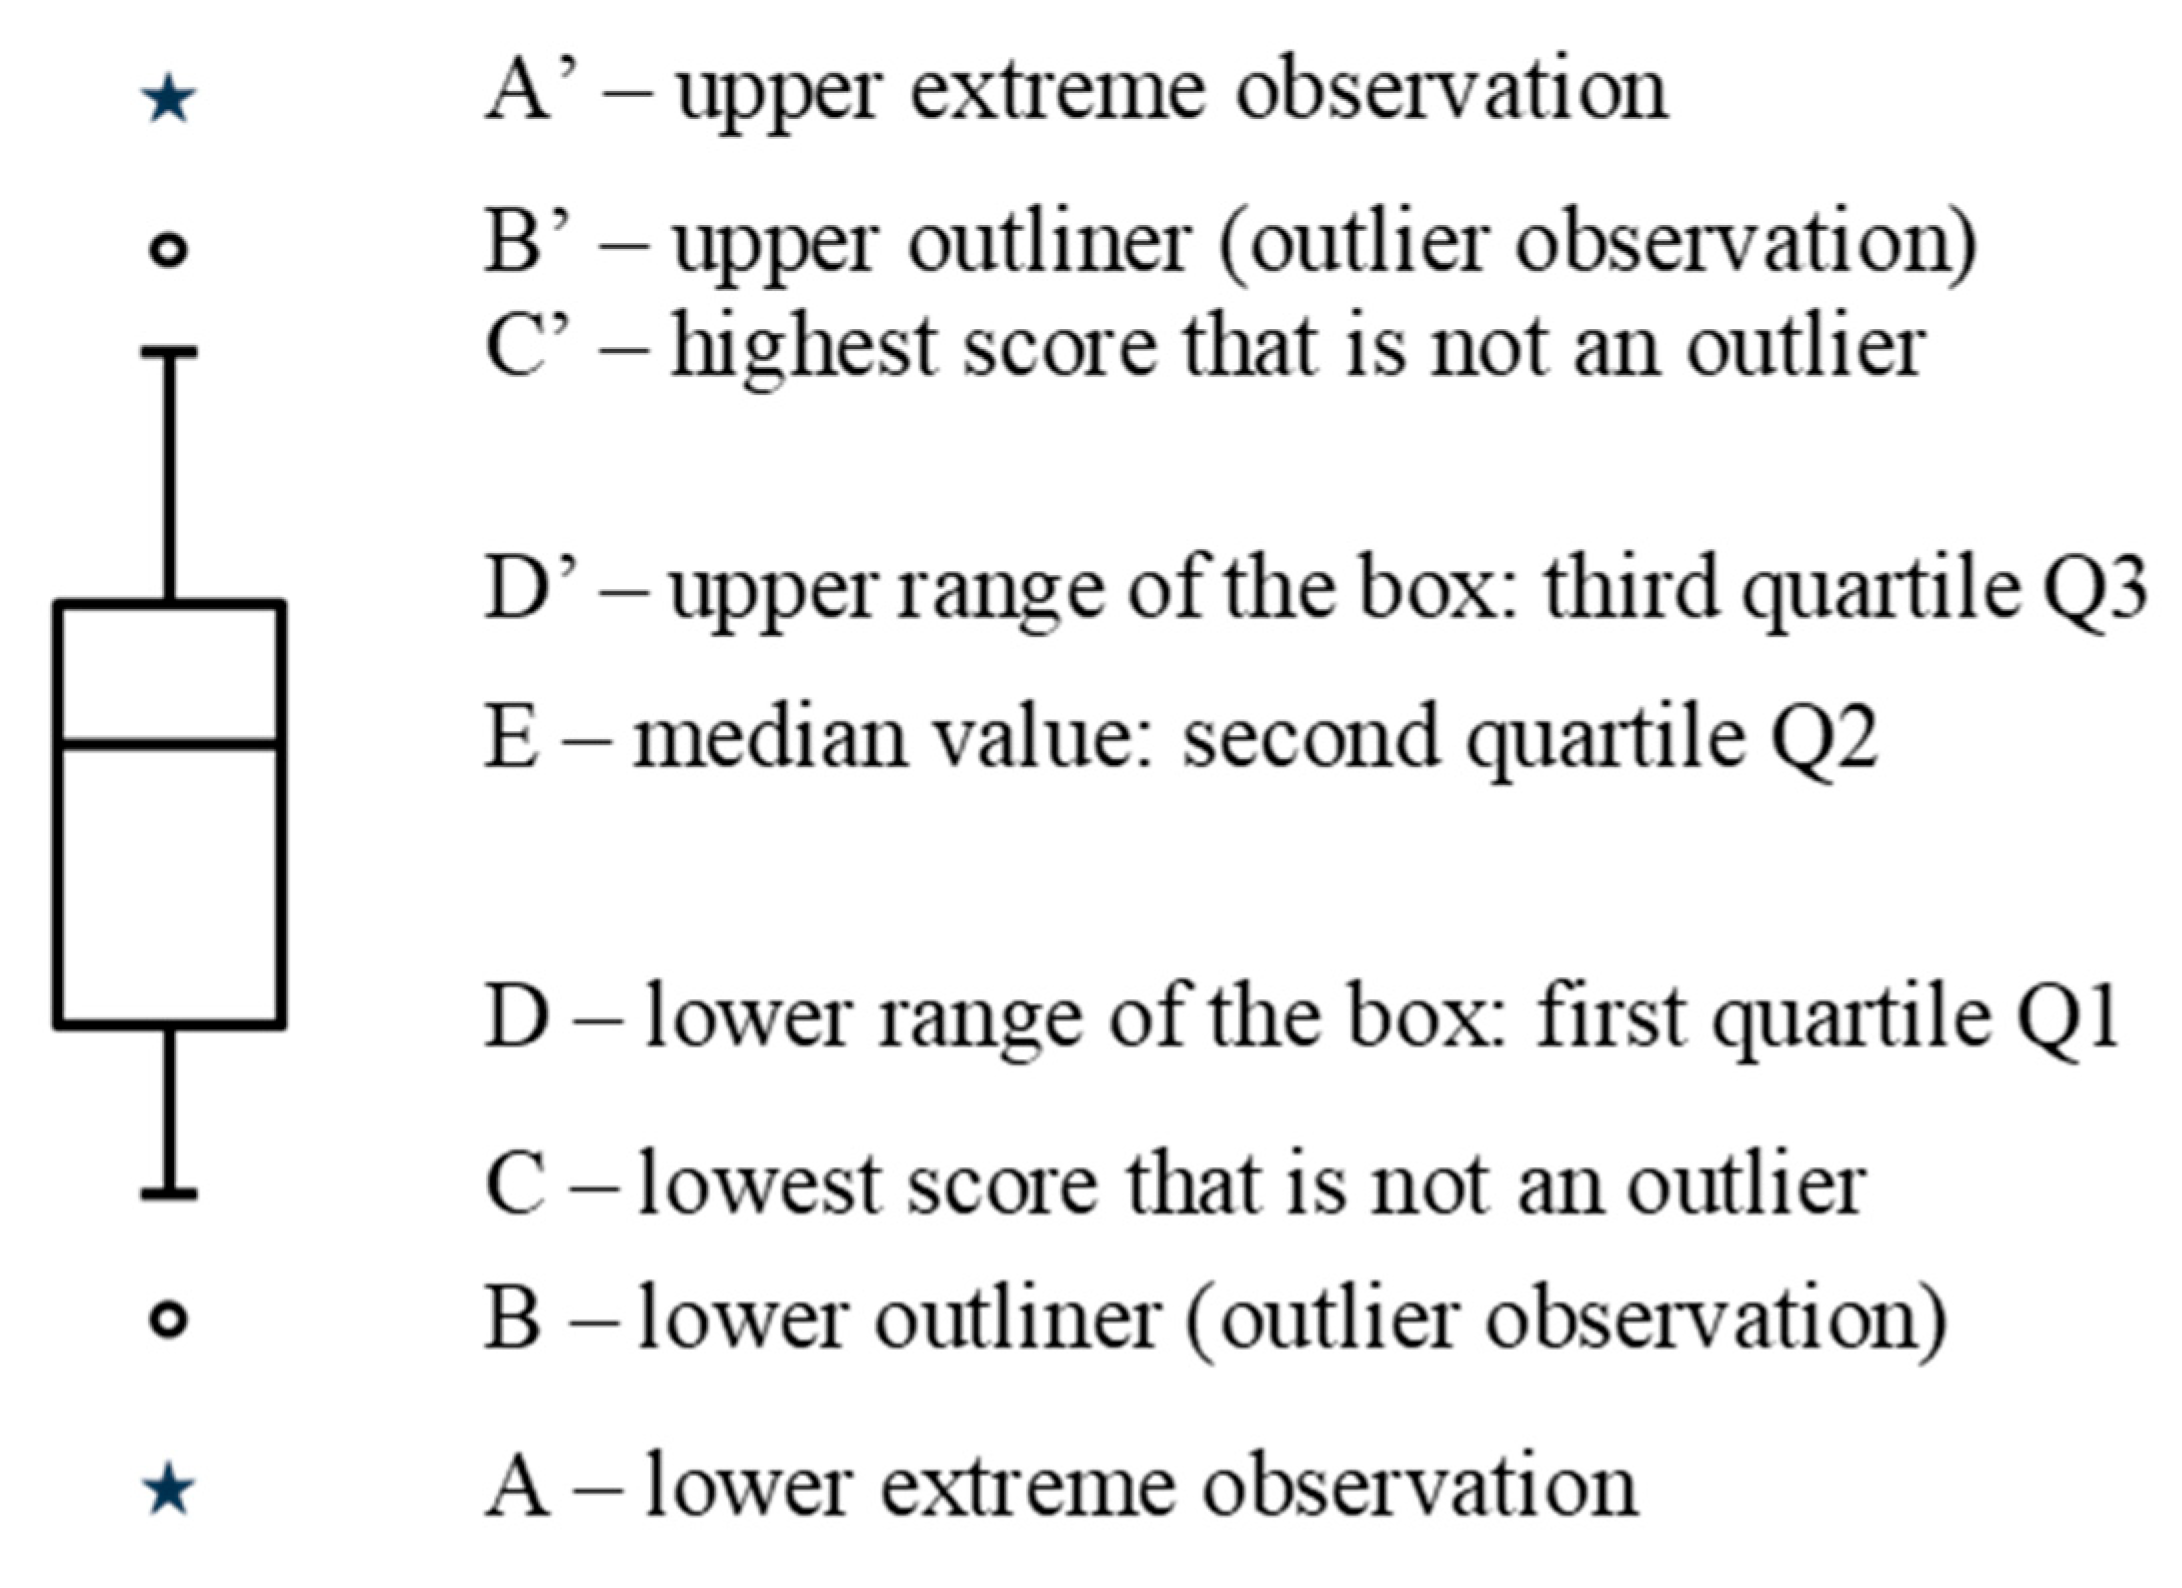
3.3. Analysis of the Relationship Between Planned Cost and Actual Cost in the Context of Financial Contingency

The value of the financial contingency, which was set at 3% by the bank crediting construction projects, refers to the amount of the total planned cost of the investment. It was, therefore, reasonable to examine how the cost performance index (CPI) values determined at the end of the investment were distributed as a derivative of the planned cost and the cost actually incurred during implementation. Box plots resulting from the analysis are shown in Figure 12.
The individual charts show the values of the ratio of the planned cost and the cost actually incurred for the implementation of projects in each group of facilities. In order to more easily refer to the level of the financial contingency, the chart shows its level as a value of 0.97 with a red horizontal line.
In the chart, it was observed that in each group of projects, there was an overspending of the planned investment cost. Exceedances of the financial contingency were found in projects in the groups of residential buildings (M), office buildings (O), hotel buildings (H) and shopping centres (G). Only in the case of the group of logistics centres (L), despite exceeding the planned cost, the actual cost was kept within the reserve. Analyzing the box plots in each group of projects, there was a wide variation in the values obtained in the group of office buildings (O), hotel buildings (H) and shopping centres (G). There was little variation in the ranges of values between projects in the group of residential buildings (M) and the group of logistics centres (L).
Based on the observation of the relationship between planned cost and actual cost in the studied groups of projects presented in the form of box charts, the following conclusions were made:
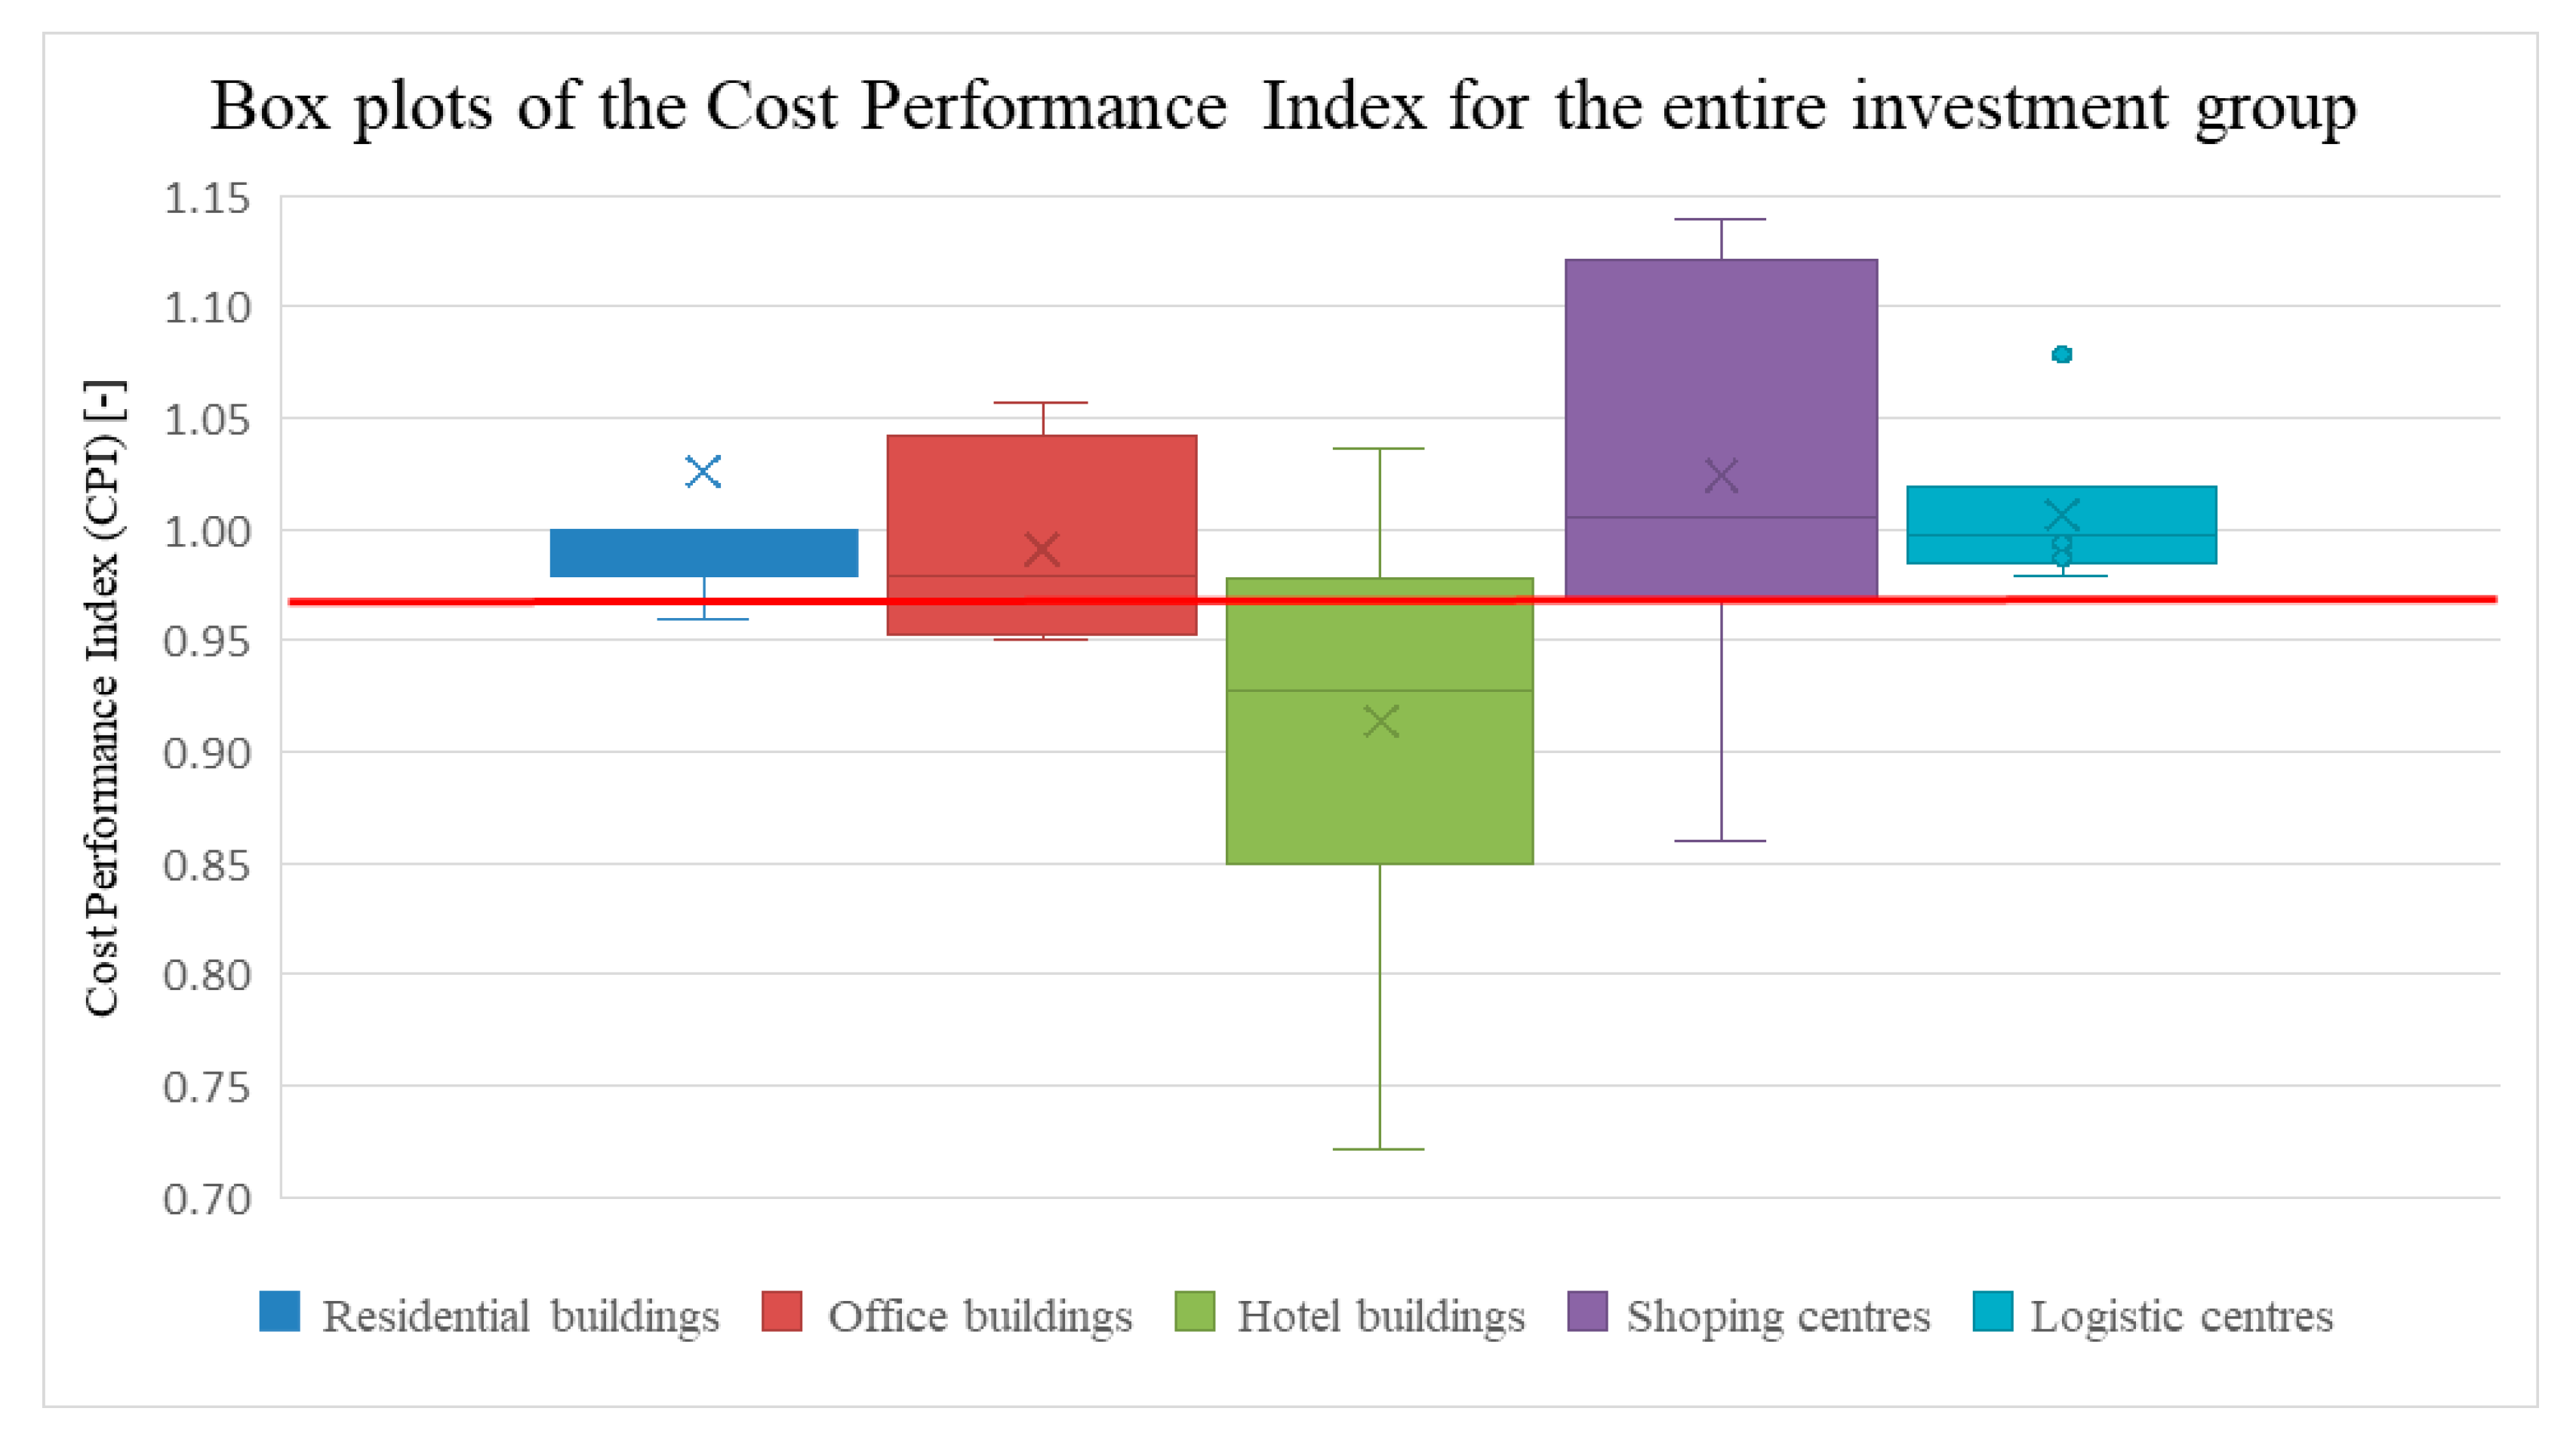
  • Despite the slight variation in CPI, outliers were observed in the groups of residential buildings (M) and logistics centres (L), indicating the possibility of projects in which the actual cost differs significantly from the planned cost. As these values approach the level of the financial contingency, the real possibility of exceeding it emerges;
  • The compact range of CPI values with no outliers, as seen in the group of office buildings (O), indicates a stable range of observed deviations of actual cost from planned cost, and a low probability of values significantly deviating from the range contained between quartiles Q1 and Q3;
  • The breadth of the range of CPI values observed in the groups of hotel buildings (H) and shopping centres (G) shows high variability, as evidenced by the height of the boxes in the graphs for these groups of facilities. Both groups were also found to have maximum and minimum values that significantly deviate from the box. This allows us to assume that there may be projects in which the actual cost exceeds not only the planned cost, but also the value of the budget provision.

4. Summary and Discussion

The selection of the research sample resulted from the specificity of measuring the implementation parameters and processing the research data, which made it impossible to freely choose construction projects. The presence of these projects in the research sample is the result of commercially obtained orders. The collected data formed a closed set, including 41 construction projects, which consisted of a total of 547 measurements. The typological division into residential buildings, office buildings, hotels, shopping centres and logistics centres, due to their affiliation to specific typological groups, resulted in a differentiated number of objects, and thus the number of measurements, in individual groups. The consequence of this division, despite random selection, was the loss of full representativeness in the research sample due to its small size. Other requirements, such as population structure mapping, random selection and no bias of selection, ensured that the sample maintained high data quality. The resulting quality of the data is acceptable and sufficient to support the conduct and conclusion.
Analysis of the variability of the CPI cost overrun rate for a variety of construction projects was performed using a box plot tool, both within separate groups and between individual projects. This is evidenced by the shape of the box charts, characterised by high variability, and their positioning relative to the horizontal axis, indicating the magnitude of exceedances.
The benchmark for the developed graphs of cost overspending represented by the CPI is the financial contingency, considered as an acceptable cost overrun. The size of this reserve is set by the banks and is 3% of the cost of the entire investment. Therefore, in this analysis, it should be interpreted as a range of excess values [0.97, 1].
Table 2 shows the aggregate results obtained from the analysis of the final CPI values in each group of facilities, indicating the extreme values of deviations and the values obtained in the first and third quartiles.
The minimum values included in Table 3 reflect the largest cost overspending against planned values in each of the analyzed typological groups. The maximum values indicate deviations of the actual cost in the direction of savings.
In the four groups of projects studied, residential buildings (M), office buildings (O), hotel buildings (H) and shopping centres (G), there were cases in which cost overruns were greater than the financial contingency set by the banks. The exception is the group of logistics centres (G), where the total cost of projects was maintained at an overrun of less than 3%.
A high irregularity in the cost overspending of individual investments was observed in all the groups studied and is evident in the different shape of the graphs representing them. This is evidenced by the height of the boxes, which represent CPI values just from the Q1–Q3 range. Even in cases of investments where the cost was kept in financial contingency, a varying spread of CPI values is observed. This fact leaves uncertainty in forecasting the cumulative cost of investments.
Also, when analyzing the final values of the indicator, a wide variation in the width of the value ranges was observed in each group of projects, resulting in a variable size of deviations from the planned cost and the financial contingency.
Given the magnitude of the excess of the financial contingency, occurring in the group of residential buildings (M), amounting to 0.96, and the presence of outliers, it is recommended to increase the financial contingency to 5% of the investment cost. This will allow financially secure completion of the project, taking into account the possibility of cost overruns, falling within the updated financial contingency.
Increasing the financial contingency to the level of 5% of the project value is also recommended for the group of office buildings (O). Despite exceeding the financial contingency and obtaining a CPI value of 0.95 (5% deviation from the planned cost), it was assumed that in the analyzed group of projects, given the width of the range and the absence of CPI outliers, major overspending would not occur.
The group of hotel buildings (H) is characterized by having the largest number of projects that exceeded the 3% financial contingency. The lowest recorded whisker value and the bottom value of the Q1 box were 0.72 and 0.85, respectively, indicating the wide range of CPI values in this group of projects. Therefore, for this group of construction projects, it is recommended that the financial contingency be increased to as much as 30% of the cost of the entire investment. This will ensure secure financing for a group of projects that are characterized by frequent changes in scope during the implementation stage.
In the group that includes shopping centres (G), a wide variation was observed in the course of individual projects. Approximately 30% of the projects had overruns exceeding the 3% financial contingency. The value of the lower whisker was 0.86, which means that the planned cost was exceeded by about 26%. Accordingly, the financial contingency is recommended to be increased to 25% for this group as well.
The values of the financial contingency recommended for hotel buildings (H) and shopping centres (G) are due to the high susceptibility of the projects included in these groups to changes in scope during their course, which is clearly visible in the box plots in the form of high box heights and high whisker lengths. The main reason for such a wide range of cost deviation and linked financial contingency is the huge input of investors’ own technology, like branding, common areas, lobbies, halls, malls, etc., which is prone to follow the tastes of customers.
Investments belonging to the logistics centres group (L) did not show cost overspending that would result in exceeding the financial contingency set by the bank. The majority of projects showed no cost deviations, while one project showed significant deviations in CPI values. However, this did not result in exceeding the level of 0.97. Therefore, it is recommended to maintain the financial contingency at the current level.
The proposed financial contingency level for each group of facilities is included in tabular form (Table 4).
Using a tool in the form of box plots, cost deviations from the planned value were analyzed. The study was conducted for each of the identified groups of facilities to determine the level of acceptable deviation within the financial contingency range. As a result, an increase in the financial contingency was recommended to guarantee the safe completion of investments in the event of cost overruns in selected groups of construction projects.
A cost overrun is a situation in which the actual cost of implementing a construction project is higher than the planned cost. Most authors have argued that in most construction projects, actual costs increase similarly to planned costs [13,31] and this phenomenon has become almost a natural part of construction projects. Discrepancies between planned and actual costs have negative effects and financial consequences for the public and private sectors, but also economic consequences for the construction industry as a whole.
Inaccurate cost estimates at the planning stage of a construction project, i.e., during budgeting and scoping of the task, and inadequate planning of the investment process is one of the most frequently discussed causes of cost overspending in the literature [32]. Other causes of cost overruns include design errors, deficiencies in design documentation leading to design changes [33,34,35,36,37], unrealistic duration of construction work [17], lack of availability of skilled labour [38], lack of qualified management [39], lack of effective coordination between participants in the investment process [40], inexperience of construction contractors [41] and variable weather conditions [42].
Using a different approach for the subject of cost overspending, the authors [43] studied one of the cost components of construction projects, which is labour. They found that the labour cost rates depend on the market situation and on large construction companies often using subcontractors with lower labour costs. This reduces the costs associated with labour, thus contributing to a reduction in the aggregate overruns created during the course of the project.
Cost overruns have a significant impact on a multitude of factors related to construction production, including the profitability of those carrying out construction work. In the article [44], an economic analysis of construction site disruption was carried out. The earned value method (EVM) were used, and the cost and rate of completion were evaluated. The economic analysis was aimed at assessing the profitability of continuing work on the construction site as a result of underestimating the cost of construction work, resulting in cost overspending.
As can be seen, many of the cited researchers have explored the causes of cost overruns of selected investment tasks in their studies, but these studies have not led to the determination of current balanced financial contingency, understood as the boundary and acceptable ranges of cost variation in a credited construction project.
The results of the study of five typologically different groups of construction projects presented in the article provide a solid basis for further analysis, the purpose of which will be to deepen knowledge of the factors affecting cost and schedule deviations in construction projects. Thus, taking the causality of the resulting cost and schedule deviations into account is planned, which will make it possible to obtain a more reliable projection of the course of construction projects.
Further research work must have a practical, applied dimension, and will therefore go in the direction of determining the real financial contingency of banks financing various investments.
Continuing the study of the parameters of the cost and time of new investment tasks is a long-term process and a complex cognitive challenge, but it is necessary to obtain a quantitatively larger, and thus more representative, research sample for full statistical inference for selected typological groups and the extrapolation of the results to the wider field of construction.

Author Contributions

Conceptualization, T.S., M.S. and J.K.; methodology, T.S., M.S. and J.K.; software, T.S.; validation, J.K.; formal analysis, M.S.; investigation, T.S. and M.S.; resources, T.S., M.S. and J.K.; data curation, T.S. and M.S.; writing—original draft preparation, T.S. and J.K. writing—review and editing, M.S. and J.K.; visualization, T.S.; supervision, J.K.; project administration, T.S. All authors have read and agreed to the published version of the manuscript.

Funding

This research received no external funding.

Institutional Review Board Statement

Not applicable.

Informed Consent Statement

Not applicable.

Data Availability Statement

The data presented in this study are available in the article.

Conflicts of Interest

The authors declare no conflicts of interest.

References

  1. Tijanić, K.; Car-Pušić, D. Application of S-Curve in EVA Method. In Proceedings of the 13th International Conference “Organization, Technology and Management in Construction”, Poreč, Croatia, 27–30 September 2017; pp. 103–115. [Google Scholar]
  2. Project Management Institute. A Guide to the Project Management Body of Knowledge (PMBOK Guide), 6th ed.; Project Management Institute (PMI): Newtown Square, PA, USA, 2017; ISBN 9781935589679. [Google Scholar]
  3. IPMA. IPMA Individual Competence Baseline; IPMA: Lisboa, Portugal, 2015. [Google Scholar]
  4. Abba, W.F. How Earned Value Got to Primetime: A Short Look Back and Glance Ahead. In Proceedings of the Project Management Institute Annual Seminars & Symposium, Houston, TX, USA, 7–16 September 2000; Project Management Institute (PMI): Houston, TX, USA, 2000. [Google Scholar]
  5. De Marco, A.; Narbaev, T. Earned Value-Based Performance Monitoring of Facility Construction Projects. J. Facil. Manag. 2013, 11, 69–80. [Google Scholar] [CrossRef]
  6. Zohoori, B.; Verbraeck, A.; Bagherpour, M.; Khakdaman, M. Monitoring Production Time and Cost Performance by Combining Earned Value Analysis and Adaptive Fuzzy Control. Comput. Ind. Eng. 2019, 127, 805–821. [Google Scholar] [CrossRef]
  7. Chen, H.L.; Chen, W.T.; Lin, Y.L. Earned Value Project Management: Improving the Predictive Power of Planned Value. Int. J. Proj. Manag. 2016, 34, 22–29. [Google Scholar] [CrossRef]
  8. Bhosekar, S.K.; Vyas, G. Cost Controlling Using Earned Value Analysis in Construction Industries. Int. J. Eng. Innov. Technol. 2012, 1, 324–332. [Google Scholar]
  9. Waris, M.; Khamidi, M.F.; Idrus, A. The Cost Monitoring of Construction Projects through Earned Value Analysis. J. Constr. Eng. Proj. Manag. 2012, 2, 42–45. [Google Scholar] [CrossRef]
  10. Szóstak, M.; Stachoń, T.; Konior, J. Course of Cumulative Cost Curve (CCCC) as a Method of CAPEX Prediction in Selected Construction Projects. Appl. Sci. 2024, 14, 5597. [Google Scholar] [CrossRef]
  11. Ballesteros-Pérez, P.; Sanz-Ablanedo, E.; Soetanto, R.; González-Cruz, M.C.; Larsen, G.D.; Cerezo-Narváez, A. Duration and Cost Variability of Construction Activities: An Empirical Study. J. Constr. Eng. Manag. 2020, 146, 04019093. [Google Scholar] [CrossRef]
  12. Przywara, D.; Rak, A. Monitoring of Time and Cost Variances of Schedule Using Simple Earned Value Method Indicators. Appl. Sci. 2021, 11, 1357. [Google Scholar] [CrossRef]
  13. Plebankiewicz, E. Model of Predicting Cost Overrun in Construction Projects. Sustainability 2018, 10, 4387. [Google Scholar] [CrossRef]
  14. Konior, J.; Szóstak, M. The S-Curve as a Tool for Planning and Controlling of Construction Process-Case Study. Appl. Sci. 2020, 10, 2071. [Google Scholar] [CrossRef]
  15. Konior, J. Monitoring of Construction Projects Feasibility by Bank Investment Supervision Approach. Civ. Eng. Archit. 2019, 7, 31–35. [Google Scholar] [CrossRef]
  16. Shah, F.H.; Bhatti, O.S.; Ahmed, S. A Review of the Effects of Project Management Practices on Cost Overrun in Construction Projects †. Eng. Proc. 2023, 44, 1. [Google Scholar] [CrossRef]
  17. Gunduz, M.; Maki, O.L. Assessing the Risk Perception of Cost Overrun through Importance Rating. Technol. Econ. Dev. Econ. 2018, 24, 1829–1844. [Google Scholar] [CrossRef]
  18. Daoud, A.O.; El Hefnawy, M.; Wefki, H. Investigation of Critical Factors Affecting Cost Overruns and Delays in Egyptian Megaconstruction Projects. Alex. Eng. J. 2023, 83, 326–334. [Google Scholar] [CrossRef]
  19. Wang, Y.; Ghazali, F.E.M. Effective Control Measures to Minimize Cost Overrun during Construction Phase of High-Rise Residential Building Projects in Chongqing, China. Arch. Civ. Eng. 2023, 69, 79–94. [Google Scholar] [CrossRef]
  20. Sheamar, S.; Wedawatta, G.; Tennakoon, M.; Palliyaguru, R.; Antwi-Afari, M.F. The Potential of New Models of Construction Procurement to Counter Cost Overruns in Construction Projects: An Exploratory Study from a Contractors’ Perspective. J. Financ. Manag. Prop. Constr. 2024, 29, 211–228. [Google Scholar] [CrossRef]
  21. Ammar, T.; Abdel-Monem, M.; El-Dash, K. Risk Factors Causing Cost Overruns in Road Networks. Ain Shams Eng. J. 2022, 13, 101720. [Google Scholar] [CrossRef]
  22. Sharma, S.; Gupta, A.K. Analysis of Factors Affecting Cost and Time Overruns in Construction Projects. In Advances in Geotechnics and Structural Engineering: Select Proceedings of TRACE 2020; Lecture Notes in Civil Engineering; Springer: Singapore, 2021; Volume 143, ISBN 9789813369689. [Google Scholar]
  23. Alhammadi, Y.; Al-Mohammad, M.S.; Rahman, R.A. Modeling the Causes and Mitigation Measures for Cost Overruns in Building Construction: The Case of Higher Education Projects. Buildings 2024, 14, 487. [Google Scholar] [CrossRef]
  24. Memon, A.H.; Rahman, I.A.; Aziz, A.A.A. Study of Causative Factors of Cost Overrun in Large Projects of Southern Part of Peninsular Malaysia. In Proceedings of the 26th International Business Information Management Association Conference—Innovation Management and Sustainable Economic Competitive Advantage: From Regional Development to Global Growth, IBIMA 2015, Madrid, Spain, 11–12 November 2015; pp. 3580–3592. [Google Scholar]
  25. Ezeldin, A.S.; Ali, G.G. Cash Flow Optimization for Construction Portfolios. In Proceedings of the International Conference on Sustainable Infrastructure 2017: Policy, Finance, and Education, New York, NY, USA, 26–28 October 2017; pp. 26–37. [Google Scholar]
  26. Konior, J. Mitigation of correlated risk in construction projects. Civ. Eng. Archit. 2019, 7, 17–22. [Google Scholar] [CrossRef]
  27. Konior, J.; Szóstak, M. Time and Cost Variance of Construction Projects Monitored by Bank Investment Supervision. In International Scientific Conference Environmental Challenges in Civil Engineering; Springer International Publishing: Berlin/Heidelberg, Germany, 2021; Volume 122, ISBN 9783030638788. [Google Scholar]
  28. PM Group. Polska sp. z o.o. 2006–2015 and 3EPCM sp. z o.o. 2016–2024. “Initial, Monthly, Close-out Reporting of Bank Investment Supervision”.
  29. Regulation of the Council of Ministers of 30 December 1999 on the Polish Classification of Building Structures (PKOB) (Decree from 1999 r. No 112, Item. 1316). Available online: https://isap.sejm.gov.pl/isap.nsf/DocDetails.xsp?id=WDU19991121316 (accessed on 20 February 2025).
  30. Wickham, H.; Stryjewski, L. 40 Years of Boxplots. Had.Co.Nz 2011. Available online: https://vita.had.co.nz/papers/boxplots.pdf (accessed on 20 February 2025).
  31. Karunakaran, P.; Abdullah, A.H.; Nagapan, S.; Sohu, S.; Kasvar, K.K. Categorization of Potential Project Cost Overrun Factors in Construction Industry. IOP Conf. Ser. Earth Environ. Sci. 2018, 140, 012098. [Google Scholar] [CrossRef]
  32. Asiedu, R.O.; Adaku, E. Cost Overruns of Public Sector Construction Projects: A Developing Country Perspective. Int. J. Manag. Proj. Bus. 2020, 13, 66–84. [Google Scholar] [CrossRef]
  33. Larsen, J.K.; Shen, G.Q.; Lindhard, S.M.; Brunoe, T.D. Factors Affecting Schedule Delay, Cost Overrun, and Quality Level in Public Construction Projects. J. Manag. Eng. 2016, 32, 04015032. [Google Scholar] [CrossRef]
  34. Han, S.; Love, P.; Peña-Mora, F. A System Dynamics Model for Assessing the Impacts of Design Errors in Construction Projects. Math. Comput. Model. 2013, 57, 2044–2053. [Google Scholar] [CrossRef]
  35. Love, P.E.D.; Edwards, D.J.; Irani, Z.; Walker, D.H.T. Project Pathogens: The Anatomy of Omission Errors in Construction and Resource Engineering Project. IEEE Trans. Eng. Manag. 2009, 56, 425–435. [Google Scholar] [CrossRef]
  36. Polat, G.; Okay, F.; Eray, E. Factors Affecting Cost Overruns in Micro-Scaled Construction Companies. Procedia Eng. 2014, 85, 428–435. [Google Scholar] [CrossRef]
  37. Aslam, M.; Baffoe-Twum, E.; Saleem, F. Design Changes in Construction Projects—Causes and Impact on the Cost. Civ. Eng. J. 2019, 5, 1647–1655. [Google Scholar] [CrossRef]
  38. Derakhshanalavijeh, R.; Teixeira, J.M.C. Cost Overrun in Construction Projects in Developing Countries, Gas-Oil Industry of Iran as a Case Study. J. Civ. Eng. Manag. 2017, 23, 125–136. [Google Scholar] [CrossRef]
  39. Alhammadi, A.S.A.M.; Memon, A.H. Ranking of the Factors Causing Cost Overrun in Infrastructural Projects of Uae. Int. J. Sustain. Constr. Eng. Technol. 2020, 11, 204–211. [Google Scholar] [CrossRef]
  40. Yap, J.B.H.; Skitmore, M. Ameliorating Time and Cost Control with Project Learning and Communication Management: Leveraging on Reusable Knowledge Assets. Int. J. Manag. Proj. Bus. 2020, 13, 767–792. [Google Scholar] [CrossRef]
  41. Amusan, L.M.; Afolabi, A.; Ojelabi, R.; Omuh, I.; Okagbue, H.I. Data Exploration on Factors That Influences Construction Cost and Time Performance on Construction Project Sites. Data Brief 2018, 17, 1320–1325. [Google Scholar] [CrossRef]
  42. Senouci, A.B.; Mubarak, S.A. Multiobjective Optimization Model for Scheduling of Construction Projects under Extreme Weather. J. Civ. Eng. Manag. 2016, 22, 373–381. [Google Scholar] [CrossRef]
  43. Przywara, D.; Rak, A. Analysis Construction Industry on the Basis of Price Trends of Labor Cost. In Proceedings of the MATEC Web of Conferences, Bandung, Indonesia, 18 April 2018; Volume 174. [Google Scholar]
  44. Przywara, D.; Rak, A. Economic Conditions of Leaving the Construction Site by the Contractor at Different Stages of Its Implementation. In Environmental Challenges in Civil Engineering II; Lecture Notes in Civil Engineering; Springer: Cham, Switzerland, 2023; Volume 322. [Google Scholar]
Figure 1. Graphical interpretation of the box plot [30].
Applsci 15 04445 g001
Figure 2. Variability in the execution rate of the cost of investment in the group of residential buildings (M).
Applsci 15 04445 g002
Figure 3. Variability of the execution rate of the cost of investment in the group of office building group (O).
Applsci 15 04445 g003
Figure 4. Variability of the execution rate of the cost of investment in the group of hotel buildings (H).
Applsci 15 04445 g004
Figure 5. Variability of the execution rate of the cost of investment in the shopping centre group (G).
Applsci 15 04445 g005
Figure 6. Variability of the execution rate of the cost of investment in the group of logistics centres (L).
Applsci 15 04445 g006
Figure 7. Box plots for the residential building group (M). Dots in the figure are individual measurements.
Applsci 15 04445 g007
Figure 8. Box plots for the office building group (O). Dots in the figure are individual measurements.
Applsci 15 04445 g008
Figure 9. Box plots for the hotel buildings (H).
Applsci 15 04445 g009
Figure 10. Box plots for the shopping centres (G).
Applsci 15 04445 g010
Figure 11. Box plots for the logistics centres (L).
Applsci 15 04445 g011
Figure 12. Box plots of the budget performance index (CPI) of the entire investment group for the projects included in each object group (M, O, H, G and L).
Applsci 15 04445 g012
Table 1. Division of the construction projects included in the research sample into typological groups along with the number of measurements taken.
CategoryTypological GroupSymbol
According to PKOB
Measurement
Period
Number of
Construction
Projects
Number of
Measurements
MResidential buildings11302006–202114218
OOffice buildings12202008–2021469
HHotels12112013–20209110
GShopping centres12302008–20188113
LLogistics centres12522017–2024637
Sum41547
Table 2. Summary of selected values of CPI cost deviations in each typological group for projects in which the financial contingency was exceeded.
CategoryTypological GroupBottom Whisker ValueQuartile Q1
Median
Quartile Q3
Median
Top Whisker Value
MResidential buildings0.960.981.001.03
OOffice buildings0.950.951.041.06
HHotels0.720.850.981.04
GShopping centres0.860.971.121.14
LLogistics centres0.980.991.021.08
Table 3. Summary of recommended financial contingency values for each typological group.
CategoryTypological GroupBottom Whisker ValueQuartile Q1
Median
Quartile Q3
Median
Top Whisker Value
MResidential buildings0.960.981.001.03
OOffice buildings0.950.951.041.06
HHotels0.720.850.981.04
GShopping centres0.860.971.121.14
LLogistics centres0.980.991.021.08
Table 4. Recommended level of financial contingency values for each typological group.
CategoryTypological GroupExisting Level of Financial
Contingency
Recommended Level of
Financial Contingency
MResidential buildings3%5%
OOffice buildings3%5%
HHotels3%30%
GShopping centres3%25%
LLogistics centres3%3%
Disclaimer/Publisher’s Note: The statements, opinions and data contained in all publications are solely those of the individual author(s) and contributor(s) and not of MDPI and/or the editor(s). MDPI and/or the editor(s) disclaim responsibility for any injury to people or property resulting from any ideas, methods, instructions or products referred to in the content.

