Article

The Influence of Different Cooking Techniques on the Biochemical, Microbiological, and Sensorial Profile of Fish-Based Catering Products

by
Adrian Măzărel
1,
Raluca-Ștefania Rădoi-Encea
2,*,
Vasile Pădureanu
1,*,
Alina Maier
1 and
Florentina Matei
1,2
1
Faculty of Food Industry and Tourism, Transilvania University of Brașov, 148 Castelului St., 500014 Brașov, Romania
2
Faculty of Biotechnologies, University of Agronomic Sciences and Veterinary Medicine Bucharest, 59 Mărăști Blvd., District 1, 011464 Bucharest, Romania
*
Authors to whom correspondence should be addressed.
Appl. Sci. 2025, 15(8), 4417; https://doi.org/10.3390/app15084417
Submission received: 13 March 2025 / Revised: 14 April 2025 / Accepted: 15 April 2025 / Published: 17 April 2025
(This article belongs to the Special Issue Biosystems Engineering: Latest Advances and Prospects)

Abstract

:
The present study aims to characterize five fish-based catering dishes, cooked by sous vide, by convection and microwaves in terms of their biochemical content, microbial load, and sensory analysis. The product cooked by using convection had the highest levels of MUFAs, PUFAs, and SFAs and the lowest levels of vitamin PP, riboflavin, and niacin. The sous vide maintained the highest levels of retinol, tocopherol, riboflavin, and niacin. Microwaves triggered the greatest decrease in vitamin content. All microbiological indicators exhibited levels below the acceptable limits, except for the level of fungi in the sous vide cooked product. Shelf life was estimated at 5 days for the product cooked by convection and immediately refrigerated and at 50 days for the product cooked by convection and immediately frozen. The most appreciated product from the sensory standpoint, which falls under fine dining, was the one cooked by convection and served immediately. The sous vide dish, the microwaved dish, and those refrigerated/frozen after cooking were undervalued.

1. Introduction

Nutrition is a vital issue for the sustainability of humankind. In the context of recent social and economic changes, in the aftermath of the SARS-CoV-2 pandemic, food service providers, including bars and restaurants, have diversified and intensified their catering services and widened the range of quality products that meet the needs of consumers [1,2,3].
Traditionally, in the hospitality industry, especially in fine dining, the taste and aesthetic criteria, such as the outer and inner aspects of the final product or the color harmony and intensity obtained using specific techniques or plating styles, have been taking precedence over other quality indicators [1]. Among other factors such as price, accessibility, or safety issues, the catering consumers’ choice for such a service also depends on the type of dishes and their variety. From vegetables to meat and fish, there are so many kinds of foods with different nutritional value; nevertheless, meat and meat products play a key role in a well-balanced diet.
The nutritional quality of food supplied by the catering industry is of particular interest, as these foods may account for a significant proportion of daily food intake and even the total intake of the population [4]. Three main parameters influence the nutritional quality of food preparation: the choice of raw materials, the recipe and composition of a meal, and the preparation process [4,5]. Considering the diverse cooking methods, it is necessary to explore the impact of such different methods on nutritional components in order to determine the differences between the calculated value and the measured value of nutritional components in catering food and to identify the correction factors for the effects of these cooking methods [4]. In catering systems, the temperature and time history during preparation and distribution, i.e., systems like cook–chill, cook–freeze, or warm-holding, require particular attention with regard to some sensitive nutrients, e.g., vitamins C and B1 and folic acid. If the main parameters and influencing factors as described are taken into account, it should not be difficult to produce food with high nutritional quality in catering.
Over the past decade, fish and seafood consumption has been increasing in the catering industry, especially in fine dining [6]. One of the reasons is that fish and seafood availability has become more diverse, ranging from wild-caught to farm-raised; moreover, their production volumes have increased significantly [7]. From a nutritional point of view, the biochemical composition of fish provides multiple much-needed substances in the human diet, such as omega-3 polyunsaturated fatty acids [8,9,10], especially eicosapentaenoic acid, EPA (C20:5 ω-3), docosapentaenoic acid, DPA (C22:5 ω-3), docosahexaenoic acid, and DHA (C22:6 ω-3) [11,12,13]. EPA, DPA, and DHA can prevent serious diseases/conditions such as high blood pressure, tumors, and brain function failure [11,12]. Omega-3 fatty acids, both n3-MUFAs (omega-3 monounsaturated fatty acids) and n3-PUFAs (omega-3 polyunsaturated fatty acids), support the functioning of the central nervous system. PUFAs are also involved in cell membranes’ structural integrity and inflammatory responses [14]. Also, fish contain hydro-soluble vitamins, such as thiamine (B1) [15], riboflavin (B2) [16], niacin (B3 or PP) [15], cobalamin (B12) [17], and fat-soluble vitamins, such as retinol (A) [15], cholecalciferol (D3) [18], and tocopherol (E) [16].
To meet consumers’ needs, catering companies need to diversify their techniques of processing raw materials. Food processing is usually correlated with changes in shape, sensory properties, and preservation capacity, different types of heat treatment, or the application of modern catering production systems modifying the structure of molecules, ensuring distinct physicochemical properties of the finished products and preventing nutrient losses [19]. Generally, catering production involves production systems that involve traditional cooking, namely, cook–serve (CS), cook–chill (CC), and cook–freeze (CF). In order to preserve the products’ nutritional and sensory qualities while also ensuring food safety, sous vide technology is often employed for culinary dishes [20], including fish products [13].
Beyond the nutritional value of raw materials, for the catering industry, it is important to have a clear image of the nutritional advantages brought by different production systems and thermal treatments. The present study aims to conduct the characterization of fish-based catering products cooked using different techniques (sous vide cooking—cook–serve, convective cooking—cook–serve, microwave cooking—cook–serve, convective cooking—cook–chill, and convective cooking—cook–freeze), from a nutritive/biochemical point of view, as well as from a sensorial perspective, in a microbiological safety context. To establish the advantages of such techniques, the processing losses were analyzed, as well as vitamin retention, macronutrient values, correlated with the final product innocuity, and its sensorial profile.

2. Materials and Methods

2.1. Selected Fish Products and Applied Culinary Treatments

This study targeted five catering products derived from a fish-based dish, with each of them obtained with a different cooking technique. The differentiation consisted of both the heat treatment, where the behavior of the products and the transformations related to convective baking (traditional method) and microwave baking (unconventional method) were analyzed, and the use of catering production systems. The behavior of the products was examined comparatively by applying not only the classic cook–serve production system but also the cook–chill and cook–freeze systems.
The fish dishes were presented as rolls, made of 42% fresh salmon fillets (Salmo salar) and 38% fresh carp fillets (Cyprinus carpio), with 13% vegetables (frozen carrots, fresh tomatoes, green parsley, and garlic), and 2% heavy cream and condiments (sunflower oil, paprika powder, salt, and white pepper). After quality control, ingredient dosing, and preliminary operations, the products were shaped into a cylindrical roll, obtained by overlapping the two types of fish with one another. The rolls were covered with breading made of finely chopped fish, mixed with brunoise chopped vegetables, heavy cream, and condiments.
The raw materials were purchased in a refrigerated state (2–4 °C), respecting the pre-set parameters of the cold chain and the company’s technical specifications. Culinary production was carried out in equipped, monitored production spaces, for which there is an integrated food quality and safety management system (QMS), certified according to ISO 9001:2015 [21] and ISO 22000:2018 [22]. The QMS ensures the safety of culinary products and superior, controlled quality (sensory, nutritional, technological, ecological, and symbolic value) [23].
The implemented hygiene programs ensured the sanitation of work surfaces, dishes, and utensils. Hygiene monitoring was carried out with a certified SystemSURE Plus device for measuring the level of surface contamination (Hygiena International, Watford, UK).

2.2. Experimental Concept and Sampling

The tested culinary product was then subjected to 5 different cooking methods, as presented in Table 1, namely: sous vide cooking—cook–serve, convective cooking—cook–serve, microwave cooking—cook–serve, convective cooking—cook–chill, and convective cooking—cook–freeze.

Sample Preparation

To limit physical, chemical, and microbiological transformations that could generate nutrient losses, the catering products were cooled down immediately to a temperature of +4 °C after thermal regeneration (which actually coincides with their consumption). Sampling was performed carefully, eliminating the possibility of contamination, and the samples were transported to the laboratory under safe and controlled conditions. The temperature during the samples’ transport was maintained at +4 °C.
Sample A0 was taken on the day of processing, representing the non-thermally treated catering products, which underwent preliminary operations according to the product sheet. Samples A1, A2, and A3 were taken on the day of processing, thus representing the catering products for which the cook–serve catering production system had been used. The products were subjected to different thermal treatments, i.e., A2 was cooked in a convection oven, whereas A3 was cooked in the microwave oven. Sample A4 was taken 72 h after the processing day and stored at a temperature of +4 °C, thus representing a catering product made in the cook–chill system, thermally treated in the convection oven. The product was thermally regenerated up to a temperature of 73 °C and cooled down to +4 °C. In the physico-chemical examination, sample A4 was identical in terms of storage duration to samples A4-c, taken for the microbiological examination. Sample A5 was collected 20 days after the processing day, after storage at a temperature of −18 °C, representing catering products made in the cook–freeze system, thermally treated in the convection oven. The product was thermally regenerated to a temperature of 73 °C and cooled to +4 °C. In the physico-chemical examination, sample A5 was identical to sample A5-b, taken for the microbiological examination.
Before being subjected to nutrient content analyses, the final products were homogenized in the laboratory using a VO4006 blender (Vortex, Cesano Maderno, Italy).

2.3. Physico-Chemical Analyses

To perform the biochemical analysis, samples were taken from the homogenates corresponding to each cooking method. The following indicators were determined: dry matter content, major nutrients (carbohydrates, proteins, and lipids), total nitrogen content, non-protein nitrogen content, crude protein broken down by pepsin in hydrochloric acid, fatty acid content, and hydro-soluble (thiamine, riboflavin, and niacin) and fat-soluble (retinol, tocopherol, and F) vitamins.
The dry matter was determined through drying in a vacuum oven at 102 ± 2 °C, according to ISO 1442:2023 [24]. The result is expressed in DM% or DM (g/100 g of analyzed product).
The carbohydrate content was determined according to the specifications of AOAC 923.09 [25]. An alkaline solution of cupric salt is reduced under heat with the help of the reducing sugar from the sample to be analyzed. The excess copper sulfate is treated with potassium iodide in an acidic medium, and the released iodine is titrated with a sodium thiosulfate solution. The result is expressed in reducing sugar, %.
The lipid content was determined by means of the ether-hydrochloric extraction method in accordance with SR ISO 1443:2008 [26]. The protein substances and carbohydrates in the sample to be analyzed are hydrolyzed with hot hydrochloric acid, the insoluble part is separated via filtration, and the fat is extracted with ethyl alcohol in a Soxhlet installation.
In determining the protein content (P = 6.25(NT − NPN), the Kjeldhal method was used, specifically by assessing the total nitrogen content (NT) (according to ISO 5983-1:2005 [27]), and the determination of non-protein nitrogen (NPN) was based on the method of protein precipitation with trichloroacetic acid (according to ISO 8968-4:2016 [28]), thus determining the non-protein nitrogen in the filtrate using the same method. To evaluate the digestibility of proteins in the analyzed products, the content of crude protein decomposed with pepsin and hydrochloric acid solution was determined. The action of the enzyme (2 U/mg pepsin) on the sample heated for 48 h at 40 °C simulates the process of human protein digestion. The suspension was filtered, and the nitrogen content of the filtrate was established in accordance with the method for determining crude protein. Digestibility is expressed in %, as the ratio between the amount of digested protein and the initial amount of crude protein in the analyzed samples (in vitro digestibility (%) = digestible protein/initial protein × 100) [29].
The fatty acid content was determined with gas chromatography, based on the separation of fatty acid methyl esters (according to ISO 12966-4:2015 [30]), using a Shimadzu GC-17A gas chromatograph equipped with a Chrompack capillary column with a length of 25 m and a diameter of 0.25 mm. The stationary phase (a polyethylene glycol derivative) was deposited inside the column as a thin film of 0.2 μm. A FID detector was used, and the mobile phase was helium of 99.9% purity. The operation parameters of the gas chromatograph were as follows: an injector and carrier temperature of 260 °C, a carrier gas flow rate of 2.0 mL/min, a 5 min plateau at the initial temperature of 70 °C, a temperature gradient of 4 °C/min, up to 235 °C, a split ratio of 1:28, and a total analysis time of 36.658 min. After the gas chromatograph reached the programmed parameters, 0.5 µL of hexane solution of fatty acid methyl esters was injected using a syringe. The retention times for short- and long-chain fatty acids had been recorded previously.
To measure the vitamin B1 content in the samples, each one was heat-treated with diluted sulfuric acid and subjected to enzymatic hydrolysis. The quantification of vitamin B1 in extracts is traditionally based on spectrofluorimetric detection (Cary-50 UV-VIS Spectrophotometer, Agilent, Santa Clara, USA) after an oxidation step to convert vitamin B1 to thiochrome. This method is similar to the AOAC Official Method 953.17 and the AACC Method 86-80. Thiamine is oxidized to thiochrome by potassium ferricyanide in a strongly alkaline solution. Thiochrome is then extracted into isobutyl alcohol, and its fluorescence is measured at 435 nm after excitation at 365 nm. Thiochrome fluorescence is directly proportional to the concentration of thiamine in the sample.
To extract vitamin B2 from the samples, hydrolysis with hydrochloric acid, enzymatic treatment, and then extraction in acetone were performed. The quantification of vitamin B2 in extracts is traditionally based on spectrofluorimetric detection (Cary-50 UV-VIS Spectrophotometer). This method is based on the automated AOAC Official Method 981.15 and is similar to the AACC Method 86-70. All methods use measurement of riboflavin’s natural fluorescence under controlled pH conditions. Fluorescence is measured at 510 nm after excitation at 450 nm.
The quantification of vitamin B3 in samples is traditionally based on spectrofluorimetric detection (Cary-50 UV-VIS Spectrophotometer) and includes an initial extraction step in a 1:1 solution of sulfuric acid and water (through autoclaving at 121 °C for 45 min). This method is based on the automated AOAC Official Method 975.41 and is similar to the AACC Method 86-50A. Modifications have resulted in a safer method with equivalent responses from both niacin and niacinamide, eliminating the need for the conversion of niacinamide to niacin. Niacin and niacinamide react with cyanogen chloride created in situ to form an aldehyde intermediate. The subsequent addition of sulfanilic acid results in the formation of a polymethine dye absorbing light at 470 nm. The absorbance is directly proportional to the total niacin concentration.
For the determination of retinol, an RP-HPLC method was used with a UV detector (λ = 325 nm). The method, adapted from the European Commission Regulation 152/2009 [31], is based on the extraction of vitamin A in petroleum ether from the sample hydrolyzed with ethanolic potassium hydroxide solution. The solvent is removed via evaporation, and the residue is diluted in methanol and, if necessary, diluted to the required concentration. The chromatographic parameters are chosen so that there is no difference between all trans alcohol compounds of vitamin A and the cis isomers. Vitamin A was separated on a C18 reversed phase column, and an elution with the methanolic mobile phase was performed. The average peak height of several injections from the same sample solution and the average peak height of several injections of the calibration solutions were calculated.
Alpha tocopherol was analyzed using a Shimadzu VP Series liquid chromatograph with an FR-10 AXL fluorescence detector (Shimadzu, Kyoto, Japan), based on a method adapted from the European Commission Regulation 152/2009. An Alltima RP C-18 column (250 mm × 4.6 mm, 5 μm) at 40 °C was used for chromatographic separation. The mobile phase was a mixture of methanol and acetonitrile (50:50, v/v) with a flow rate of 1.5 mL/min. For the detection of alpha tocopherol, a 290 nm excitation wavelength and a 325 nm emission wavelength were set on the detector.

2.4. Microbiological Analyses

The microbiological quality assessment was carried out in order to analyze the influence of the type of thermal treatment applied (sous vide, convection, and microwaves) on the main indicators. The samples prepared in the cook–chill and cook–freeze production systems were monitored throughout the minimum durability period. In the case of cook–chill products, samples were taken daily, over a 5-day period, and in the case of cook–freeze products, every 10 days, for 50 days. Before being subjected to microbiological evaluation (Table 2), the samples were ground and homogenized (Vortex, Italy).
From the homogenates, samples were taken and subjected to quantitative and qualitative determinations using classical and rapid methods. The samples collected and individualized by serial number were sealed and sent immediately to the laboratory, where they were subjected to bacteriological investigations aimed at isolating, identifying, and quantifying the microorganisms, according to the standards presented in Table 2.

2.5. Sensory Analysis

The sensory characteristics of the fish dishes were evaluated by a panel of 30 assessors (60% female and 40% male, aged between 20 and 61 years) who had undergone professional training in the field of gastronomy. The panel evaluated the attributes of exterior appearance, interior appearance, consistency, odor, taste, and overall acceptability, scoring them on a linear hedonic scale of 9 points [37]. A score of 1 indicated extreme dislike, while 9 indicated maximum acceptability (extreme liking). The samples were coded to protect information on the production system and heat treatment method used so as not to influence the panelists’ assessments (ISO 8589:2007 [38]). The dimensions, shape, and quantity were set to simulate a presentation mode as close as possible to the reality of serving systems in fine dining restaurants. Water was used as a palate cleanser.
The sensory tests were conducted in two stages. In the first stage, the sensory characteristics of a fish dish (A1:A5) were analyzed, influenced by the different thermal treatments (sous vide, convective baking, and microwave baking), as well as by the utilization of modern culinary production systems: cook–serve, cook–chill, and cook–freeze. In the subsequent stage, the sensory quality of products that had been enhanced by the application of specific fine dining working techniques was tested by the same panel. This process was applied to samples A1, A2, and A3, resulting in the preparation of new enhanced samples for sensory testing: OA1, OA2, and OA3.

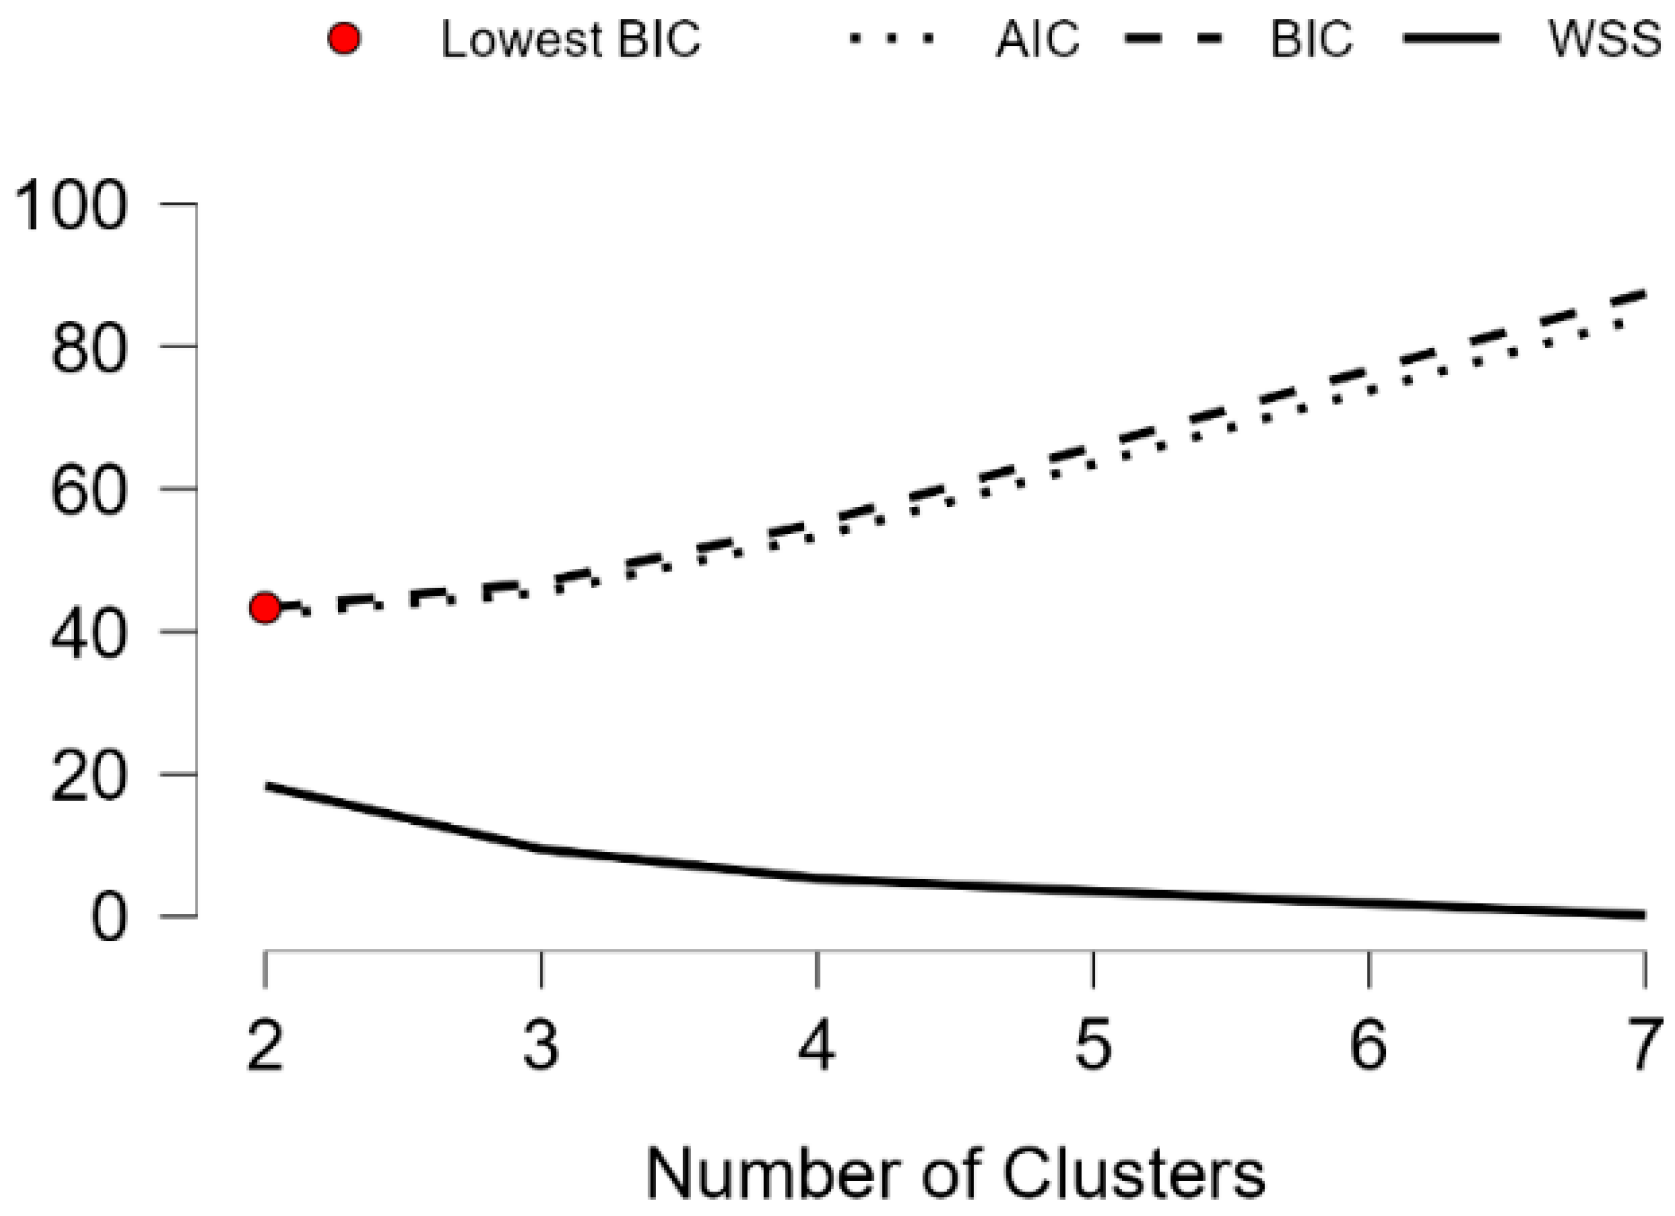
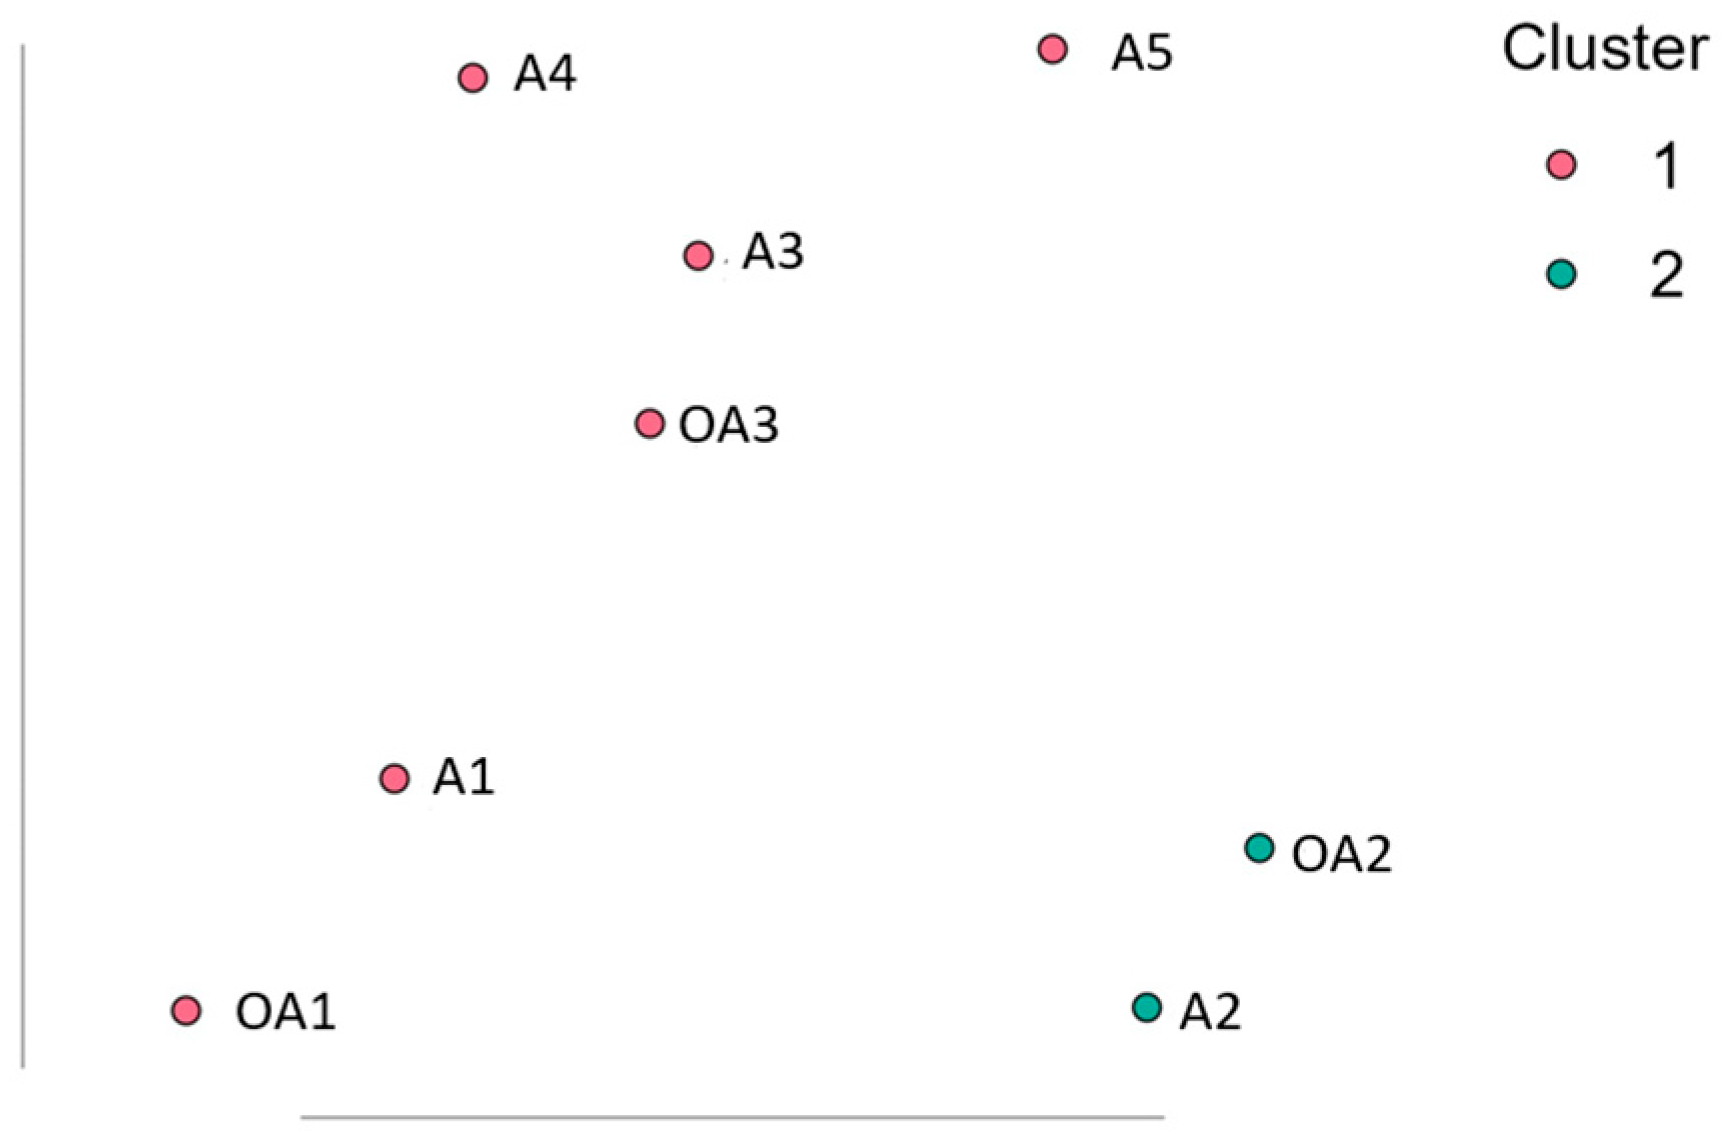
2.6. Statistical Analysis

All experiments were conducted in triplicate, with the results expressed as the mean ± Standard Deviation (SD). The analysis of variance (ANOVA) and Tukey’s test (p ≤ 0.05) were employed to assess the differences in physicochemical and microbiological analyses. JASP Team software (2025), Version 0.19.3, was utilized for the statistical analysis [39].
The identification of patterns and relationships within complex datasets was facilitated by the implementation of a Cluster Analysis algorithm. In Random Forest clustering, data were segmented into multiple clusters, with each observation assigned to a single group [39]. The Random Forest algorithm was utilized in this clustering method, with the outcome variable ‘y’ set to NULL [40,41]. The frequency of observations ending up in the same leaf node is then analyzed, generating a proximity matrix that estimates the distance between observations.

3. Results and Discussions

3.1. Evaluation of the Nutrient Content of the Analyzed Fish Dishes

Thermal processing of foods can affect macronutrient content, the quality of some micronutrients, and the content of minerals in their composition. Cooking and baking can destroy some of the valuable nutrients in foods, such as PUFAs, proteins, and vitamins [15]. Table 3 offers an overview of the nutrient content of the fish dishes.

3.1.1. Evaluation of Processing Losses of the Analyzed Products

Food loss and waste, including cooking loss, are crucial factors that influence the catering sector because they can generate financial losses, depending on the selected cooking process [42]. Cooking loss is of special interest in the catering sector because of the changes in the shape, color, and texture of the product [43,44]. Cooking loss is defined as a mixture of liquids and solids removed from the fish during cooking and depends on several factors: humidity, pressure, temperature and cooking time, ventilation and the heat distribution system, muscle fiber composition, and connective tissue [45]. Cooking losses are calculated based on the weight of the fish sample before and after heat treatment, as water comes out of the product in the form of vapor and liquid [46]. %Cooking loss = 100 × (W1 − W2)/W1, where W1 is represented by the initial weight of the samples before cooking and W2 is the weight of the cooked samples [47].
In the case of the cook–serve production system, the highest quantitative losses were recorded for sample A2 (microwave cooking, 28.55 ± 1.23%) and sample A3 (convective cooking, 30.91 ± 2.01%), results that are not significantly different (p > 0.05). The lowest rate of cooking loss was observed in the sous vide system (14.25 ± 1.57%), which is represented by the liquid extracted from the product through the vacuum created in the special packaging bag. This result was found to be significantly different as compared to all of the other samples (p < 0.05). Through the water removed from the product, in the liquid state, significant amounts of lipids and fat-soluble compounds, soluble proteins, vitamins, minerals, etc., are lost, with the possibility of reintegrating this by-product into other culinary preparations. The two-stage cooling applied to sample A4 (CC-CC) resulted in a cooking loss of 35.68 ± 2.32%, and the three-stage cooling applied to sample A5 (CC-CF) with a temperature of −18 °C resulted in a cooking loss of 40.25 ± 1.57%. Moisture losses individualize production yields and specific raw material consumption with a direct impact on economic efficiency. Cook–chill production systems, but especially the cook–freeze ones, are consumers of both material and energy resources, so in order to obtain expected economic results, efficient cost management will have to be applied that correlates production expenses with orders and sales.

3.1.2. Evaluation of Macronutrient Content

According to the working protocol, three determinations were performed, with a coefficient of variation of reproducibility of 3.85 (VCr % = 3.85) and a measurement uncertainty of 7.35 (M% = 7.35). The preparation selected for evaluation in relation to different types of heat treatment or processing is a product with high protein content of approximately 14.32 ± 0.02%. Starting from a protein digestibility of 69.51% in sample A0 (raw), the most useful type of heat treatment is sous vide, where the digestibility increased to 89.91%. Starting from a protein digestibility of 69.51% in sample A0 (raw), the lowest digestibility for all dishes was determined for sample A3 (Mw-CS, 86.91%), with the results being significantly different (p < 0.05). The results were not significantly different (p > 0.05) for samples A1 (SV-CS, 89.91%), A2 (CC-CS, 89.31%), and A4 (CC-CC, 90.67%). It was also found that the digestibility of sample A5 (CC-CF) was 91.74%, a result significantly different from the other samples (p < 0.05).
The authors of a similar study [47] concluded that thermal processes such as sous vide can induce favorable changes, such as partial unfolding or exposure of cleavage sites, in muscle proteins and improve their digestibility, whereas processes such as stewing and roasting can induce unfavorable changes, such as protein aggregation, severe oxidation, cross linking, or increased disulfide (S-S) content and decrease the susceptibility of proteins during gastrointestinal digestion. In another study [29], following treatments such as pulsed electric field, high pressure, and ultrasound, conformational and microstructural changes in proteins were found to lead to the unfolding of polypeptides and the exposure of active sites for further interactions. These changes can increase the accessibility of digestive proteases to cleavage sites. Some of these technologies can inactivate some egg proteins that are enzyme inhibitors, such as trypsin inhibitors. Sous vide is recommended to be used in order to develop new fine dining dishes with increased protein bioaccessibility.
The carbohydrate content did not undergo major changes during the treatments applied, with the observed differences being an increase of less than 1%. A0 had a sugar content of 0.73% (w/w). A1 (sous vide cooked) had a sugar content of 1.1% (w/w), A2 (convection cooked) contained 1.05% (w/w) sugars, and A3 (microwaved) contained 1.93% (w/w) sugars. The CC-CC system, A4, contained 1.23% (w/w) sugars, and the CC-CF system, A5, contained 1.25% (w/w) sugars. The raw fish dish (A0) did not have a high carbohydrate content—0.73% (w/w). Compared to the raw sample, the different values of carbohydrate content in the other samples were due to the solubility taken up by the liquid collected in the baking containers. The carbohydrate content was not significantly different for samples A1 (SV-CS, 1.1% (w/w)), A2 (CC-CS, 1.05% (w/w)), A4 (CC-CC, 1.23% (w/w)), and A5 (CC-CF, 1.25% (w/w)) (p > 0.05). The carbohydrate content was significantly different for sample A3 (Mw-CS, 1.90% (w/w) (p < 0.05), given the rapid heating of the dish and the evaporation of water during this time.
Culinary dishes, rich in saturated and monounsaturated fats, are very resistant to heat. In the analyzed samples, the loss of lipid content ranged between 6% and 9%, depending on the applied cooking system (Table 3 shows the lipid content of all of the analyzed samples). The most protective system was the sous vide (A1) system with a 6% loss, and a 9% loss was determined for sample A3, treated with microwaves. Lipids and lipid-containing foods are particularly sensitive to microwave heating since the specific heat of lipids is low and, therefore, they are heated quickly. Microwave heating mainly favors lipid oxidation but can also cause lipolysis and polymerization. This cooking method can have a different impact on lipid oxidation depending on the treatment conditions used (power, temperature, and time). This analysis provides an overview of the main degradation effects of microwave heating on vegetable oils and lipid-containing foods, with emphasis on the oxidation of fatty acids and cholesterol [48].
In the case of the control sample (A0), the content of SFAs (30.42%) was lower than MUFAs (34.46%) but higher than PUFAs (12.57%), which indicates high of unsaturated fatty acid content (Table 4), thus determining a high degree of risk in terms of negative transformations that it could suffer due to oxidation. The culinary techniques applied in fine dining to this category of preparations involve preliminary operations with exposure to temperature fluctuations, slicing—portioning—forming, which implies the presence of light and oxygen. These factors directly influence the stability of PUFAs and MUFAs, among other factors: pH, natural antioxidant content, the freshness of the raw material, conditions, and storage time after heat treatment (CC-CC and CC-CF).
In the control sample (A0), undecanoic (C11:0), tridecanoic (C13:0), cis 10-pentadecanoic (C15:2) and cis-10-heptadecenoic (C17:1) were not detected. Among the MUFAs, oleic acid (C18:1) represented 25.56% of the total fatty acids, and its isomer C18:1-iso (2.17%). Palmitoleic acid was determined to be in a proportion of 3.85%, and cis 11-eicosenoic acid amounted to 2.63%.
The most representative PUFAs in the A0 product were as follows: linoleic acid (8.27%), linolenic acid (2.14%), and cis-11,13-eicosadienoic acid (2.16%). The fatty acids caproic (7.59%), caprylic (0.2%), and capric (0.23%) detected in the fish dishes come from the heavy cream used as raw material, according to the product standard. These saturated, short-chain fatty acids are specific to dairy products.
Sous vide, of all of the thermal treatments applied, best protected the PUFA content, being the most balanced preparation in terms of the PUFA/SFA ratio (0.47), respectively the n-6/n3 ratio (6.25). The lack of oxygen and maintaining the vacuum inside the package during the thermal treatment contributed to maintaining the content of essential fatty acids in sample A1. From the category of ω-3 fatty acids, the analyzed samples contain only linolenic acid, determining a content between 0.19–0.61 g/portion.

3.1.3. Evaluation of Water-Soluble and Fat-Soluble Vitamin Content

Contrary to widespread opinions [49], which nevertheless led to a real “trend” in dietary nutrition—“food without fire”—most vitamins are not very sensitive to heat [50]. The vitamin content of a culinary dish can be ensured by efficiently associated raw materials but also optimized by the correct choice of culinary techniques and production systems that lead to superior vitamin retention. The heat treatment applied to culinary products is a decisive factor in preserving the native vitamin potential.
From the data analysis, it results that the most protective production system for riboflavin, used in obtaining fine dining products from fish, is the sous vide (A1 − TR = 71.67%) and microwave cooking (A3 − TR = 59.20%). Riboflavin losses are influenced by the rapid cooling/freezing treatments and storage times. After convective cooking, in sample A2, a loss of vitamin B2 content of 45% was determined, and after 72 h under refrigeration and thermal regeneration conditions, the loss is 58.5%. In the case of frozen and regenerated products, after 20 days, the loss is approximately 65.3%.
Although it is a relatively stable vitamin to thermal treatment, the literature indicates considerable losses of riboflavin during culinary preparation [51]. Thus, starting with the washing of raw materials, it was found that the first losses of riboflavin occur. By grinding raw materials, vitamin B2 losses can reach up to 7% of the existing content [52]. The type of heat treatment applied can influence riboflavin losses differently, the most unfavorable way of heat processing being frying, with losses of up to 30%. Baking at low temperatures, on the other hand, decreases the riboflavin content by very little. Riboflavin is photosensitive, so the processes that take place in light act negatively, transforming it into lumiflavin or lumichrome without vitamin activity. Significant losses occur during storage; even during short-term storage, the lack of adequate protection measures leads to its reduction [53].
Böhm et al. [54] and Kala & Prakash [55] show in similar studies on microwaved products that a possible cause of the decrease in riboflavin content in microwaved products is the fat content of the raw materials. They show that there is a direct link between the fat content and the level of riboflavin retention: the higher the fat content of the product, the lower the riboflavin retention in the microwaved product than in the conventionally cooked product, since it is a water-soluble vitamin and the high fat content of a preparation is equivalent to a low water content in the product. Sterilization, the basic method used to preserve food products, due to the harshness of the heat treatment, causes multiple reductions in vitamin content, including riboflavin. For example, in a study conducted by Rickman et al. [56], when sterilizing canned vegetables in water, the losses of riboflavin are: in sweet corn 58.3%, mushrooms 45.6%, green beans 63.6%, and Parisian carrots 60%. These products are raw materials in the manufacturing process of catering products, raw materials that participate with a large deficit of riboflavin. Freezing is also a widely used method of food preservation, which, unlike sterilization, has the advantage of being associated with three times lower riboflavin losses. Some studies, such as the one of Awonorin et al. [57] confirm that in the case of frozen meat, the reduction in vitamin B2 content during storage is relatively small, the losses depending on the fat content and the species. When defrosting meat, in addition to the losses of major nutrients, quantities of water-soluble vitamins are also lost, losses which are much more intense when defrosting is done in water than in air thawing.
Thus, for products made in the SV system, the real retention of vitamin PP reported to the content of the non-thermally treated preparation is 61.49%, compared to the retention determined for the sample thermally treated with microwaves (A3 − TR = 40.74%), respectively with the one thermally treated by convective baking (A2 − TR = 39.21%). In the case of products made in the cook–chill and cook–freeze systems, the real retentions were approximately 20%.
Temperature, light, and contact with oxygen negatively influence the retention of retinol in the analyzed culinary preparations. Vitamin A undergoes oxidative decomposition under the influence of light, due to the cleavage of the double bond in the cycle and thus, the opening of the β-ionic cycle. Not only retinol in preparations is affected by processing (temperature, light) but also carotene. It undergoes an isomerization process, the trans form passing into the cis form with a reduction in vitamin activity. However, from the analysis of the results, it is found that microwave treatment is less protective of vitamin A (A3 − TR = 30.20%). In the case of the sous vide system, the real retention is 62.24% and in the case of the CC-CS system it is 37.89%.). In the case of products made in the cook–chill and cook–freeze systems, the real retentions were approximately 30%.
From the data analysis, significant losses of α-tocopherol were found as compared to the content of the control samples (A0). It was found that the most protective system is the S-V (A1 − TR = 51.61%), followed by the CC-CS (A2 – TR = 43.33%) and the Mw-CS (A3 − TR = 35.95%). In the case of the CC-CF, also influenced by the storage duration (20 days), the real retention of α-tocopherol is approximately 20%. It was observed that the α-tocopherol content was affected by the catering processing compared to the raw sample (A0), with the true retentions being significantly different (p < 0.05) and influenced by the type of heat treatment. Thus, the most protective catering system was found to be the sous vide treatment (A1, TR = 51.61%). No significant difference (p > 0.05) was observed for samples A2 (CC-CS, TR = 43.33%), A3 (Mw-CS, TR = 35.95%), and A4 (CC-CC, TR = 36.65%). It was also observed that the real retention for A5 (CC-CF, TR = 21.17) was significantly different from the other heat-treated samples, being influenced by the long storage time (p < 0.05).
A similar study conducted on the effect of traditional and microwave heat treatment on nutrient retention in some traditional Oceanian culinary preparations (based on chicken, lamb, fish, tapioca and palusami) carried out by Kumar & Aalbersberg [58], shows a retinol retention of 91% in microwaved products and 20% in products cooked traditionally in clay pots, a niacin retention of 95% in microwaved products and 63% in traditionally heat treated products. Other studies, conducted by Gentry & Roberts [59] and Roberts et al. [60], also argue for a higher retention of micronutrients in microwaved culinary preparations compared to conventionally cooked preparations.

3.2. Microbiological Analysis

The development of microorganisms in catering products is influenced by the chemical composition of the product, the type of catering processing, the technological parameters, especially the heat treatment parameters, and also the biological relationships and relationships between different microorganisms.
All samples were analyzed in terms of innocuity by determining their microbiological load, and the results are compiled in Table 5, which provides an overall picture of the microbiological quality.
It is preferred that certain pathogens are not present in fish to avoid the use of antibiotics since the continued use of antibiotics against them can also lead to bacterial resistance to antibiotics, which may also affect human health [61]. According to EC Regulation 2073/2005 [62], the maximum accepted limits for the microbial load of heat-treated catering products are as follows: Aerobic Plate Count of 104 CFU/g, 10 CFU/g Total Yeasts and Molds Count, 1 CFU/25 g S. aureus, 1 CFU/25 g B. cereus, absent E. coli and absent in 25 g for L. monocytogenes and Salmonella sp. In the tested samples, pathogenic bacteria B. cereus, S. aureus, Salmonella sp., and L. monocytogenes were all absent.

3.2.1. Aerobic Plate Count (APC)

In the raw sample (A0), the APC was 4.02 log CFU/g, approximately 10 times lower than the maximum limit allowed by the legislation in force in Romania (5 log CFU/g, corresponding to 105 CFU/g). Malak et al. [63] compared the microbial load of five fish species and determined that the common carp and the grass carp had the highest values of APC (5.44 log CFU/g and 5.51 log CFU/g, respectively). Our analysis showed a lower APC, even if A0 contained fillets from two fish species and other ingredients. Their coliform counts were 1.66 log CFU and 1.93 log CFU/g, respectively, which is higher than our results.
In the sous vide cooked dish (A1), the APC decreased by 59%. Conventional thermal treatment, represented by cooking the fish dish in a convection oven, influenced the number of microorganisms in the products differently. All three cooking systems that involved convection had an average APC of 3.69 log CFU/g, still below the accepted maximum. In the cook–chill system, this level showed some fluctuations, decreasing by 0.02 log CFU/g after the first day and then increasing slightly until day four. Between day four and day five, a new decrease of another 0.02 log CFU/g was recorded. Over the 5 days of sample testing of the cook–chill system, the APC increased by a total of 0.06 log CFU/g. In the cook–freeze system, the APC level decreased by a total of 0.08 log CFU/g until day 30, after which it increased by a total of 0.09 log CFU/g. Thus, in the fish dish made in the cook–serve system, the APC decreased by 61%, in the cook–chill sample, it decreased by 44%, and in the cook–freeze sample, it decreased by 52%. Unconventional heat treatment using microwaves proved to be more effective in reducing the microbial load. Thus, the APC in sample A3 was 2.99 log CFU/g, 10.5 times lower than the non-heat-treated product and 4 times lower than the conventional heat-treated product. All APC values are presented in Figure 1 as log CFU/g.
The production of the fish dish in the cook–chill system (CC-CC, convective oven followed by rapid cooling in two stages to the refrigeration temperature) resulted in a 45% higher level of bacterial contamination than in the product prepared in the cook–serve system. Products made in the cook–freeze system (CC-CF, convective oven followed by rapid cooling in two stages to freezing temperature) presented a 24.2% higher load compared to that of the same product made in the cook–serve system.
Other studies have reported similar APCs below the European Commission Regulation limits, such as of 4 log CFU/g (sardines [64]), 3.9 log CFU/g (red porgy [65]), 3.46 log CFU/g (bonito [66]), 3.70 log CFU/g (Dicentrarchus labrax, [67]), and 3.53 log CFU/g (carp fillets [68]), while some others had considerably lower levels (2.9 log CFU/g in eel [69]). Sebastia et al. [70] also analyzed four different fish species, with salmon being one of them, and obtained minimal results in the microbial loads, with the APCs under 1 log CFU/g. E. coli, S. aureus, Salmonella sp., L. monocytogenes, and C. perfringens were not detected in their samples. APCs that exceed the European Commission Regulation limits have been reported by Picouet et al. [71] (4.5 log CFU/g in sous vide cooked salmon fillets), Nguvava et al. [72] (6.08 log CFU/g in sardines), and Antelm et al. [73] (9.14 log CFU/g also in sardines).
The microbiological stability of catering products was monitored during the shelf life provided by the product standard in terms of the evolution of the aerobic mesophilic microorganisms’ content. The shelf life is estimated at 5 days for dishes prepared in the cook–chill system (CC-CC), stored at a temperature of 4 °C, and 50 days for dishes prepared in the cook–freeze system (CC-CF), stored at a temperature of −18 °C. Following the microbiological analysis of the sample stored for 5 (A4-e) and 50 days (A5-e), respectively, it was possible to assume and declare the shelf life of the catering products. Samples were taken and analyzed from the refrigerated products coded A4a-e every day of the shelf life.

3.2.2. Total Yeast and Mold Count (TYMC)

All samples analyzed had a total fungi count below half the APC, except for sample A3. A0, representing the raw sample, had a TYMC of 2.43 log CFU/g, which exceeds the initial fungi count that is accepted in the CE Regulation.
Two convection-cooked samples (CC-CC and CC-CS systems) had a fungal level with 0.64 log CFU/g lower than the raw sample (TYMC decreased by 77%). Over the 5 days of testing the A4 samples (cook–chill system), the total number of fungi increased by a total of 0.24 log CFU/g (a total of 73%).
The convection-cooked sample in the cook–freeze system (CC-CF) had a level of 1.05 log CFU/g lower than the raw sample (TYMC decreased by 91% in this case). Over the 50 days of testing the A5 samples, TYMC levels registered small fluctuations of 0.02–0.04 log CFU/g from one analysis to another. Overall, the TYMC count decreased by a total of 0.08 log CFU/g.

3.2.3. Coliforms Count

The initial number of coliforms in the raw sample was 1.41 log CFU/g, below the limit set by the European Commission. After the applied cooking techniques, these values decreased in the cook–serve systems, as follows: to 1.22 log CFU/g in sous vide, to 1.04 log CFU/g in convection, and to 0.48 log CFU/g in the case of microwaves. Even though the number of coliforms decreased by 36% in the case of sous vide and by 58% in the case of convection, these values still exceed the limits. In the microwaved sample, the coliforms number decreased by 88%, and this is acceptable. The samples prepared in the cook–chill and cook–freeze systems had 0.6 log CFU/g coliforms (A4) and 0.48 log CFU/g coliforms (A5). In the cook–chill system, the value decreased by half after the first day, and then coliforms were detected at a very low level until the fifth day (1 CFU/g). In the case of the cook–freeze system, the value fluctuated between 0.48 and 0.3 log CFU/g until day 30. In the determinations of days 40 and 50, the coliform level reached 1 CFU/g.

3.2.4. E. coli Determination

The raw sample had a 0.85 log CFU/g of E. coli. This level decreased by 33% to 0.67 log CFU/g after sous vide cooking, by 57% to 0.48 log CFU/g after convection, and by 100% to nd (not detected) in all of the other samples. All tested samples maintained a minimum content of E. coli below the accepted limits.

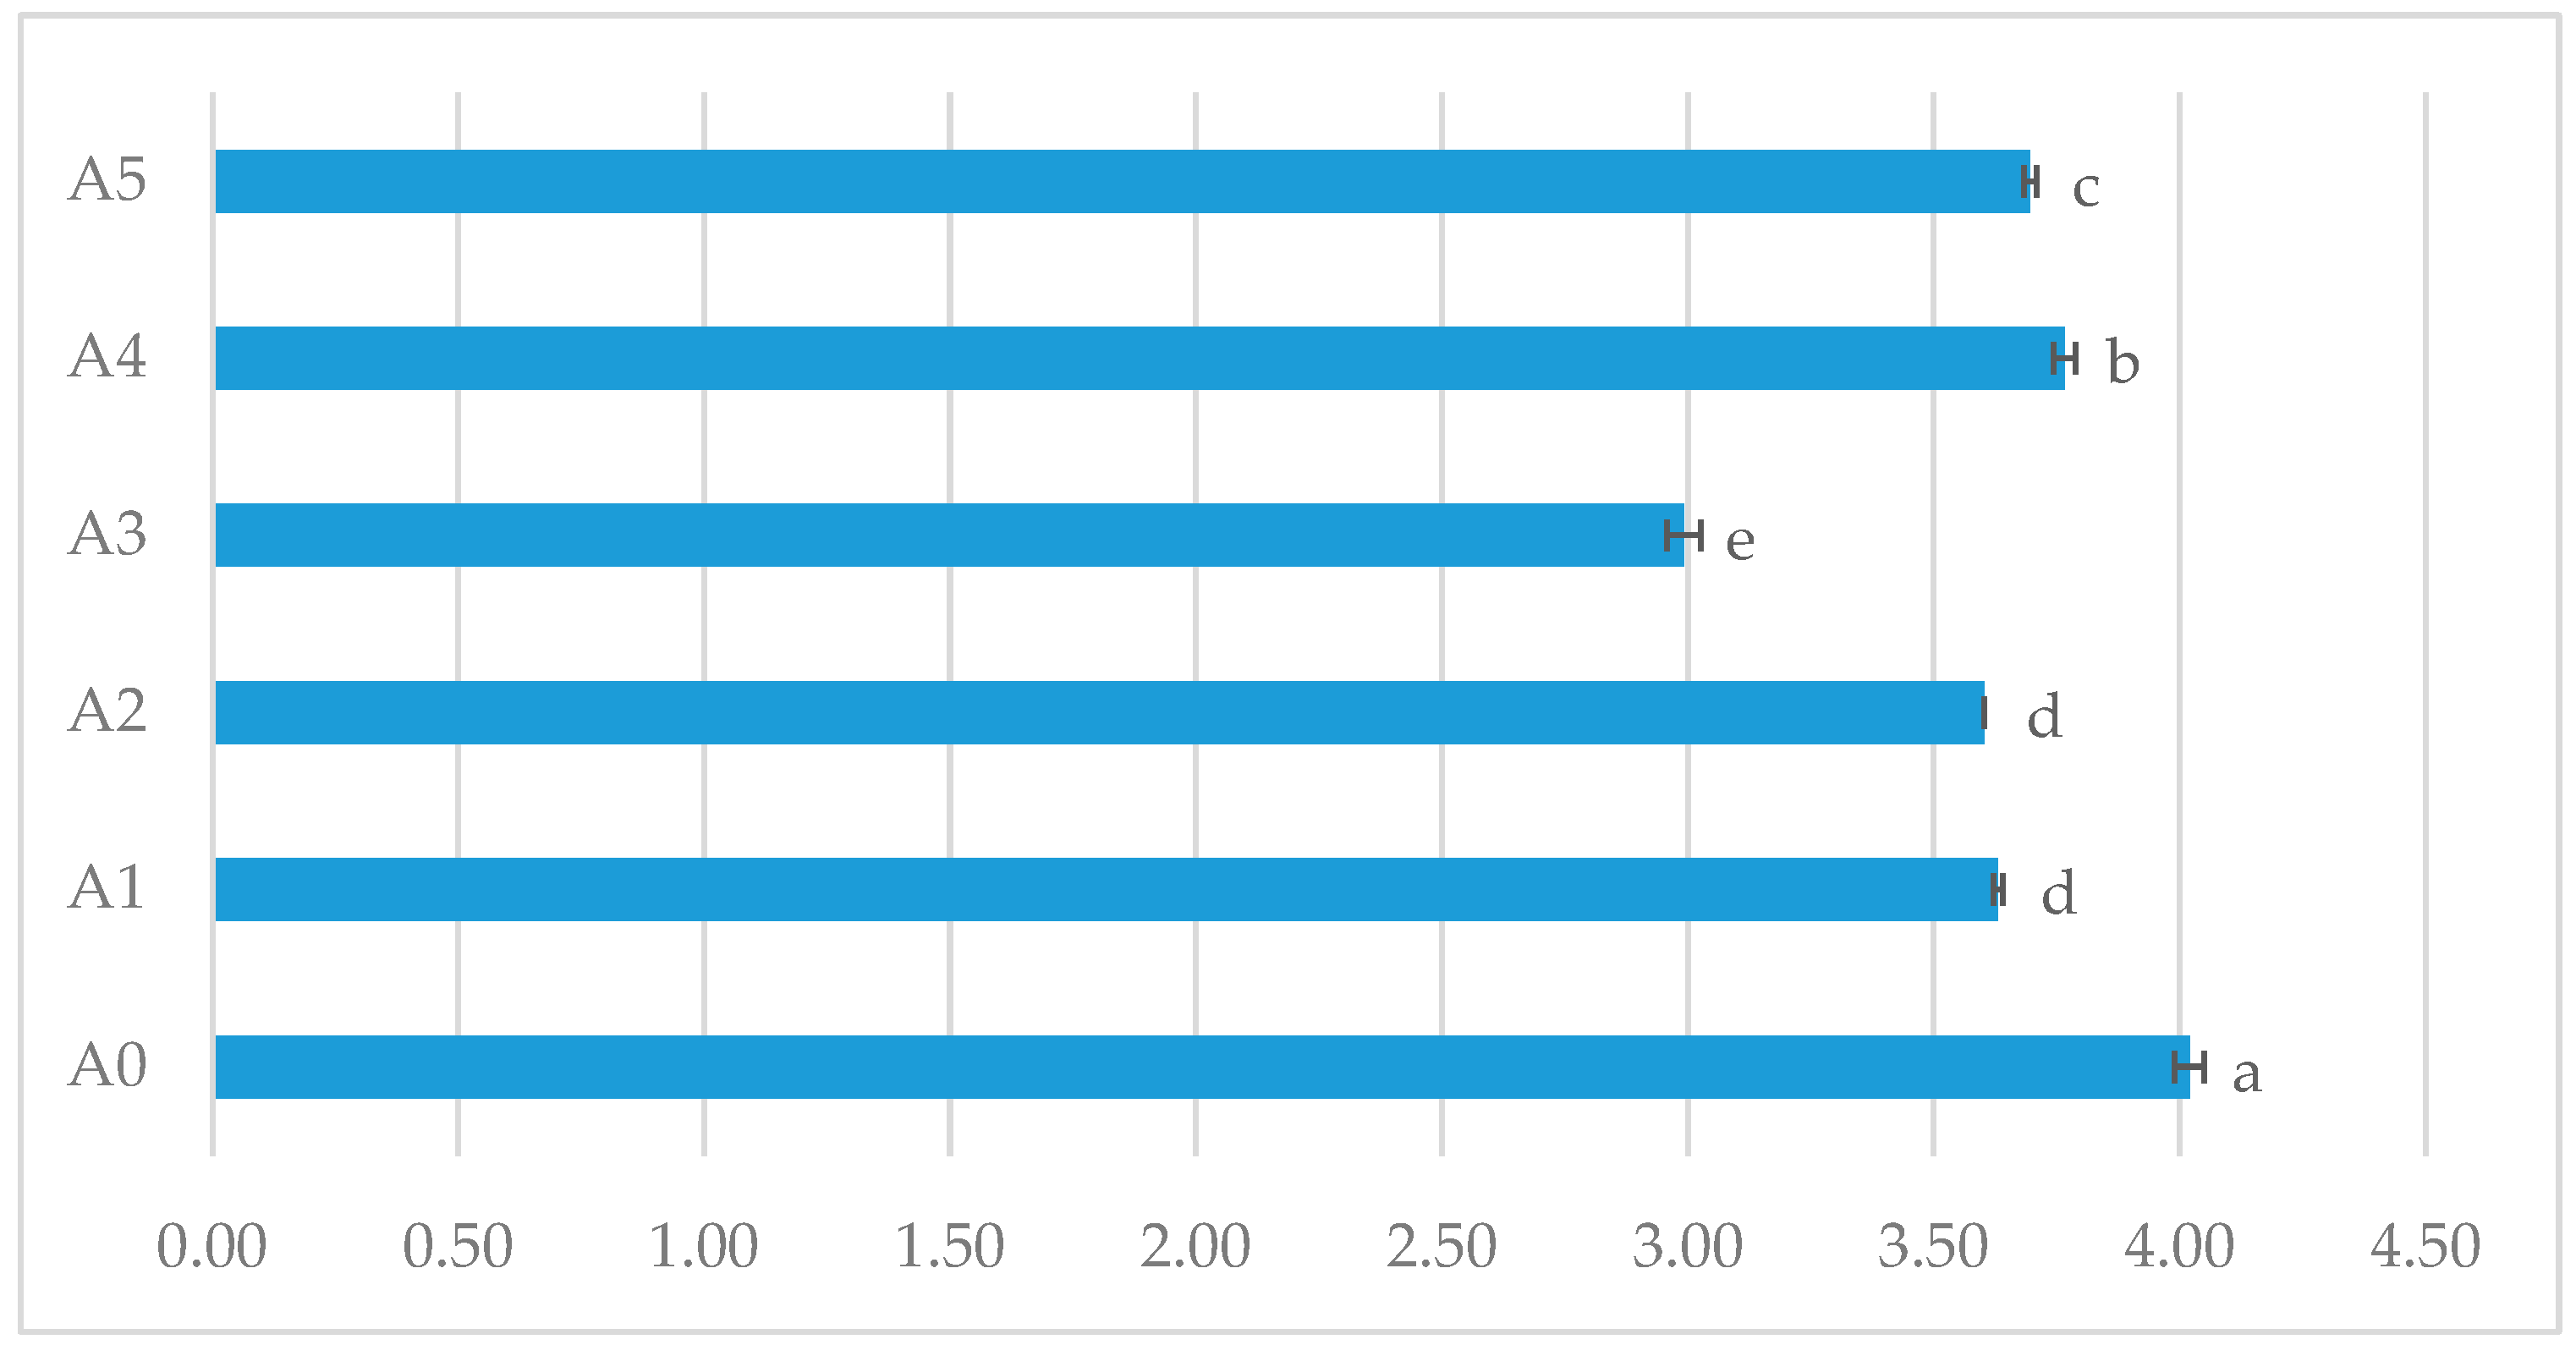
3.3. Sensorial Quality Evaluation

The sensory characteristics of fish dishes have been identified as the primary factors influencing consumer purchasing decisions. These characteristics are also considered the key determinants of the quality of such dishes. Various sensory attributes can be employed to categorize fish dishes based on these standards [63].
The fish dishes dataset (Table 6) contains the results of the sensory assessment of the fish dish samples: A1: Sous vide cooking—cook–serve (SV-CS), A2: Convective cooking—cook–serve (CC-CS), A3: Microwave cooking—cook–serve (Mw-CS), A4: Convective cooking—cook–chill (CC-CC), A5: Convective cooking—cook–freeze (CC-CF), OA1: Enhanced sample sous vide cooking—cook–serve (SV-CS), OA2: Enhanced sample convective cooking—cook–serve (CC-CS), and OA3: Enhanced sample microwave cooking—cook–serve (Mw-CS). Eight types of fish dishes were represented in the 24 samples (8 samples analyzed in triplicate), with the results of six sensory parameters recorded for each sample. The variables recorded were exterior appearance, interior appearance, consistency, odor, taste, and overall acceptability.
Finding the most distinctive attribute among the fish meals is the aim of the Random Forest algorithm we used. The Random Forest cluster model is specifically optimized in relation to its BIC (Bayesian Information Criterion) value, which is visible in the Elbow Curve Diagram (Figure 2). The elbow diagram shows the kink in the curve or the point at which it would be unnecessary to add another cluster. The model’s optimized metric, the least BIC value, is shown by the red dot.
As can be seen, the result of the cluster analysis is a set of two clusters, each one distinct from the other but largely similar to the objects or data points within them (Figure 3). The two-dimensional t-SNE (t-distributed Stochastic Neighbor Embedding) graph shown in Figure 3 provides a good summary of all of the different characteristics of the samples. The disadvantage, however, is that the axes lose their interpretability. The way in which the different clusters are grouped together is shown in this t-SNE graph. In addition, Figure 3 shows the clustering of the samples according to six fixed criteria that shaped their characteristics: external appearance, internal appearance, consistency, odor, taste, and overall acceptability.
As is apparent in Table 6 and Figure 3, the panelists’ preferred variants are represented by sample A2, which was prepared by CC-CS, and sample 7, which was also represented by sample A2, which was improved. The two samples were grouped in a cluster (Cluster 2). Convective baking was the thermal treatment that generated the most appreciated sensory characteristics in the analyzed samples A2 (CC-CS) and OA2 (CC-CS), obtaining average scores of 8.41 and 8.47 points, respectively. All other samples, irrespective of the treatment applied, were grouped into a separate cluster (Cluster 1). It was therefore deduced that the panelists gave similar ratings for the samples in Cluster 1, as well as there being no significant differences in the scores obtained.
Additionally, the cluster analysis revealed the ranking of features in a descending order of importance for the grouping of samples. The most significant variable is the odor (index 1.383), followed by taste (index 1.343), exterior appearance (index 1.282), overall acceptability (index 1.254), interior appearance (index 1.201), and, finally, consistency (index 0.933).
It was evident that samples A1, A2, and A3 were prepared in the cook–serve system; however, they underwent different thermal treatments. The samples that were most highly regarded were those that were cooked through convection baking (A2—8.41 points), followed by those that were cooked sous vide (A1—8.15 points) and those that were cooked through microwave baking (A3—7.91 points).
Furthermore, a notable observation is that among all of the samples analyzed, those produced in the cook–serve system were the most highly regarded. The samples produced in the cook–chill and cook–freeze systems were found to be less appealing in terms of external appearance (A4—7.67 points, A5—7.2 points) and internal appearance (A4—7.47 points, A5—7.77 points), in comparison with those produced in the cook–serve system. The gradual cooling of the samples and the temporary storage at a temperature of 4 °C (A4), respectively at a temperature of −18 °C (A5), can be considered to justify slight dehydration of the products, with a direct influence on the color and external appearance of the products.
Concerning the optimization proposal, it was observed that the sous vide (SV) samples (OA1—7.93 points) did not yield a positive result and were undervalued in comparison with the initial samples (A1—8.15 points). The technical optimization proposal, in this case, failed to enhance the sensory quality, as evidenced by the contraction of the packaging resulting from the internal vacuum, which mechanically impacted the product’s integrity. The internal and external appearance of the samples were influenced by the consistency of the non-thermally treated products and the mechanical actions applied during the preparation, formation, and thermal treatment. Moreover, it was observed that the samples subjected to convective baking (OA2) and microwave baking (OA3) exhibited higher scores in comparison with the initial samples (A2 and A3, respectively).

4. Conclusions

The results obtained in this study of the culinary preparation of fish made in the cook–serve, cook–chill, and cook–freeze systems, alternating with thermal treatments such as sous vide, convective baking, and microwave, are different in terms of production yield, nutritional potential, safety, and sensory value. The lowest quantitative loss was determined in the case of the fish preparation cooked under vacuum (A1, 14.25 ± 1.57%), as compared to those thermally treated using convective baking and microwave, where the losses found were approximately 30%. Systems that ensure a significantly improved minimum durability by controlled cooling to refrigeration temperature (A4) and freezing (A5) resulted in quantitative losses of approximately 40%.
The open systems—convection and microwave cooking—recorded higher cooking losses than the sous vide system, largely due to moisture loss. The lowest quantitative loss was determined in the case of the sous vide dish (A1, 14.25 ± 1.57%), compared to those thermally treated using convection cooking and microwaves, where the losses were found to be approximately 30%. Systems that ensure a significantly improved minimum durability by controlled cooling to refrigeration temperature (A4) and freezing (A5) resulted in quantitative losses of approximately 40%.
The macronutrient content recorded little variations between the used systems. The protein content was similar in all dishes, with an average value of 16.06%. The digestibility was also similar, with very little variation between the five cooking techniques, but it increased slightly in the cook–chill and cook–freeze systems, compared to the cook–serve (CC-CS) system. The fatty acid profile showed the highest contents of SFAs, MUFAs, and PUFAs in the convection-cooked dish. The retention of the PP vitamin was the highest in the sous vide dish and the lowest in the convective cooking. The highest amount of hydro-soluble vitamins was maintained in sous vide cooked dishes, while the convection CC-CS system caused the greatest decrease in riboflavin and niacin content. Regarding fat-soluble vitamins, namely retinol and α-tocopherol, the sous vide preserved most of their content, and microwaves caused their reduction to the lowest values. In terms of the real retention of vitamins, sous vide and convection cooking proved to be protective.
Regarding the APC, the sous vide dish had the highest value, and the microwaved dish had the lowest, but both were within the accepted limits. The number of fungi in the tested dishes was also below the limits, with the highest number in the sous vide dish and the lowest after microwave cooking. The coliform count was limited to very low, and the E. coli count was also below the limits, even reaching an absolute low of not being detected in the microwaved dish. S. aureus, B. cereus, L. monocytogenes, and Salmonella sp. were all undetected in the tested samples, which supports the fact that all of them were prepared in maximum safety and hygiene conditions. The cook–chill and cook–freeze systems offer better shelf life and rigorous control of the main indicators of safety.
Convective cooking—cook–serve (CC-CS)—was identified as the thermal treatment that produced the most appreciated sensory characteristics in the samples analyzed, as dishes OA2 and A2 obtained the highest scores. The CC-CS system was found to be the most efficient because it ensures a balance in terms of technological quality, nutritional quality, safety, and sensory quality. Through this production system, diversification in fine dining gastronomy can be ensured, thus offering versatility to the quality values of culinary products. The sous vide and microwave treatments, as well as the samples prepared in the cook–chill and cook–freeze systems, were found to be less appealing in terms of sensory attributes.

Author Contributions

Conceptualization, A.M. (Adrian Măzărel), R.-Ș.R.-E. and F.M.; methodology, A.M. (Adrian Măzărel), R.-Ș.R.-E., V.P., and A.M. (Alina Maier); software, A.M. (Alina Maier); validation, V.P. and F.M.; formal analysis, A.M. (Adrian Măzărel) and V.P.; investigation, A.M. (Adrian Măzărel), R.-Ș.R.-E. and A.M. (Alina Maier); resources, A.M. (Adrian Măzărel), V.P. and F.M.; data curation, A.M. (Adrian Măzărel), R.-Ș.R.-E. and A.M. (Alina Maier); writing—original draft preparation, A.M. (Adrian Măzărel) and R.-Ș.R.-E.; writing—review and editing, A.M. (Adrian Măzărel), R.-Ș.R.-E., A.M. (Alina Maier), V.P. and F.M.; visualization, A.M. (Adrian Măzărel) and R.-Ș.R.-E.; supervision, F.M.; project administration, A.M. (Adrian Măzărel) and F.M.; funding acquisition, A.M. (Adrian Măzărel) and V.P. All authors have read and agreed to the published version of the manuscript.

Funding

This research received no external funding.

Institutional Review Board Statement

Not applicable.

Informed Consent Statement

Not applicable.

Data Availability Statement

The original contributions presented in this study are included in the article. Further inquiries can be directed to the corresponding authors.

Conflicts of Interest

The authors declare no conflicts of interest.

References

  1. Malinowska, E.; Tarczyńska, A.S.; Urbanowicz, A. Factors Determining the Quality of Catering Services in the Opinion of Consumers and Catering Staff. In Quality Challenges; Dziadkowiec Joanna, M., Niewczas-Dobrowolska, M., Eds.; Wydawnictwo Rys: Dąbrówka, Poland, 2022; pp. 171–197. ISBN 978-83-67287-33-3. [Google Scholar]
  2. Brănescu, G.; Măzărel, A.; Moja, A.; Lupu, M. Management of Combating Food Fraud in the Field of Public Catering. Ann. Univ. Craiova Agric. Mont. Cadastre Ser. 2023, 53, 31–36. [Google Scholar] [CrossRef]
  3. Chou, S.F.; Horng, J.S.; Liu, C.H.; Yu, T.Y.; Huang, Y.C.; La, Q.P.; Ng, Y. Comparison of Hotel Fine Dining and Chain Restaurant Consumer Perceived Service Quality and Satisfaction Predictions. J. Hosp. Tour. Insights 2024. ahead of print. [Google Scholar] [CrossRef]
  4. Li, N.; Cong, L.; Wang, H.; Chen, Y.; Liu, Z.; Li, M.; Yang, D.; Li, H.; Fang, H. Establishing a Nutrition Calculation Model for Catering Food According to the Influencing Factors of Energy and Nutrient Content in Food Processing. Front. Nutr. 2024, 11, 1388645. [Google Scholar] [CrossRef]
  5. Hurrell, R.F. Food Manufacturing Processes and Their Influence on the Nutritional Quality of Foods. In Nutritional Impact of Food Processing; S. Karger Ag: Basel, Switzerland, 1989; Volume 43, pp. 125–139. ISBN 978-3-8055-4848-9. [Google Scholar]
  6. Nguyen, L.; Gao, Z.; Anderson, J.L. Regulating Menu Information: What Do Consumers Care and Not Care about at Casual and Fine Dining Restaurants for Seafood Consumption? Food Policy 2022, 110, 102272. [Google Scholar] [CrossRef]
  7. Nguyen, L.; Gao, Z.; Anderson, J.L. Perception Shifts in Seafood Consumption in the United States. Mar. Policy 2023, 148, 105438. [Google Scholar] [CrossRef]
  8. Tan, K.; Huang, L.; Tan, K.; Lim, L.; Peng, Y.; Cheong, K.L. Effects of Culinary Treatments on the Lipid Nutritional Quality of Fish and Shellfish. Food Chem. X 2023, 19, 100856. [Google Scholar] [CrossRef] [PubMed]
  9. Tan, K.; Lim, L.; Cheong, K.L. Effects of Food Processing on the Lipid Nutritional Quality of Commercially Important Fish and Shellfish. Food Chem. X 2023, 20, 101034. [Google Scholar] [CrossRef] [PubMed]
  10. Rodrigues, M.; Rosa, A.; Almeida, A.; Martins, R.; Ribeiro, T.; Pintado, M.; Goncalves, R.F.S.; Pinheiro, A.C.; Fonseca, A.J.M.; Maia, M.R.G.; et al. Omega-3 Fatty Acids from Fish by-Products: Innovative Extraction and Application in Food and Feed. Food Bioprod. Process. 2024, 145, 32–41. [Google Scholar] [CrossRef]
  11. Zhang, Y.; Zhuang, P.; Mao, L.; Chen, X.; Wang, J.; Cheng, L.; Ding, G.; Jiao, J. Current Level of Fish and Omega-3 Fatty Acid Intakes and Risk of Type 2 Diabetes in China. J. Nutr. Biochem. 2019, 74, 108249. [Google Scholar] [CrossRef]
  12. Ahmmed, M.K.; Ahmmed, F.; Tian, H.S.; Carne, A.; Bekhit, A.E.A. Marine Omega-3 (n-3) Phospholipids: A Comprehensive Review of Their Properties, Sources, Bioavailability, and Relation to Brain Health. Compr. Rev. Food Sci. Food Saf. 2020, 19, 64–123. [Google Scholar] [CrossRef]
  13. Coșansu, S.; Mol, S.; Haskaraca, G. Sous-Vide Cooking: Effects on Seafood Quality and Combination with Other Hurdles. Int. J. Gastron. Food Sci. 2022, 29, 100586. [Google Scholar] [CrossRef]
  14. Raza, M.L.; Hassan, S.T.; Jamil, S.; Fatima, W.; Fatima, M. Nutritional Interventions in Depression: The Role of Vitamin D and Omega-3 Fatty Acids in Neuropsychiatric Health. Clin. Nutr. 2025, 45, 270–280. [Google Scholar] [CrossRef] [PubMed]
  15. Golgolipour, S.; Khodanazary, A.; Ghanemi, K. Effects of Different Cooking Methods on Minerals, Vitamins and Nutritional Quality Indices of Grass Carp (Ctenopharyngodon idella). Iran. J. Fish. Sci. 2019, 18, 110–123. [Google Scholar] [CrossRef]
  16. Orlando, P.; Giardinieri, A.; Lucci, P.; Nartea, A.; Balzano, M.; Pacetti, D.; Frega, N.G.; Silvestri, S.; Tiano, L. Impact of Traditional and Mild Oven Cooking Treatments on Antioxidant Compounds Levels and Oxidative Status of Atlantic Salmon (Salmo salar) Fillets. LWT Food Sci. Technol. 2020, 134, 110011. [Google Scholar] [CrossRef]
  17. Zhou, Y.; He, A.; Xu, B. Natural Resources, Quantification, Microbial Bioconversion, and Bioactivities of Vitamin B12 for Vegetarian Diet. Food Chem. 2025, 463, 140849. [Google Scholar] [CrossRef] [PubMed]
  18. Schmid, A.; Walther, B. Natural Vitamin D Content in Animal Products. Adv. Nutr. 2013, 4, 453–462. [Google Scholar] [CrossRef]
  19. Scanlon, N.L. Catering Management, 4th ed.; John Wiley & Sons: Hoboken, NJ, USA, 2012; ISBN 1-118-09149-3. [Google Scholar]
  20. Mîșu, G.A.; Canja, C.M.; Lupu, M.; Matei, F. Advances and Drawbacks of Sous-Vide Technique—A Critical Review. Foods 2024, 13, 2217. [Google Scholar] [CrossRef]
  21. ISO 9001:2015; Quality Management Systems. Requirements. International Organization for Standardization: Geneva, Switzerland, 2015.
  22. ISO 22000:2018; Food Safety Management Systems. Requirements for Any Organization in the Food Chain. International Organization for Standardization: Geneva, Switzerland, 2018.
  23. Rotaru, G.; Sava, N.; Borda, D.; Stanciu, S. Food Quality and Safety Management Systems: A Briief Analysis of the Individual and Integrated Approaches. Sci. Res. Agroaliment. Process. Technol. 2005, XI, 229–236. [Google Scholar]
  24. ISO 1442:2023; Meat and Meat Products. Determination of moisture content. Reference method. International Organization for Standardization: Geneva, Switzerland, 2023.
  25. AOAC 923.09-1923; Invert Sugar in Sugars and Syrups. Lane-Eynon General Volumetric Method. Association of Official Analytical Chemists: Rockville, MD, USA, 1923.
  26. SR ISO 1443:2008; Meat and Meat Products. Determination of total fat content. ASRO—Romanian Standards Association: Bucharest, Romania, 2008.
  27. ISO 5983-1:2005; Animal Feeding Stuffs. Determination of Nitrogen Content and Calculation of Crude Protein Content. International Organization for Standardization: Geneva, Switzerland, 2005.
  28. ISO 8968-4:2016; Milk and Milk Products. Determination of Nitrogen Content. International Organization for Standardization: Geneva, Switzerland, 2016.
  29. Bhat, Z.F.; Morton, J.D.; Bekhit, A.E.A.; Kumar, S.; Bhat, H.F. Effect of Processing Technologies on the Digestibility of Egg Proteins. Compr. Rev. Food Sci. Food Saf. 2021, 20, 4703–4738. [Google Scholar] [CrossRef]
  30. ISO 112966-4:2015; Animal and Vegetable Fats and Oils. Gas Chromatography of Fatty Acid Methyl esters. International Organization for Standardization: Geneva, Switzerland, 2015.
  31. European Commission. Commission Regulation (EC) No 152/2009 of 27 January 2009 laying down the methods of sampling and analysis for the official control of feed. Off. J. Eur. Union 2009, L54, 1–130. Available online: https://eur-lex.europa.eu/legal-content/EN/TXT/?uri=CELEX:32009R0152 (accessed on 20 January 2025).
  32. ISO 4833:2013; Microbiology of the Food Chain. Horizontal Method for the Enumeration of Microorganisms. International Organization for Standardization: Geneva, Switzerland, 2013.
  33. ISO 21527-1:2008; Microbiology of Food and Animal Feeding Stuffs. Horizontal Method for the Enumeration of Yeasts and Moulds. International Organization for Standardization: Geneva, Switzerland, 2008.
  34. ISO 4831:2006; Microbiology of Food and Animal Feeding Stuffs. Horizontal Method for the Detection and Enumeration of Coliforms. Most probable number technique. International Organization for Standardization: Geneva, Switzerland, 2006.
  35. ISO 6579-1:2017; Microbiology of the Food Chain. Horizontal Method for the Detection, Enumeration and Serotyping of Salmonella. International Organization for Standardization: Geneva, Switzerland, 2017.
  36. ISO 11290-1:2017; Microbiology of the Food Chain. Horizontal Method for the Detection and Enumeration of Listeria monocytogenes and of Listeria spp. International Organization for Standardization: Geneva, Switzerland, 2017.
  37. Chan, S.S.; Iversen, S.G.; Skuland, A.V.; Rotabakk, B.T.; Lerfall, J.; Rognsa, G.H.; Roth, B. Using Renowned Chefs for VeriTasteTM as a Sensory Method Analysis in Food Products—A Comparison of Atlantic Salmon Stored in Refrigerated Seawater and on Ice. Int. J. Gastron. Food Sci. 2023, 31, 100635. [Google Scholar] [CrossRef]
  38. ISO 8589:2007; Sensory Analysis. General Guidance for the Design of Test Rooms. International Organization for Standardization: Geneva, Switzerland, 2007.
  39. JASP Team. JASP, version 0.19.3; computer software; JASP Team: Amsterdam, The Netherlands, 2024. [Google Scholar]
  40. Breiman, L. Random Forests. Mach. Learn. 2001, 45, 5–32. [Google Scholar] [CrossRef]
  41. Tibshirani, R.; Walther, G.; Hastie, T. Estimating the Number of Clusters in a Data Set via the Gap Statistic. J. R. Stat. Soc. Ser. B Stat. Methodol. 2001, 63, 411–423. [Google Scholar] [CrossRef]
  42. Ellison, B.; Muth, M.K.; Golan, E. Opportunities and Challenges in Conducting Economic Research on Food Loss and Waste. Appl. Econ. Perspect. Policy 2019, 41, 1–19. [Google Scholar] [CrossRef]
  43. Lassen, A.; Kall, M.; Hansen, K.; Ovesen, L. A Comparison of the Retention of Vitamins B1, B2 and B6, and Cooking Yield in Pork Loin with Conventional and Enhanced Meal-Service Systems. Eur. Food Res. Technol. 2002, 215, 194–199. [Google Scholar] [CrossRef]
  44. Roldán, M.; Antequera, T.; Martin, A.; Mayoral, A.I.; Ruiz, J. Effect of Different Temperature–Time Combinations on Physicochemical, Microbiological, Textural and Structural Features of Sous-Vide Cooked Lamb Loins. Meat Sci. 2013, 93, 572–578. [Google Scholar] [CrossRef]
  45. Alfaifi, B.M.; Ah-Ghamdi, S.; Othman, M.B.; Hobani, A.I.; Suliman, G.M. Advanced Red Meat Cooking Technologies and Their Effect on Engineering and Quality Properties: A Review. Foods 2023, 12, 2564. [Google Scholar] [CrossRef] [PubMed]
  46. Ángel-Rendón, S.V.; Filomena-Ambrosio, A.; Hernández-Carrión, M.; Llorca, E.; Hernando, I.; Quiles, A.; Sotelo-Díaz, I. Pork Meat Prepared by Different Cooking Methods. A Microstructural, Sensorial and Physicochemical Approach. Meat Sci. 2020, 163, 108089. [Google Scholar] [CrossRef]
  47. Bhat, Z.F.; Morton, J.D.; Bekhit, A.E.A.; Kumar, S.; Bhat, H.F. Thermal Processing Implications on the Digestibility of Meat, Fish and Seafood Proteins. Compr. Rev. Food Sci. Food Saf. 2021, 20, 4511–4548. [Google Scholar] [CrossRef]
  48. Inchingolo, R.; Cardenia, V.; Rodriguez-Estrada, M.T. The Effects of Microwave Heating on Edible Oils and Lipid-containing Food. Lipid Technol. 2013, 25, 59–61. [Google Scholar] [CrossRef]
  49. Leskova, E.; Kubikova, J.; Kovacikova, E.; Kosicka, M.; Porubska, J.; Holcikova, K. Vitamin Losses: Retention during Heat Treatment and Continual Changes Expressed by Mathematical Models. J. Food Compos. Anal. 2006, 19, 252–276. [Google Scholar] [CrossRef]
  50. Lee, S.; Choi, Y.; Jeong, H.S.; Lee, J.; Sung, J. Effect of Different Cooking Methods on the Content of Vitamins and True Retention in Selected Vegetables. Food Sci. Biotechnol. 2018, 27, 333–342. [Google Scholar] [CrossRef]
  51. Demir, K.; Tezcan, E.E.; Kesik, S.; Ugur, H.; Yaman, M.; Catak, J. Riboflavin Cooking Losses and Bioaccessibility in Red Meats. J. Culin. Sci. Technol. 2023, 1–15. [Google Scholar] [CrossRef]
  52. Mogoș, T.V. Alimentația În Bolie de Nutriție Și Metabolism; Editura Didactică și Pedagogică: Bucharest, Romania, 1997; Volume 1, ISBN 973-30-5888-2. [Google Scholar]
  53. Choe, E.; Huang, R.; Min, D.B. Chemical Reactions and Stability of Riboflavin in Foods. J. Food Sci. 2006, 70, R28–R36. [Google Scholar] [CrossRef]
  54. Böhm, V.; Kühnert, S.; Rohm, H.; Scholze, G. Improving the Nutritional Quality of Microwave-Vacuum Dried Strawberries: A Preliminary Study. Food Sci. Technol. Int. 2006, 12, 67–75. [Google Scholar] [CrossRef]
  55. Kala, A.; Prakash, J. Nutritional Composition and Sensory Profile of Microwave and Conventionally Cooked Vegetables. Foodserv. Res. Int. 2005, 15, 1–12. [Google Scholar] [CrossRef]
  56. Rickman, J.C.; Barrett, D.M.; Bruhn, C.M. Nutritional Comparison of Fresh, Frozen and Canned Fruits and Vegetables. Part 1. Vitamins C and B and Phenolic Compounds. J. Sci. Food Agric. 2007, 87, 930–944. [Google Scholar] [CrossRef]
  57. Awonorin, S.O.; Bamiro, F.O.; Ayoade, J.A. The Effect of Freezing Rate, Storage and Cooking on Some B-Vitamins in Beef and Pork Roast. Foodserv. Res. Int. 1996, 9, 7–23. [Google Scholar] [CrossRef]
  58. Kumar, S.; Aalbersberg, B. Nutrient Retention in Foods after Earth-Oven Cooking Compared to Other Forms of Domestic Cooking☆: 2. Vitamins. J. Food Compos. Anal. 2006, 19, 311–320. [Google Scholar] [CrossRef]
  59. Gentry, T.S.; Roberts, J.S. Formation Kinetics and Application of 5-Hydroxymethylfurfural as a Time–Temperature Indicator of Lethality for Continuous Pasteurization of Apple Cider. Innov. Food Sci. Emerg. Technol. 2004, 5, 324–333. [Google Scholar] [CrossRef]
  60. Roberts, J.; Walker, L.T.; Anderson, J.C. Assessment of Microwave Blanching as a Preparatory Tool for Home Freezing of Yellow Squash (Cucurbita pepo); Institute of Food Technologists Annual Meeting: Las Vegas, NV, USA, 2004; p. 67C-32. [Google Scholar]
  61. Diguță, C.F.; Mihai, C.; Toma, R.C.; Cîmpeanu, C.; Matei, F. In Vitro Assessment of Yeasts Strains with Probiotic Attributes for Aquaculture Use. Foods 2022, 12, 124. [Google Scholar] [CrossRef]
  62. European Commission. Commission Regulation (EC) No 2073/2005 of 15 November 2005 on Microbiological Criteria for Foodstuffs. Off. J. Eur. Union 2005, L338, 1–26. Available online: https://eur-lex.europa.eu/legal-content/EN/TXT/?uri=CELEX%3A32005R2073 (accessed on 20 January 2025).
  63. Malak, N.M.L.; Abdel-Naeem, H.H.S.; Abdelsalam, A.A.; Ezzat, G.A. A Comparative Study Concerning the Sensory, Physicochemical, Bacteriological, Nutritional Quality, Heavy Metal Content, and Health Risk Assessment of Some Low-Cost Fish Species. Food Control 2025, 169, 111023. [Google Scholar] [CrossRef]
  64. Cyprian, O.O.; Van Nguyen, M.; Sveinsdottir, K.; Jonsson, A.; Tomasson, T.; Thorkelsson, G.; Arason, S. Influence of Smoking and Packaging Methods on Lipid Stability and Microbial Quality of Capelin (Mallotus villosus) and Sardine (Sardinella gibossa). Food Sci. Nutr. 2015, 3, 404–414. [Google Scholar] [CrossRef] [PubMed]
  65. Vatavali, K.; Karakosta, L.; Nathanailides, C.; Georgantelis, D.; Kontominas, M.G. Combined Effect of Chitosan and Oregano Essential Oil Dip on the Microbiological, Chemical, and Sensory Attributes of Red Porgy (Pagrus pagrus) Stored in Ice. Food Bioprocess Technol. 2013, 6, 3510–3521. [Google Scholar] [CrossRef]
  66. Mol, S.; Ozurtan, S.; Cosansu, S. Determination of the Quality and Shelf Life of Sous Vide Packaged Bonito (Sarda sarda, Bloch, 1793) Stored at 4 and 12 C. J. Food Qual. 2011, 35, 137–143. [Google Scholar] [CrossRef]
  67. Cetinkaya, T.; Ceylan, Z.; Meral, R.; Kilicer, A.; Altay, F. A Novel Strategy for Au in Food Science: Nanoformulation in Dielectric, Sensory Properties, and Microbiological Quality of Fish Meat. Food Biosci. 2021, 41, 101024. [Google Scholar] [CrossRef]
  68. Zhang, Y.; Li, Q.; Li, D.; Liu, X.; Luo, Y. Changes in the Microbial Communities of Air-Packaged and Vacuum-Packaged Common Carp (Cyprinus carpio) Stored at 4 °C. Food Microbiol. 2015, 52, 197–204. [Google Scholar] [CrossRef]
  69. Arkoudelos, J.; Stamatis, N.; Samaras, F. Quality Attributes of Farmed Eel (Anguilla anguilla) Stored under Air, Vacuum and Modified Atmosphere Packaging at 0 °C. Food Microbiol. 2007, 24, 728–735. [Google Scholar] [CrossRef]
  70. Sebastia, C.; Soriano, J.M.; Iranzo, M.; Rico, H. Microbiological Quality of Sous Vide Cook-Chill Preserved Food at Different Shelf Life. J. Food Process. Preserv. 2010, 34, 964–974. [Google Scholar] [CrossRef]
  71. Picouet, P.A.; Cofan-Carbo, S.; Vilaseca, H.; Carbone Ballbe, L.; Castells, P. Stability of Sous-Vide Cooked Salmon Loins Processed by High Pressure. Innov. Food Sci. Emerg. Technol. 2011, 12, 26–31. [Google Scholar] [CrossRef]
  72. Nguvava, J.P. Effects of Post Harvest Handling on Quality and Sensory Attributes of Sardines: A Case Study of Musoma District. Master’s Thesis, Sokoine University of Agriculture, Morogoro, Tanzania, 2013. [Google Scholar]
  73. Antelm, P.; Juma, I.; Rweyemamu, L.M.P.; Kaale, L.D. Effects of Vacuum Packaging and Chilling Storage on the Microbiological Changes of the Superheated Steam Dried Sardines. Tanzan. J. Sci. 2023, 49, 140–151. [Google Scholar] [CrossRef]
Figure 1. Total aerobic mesophilic bacterial count (log10 CFU/g) in the different catering fish dishes cooked using different techniques (A0—control; A1—sous vide cook–serve; A2—convection cook–serve; A3—microwave cook–serve; A4—convection cook–chill; A5—convection cook–freeze). The results are expressed as the mean value of the three replicates ± the standard deviation (SD); different letters indicate significant differences (Tukey’s test, p ≤ 0.05).
Applsci 15 04417 g001
Figure 2. The determination of clusters optimized in accordance with the Bayesian Information Criterion (BIC) for the eight samples of fish dishes: A1: Sous vide cooking—cook–serve (SV-CS), A2: Convective cooking—cook–serve (CC-CS), A3: Microwave cooking—cook–serve (Mw-CS), A4: Convective cooking—cook–chill (CC-CC), A5: Convective cooking—cook–freeze (CC-CF), OA1: Enhanced sample Sous vide cooking—cook–serve (SV-CS), OA2: Enhanced sample convective cooking—cook–serve (CC-CS), and OA3: Enhanced sample microwave cooking—cook–serve (Mw-CS). Akaike Information Criterion (AIC); within sum of squares (WSS).
Applsci 15 04417 g002
Figure 3. Two-dimensional t-SNE plot illustrating clustering for the eight samples of fish dishes: A1: Sous vide cooking—cook–serve (SV-CS), A2: Convective cooking—cook–serve (CC-CS), A3: Microwave cooking—cook–serve (Mw-CS), A4: Convective cooking—cook–chill (CC-CC), A5: Convective cooking—cook–freeze (CC-CF), OA1: Enhanced sample Sous vide cooking—cook–serve (SV-CS), OA2: Enhanced sample convective cooking—cook–serve (CC-CS), and OA3: Enhanced sample microwave cooking—cook–serve (Mw-CS).
Applsci 15 04417 g003
Table 1. Sample codes and applied cooking methods.
Applied TreatmentSample CodeCooking Method
NoneA0None; this sample was tested without applying any thermal treatment.
Sous vide cooking—cook–serve (SV-CS)A1The product was placed in a bag (Saporoso, Brașov, Romania) that was then vacuum sealed (SAM Cook, Milanówek, Poland) and cooked at 55 °C for 40 min in a sous vide cooker (Hendi, Ghimbav, Romania).
Convective cooking—cook–serve (CC-CS)A2In this cook–serve production system, convection baking (without steam) in an electrical oven (Rational, Luton, UK) was chosen. The product was baked at 170 °C for 25 min.
Microwave cooking—cook–serve (Mw-CS)A3The product was cooked in a microwave oven (Galanz, Foshan, China) for this cook–serve production system at 567 W for 15 min.
Convective cooking—cook–chill (CC-CC)A4In this cook–chill production system, convection baking (without steam) in an electrical oven (Rational, UK) was also chosen. The product was baked at 180 °C for 25 min.
After cooking, the product was cooled in a controlled manner, in two stages: down to 20 °C in the first 60 min and down to 4 °C in the next 60 min, using a rapid blast chiller (Afinox, Campo San Martino, Italy).
Convective cooking—cook–freeze (CC-CF)A5In this cook–freeze production system, convection baking (without steam) in an electrical oven (Rational, UK) was also chosen. The product was baked at 180 °C for 25 min.
After cooking, the product was cooled and then frozen, in a controlled manner, in three stages: down to 20 °C in the first 60 min, down to 4 °C in the following 60 min, and down to −18 °C in the last 60 min, using a rapid blast chiller (Afinox, Campo San Martino, Italy).
Table 2. Microbiological indicators.
Microbiological AnalysesAnalysis Methods
Quantitative Evaluation * of Microbiological Quality
1.Total Aerobic Microbial Count/Aerobic Plate Count (APC)Classic method, according to ISO 4833:2013 [32]
2.Total Yeast and Mold Count TYMCClassic method, according to ISO 21527-1:2008 [33]
3.Total Coliform CountClassic method, according to ISO 4831:2006 [34]
Quantitative evaluation * of pathogenic bacteria
4.Staphylococcus aureus countRapid TEMPO method (BioMerieux Industry, France).
5.Bacillus cereus count
6.Escherichia coli count
Qualitative evaluation ** of the presence/absence of pathogenic bacteria
7.Salmonella sp. detectionISO 6579:2017 [35]
8.Listeria monocytogenes detectionISO 11290-1:2017 [36]
* With a VITEK 2 Compact system (Biomerieux, Craponne, France); ** with a Vidas Next Day rapid kit (BioMerieux, Craponne, France).
Table 3. Cooking losses and macronutrient and vitamin content.
A0A1A2A3A4A5
Content loss, %-14.25 ± 1.57 a30.91 ± 2.01 b28.55 ± 1.23 b35.68 ± 2.32 c40.25 ± 1.57 d
Dry substance, %30.98 ± 0.02 a31.84 ± 0.04 a31.47 ± 0.38 a31.40 ± 0.08 a33.57 ± 0.04 b33.86 ± 0.04 b
Proteins, % 14.32 ± 0.02 a15.22 ± 0.09 a16.66 ± 0.12 b15.90 ± 0.16 a16.93 ± 0.21 c17.36 ± 0.03 c
Insoluble proteins, %4.37 ± 0.01 a1.53 ± 0.05 b1.53 ± 0.05 b1.78 ± 0.02 c2.15 ± 0.04 c1.58 ± 0.02 b
Digestibility, %69.51 a89.9189.91 ± 0.03 c89.31 ± 0.20 c86.48 ± 0.11 b90.67 ± 0.21 c
Carbohydrates, %0.73 ± 0.02 a1.10 ± 0.04 b1.05 ± 0.04 b1.93 ± 0.05 c1.23 ± 0.05 b1.25 ± 0.01 b
Lipids, % 15.01 ± 0.09 a14.2 ± 0.08 b13.64 ± 0.06 c13.93 ± 0.05 c14.71 ± 0.09 b14.81 ± 0.01 b
Hydro-soluble vitamins
Thiaminemg0.0478 ± 0.01 a0.0347 ± 0.01 b0.0256 ± 0.01 c0.0289 ± 0.01 c0.0183 ± 0.01 d0.0159 ± 0.01 d
TR%100 ± 0.01 a72.51 ± 0.01 b55.32 ± 0.01 c63.08 ± 0.01 c41.49 ± 0.01 d36.45 ± 0.01 d
Riboflavinmg0.0465 ± 0.01 a0.0333 ± 0.01 b0.0257 ± 0.01 c0.0275 ± 0.01 c0.0193 ± 0.02 c0.02 ± 0.01 c
TR%100 ± 0.01 a71.67 ± 0.01 b55.33 ± 0.01 c59.20 ± 0.01 c41.57 ± 0.01 c34.69 ± 0.01 c
Niacinmg5.24 ± 0.06 a3.22 ± 0.04 b2.05 ± 0.04 c2.13 ± 0.01 c1.23 ± 0.01 d1.14 ± 0.05 d
TR%100 ± 0.01 a61.49 ± 0.04 b39.21 ± 0.04 c40.74 ± 0.01 c23.42 ± 0.01 d21.77 ± 0.01 d
Fat-soluble vitamins
Retinolmg0.3411 ± 0.02 a0.2123 ± 0.01 b0.1251 ± 0.01 c0.1148 ± 0.01 c0.0941 ± 0.01 c0.0917 ± 0.01 c
TR%100 ± 0.01 a62.24 ± 0.01 b37.89 ± 0.02 c34.10 ± 0.01 c29.85 ± 0.01 c29.40 ± 0.01 c
α-Tocopherolmg0.62 ± 0.02 a0.32 ± 0.02 b0.26 ± 0.03 c0.22 ± 0.02 c0.21 ± 0.02 c0.12 ± 0.04 d
TR%100 ± 0.01 a51.61 ± 0.02 b43.33 ± 0.01 c35.95 ± 0.01 c36.65 ± 0.01 c21.17 ± 0.01 d
Nutrient content values, dry substance, digestibility, and content loss are expressed as percentages of the total mass of each product/sample. The results are expressed as the mean value of the three replicates ± the standard deviation (SD); different letters in superscript on the same line indicate significant differences (Tukey’s test, p ≤ 0.05). TR% = true retention of vitamins after cooking treatments.
Table 4. Fatty acid content.
Fatty Acids (%)A0A1A2A3
C6:0; Caproic7.59 ± 0.01 a2.18 ± 0.01 b2.29 ± 0.01 b0.42 ± 0.01 c
C8:0; Caprylic0.2 ± 0.04 a0.21 ± 0.01 a0.22 ± 0.01 a0.34 ± 0.03 b
C10:0; Capric0.23 ± 0.01 a0.22 ± 0.01 a0.22 ± 0.01 a0.33 ± 0.01 b
C11:0; Undecanoicn.d.n.d.n.d.n.d.
C12:0; Lauric2.12 ± 0.04 a2.24 ± 0.02 b2.49 ± 0.01 c3.49 ± 0.02 d
C13:0; Tridecanoicn.d.n.d.n.d.n.d.
C14:0; Myristic3.18 ± 0.02 a3.1 ± 0.03 a3.05 ± 0.01 b3.14 ± 0.02 a
C14:1; Myristoleic0.16 ± 0.01n.d.n.d.n.d.
C15:0; Pentadecanoic0.22 ± 0.02 a0.18 ± 0.01 b0.18 ± 0.01 b0.18 ± 0.01 b
C15:1, cis-10; Pentadecanoicn.d.0.07 ± 0.01 a0.07 ± 0.01 an.d.
C16:0; Palmitic12.5 ± 0.87 a13.12 ± 0.01 b14.18 ± 0.02 c14.08 ± 0.02 c
C16:1; Palmitoleic3.85 ± 0.09 a4.08 ± 0.01 b4.19 ± 0.01 b4.01 ± 0.01 ab
C17:0; Heptadecenoic0.23 ± 0.01 an.d.n.d.n.d.
C17:1, cis-10; Heptadecenoicn.d.n.d.n.d.n.d.
C18:0; Stearic3.93 ± 0.01 a4.64 ± 0.01 b4.88 ± 0.02 b5.48 ± 0.02 c
C18:1, cis-9; Oleic25.65 ± 0.09 a28.82 ± 0.02 b30.05 ± 0.02 c29.1 ± 0.09 b
C18:1 iso, trans-9; Elaidic2.17 ± 0.01 a2.18 ± 0.01 a2.21 ± 0.01 b2.18 ± 0.01 a
C18:2, cis-9, cis-12; Linoleic (n-6)8.27 ± 0.01 a9.04 ± 0.01 b9.11 ± 0.01 c8.7 ± 0.02 b
C18:3, cis-9, cis-12, cis-15; Linolenic (n-3)2.14 ± 0.01 a1.96 ± 0.01 a2.02 ± 0.01 a1.76 ± 0.01 b
C20:0; Arahidic0.22 ± 0.01 a4.1 ± 0.01 b6.62 ± 0.03 c4.27 ± 0.03 b
C20:1,cis-11; Eicosenoic2.63 ± 0.01 a2.86 ± 0.01 a2.76 ± 0.02 a2.24 ± 0.01 b
C20:2, cis-11, cis-14; Eicosadienoic (n-6)2.16 ± 0.01 a3.21 ± 0.01 b3.07 ± 0.02 b3.22 ± 0.03 b
S.F.A.30.42 ± 0.77 a29.99 ± 0.05 a34.13 ± 0.05 b31.73 ± 0.03 a
M.U.F.A.34.46 ± 0.16 a37.94 ± 0.03 b39.21 ± 0.02 c37.53 ± 0.08 b
P.U.F.A.12.57 ± 0.02 a14.21 ± 0.02 b 14.2 ± 0.03 b13.68 ± 0.16 c
U.F.A/S.F.A1.55 ± 0.03 a1.74 ± 0.01 b1.56 ± 0.01 a1.61 ± 0.01 a
P.U.F.A./S.F.A0.41 ± 0.01 a0.47 ± 0.01 a0.42 ± 0.01 a0.43 ± 0.01 a
n-6/n-34.87 ± 0.01 a6.25 ± 0.01 b6.03 ± 0.01 b6.77 ± 0.11 c
SFAs—saturated fatty acids; MUFAs—monounsaturated fatty acids; PUFAs—polyunsaturated fatty acids; UFAs—unsaturated fatty acids. All values are expressed as percentages of fatty acids out of the total fatty acid content. The results are expressed as the mean value of the three replicates ± the Standard Deviation (SD); different letters in superscript on the same line indicate significant differences (Tukey’s test, p ≤ 0.05).
Table 5. Microbiological quality of the fish dishes.
SampleAPC (CFU/g ± SD)TYMC (CFU/g ± SD)Coliforms (CFU/g ± SD)E. coli (CFU/g ± SD)Salmonella sp. (CFU/25 g)Listeria sp. (CFU/25 g)
A0 (1.037 ± 0.071) × 104 a(2.69 ± 0.11) × 102 a(2.6 ± 0.11) × 101 a7 ± 0.58 andnd
A1 (4.27 ± 0.10) × 103 b(6.14 ± 0.04) × 101b(1.67 ± 0.09) × 101 b4.67 ± 0.94 bndnd
A2 (4 ± 0.01) × 103 b(6.1 ± 0.32) × 101 b(1.1 ± 0.11) × 101 b3 ± 0.58 bndnd
A3 (9.83 ± 0.76) × 102 c(4.7 ± 0.15) × 101 c3 ± 0.15 cndndnd
A4 (5.83 ± 0.29) × 103 d(6.2 ± 0.67) × 101 b4 ± 0.8 cndndnd
A4-a (day 1)(5.67 ± 0.29) × 103 d(7 ± 0.25) × 101 d2 ± 0.58 cndndnd
A4-b (day 2)(6.50 ± 0.5) × 103 e(7 ± 0.38) × 101 d1 ± 0.58 cndndnd
A4-c (day 3)(6.67 ± 0.58) × 103 e(8.2 ± 0.29) × 101 e1 ± 0.58 cndndnd
A4-d (day 4)(7 ± 0.5) × 103 f(8.7 ± 0.58) × 101 e1 ± 0.58 cndndnd
A4-e (day 5)(6.83 ± 0.29) × 103 e(1.07 ± 0.06) × 102 f1 ± 0.58 cndndnd
A5 (4.97 ± 0.15) × 103 b(2.4 ± 0.2) × 101 g3 ± 1.15 cndndnd
A5-a (day 10)(4.63 ± 0.12) × 103 b(2.3 ± 0.16) × 101 g2 ± 0.58 c ndndnd
A5-b (day 20)(4.5 ± 0.01) × 103 b(2.1 ± 0.16) × 101 g3 ± 1.15 cndndnd
A5-c (day 30)(4.17 ± 0.29) × 103 b(2.1 ± 0.16) × 101 g2 ± 0.58 cndndnd
A5-d (day 40)(4.5 ± 0.01) × 103 b(2.2 ± 0.2) × 101 g1 ± 0.58 cndndnd
A5-c (day 50)(5.13 ± 0.23) × 103 d(2.0 ± 0.2) × 101 g1 ± 0.58 cndndnd
The results are expressed as the mean value of the three replicates ± the standard deviation (SD); different letters in superscript within the same column indicate significant differences (Tukey’s test, p ≤ 0.05).
Table 6. Scores of sensory attributes for the fish dish samples.
TreatmentSampleExterior AppearanceInterior AppearanceConsistencyOdorTasteOverall AcceptabilityTotal Points
Sous vide cook–serve (SV-CS)A17.73 ± 0.44 b7.77 ± 0.50 bc8.30 ± 0.69 a8.37 ± 0.56 b8.43 ± 0.48 b8.27 ± 0.29 b8.15 ± 0.31 b
Convective cooking cook–serve (CC-CS)A28.20 ± 0.48 a8.23 ± 0.76 a8.30 ± 0.59 a8.50 ± 0.62 a8.73 ± 0.51 a8.50 ± 0.61 a8.41 ± 0.40 a
Microwave cook–serve (Mw-CS)A37.40 ± 0.51 cd7.70 ± 0.46 c8.07 ± 0.51 b8.07 ± 0.56 e8.00 ± 0.64 d8.20 ± 0.33 b7.91 ± 0.45 c
Convective cooking cook–chill (CC-CC)A47.67 ± 0.55 bc7.47 ± 0.85 d8.07 ± 0.71 c8.13 ± 0.47 d8.13 ± 0.35 c7.87 ± 0.65 c7.89 ± 0.29 c
Convective cooking cook–freeze (CC-CF)A57.20 ± 0.65 d7.77 ± 0.88 c7.97 ± 0.62 d7.97 ± 0.51 f7.7 ± 0.67 d7.87 ± 0.59 c7.75 ± 0.71 c
Fine dining of A1OA17.07 ± 0.21 d7.23 ± 0.32 e8.33 ± 0.50 a8.37 ± 0.51 b8.37 ± 0.62 b8.23 ± 0.44 b7.93 ± 0.63 c
Fine dining of A2OA28.37 ± 0.34 a8.27 ± 0.38 a8.30 ± 0.48 a8.57 ± 0.50 a8.73 ± 0.56 a8.57 ± 0.33 a8.47 ± 0.57 a
Fine dining of A3OA37.73 ± 0.41 bc7.90 ± 0.46 b8.07 ± 0.44 c8.27 ± 0.61 c8.20 ± 0.39 c8.23 ± 0.62 b8.07 ± 0.43 b
The results are expressed as the mean value of the three replicates ± the standard deviation (SD); different letters in superscript within the same column indicate significant differences (Tukey’s test, p ≤ 0.05). A nine-point hedonic scale was used, where 1: extremely unacceptable and 9: extremely acceptable. The total score was calculated as the mean of the 6 sensory parameters recorded for each sample.
Disclaimer/Publisher’s Note: The statements, opinions and data contained in all publications are solely those of the individual author(s) and contributor(s) and not of MDPI and/or the editor(s). MDPI and/or the editor(s) disclaim responsibility for any injury to people or property resulting from any ideas, methods, instructions or products referred to in the content.

