1. Introduction
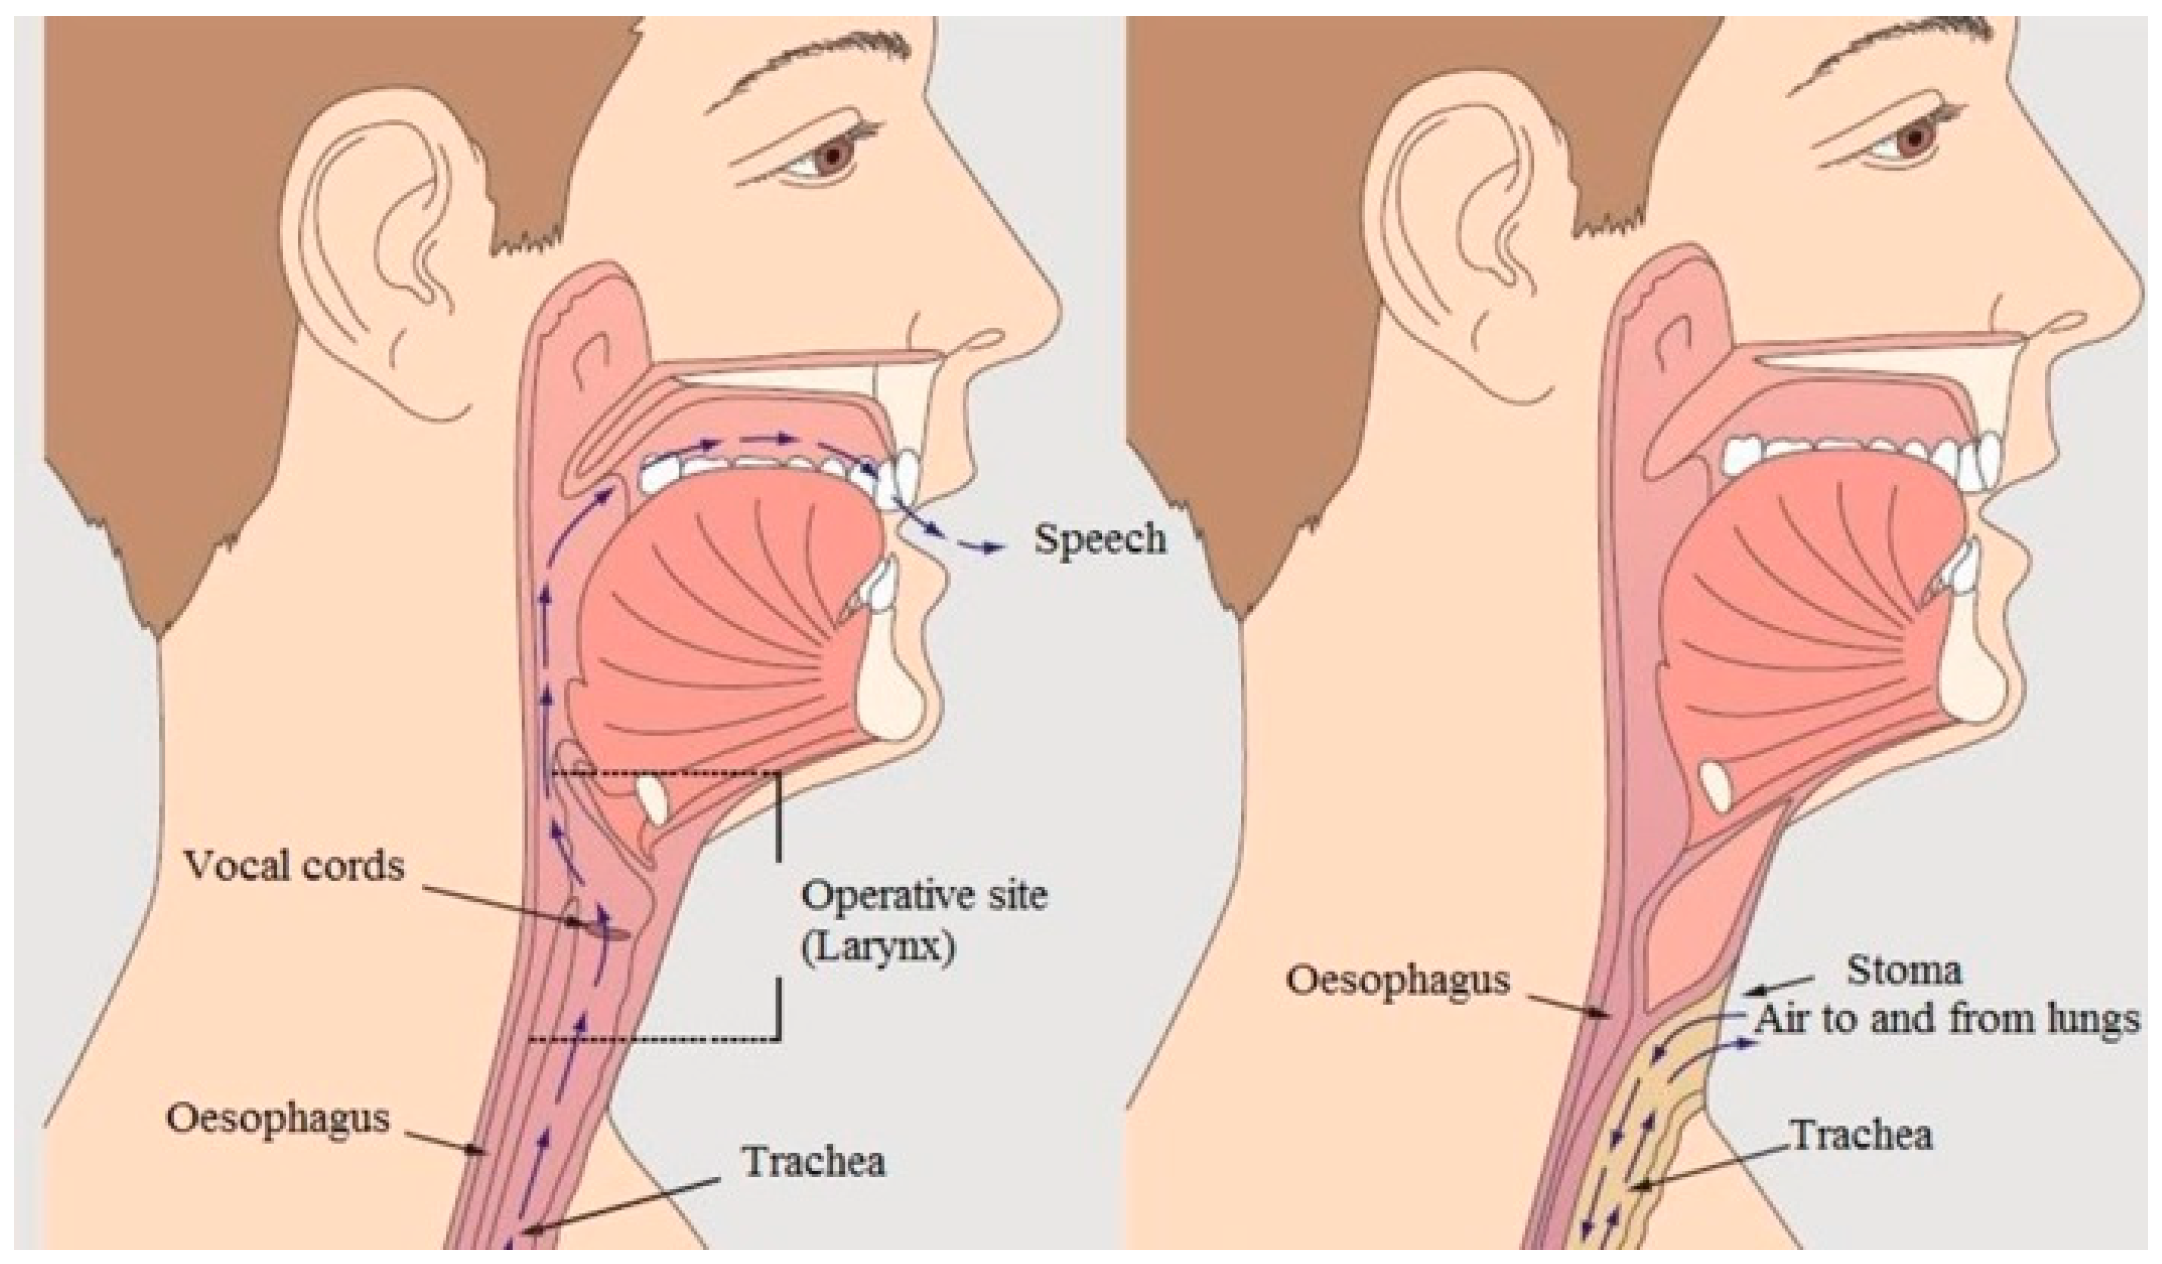
Following laryngeal cancer and total laryngectomy, patients lose the ability to communicate using spoken language. People suffering from laryngeal cancer undergo a laryngectomy surgery, which involves removing the larynx (which contains the vocal cords) and separating the respiratory tract from the nasal cavity and mouth. The consequences of total laryngectomy and the organ system in a healthy and a laryngectomised person are shown in
Figure 1.
Total laryngectomy is a life-saving procedure, performed only when the cancer is so advanced that it is impossible to use alternative methods of treatment. However, the post-operative mutilation of the patient is significant and for these people, effective rehabilitation, the aim of which is to develop the ability to use substitute speech, is a priority. There are three methods of speech rehabilitation:
tracheoesophageal (TE),
electrolarynx (EL)
oesophageal speech (ES)
TE is a surgical and prosthetic procedure involving the implantation of a speech prosthesis, most often during laryngectomy surgery. It is also possible to implant a voice prosthesis after the completion of oncological treatment. In this surgical procedure, a fistula is placed between the trachea and the oesophagus, allowing patients to produce tracheoesophageal phonation with pulmonary air. This allows, when the tracheostomy opening is closed using a finger, exhaled air from the lungs to be directed to the oesophagus and hypopharynx [
1].
Figure 1.
Organ system in a healthy and a laryngectomised person. Visible tracheostomy [
2].
Figure 1.
Organ system in a healthy and a laryngectomised person. Visible tracheostomy [
2].
EL is a portable, battery-powered device that is pressed against the tissues of the neck to introduce electromechanical energy into the vocal tract [
3]. Although EL is easier to use, it has limitations that make it difficult to generate phonetic information such as accent and intonation, and EL speech sounds like machine speech.
ES is one of the major methods of speech rehabilitation. It is a learned technique in which air is swallowed (“injected”) into the and then allowed to escape through the pharynx. Appropriate tensing of the pharyngeal walls during expiratory airflow results in vibration of the pharyngeal walls, which creates sound. Oesophageal speech is typically of lower frequency pitch than normal speech frequencies because of the characteristics of the pharyngeal wall. The advantages of this technique are that it requires no surgical procedure, prosthesis, or cumbersome hand motions [
4,
5]. Sentences spoken with ES take longer than physiological speech because the patient has to replenish the swallowed air. ES is one of the most popular voice rehabilitation methods. The sounds obtained through ES are closer to the laryngeal voice compared to speech generated by TE and EL. However, their intelligibility and quality may be worse than in the case of laryngeal speech. It depends on the individual predispositions of the patient. Reduced oesophageal speech quality results from many factors, including low intensity and fundamental frequency (F0) and the presence of noises generated by its production mechanism [
6,
7]. The advantages of speech rehabilitation by ES include:
Disadvantages of oesophageal speech:
Learning takes a lot of time and must be intensive;
Not all people are able to master this method well;
Speech may be incomprehensible;
Speaking in short sentences and at a slower pace—having to swallow air while speaking [
8,
9].
Speech signal analysis can be performed by analysing the time domain, spectrum domain, cepstrum domain, and other solutions proposed by researchers. The ability to identify physical features of speech is provided by the MPEG-7 standard [
10] description definition database. In the article [
11], the authors present the possibilities of speech parametrisation using popular time domain and spectrum domain descriptors, whose high efficiency in recognising the general speech signal was also demonstrated in the works [
8,
12,
13].
The group of these popular MPEG-7 database descriptors includes, among others,
ZCR (zero-crossing rate)—a measurement used to determine the rate of zero crossings (crossing of the OX axis). This is determined as the percentage of audio samples in a given fragment that change sign. The ZCR is defined by the following equation [
14]:
where sgn(*) is the function, i.e.,
Short-time energy (
STE) is an audio descriptor from the MPEG-7 standard also used in speech classification. It describes the envelope of the signal.
STE is the sum of squares computed in the time domain over the length of the test frame of the signal. The
STE is expressed by the formula [
14]:
where
x(n)—the value of nth sample,
n—index of the sample,
N—signal length (total number of samples in the processing window).
The signal mean value (
SMV) descriptor expresses the average value of the input speech signal. Its value is estimated in the tested frame of the audio signal. It is calculated by summing the values of all samples and dividing by
N. The
SMV is given by [
14]:
The possibilities of ES parametrisation in time domain and spectrum domain using the above descriptors are also presented in the article [
12]. These studies have shown the effectiveness of descriptors for describing ES. Speech parametrisation could be also realised in the cepstrum domain, which is mainly used to describe the laryngeal tone. In paper [
15], the authors show the possibilities of improving automatic speech recognition (ASR) performance in noisy speech recognition cases by the using cepstrum domain. Cepstrum analysis and MFCC are also used to study ES, which is widely presented in [
8,
12]. In these articles, the effectiveness of recognising differences between ES and physiological speech based on cepstrum analysis is indicated. One of the most important parameters characterising the source of voiced speech is the fundamental frequency of the laryngeal tone (marked as F0), i.e., the fundamental frequency of the vocal fold vibrations, which are primarily a function of the mass, elasticity (stiffness), and the tension coefficient of the vocal cords [
16]. The value of the F0 frequency depends, among other things, on the gender, age, and emotional state of the speaker. For men, the F0 frequency takes values from the 80–480 Hz range, and for women, from the 160–960 Hz range (speech and singing are taken into account). It should also be noted that F0 is usually not stationary, but changes constantly in a sentence or spoken word. As mentioned above, ES is characterised by a lower sound frequency than natural speech due to the characteristics of the pharyngeal wall—of course, this also applies to F0. This article presents an in-depth analysis of the F0 frequency of ES in people following total laryngectomy. The obtained results were compared with natural speech. For the purposes of the study, a common frequency range was found for laryngectomised and healthy people and the same spoken words (in Polish) were analysed—each as a separate pattern. The author of this article aims to find significant differences in the F0 frequencies of oesophageal speech and natural speech using words that are used during the rehabilitation of patients following total laryngectomy. This research is a continuation of the ES analysis published earlier, but this time the focus was on the analysis of a narrow aspect of speech, namely the fundamental frequency F0. This study was approved by the bioethics committee (KB 178/2020).
2. Materials and Methods
The study group consisted of six people who had undergone a total laryngectomy surgery. This group consisted of three men aged 30 to 70 and three women aged 30 to 60. Those patients were undergoing speech rehabilitation related to learning ES. The patients had mastered the art of oesophageal speech at a communicative level. The words used by therapists for speech rehabilitation were selected for the study. The criterion for selecting the tested words depended on the speech therapists. All words were spoken in Polish. The selection of words depends on the characteristics and features of the Polish language and is related to articulation. Five words were selected for the study, which are presented in
Table 1.
The above-studied words are the basis for the rehabilitation of flowing speech, which is adapted to the specifics of the Polish language. Of particular importance is the articulation of the Polish “cz” (/t͡sɛ/) or “ś” (/ʃ/), which requires a specific positioning of the lips and tongue. The above is included in the tested words, which are the subject of the research described in this paper. The same is true for the pronunciation of the Polish “buł” (/bu͡w/), which is included in the test word “bułka” (Eng. a bread roll). The tested words were also recorded from healthy people, and the numerical results related to the F0 frequency studied were used as a reference point to assess the differences between oesophageal speech and physiological speech. The words to be analysed were recorded at the Bydgoszcz Laryngectomy Association (Bydgoszcz, Poland). The recordings were taken in a specially prepared room. The OMNITRONIC IM-1000 PRO condenser microphone (Steinigke Showtechnik GmbH, Waldbüttelbrunn, Germany) was used. Details of the microphone are as follows:
All speech samples were recorded in WAV format with a sampling rate of 44,100 Hz and 16 bits/sample. The mean durations of the studied words for healthy and laryngectomised people are presented in
Table 2.
The research being carried out is a continuation of the analysis of oesophageal speech. In previous research, a broad analysis of the time domain, frequency domain, and cepstrum was carried out, and the results were presented in paper [
12]. In addition, an analysis of ES was carried out using division of the studied words into phonetic segments, and the results of the research were presented in paper [
8]. The author’s goal is a broad numerical analysis of oesophageal speech, the synthesis of which will lead to the definition of a precise description of the physical features of ES. The generated ES feature vector will be based on the results of the research included in the publications [
8,
12] and the results of this research. According to the author, the analysis of oesophageal speech is not yet complete and will be continued, with the results published in subsequent papers.
The Octave programming environment was used for signal pre-processing such as cutting out silence and removing noise and artifacts. All work related to obtaining information about the F0 frequency was performed using the Praat program v.6.4.13. The pitch information was taken from the available “Pitch” menu option of the Praat program. One of the key options is the pitch range setting, which allows the tested frequency range of the analysed word to be set. An important issue in the research was determining the common frequency range for ES and physiological speech, i.e., the range in which frequency components are present for both laryngectomised patients and healthy people. A natural feature of physiological speech is that the average male voice falls within the frequency range of between 50 Hz and 600 Hz. For average female voices, it is 100 Hz to 800 Hz, respectively. However, in the case of children, the upper value of the frequency range can reach up to 2000 Hz, especially while shouting, which accompanies play among peers. The above cases differ significantly from the properties of oesophageal speech (ES), which on the low side of the frequency range may take on the character of a “creaky” voice and a voice that is much lower than physiological speech. In addition, the speech of laryngectomised women does not have to be higher than that of laryngectomised men, which is very common in the case of the speech of healthy people.
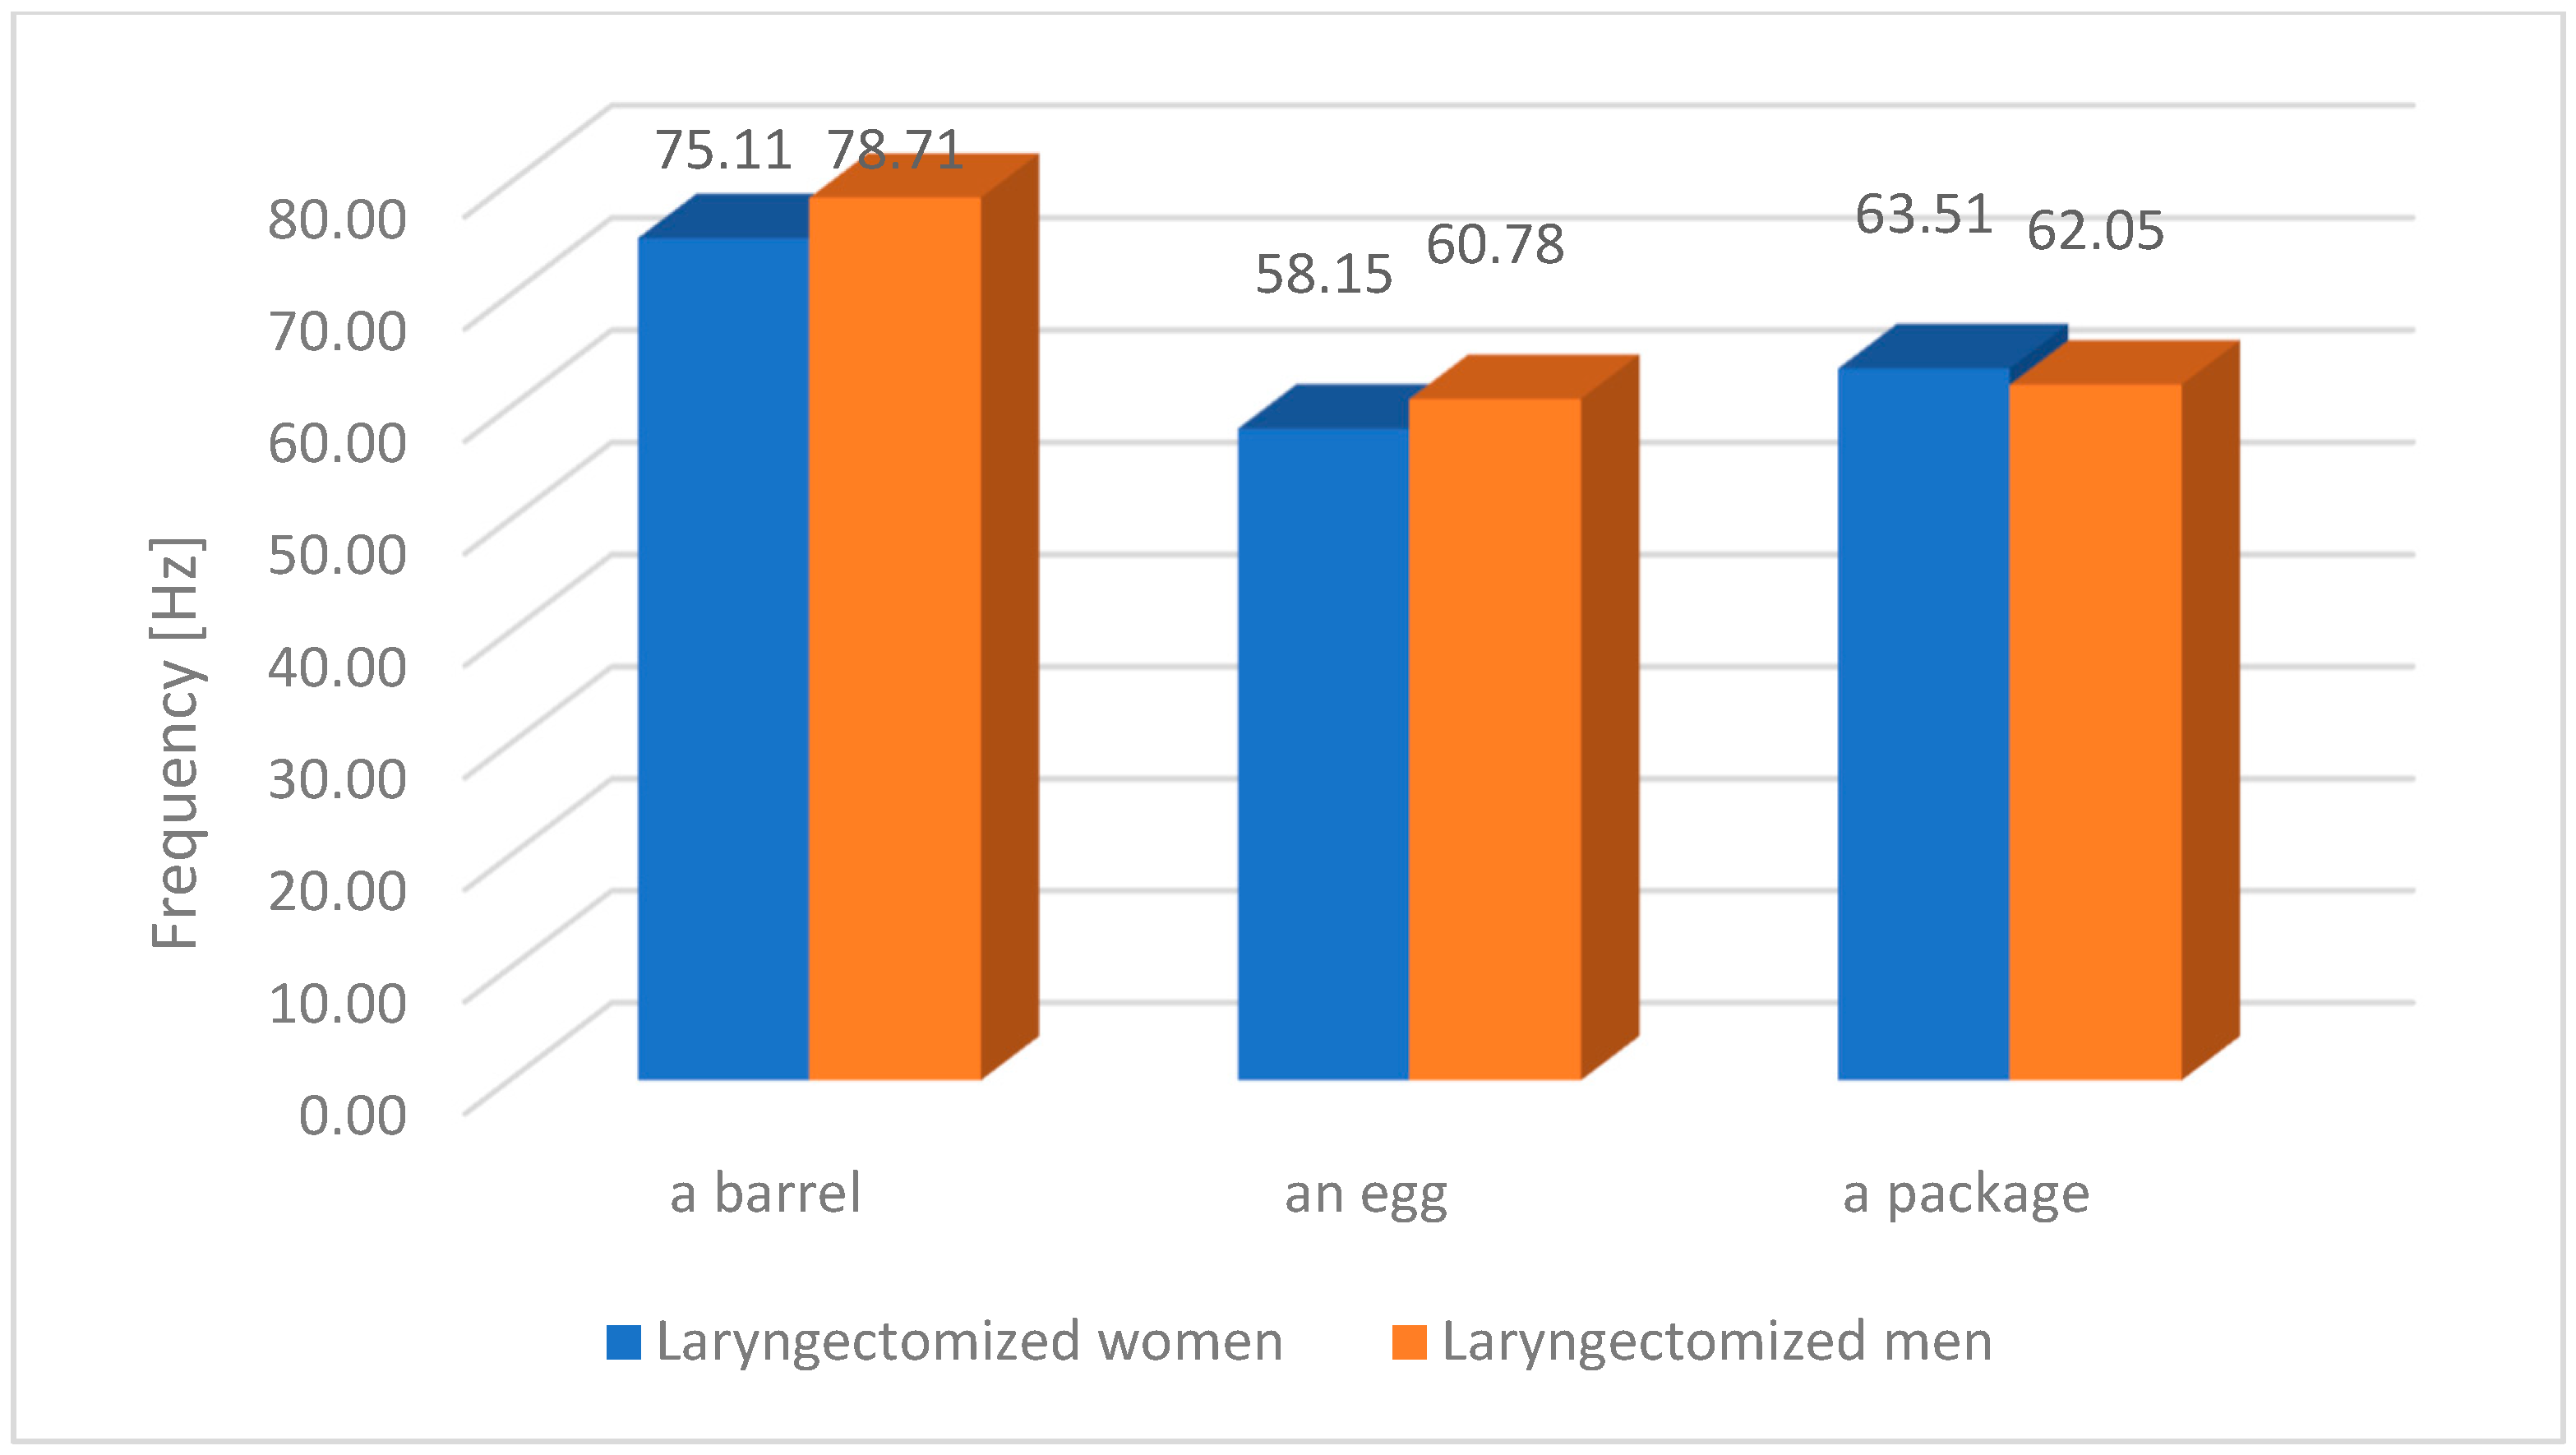
Figure 2 shows the F0 frequency of oesophageal speech (ES) for selected words and selected people following laryngectomy surgery. The figure shows that the F0 frequencies within individual words are very similar despite the gender of the speaker.
In further stages of the research, the frequency analysis range from 50 Hz to 200 Hz was established, taking into account the following settings of the Praat program:
Pre-processing: attenuation at ceiling = 0.03
Finding a path:
Time step: fixed time step = 0.01 s
The filtered autocorrelation analysis method was chosen.
For each tested word (physiological speech and oesophageal speech [ES]), the following parameters were analysed: the number of F0 components obtained in the “pitch listing” from Praat, the average of values F0, and the minimum F0 and maximum F0 values of each word.
3. Results
This article focuses on the statistical analysis of the F0 frequency value of oesophageal speech, comparing it with the physiological speech of healthy people. The focus is on determining the temporary value of the F0 frequency, resulting from the segmentation of the analysed signal. This means that the F0 value was determined based on the processing of a speech signal segment that represents at least several cycles of vocal fold or pseudo-glottis work, in the case of oesophageal speech (ES). The speech signal segment is separated using a moving time window (called a frame), while the basic F0 frequency within the frame is constant. Therefore, an F0 frequency vector (pitch listing) is obtained, the length of which depends on the number of frames. The number of frames depends on the length of the spoken word. The duration of the spoken word for oesophageal speech (ES) is longer compared to the speech of healthy people, which depends on the level of the patient’s rehabilitation, including the ability to swallow appropriate air resources. In the case of single words, the time of expression may differ less than in the case of full sentences.
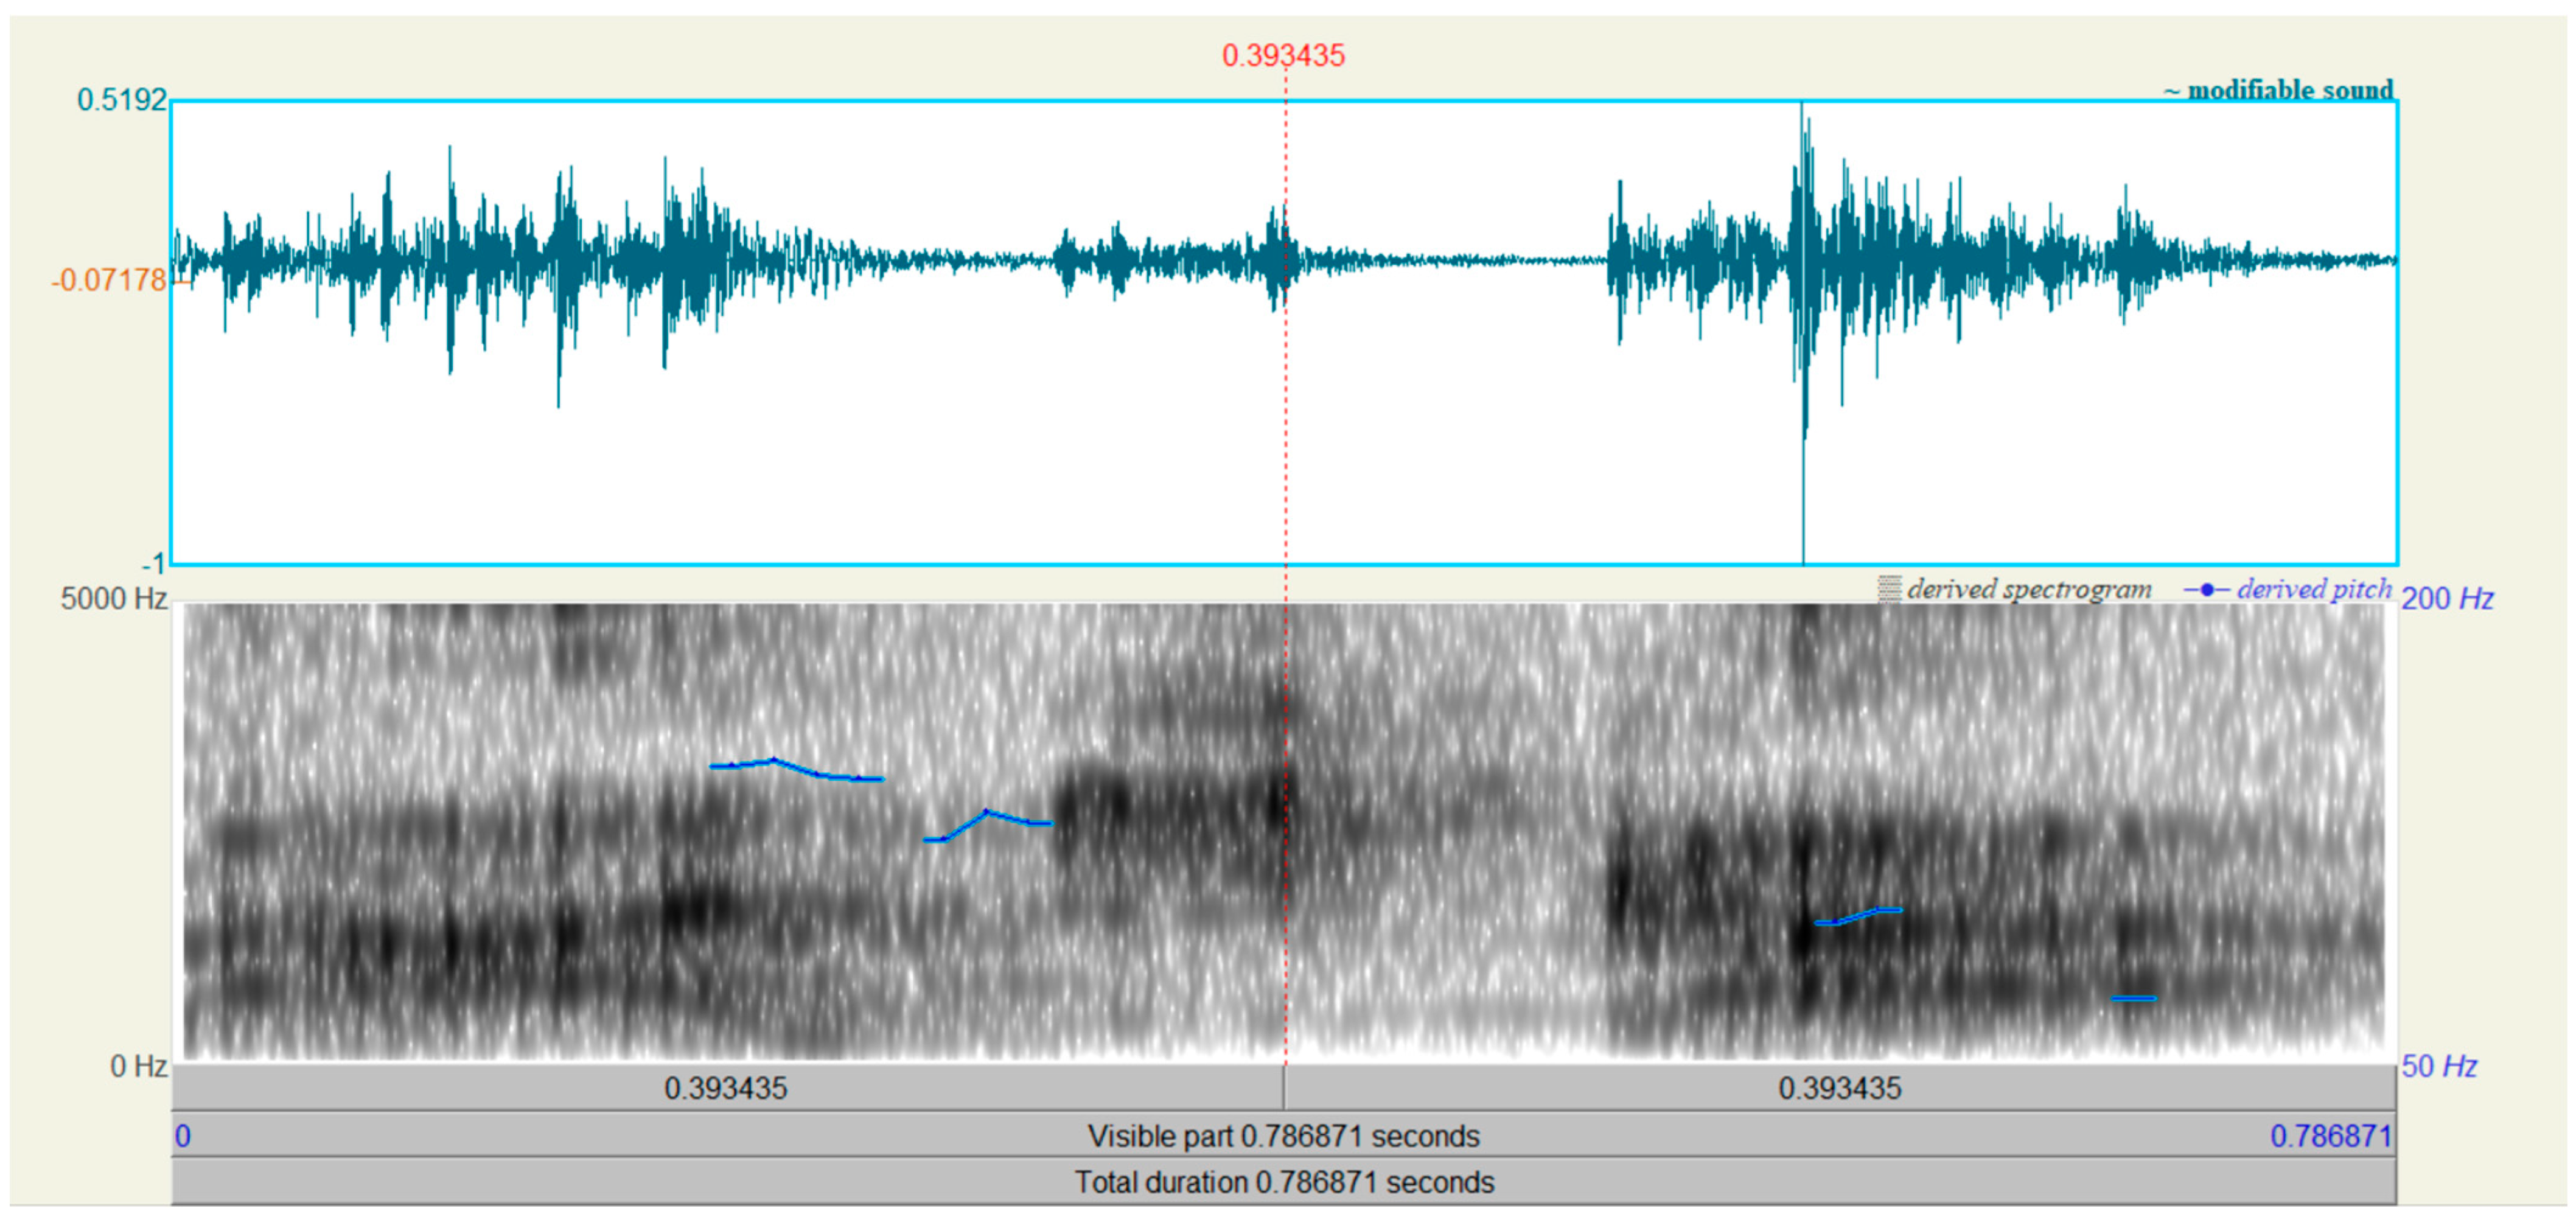
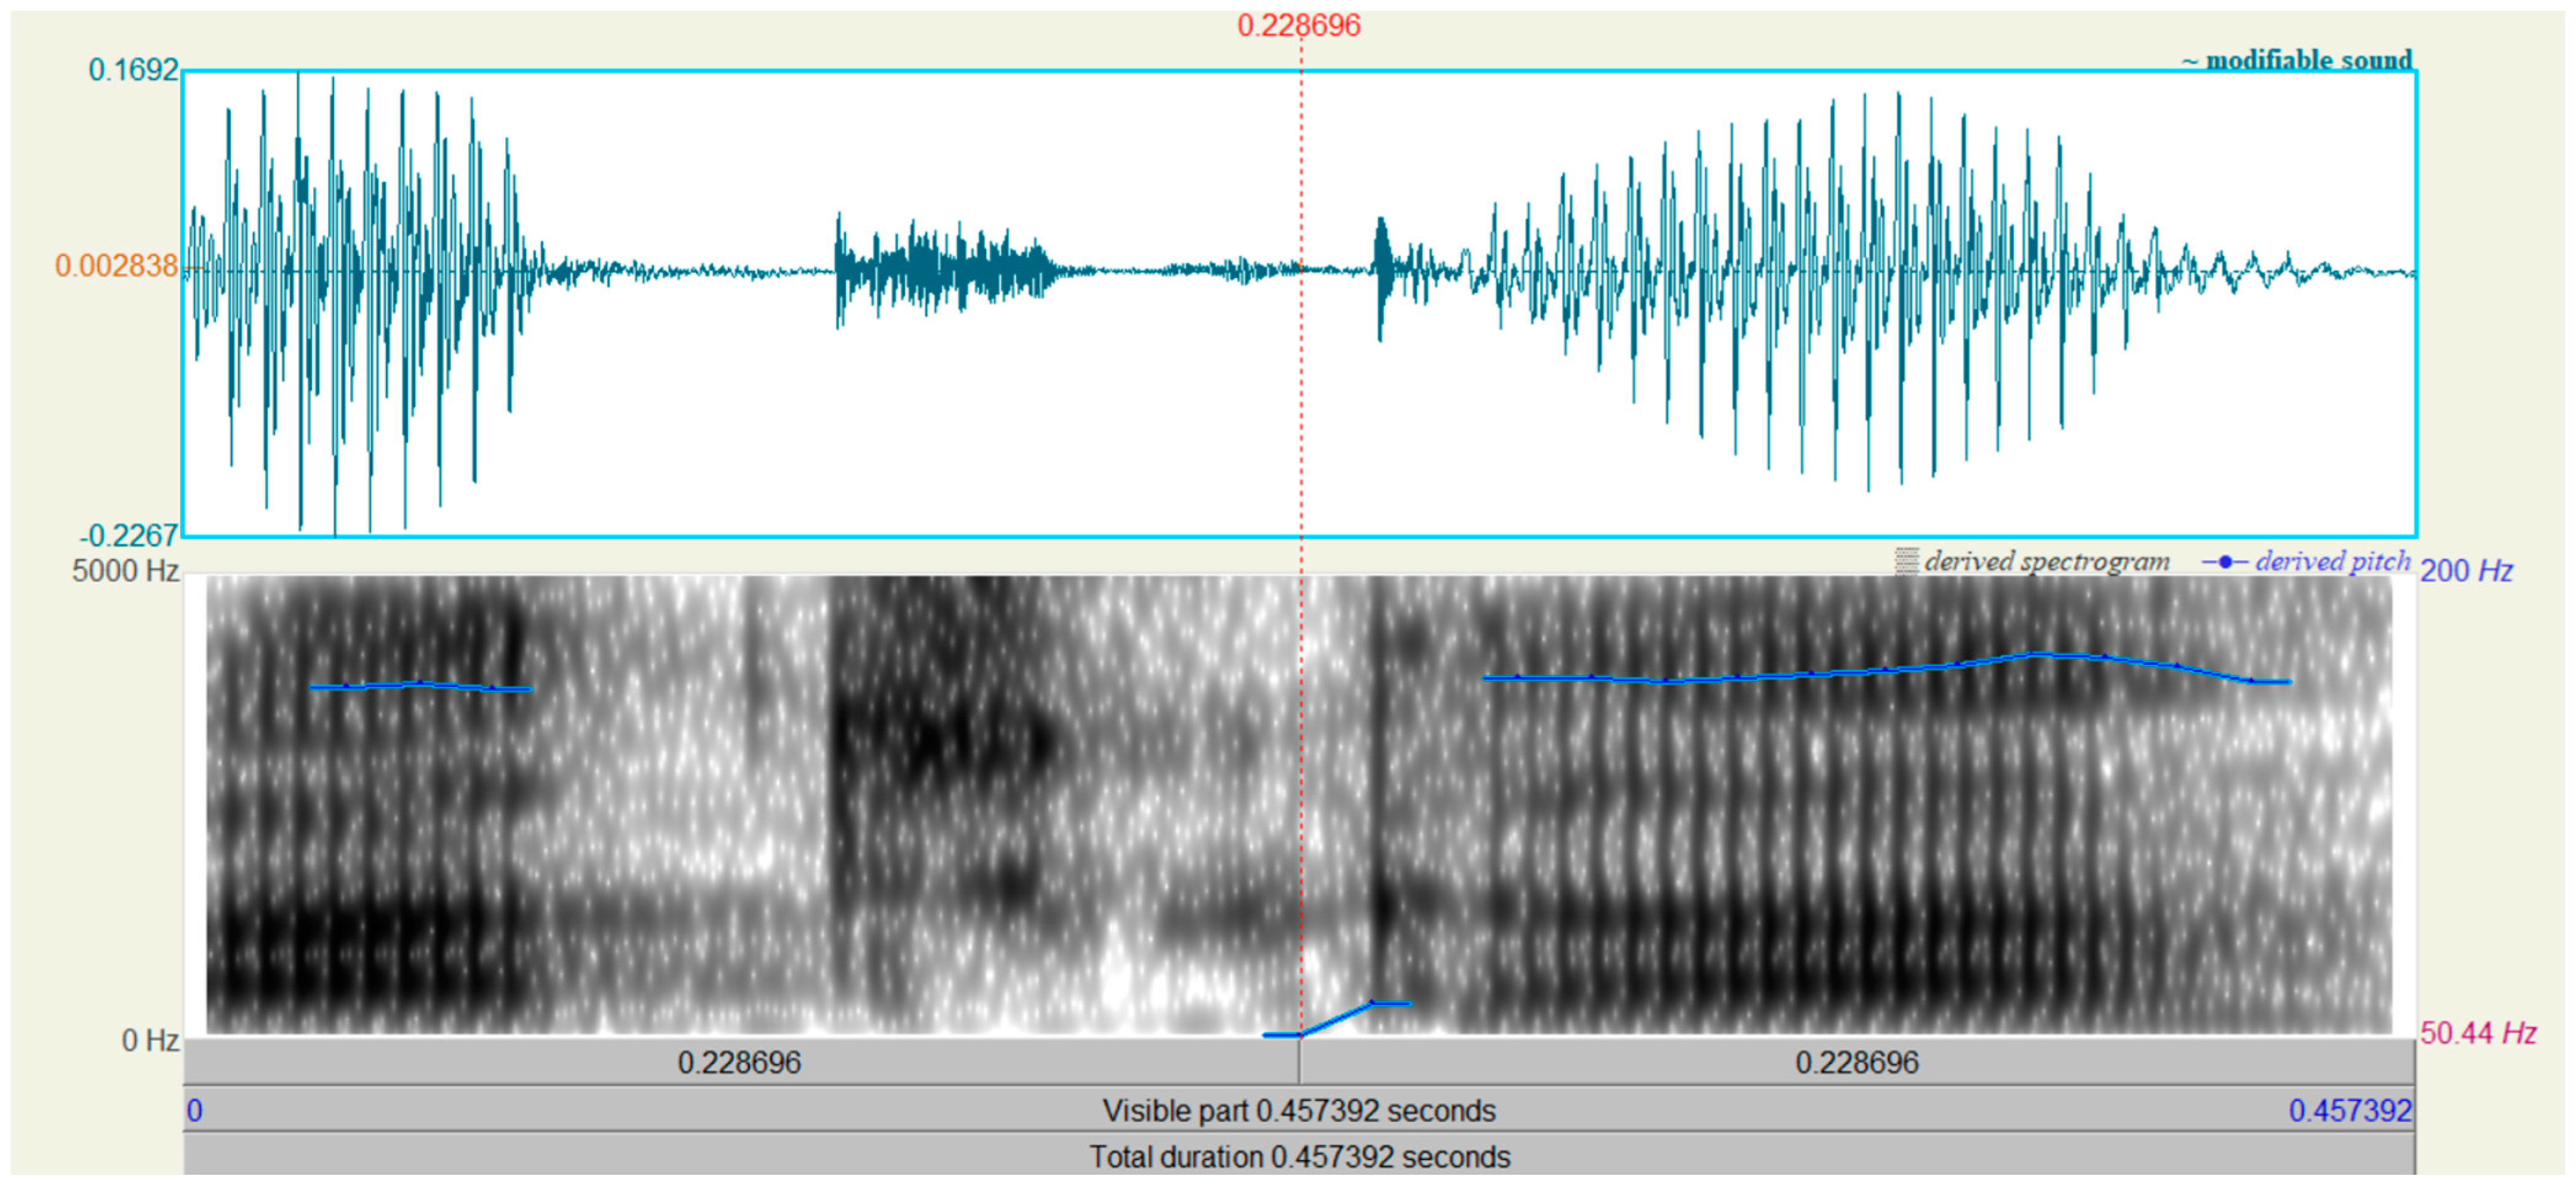
Figure 3 and
Figure 4 show the time waveform and spectrogram of the word “paczka” (“a package”) of spoken by a man who had had laryngectomy surgery and a healthy man. The following spectogram settings were used:
Time frequency resolutions
Number of time steps 1000
Number of frequency steps 250
Spectogram analysis settings
Method: Fourier
Window shape: Gaussian
There is a significant difference in the length of the spoken word. Moreover, for both words, a pitch contour is displayed.
The information collected regarding the F0 frequency of each single word tested included:
the mean value of the F0 frequencies contained in the pitch listing
the minimum value of the F0 frequencies from the pitch listing
the maximum value of the F0 frequencies from the pitch listing
the median value of the F0 frequencies contained in the pitch listing
the standard deviation value of the F0 frequencies contained in the pitch listing
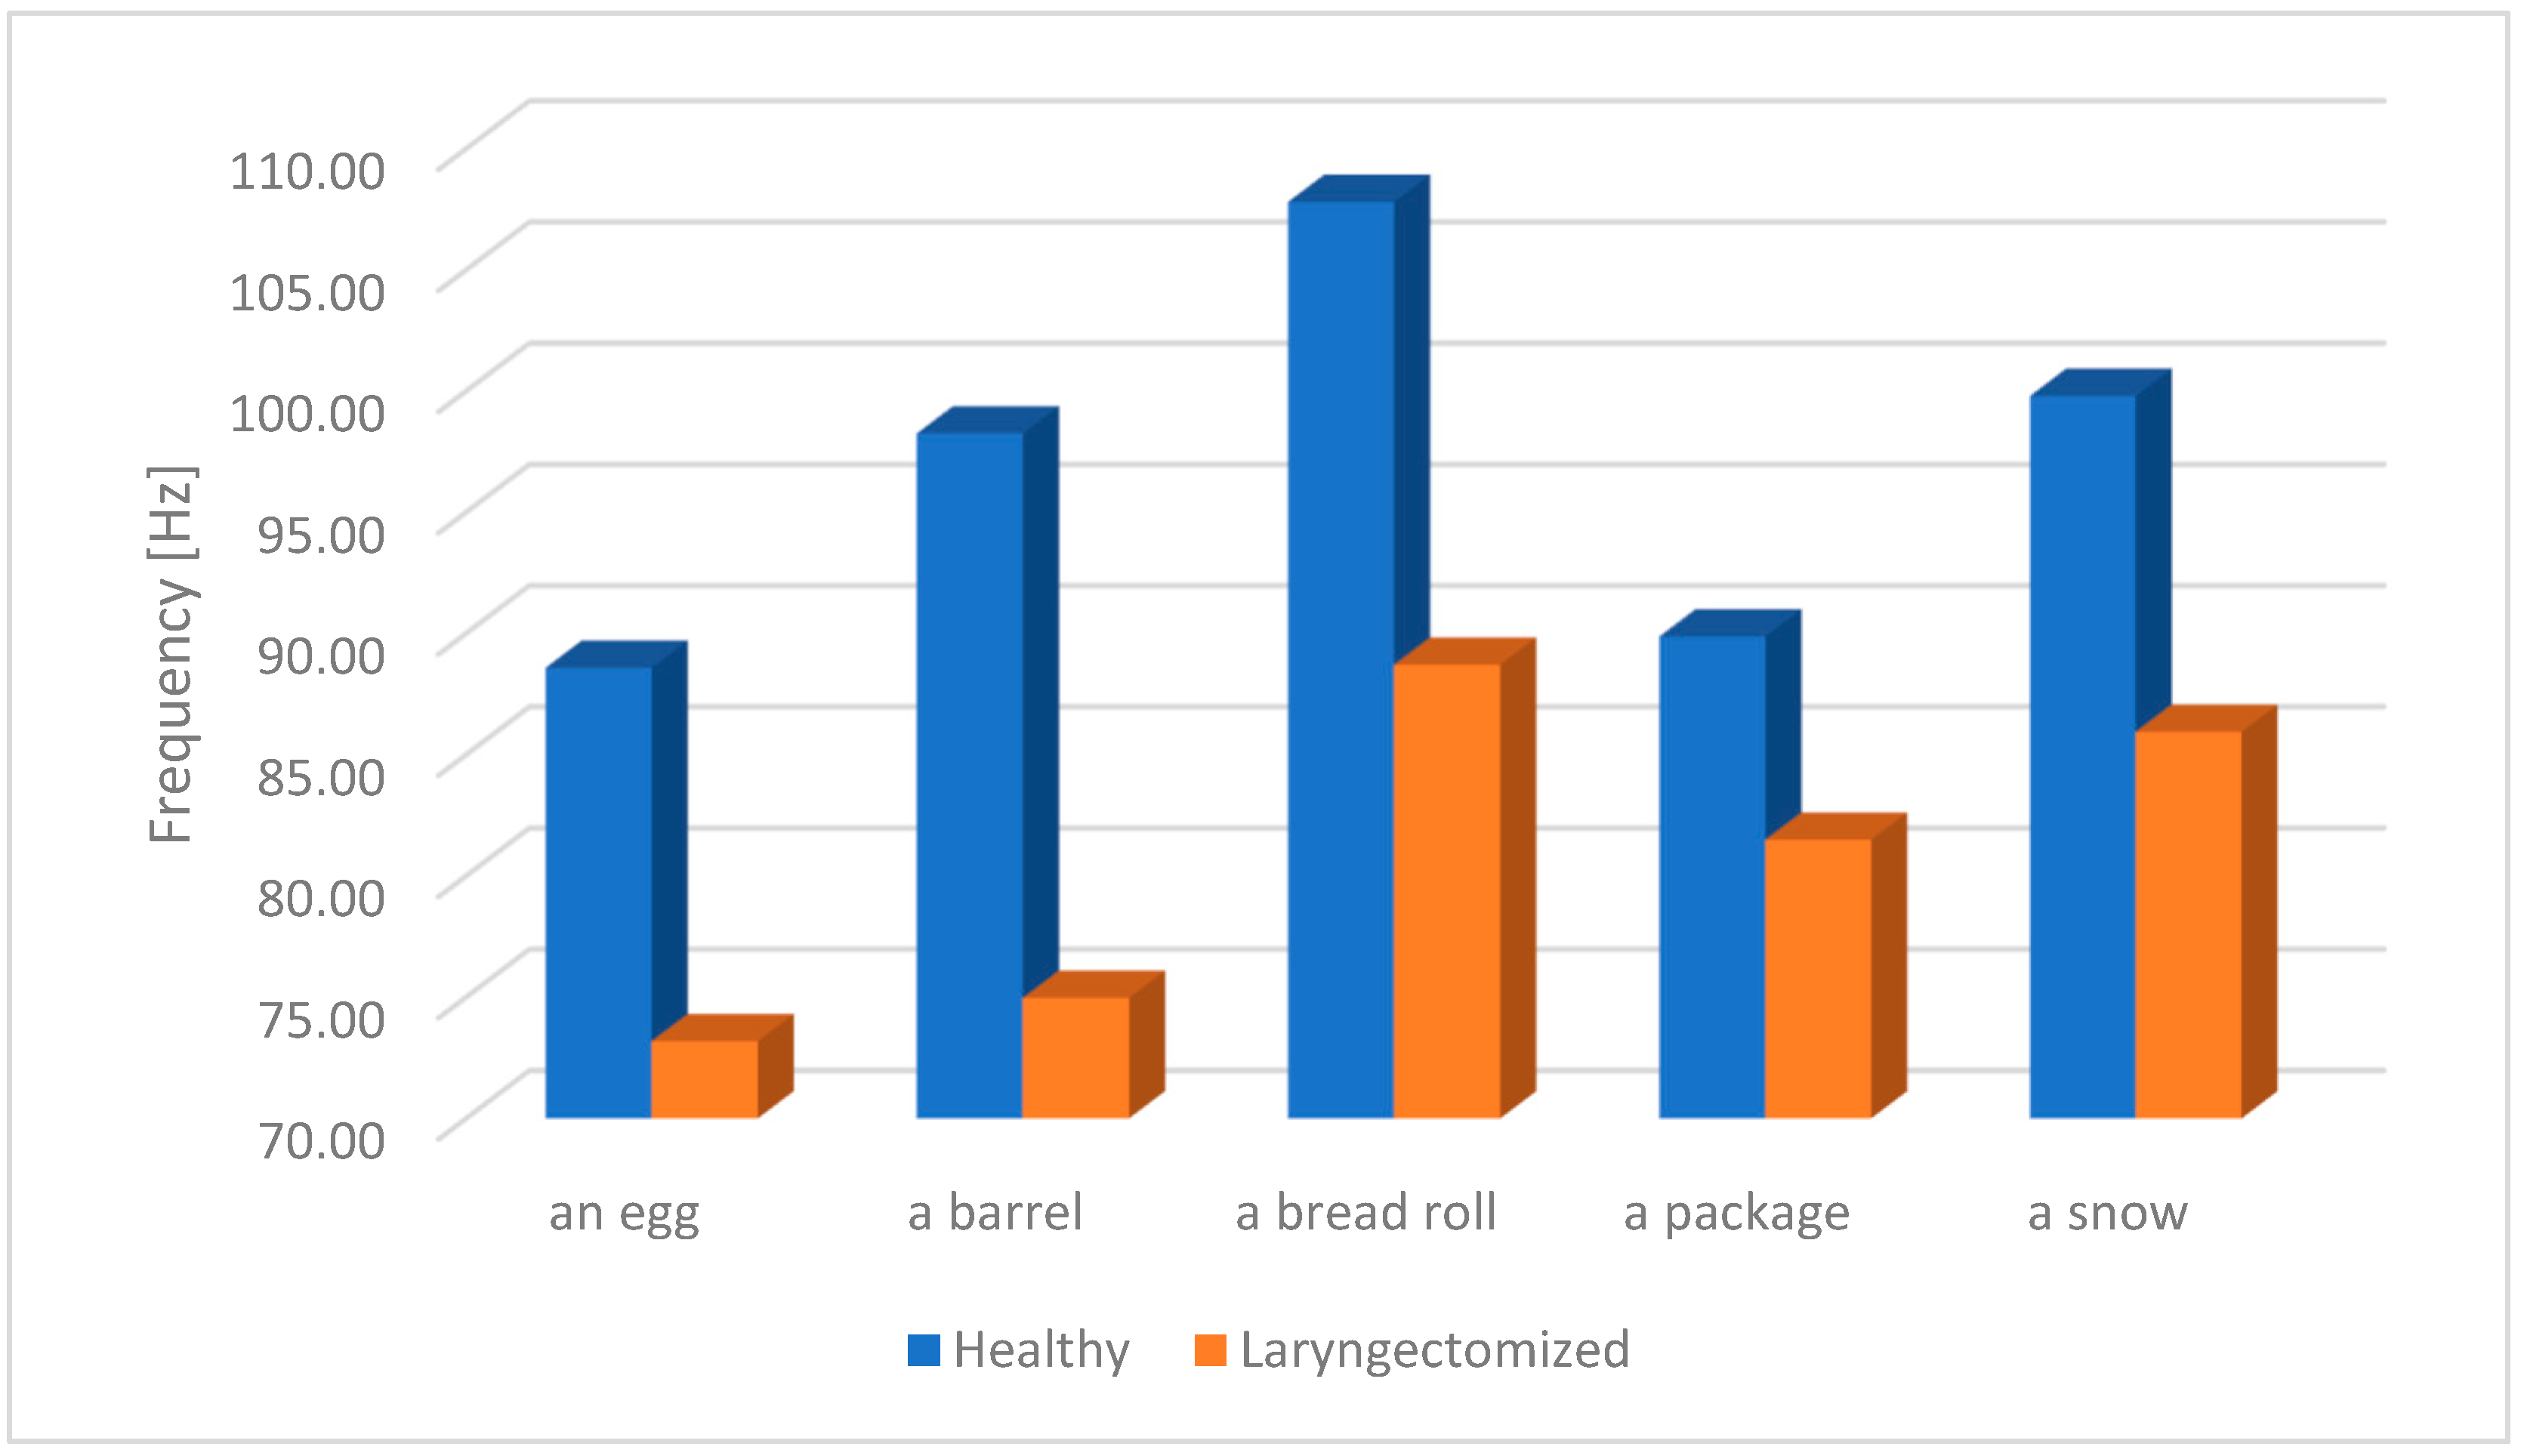
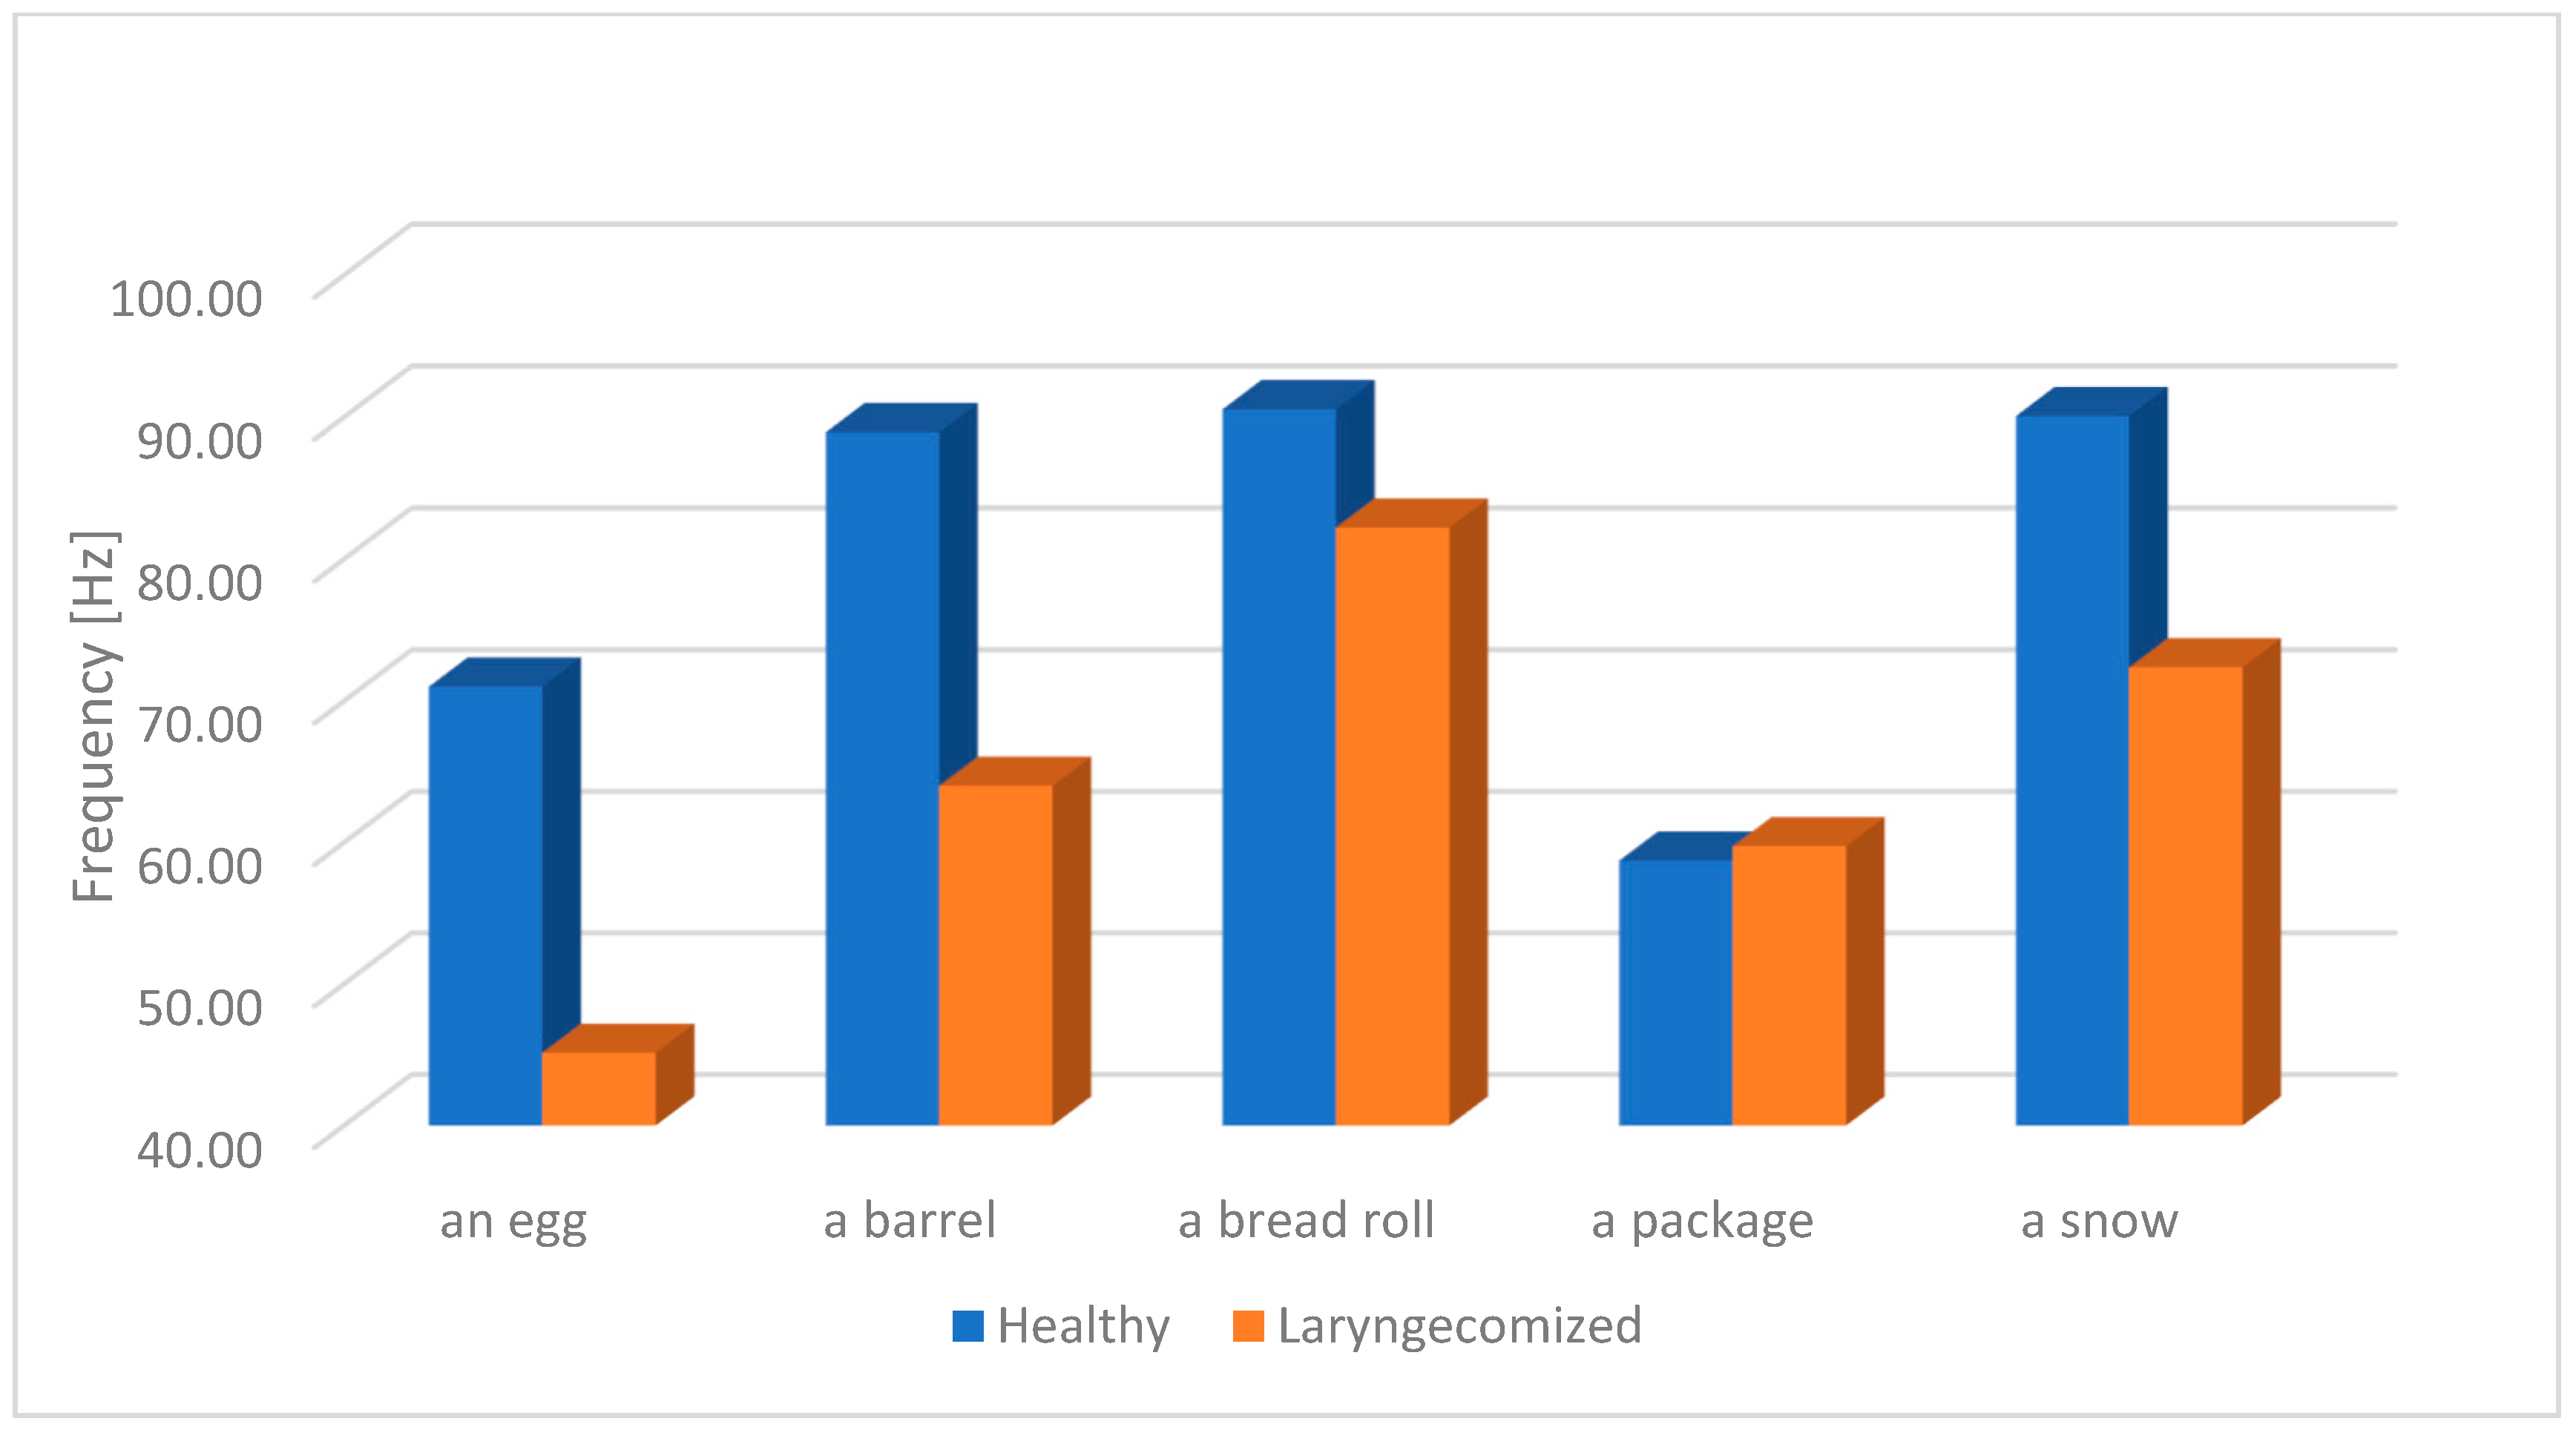
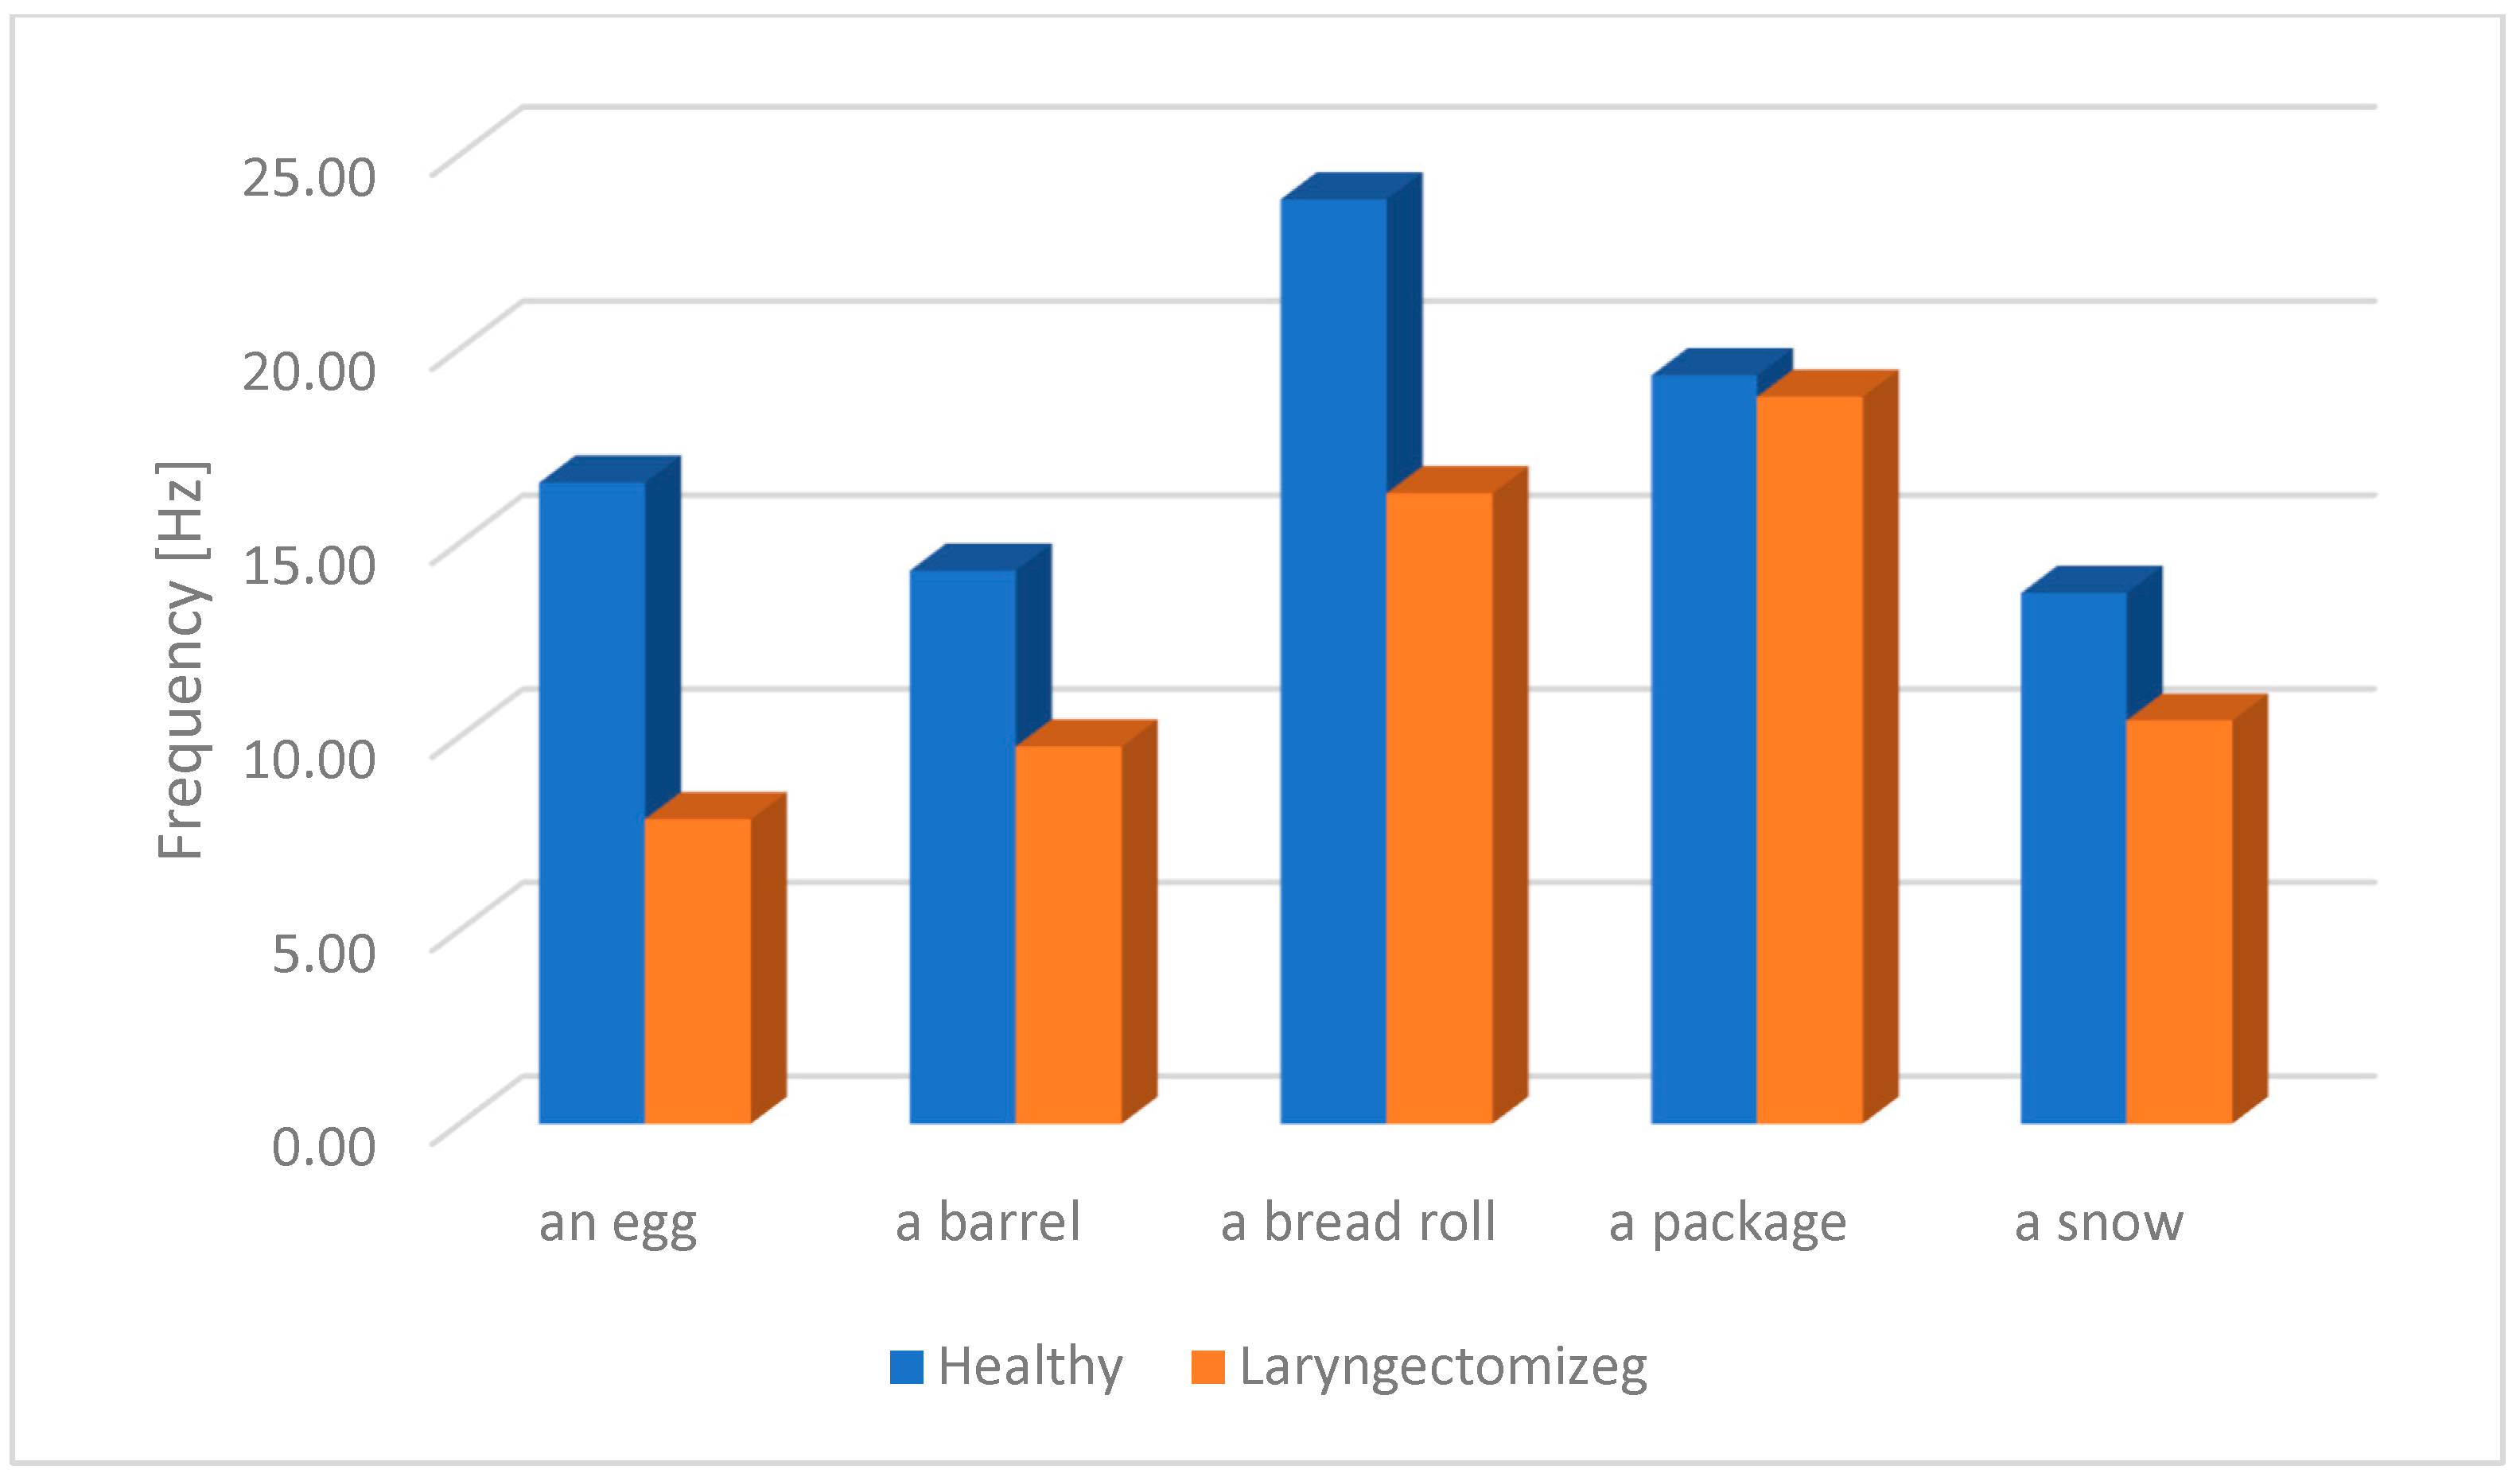
The results of the study of the fundamental frequency F0 of oesophageal speech (ES) and the speech of healthy individuals (from the pitch listing for each studied word) will be presented later on this section. As mentioned earlier, for the purpose of the analysis, a frequency band range from 50 Hz to 200 Hz was selected. The choice of this frequency range results from the need to determine the space in which the frequency components of both oesophageal speech (ES) and physiological speech will be located. This will prevent a lack of F0 registration for some speech samples. The figures below (
Figure 5,
Figure 6,
Figure 7,
Figure 8 and
Figure 9) present the average F0 frequency distribution, the average minimum and maximum values of F0, the average median value and the average standard deviation from the pitch listing of the F0 values of the studied words.
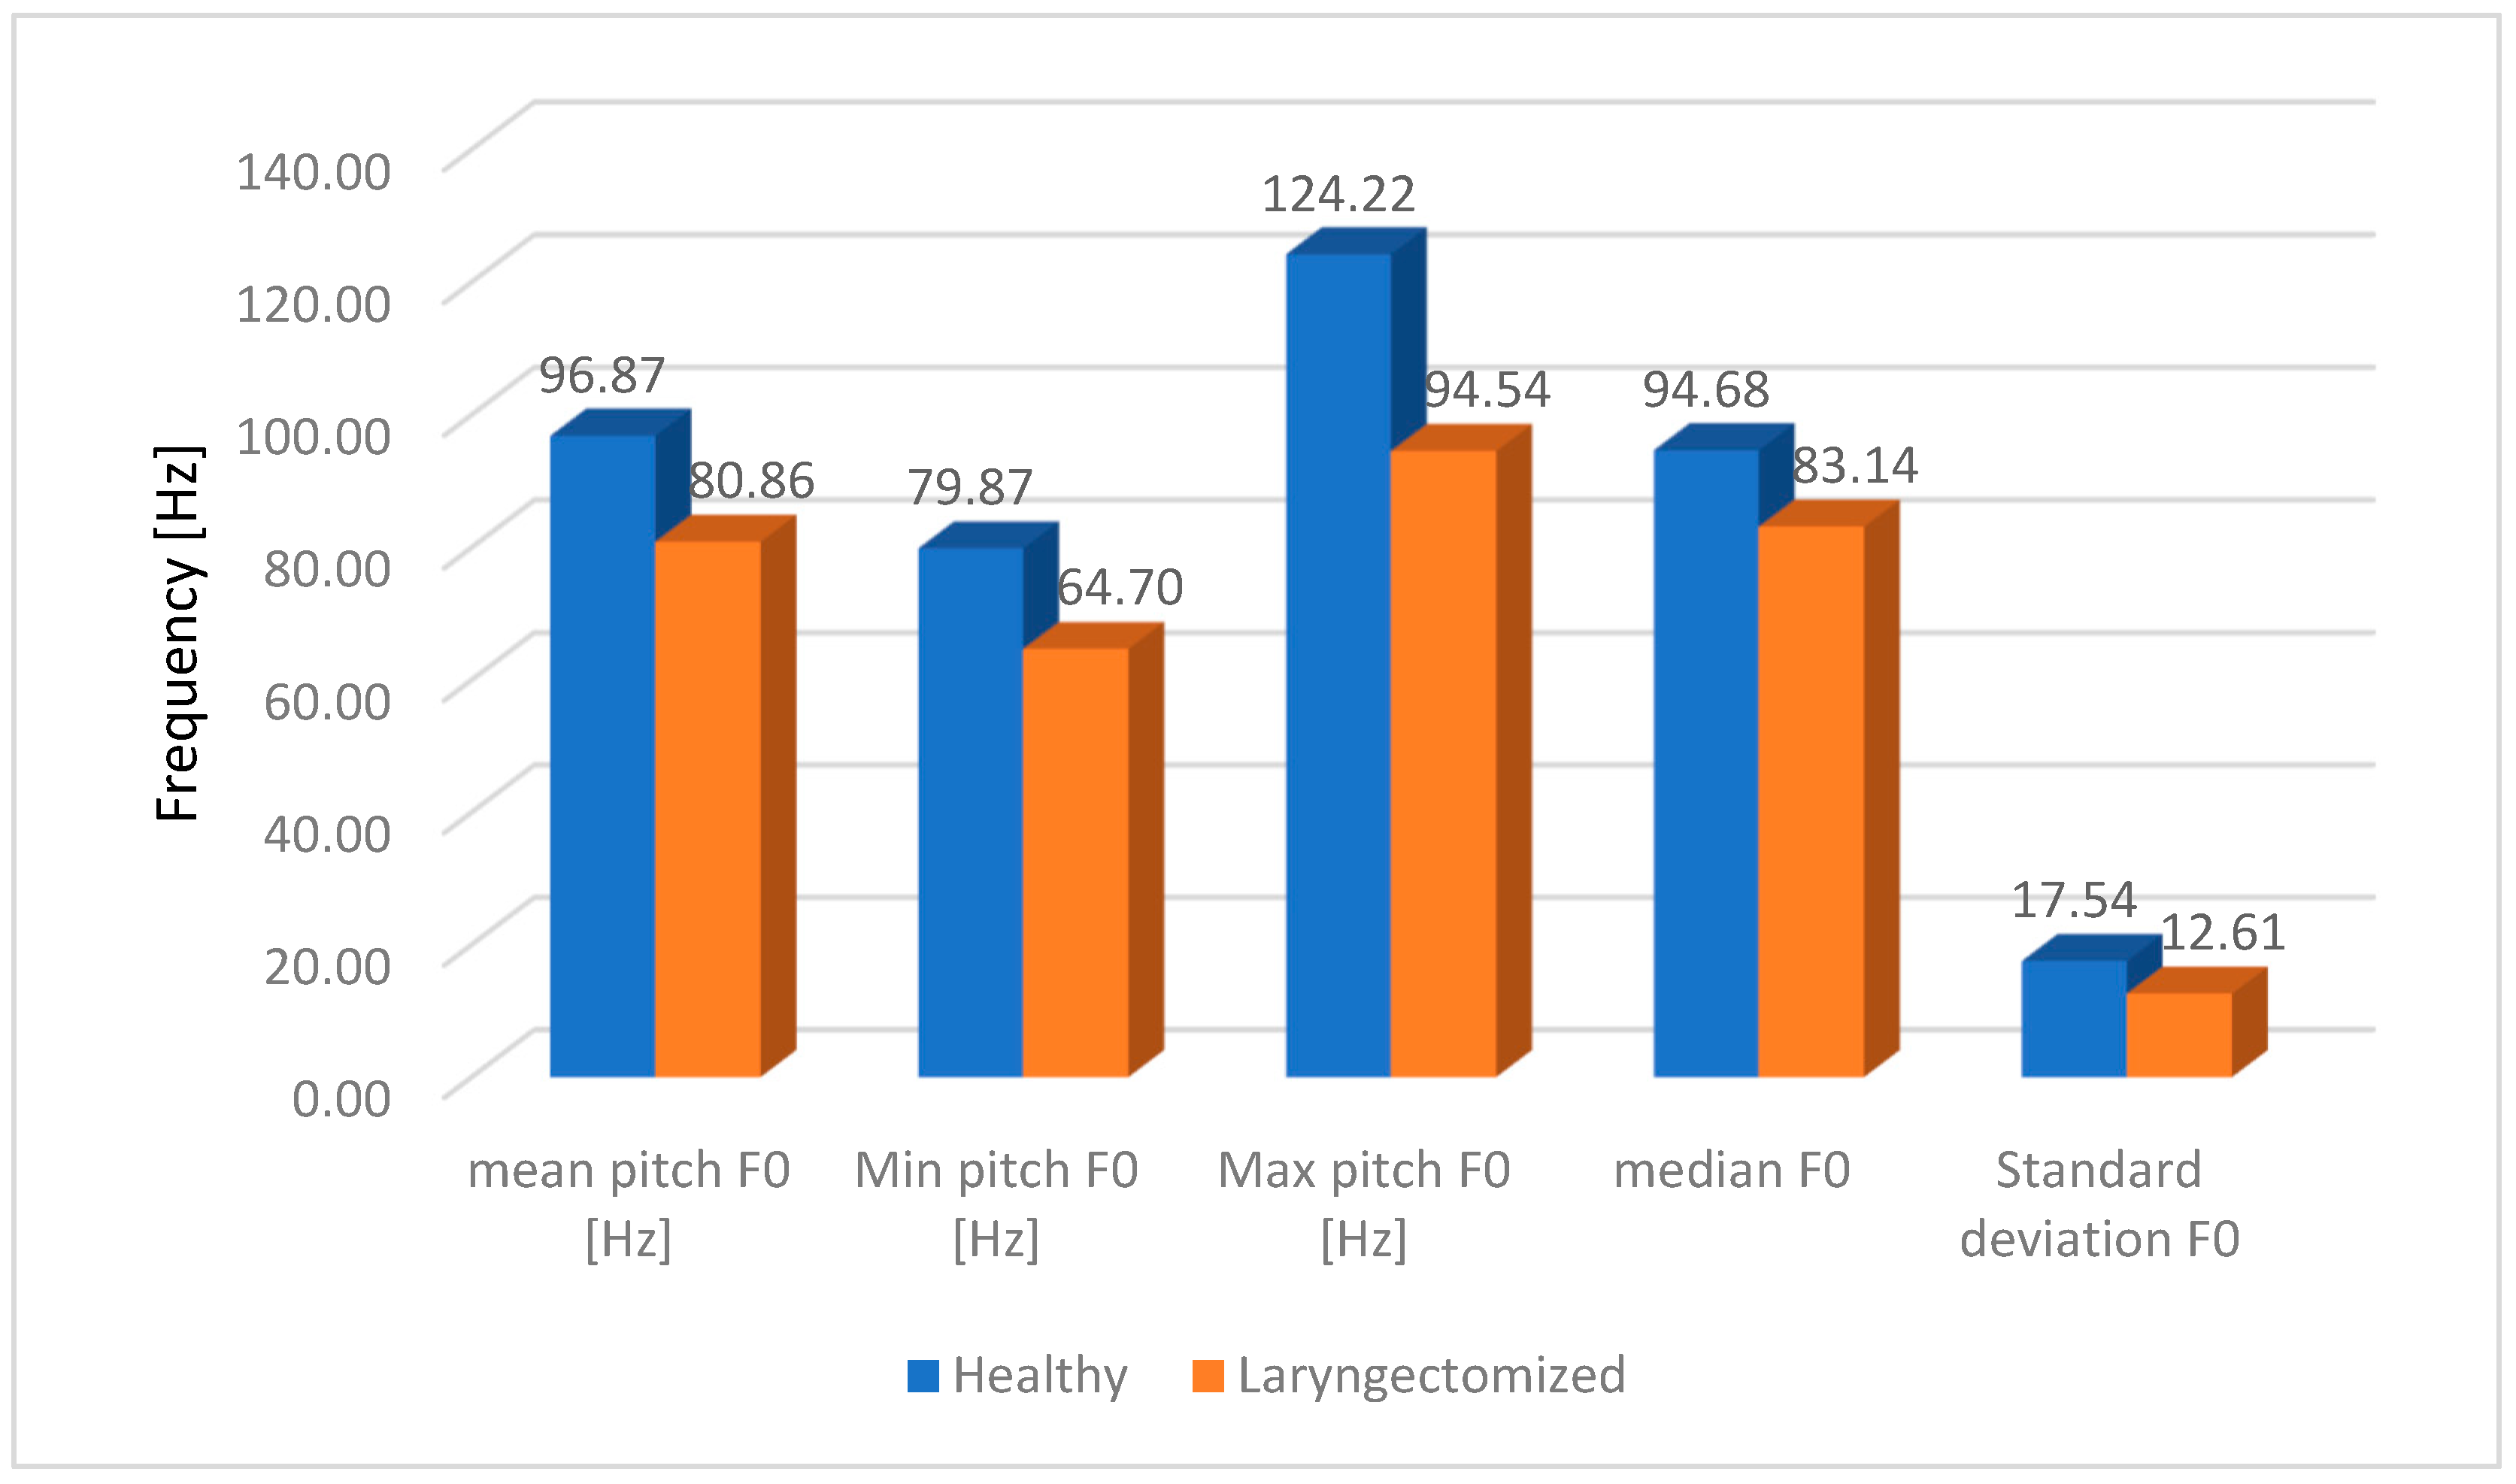
Figure 10 presents the average values of the fundamental frequency F0 without taking into account the division according to the studied words. The main criterion is the differences between oesophageal speech (ES) and the speech of healthy people.
From the presented
Figure 10, we conclude that the greatest differences can be observed for max. pitch F0. The difference is equal to 29.68, which, taking into account 124.22 Hz for healthy people and 94.54 Hz for laryngectomised people, constitutes 76.1% in the ratio of laryngectomised people to healthy people. The full set of values for the average fundamental frequency F0 for all the words tested is presented in
Table 3.
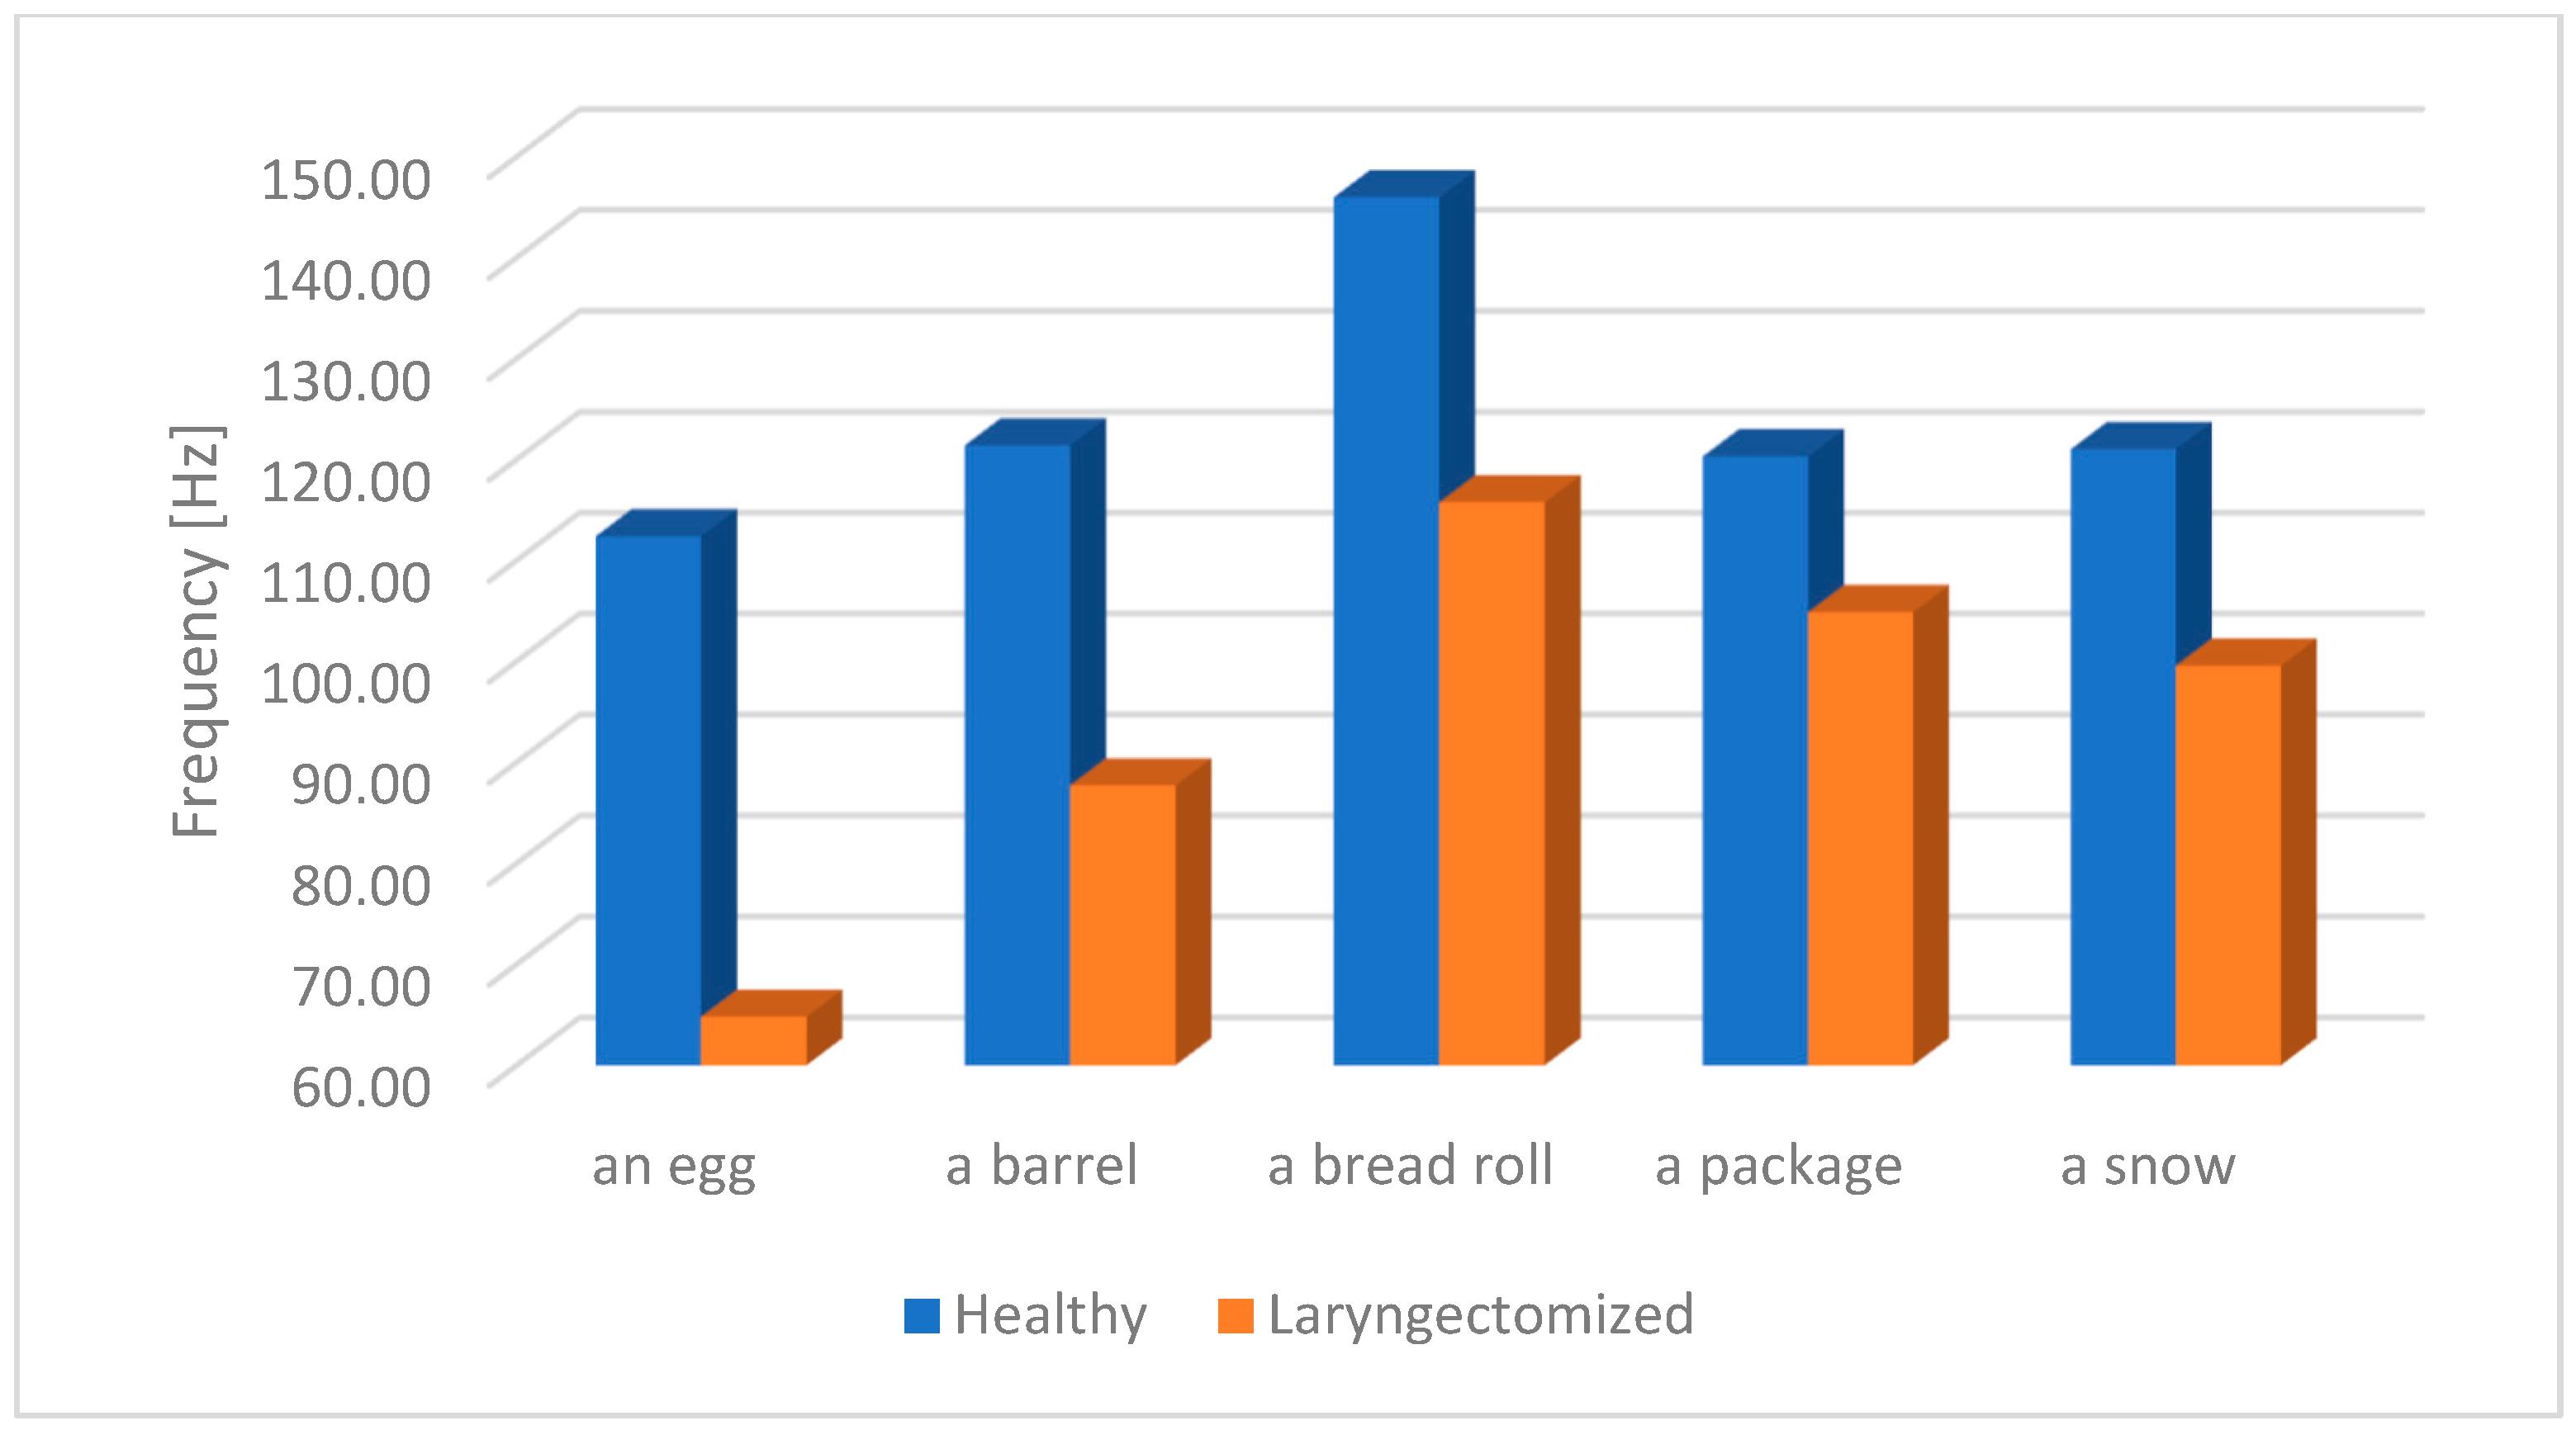
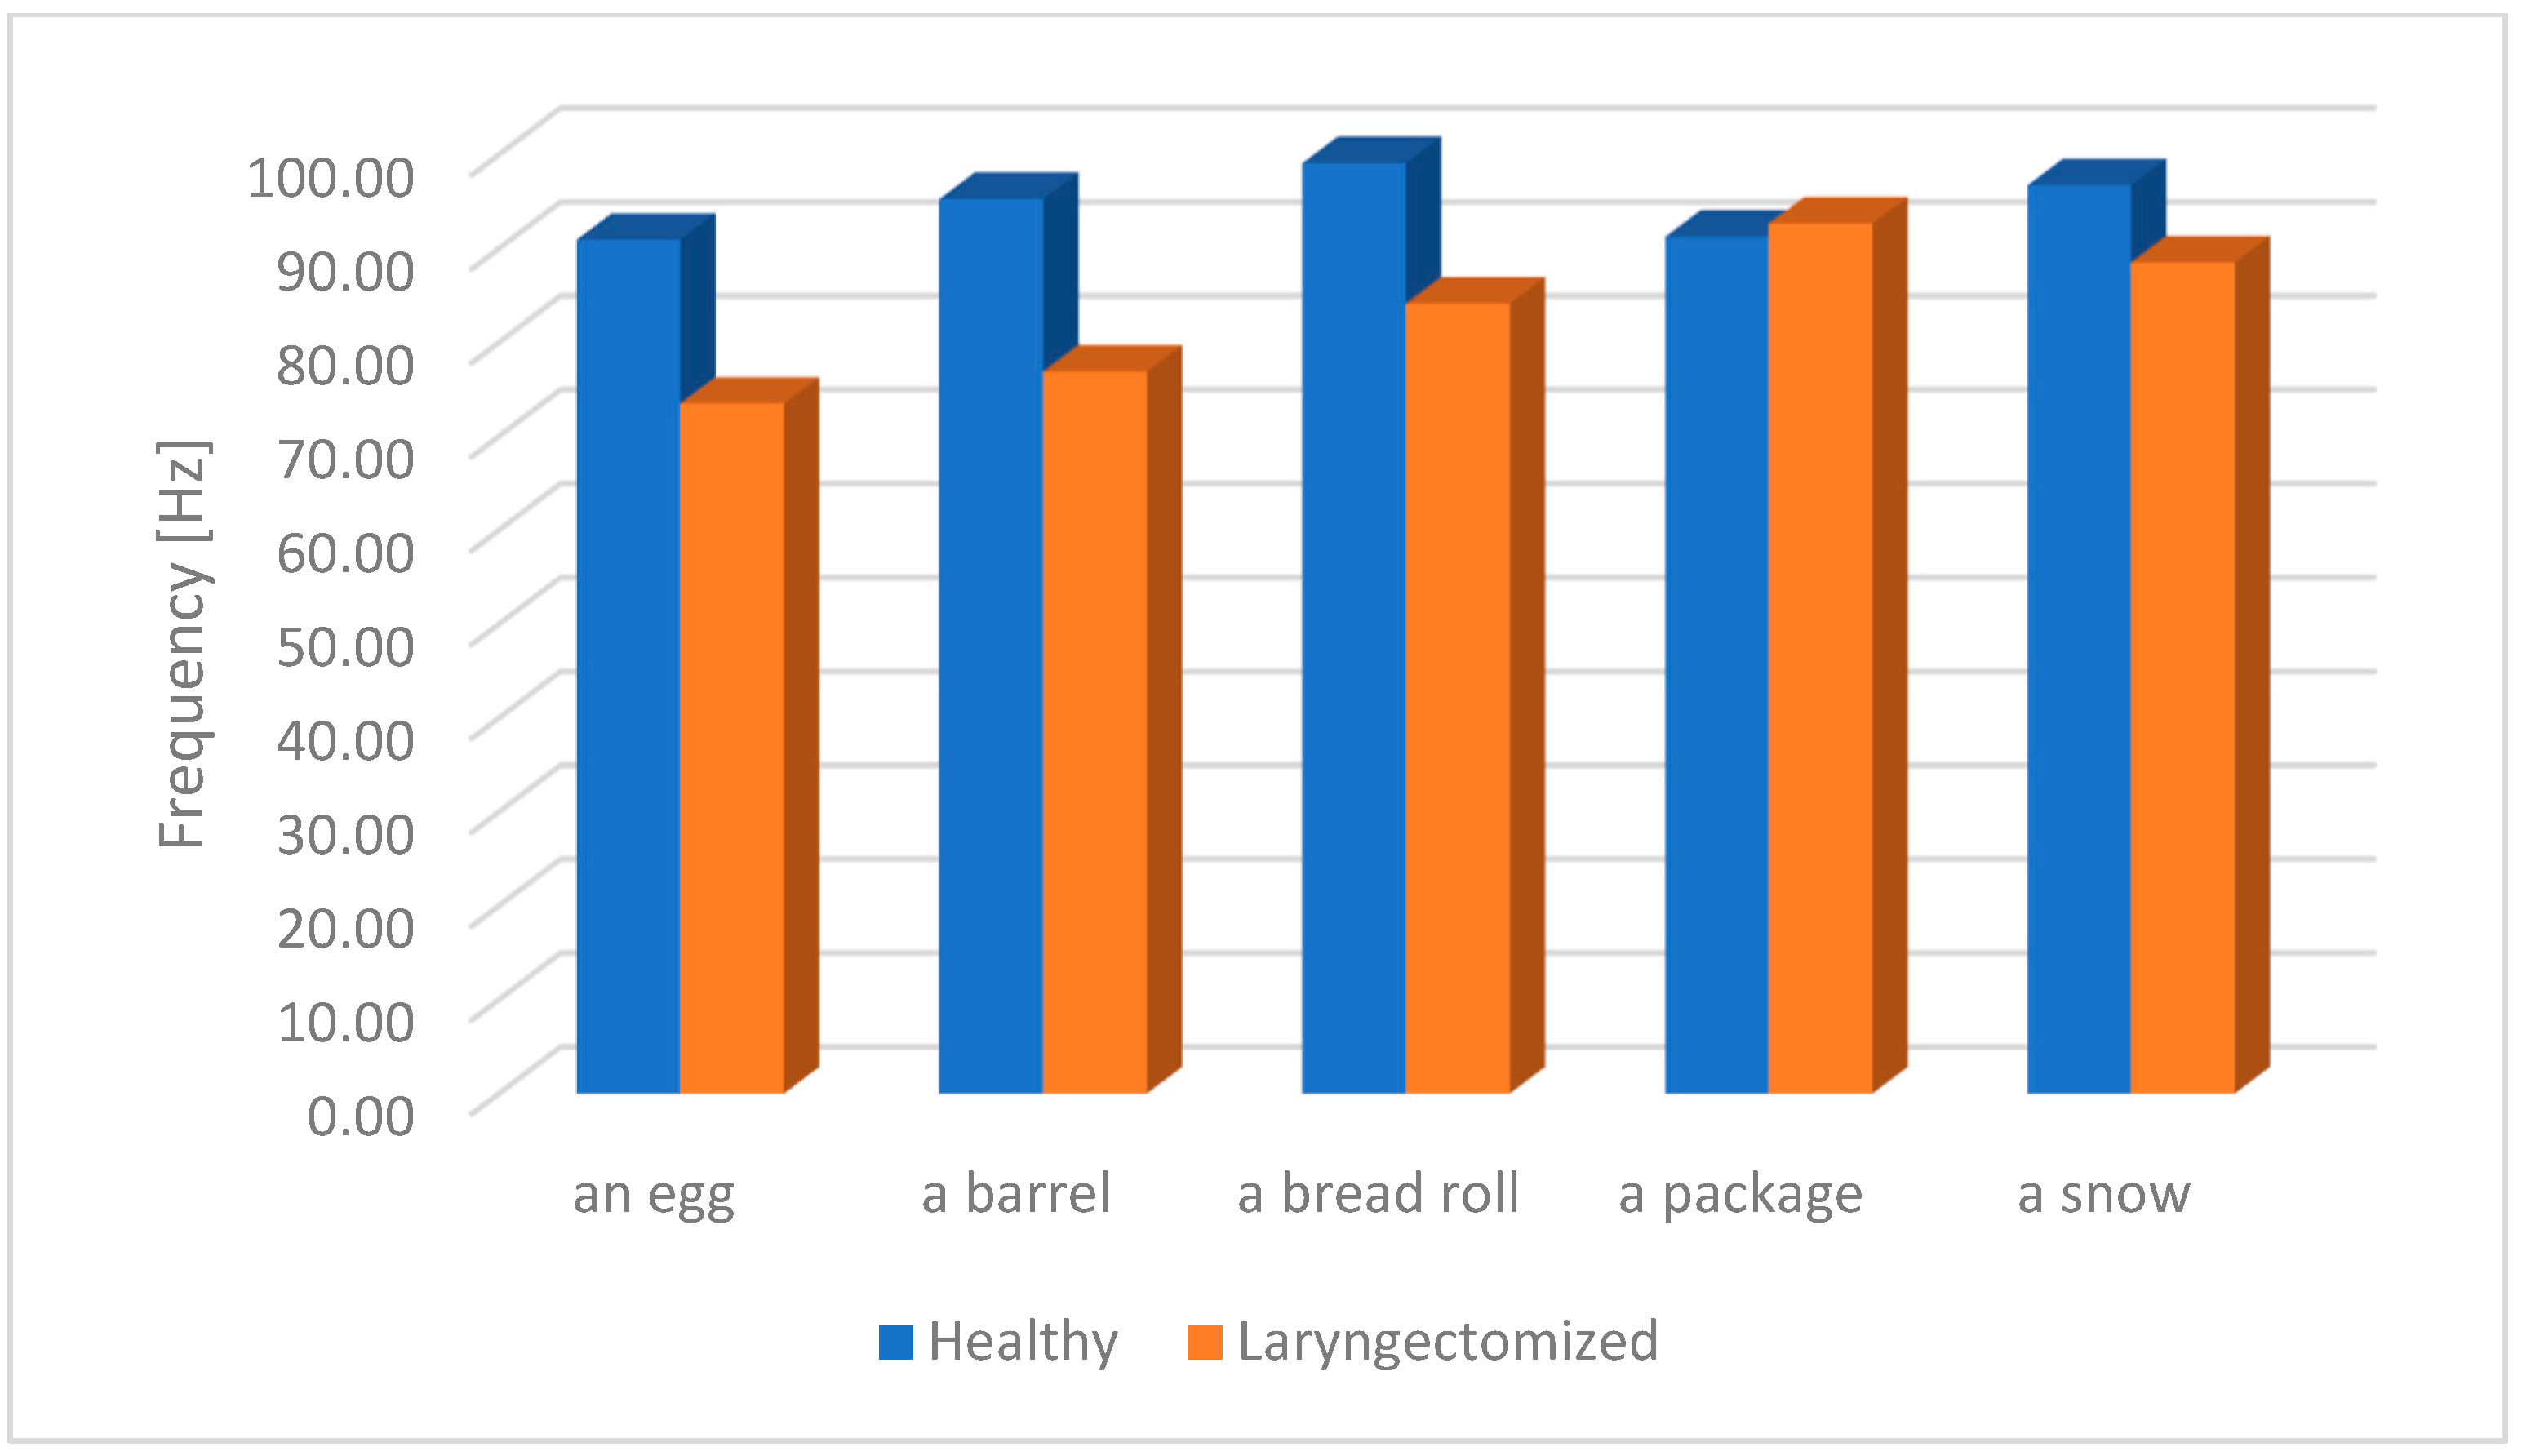
The research performed shows that the largest difference regarding max. pitch F0 occurs in the tested word “egg” and is 47.58 Hz, as shown in
Figure 11 and
Table 4.
4. Conclusions
This study attempted to provide broad information on the distribution of information on the fundamental frequency F0 for people who had undergone a total laryngectomy surgery and used oesophageal speech (ES). The obtained results located in the pitch listing were subjected to detailed statistical analysis. This analysis was to show significant differences in information on the F0 frequency between oesophageal speech (ES) and the speech of healthy people. Due to the specific features of the Polish language, which are related to the difficult articulation and pronunciation of some syllables, words used during the speech rehabilitation process were selected for the study. The selected words were not random and resulted from the recommendations of speech therapists. In this study, only single words were analysed, not full sentences. Analysis of full sentences is a more complex task and will be carried out by the author in later studies. The results of the analysis clearly indicate a significantly higher fundamental frequency F0 average value for all the tested words for physiological speech. The highest F0 frequency difference between oesophageal speech and the speech of healthy individuals was noted for the word barrel (in Polish “beczka”), and it amounted to 23.29 Hz; the lowest F0 frequency difference was noted for the word package (in Polish “paczka”), and it amounted to 8.38 Hz. The set of maximum values of the F0 frequency of the tested word obtained from the pitch listing showed that the largest difference for max. F0 occurs in the case of the word egg (in Polish “jajko”), which is 47.58 Hz. The smallest difference for the set of max. F0 frequency is 15.45 Hz for the word package (in Polish “paczka”). The differences in the of the set of minimum frequencies F0, included in the pitch listing, for the tested words are: the largest difference is 8.34 Hz for the term bread roll (in Polish “bułka”) but the smallest difference for the set of min. F0 frequencies is −1 Hz for the word package (in Polish “paczka”). The negative value results from the fact that for oesophageal speech the minimum value of the F0 frequency was higher (59.74 Hz) than the analogous one for the speech of healthy people (58.74 Hz). The highest difference in the set of median F0 value was noted for the word barrel (in Polish “beczka”) (18.39) and the lowest was for the word package (in Polish “paczka”) (−1.39); the negative value results from the fact that the median F0 frequency for laryngectomised people is higher than for healthy people. The differences in standard deviations for the set of the F0 frequency are as follows: the largest difference is 8.69 for the word egg (in Polish “jajko”) and the smallest difference is 0.56 for the word package (in Polish “paczka”). The fundamental frequency F0 is a key physical feature of speech, therefore its analysis is necessary to fully understand the changes occurring in the speech signal. Controlling the changes in the numerical values of this descriptor can contribute to a more effective rehabilitation process using oesophageal speech. Information on the distribution of the fundamental frequency F0 in combination with the previously mentioned MPEG-7 descriptors can not only support the rehabilitation process but also contribute to the development of new methods of teaching the use of oesophageal speech. The research results can be used to improve the quality of speech rehabilitation after laryngectomy. A key element of learning oesophageal speech is breathing exercises, which will allow for the correct articulation of vowels, consonants, single words and full sentences. In the first stage, air is sucked into the oesophagus, then by reflection it is directed to the oral cavity. Then, words are pronounced and substitute speech is learned. However, the words pronounced are characterized by different physical features than physiological speech. The obtained research results can be used to indicate differences in the deviations of the numerical values of oesophageal and physiological speech features. Thanks to this, a feature vector can be implemented in a device that will indicate to the patient and therapist whether the rehabilitation process is going optimally—that is, whether during rehabilitation the difference in numerical values of descriptors, between oesophageal and physiological speech features, decreases or increases. Thus, whether the rehabilitation is proceeding correctly or whether changes need to be made or to improve the rehabilitation method can be determined.


