Article

Dynamic Monitoring of Goaf Stress Field and Rock Deformation Driven by Optical Diber Sensing Technology

1
College of Energy Engineering, Xi’an University of Science and Technology, Xi’an 710054, China
2
Key Laboratory of Mine Mining and Disaster Prevention in West China, Ministry of Education, Xi’an University of Science and Technology, Xi’an 710054, China
3
Henan Vocational College of Water Conservancy and Environment, Zhengzhou 450008, China
*
Author to whom correspondence should be addressed.
Appl. Sci. 2025, 15(8), 4393; https://doi.org/10.3390/app15084393
Submission received: 3 April 2025 / Revised: 10 April 2025 / Accepted: 14 April 2025 / Published: 16 April 2025

Abstract

:
Addressing the critical technological needs for the real-time monitoring of stress distribution in mining areas, a new method for inverting goaf pressure using distributed optical fiber monitoring data is proposed. By coupling the key stratum fracture mechanics model with the subsidence trajectory function model, a theoretical model is established to accurately describe spatial stress evolution during coal mining. The model quantifies the relationship between goaf pressure changes and key stratum failures through a two-stage analysis of the subsidence process, based on distinct mechanical properties before and after key stratum fracture. Physical model experiments (3 m × 0.2 m × 1.1 m) using Brillouin Optical Time Domain Analysis (BOTDA) technology validated the proposed method, with comprehensive monitoring of key stratum deformations. By coupling the fracture mechanics model of the critical layer and the settlement trajectory function model, the dynamic transformation of the pre-fracture and post-fracture stages is realized, and the stress evolution can be monitored and predicted in real time. The results demonstrate spatial consistency between key stratum fracture locations and goaf peak stress positions. High-precision optical fiber sensing detected an ultimate strain threshold of 4000 με for key stratum failure, with pre-fracture strain measurements consistently below this threshold. The developed stress inversion formula successfully predicted pressure distribution patterns within the goaf, achieving real-time monitoring capabilities. Compared with the BPPS measurements, the deviation in the inverted data is less than 8.88%, the root mean square error (RMSE) is 0.98–1.20 in different propulsion stages, and the coefficient of determination (R2) is between 0.72 and 0.85. These findings provide a crucial theory for predicting peak stress evolution in mining areas, with implications for improving safety monitoring systems and optimizing mining operations.

1. Introduction

The stability control of goaf areas remains a critical challenge in underground longwall mining operations. During the mining process, pressure variations in a goaf can trigger catastrophic safety incidents, including roof collapse and roadway deformation [1,2,3]. Moreover, abnormal pressure distributions may compromise the stability of surrounding coal pillars through stress transfer mechanisms, potentially affecting adjacent mining zones [4,5]. These safety concerns are particularly pronounced in modern mining operations, where increasing mining depths and expanding production scales amplify the complexity of stress regime management. Therefore, comprehensive characterization and precise prediction of stress magnitude and distribution patterns in goaf regions have become imperative for ensuring operational safety in longwall mining environments.
Previous investigations have examined the mechanical response and geomaterial deformation patterns in goaf environments through analytical frameworks and computational modeling approaches [6,7,8]. Qian M et al. [9] demonstrated that subsurface mass movement profiles more accurately reflect field conditions when characterized by negative exponential functions. Jiang L et al. [10] performed a coupled analysis of mining-induced stress regimes and the characteristics of bifurcated zones (fragmented and fractured domains) within an overburden sequence by simulating their distinct features, revealing exponential pressure evolution during waste material consolidation. Sui W et al. [11] categorized stress distributions within rock masses into five domains based on principal stress extrema. Tu H et al. [12] established a computational methodology for stress field determination in room-and-pillar environments utilizing superposition principles. Wang Z et al. [13] introduced concepts including the “confined roof behavior principle”, “quaternary temporal phases”, and the strata–floor mass interaction under spatiotemporal conditions through field observations. While these studies elucidated the failure mechanisms of superincumbent strata and constitutive behavior in goaf regions, the practical implementation of stress monitoring remains challenging due to the limitations of conventional monitoring approaches. In addition, the goaf treatment method has a significant impact on the surrounding stress distribution, and the filling method can effectively regulate the stress state of the surrounding rock. Compared with the alternating distribution of the stress concentration and pressure relief zone caused by the natural collapse method, the backfill method can reduce the stress of the original rock by 30–70% by actively supporting the surrounding rock.
The primary challenge in goaf stress monitoring lies in sensor deployment and data acquisition. Traditional monitoring methods rely on instruments installed directly in the coal seam floor, making them vulnerable to damage from roof caving during mining operations. Furthermore, conventional physical simulation experiments typically employ discrete monitoring devices, such as extensometers and surveying instruments [14,15,16], which provide only localized resolution and exhibit operational complexity. These limitations have motivated the exploration of alternative monitoring technologies, particularly the implementation of distributed optical fiber sensing technology (DOFS) [17,18,19]. DOFS presents several distinctive advantages for goaf stress field monitoring. First, by installing optical fibers in the key stratum that experiences relatively less impact, rather than in the coal seam floor, the system achieves stable continuous monitoring throughout the entire mining process. Second, the technology offers superior durability and reliability, with optical fiber materials demonstrating strong corrosion resistance and an operational lifespan exceeding 20 years under normal conditions. Third, the absence of electrical components eliminates spark-related safety risks in underground environments [20,21,22]. Most importantly, DOFS enables continuous spatiotemporal monitoring with high-resolution data acquisition, establishing an advanced methodology for the stability assessment of superincumbent formations. These advantages have led to the widespread adoption of DOFS in dynamic monitoring applications within physical simulation experiments [23,24]. Currently, in the engineering field (such as mining and geology), distributed optical fiber technology mainly uses the optical fiber strain integration method to monitor the deformation of rock and soil bodies. This method requires a high coupling degree between the optical fiber and the structure being measured to ensure accuracy.
To address these challenges, this study develops an integrated methodology that couples distributed optical fiber sensing technology with key stratum fracture mechanics for precise goaf stress field prediction. The specific objectives of this research are to establish a new monitoring method by deploying fiber optic sensors at critical layers and establish a dual-state theoretical framework to describe the settlement behavior of the critical layer before and after breaking. By deploying optical fiber sensors in key layers, a new method for continuous spatiotemporal monitoring is constructed. Finally, a data-driven approach is created to connect fiber monitoring data with stress field prediction models, which is validated through physical experiments. The remainder of this paper is organized as follows: Section 2 presents the theoretical basis for key stratum fracture mechanics and establishes the mathematical relationship between stratum deformation and goaf stress. Section 3 details the experimental setup, including the physical model construction and optical fiber sensor deployment. Section 4 analyzes the monitoring results and validates the proposed methodology through comparison with conventional pressure sensors. Finally, Section 5 and Section 6 summarize the key findings and discuss their implications for mining safety practices. This research provides several significant contributions to the field. By integrating high-precision optical fiber sensing with theoretical modeling, we establish quantitative relationships between goaf pressure changes and key stratum failures. The determination of the ultimate strain threshold for key stratum failure offers crucial parameters for stability prediction. Furthermore, our methodology enables continuous spatiotemporal monitoring while accounting for the mechanical properties of fragmented masses and the synergistic effects of critical stratum failure, addressing a significant gap in comprehensive inverse analysis approaches.

2. Pressure Inversion Model for Gob Areas Driven by Optical Fiber Monitoring Data

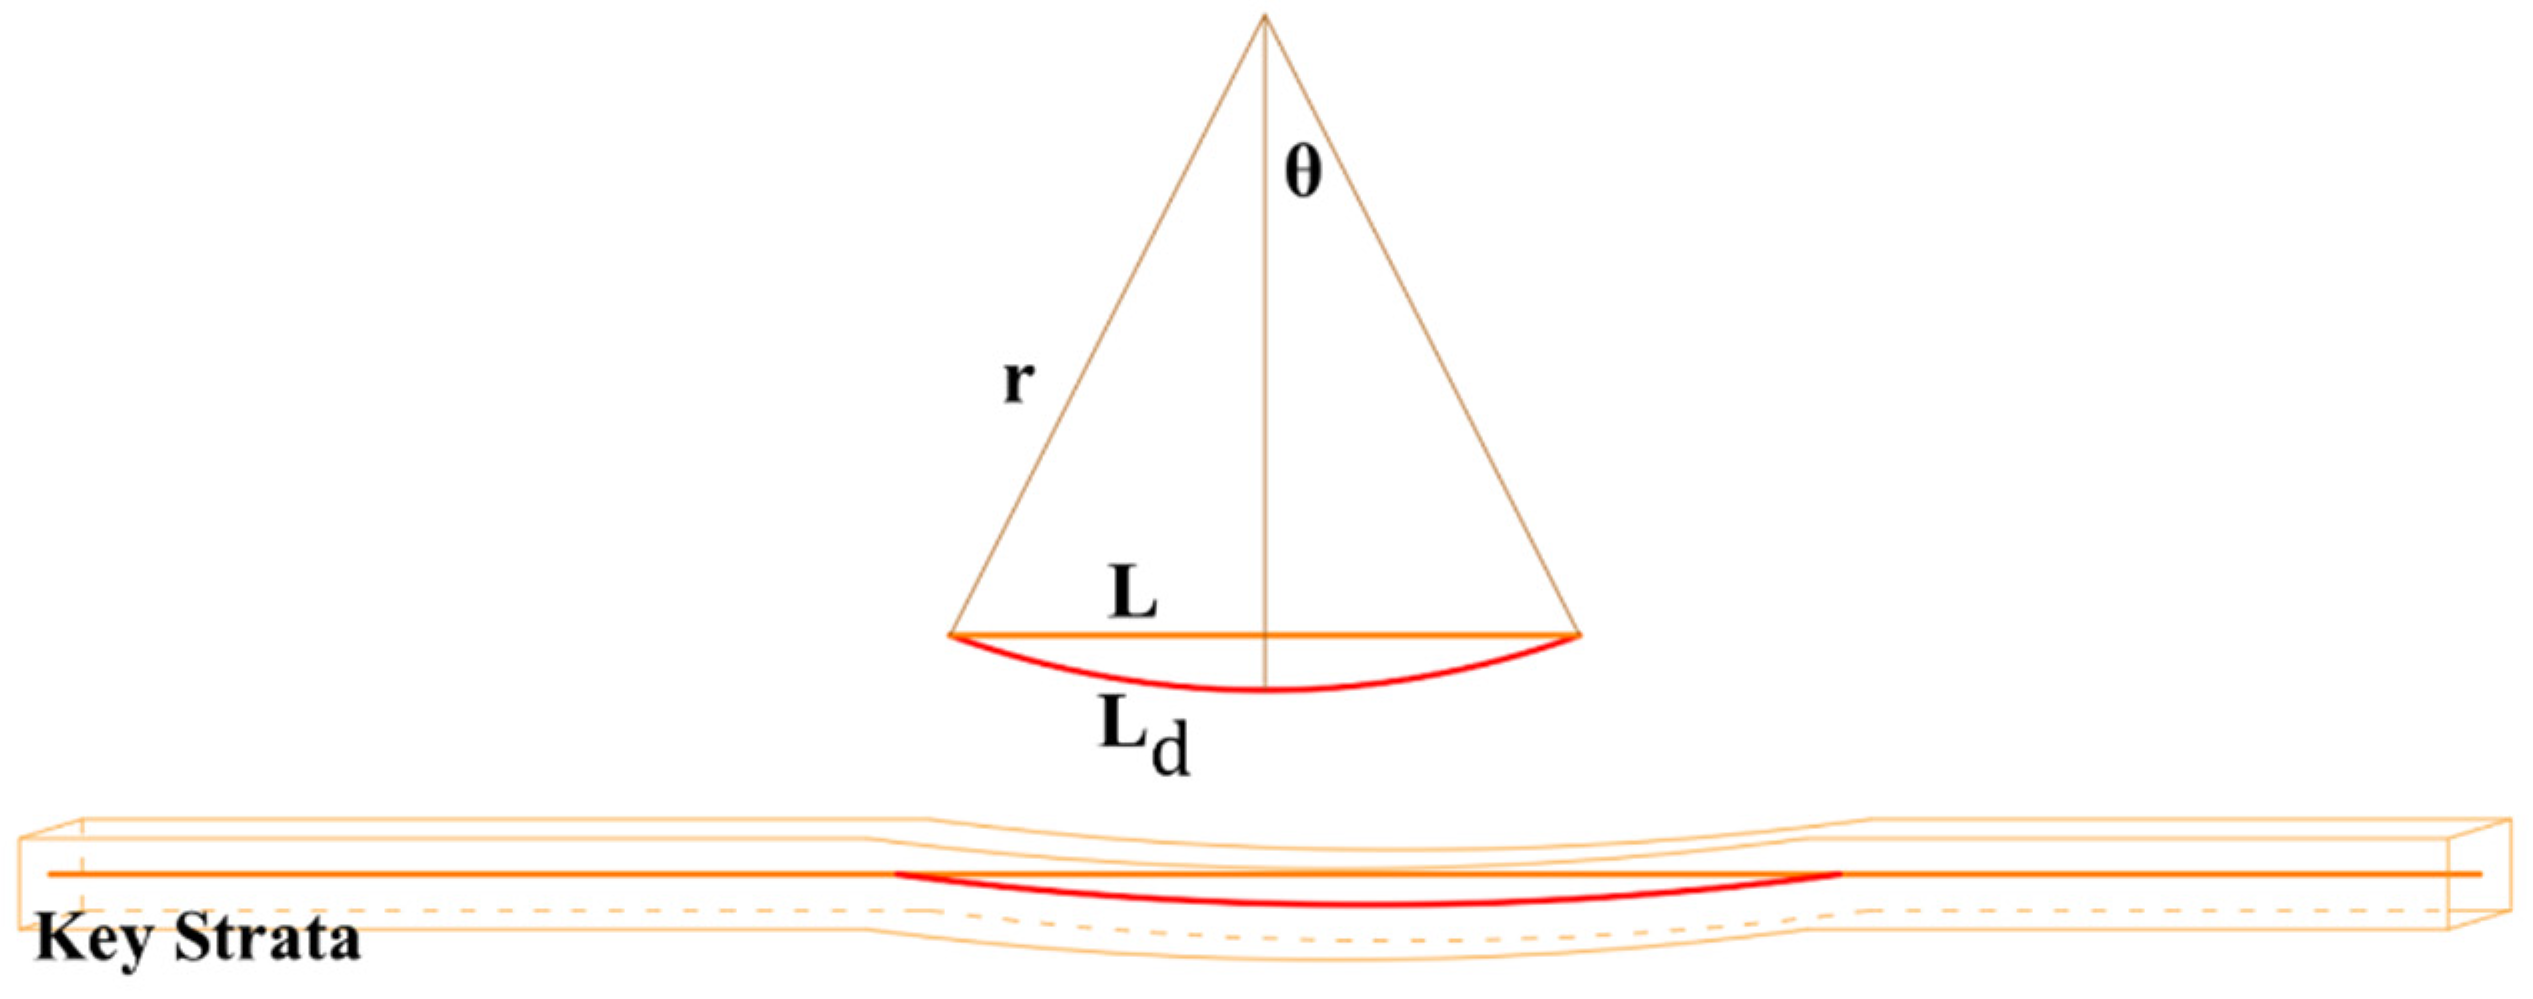
2.1. Distributed Optical Fiber Representation and Calculation Method for Subsidence of Key Strata

The distributed optical fiber sensing (DOFS) methodology for strata deformation monitoring utilizes microbending responses of embedded sensors subjected to mining-induced displacements [25]. The mechanical behavior can be conceptualized as a simply supported beam model, where sensing elements respond to continuous uniform loading from superincumbent formations. Based on sensor–formation interaction mechanics, the analytical framework for stratum subsidence quantification encompasses two distinct phases: pre-failure and post-failure regimes. In the pre-failure phase, robust interfacial coupling enables direct strain integration computation. Post-failure analysis initially requires fracture zone localization, followed by the integration of geometric deformation parameters to achieve comprehensive subsidence characterization through distributed sensing data.
(1)
Before fracture of the key strata.
Before the fracture of the key strata, the strain data measured by distributed optical fibers can be used to deduce the bending deflection of the key strata. The center of the bending deformation model of the key strata is at the point of maximum deflection in the bending segment, and the deformation of the bending segment assumes an arcuate shape. This deformation characteristic allows the deformation pattern of the optical fibers to be modeled as an arc, thereby enabling a quantitative description of the geometric relationship; the simplified model is shown in Figure 1. The relationship expression for the bending deflection Sx (m) of the rock strata is:
S x = r ( 1 cos θ )
where r (m) is the radius of curvature and θ (dimensionless) is the arc angle, and its value is limited by the configuration of the embedded sensor. The relationship between them is expressed as:
{ θ = L d 2 r r = L 2 sin θ
where L denotes the initial embedded length of the optical fiber and Ld represents the deformed length of the optical fiber after axial tension. Ld can be derived by summing the strains at each sampling point of the optical fiber, and its expression is:
L d = L + i = 1 N = L ι ι ε i
where N represents the number of sampling points for the optical fiber embedded in the key strata, ι is the set spatial sampling interval, and εi denotes the strain at each sampling point.
(2)
After the fracture of the key strata.
Utilizing rock mechanics fundamentals, the flexural moment of the critical rock layer, which approximates a basic support structure, can be obtained, thereby allowing the stress distribution in the optical fibers to be deduced. When the deformation of the key strata is significant, a longitudinal fissure may appear at a certain location, exposing the optical fibers embedded within it. At this point, the two fractured sections of the rock strata exert tensile forces on the optical fibers at the fissure, leading to a sudden change in stress at that location. At the discontinuity interface, the combined effect of shearing forces and rock–fiber contact friction generates localized stress concentrations Fa and Fb along the rupture plane. The resultant loads can be resolved into orthogonal components: normal forces Fav and Fbv, coupled with lateral forces Fah and Fbh. Among them, under the action of the horizontal forces Fah and Fbh, compressive stress concentrations form in the optical fibers. For equilibrium preservation, the sensing elements develop counteracting forces Fta and Ftb within the intact competent formation flanking the failure zone.
Taking the key strata model with a masonry beam structure formed by three collapses as an example, we consider the middle-collapsed rock block to be parallel to the initial position of the key strata. The simplified model is shown in Figure 2. The lengths L1′, L2′, and L3′ of the optical fibers after fracture at different positions of the rock block can be obtained from the initial lengths L1, L2, and L3, along with the strains measured by the optical fibers, using the following expressions:
L 1 = L 1 ( 1 + ε 1 )
where ε1 represents the tensile strain experienced by the segment L1. The expression for the subsidence H1 of the optical fiber at this location is:
H 1 = L 1 2 L 1 2 L 1 2 ε 1
Similarly, for the second exposed segment of the optical fiber, the calculation can be performed using the following formula:
H 3 H 2 L 3 2 ε 2
The relationship between the optical fiber, which changes position as the rock strata fracture, and its initial position can be regarded as a similar triangle with sides of L1, L1′, H1 and another triangle with sides of L1′ + L2′, H2, and L1 + L2. The expression for this similarity is:
H 2 = ( L 1 + L 2 ) H 1 L 1
Substituting Formula (4) into the relevant equation, we obtain:
H 2 = L 1 2 ε 1 + L 2 2 ε 1 1 + ε 1
Next, we obtain the expression for H3, which represents the subsidence Sx after the fracture of the key strata. The integrated expression is as follows:
H 3 = L 1 2 ε 1 + L 2 2 ε 1 1 + ε 1 + L 3 2 ε 2
Based on the principles of Equations (4)–(9), the settlement at each fracture point of the key strata, which exhibit a masonry beam fracture pattern, can be inferred from the changes in the strain of the optical fibers embedded within the rock blocks. The tensile strain experienced by the optical fibers can indicate this settlement and the degree of key strata collapse. The specific expressions are as follows:
S x = x N 2 N = 1 N = x / l ε N
where HN represents the distance between each sampling point and the coal wall and Sx′ denotes the subsidence at different positions after the fracture of the key strata.

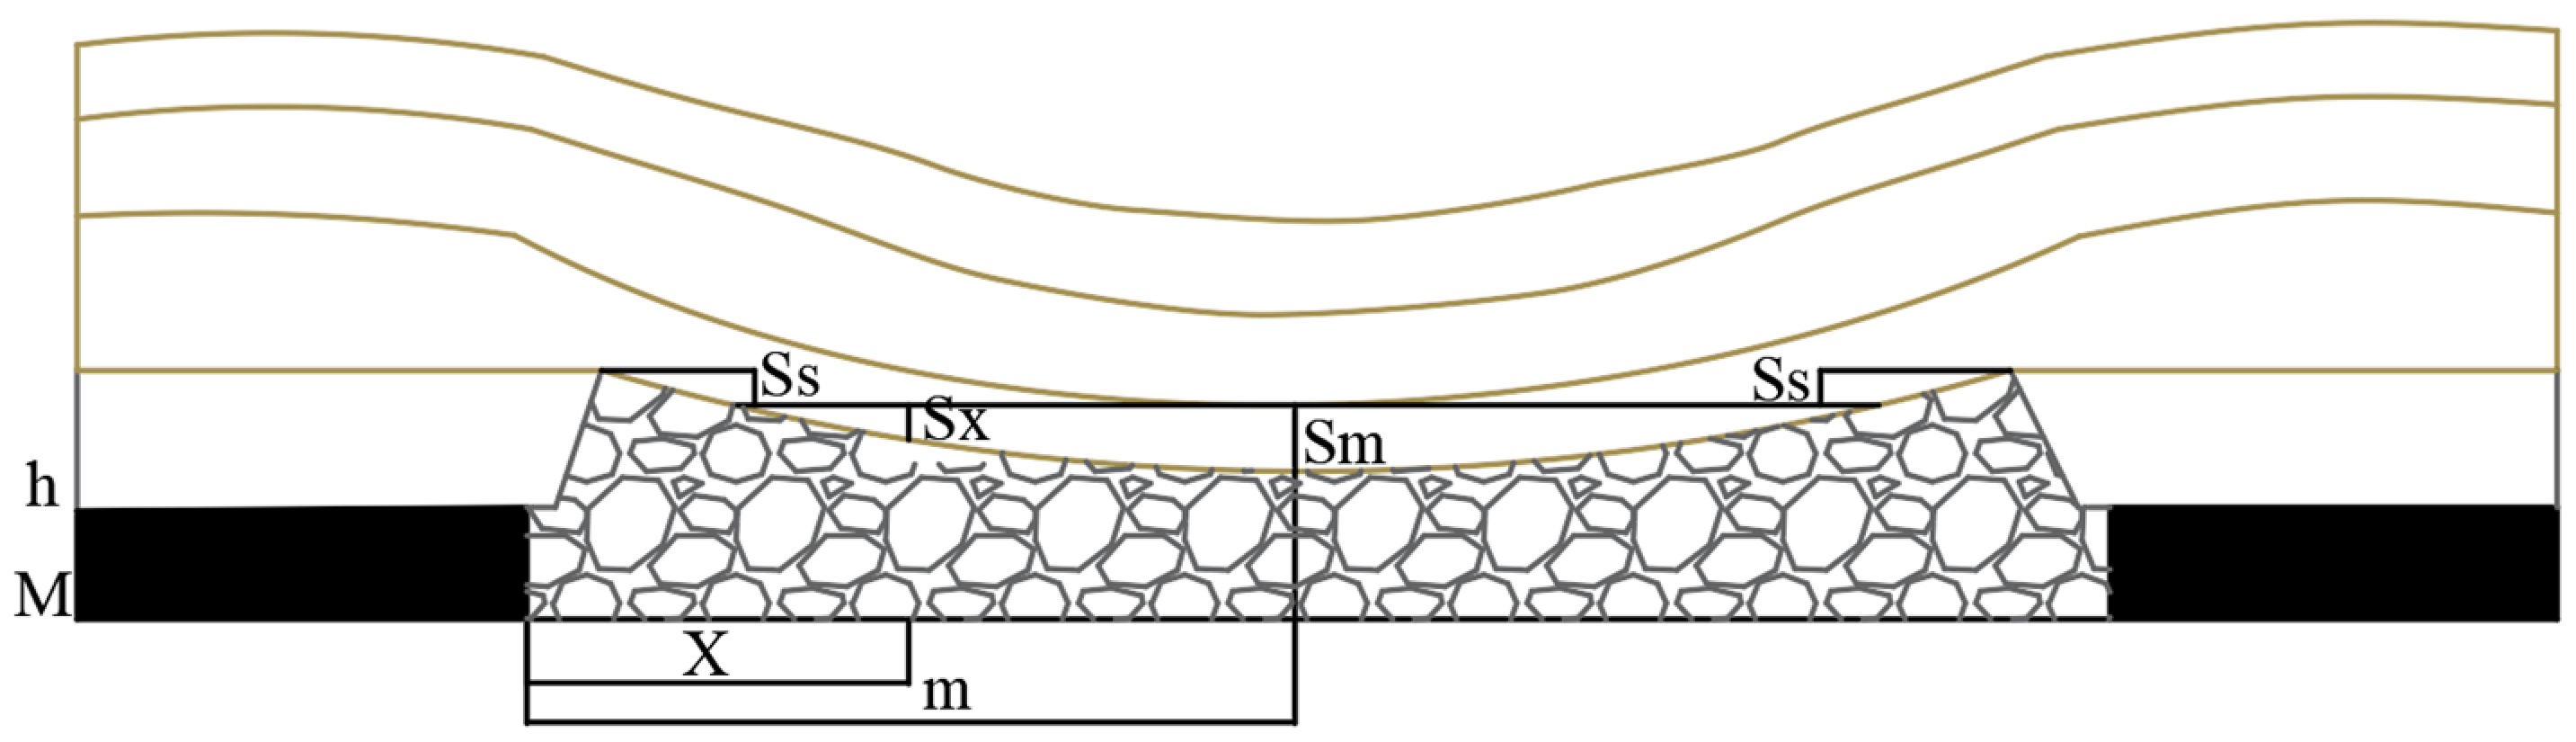
2.2. The Inversion Method for Pressure Distribution in the Gob Area

The redistribution of geostatic loads and the evolving stress regime in the overburden sequence during extraction operations directly induces ground pressure phenomena. After coal seam extraction, two major systems are formed, i.e., the gob area and the surrounding rock, which are both opposed and unified. The goaf and the surrounding rock mass are interdependent and form a complex, dynamic system. As the mining progresses, the stresses and deformations in this system undergo continuous adjustment, leading to the manifestation of mining pressure in the form of roof falls, floor heave, rib spalling, and other geomechanical phenomena. The height of the falling zone is an important parameter of goaf strain; the height of the falling zone is generally 4–6 times the mining height, and the height of the fracture zone is 10–15 times the mining height. The expression for the height of the caved zone Hc is as follows:
H C = h M S S b 1 , S S S S max
where hM represents the mining height, SS is the flexural deformation of the overlying formation above the mined-out void, SSmax represents the critical subsidence threshold, and b denotes the bulking factor of the collapsed lithological units. The deformation magnitude within the goaf zone correlates with both the lateral offset from the mining face and the geomechanical properties of the surrounding strata. The expression for the strain εx in the gob area at a distance X from the coal wall is:
ε x = S x H c + h M
Substituting Equation (11) into Equation (12) yields:
ε x = S x h M b 0.05 h M 1.2
where Sx represents the deformation of the caved gangue at a distance X from the coal wall in the gob area. The sinking of the critical layer is shown in Figure 3.
During the longwall mining process, as the working face advances from the setup room, the sequential extraction of resources creates a goaf zone, which leads to the progressive subsidence of the adjacent rock strata. The expansion index of the fragmented lithological units is unable to fully compensate for the void created by the excavation. This results in bed separation between the immediate and primary roof horizons, leading to a complete redistribution of the overburden load onto the abutment zones. As the working face continues to advance, the immediate roof continues to collapse and fill the gob area, with the caved immediate roof eventually coming into contact with the main roof. At this stage, the majority of the weight from the overlying rock strata is still supported by the surrounding rock formations. As the mining operation progresses further, the scope of roof collapse and failure gradually extends upwards towards the overlying rock strata. The caved gangue, or waste material, is continuously compressed until it becomes compacted, with the weight it bears from the overlying rock strata correspondingly increasing. The geostatic pressure, or the pressure exerted by the weight of the rock formations, transitions from being primarily supported by the peripheral support pillars to alternative load-bearing mechanisms, such as the compacted caved material and the surrounding rock formations. This complex sequence of events, involving the creation of the goaf zone, bed separation, roof collapse, and the redistribution of geostatic pressure, is a critical aspect of the longwall mining process and must be carefully managed to ensure the safety and efficiency of the mining operation. Therefore, the expression for the stress in the gob area at a distance X is:
σ x = E 0 ε x 1 ( ε x ε M )
where E0 denotes the initial deformation modulus, while εM represents the ultimate strain of the caved goaf material under roof pressure loading. The εM coefficient is derived through:
ε M = b 1 b
As the longwall mining face advances, the abutment pressure within the goaf material undergoes progressive reconsolidation and compaction. The length of the compaction zone extends synchronously with the advancement of the face, as the caved and fractured rock material is gradually compressed under the increasing overburden pressure [26,27,28]. The in situ stress regime of the reconsolidated goaf material gradually re-establishes to approximate the pre-mining geostatic pressure conditions. This means that at equivalent subsurface horizons within the goaf zone, the vertical stress component tends to maintain a state of equilibrium, excluding any significant tectonic influences. Notably, there is a significant reduction in the stress levels in the direction of the gob area around the active mining face. Conversely, the load-bearing demands in front of the coal face increase, leading to the formation of stress concentration in this zone. This redistribution of the in situ stresses is a critical factor in the longwall mining process. The increased load in front of the coal face can lead to ground control challenges, such as excessive roof sagging, rib spalling, or even pillar failure, if not properly managed. Likewise, the reduced stress levels within the gob area can result in unstable caving behavior and potential surface subsidence issues. Continuous monitoring of the stress changes within the goaf and the surrounding rock mass is essential to optimize the longwall mining design and operational parameters. Advanced numerical modeling techniques, in combination with field instrumentation data, can provide valuable insights into the evolving stress regime and guide the implementation of effective ground control measures. The successful management of the stress redistribution within the goaf and the coal face abutment zones is a key aspect of safe and efficient longwall mining operations. It requires a comprehensive understanding of rock mechanics principles, as well as the application of advanced monitoring and data analysis tools to proactively identify and mitigate potential geotechnical risks.
By substituting Equations (1)–(3) into Equation (14), we can obtain the strain in the gob area monitored by optical fibers before the key stratum breaks. Similarly, by substituting Equation (10) into Equation (14), we can obtain the strain in the gob area monitored by optical fibers after the key stratum breaks. The specific expressions are as follows:
{ σ x = E 0 [ L ( x ) + i = 1 N ι ε i × ( 1 cos θ ) ] ( b 1 ) b [ h M ( [ L ( x ) + i = 1 N ι ε i × ( 1 cos θ ) ] ) ] 0.05 h M 1.2 Before fracture of the key strata σ x = E 0 ( S x = x N 2 N = 1 N = x / l ε N ) ( b 1 ) b [ h M ( S x = x N 2 N = 1 N = x / l ε N ) ] 0.05 h M 1.2 After the fracture of the key strata
From a theoretical perspective, this research innovatively establishes a goaf pressure inversion model driven by distributed optical fiber monitoring data, uniquely coupling the key stratum fracture mechanics model with the subsidence trajectory function model. Specifically, before the key stratum fracture, the fiber bending deformation characteristics are analyzed based on a simply supported beam model, and the stratum subsidence is obtained through strain integration calculation. After the key stratum fracture, considering the stress concentration effect at the fractured surface, a mapping relationship between fiber geometric deformation and stratum subsidence is established based on the masonry beam structure characteristics. By establishing quantitative relationships between stratum subsidence characteristics and goaf pressure distribution in these two stages, a complete pressure inversion theoretical system is formed. This theoretical innovation not only enables accurate prediction of pressure distribution in the goaf area but also provides important theoretical support for the development of real-time monitoring technology.
To verify the reliability and practicality of this theoretical system, we designed a physical model experiment based on Brillouin Optical Time Domain Analysis (BOTDA) technology. This experiment not only comprehensively monitors the deformation process of the key stratum but also obtains critical parameters of stratum fracture through high-precision fiber sensing technology, providing an important experimental foundation for the practical application of the theoretical model. Next, let us examine in detail the specific design and implementation process of this physical model experiment.

3. The Experiment of Similar Physical Models

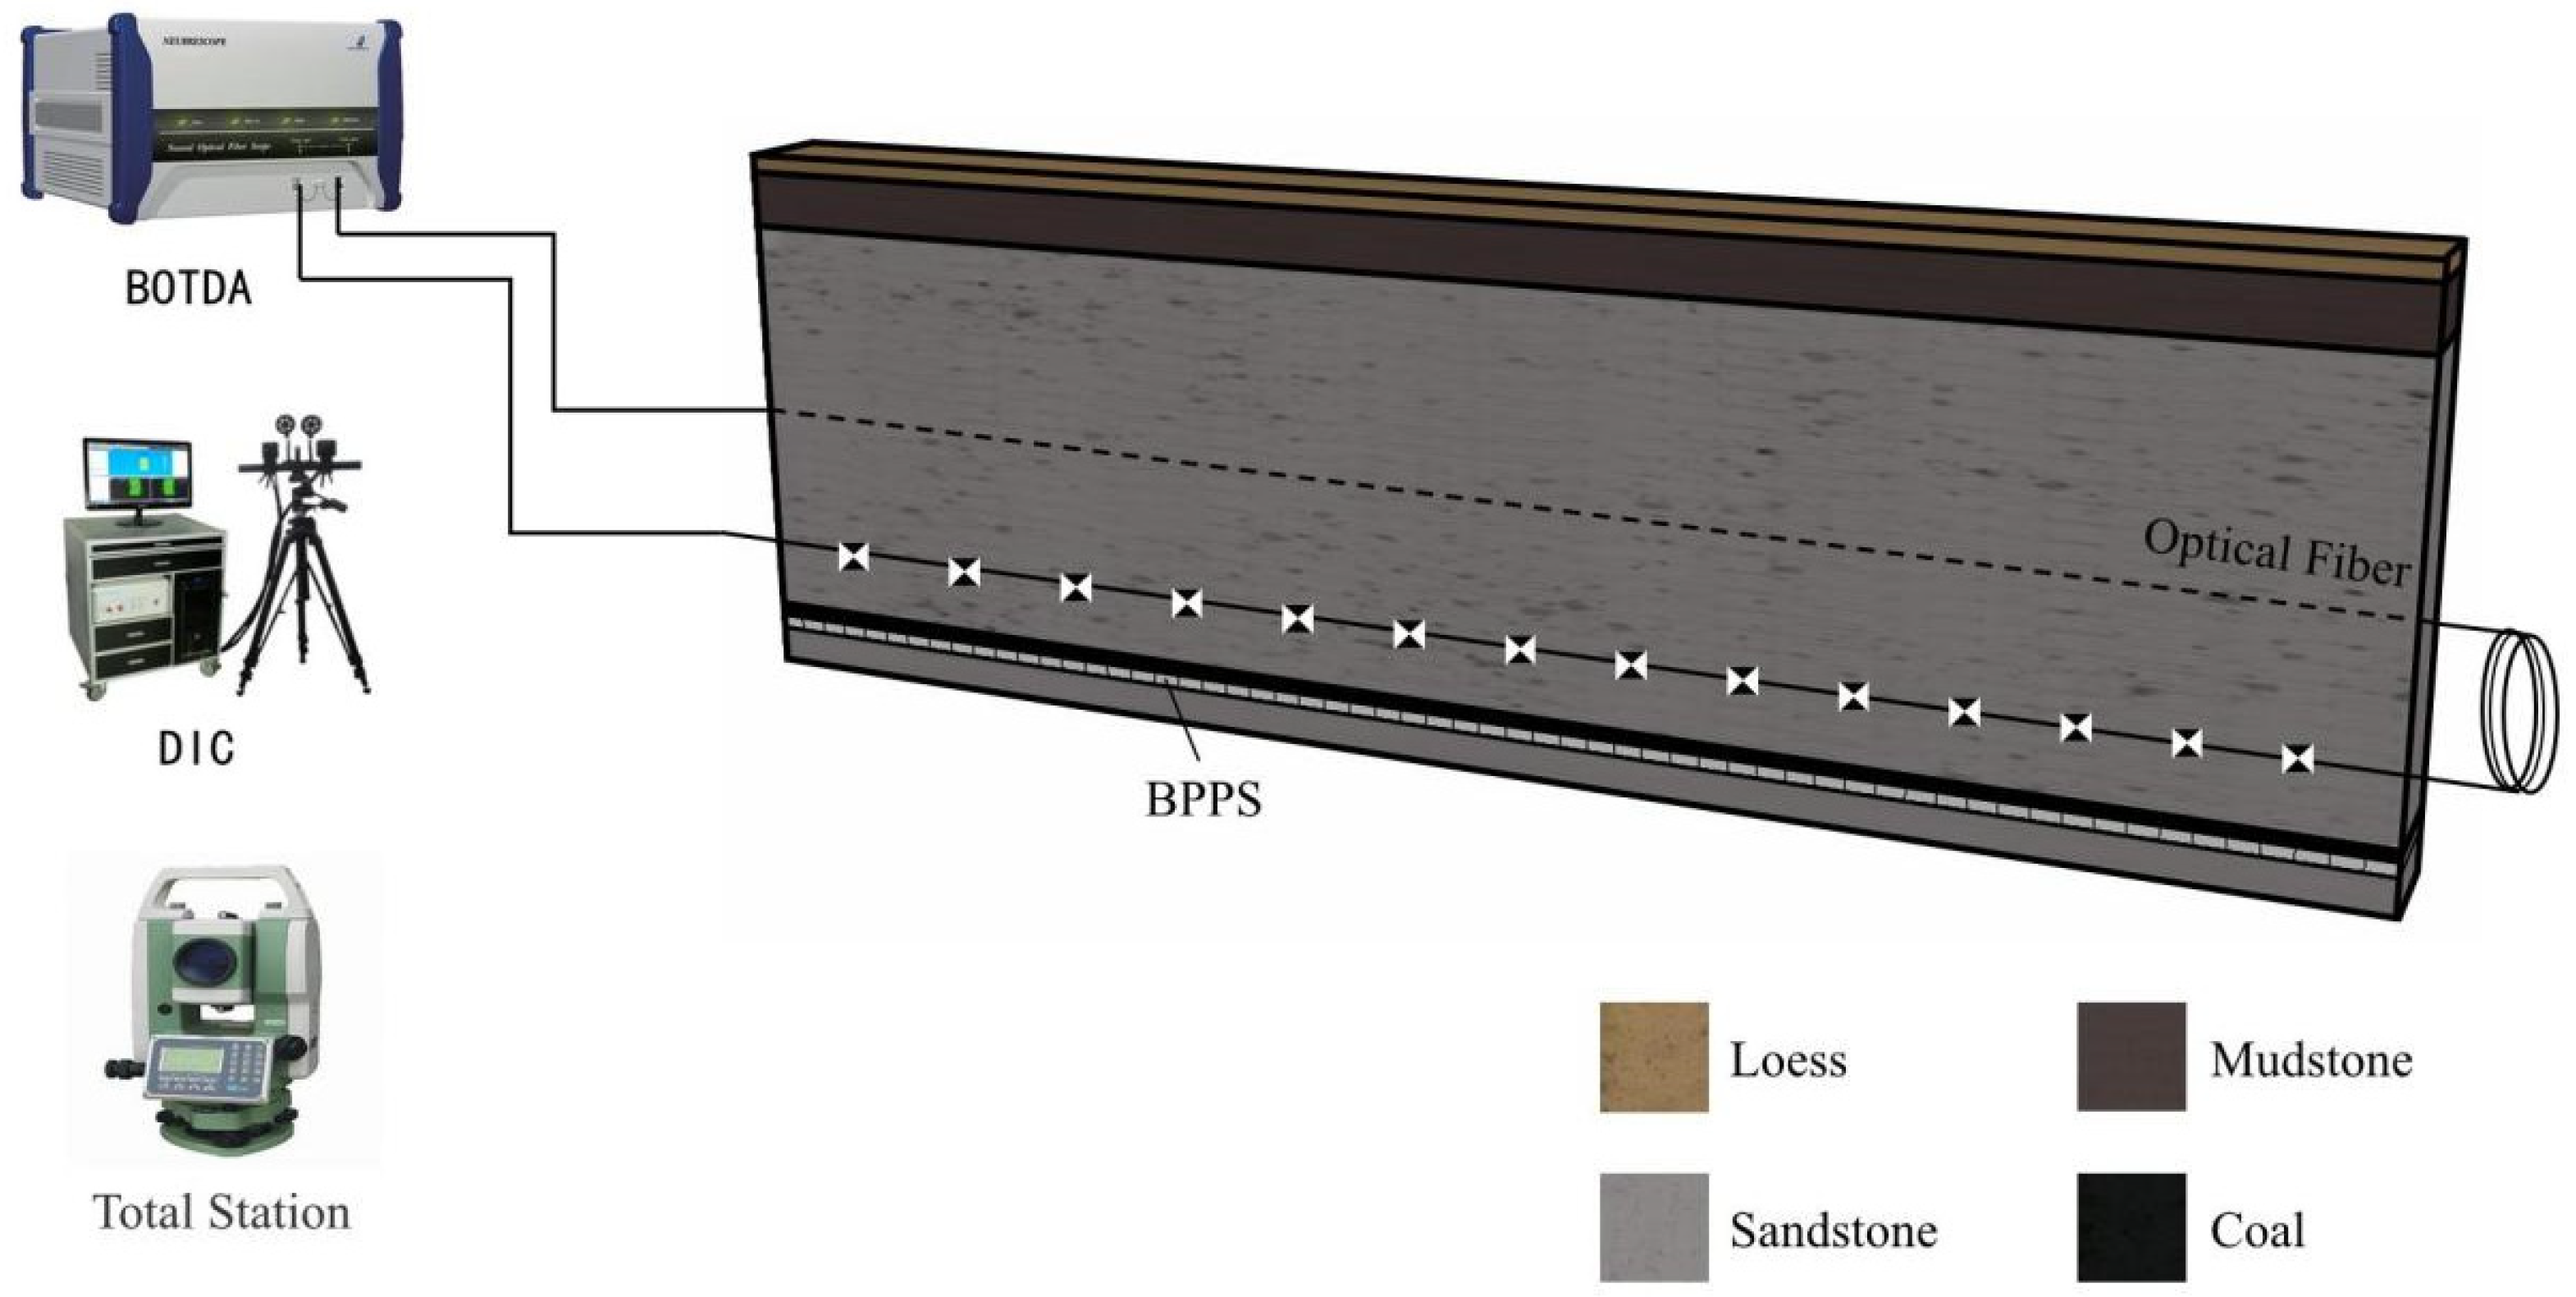
3.1. Overview of the Model

The reference for simulating the lithology of various strata and the methodology for replicating the stratigraphic configuration and their geomechanical properties using similar materials is shown in Table 1. Based on the principle of geometric similarity and dynamic similarity, a similarity coefficient of 150 is selected to ensure the accurate reproduction of fracture propagation and stress redistribution. The bulk density similarity ratio is 1.56, and the stress similarity ratio is 380. The dimensions of the model are 3000 mm in length, 200 mm in width, and 1140 mm in height. When designing the excavation parameters for the model, a 30 cm boundary coal pillar is set at both ends of the coal seam. The mining step distance for this experiment is 4 cm, and the experimental protocol comprises 60 extraction sequences, achieving a cumulative advance of 240 cm. River sand functions as the primary aggregate in the equivalent material composition, with gypsum and white powder serving as cementing agents. Micaceous powder with 20–50 mesh granularity is incorporated as the stratified component. Following the predetermined proportioning scheme, the equivalent materials are deposited in sequential strata. The simulated coal seam maintains a thickness of 2 cm, with the principal key stratum positioned 13 cm superior to the coal horizon.

3.2. Layout of the Monitoring System

The experimental apparatus incorporates an integrated monitoring framework consisting of DIC instrumentation and distributed optical fiber sensors, synchronized through a high-precision total station measurement system, as depicted in Figure 4. Data acquisition from each monitoring subsystem commences following the face advancement and strata stabilization phases. The surveying apparatus employs a Leica TS02 instrument, establishing 25 monitoring points at 10 cm intervals across the critical stratum surface, intersecting with the optical fiber array to form a horizontal measurement grid. Floor-mounted pressure transducers are installed at the base of the physical model for monitoring the stress evolution and spatial distribution within the goaf region. The analysis employs a GOM-aramis digital image correlation apparatus, which acquires surface deformation patterns via dual high-resolution CCD sensors operating at 2648 × 2448 pixel definition. Given the insufficient surface contrast of the analogous materials, engineered speckle patterns must be artificially applied. The optimization process determines circular speckle elements of 3mm diameter, achieving approximately 40% surface coverage density. The correlation window dimensions are established through dual-threshold optimization, with image processing parameters configured at a 30-pixel minimum correlation area and a 15-pixel facet interval. The instrumentation incorporates single-mode compact optical fibers (2000 μm diameter) selected for their minimal interference with rock mass deformation characteristics. During the installation phase of analogous materials up to the critical stratum position, a calibrated tensile force is applied to the optical sensors to ensure precise linear alignment within the target stratum. The NBX-6055 fiber optic analyzer operates with parameters set to 1 cm sampling intervals, 5 cm spatial resolution, and an averaged sampling frequency of 2 × 10⁶ measurements.
This physical simulation program demonstrates several unique advantages and innovative features in its comprehensive design. The model employs a sophisticated multi-scale approach with carefully calculated similarity ratios (dimensional scaling coefficient of 150 and density similarity constant of 1.56), enabling accurate representation of complex geological conditions while maintaining practical experimental dimensions (3000 mm × 200 mm × 1140 mm). A key strength lies in its integrated monitoring framework that synergistically combines three advanced measurement technologies: distributed optical fiber sensing, digital image correlation (DIC), and high-precision total station measurements. This multimodal monitoring approach enables unprecedented coverage and cross-validation of deformation measurements. The model’s design incorporates meticulous attention to material selection and preparation, utilizing river sand as the primary aggregate with precisely controlled proportions of gypsum and white powder as binding agents, while micaceous powder (20–50 mesh) provides realistic stratification effects. Furthermore, the experimental protocol’s systematic mining sequence (60 extractions of 4 cm each) allows for detailed observation of progressive failure mechanisms. The optimization of measurement parameters, including the 3mm diameter speckle elements with 40% surface coverage for DIC and the precisely calibrated optical fiber installation with 1 cm sampling intervals, demonstrates the model’s capability for high-resolution data acquisition. This comprehensive simulation program not only enables detailed investigation of key stratum behavior but also provides valuable insights into the complex interactions between mining-induced deformation and stress redistribution in the surrounding rock mass, making it an invaluable tool for validating theoretical predictions and understanding practical mining scenarios.

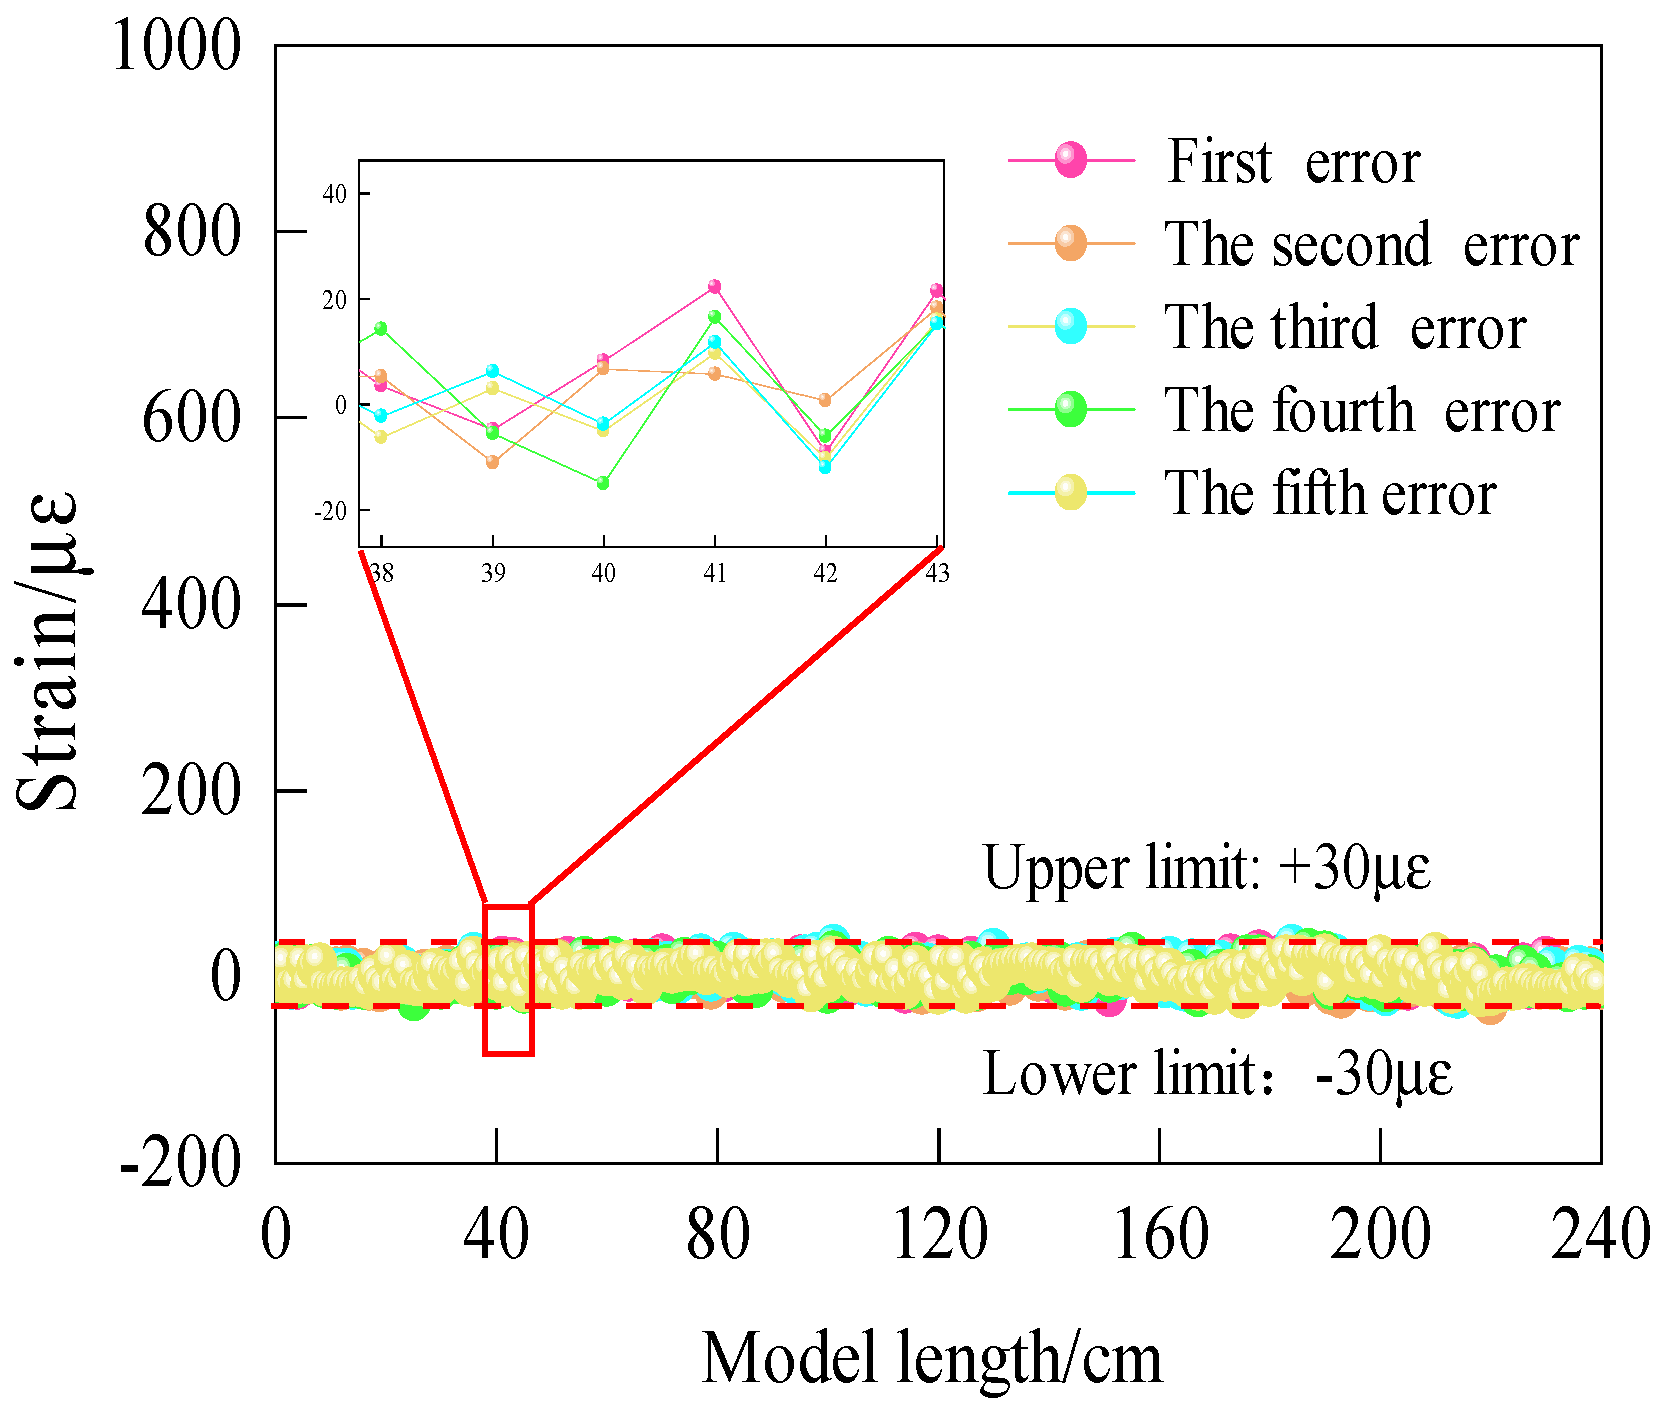
3.3. Fiber Optic Test System Accuracy

To validate the data reliability, post-construction calibration of the optical sensing elements is conducted following the physical model assembly [29,30]. The embedded fiber optic sensors within the critical stratum undergo quintuple verification tests. With the initial measurement serving as the reference baseline, comparative analysis of the four subsequent datasets enables the quantification of systematic strain variations, as illustrated in Figure 5. The graphical representation depicts the monitored length along the model axis excluding coal support elements on the x-axis, while the y-axis quantifies the strain measurements from fiber optic instrumentation. The measurement consistency demonstrates the robust survivability of the fiber optic sensing array and indicates stable instrumentation performance with minimal systematic deviation. The monitoring system exhibits high stability characteristics, with strain measurement precision maintained within the ±30 με range, excluding isolated anomalous readings. This calibration outcome substantiates the measurement fidelity of the fiber optic sensor network, establishing a reliable foundation for subsequent rock mass deformation monitoring and analysis.
Through the design and construction of similar experimental models, as well as the layout and accuracy verification of the monitoring system, we have established a reliable technical foundation for subsequent experiments. Having ensured the stability of the monitoring system and the accuracy of data acquisition, we will now focus on analyzing the main phenomena observed during the experiment and their underlying mechanisms, delving deep into the key scientific questions revealed by the experimental results. This not only helps validate our theoretical hypotheses but also provides important reference points for engineering practice.

4. Analysis of Test Results

4.1. The Main Test Phenomenon

Upon longwall advancement reaching 28 cm, roof subsidence initiates in the immediate strata overlying the coal horizon, exhibiting initial failure dimensions of 24 cm in length and 2.5 cm in vertical displacement. With continued face progression to 48 cm, the primary fracture manifests in the critical stratum, characterized by a subsidence zone extending 42 cm horizontally and 23 cm vertically. Concurrent monitoring indicates the initial pressure surge from superincumbent strata acting upon the extraction face. The mining-induced deformation generates a cantilever structure at the unexploited coal boundary, resulting in stratigraphic delamination between the critical horizon and its substrata.
As the longwall face advances to 64 cm, the initial periodic loading phenomenon manifests, inducing secondary fracturing within the critical stratum. The destabilized rock mass configuration evolves into an articulated structure, where intact segments at the stratum terminals function as hinged supports, generating lateral thrust forces that establish a characteristic voussoir beam mechanism. Upon face progression reaching 240 cm, the caved zone development extends to 7.5 cm vertically, while the fractured zone propagates to 35 cm in height. The progressive strata deformation pattern is documented in Figure 6. Following complete panel extraction, the model crown experiences 1.1 cm of total subsidence, with asymmetric break angles of 69° and 61° developing on the panel boundaries.

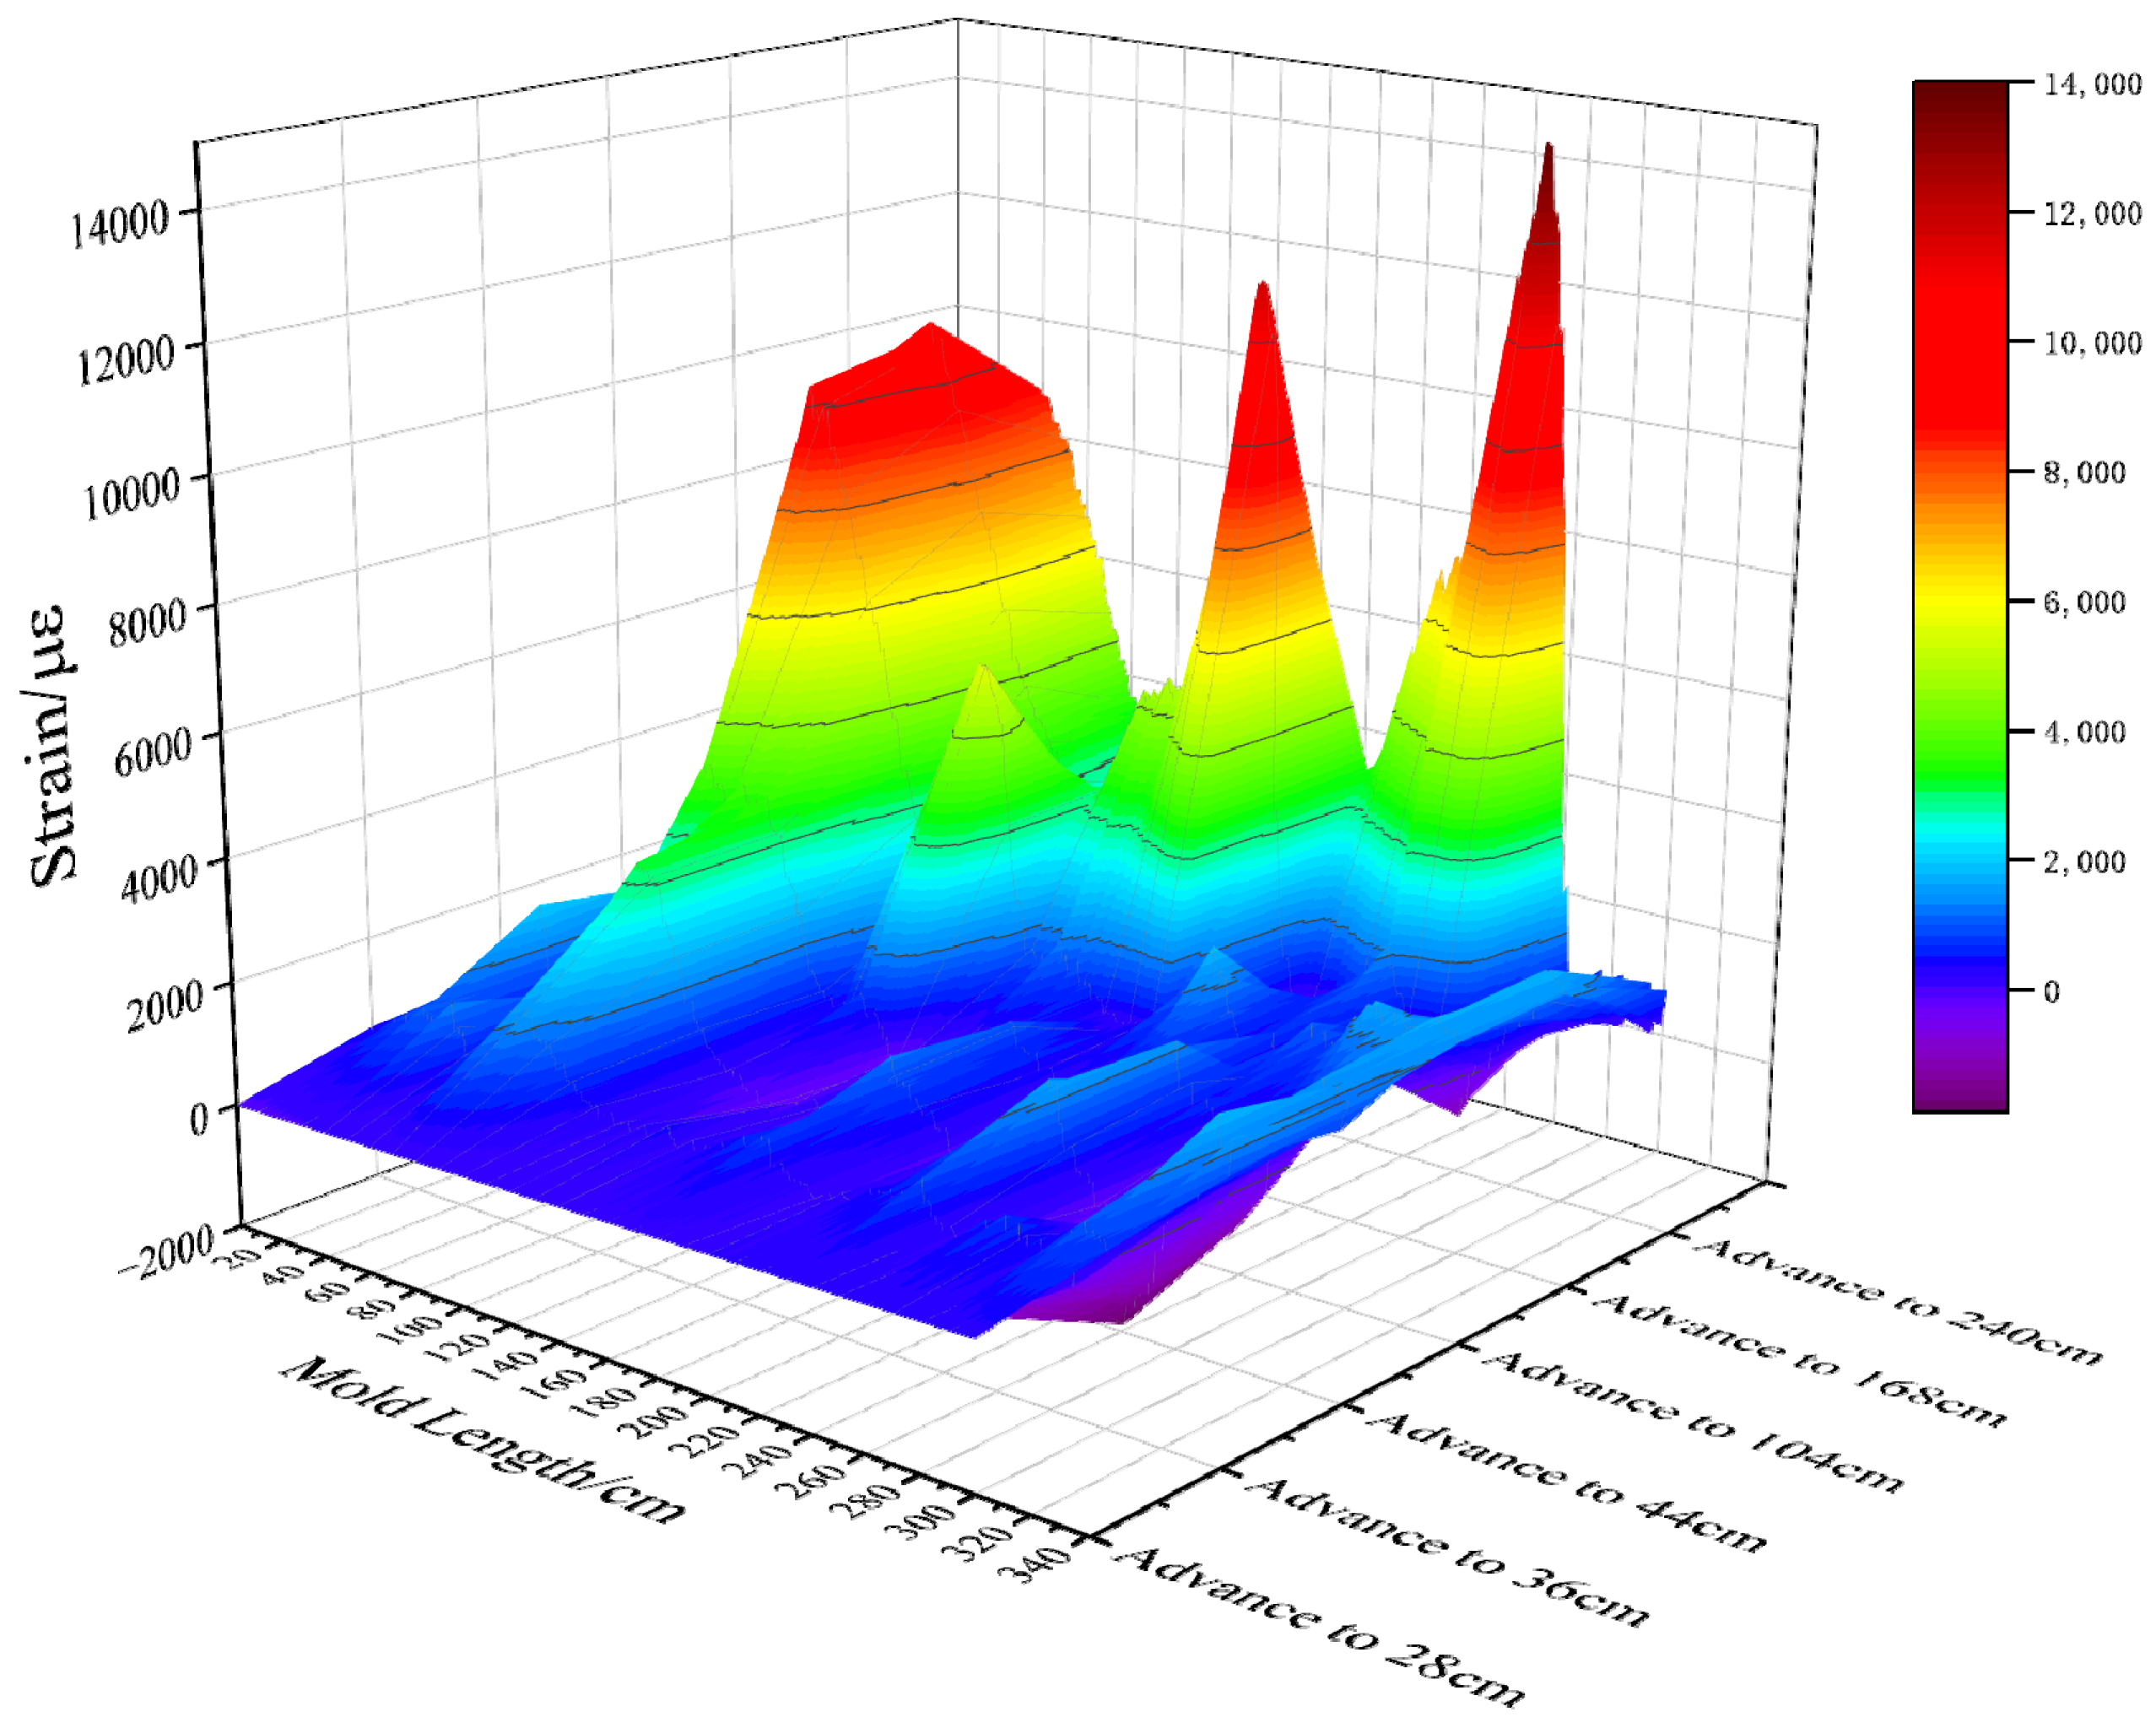
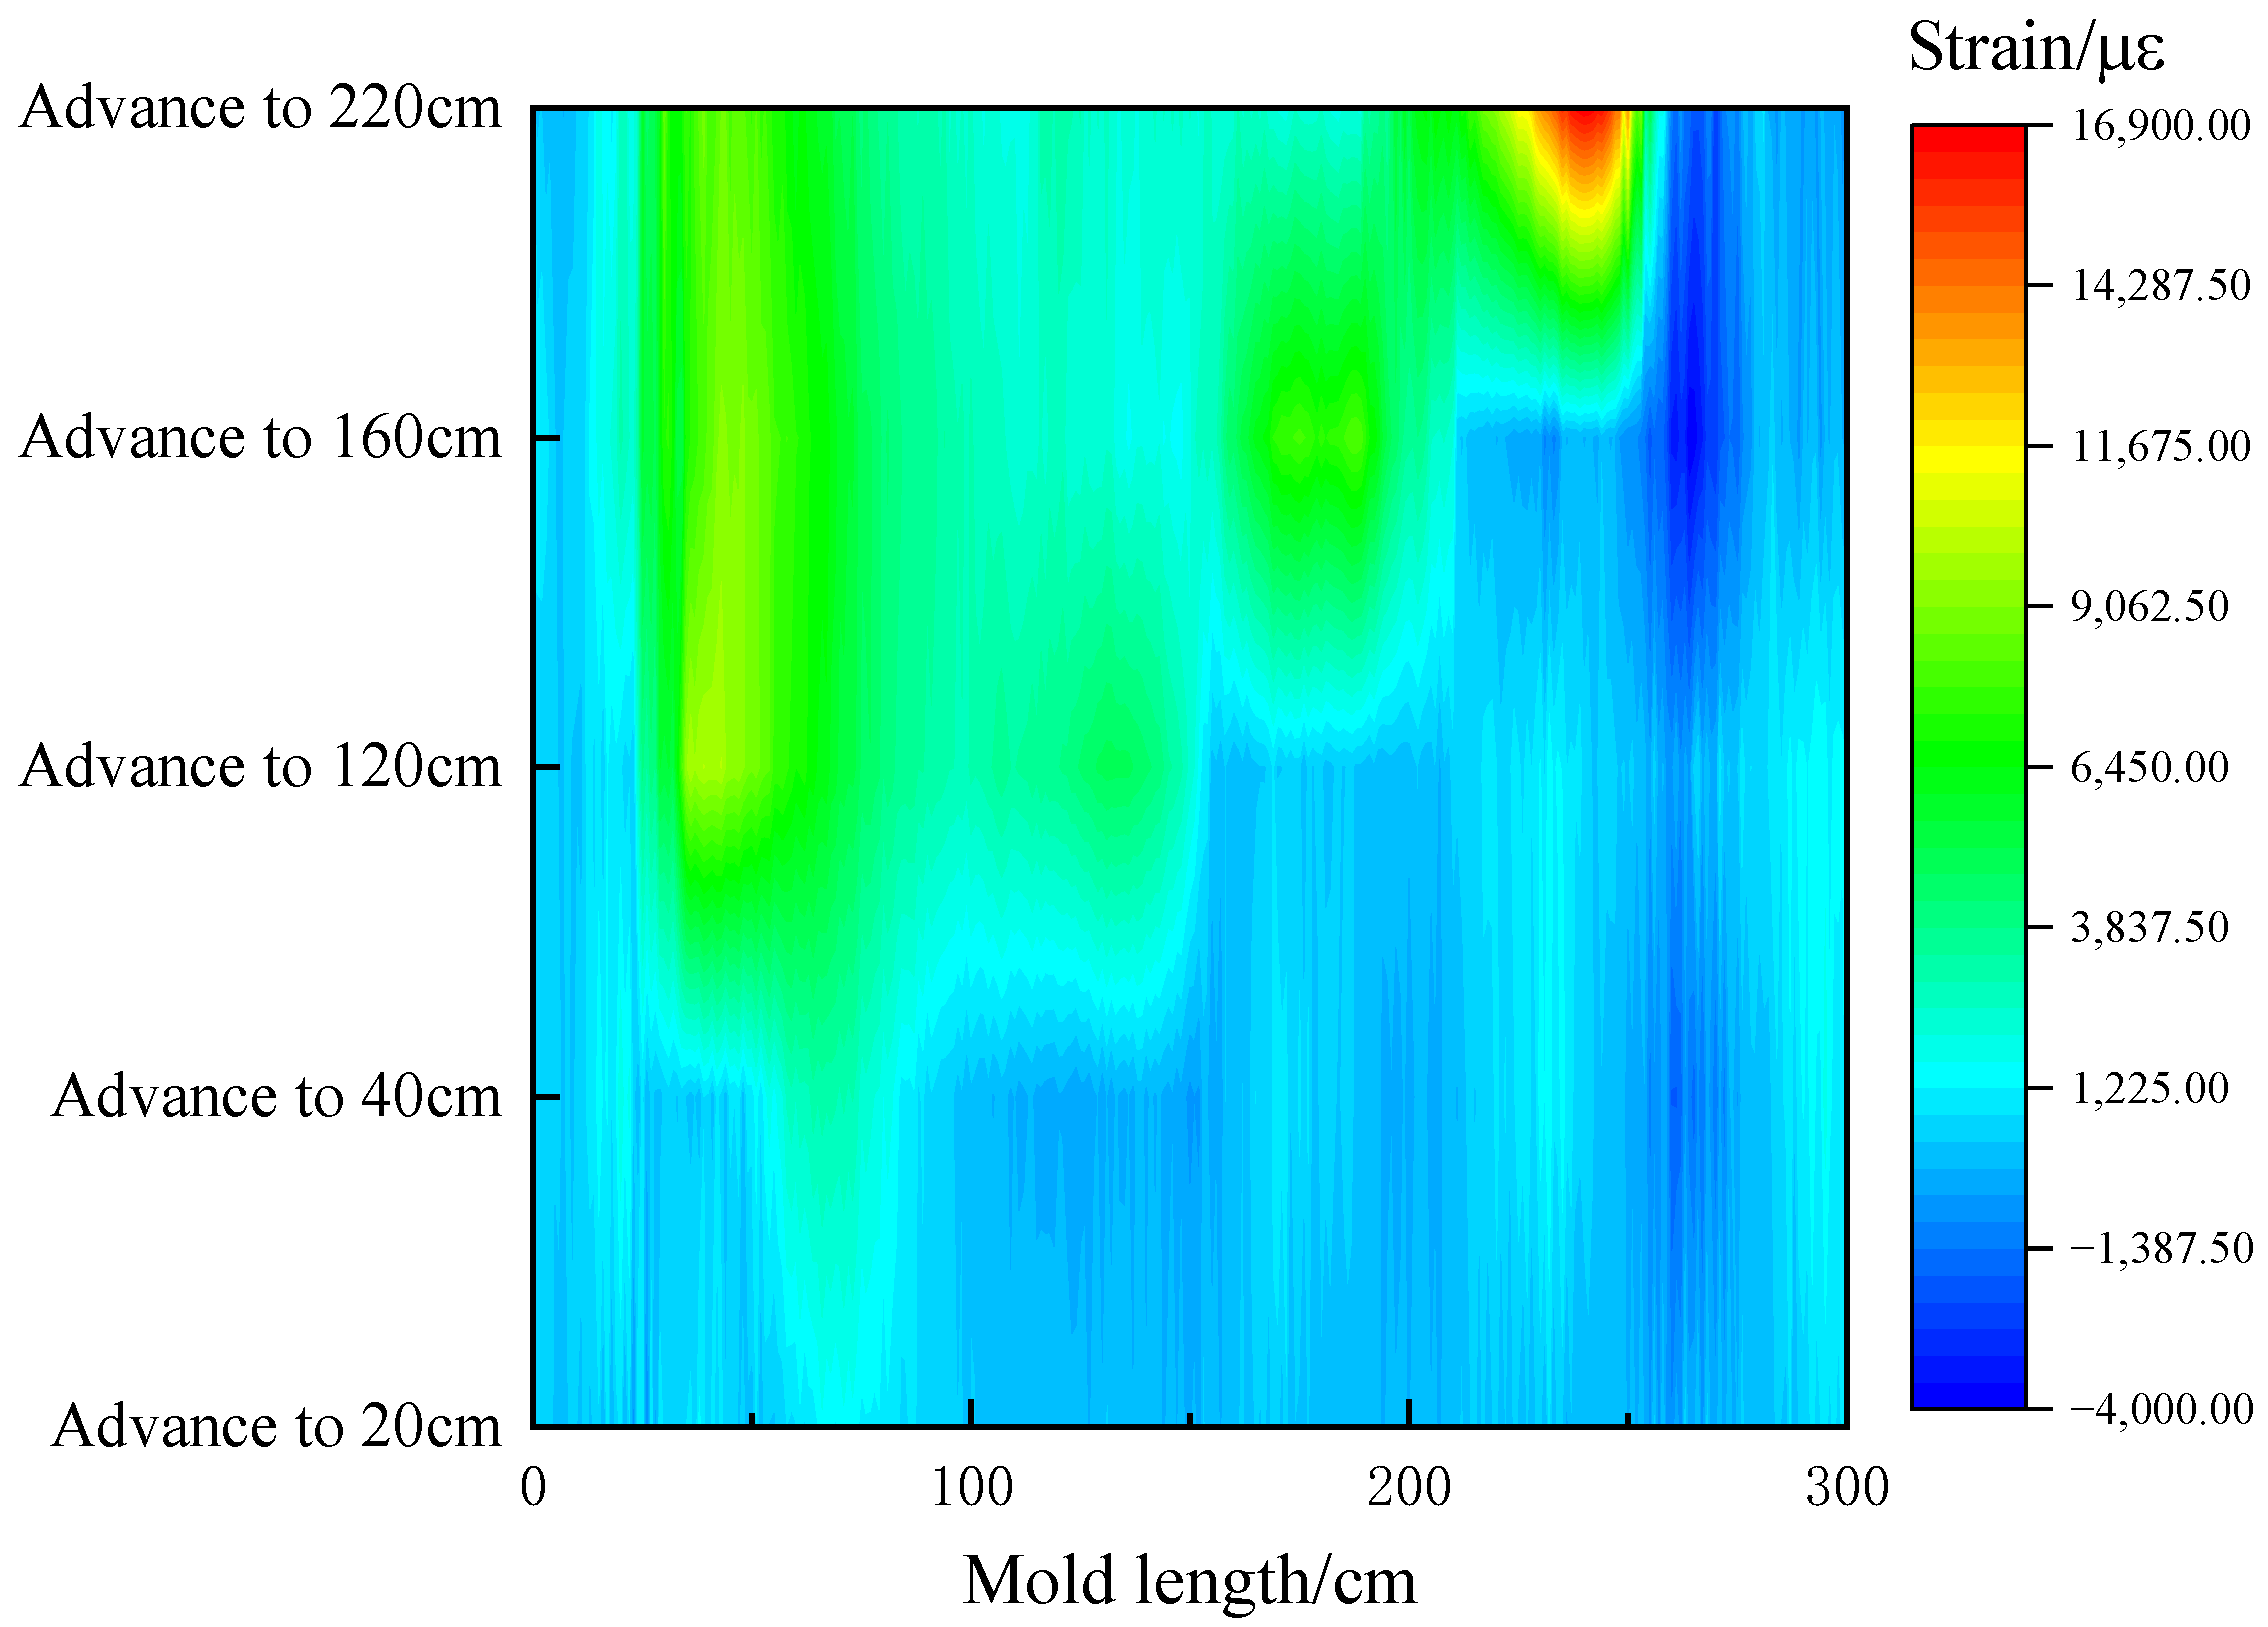
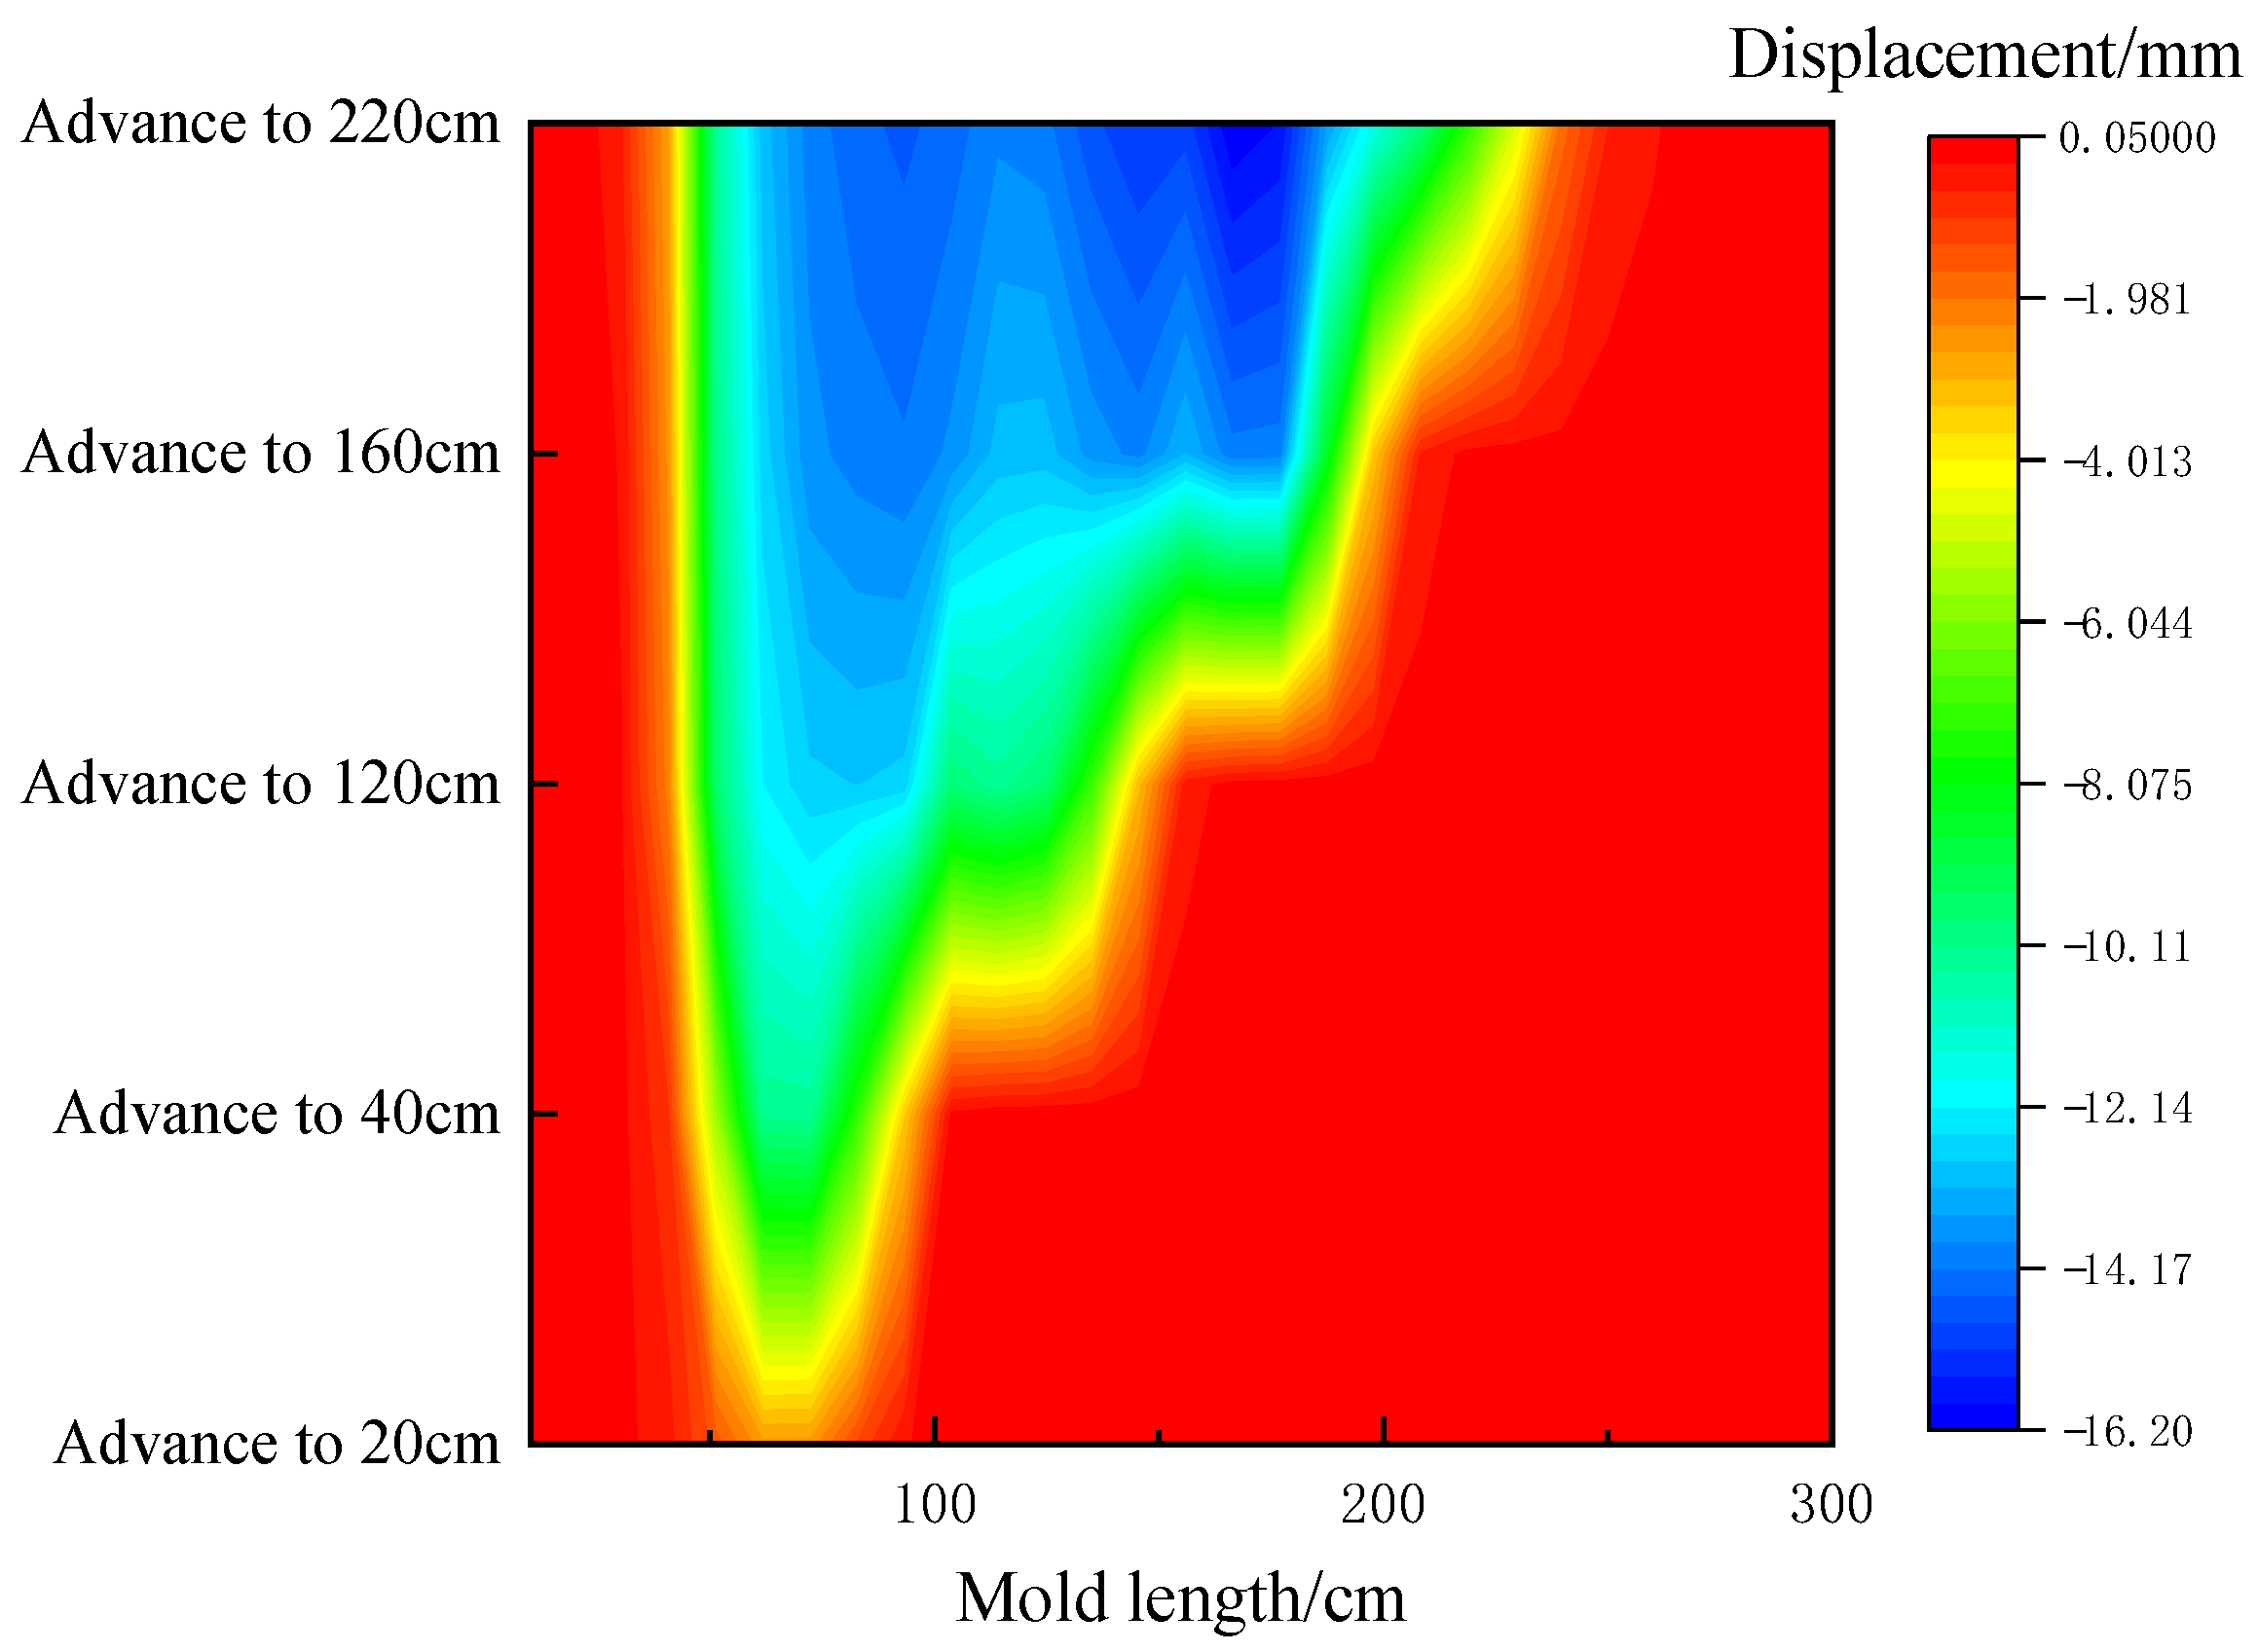
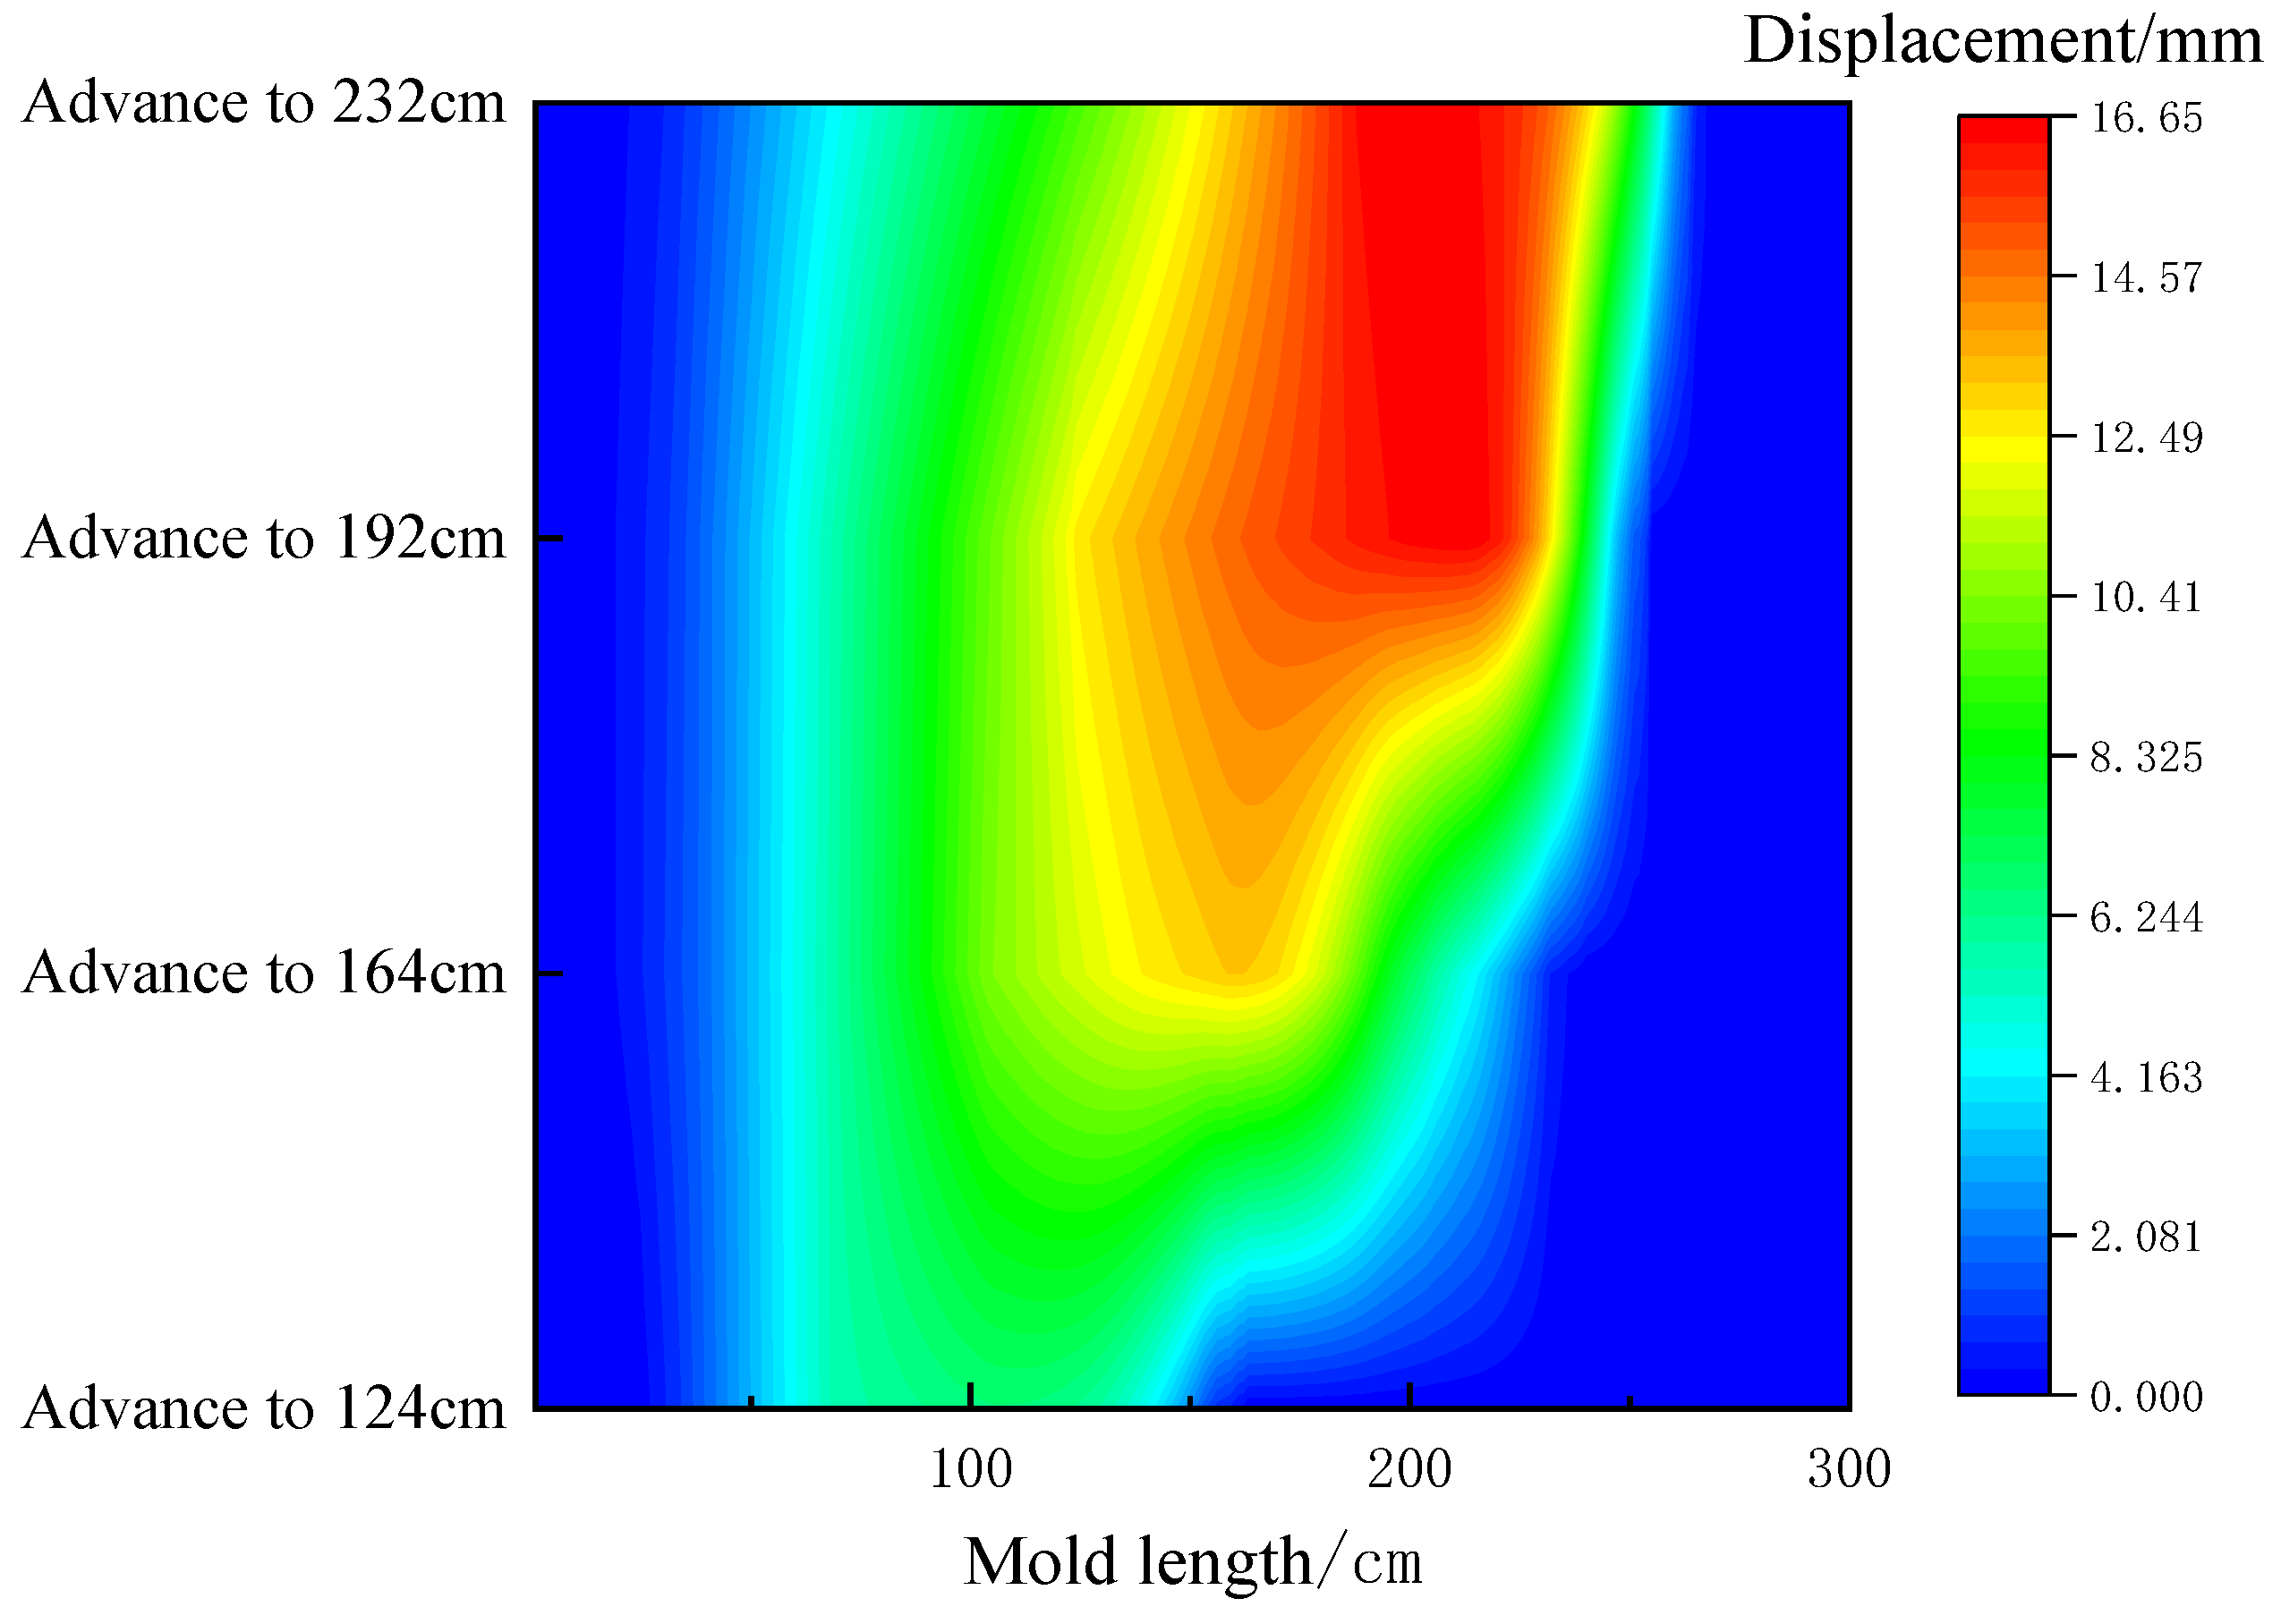
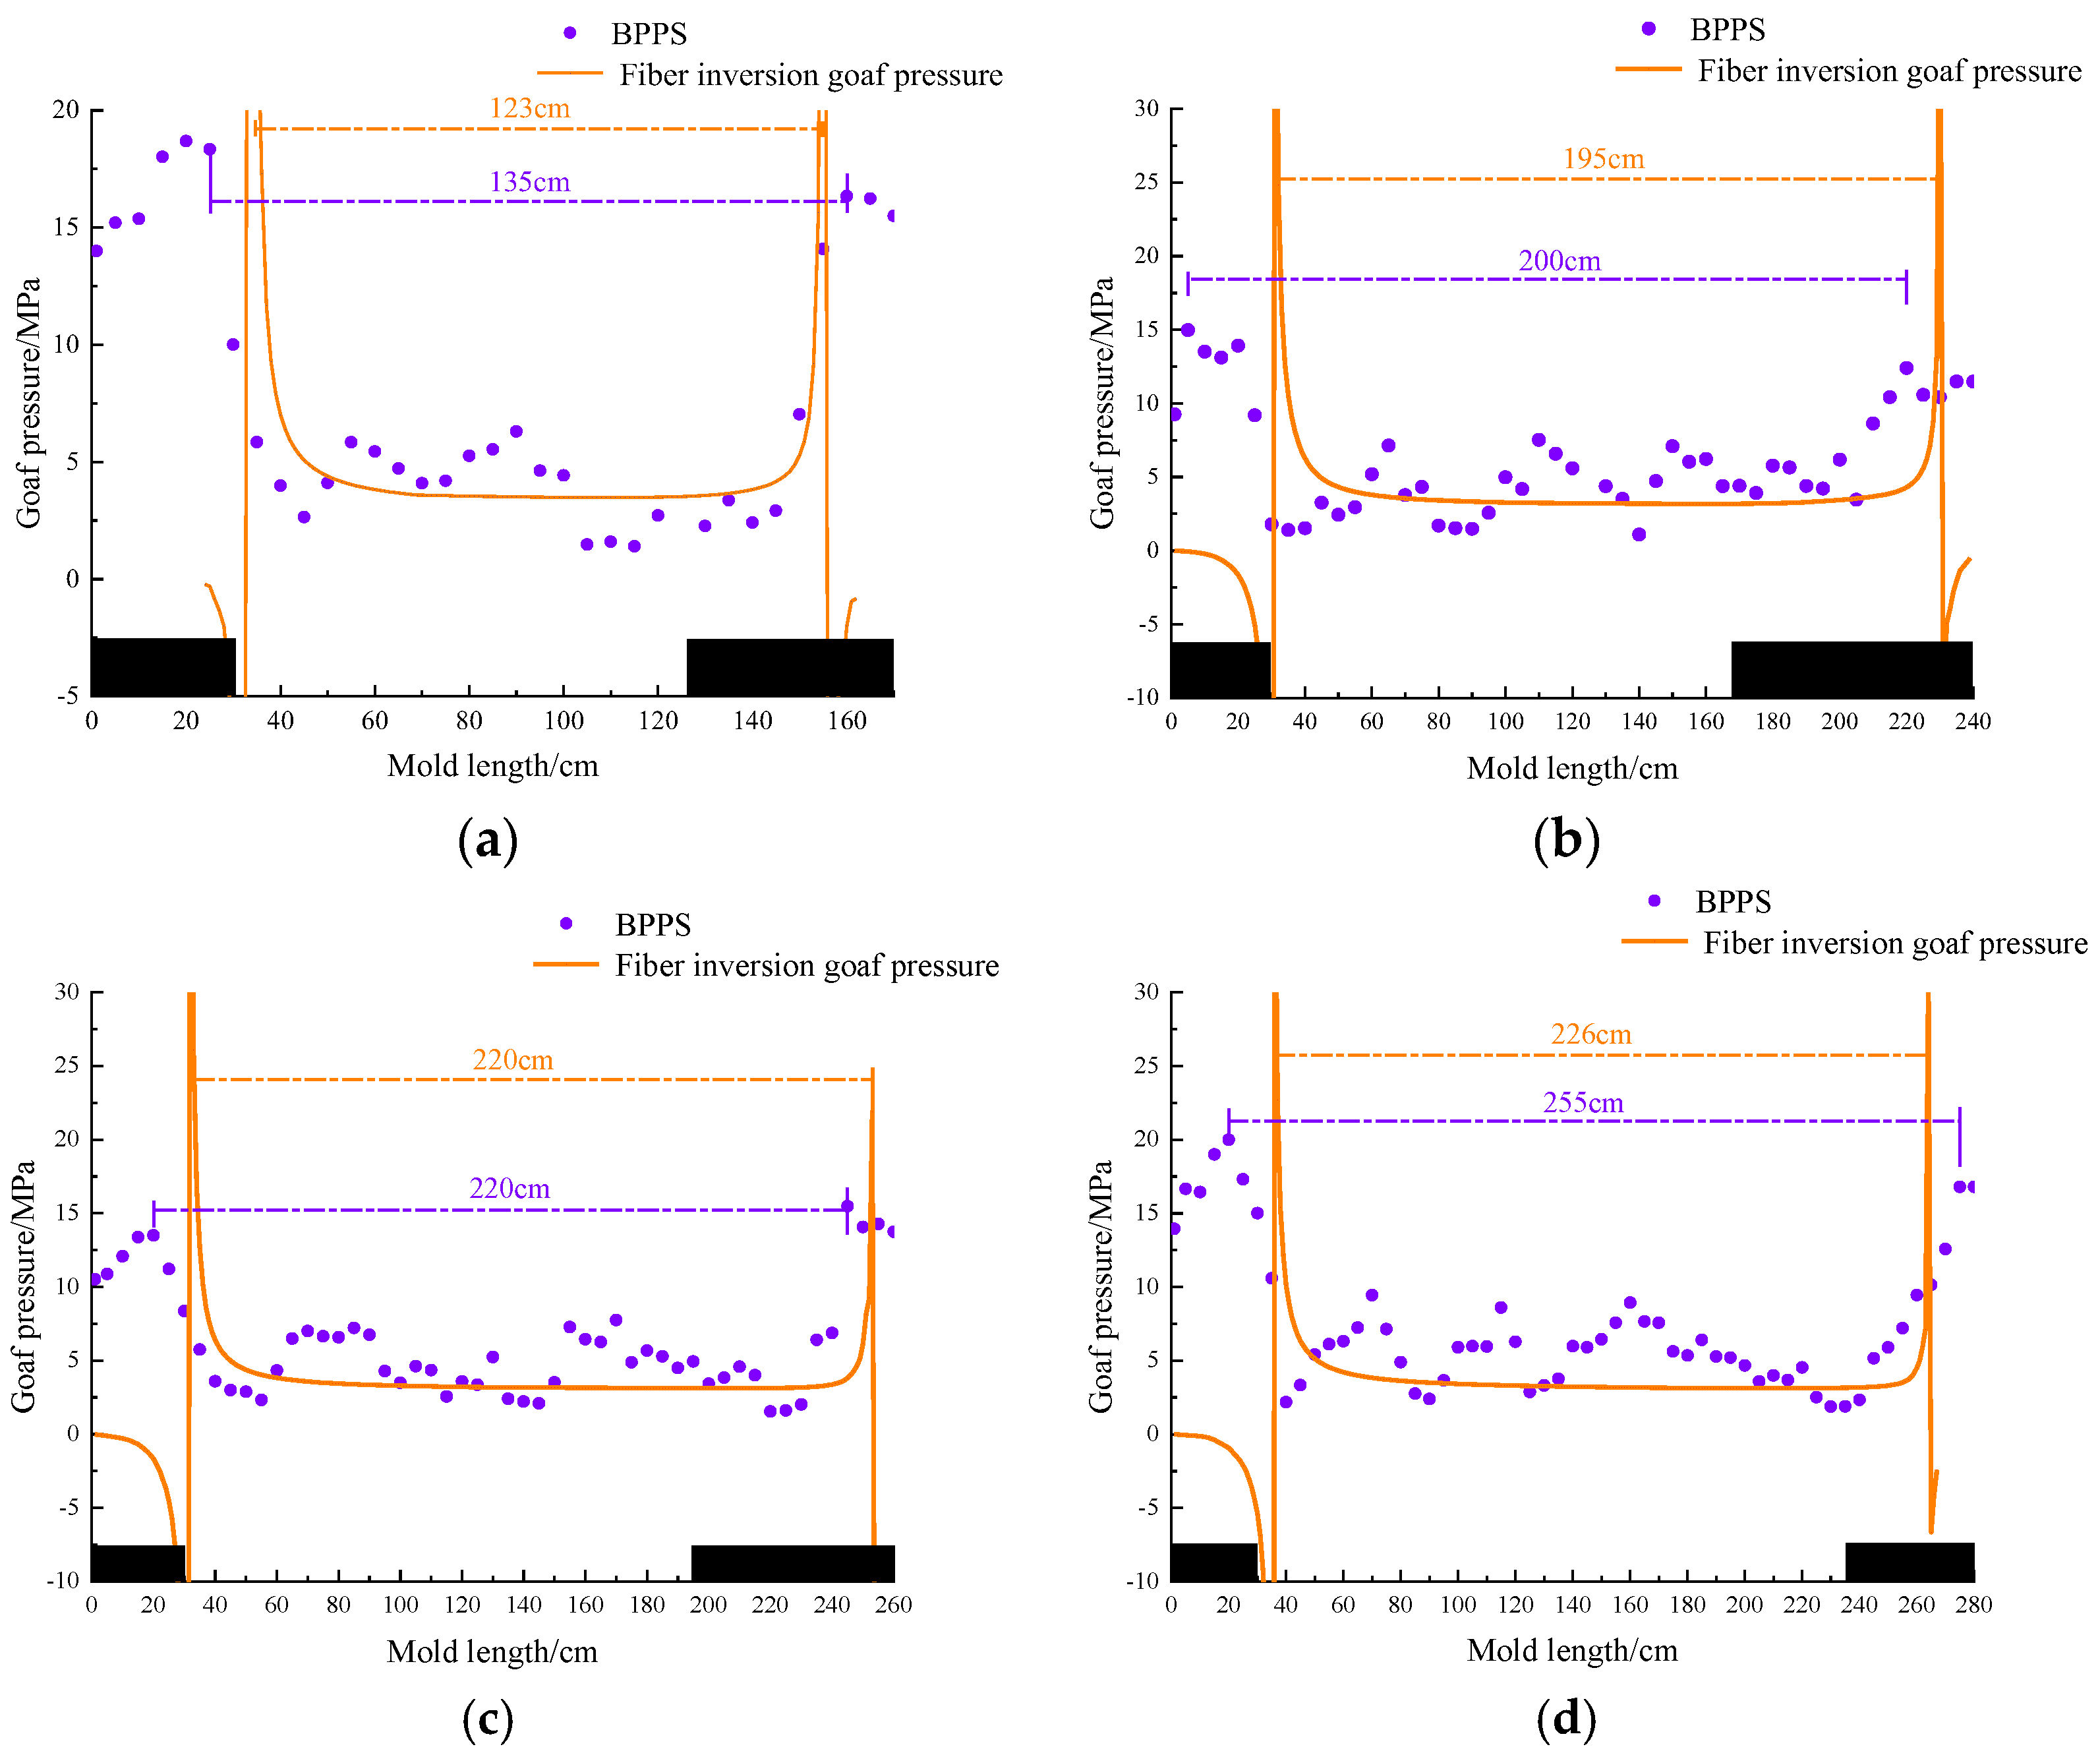
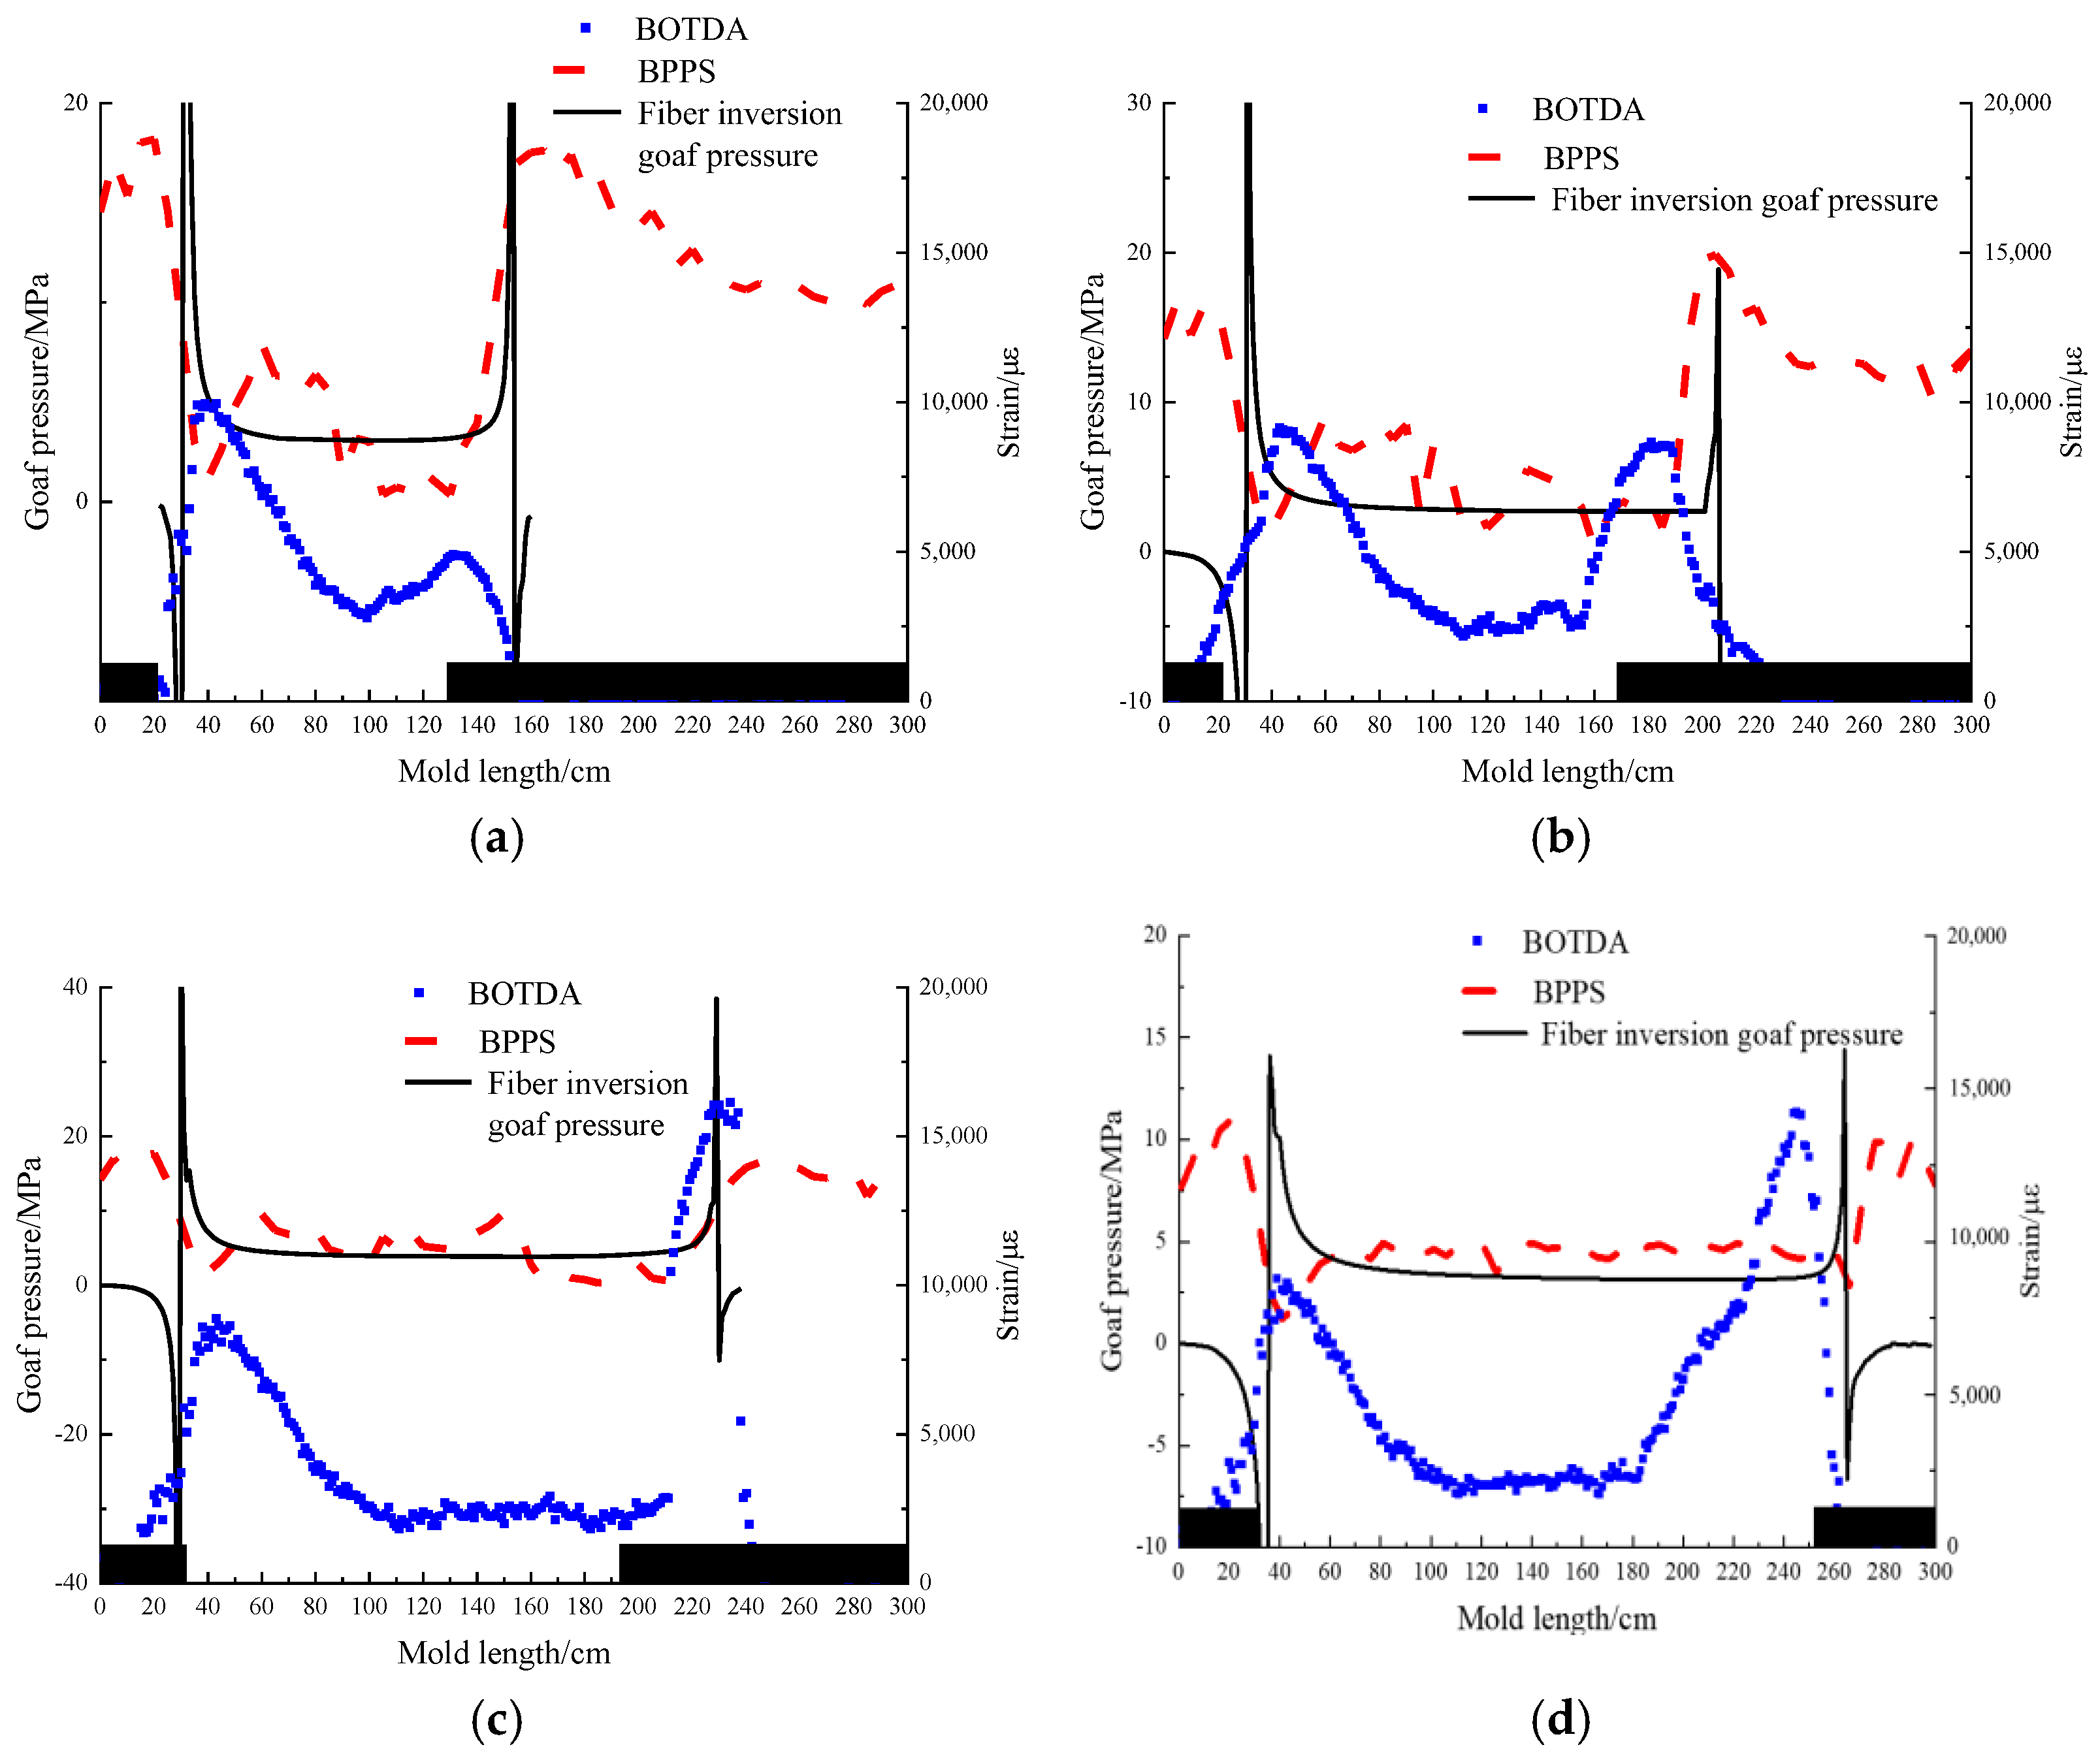
4.2. Spatial Distribution Characteristics of Goaf Pressure

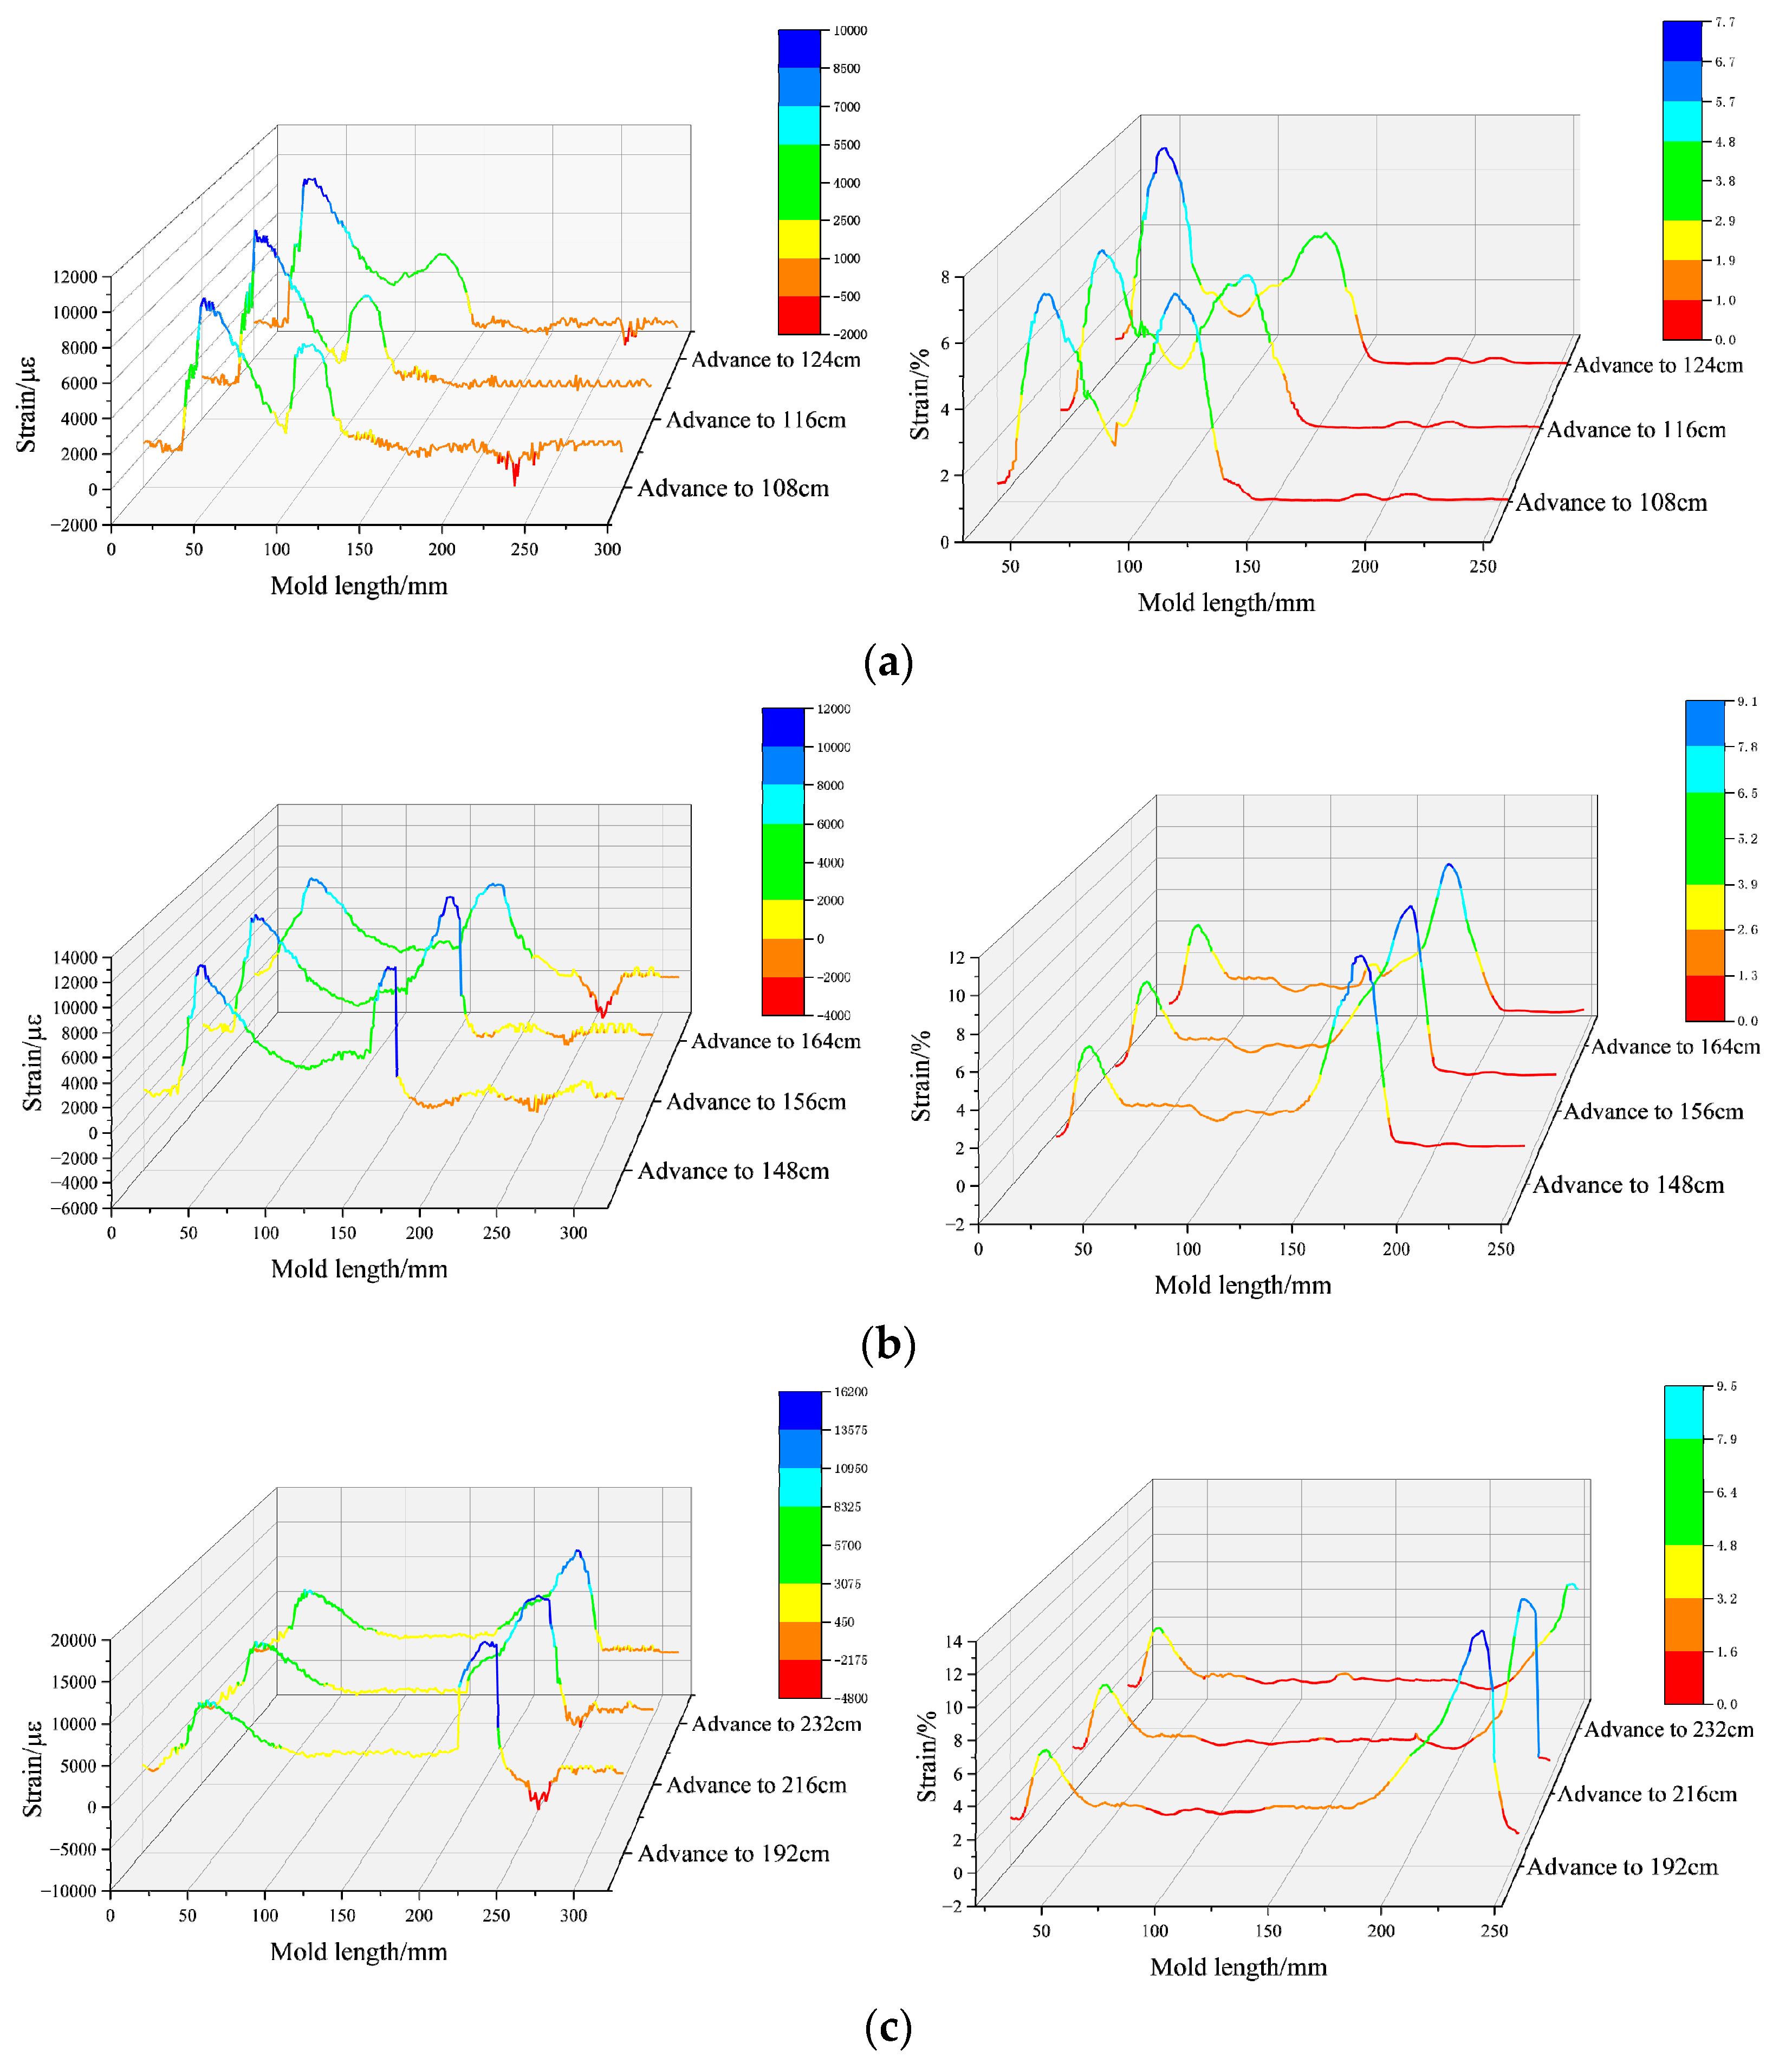
4.2.1. Critical Layer Deformation

Tensile failure mechanisms within the strata sequence initiate fracture propagation in the critical horizon [31]. Upon reaching the ultimate tensile strength at localized points within this horizon, fracture networks develop orthogonally to the principal tensile stress direction. The integrated fiber optic sensors, coupled with the rock mass, facilitate strain monitoring during the deformation process, registering positive strain measurements during tensile loading. This failure process manifests through several key mechanisms: initially, mining-induced disturbances generate bending deformation in the overlying strata, creating tensile stress concentration zones in critical horizons. When local tensile stress exceeds the rock mass strength, micro-fractures begin to nucleate, typically originating at weak interlayer interfaces or near existing structural planes. The primary fractures extend perpendicular to the maximum principal tensile stress direction, while secondary fractures gradually develop into a network structure as mining disturbance continues. The orientation and dip angle of these fractures are jointly controlled by regional geostress fields and mining-induced stress fields. The distributed fiber optic sensing system, intimately coupled with the rock mass, enables the real-time capture of deformation information, which proves invaluable for evaluating fracture propagation rates, predicting critical failure points, and analyzing the extent of mining influence. The mechanical process involves both tensile and shear failure modes, with fracture propagation being influenced by rock mass strength, bedding characteristics, and tectonic stress conditions. The fractured zone above the mined-out area exhibits distinct zonal characteristics.
Under tensile crack propagation, a marked strain gradient manifests at the fracture interface, driving the fiber optic readings toward peak values. However, within fractured and destabilized zones, the sensing elements experience minimal residual tensile stress, resulting in attenuated response curves. Concurrent DIC monitoring validates these observations, confirming the strain measurement accuracy of both monitoring systems within these regions.
As illustrated in Figure 7, the fiber optic strain response exhibits stability within a defined interval as the longwall face progresses from the excavation origin. Prior to face advancement reaching 48 cm, the measured strain values from the distributed sensing array are maintained within the 4000 με threshold. Upon face progression to 104 cm, the strain profile demonstrates a stepped increment pattern, with peak magnitudes attaining 10,000 με, indicating critical horizon rupture. At 168 cm face advance, the strain distribution manifests a characteristic bimodal configuration. The recorded strain magnitudes at the primary and secondary rupture interfaces register 10,487 με and 12,056 με, respectively, corresponding to the bilateral fracture development.
Figure 8 and Figure 9 illustrate the spatiotemporal deformation characteristics of the critical stratum documented through the synchronized fiber optic and total station monitoring systems during extraction operations. The data demonstrate a correlation between internal strain distributions measured via distributed optical sensing and vertical displacement profiles obtained from total station surveys. Adopting the constitutive assumption of a continuous, homogeneous, and isotropic elastic medium, and applying limit equilibrium principles, the yielded rock mass exhibits linear elastic behavior under localized plasticity. Field geological investigation identifies the critical horizon as siltstone lithology. Laboratory testing on analogous specimens determines the ultimate compressive strength and elastic modulus values at 295 KPa and 77 MPa, respectively. These mechanical parameters yield a theoretical ultimate strain threshold of 3830 με.
Based on distributed fiber optic sensing data from the physical modeling experiment, the critical stratum maintains strain magnitudes below 4000 με prior to rupture initiation. Quantitative analysis establishes 4000 με as the transitional strain threshold between continuous and discontinuous deformation regimes. When monitored strain values remain below this threshold, the stratum exhibits continuous elastic behavior; exceedance of this value triggers discontinuous deformation mechanisms, including fracture propagation and structural disintegration. Four distinct measurement sequences were acquired at face advances of 124 cm, 164 cm, 192 cm, and 232 cm during the complete deformation evolution of the critical horizon. The vertical displacement coordinates were derived from the distributed sensing data. As evidenced in Figure 10, the computed results demonstrate a strong correlation with the geodetic monitoring data, maintaining deviation margins within 15%.
This research reveals critical quantitative parameters, including a threshold strain value of 4000 με marking the transition from continuous to discontinuous deformation, peak strains reaching 10,000 με at 104 cm face advancement, and characteristic bimodal strain distributions of 10,487 με and 12,056 με at 168 cm advancement. The critical horizon, identified as siltstone, demonstrates mechanical properties with ultimate compressive strength of 295 KPa and elastic modulus of 77 MPa, yielding a theoretical ultimate strain threshold of 3830 με. This study establishes a reliable deformation prediction model based on continuous, homogeneous, and isotropic elastic medium assumptions, validated through four measurement sequences at different face advancements (124 cm, 164 cm, 192 cm, and 232 cm), maintaining deviation margins within 15% of geodetic monitoring data. These findings provide invaluable practical guidance for mining safety monitoring, influence range assessment, and support system optimization, while the dual monitoring methodology offers a robust framework for similar engineering applications.

4.2.2. Goaf Pressure Inversion Analysis

The deformation data acquired via the distributed optical fiber sensing (DOFS) system correlates well with the strain profiles detected by the digital image correlation (DIC) instrumentation deployed on the key stratum surface. Both monitoring methodologies reveal concurrent dome-shaped patterns, characterized by progressive rightward migration of peak magnitudes during face advancement, as illustrated in Figure 11. The comparative analysis demonstrates exceptional conformity between these two independent measurement techniques.
According to the failure mechanism observed in the analogous model, the geological formations initiate destabilization along the excavation boundary at the model’s left section. With the continuous advancement of the mining front, the formations posterior to the working surface progressively achieve stability; meanwhile, the rock mass on the opposite flank undergoes progressive fracturing and disintegration, accompanied by dynamic variations in the maximum strain magnitude throughout the deformation process.
Based on the mechanical mechanism analysis of strata failure, the phenomenon of peak value movement with working face advancement reflects the dynamic evolution process of the mining-induced stress field. When the working face advances to 108–124 cm, the initial failure of the rock strata begins to occur above the cut-hole position. As the working face continues to advance, the mining-induced stress gradually transmits forward through the rock strata. During this period, the elastic deformation in the unfailed zone continues to accumulate, and the stress concentration effect intensifies, leading to a continuous rise in the peak value on the right side. When the working face advances to 148–164 cm, large-scale fragmentation begins to occur in the rock strata, resulting in stress release and gradual dissipation of deformation energy, causing the peak value on the right side to decrease. Finally, when the working face advances to 192–232 cm, the mining-influenced zone tends to stabilize, the stress field reaches a new equilibrium state, the failure zone morphology becomes basically fixed, and the peak value stabilizes accordingly. From the perspective of the overall strain process, the left-side strain peak value ultimately stabilizes at approximately 45 cm from the model, while the variation process of the right-side peak value at different positions also reflects the degree of fragmentation of the key stratum as the working face advances. The strain peak moves to the right at a speed of 4 cm per step.
This comprehensive study examines the correlation between distributed optical fiber sensing (DOFS) and digital image correlation (DIC) monitoring systems in analyzing critical stratum deformation during mining operations. This research reveals a distinctive saddle-shaped strain pattern that migrates rightward as the working face advances, with both monitoring systems demonstrating remarkable consistency in their measurements. This study identifies key deformation stages tied to specific face advancement distances: initial failure occurs at 108–124 cm, followed by progressive stress transmission and elastic deformation accumulation, leading to peak strain values on the right side. At 148–164 cm advancement, large-scale fragmentation triggers stress release and deformation energy dissipation, resulting in decreased peak values. The system achieves stability at 192–232 cm advancement, with the left-side strain peak stabilizing approximately 45 cm from the model. This dynamic evolution pattern reflects the complex interplay between mining-induced stress fields, rock mass failure mechanisms, and structural stability, providing valuable insights for predicting and managing mining-induced deformation in practical engineering applications. The high correlation between DOFS and DIC measurements validates the reliability of this dual monitoring approach, establishing a robust framework for future mining operation safety assessments and deformation control strategies.
Overburden subsidence in the goaf region induces horizontal tensile fractures within the key strata, resulting in articulated structures that generate tensile stress on the fiber optic sensors. The sensing elements within fractured zones exhibit substantial strain amplification until reaching peak deformation. Strain gradients are detected in the intact fiber segments adjacent to fracture boundaries, indicating variable tensional effects from the articulated formation within specific ranges. The superior key stratum in the unmined coal face demonstrates minimal mining disturbance, facilitating enhanced sensor–formation coupling. Consequently, the strain profile amplitude within the intact rock mass proximate to the cantilever region is notably reduced compared to the measurements from the sensors embedded in the goaf-overlying strata. Beyond the gravitational loading, the sensors in the goaf zone are subjected to additional residual stresses. The temporal lag between face advancement and peak strain manifestation persists in the rightward monitoring section.
As model advancement progresses, compaction occurs in the goaf zone proximate to the excavation boundary. While the left-side peak pressure location in the compacted region maintains stability, the compaction-affected zone expands progressively. The right-side maximum pressure exhibits continuous lateral displacement concurrent with face progression. By incorporating fiber optic settlement measurements into Equation (16), the inverted goaf pressure distribution is derived, as depicted in Figure 12. The comparative analysis at 124 cm advancement reveals relative deviations of 2.5% in the right-side peak pressure position and 8.88% in the compaction zone extent. At 164 cm, these variations measure 6.97% and 2.56%, respectively. Further advancement to 192 cm yields deviations of 5.41% and 0%, while at 232 cm, the discrepancies are 4.36% and 7.45%, respectively. When the working face is advanced to 124 cm, 164 cm, 192 cm, and 232 cm, respectively, the corresponding Root Mean Square Error (RMSE) values for the fiber optic monitoring method are 0.98, 1.20, 1.03, and 1.07, and the corresponding Coefficient of Determination (R2) values are 0.82, 0.72, 0.79, and 0.85. The pressure profile inverted from the optical sensing data demonstrates a substantial correlation with the BPPS measurements, validating the methodology’s efficacy. The pressure evolution within the goaf region is predominantly governed by the primary and cyclic fracturing mechanisms of the key strata. The stress field distribution exhibits a strong correlation with the overburden displacement patterns, demonstrating progressive intensification corresponding to key stratum failure development.
Analysis of pressure monitoring data across four different advancement distances reveals a remarkable consistency in the pressure distribution characteristics of the gob area, as measured by both the BPPS sensor and the optical fiber monitoring system. Both monitoring methods exhibit a typical, approximately “U-shaped” pressure distribution pattern: higher pressure values are observed at the two ends of the gob area (within the 0–40 cm and 140–260 cm regions), while the middle region (40–140 cm) maintains a relatively stable low-pressure state. Although the BPPS data demonstrate some degree of dispersion, their distribution trend aligns closely with the pressure inversion curves obtained from the optical fiber system, particularly in regions where pressure changes are dramatic. While the BPPS data show greater variability, the optical fiber inversion results present a smooth and continuous curve. Overall, the two methods exhibit good consistency in trends. This study represents the first systematic comparison of the performance of these two monitoring methods across different advancement distances. The complementarity of this dual monitoring system not only validates the reliability of each method’s data but also provides a more comprehensive and accurate dataset for studying the evolution of pressure in the gob area, offering significant value for guiding engineering practices.
The considerable discrepancy between fiber optic-inverted goaf pressure and BPPS measurements can be attributed to two primary factors: the challenges in quantifying sensor-formation interfacial coupling efficiency and the inherent geological anisotropy of the ambient strata. These limitations necessitate further comprehensive investigation to enhance measurement accuracy.
The comprehensive experimental results demonstrate a robust validation of the theoretical framework through multiple lines of evidence: the distributed optical fiber sensing system successfully captured the predicted strain evolution patterns, with measurements showing the theoretically anticipated threshold of 4000 με, marking the transition from continuous to discontinuous deformation. The experimental data revealed precise correlations between face advancement distances and deformation characteristics, matching the theoretical predictions of stress field evolution. Furthermore, the dual-monitoring approach, combining DOFS with DIC and BPPS measurements, provided cross-validation of the theoretical model’s predictions, with measurement deviations consistently remaining within 15% across different advancement stages. The observed “U-shaped” pressure distribution pattern in the goaf area aligns perfectly with the theoretical stress transfer mechanisms, while the temporal evolution of strain patterns and pressure distributions corresponds closely to the predicted mechanical behavior of the rock mass. This multi-faceted experimental validation not only confirms the accuracy of the theoretical framework but also establishes its practical applicability for real-world mining operations, thereby bridging the gap between theoretical understanding and engineering implementation.
Through the comprehensive analysis of critical layer deformation and goaf pressure inversion, we have gained valuable insights into the spatial distribution characteristics of goaf pressure and the underlying mechanical behavior of surrounding rock masses. Building upon these experimental findings, the following discussion section will explore the broader implications of our results, examine potential mechanisms driving the observed phenomena, and evaluate their significance for mining engineering practices. This critical examination will not only help validate the existing theoretical frameworks but also identify areas where our current understanding could be enhanced through future research.

5. Discussion

First, the discovered “U-shaped” pressure distribution pattern (with measurement deviations controlled within 8.88%) strongly aligns with the evolution patterns of vertical stress in goaf areas described in earlier studies [32,33], and this consistency across multiple data sources powerfully validates the reliability of fiber optic monitoring results. Notably, this finding is not only supported by independent studies [34,35] using different methodologies, but, more importantly, it achieves continuous, high-resolution pressure distribution monitoring through the innovative application of dual BOTDA and DIC monitoring systems, significantly overcoming the limitations of traditional monitoring methods (such as the borehole stress meters used by Yu Bin et al. [36]) with their limited measurement points. Table 2 summarizes the main differences between DOFS-based monitoring and traditional stress monitoring methods in terms of accuracy, data resolution, and practicality. In terms of theoretical advancement, this research builds upon the abutment pressure distribution theoretical model established by Zhu Sitao et al. [37], achieving real-time validation through fiber optic sensing for the first time, leading to a more comprehensive and profound understanding of goaf pressure distribution. Particularly, compared to BN Whittaker and RN Singh’s [38] static conclusion that peak abutment pressure reaches 4–6 times the original rock stress, the new monitoring system successfully captures the complete stress evolution process. Previous work considered the impact of rock layer deformation and fracture and proposed a multi-scale optical fiber monitoring method. However, this method only obtained the fracture location and range during the rock layer fracture stage. More significantly, by integrating fiber optic sensing with fracture mechanics, this research not only validates Wang’s [39] logarithmic relationship between stress recovery and surface subsidence but also establishes a more direct and precise measurement methodology, effectively addressing the limitations of traditional indirect measurement methods while providing robust experimental support for the theoretical frameworks proposed in earlier studies [40,41], thereby achieving important breakthroughs in both technological innovation and theoretical development.
In order to verify the effectiveness and universality of the proposed fiber-driven goaf stress field inversion method, we further analyzed the BPPS data in Ref. [25]. As shown in Figure 13, the optical fiber strain measurements were recorded at multiple advancing distances of the working face: 124 cm, 164 cm, 192 cm, and 232 cm. These measurements represent the strain data collected after the rock stratum experienced breakage. To determine the goaf pressure, we first calculated the optical fiber displacement under various degrees of deformation using Equations (1) through (10). These displacement values were then input into Equation (16), which establishes an inverse correlation between the key stratum subsidence and goaf pressure, allowing us to derive the goaf pressure through inversion analysis. The results show that the stress distribution data obtained by our inversion are in good agreement with the BPPS measurements. This not only verifies the reliability of our method but also confirms its applicability in other similar conditions. Compared with existing research, the main advantages of this method include establishing a quantitative inversion model from fiber optic monitoring data to goaf pressure; considering the transition process of key stratum from continuous deformation to fracture instability; and employing multiple monitoring techniques such as BOTDA, DIC, and BPPS for cross-validation to enhance the credibility of inversion results.
The physical model experiments in this study represent a significant advancement in validating theoretical frameworks for mining-induced stress distribution. The experimental design carefully incorporates multiple monitoring technologies (BOTDA, DIC, and BPPS) to provide comprehensive validation across different advancement stages, with particular attention to the critical layer deformation characteristics. The model’s ability to capture both continuous and discontinuous deformation regimes, while maintaining measurement accuracy within 8.88% deviation, demonstrates its robust reliability. Furthermore, the observed “U-shaped” pressure distribution pattern and the temporal evolution of strain profiles align remarkably well with theoretical predictions, especially in the transition zones between intact and fractured rock masses. The correlation between sensor data from different monitoring systems provides strong cross-validation of the measurement methodology, while the consistent strain threshold of 4000 με for fracture initiation offers a reliable benchmark for safety monitoring. However, this method still faces several challenges and limitations in practical applications. The primary issue is the difficulty in accurately quantifying the coupling efficiency between optical fibers and rock mass, which directly affects strain transfer effectiveness and inversion accuracy. Secondly, the current model assumes the rock mass to be a homogeneous and isotropic medium, without fully considering the anisotropic characteristics of geological bodies in actual engineering. Furthermore, this method primarily focuses on quasistatic processes and lacks consideration of rapid response characteristics under dynamic mining disturbances. Additionally, the inherent scale effect of physical model tests introduces certain uncertainties when translating experimental results into engineering practice. These issues require in-depth investigation and resolution in future research.
The proposed methodology represents several key advancements when compared to the existing state-of-the-art approaches in mining stress monitoring and analysis. Current leading methodologies typically rely on single monitoring systems such as traditional stress meters or conventional fiber optic sensors, which often provide limited spatial resolution and lack the ability to capture the dynamic evolution of stress fields comprehensively. Our integrated approach, combining distributed optical fiber sensing with DIC and BPPS technologies, offers superior spatial and temporal resolution while maintaining measurement accuracy within 8.88% deviation, significantly improving upon the 15–20% error margins commonly reported in the existing literature. Furthermore, while previous studies have primarily focused on either pre-failure or post-failure behavior, our theoretical framework uniquely addresses both phases through a unified mathematical model. This comprehensive approach enables continuous monitoring across the entire deformation process, from initial elastic deformation through to complete failure. The establishment of a quantitative strain threshold (4000 με) for fracture initiation provides a more precise criterion compared to traditional qualitative assessments. Additionally, our methodology’s ability to capture the characteristic “U-shaped” pressure distribution with high fidelity represents a significant improvement over the existing approaches that often struggle to maintain accuracy in highly disturbed zones. Contemporary monitoring systems frequently face challenges in real-time data interpretation and early warning capabilities. Our dual monitoring approach, validated through extensive physical modeling, addresses these limitations by providing continuous, high-resolution data with clear quantitative thresholds for safety assessment. The integration of optical fiber sensing with advanced data inversion techniques offers unprecedented insights into the dynamic evolution of mining-induced stress fields, establishing a more robust foundation for mining safety assessment and control strategies compared to current industry standards.
However, it is important to acknowledge that our approach shares some common limitations with the existing technologies, particularly in addressing sensor–formation coupling efficiency and geological anisotropy effects. Future research directions could focus on enhancing these aspects while maintaining the demonstrated advantages in measurement accuracy and comprehensive monitoring capabilities. The methodology’s successful validation through physical modeling experiments, while maintaining consistent accuracy across various advancement stages, positions it as a significant advancement in the field of mining safety monitoring and stress analysis.
Based on the above analysis, future research should focus on the following directions: conducting in-depth studies on fiber–rock interface coupling mechanisms to establish more accurate strain transfer models and incorporating rock mass anisotropy characteristics into the inversion model to enhance engineering practicality. Specifically, tensor-based strain analysis will be used to integrate anisotropic rock mass properties, and surface treatment techniques (such as micro-groove processing) will be used to improve the fiber–rock coupling efficiency and optimize strain transfer. In addition, rapid inversion methods will be developed that consider dynamic effects to improve the characterization of engineering dynamic responses, and intelligent algorithms will be introduced, such as machine learning to enhance the adaptability and accuracy of the inversion process. Specifically, machine learning techniques, such as neural networks, will be explored, and the inversion process will be optimized through high-resolution experimental data training, so as to realize the adaptive adjustment of parameters under heterogeneous geological conditions. Finally, more engineering case validations will be conducted to establish comprehensive engineering application guidelines. Through these in-depth studies, the fiber-optic-driven goaf stress field inversion method can be further improved to provide more reliable theoretical and technical support for safe and efficient mining operations.

6. Conclusions

In this paper, the stress inversion method for a goaf driven by optical fiber data is studied using the key stratum theory and optical fiber monitoring principles. A novel inversion formula for goaf stress is derived, enabling precise monitoring of the pressure distribution within the goaf. The method was rigorously verified through comprehensive physical model experiments. Compared with traditional detection methods, distributed fiber sensing technology has the characteristics of real-time monitoring, and the analysis of data can be synchronized through computer programming. It can significantly improve the efficiency and response speed of goaf pressure monitoring. The main conclusions are as follows:
(1)
A pioneering goaf pressure inversion model has been developed, driven by distributed optical fiber monitoring data, which effectively characterizes critical layer subsidence through distinct pre-fracture and post-fracture phases. The sophisticated mathematical framework captures the intricate coupling relationship between optical fiber sensors and rock mass deformation, revealing a definitive correlation between key stratum failure locations and peak stress positions within the goaf area. This fundamental understanding substantially advances our knowledge of the internal mechanisms governing rock mass deformation and stress redistribution patterns during mining operations.
(2)
The innovative implementation of a dual monitoring system, integrating BOTDA and DIC technologies, demonstrates exceptional reliability in predicting overburden rock fracture patterns and quantifying critical deformation thresholds. Through rigorous experimental investigations, we have conclusively established a critical strain threshold of 4000 με for key stratum fracture initiation, with pre-fracture rock mass strain consistently maintaining values below this threshold. This precise quantitative parameter marks a significant advancement in mining safety monitoring, enabling the development of accurate early warning systems and facilitating proactive risk management through continuous, real-time strain measurements.
(3)
Through systematic physical model experiments, we have comprehensively validated the effectiveness of our optical fiber monitoring data inversion methodology in characterizing both spatial distribution and temporal evolution of goaf stress patterns. The experimental results conclusively demonstrate a characteristic “U-shaped” pressure distribution across the goaf area, with measurement deviations consistently maintained within 8.88% across various advancement stages. This thorough validation not only confirms the theoretical framework’s accuracy but also provides crucial insights into the dynamic evolution of mining-induced stress fields. These findings establish a robust foundation for enhanced mining safety assessment and control strategies, offering immediate practical applications in real-world mining operations.

Author Contributions

Conceptualization, J.C. and Z.Y.; methodology D.Z. and Y.O.; data curation, Z.Y. and J.Y.; writing—original draft preparation, G.Y. and C.M.; writing—review and editing, Z.Y. All authors have read and agreed to the published version of the manuscript.

Funding

This work was supported by financial support from the Henan Province Science and Technology Projects (Grants No. 252102211032, 242102220091, 252102210090 and 242102211010), the Key Projects of Water Conservancy Science and Technology in Henan Province (Grant No. GG202441), and the National Level General Project Cultivation Project (Grant No. 23HNCDXJ49, School Level).

Institutional Review Board Statement

Not applicable.

Informed Consent Statement

Not applicable.

Data Availability Statement

The original contributions presented in this study are included in this article; further inquiries can be directed to the corresponding author.

Conflicts of Interest

The research content in this paper is experimental and there are no conflicts of interest.

References

  1. Han, D.; Hu, S.; Zhang, A.; Hao, G.; Hu, L. Study on void age distribution regulation and formation mechanism of crushed rock mass in gob. Coal Sci. Technol. 2020, 48, 113–120. [Google Scholar]
  2. Chen, S.; Li, R. Study on safe and rapid face reduction technology of fully-mechanized top-coal caving face with lower knife handle in contugous fully-mechanized goaf. Coal Sci. Technol. 2022, 50, 1–7. [Google Scholar]
  3. Wang, J.; Zhang, C.; Zheng, D.; Song, W.; Ji, X. Stability analysis of roof in goaf considering time effect. J. Min. Strat. Control Eng. 2020, 2, 47–55. [Google Scholar]
  4. Luo, S.; Tian, C.; Wu, Y.; Xie, P.; Wang, H. Characteristics of loading and failure of overlying rock at working face advancing direction in longwall mining of steeply inclined seam. J. China Coal Soc. 2021, 46, 2227–2236. [Google Scholar]
  5. Chai, J.; Ma, Z.; Du, W.; Gao, J.; Huang, Z.; Zhang, D.; Yang, J. Dynamic evolution law analysis of overburden separation and water flowing fracture under mining based on distributed optical fiber and information entropy theory. Opt. Fiber Technol. 2023, 80, 103408. [Google Scholar] [CrossRef]
  6. Ren, Y.; Yuan, Q.; Chen, J.; Wang, Z.; Zhang, D.; Li, S. Evolution characteristics of mining-induced fractures in overburden strata under close-multi coal seams mining based on optical fiber monitoring. Eng. Geol. 2024, 343, 107802. [Google Scholar] [CrossRef]
  7. Wang, L.; Cao, H.; Jiang, Z.; Wang, T. Influence of Gangue Compaction Process on Coal Pillar Supporting Pressure in Goaf. Saf. Coal Mines 2020, 51, 62–68. [Google Scholar]
  8. Zhang, J.; Wang, B.; Bai, W.; Chen, C.; Zhang, J. Stability study of the double-arch structure formed by short-distance discontinuous mining in shallow strata. J. China Univ. Min. Technol. 2021, 50, 598–605. [Google Scholar]
  9. Qian, M.; Li, H. The law of overlying strata movement and its influence on the pressure of mine. J. Coal Sci. 1982, 2, 1–8. [Google Scholar]
  10. Jiang, L.; Wu, Q.; Li, X.; Ding, N. Numerical simulation on coupling method between mining-induced stress and goaf compression. J. China Coal Soc. 2017, 42, 1951–1959. [Google Scholar]
  11. Sui, W.; Shen, W.; Di, Q. Engineering geological analysis and finite element simulation of stress deformation and failure of over burden in shallow goaf. J. China Coal Soc. 1990, 3, 76–81. [Google Scholar]
  12. Tu, H.; Tu, S.; Yuan, Y.; Wang, F.; Wang, C. Theoretical criterion of concentrated stress influence scope with thick coal seam left-over goaf. J. China Coal Soc. 2013, 38, 1345–1351. [Google Scholar]
  13. Wang, Z.; Liu, H. Consistency between stress in goaf area, movement law of overlying strata and stress effect of roof and floor rock. Coal Min. Technol. 1993, 8, 38–44. [Google Scholar]
  14. Xie, J.; Qu, Q.; Zhu, W.; Wang, X.; Xu, J.; Ning, S.; Hou, T.; Luo, X. Distributed strain monitoring of overburden delamination propagation at a deep longwall mine. Int. J. Rock Mech. Min. Sci. 2023, 171, 105589. [Google Scholar] [CrossRef]
  15. Hao, H.; Chai, J.; Ouyang, Y.; Zhang, D.; Gao, J.; Wang, J.; Huang, Z. Accurate monitoring of coal pillar deformation based on distributed optical fiber. Opt. Fiber Technol. 2024, 84, 103748. [Google Scholar] [CrossRef]
  16. Jing, C.; Zhicheng, H.; Wulin, L.; Dingding, Z.; Jianfeng, Y.; Chenyang, M.; Gang, H.; Mingyue, W. The application of distributed fiber-optic sensing technology in monitoring the loose zone in the floor of stoping roadway. Rock Mech. Rock Eng. 2024, 58, 723–744. [Google Scholar] [CrossRef]
  17. Xie, X.; Fang, X.; Liu, H.; Xing, X.; Liang, M.; Wu, G.; Chen, N. Development and application of a borehole stress meter in rocks surrounding the roadway, based on optical-fiber sensing technology. Front. Earth Sci. 2023, 10, 1122579. [Google Scholar] [CrossRef]
  18. Yang, J.; Ren, Y.; Chai, J.; Zhang, D.; Liu, Y. Adit deformation prediction based on ICEEMDAN dispersion entropy and LSTM-BP. Opt. Fiber Technol. 2023, 79, 103364. [Google Scholar] [CrossRef]
  19. Vu, T.T.; Do, S.A. Determination of the rock mass displacement zone by numerical modeling method when exploiting the longwallat the Nui Beo Coal Mine, Vietnam. Min. Miner. Depos. 2023, 17, 59–66. [Google Scholar] [CrossRef]
  20. Nowak, S.; Sherizadeh, T.; Esmaeelpour, M.; Brooks, P.; Guner, D.; Karadeniz, K.; Wurst, G.; Kirmaci, A. Geomechanical Monitoring of an Underground Bulk Mining Operation Using a Novel Distributed Optical Fiber Strain Sensing Method. Min. Metall. Explor. 2024, 41, 1553–1565. [Google Scholar] [CrossRef]
  21. Yumba, J.; Ferentinou, M.; Grobler, M. Experimental Study of Sinkhole Propagation Induced by a Leaking Pipe Using Fibre Bragg Grating Sensors. Sens. Sens. 2024, 24, 6215. [Google Scholar] [CrossRef]
  22. Doonechaly, N.G.; Reinicke, A.; Hertrich, M.; Plenkers, K.; Obermann, A.; Fischli, F.; Maurer, H.; Wiemer, S.; Giardini, D. Multiphysics monitoring of cementation operation: Implications for wellbore integrity and hydrogeological characterization. Environ. Earth Sci. 2024, 83, 146. [Google Scholar] [CrossRef]
  23. Anjana, K.; Herath, M.; Epaarachchi, J. Optical fibre sensors for geohazard monitoring—A review. Measurement 2024, 235, 114846. [Google Scholar] [CrossRef]
  24. Gao, S.; Du, W.; Liu, Y.; Chai, J.; Gao, D.; Ma, C.; Chen, J. Reasonable top coal thickness for large cross-section open-off cut in lower-layer mining. Front. Earth Sci. 2023, 11, 1301595. [Google Scholar] [CrossRef]
  25. Chai, J.; Ouyang, Y.; Liu, J.; Zhang, D.; Du, W.; Lei, W. Experimental study on a new method to forecasting goaf pressure based key strata deformation detected using optic fiber sensors. Opt. Fiber Technol. 2021, 67, 102706. [Google Scholar] [CrossRef]
  26. Wen, L.; Xue, L.; Hao, R.W. Evolution analysis of research on disaster-causing mechanism and prevention technology of mine goaf disaster. Environ. Sci. Pollut. Res. 2023, 30, 93388–93406. [Google Scholar]
  27. Ratnayake, R.; Ghassemi, A. Modeling of Fiber Optic Strain Responses to Shear Deformation of Fractures. Energies 2024, 17, 2142. [Google Scholar] [CrossRef]
  28. Zuo, Q.; Wang, Y.; Li, J. Study on the oxidation and heating characteristics of residual coal in goafs under different air-leakage conditions. Therm. Sci. 2021, 25, 3293–3302. [Google Scholar] [CrossRef]
  29. Cheng, G.; Wang, Z.; Shi, B.; Zhu, W.; Li, T. Research on a Space–Time Continuous Sensing System for Overburden Deformation and Failure during Coal Mining. Sensors 2023, 23, 5947. [Google Scholar] [CrossRef]
  30. Li, J.; He, Z.; Piao, C.; Chi, W.; Lu, Y. Research on Subsidence Prediction Method of Water-Conducting Fracture Zone of Overlying Strata in Coal Mine Based on Grey Theory Model. Water 2023, 15, 4177. [Google Scholar] [CrossRef]
  31. Ma, L.; Liu, C.; Zhao, G. Study on Coal Pillar Setting and Stability in Downward Mining Section of Close Distance Coal Seam. Energies 2024, 17, 5441. [Google Scholar] [CrossRef]
  32. Zou, J.; Chen, W.; Yuan, J.; Yang, D.; Yang, J. 3-D numerical simulation of hydraulic fracturing in a CBM reservoir. J. Nat. Gas Sci. Eng. 2017, 37, 386–396. [Google Scholar] [CrossRef]
  33. Wang, S.; Huang, Q.; Fan, L.; Yang, Z.; Shen, T. Study on overburden aquclude and water protection mining regionazation in the ecological fragile mining area. J. China Coal Soc. 2010, 1, 7–14. [Google Scholar]
  34. Yu, Y. Deformation Characteristics and Permeability Evolution Laws of Strata on Stope Boundary. Ph.D. Thesis, China University of Mining & Technology, Xuzhou, China, 2020. [Google Scholar]
  35. Gao, Z. Research on the Law of Overlying Rock Failure in the Goaf of Coal Mine. Ph.D. Thesis, Chang’an University, Xi’an, China, 2021. [Google Scholar]
  36. Yu, B.; Zhang, Z.; Kuang, T.; Liu, J. Stress Changes and Deformation Monitoring of Longwall Coal Pillars Located in Weak Ground. Rock Mech. Rock Eng. 2016, 49, 3293–3305. [Google Scholar] [CrossRef]
  37. Zhu, S.; Feng, Y.; Jiang, F. Determination of Abutment Pressure in Coal Mines with Extremely Thick Alluvium Stratum: A Typical Kind of Rockburst Mines in China. Rock Mech. Rock Eng. 2015, 49, 1943–1952. [Google Scholar] [CrossRef]
  38. Qi, T.Y.; Zhang, F.; Pei, X.M.; Feng, G.R.; Wei, H.R. Simulation research and application on response characteristics of detectingwater-filled goaf by transient electromagnetic method. Int. J. Coal Sci. Technol. 2022, 9, 167–192. [Google Scholar] [CrossRef]
  39. Wang, W.; Wang, S.; Liu, H.; Jiang, T. The space and time characteristics of the cover stress restablishment of the fractured rock mass in the goaf after coal mining. J. Min. Saf. Eng. 2017, 34, 127–133. [Google Scholar]
  40. Kang, H.; Lou, J.; Gao, F.; Yang, J.; Li, J. A physical and numerical investigation of sudden massive roof collapse during longwall coal retreat mining. Int. J. Coal Geol. 2018, 188, 25–36. [Google Scholar] [CrossRef]
  41. Chai, J.; Ouyang, Y.; Liu, J.; Zhang, D.; Du, W. Experimental evaluation of precise monitoring of multi-scale deformation failure of rock mass based on distributed optical fiber. Measurement 2022, 199, 111381. [Google Scholar] [CrossRef]
Figure 1. Fiber characterization model before critical layer breakage.
Applsci 15 04393 g001
Figure 2. Fiber characterization model after critical layer breakage.
Applsci 15 04393 g002
Figure 3. Critical layer subsidence pattern.
Applsci 15 04393 g003
Figure 4. Monitoring system of the model.
Applsci 15 04393 g004
Figure 5. Distributed fiber accuracy testing.
Applsci 15 04393 g005
Figure 6. The distribution of “three zones” of overburden rock.
Applsci 15 04393 g006
Figure 7. BOTDA strain diagram.
Applsci 15 04393 g007
Figure 8. Strain contour diagram of the critical layer monitored by fiber optics.
Applsci 15 04393 g008
Figure 9. Subsidence cloud map of the critical layer monitored by the total station.
Applsci 15 04393 g009
Figure 10. Subsidence cloud map of the critical layer monitored by fiber optics.
Applsci 15 04393 g010
Figure 11. Fiber and DIC strain curves. (a) Advance to 108~124 cm, (b) Advance to 148~164 cm, (c) Advance to 192~232 cm.
Applsci 15 04393 g011
Figure 12. Comparison between the goaf pressure inverted by optical fiber data and the goaf pressure detected by BPPS. (a) Advance to 124 cm, (b) Advance to 164 cm, (c) Advance to 192 cm, (d) Advance to 232 cm.
Applsci 15 04393 g012
Figure 13. Extended comparison. (a) Advance to 124 cm, (b) Advance to 164 cm, (c) Advance to 192 cm, (d) Advance to 232 cm.
Applsci 15 04393 g013
Table 1. Similar materials used in the simulation test of the physical and mechanical properties and proportions of various layers.
Layer NumberLithologyModel Thickness/cmMix NumberSand/kgGypsum/kgCaCO3/kgRemarks
1Loess3.331019238.252.3821.44Topsoil
2mudstone1091982.890.928.29
3Siltstone14.66837119.534.4810.46
4Medium sand20837159.475.9813.95
5Siltstone5.3393737.631.252.93
6Medium sand6.6682855.241.385.52
7Fine sandstone4.6683736.331.363.18
8Siltstone482821.080.532.11
9Fine sandstone9.3382861.011.536.1Key stratum
10Fine sandstone8.6693712.130.271.08Immediate roof
11Coal seam2 12.480.473.12coal seam
12Siltstone493719.880.661.55
13Fine sandstone5.3383748.261.814.22
Table 2. Main differences between DOFS monitoring and traditional stress monitoring methods.
ParameterDOFS MonitoringTraditional Stress Monitoring Methods
AccuracyHigh accuracy due to the use of advanced signal processing techniques and multi-parameter sensing capabilitiesGenerally lower accuracy compared to DOFS, limited by the point measurement nature and susceptibility to environmental factors
Data ResolutionHigh spatial resolution (can be as fine as 1 meter or less) along the entire length of the fiberLower spatial resolution and typically limited to point measurements at specific locations
PracticalitySuitable for long-distance and large-scale monitoring, immune to electromagnetic interference, and can operate in harsh environmentsLimited to shorter distances and smaller scales, susceptible to electromagnetic interference, and may require more maintenance
Disclaimer/Publisher’s Note: The statements, opinions and data contained in all publications are solely those of the individual author(s) and contributor(s) and not of MDPI and/or the editor(s). MDPI and/or the editor(s) disclaim responsibility for any injury to people or property resulting from any ideas, methods, instructions or products referred to in the content.

