Article

Seismic Response Analysis of Buried Nuclear Power Plant Structures in Non-Bedrock Sites

The Key Laboratory of Urban Security and Disaster Engineering, Ministry of Education, Beijing University of Technology, Beijing 100124, China
*
Author to whom correspondence should be addressed.
Appl. Sci. 2025, 15(8), 4378; https://doi.org/10.3390/app15084378
Submission received: 17 February 2025 / Revised: 28 March 2025 / Accepted: 8 April 2025 / Published: 16 April 2025

Abstract

:
In this paper, a refined 3D direct finite element model including nuclear power plant structures and soil is developed. The wave input method, including free-field loads and a viscous spring artificial boundary, is used. The effects of structural burial depths on the seismic response of power plant structures are studied. Research shows that the seismic response of this new nuclear power structure is influenced by structural burial depths. The seismic response of the acceleration response and relative floor displacement decreases significantly with increasing structural burial depths. The floor spectrum in the low-frequency region is less influenced by different burial depths. The region of the frequency band corresponding to the peak floor spectrum is significantly influenced by different burial depths. The frequencies corresponding to the peak of the floor spectrum shift towards the lower-frequency bands. The higher-frequency bands of the floor spectrum are less influenced by different burial depths.

1. Introduction

As of December 2024, according to the World Nuclear Association [1], the global nuclear power grid-connected capacity reached 396 GW, there were 439 grid-connected nuclear island structures, the capacity under construction was 71.8 GW, and there were 66 nuclear island structures under construction. The scale of nuclear power occupies an important position in the global energy structure. From the perspective of distribution area, Asia, Europe, and North America are regions with relatively concentrated nuclear power installed capacity. It is observed that more than 90% of the world’s nuclear facilities are located on coastal bedrock sites. The geological conditions in these areas are stable, providing a solid foundation for the safe operation of nuclear island structures. A series of statistical data strongly demonstrates that China’s nuclear power industry is experiencing a trend of rapid growth. So far, China’s nuclear power installed capacity has continued to rise, and its proportion in the energy structure has increased day by day. However, it cannot be ignored that most of the current domestic nuclear island structures are located in coastal areas. However, the available resources of coastal bedrock sites are gradually decreasing.
With the increasing scarcity of available space in coastal regions, future nuclear power construction sites in China are expected to move towards inland non-bedrock locations. Due to the significant water resource demands for nuclear power facility operations, inland nuclear island structures are frequently situated near rivers and lakes, which generally exhibit non-bedrock geological characteristics. Numerous studies [2,3,4,5,6,7,8,9] indicate that in the seismic design of nuclear power structures, the acceleration and floor response spectra of the structures are critical points of focus. Therefore, investigating the seismic response patterns of acceleration and floor spectra for new types of nuclear power structures, along with methods for reducing seismic response, has become one of the key research priorities in the field of nuclear power structures.
Numerous standards and design documents [10,11,12] indicate that fixed foundation analysis is applicable when the shear wave velocity reaches 2400 m/s, eliminating the need to consider soil–structure interaction (SSI) effects. However, the situation is quite different in non-bedrock sites. Given the complexity of such sites, SSI effects may significantly influence the safety of nuclear power plant structures. Thus, to ensure the safety and stability of these structures in non-bedrock sites, SSI effects must be thoroughly considered during the engineering design and construction process. Targeted strategies should be formulated in all aspects, including in geological surveys, structural design, and construction, to effectively respond to the challenges brought by non-bedrock sites and ensure the safe operation of nuclear island structures. However, with the growth of global energy demand and the decreasing number of available coastal site resources, the construction sites of nuclear island structures in the future are expected to shift more to inland non-bedrock areas. The site conditions in these inland areas are more complex than those in coastal bedrock sites. There are many uncertainties in foundation stability and soil characteristics, and the engineering challenges brought about by this are particularly prominent.
It has been established that when the average shear wave speed of a structure’s foundation exceeds 2400 m/s, or when the stiffness of the foundation is more than twice that of the superstructure [10], the interaction between the foundation and structure can be disregarded. In all other cases, the soil–structure interaction (SSI) must be considered. This interaction is particularly critical in the seismic analysis of nuclear safety structures built on non-bedrock foundations. Recently, substantial progress has been made in theoretical research [13,14,15,16] on nuclear structure control. Li and others [13,14] focused on the new CAP1400 nuclear island structure for nuclear engineering, establishing an integrated finite element model for the shielding and auxiliary building structures. They conducted vibration table experiments for nuclear plant structures on non-bedrock sites, examining the seismic response of nuclear island structures on geotechnical sites with varying shear wave velocities. Their findings indicate that site conditions and soil–structure interaction analysis should be considered when assessing the seismic response of nuclear plant structures. Borbón D F et al. [15] addressed the influence of soil stiffness, structure–soil–structure interaction (SSSI), and backfill soil stiffness. When comparing seismic responses between flexible and rigid soils, a significant reduction in the maximum absolute acceleration values was obtained for flexible soils. Additionally, under rigid soil conditions, the maximum horizontal acceleration was significantly amplified with height. Li et al. [16] investigated the dynamic response of nuclear structures under SSSI (soil–structure–site interaction), developing a numerical model of double nuclear structures under SSSI. Their comparative study on the dynamic responses of nuclear structures under SSI and SSSI revealed that the presence of a single nuclear plant has a limited optimizing effect on the seismic response of an adjacent nuclear plant, such as reducing displacement responses. Additionally, the effects of SSSI are influenced not only by soil properties but also by the direction of seismic motion. Currently, research on the seismic performance of nuclear structures with periodic foundations in non-bedrock sites is incomplete. Through extensive numerical simulations and actual case analyses, this method can be used to more accurately assess the uncertainty of nuclear power plant structure responses under earthquakes, offer new insights for reliability analysis in seismic design, and effectively address the limitations of traditional deterministic analysis methods.
In addition, previous studies mostly focused on traditional large-scale nuclear island structures with surface exposure. Today, through the design of soil-embedded reactor buildings, embedded nuclear island structures have performed well in enhancing their resistance to extreme external events (such as aircraft impacts, tornadoes, etc.) and have become a key research direction for the next generation of nuclear safety systems. The seismic response mechanism of embedded nuclear facilities is very different from that of traditional ground structures. Due to their underground structural characteristics, their structural behavior is more influenced by the deformation of the surrounding soil, resembling typical underground structures. Research has shown that site conditions significantly affect the seismic response of underground structures. However, current studies mainly focus on areas such as subway stations and tunnels. For new compact embedded nuclear island structures, current research mainly focuses on the influence of site shear wave velocity (Vs) on structural response modes, while there are few studies on the influence of the embedded depth of a structure on seismic performance. Numerous studies on pile–nuclear island structures and pile–raft–nuclear island structures on soft soil sites [17,18,19,20,21,22,23] also positively contribute to understanding the nuclear power response mode of soft soil sites. But these studies focus on traditional large-scale surface nuclear island structures. The new buried nuclear power plant discussed in this paper is a small modular reactor with the main structure located underground and configured as an underground box structure. The structural morphology indicates that its dynamic behavior is closer to that of underground structures, significantly differing from traditional large-scale ground nuclear island structures. Unlike aboveground structures, the seismic response of underground structures is dictated by surrounding soil deformation. Research shows that site conditions greatly affect underground seismic responses [24,25,26,27,28,29,30], possibly being the most critical factor [31]. F. K et al. [32] measured uncertainties in seismic risk assessment for RC buildings, providing a risk assessment tool for the retrofitting and design strategies of RC structures. This method offers a rapid and accurate assessment approach applicable to nuclear power structures. Research on underground structures and aboveground–underground structures has matured and extended to nonlinear site analyses [33,34,35,36,37]. However, these underground structures primarily include subway stations, tunnels, and similar constructions, with few studies on deeply buried large structures. The structure in this article is a large underground–aboveground single entity. Understanding the seismic performance of these unique structures under SSI requires specialized research and analysis.
To systematically study the characteristics of embedded nuclear power plant structures under non-bedrock site conditions, this study developed a refined three-dimensional finite element model integrating site–structure interaction using GFE (2024) [38], an efficient finite element analysis software, through numerical modeling. The model adopts a wave input method and uses free-field loads and viscoelastic artificial boundaries to quantitatively study the effects of different structural burial depths and successfully reveals the law of change of seismic response patterns with depth. Under a variety of burial configurations, key parameters, such as the acceleration amplification factor and stress distribution characteristics, are analyzed in detail, providing strong data support for subsequent engineering design and safety assessment.

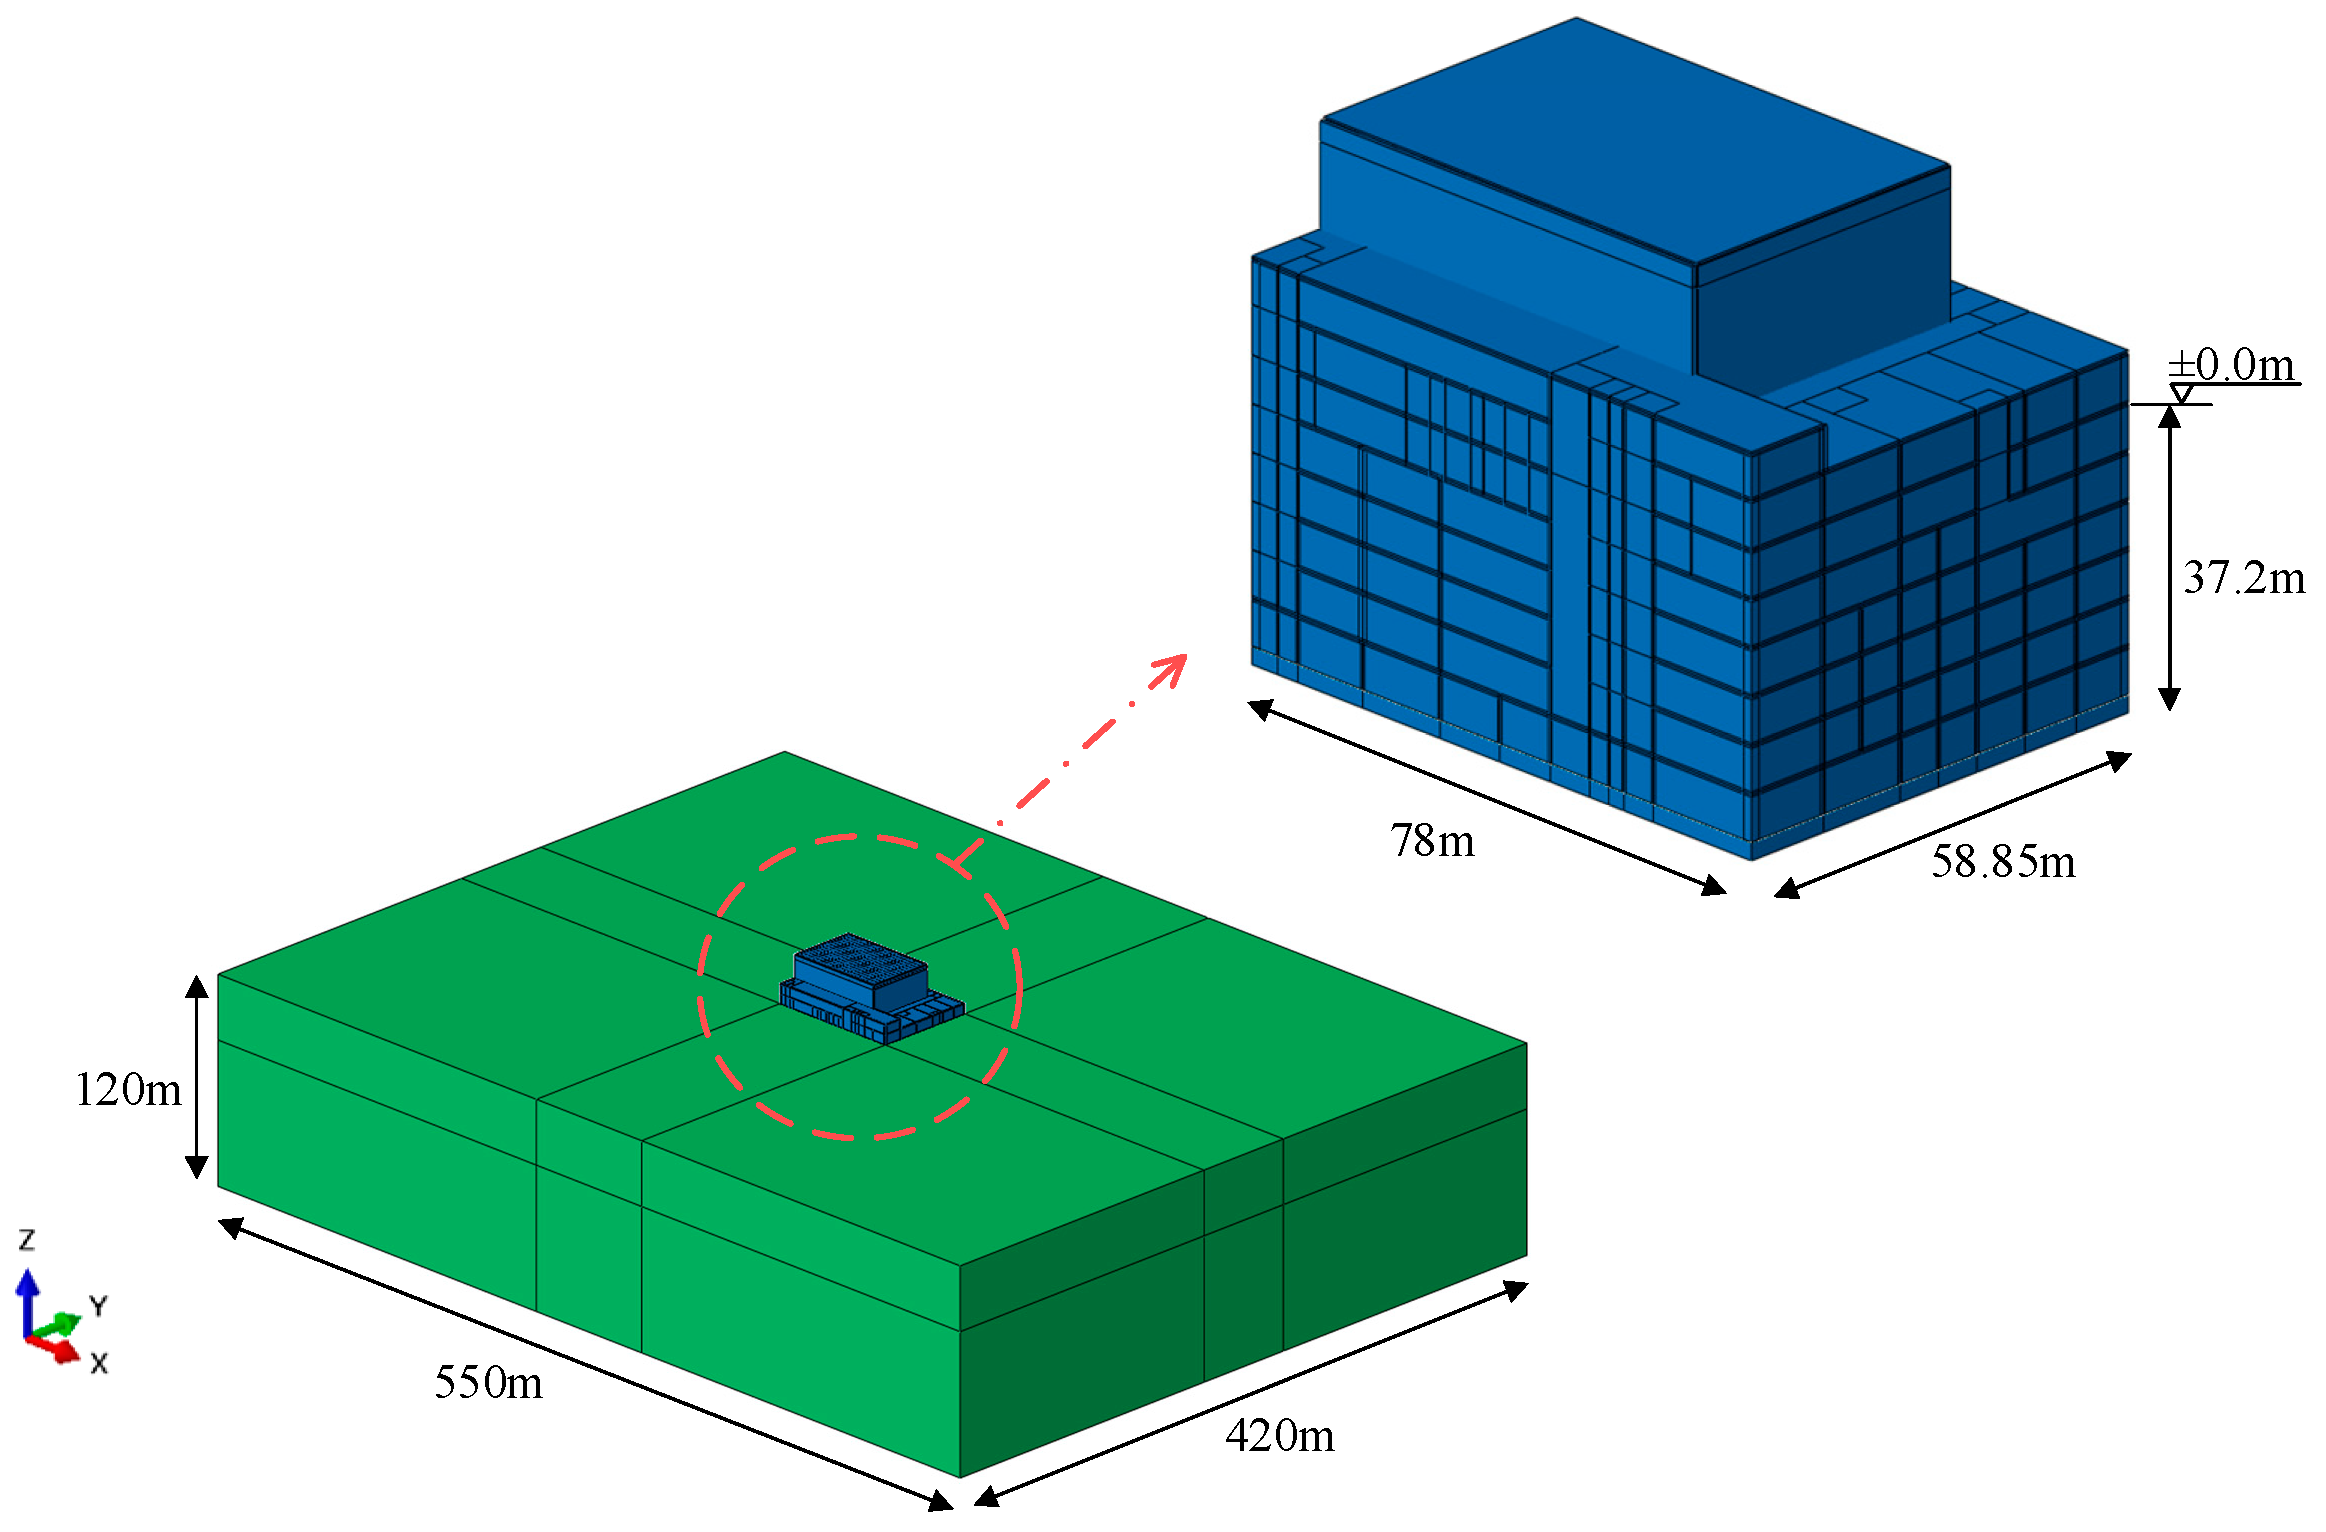
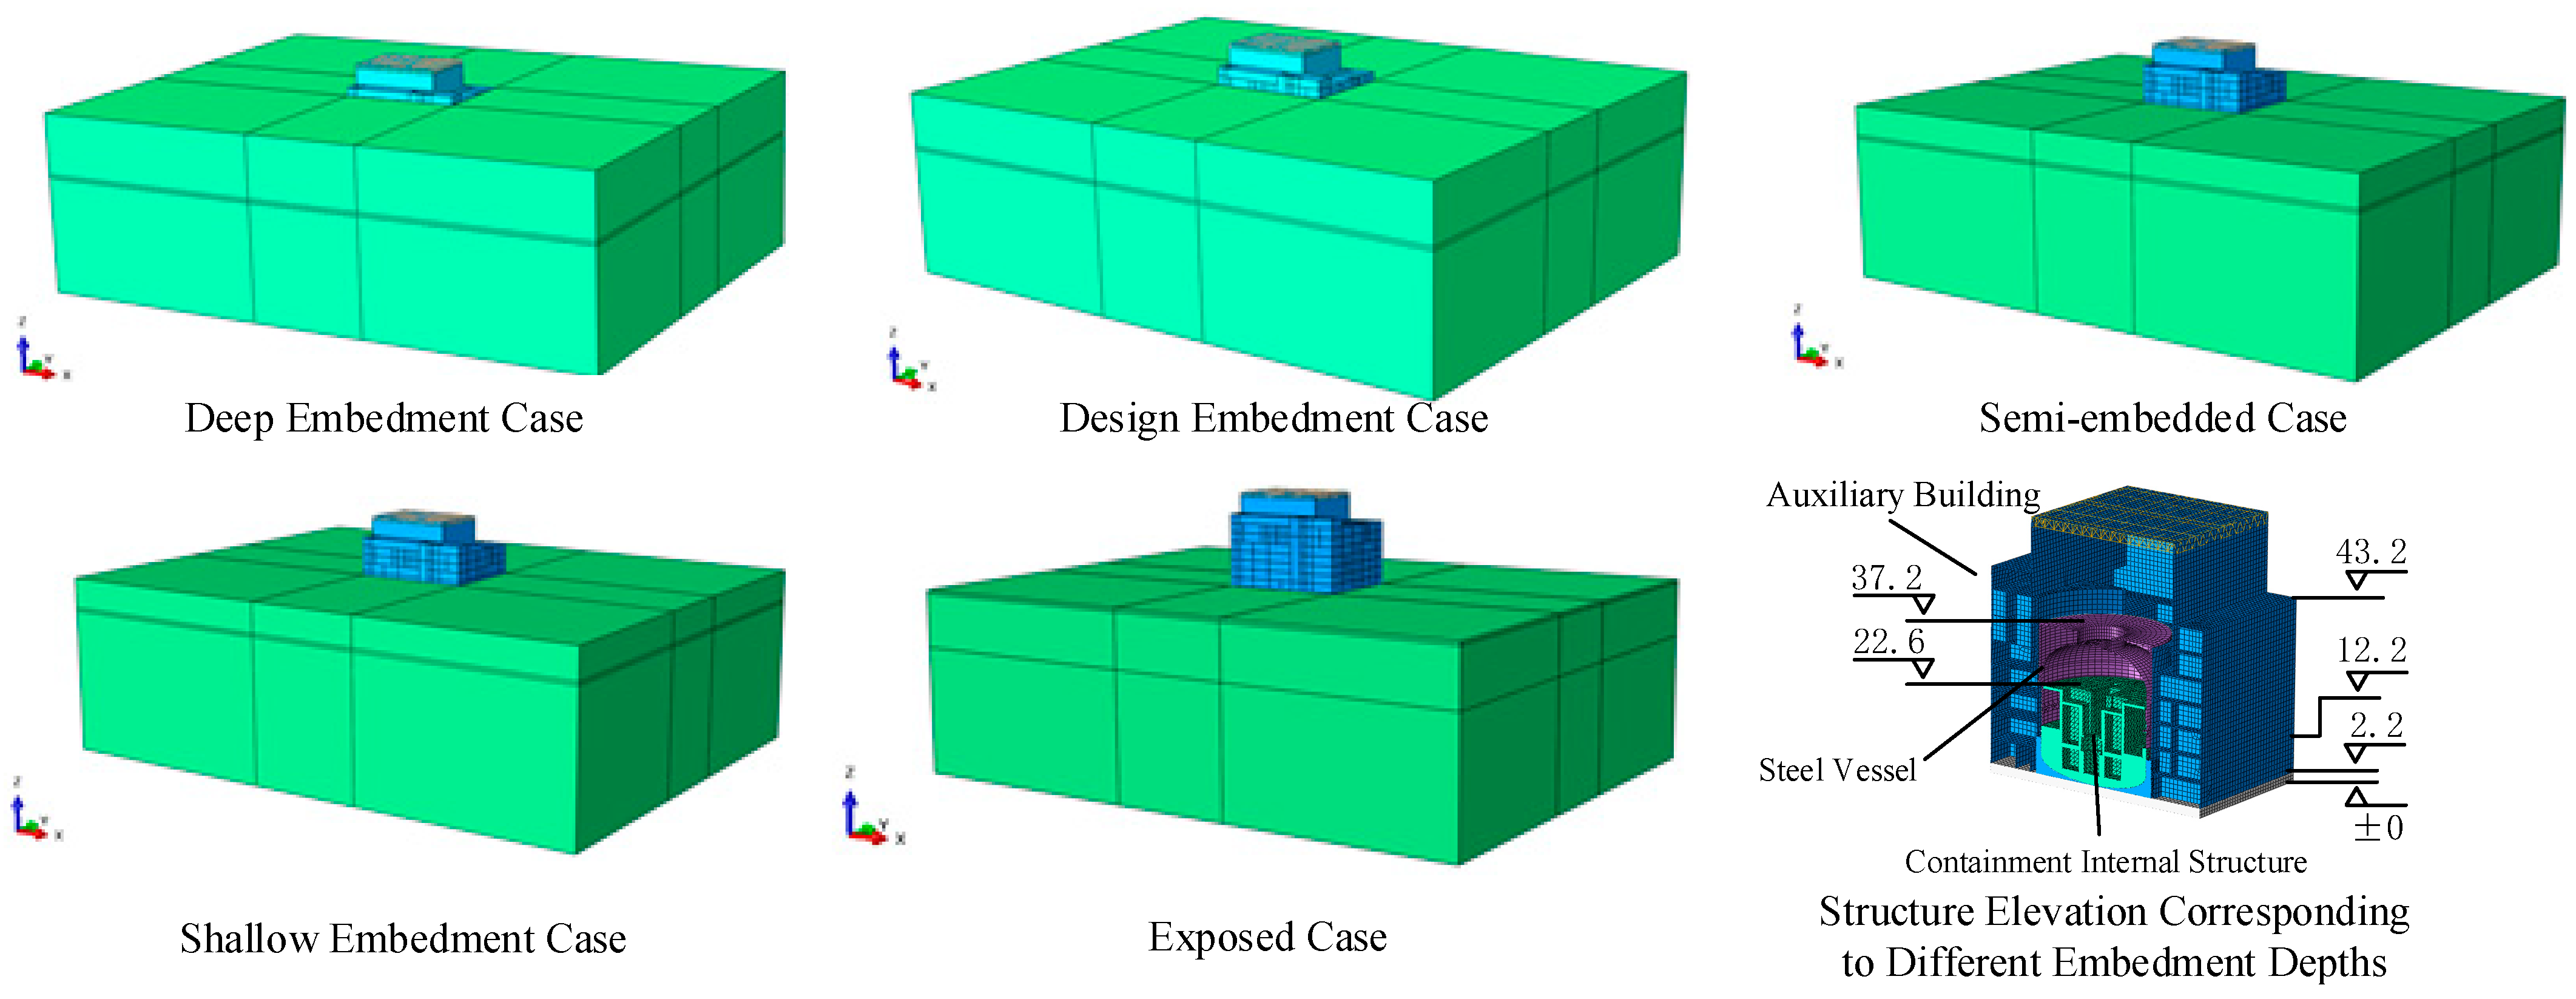
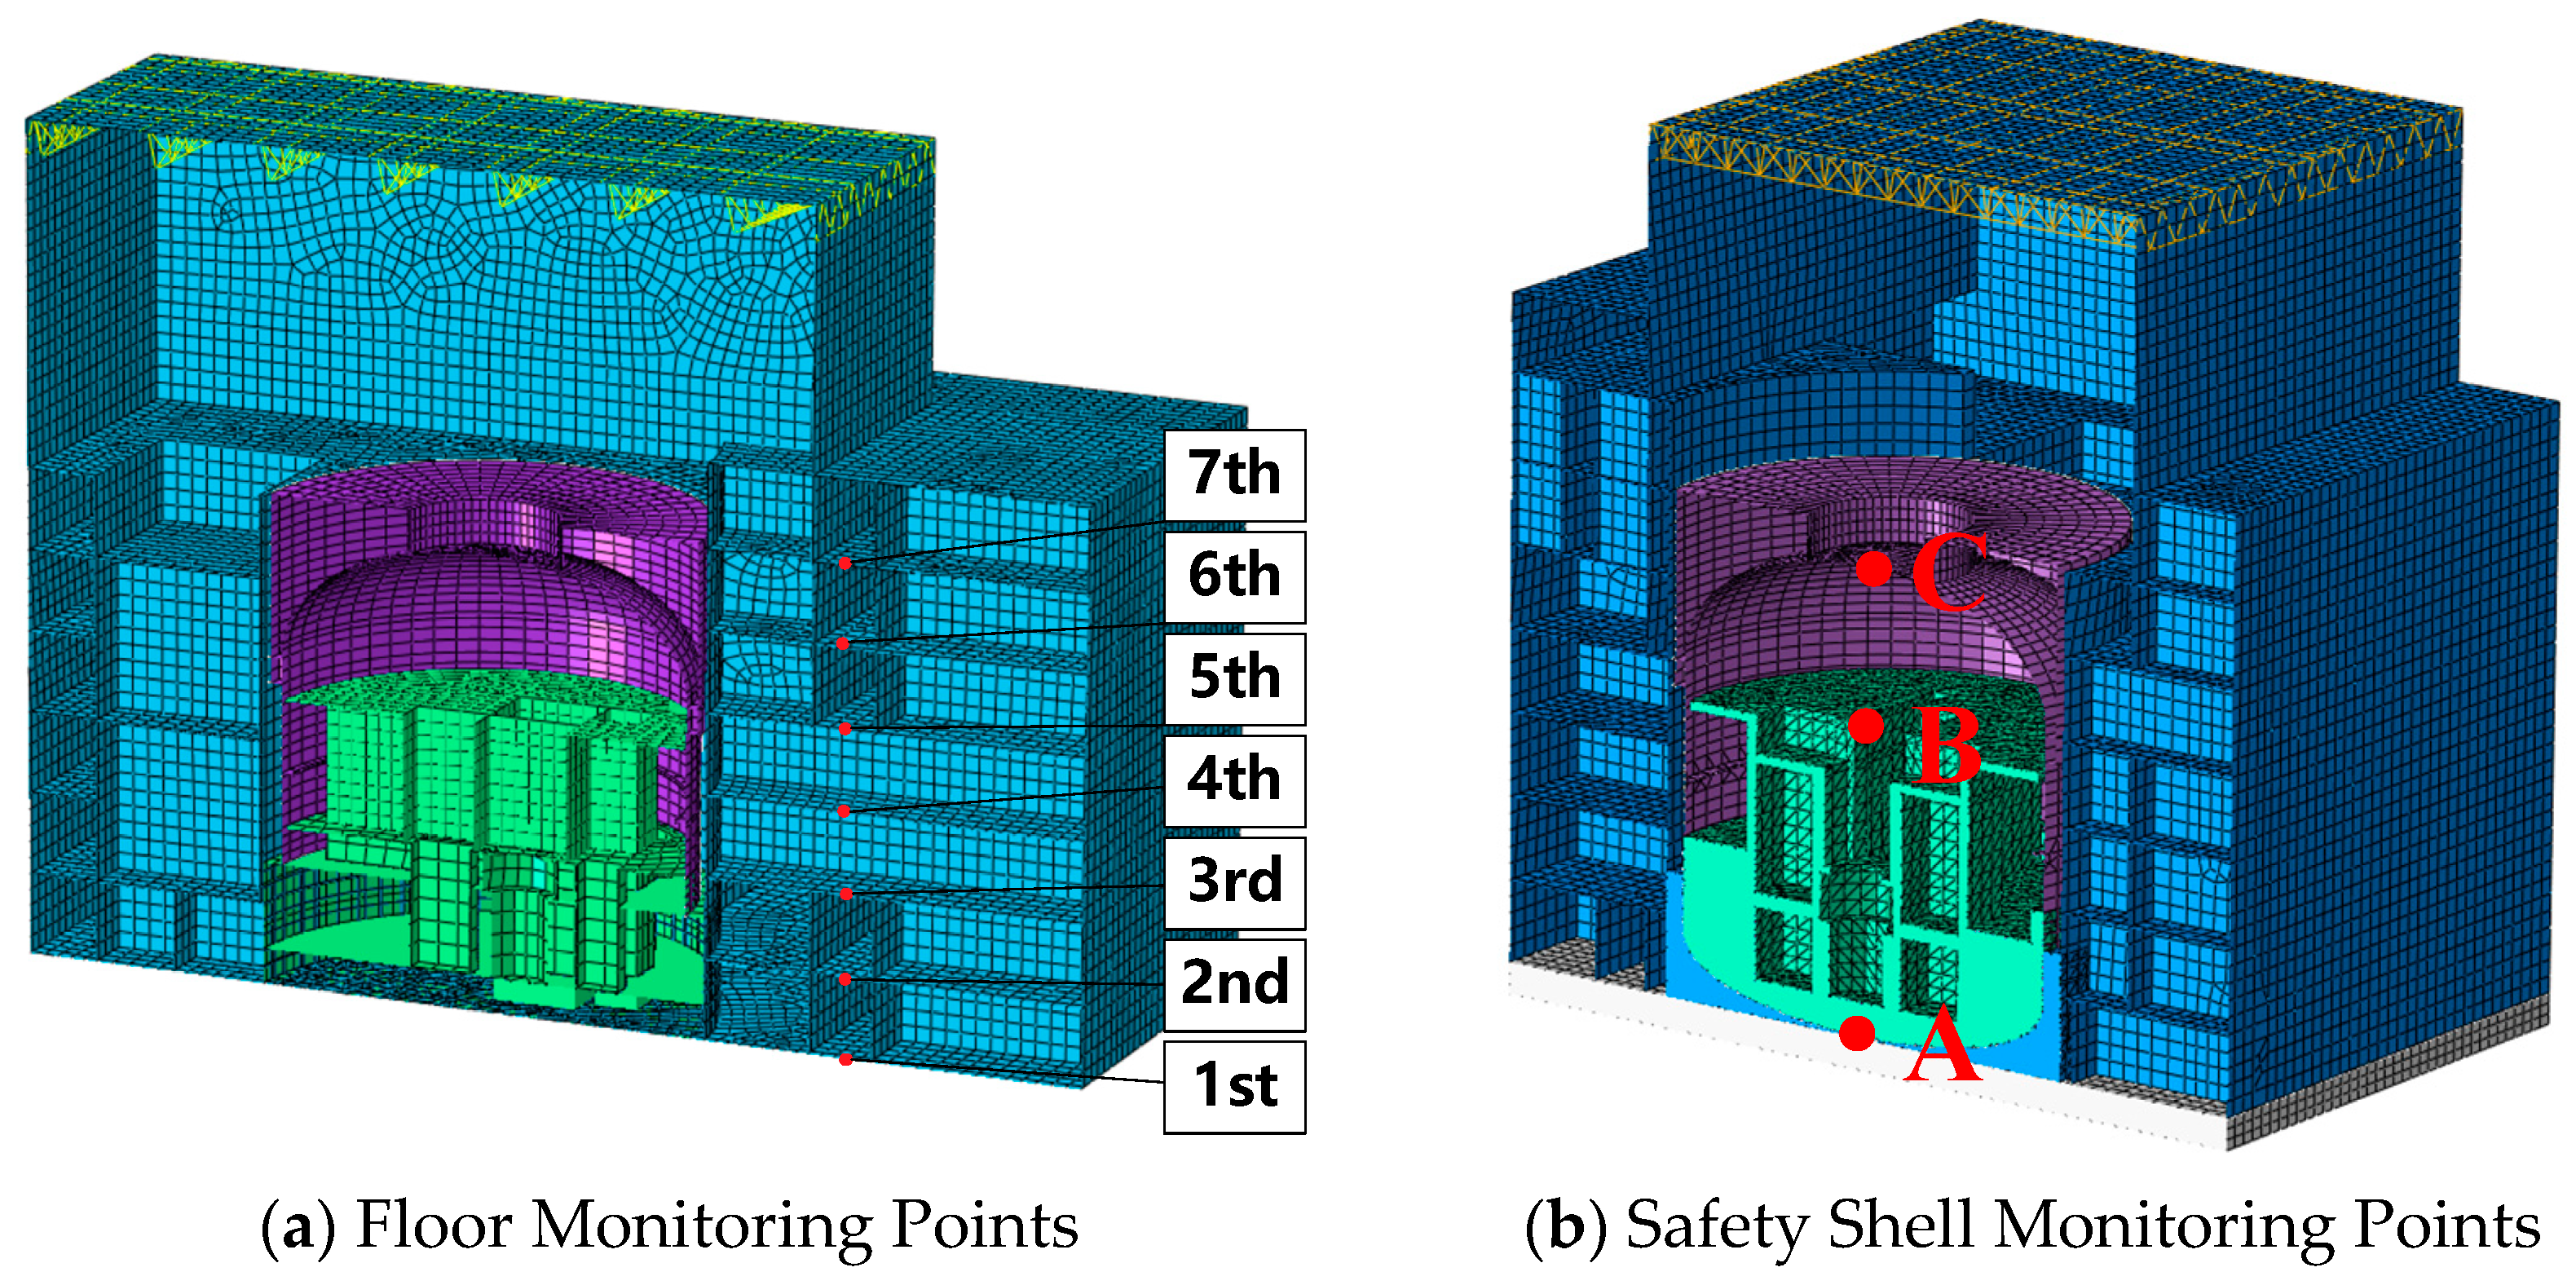
1.1. Embedded Nuclear Power Plant Structure

The embedded nuclear power plant structure is composed of four integrated components: a steel containment structure, auxiliary building, shared mat foundation, and a spatial steel truss system. As depicted in Figure 1 and Figure 2, the facility measures 78 m (length) × 58.85 m (width) × 61.6 m (height) with a designed embedment depth of 37.2 m, positioning the containment top at ground level while maintaining the main structure underground. Finite element modeling was implemented using S4/S3 shell elements (1.1 m/0.93 m mesh) for containment/auxiliary structures, C3D10 tetrahedral elements (1.11 m/2.2 m mesh) for foundation/internal components, and T3D2 truss elements for the steel framework. Tie constraints were systematically applied at structural interfaces including truss–roof connections, foundation–structure junctions, and containment–internal component bonds.
The concrete grade is C45 (Poisson’s ratio of 0.17), and the steel used is Q235 steel (Poisson’s ratio of 0.3).

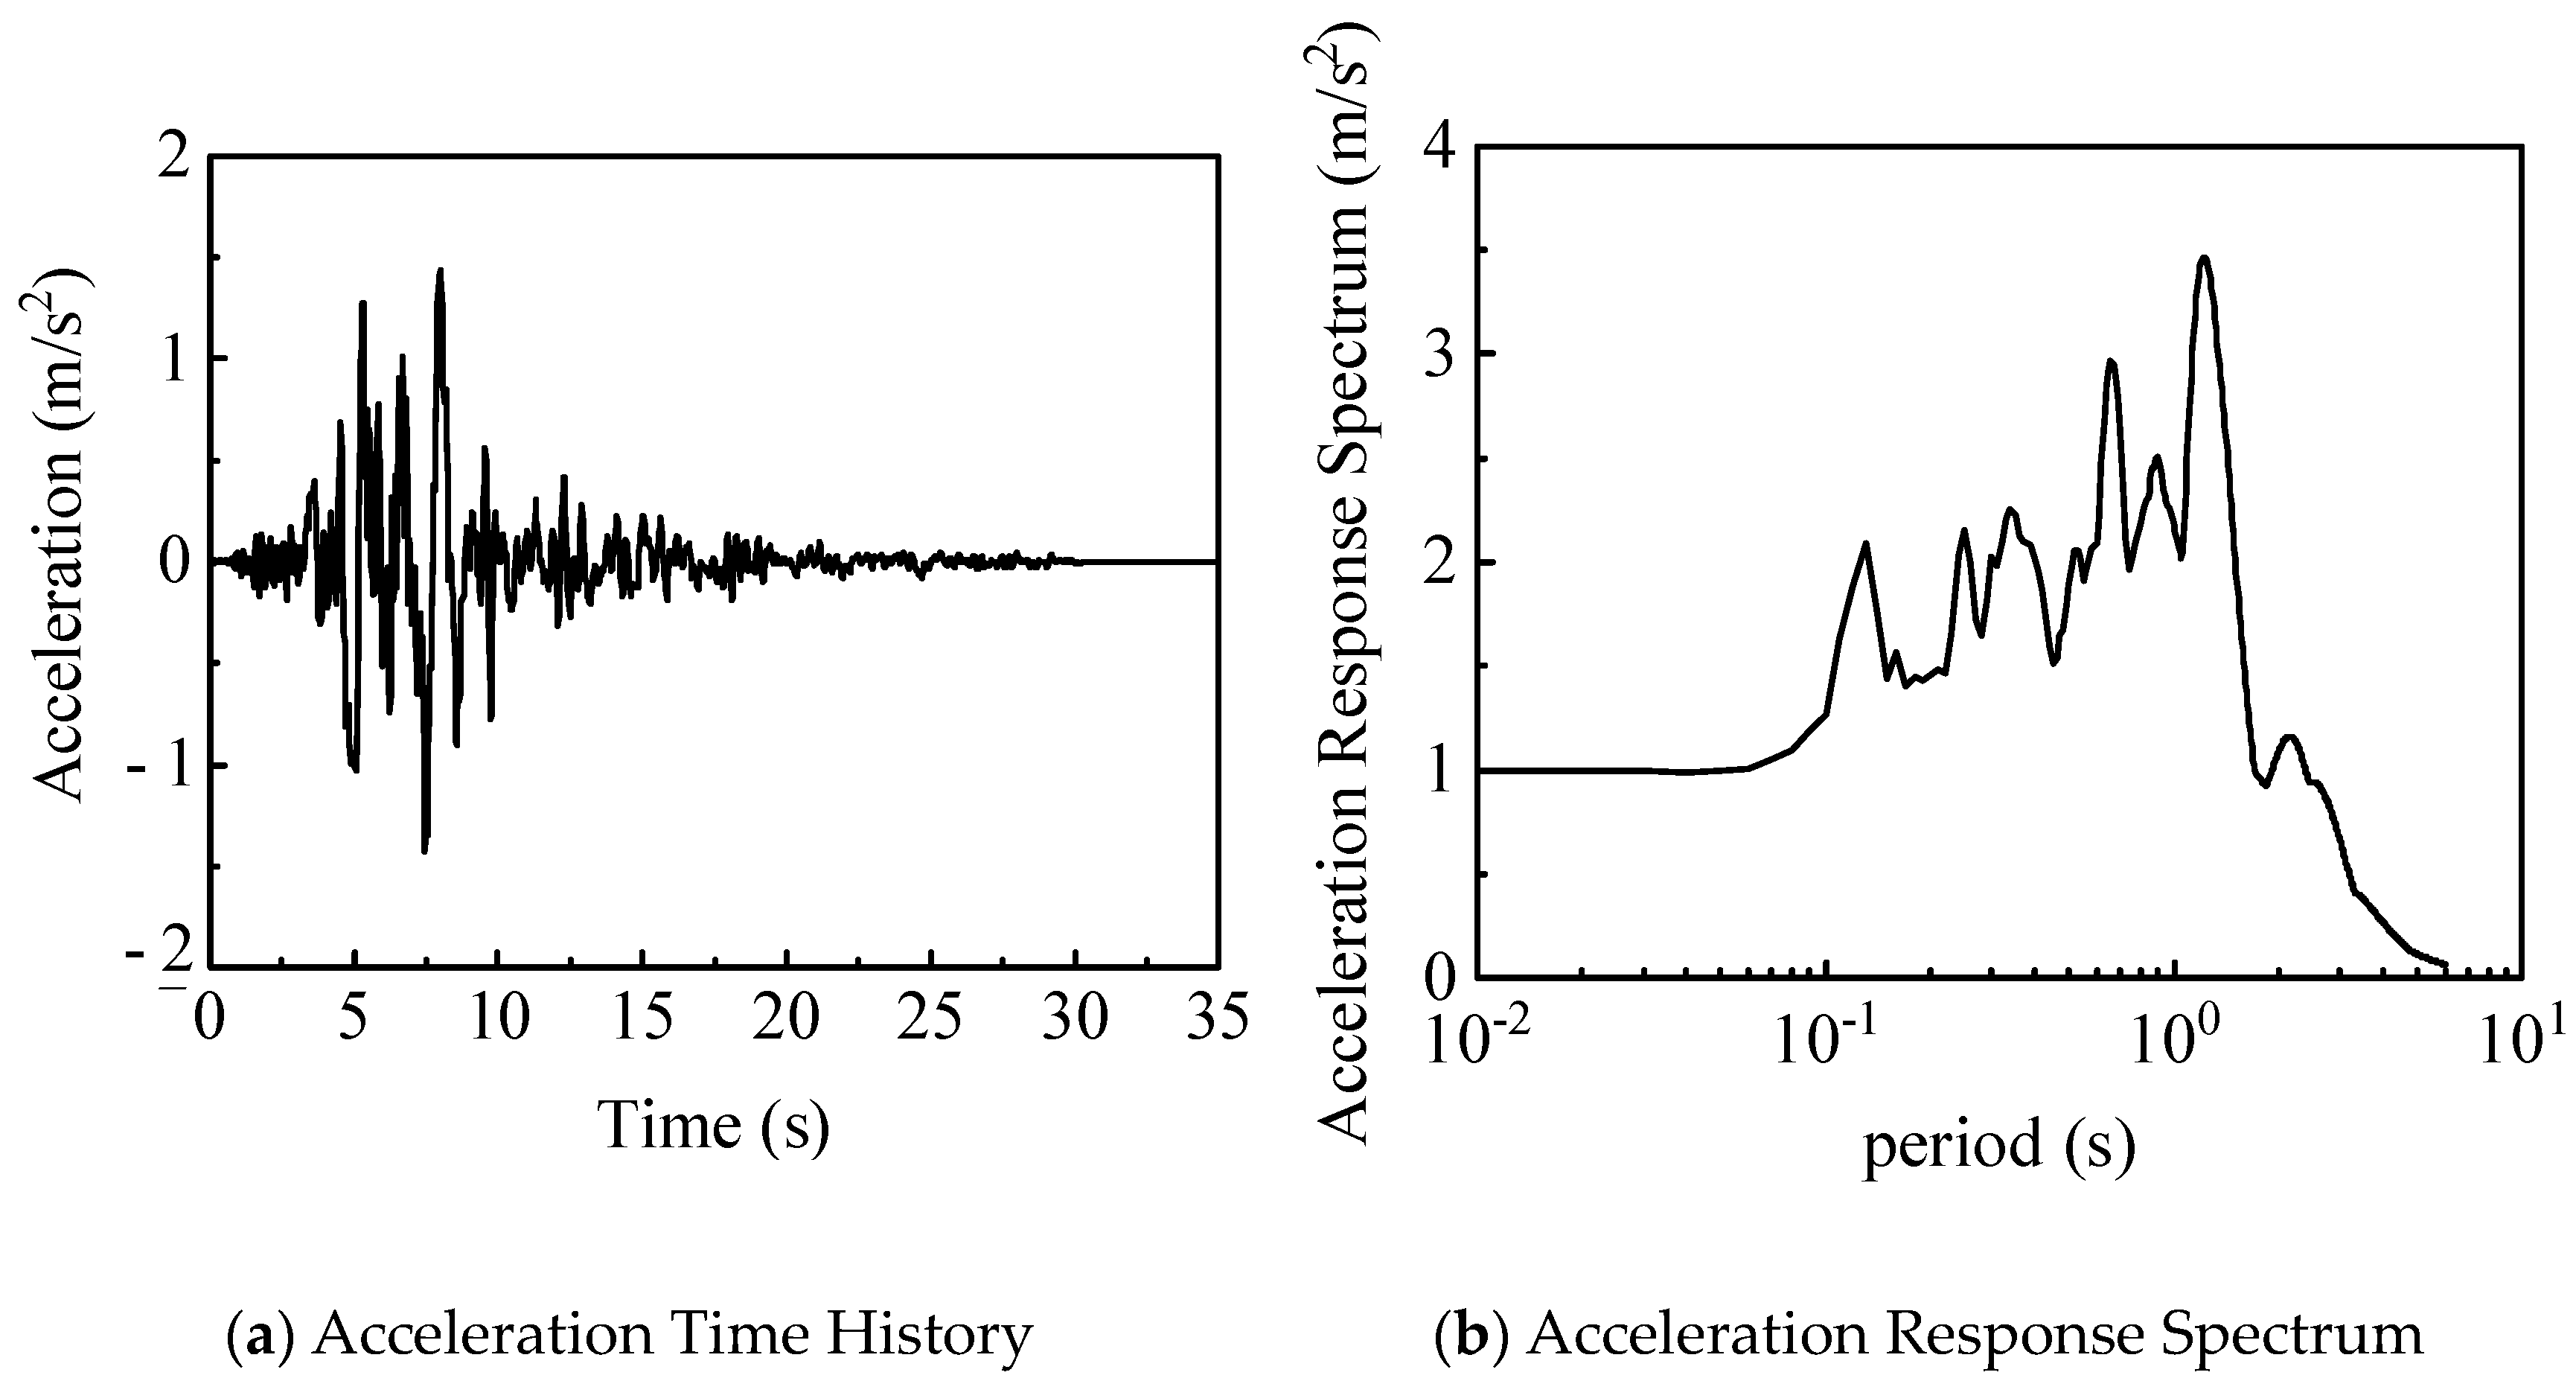
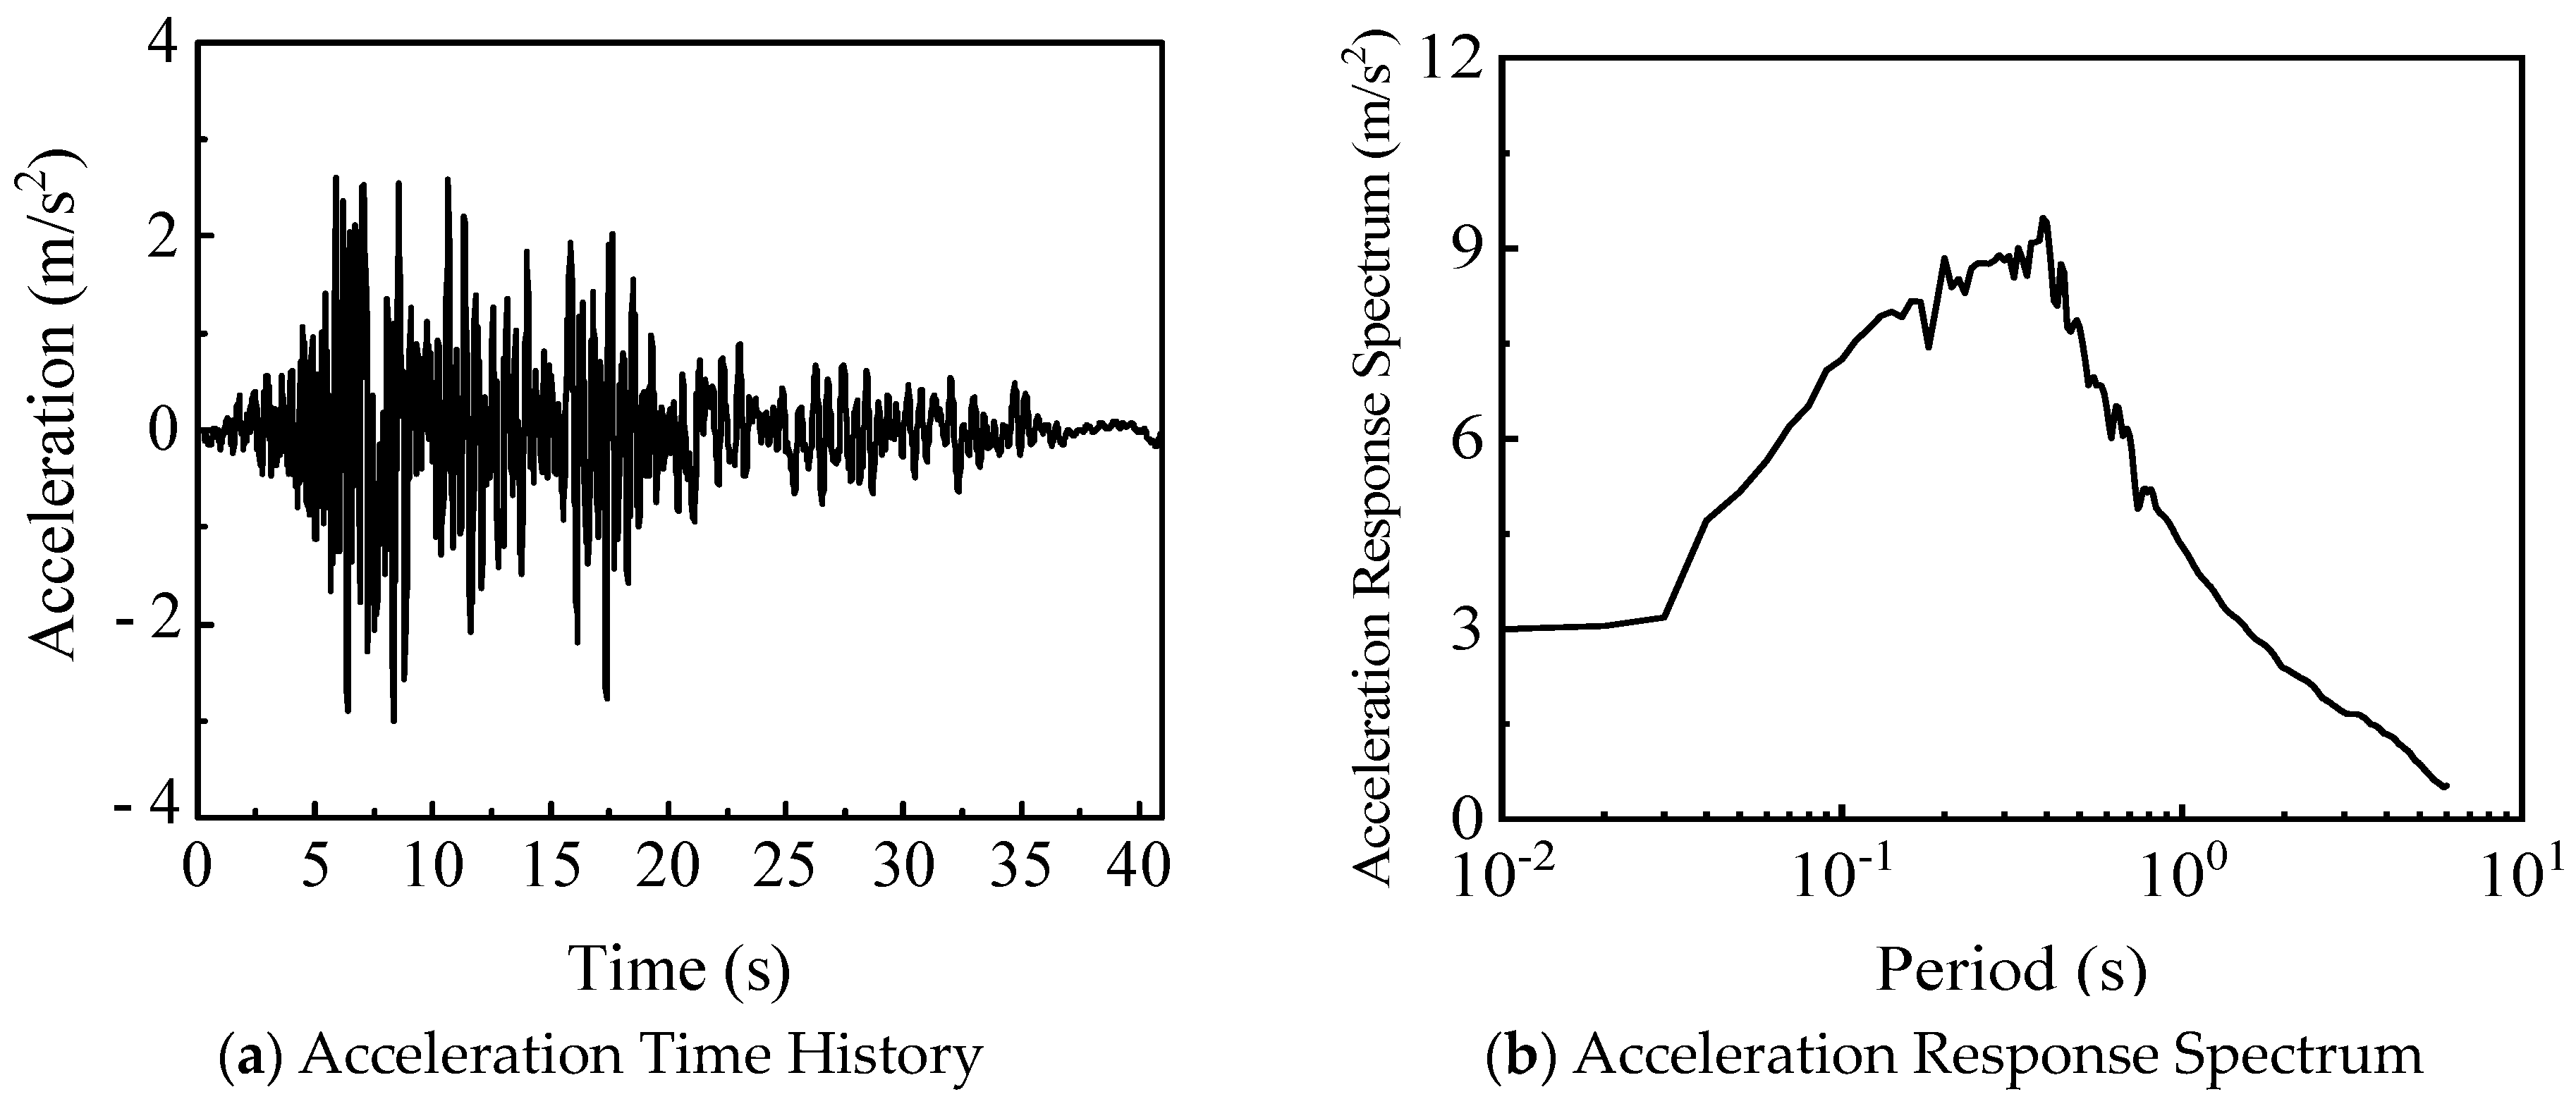
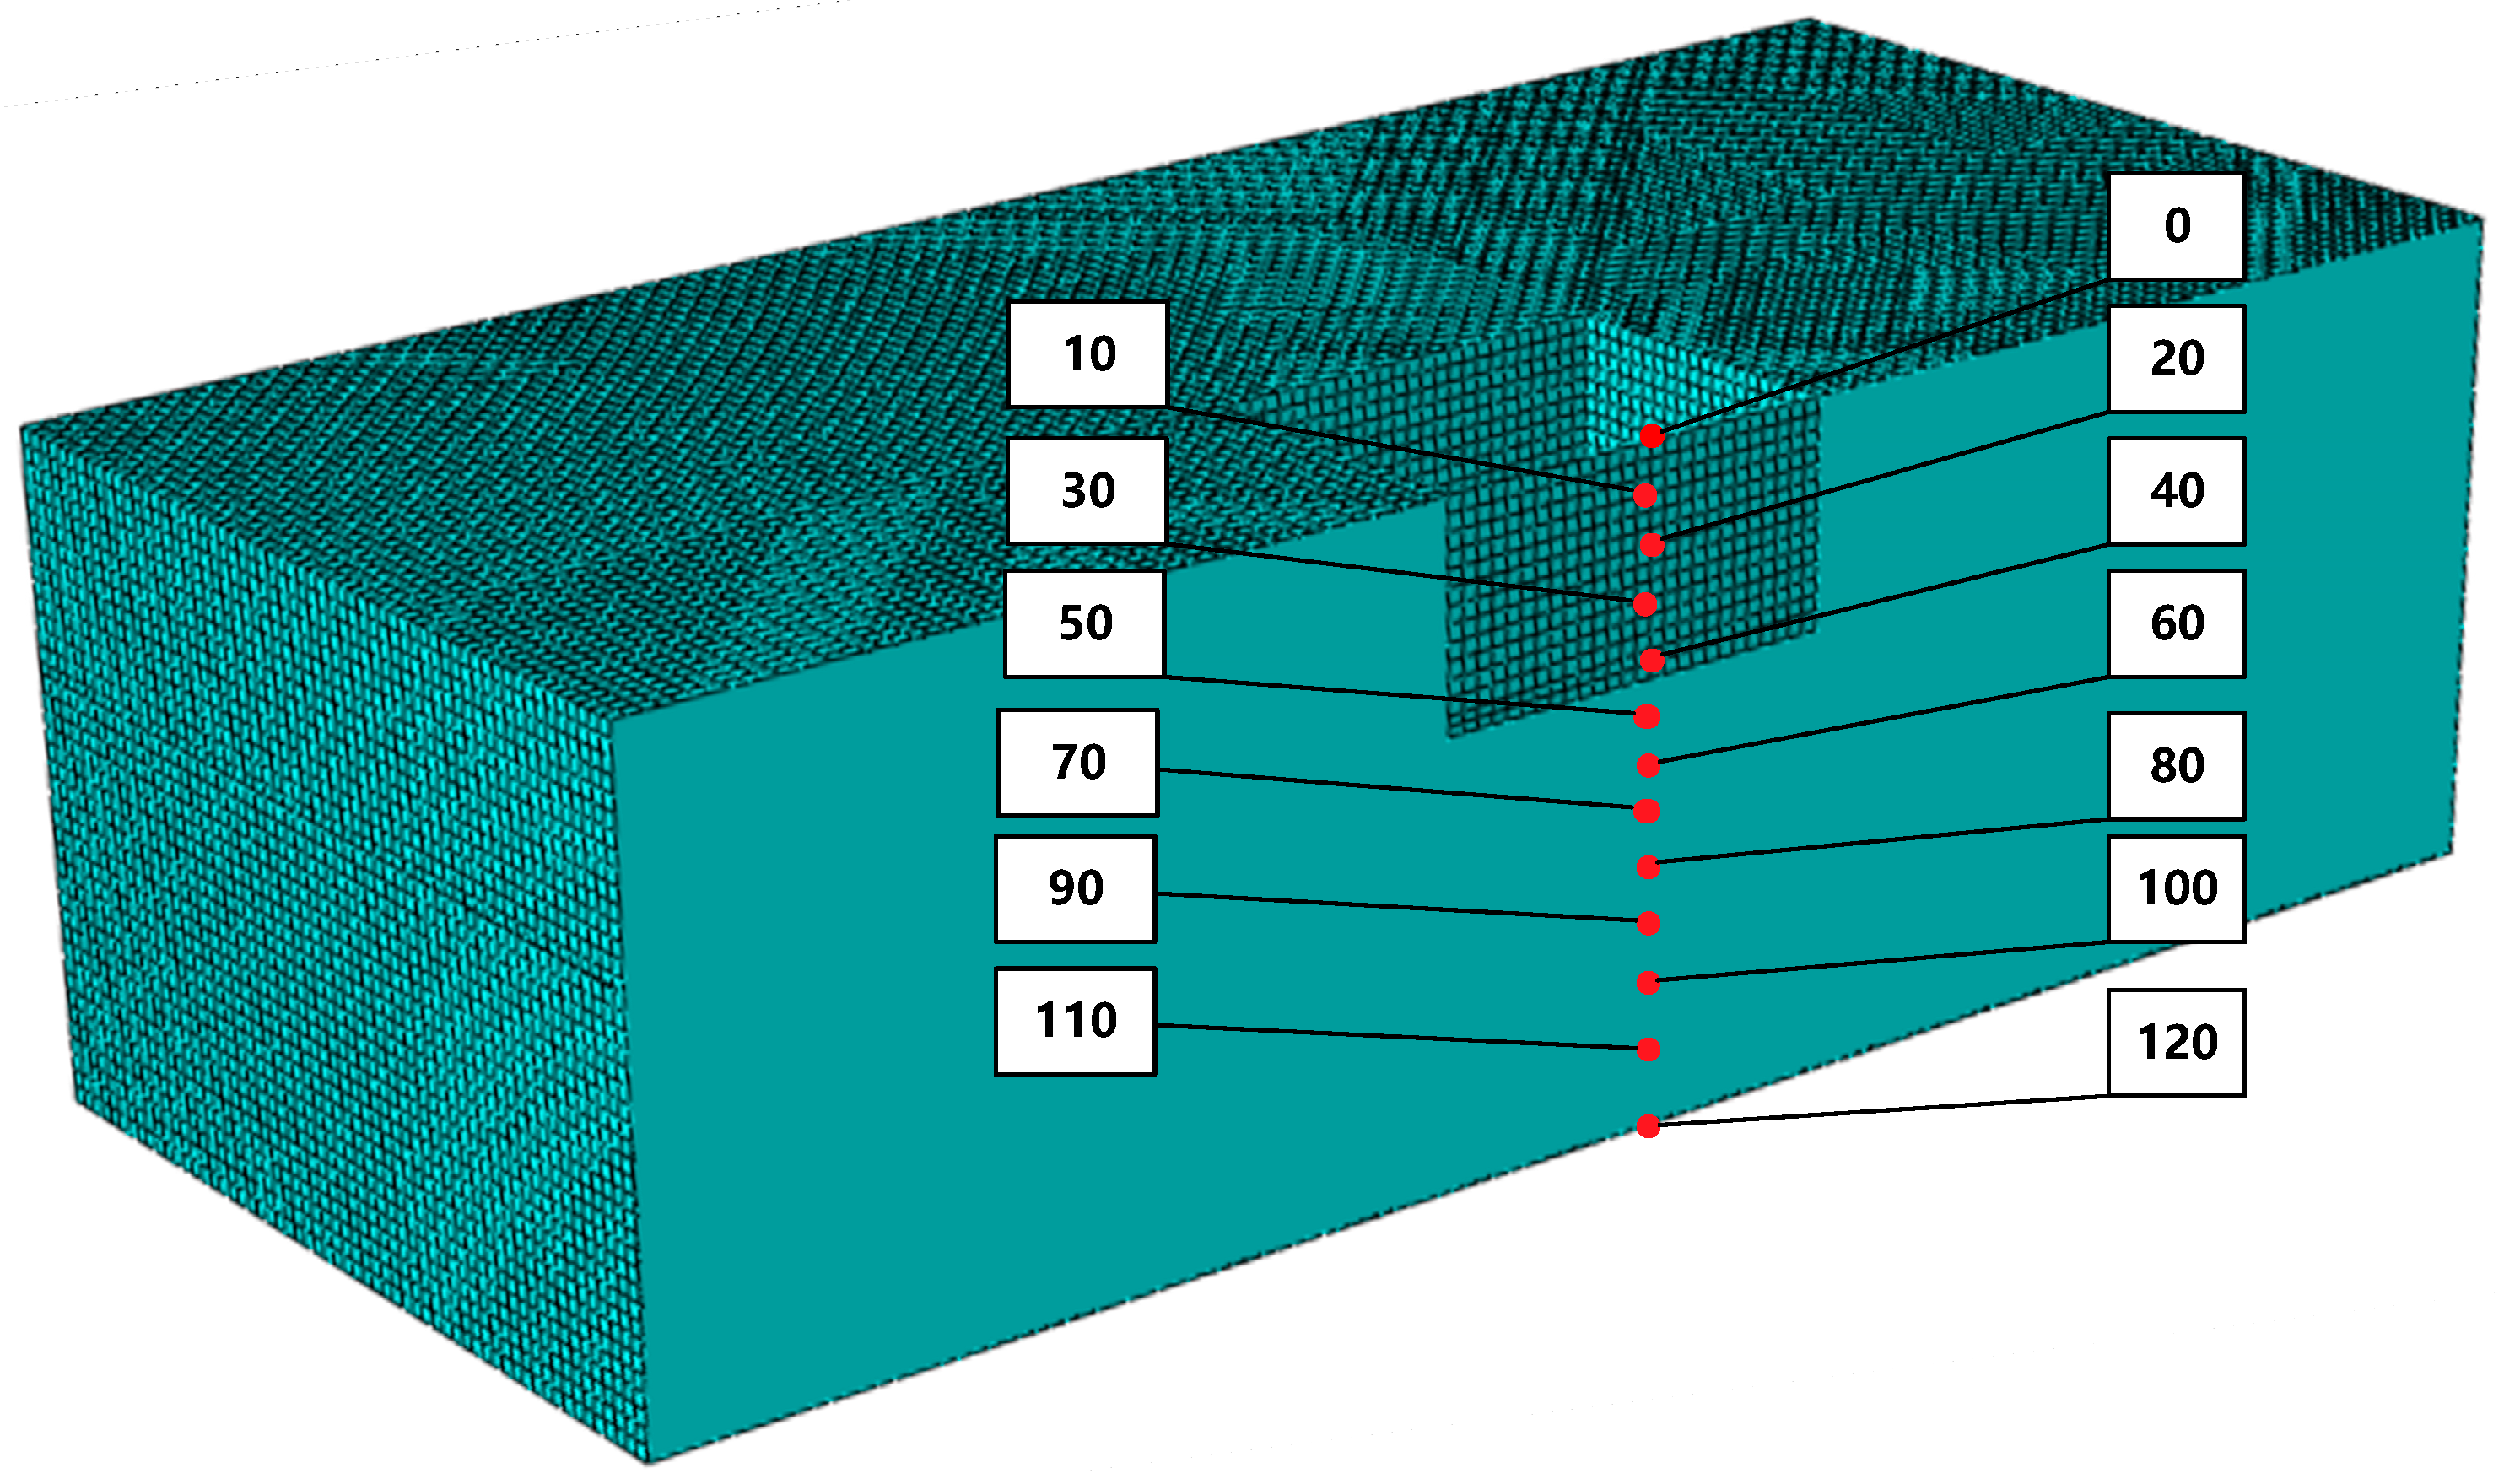
1.2. Earthquake Records and Site Information

In the study on embedment depth in homogeneous sites, Kobe University ground motion was used. The acceleration time history and Fourier spectrum curves are shown in Figure 3. In the study on interlayer positions in liquefiable sites, artificial high-frequency ground motions were adopted. This ensured that liquefaction could be more easily induced under major earthquakes. The motion time history and response spectrum (bedrock location) are shown in Figure 4. Physical parameter information on the plant site is given in Table 1, as provided by the nuclear power plant siting safety report. An equivalent site with a liquefiable layer for the LT site is shown in Table 2.

1.3. Artificial Boundary and Seismic Input Method

The viscous boundary is implemented by placing remotely fixed dampers at each degree of freedom on the artificial boundary. It has clear physical significance, is easy to implement, and performs stably under high-frequency conditions, meeting engineering accuracy requirements. As a result, it has been widely used in the analysis of complex engineering problems and has been adopted by some commercial finite element software programs.
Artificial boundary conditions [39] simulate radiation damping in truncated infinite domains. Viscoelastic boundaries use parallel spring–dashpot systems. As shown in Figure 5, each boundary degree of freedom connects to a fixed remote end. Springs add stiffness constraints. This prevents the low-frequency drift instability seen in viscous boundaries.
The mechanical properties of parallel spring–dashpot systems are defined as follows:
Normal   Direction :   K B N = 1 1 + A λ + 2 G r , C B N = B ρ c p
Tan gential   Direction :   K B T = 1 1 + A G r , C B T = B ρ c s
The viscoelastic boundary components are defined as follows:
  • KBN: Normal spring coefficient.
  • KBT: Tangential spring coefficient.
  • CBN: Normal damping coefficient.
  • CBT: Tangential damping coefficient.
  • ρ: Medium density.
  • A, B: Dimensionless empirical parameters (recommended values: 0.8 and 1.1).
  • r: Near-field structure characteristic length.
Site-specific ground response analysis is combined with viscoelastic boundary conditions. Free-field seismic motions are converted into equivalent nodal loads on truncated boundary surfaces.

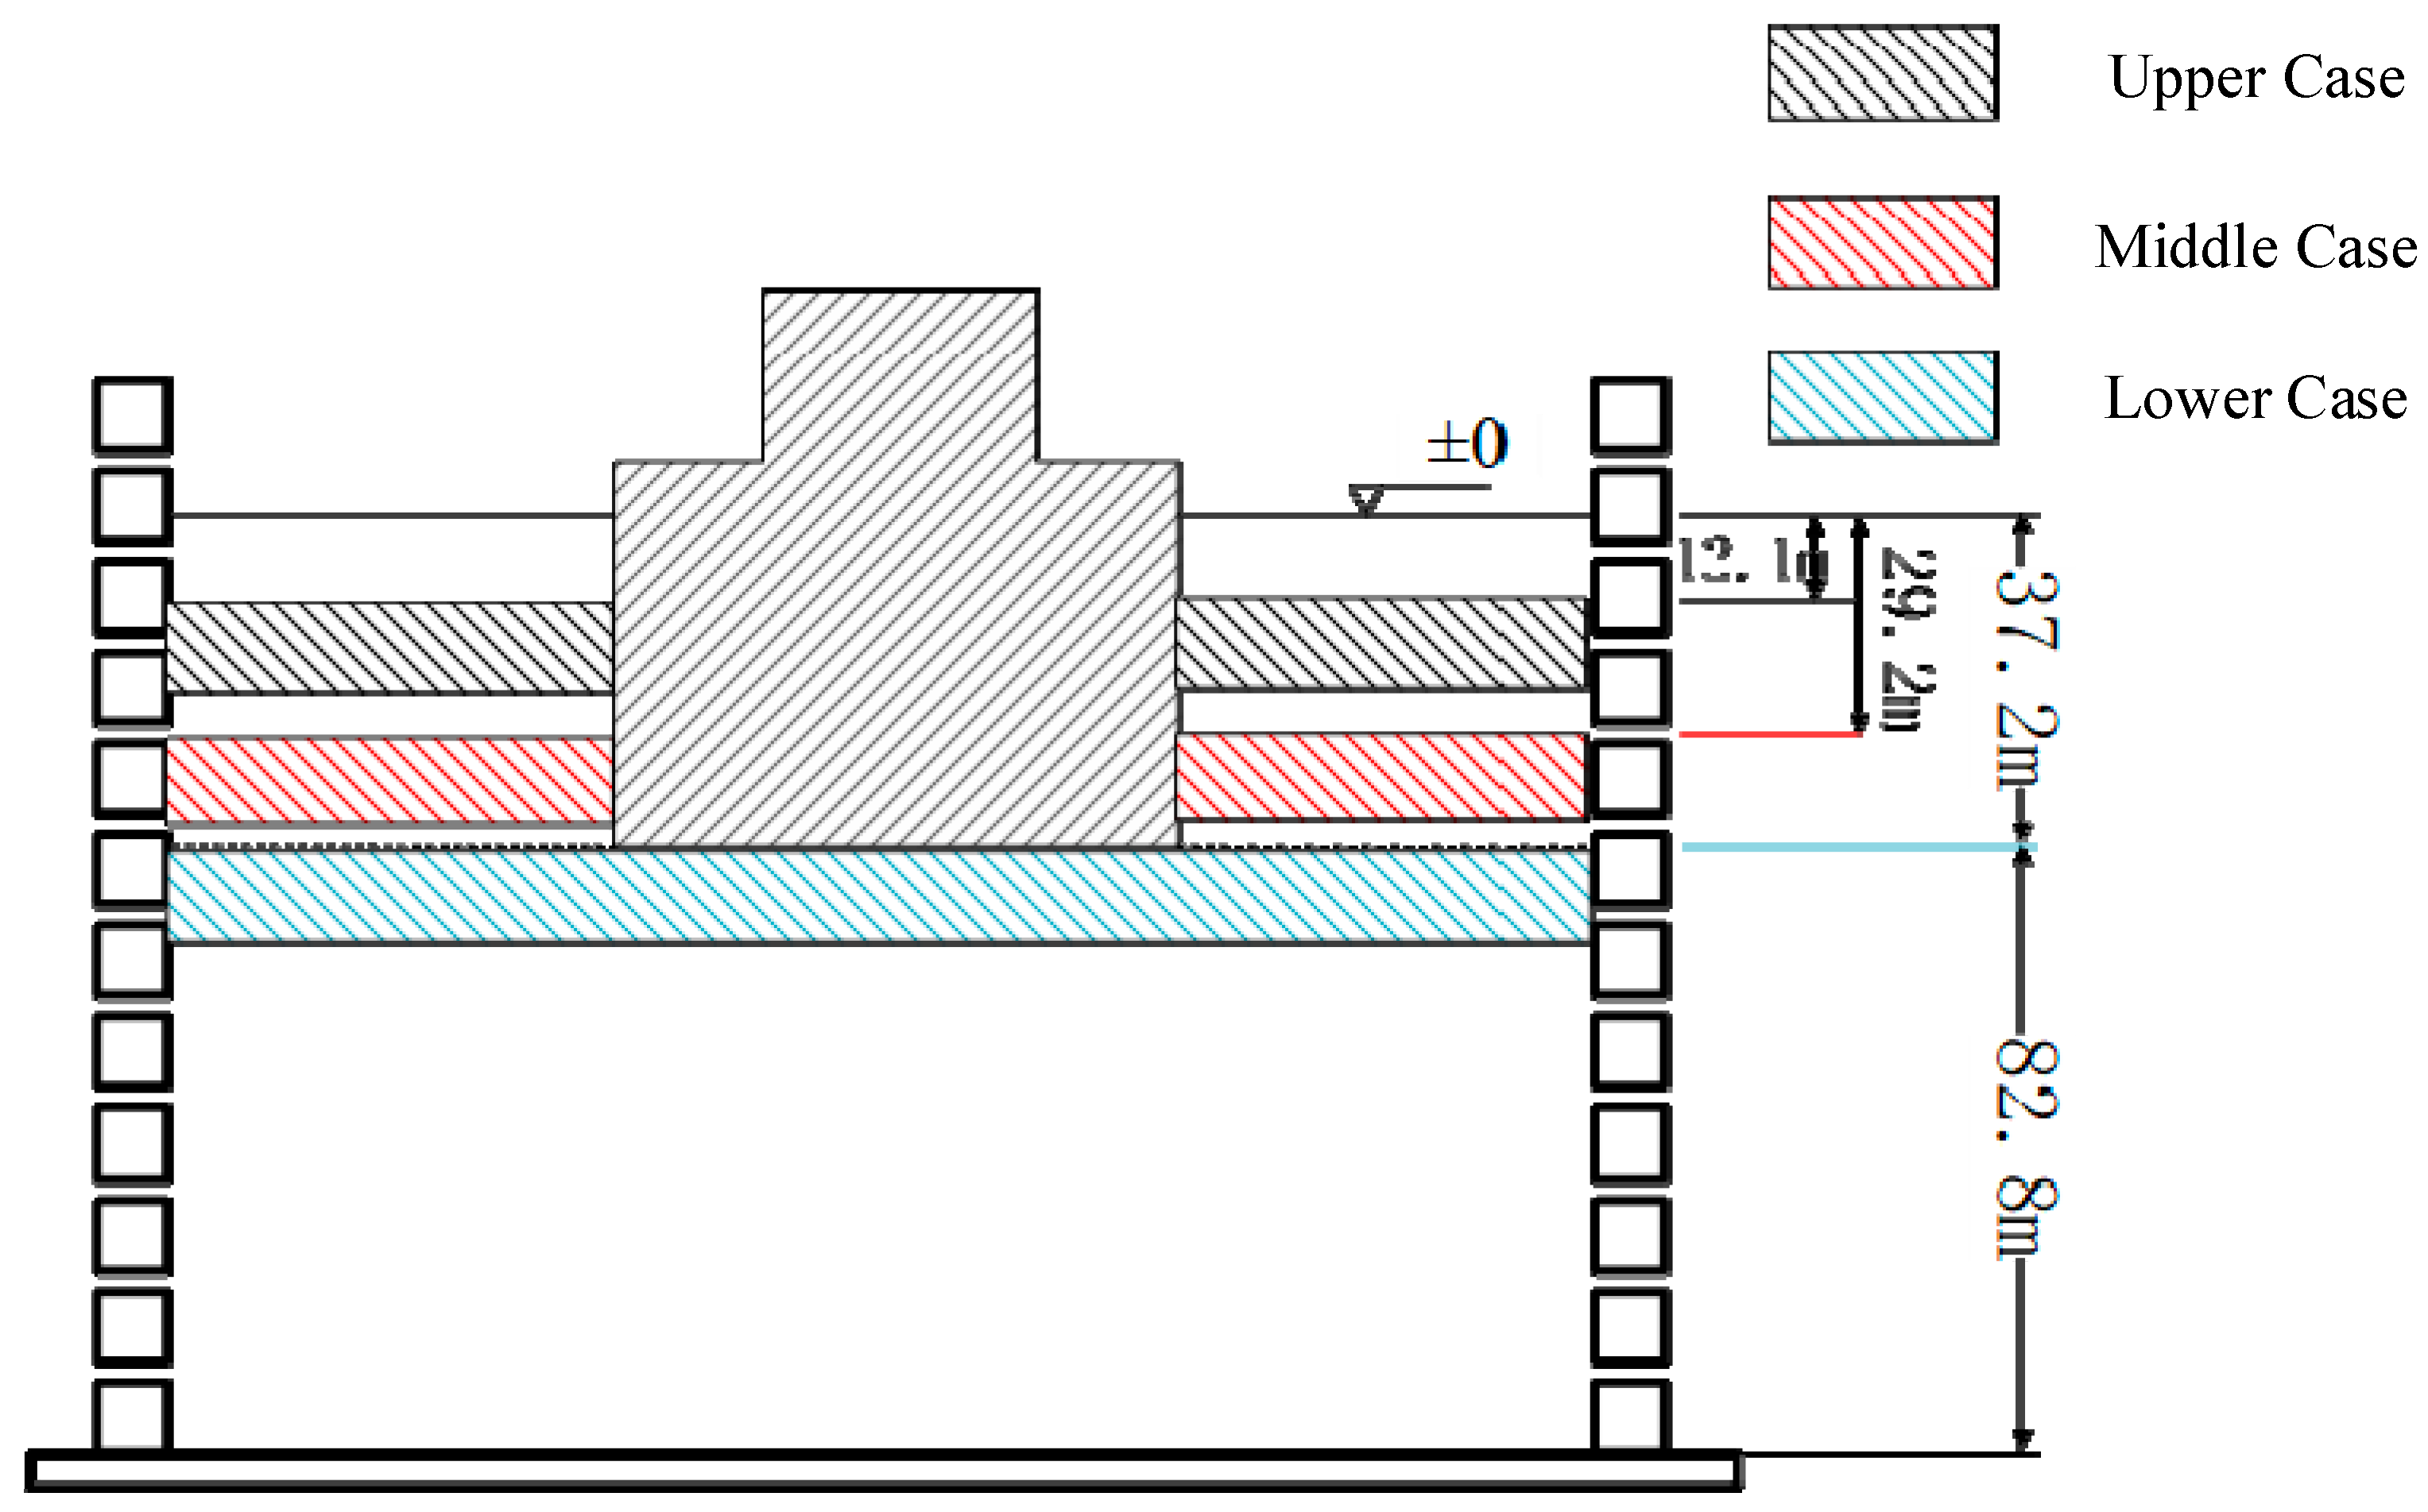
1.4. Operating Conditions

To fully study the influence of structure embedment depth on the seismic response of buried nuclear island structures, five embedment depths were designed under average soft soil conditions. These designs are shown in Table 2, Cases 1–5. Under liquefiable interlayer conditions, three embedment cases with the same depth were designed with varying liquefiable layer positions. These designs are shown in Table 3, Cases 6–8.
The design embedment depth is determined as 37.2 m, where the containment structure is fully aligned with the ground surface. Five operational cases are defined. In the deep embedment case, the ground surface is leveled with the lowest elevation of the plant roof. The design embedment case requires the ground surface to coincide with the uppermost elevation of the containment outer shell. For the semi-buried case, the ground surface is matched to the highest elevation of the containment internal structure. In the exposed case, the ground surface is positioned at the top elevation of the raft foundation. A shallow embedment case is introduced by increasing the embedment depth by 12.2 m relative to the exposed case, as the depth discrepancy between the exposed and semi-buried cases is deemed significant. The geometric configurations of these cases are systematically illustrated in Figure 6.
Three distinct liquefiable layer–structure interaction cases were designed for the LT equivalent site conditions. The liquefiable layer thickness was maintained at 13 m across all configurations. In the upper position case, the liquefiable layer top was located 12.1 m below ground surface. The middle position case positioned the layer top at 29.2 m depth, corresponding to the structural mid-height. For the lower position case, the layer top was placed at 37.2 m depth, aligned with the raft foundation base. The spatial relationships between liquefiable layers and structural components are graphically shown in Figure 7.

1.5. Davidenkov–Chen–Zhao Liquefaction Constitutive Model

This liquefiable constitutive model adopts the Davidenkov–Chen–Zhao (DCZ) model coupled with a pore pressure model [40,41]. The DCZ liquefaction model is selected due to its convenient implementation, satisfactory performance, and excellent compatibility with GFE. Therefore, the DCZ liquefaction model is chosen as the soil constitutive model for liquefaction simulation.
Firstly, an introduction is first provided to the effective stress principle and volume compatibility principle in the pore pressure increment model (pore pressure coupling component).
Effective Stress Principle: Volumetric compression deformation in saturated soils requires equivalent water volume expulsion from pores. Undrained conditions are assumed under seismic loading due to insufficient drainage time. This principle is mathematically expressed as follows:
u = σ
Volume Compatibility Principle: A reduction in net effective normal stress was proposed by Martin et al. to induce soil volumetric rebound (unloading). Permanent volumetric compression caused by cyclic shear loading, pore water drainage, and effective stress reduction was demonstrated to satisfy compatibility conditions (see equation below).
ε v , d + ε v , r = ε v , f
E r = u ε v , d
Consequently, the unloading modulus is derived from the relationship between the pore pressure increment and volumetric strain increment. Under cyclic loading, the shear–volumetric strain increment coupling of liquefiable soils is expressed by the following equation:
ε v d = A 1 ( γ A 2 ε v d ) + A 3 ε v d 2 γ + A 4 ε v d
Byrne simplified the formula proposed by Matrain, expressed as follows:
ε v d γ = C 1 · e x p C 2 ε v d γ
The threshold shear strain is introduced and further modified to the following:
ε v d γ * = C 1 · e x p C 2 ε v d γ *
Within the formula, γ * = ( γ γ t v ) C 3 , C 1 C 2 = 0.15 .
This study adopts Chen’s formula [40,41] incorporating threshold shear strain to define effective shear strain. The unloading modulus Er expression was determined through experimental fitting.
E r = 100 σ c 0 m n exp ( r u / m )
where m and n are fitting parameters, σ c 0   denotes the initial effective consolidation stress, and r u   represents the pore pressure ratio.
Finally, with pore pressure adopted as the parameter for soil stiffness degradation, the transient shear modulus parameter considering the stiffness degradation induced by pore pressure accumulation can be expressed by the following:
G max t = G max ( 1 u e / σ v 0 ) a 3
where G m a x t   is the tangent shear modulus at strain reversal, σ v 0 represents the initial effective overburden stress, and a 3 denotes a fitting parameter.
Note:
r u = u e σ v 0
σ v 0 = 100 σ c 0

1.6. Comparison Between Numerical Simulation and Experimental Results

A simplified analysis model of a site with a liquefiable interlayer and a nuclear power structure was established. The numerical simulation method and platform introduced in this chapter were applied to analyze the seismic response of the model. The effectiveness of the numerical simulation method proposed in this study was verified by comparing the results with existing centrifuge test data, including the soil excess pore pressure ratio, site acceleration, structural acceleration, and the dynamic strain of the structure.

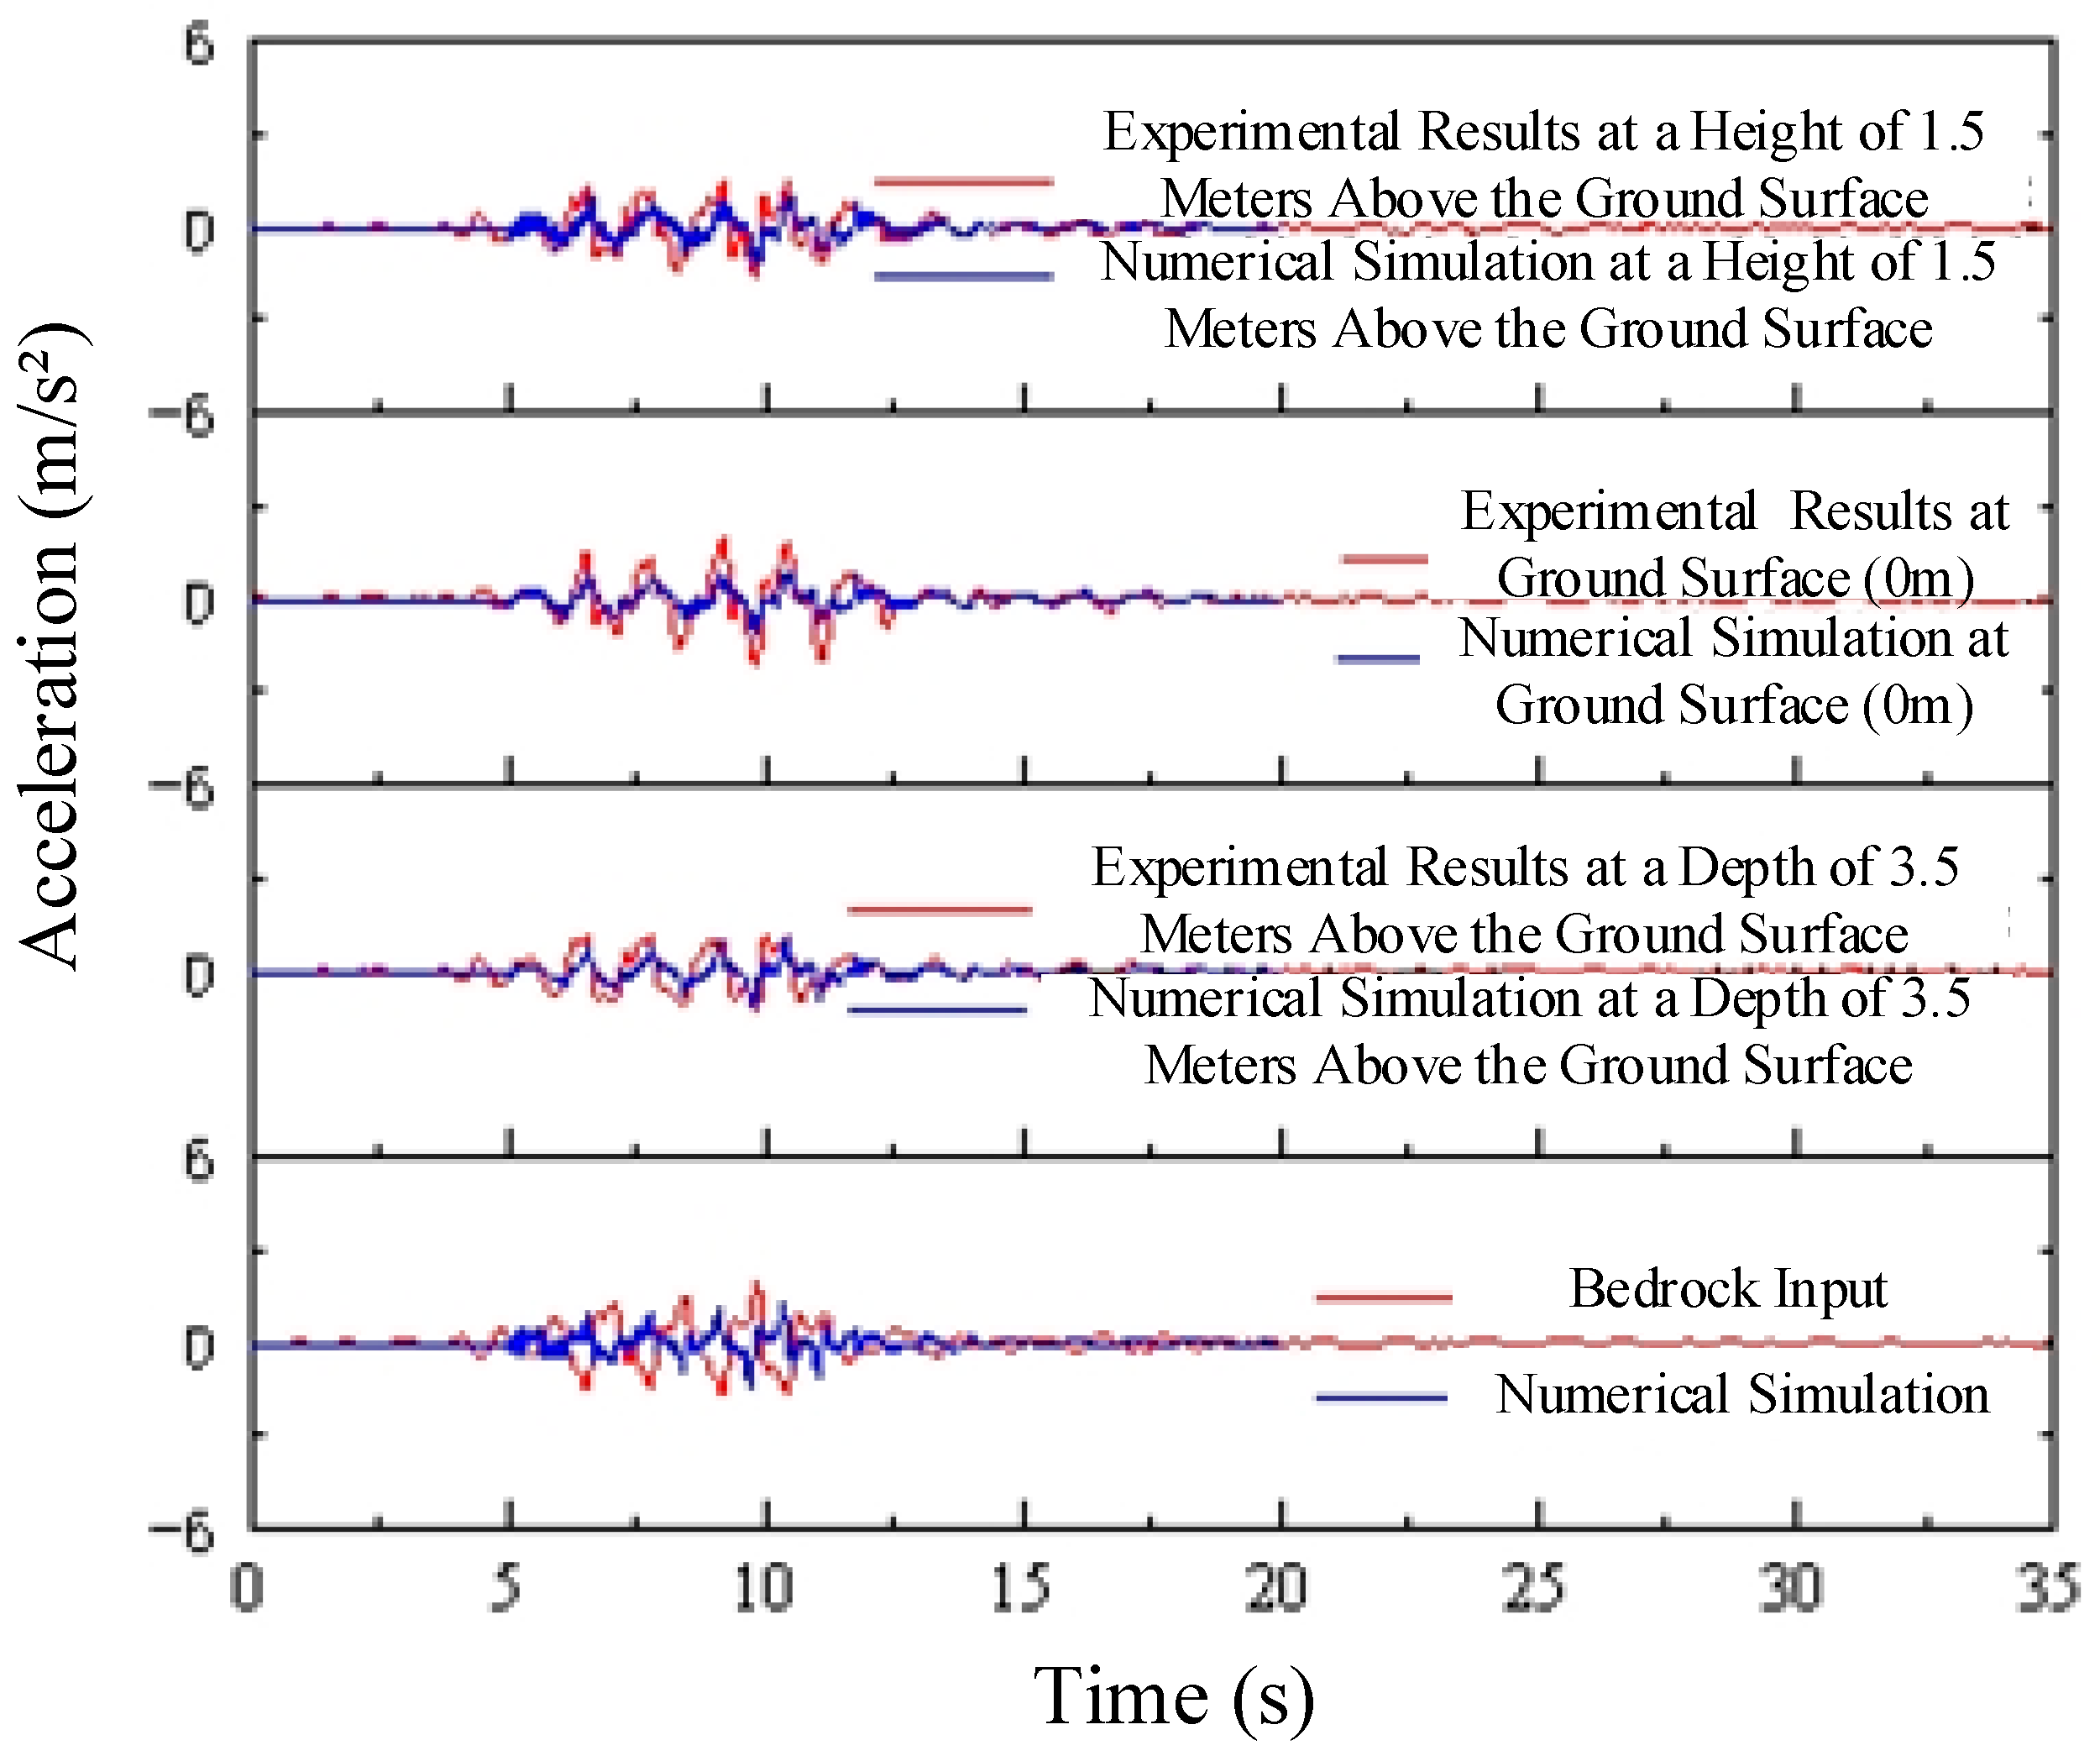
1.6.1. Site Horizontal Acceleration

Figure 8 compares the acceleration time histories at typical measurement points obtained from numerical simulations and experimental tests. The results indicate that the acceleration time histories and amplification factor distributions from numerical calculations generally match well with the experimental data.
However, slight differences in peak values are observed. In the numerical model, the shear wave velocities of soil layers were determined using the distance between accelerometers and the time difference in pulse wave arrival. The distances were based on initial modeling data. Changes in these distances may occur during the static centrifuge loading phase and under seismic conditions. These changes could lead to deviations in the calculated shear wave velocities. This is considered a primary reason for the minor discrepancies between the peak site accelerations in the numerical results and the experimental results.

1.6.2. Structural Acceleration

Figure 9 presents a comparison of the acceleration time histories at structural measurement points between numerical simulations and experimental results. The comparison reveals that the distribution of acceleration time histories obtained from numerical calculations generally aligns with the experimental data. However, slight differences in peak values are observed between the two.

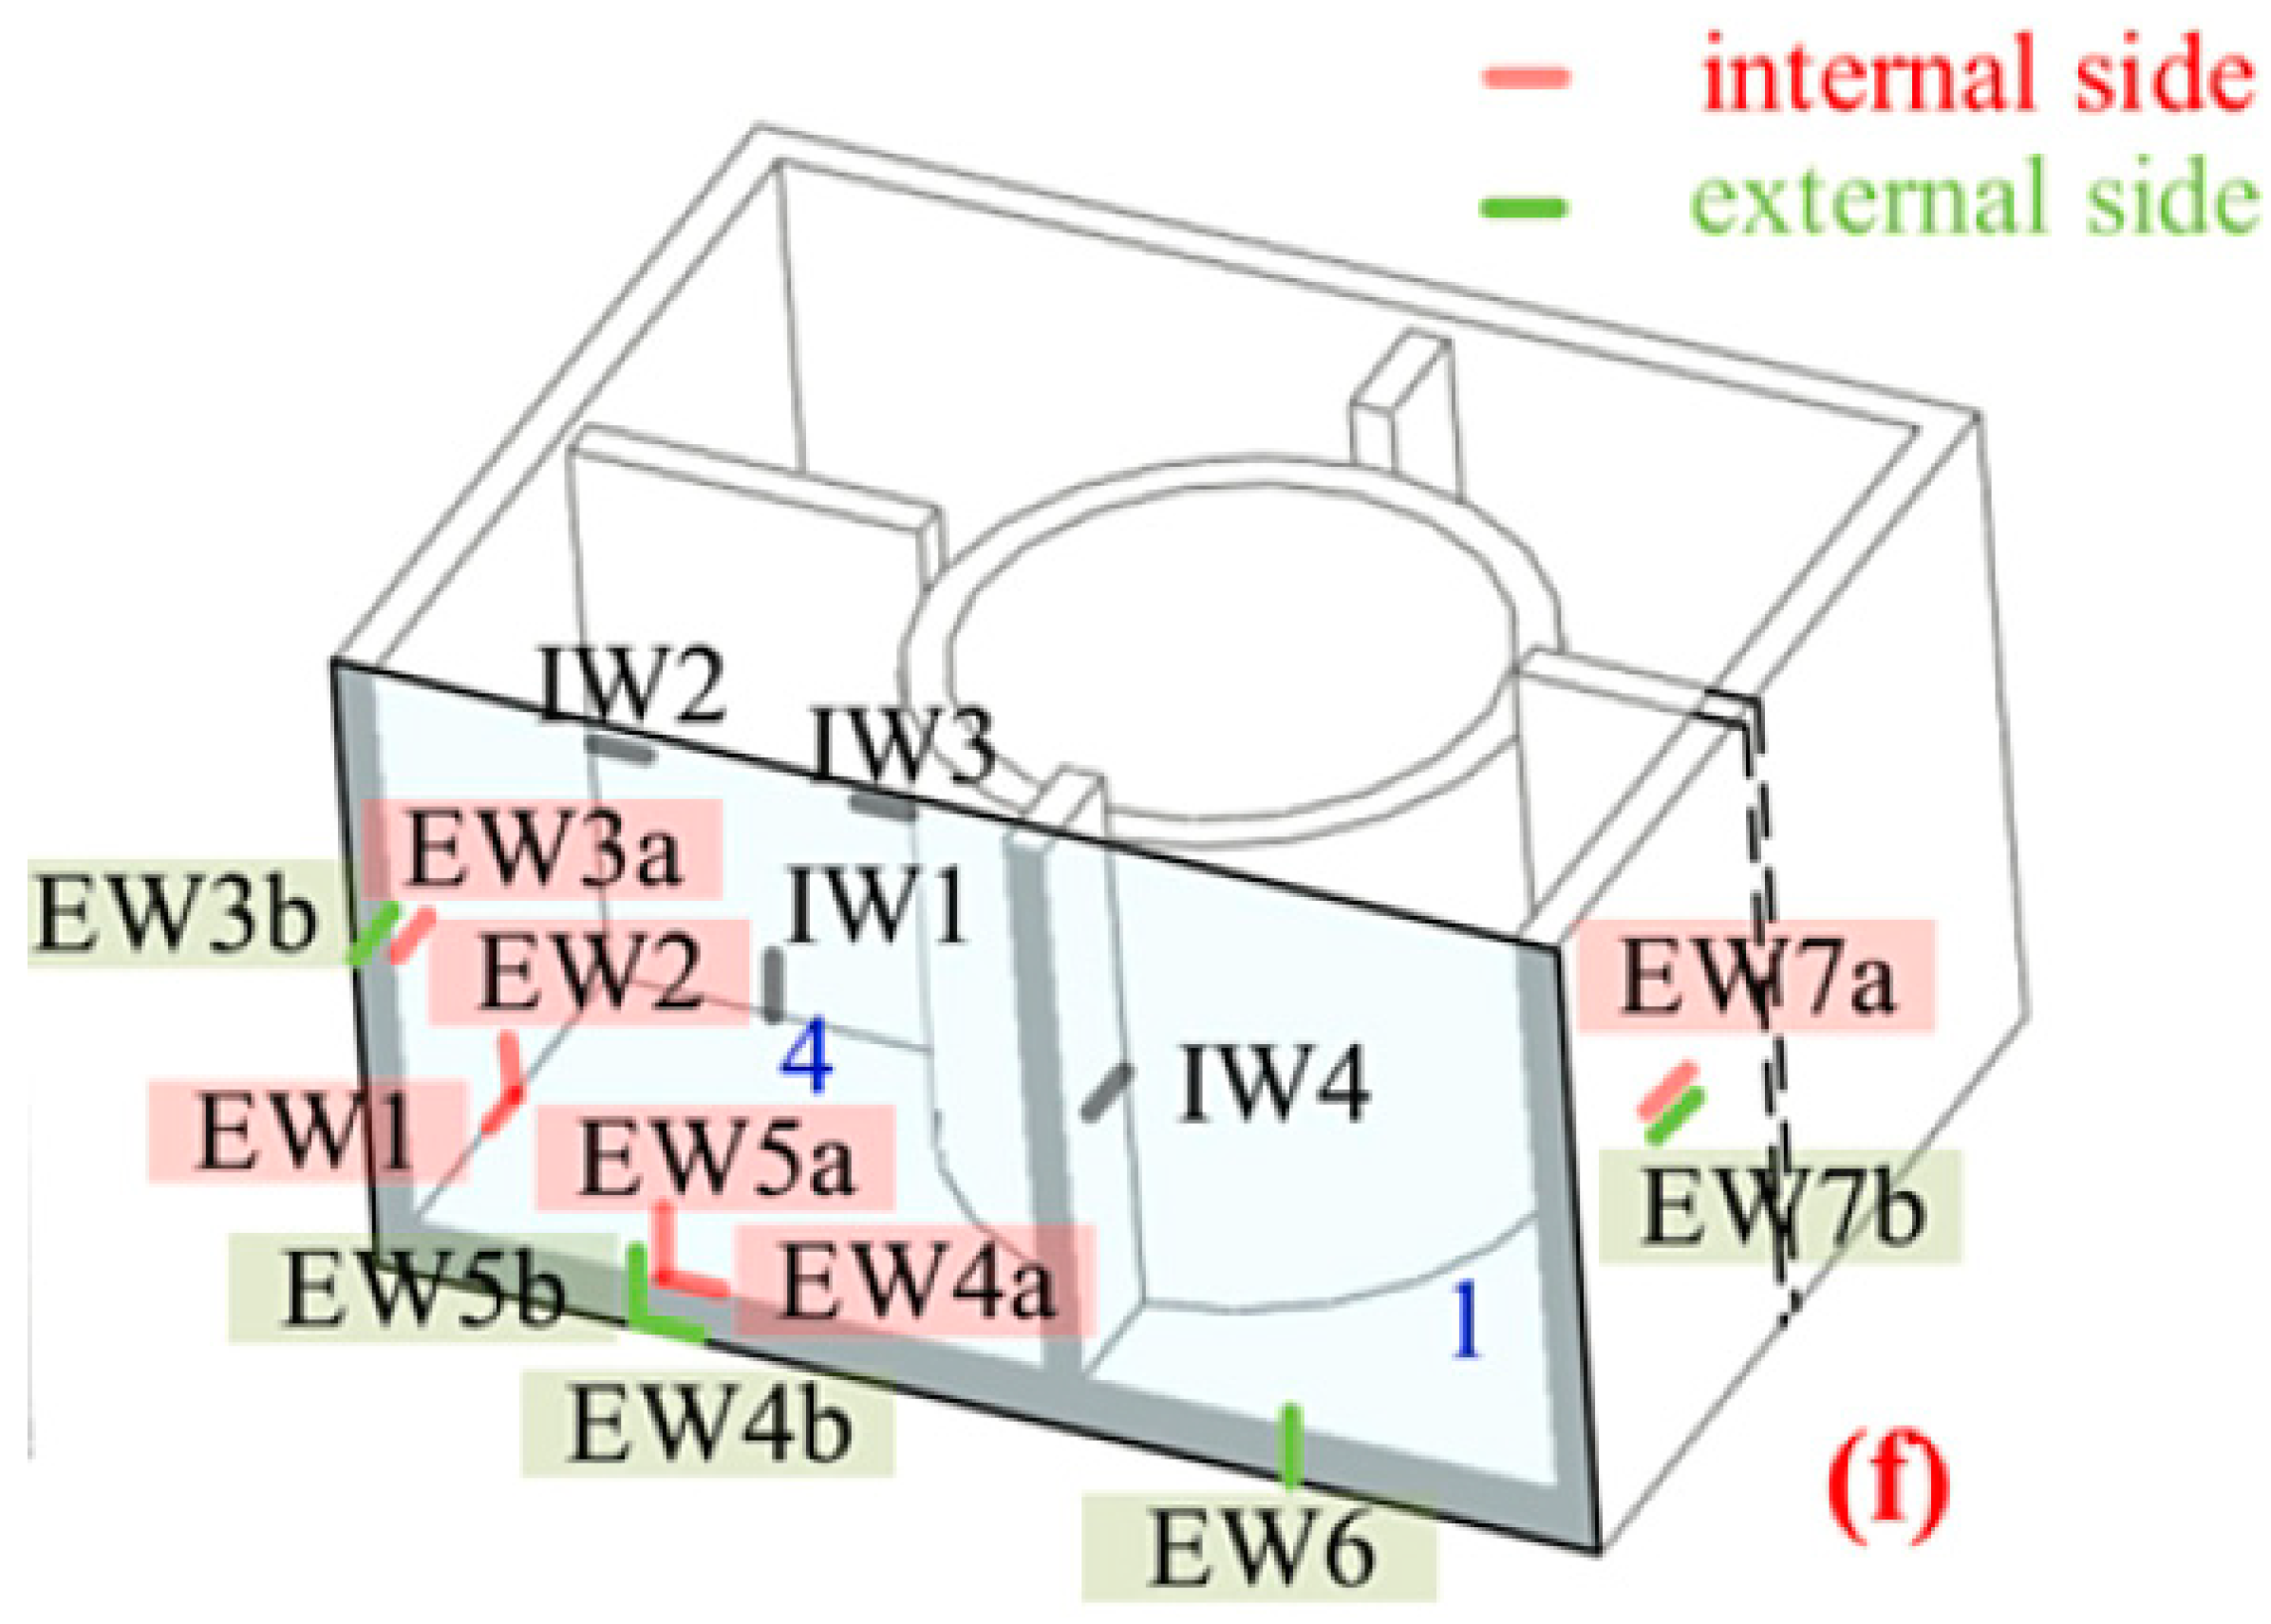
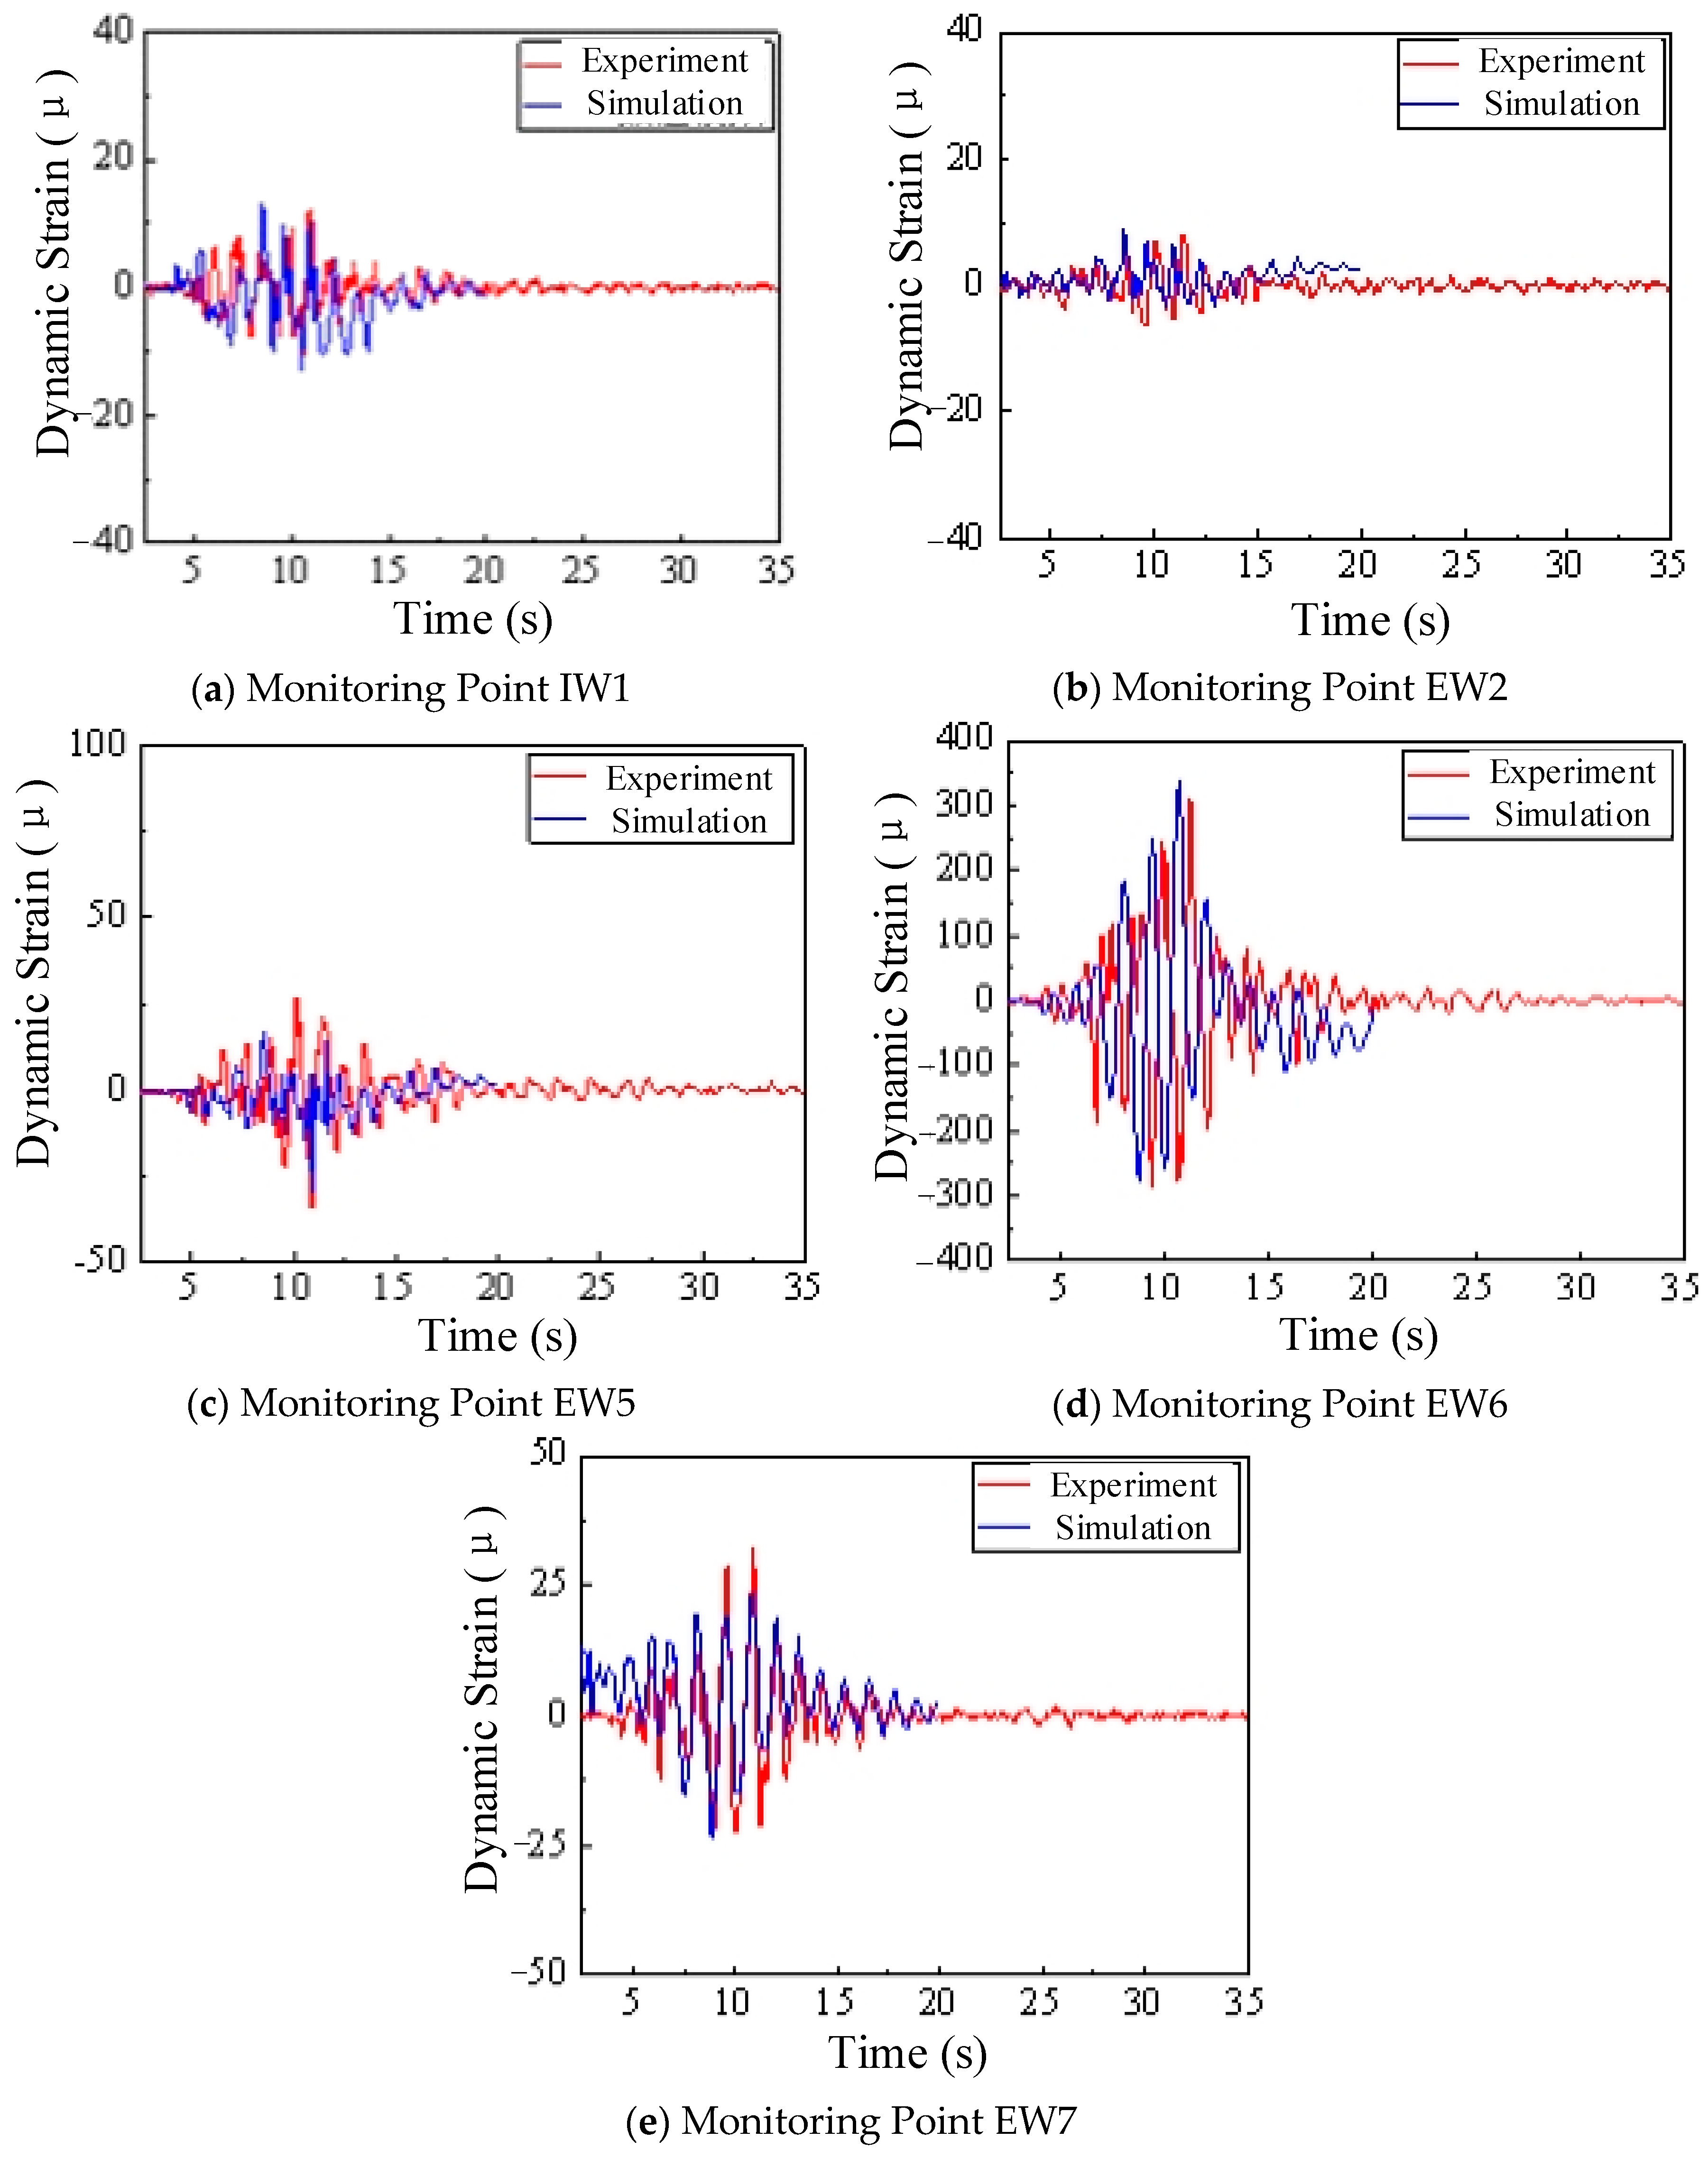
1.6.3. Structural Dynamic Strain

Figure 10 shows a schematic diagram of structural dynamic strain measurement points. For this comparison, locations 2, 9, 12, 16, and 20 (marked with red circles) were selected to compare the numerical results and experimental results of structural dynamic strain.
Figure 11 presents the structural dynamic strain from numerical simulations and model tests at monitoring points. As shown in this figure, the trends in structural dynamic strain in numerical simulations and model tests are consistent, and the peak strain values are similar. Overall, the numerical simulation results align well with the experimental results in terms of the variation patterns of structural dynamic strain. This indicates that the numerical model has a certain level of reliability for simulating the seismic response of structures under liquefiable interlayers, providing a technical foundation for further research in this direction.

2. Seismic Response Analysis of Site-Embedded NPP Structural Systems

Seven reference points were selected for the auxiliary buildings, with their locations shown in Figure 12a. Three reference points were selected for the safety shell, with their locations shown in Figure 12b. The effects of different embedment depths on the seismic response of the embedded nuclear power plant structures under non-rock site conditions were comprehensively evaluated using three indicators: floor acceleration, floor spectral acceleration, and inter-story displacement. Monitoring points A, B, and C are strategically positioned at the center of the structure’s base, the apex of the internal containment structure, and the centroid of the containment shell, respectively.

2.1. Auxiliary Building

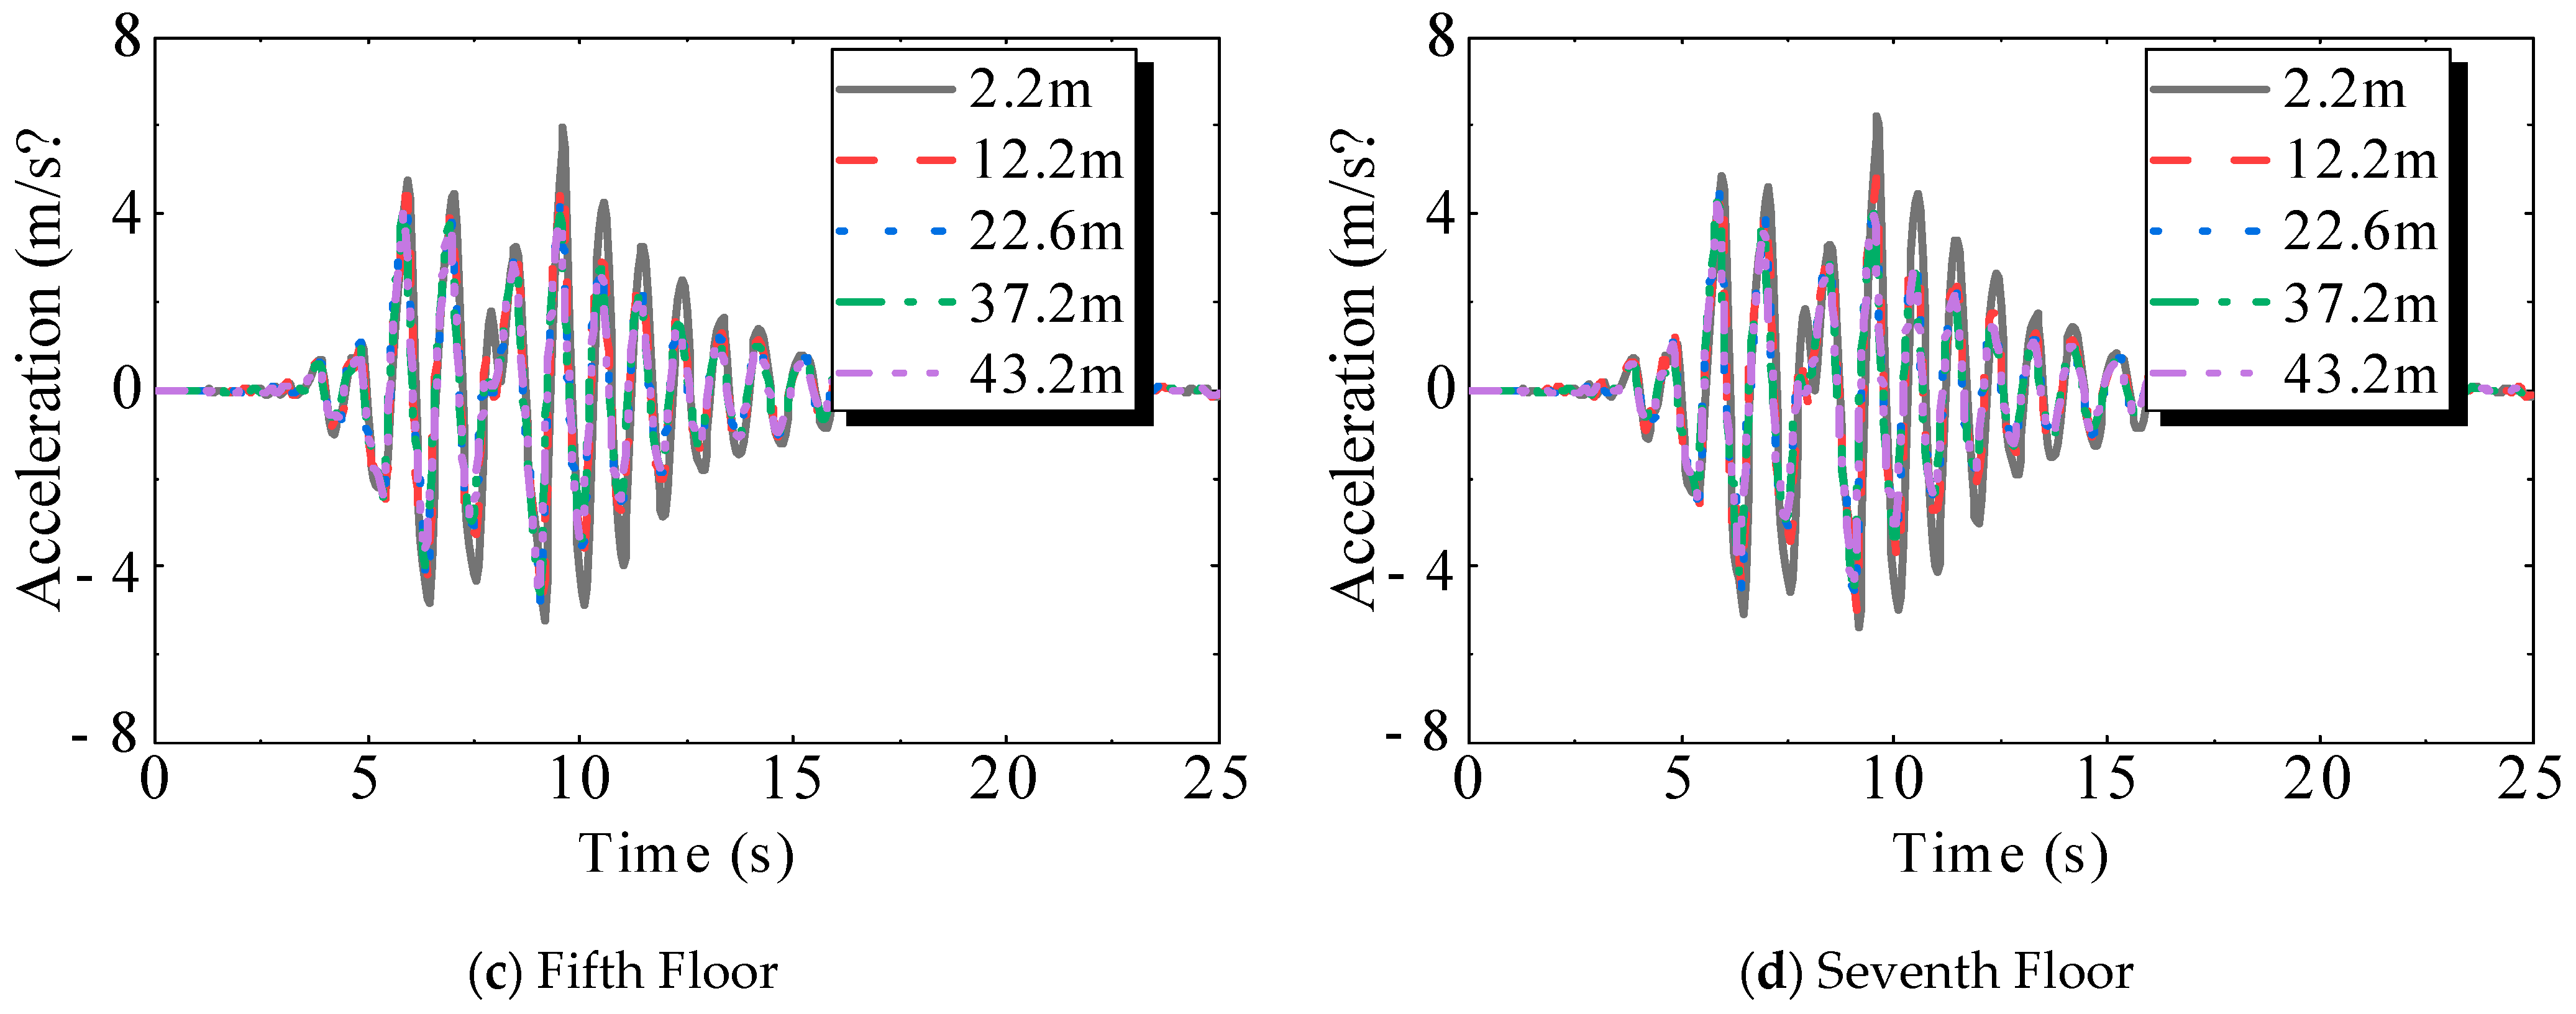
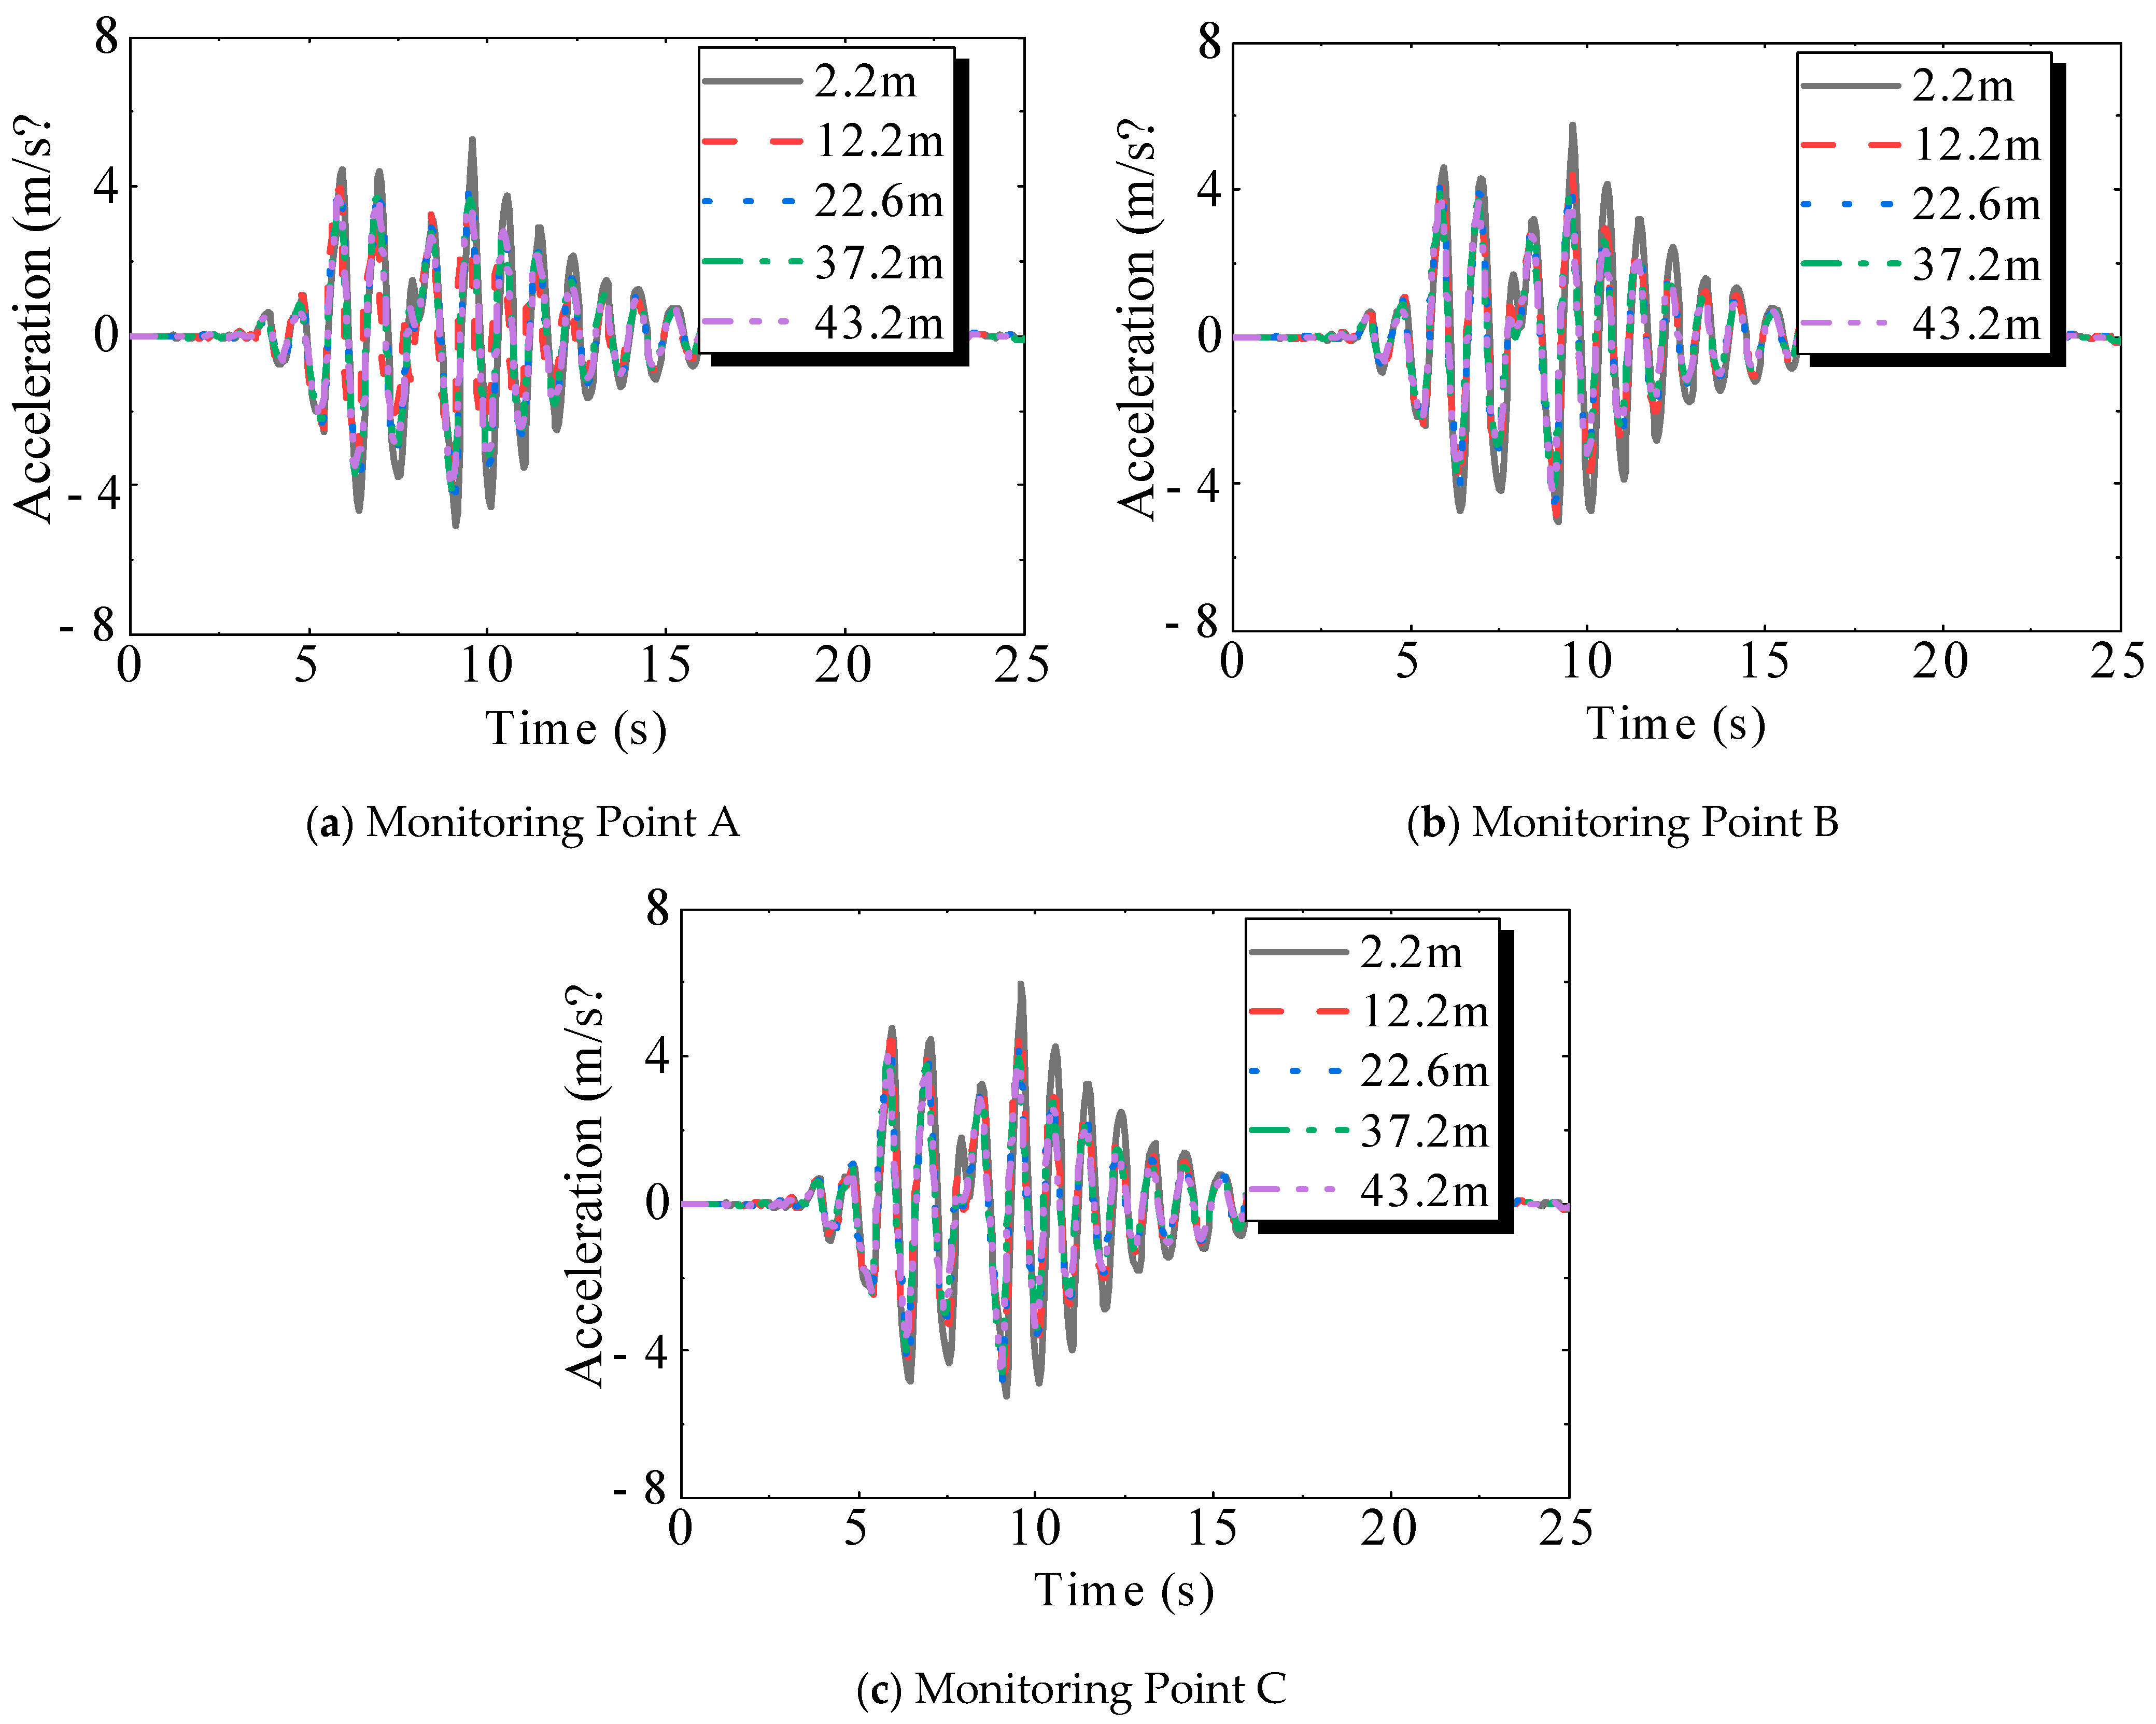
2.1.1. Acceleration of Floors

Figure 13 shows the acceleration time history curves of building floors, and Figure 14 shows the corresponding peak acceleration responses on each floor. It can be seen that the acceleration of the building structure is affected by the embedment depth. Under exposed conditions, the amplification effects on the structure’s acceleration are more pronounced, and the peak acceleration gradually increases with the number of floors. Under deep embedment conditions, the amplitude of the acceleration response is significantly reduced and is less affected by the variation in the number of floors. Overall, the building’s acceleration decreases as the embedment depth increases, and deep embedment is beneficial to structural safety.

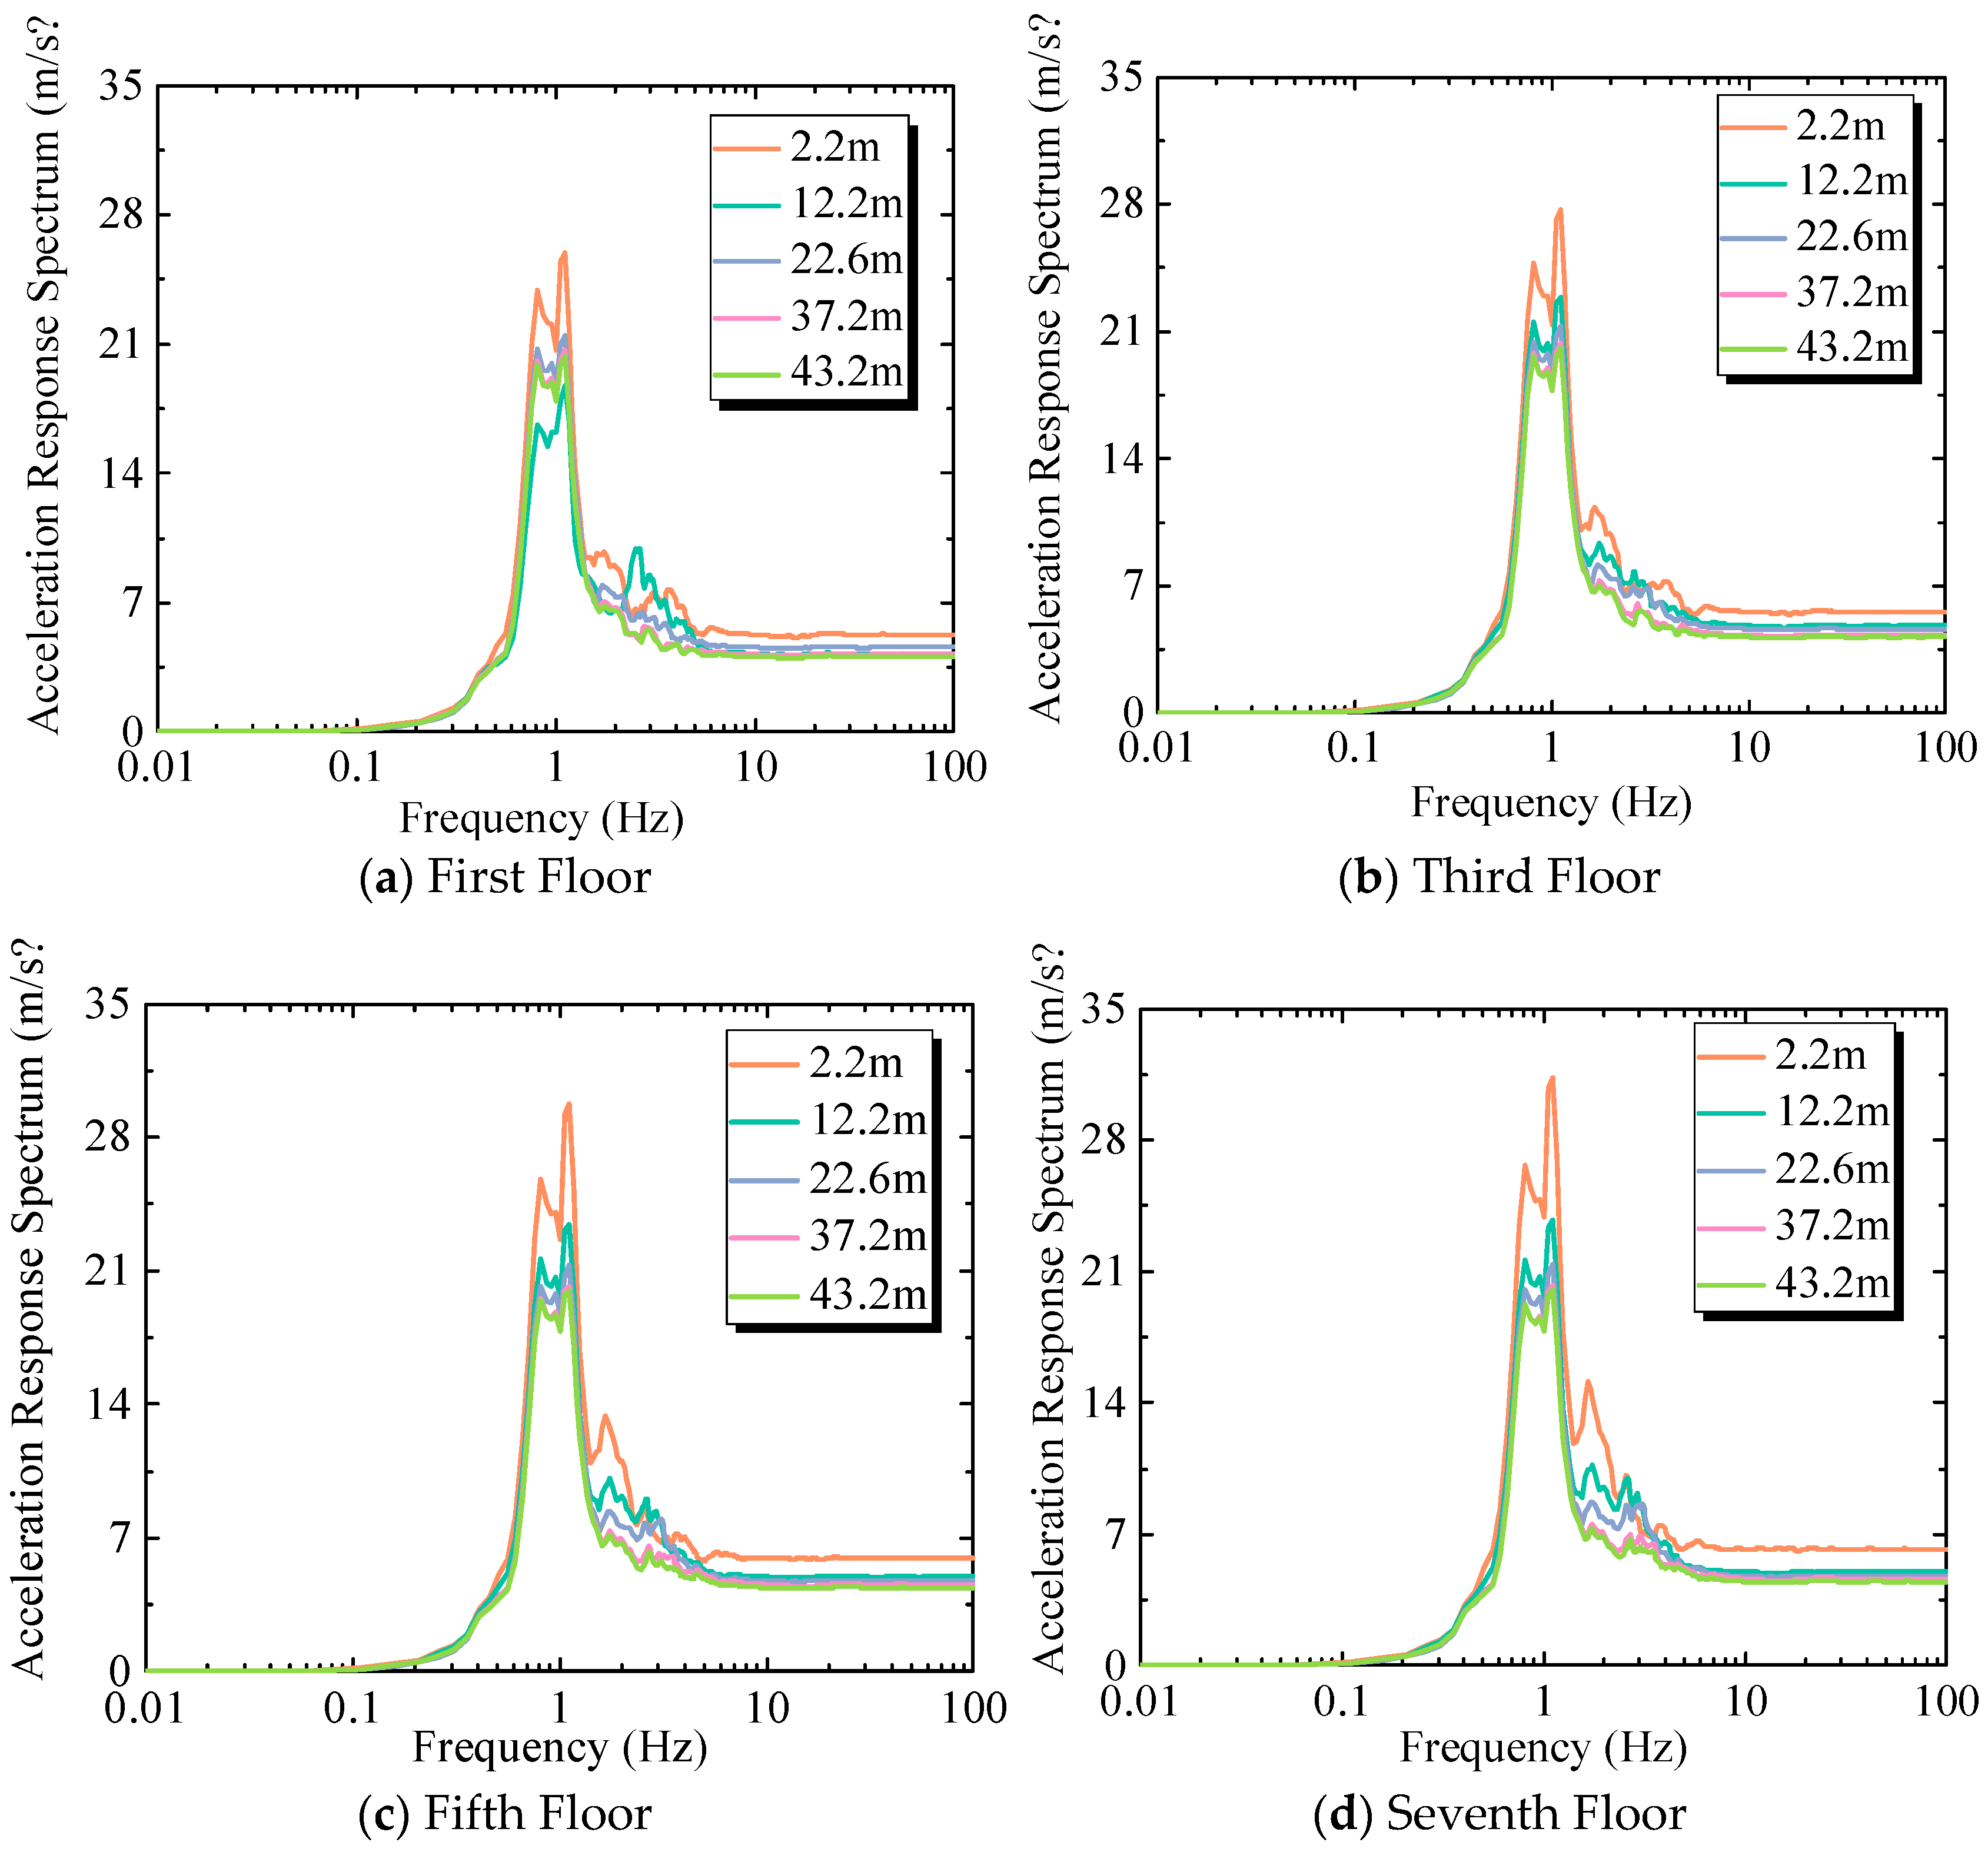
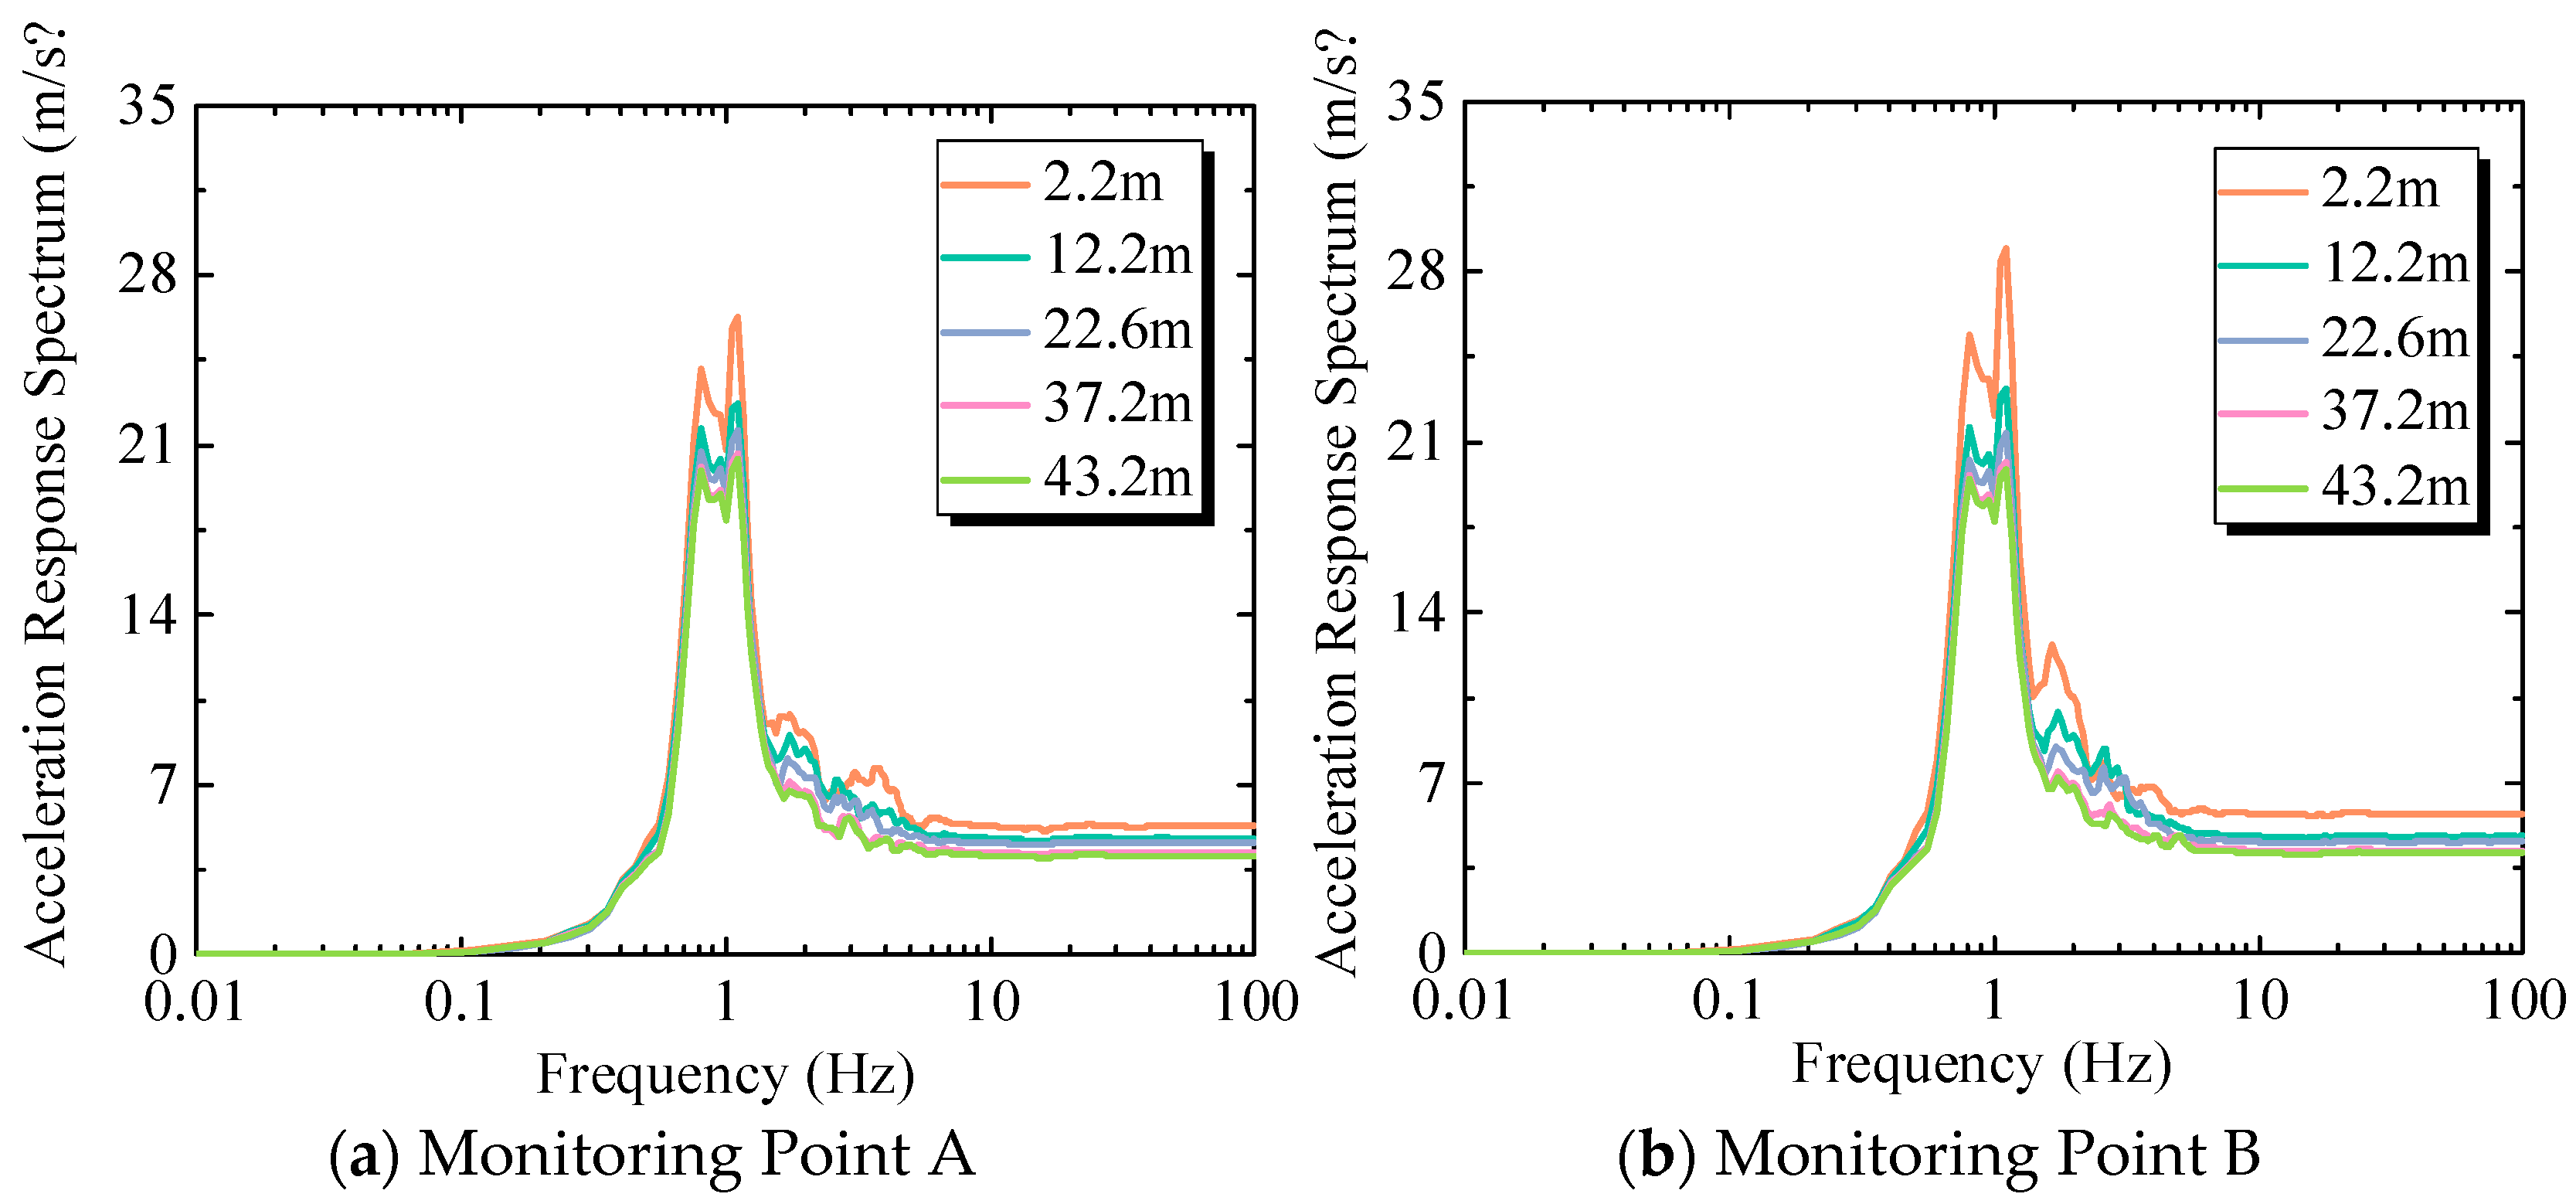
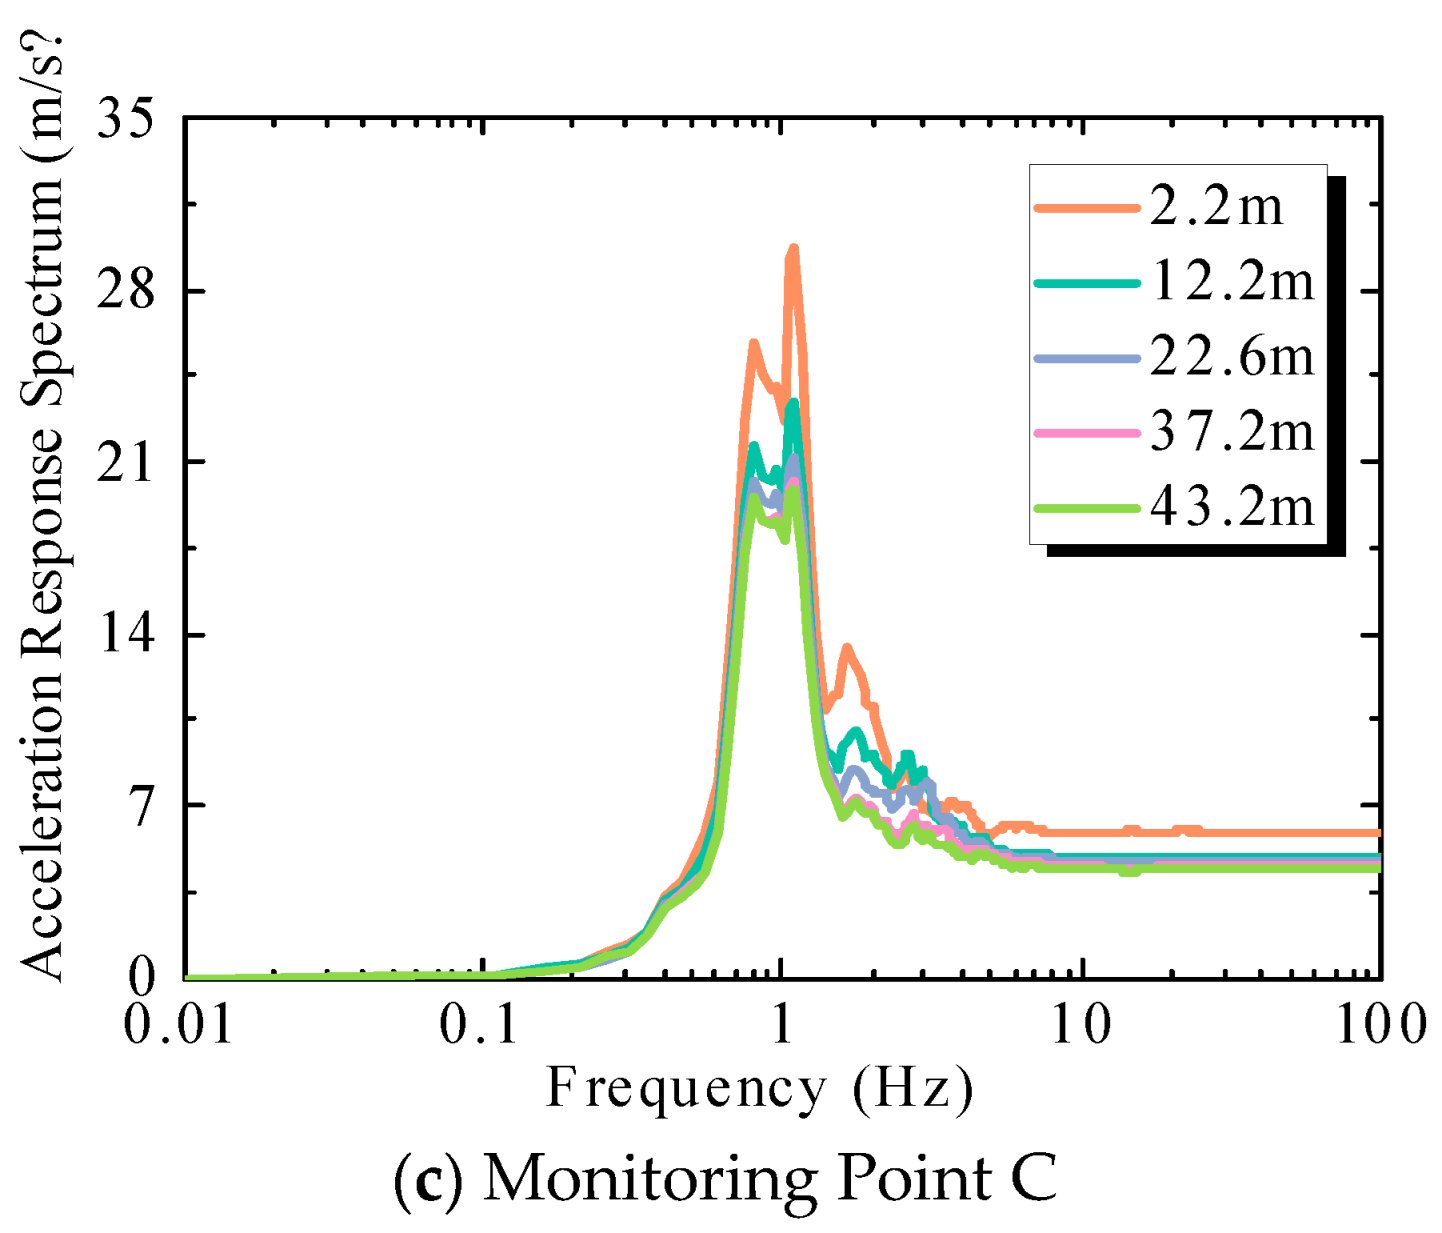
2.1.2. Acceleration Response Spectrum of Floors

Figure 15 presents the floor response spectra of the factory structure. It can be observed that different embedment depths have little effect on the 0–0.5 Hz frequency range, where the floor spectra nearly coincide. However, embedment depth significantly influences the frequency range corresponding to the spectral peak, with the peak frequency shifting to lower frequencies as the embedment depth increases. Above 10 Hz, the impact of varying embedment depths on the floor response spectrum tends to stabilize. Overall, with increasing embedment depth, the spectral peak gradually decreases, indicating that deeper embedment conditions are beneficial to the floor response of the factory structure.

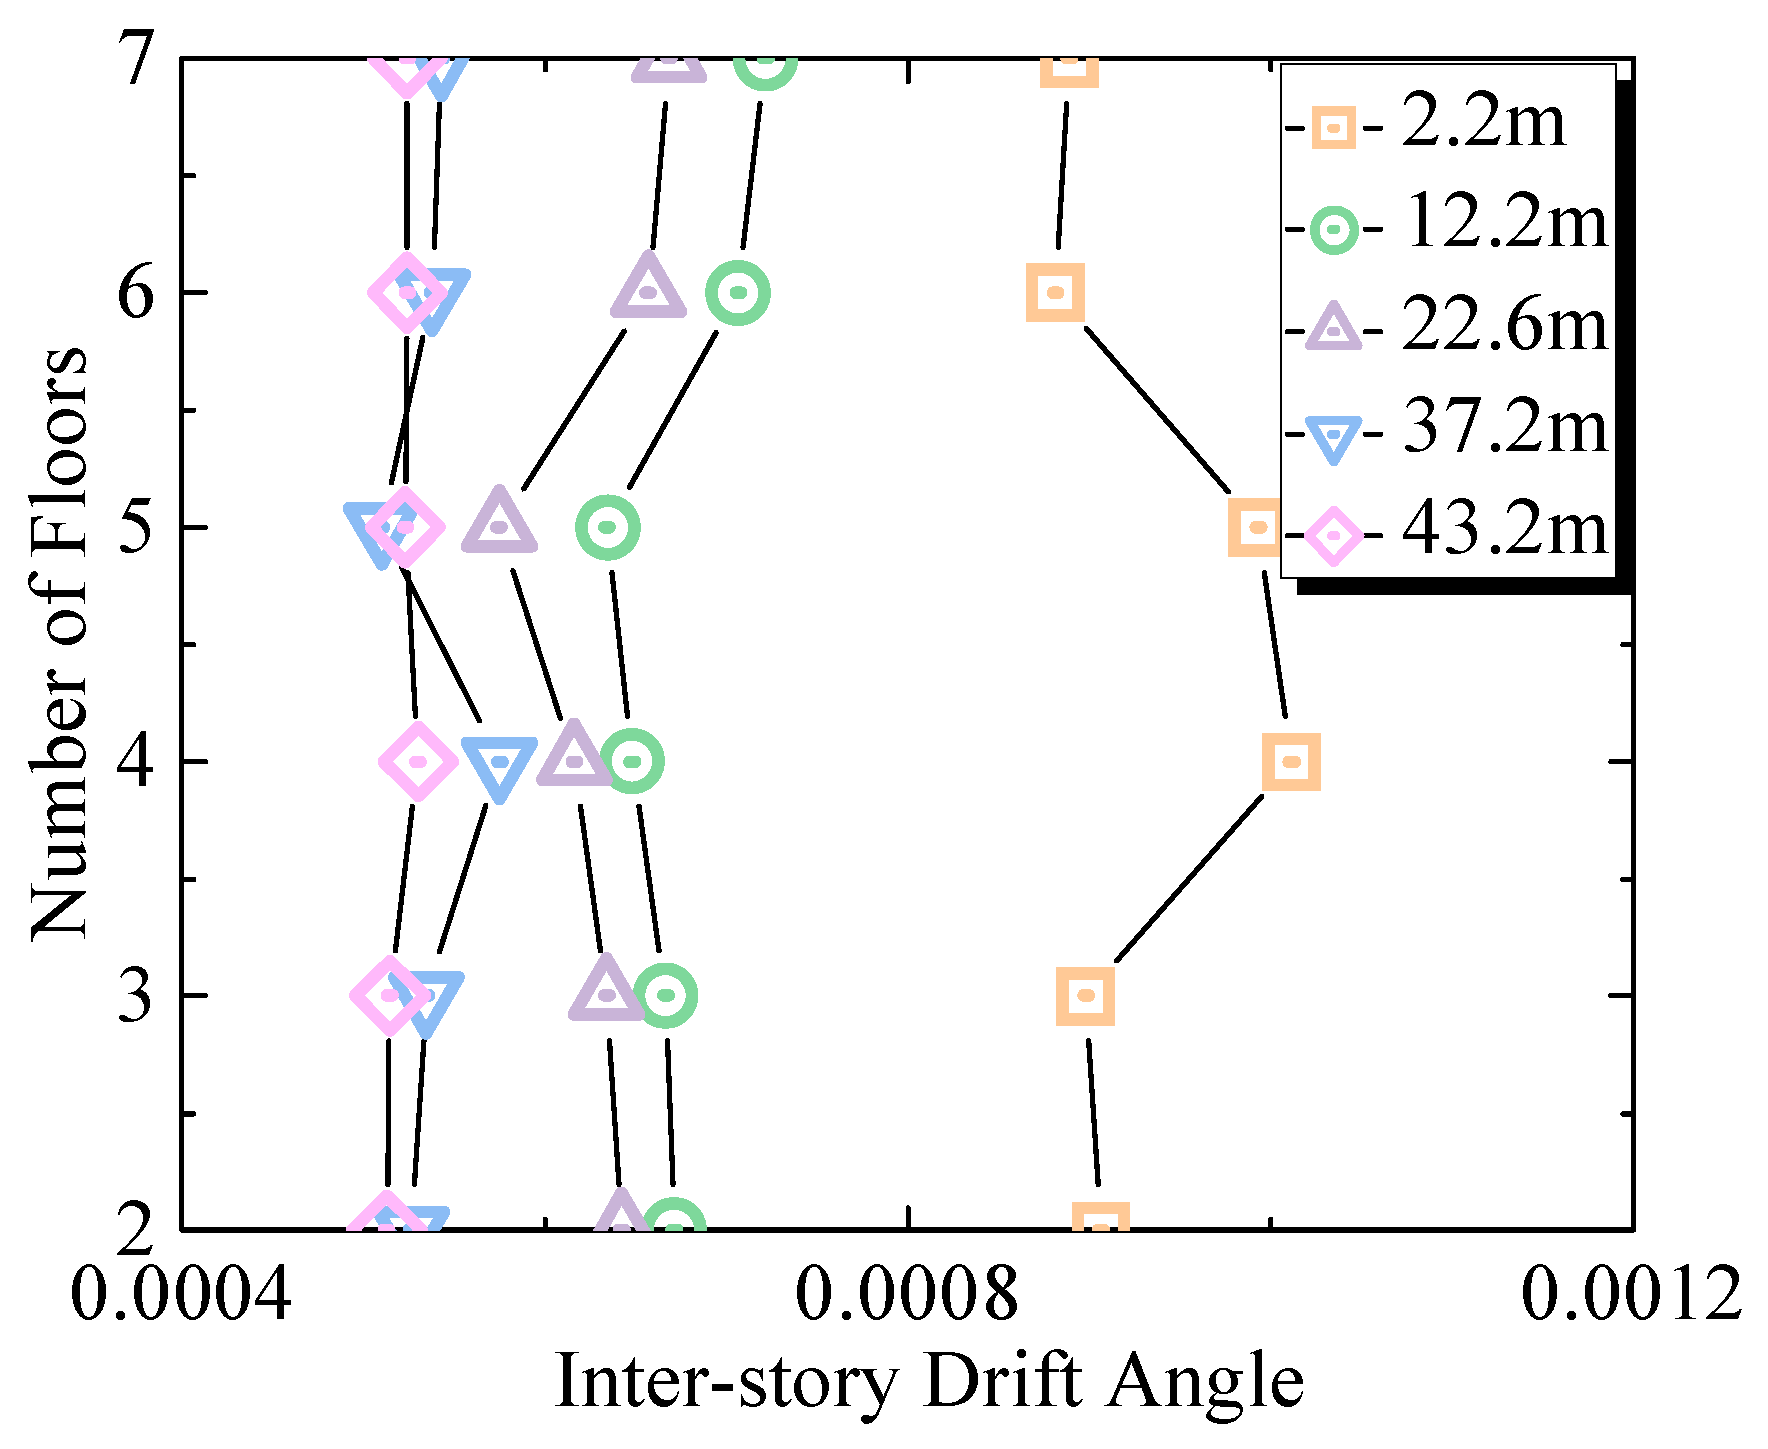
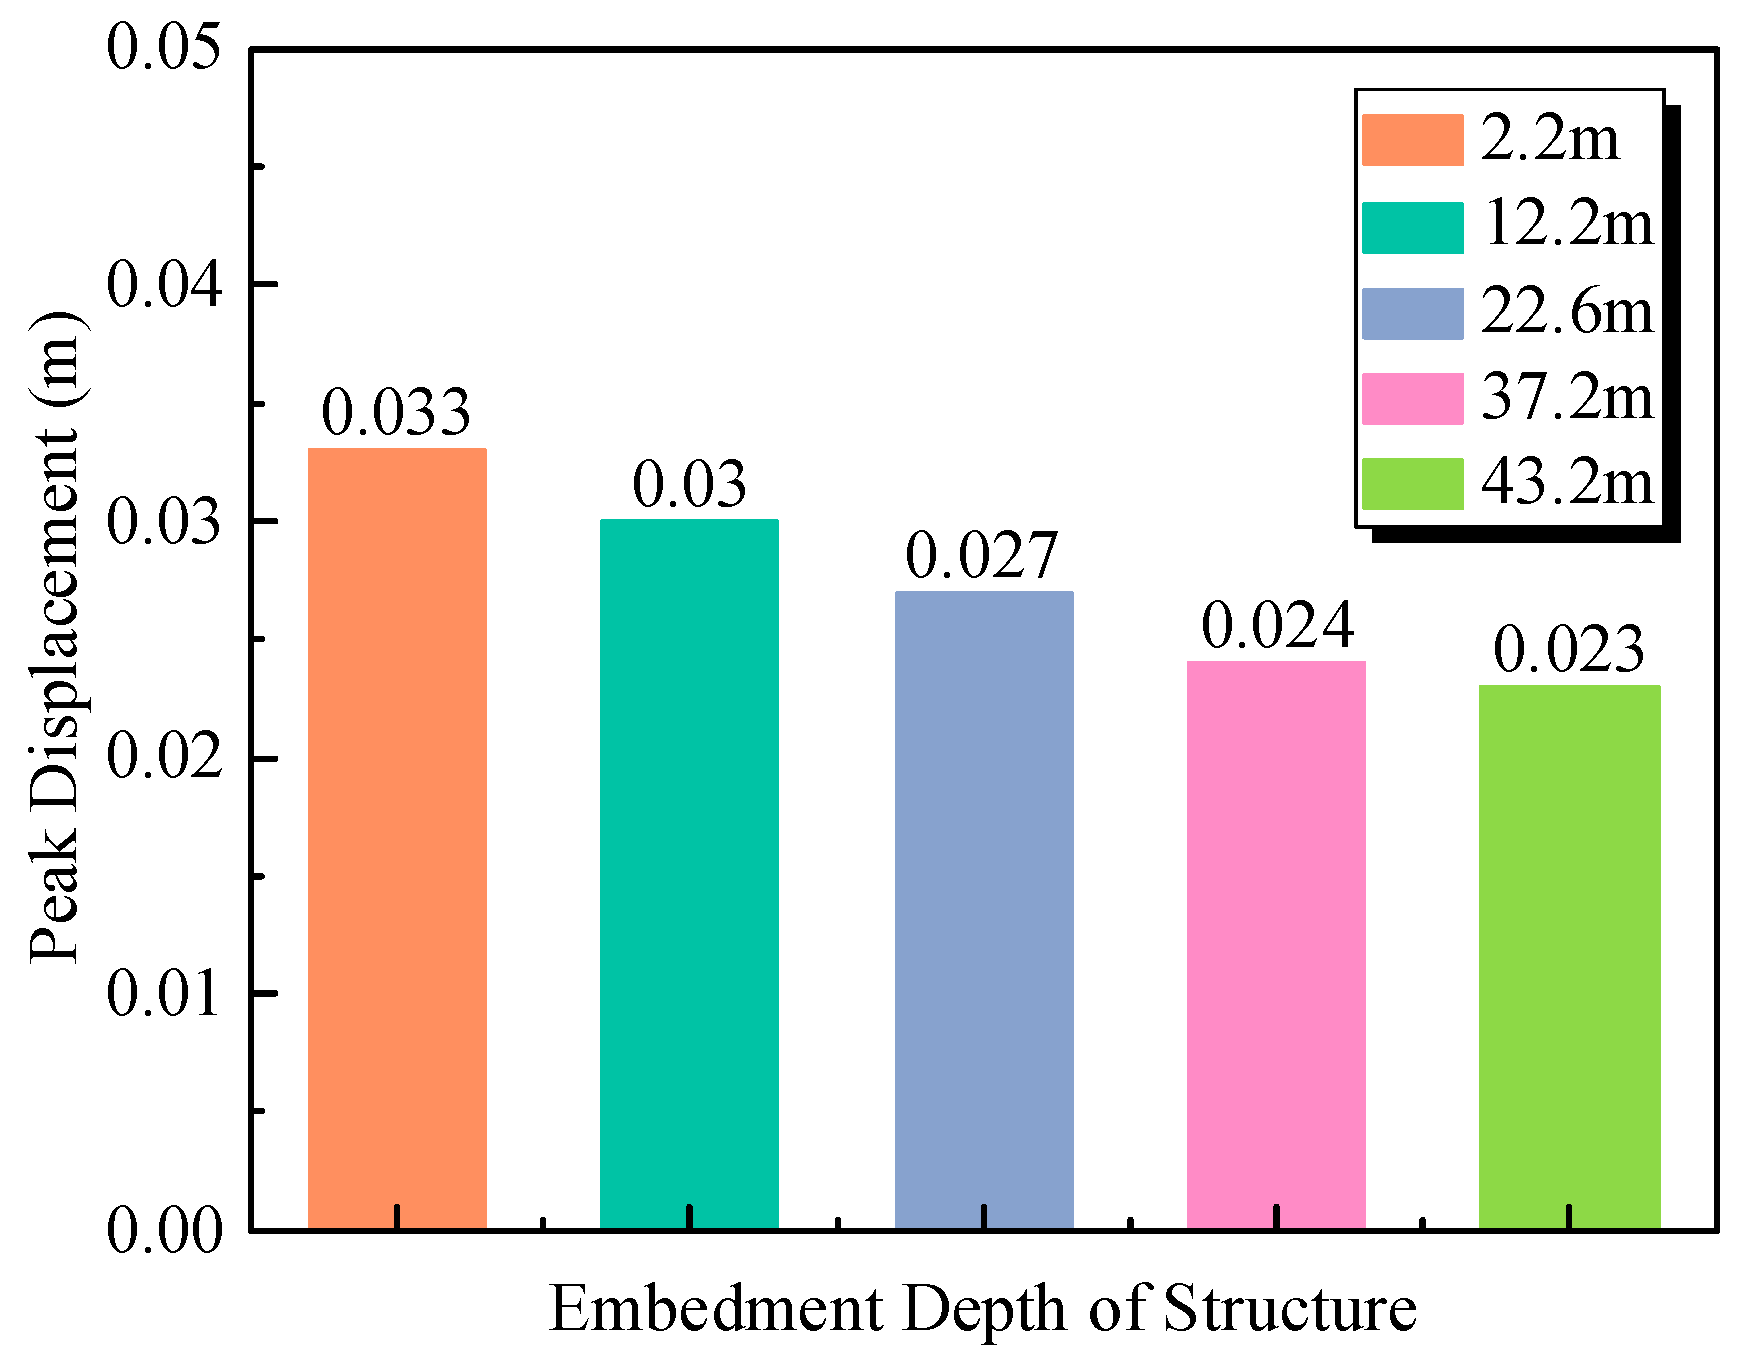
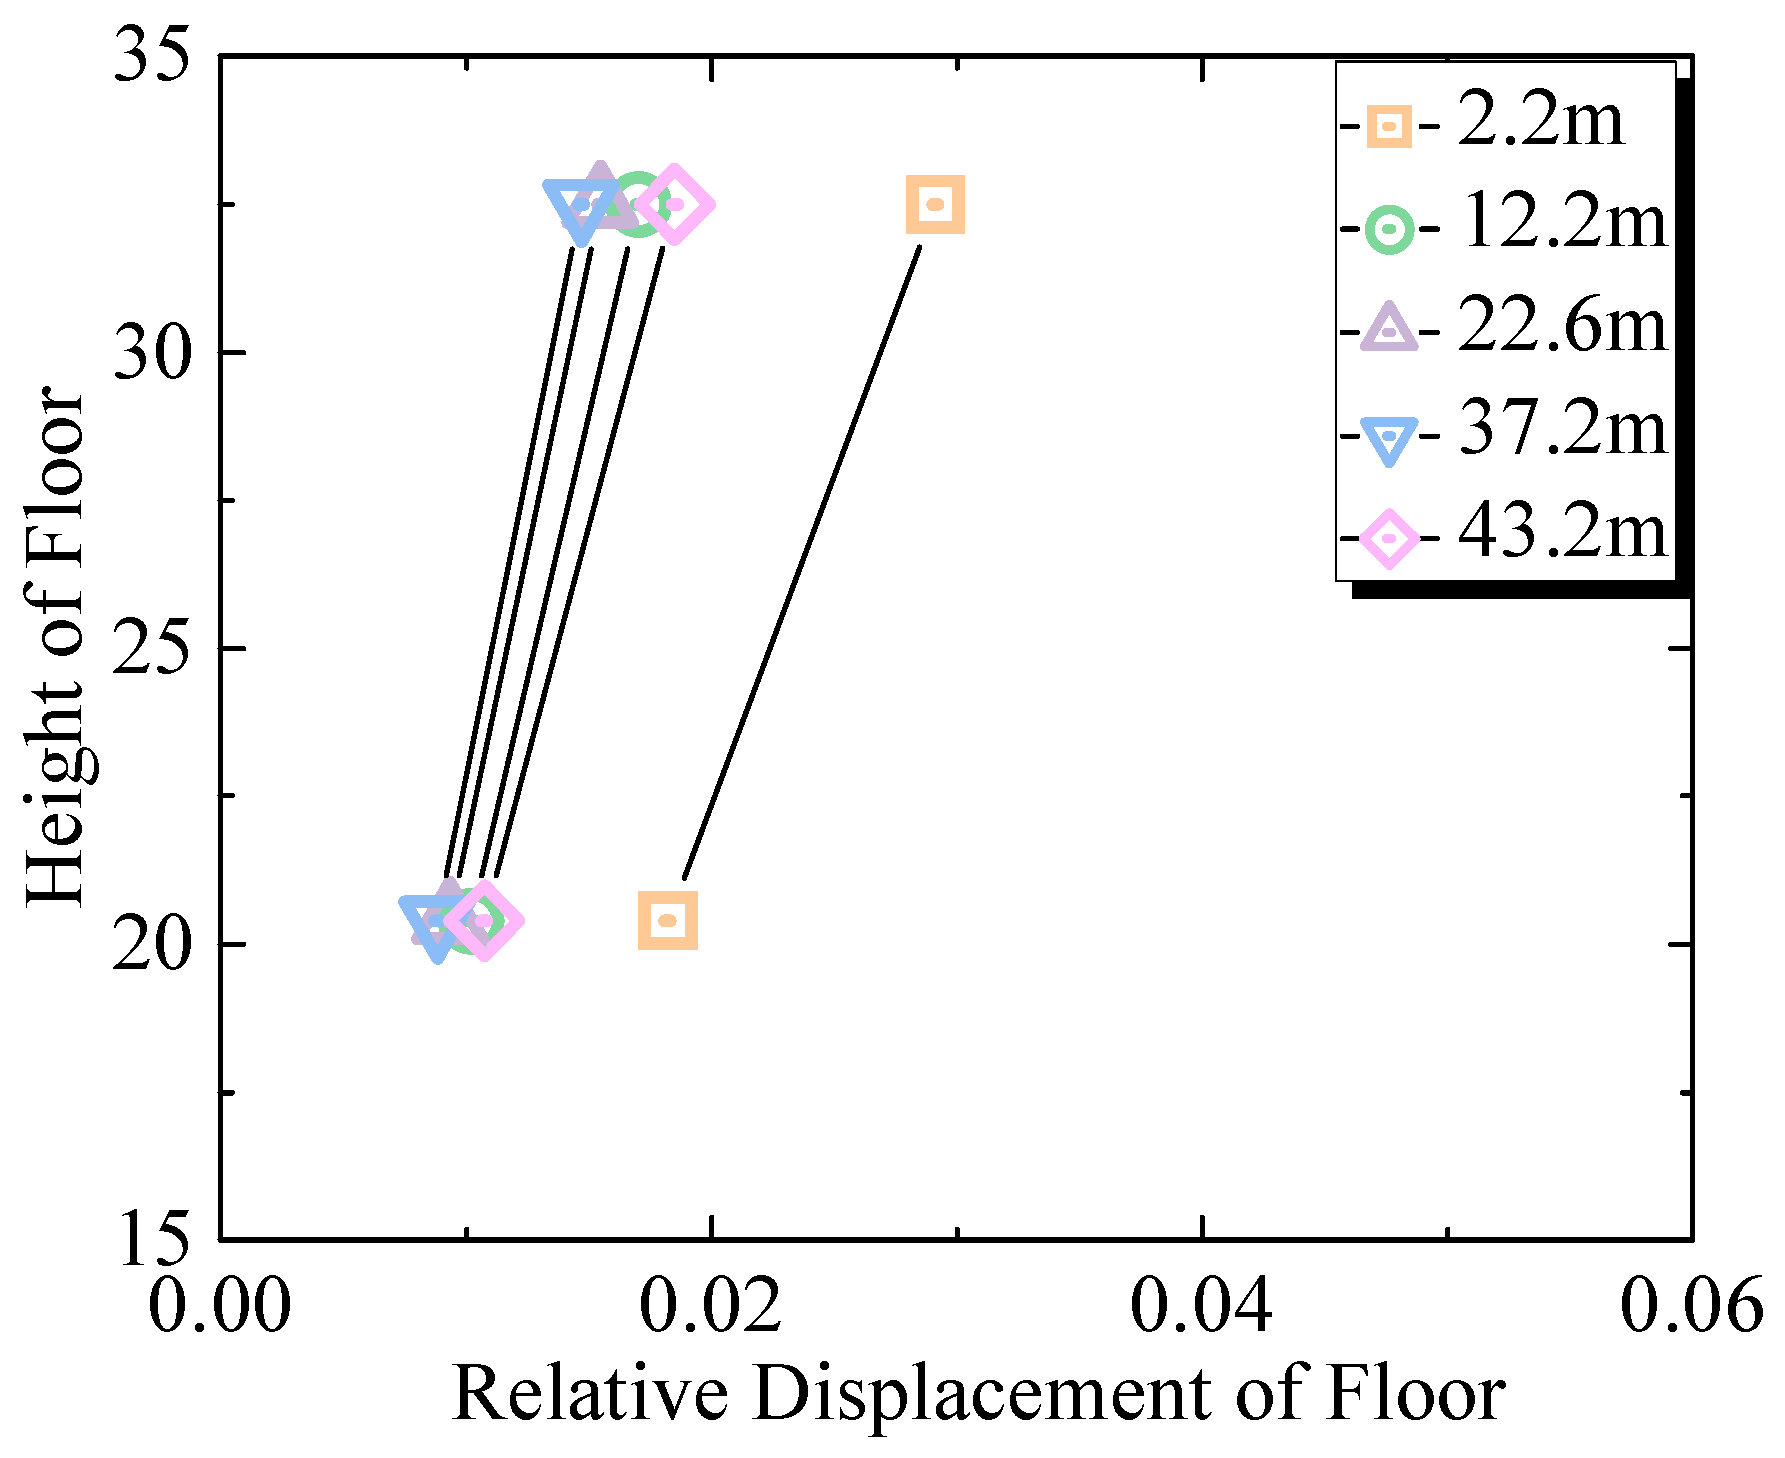
2.1.3. Relative Displacement of Floors

Figure 16 presents the relative displacement distribution along the floors of the factory structure, and Figure 17 shows the peak relative displacement. It can be seen that as the embedment depth increases, the relative displacement of the factory structure gradually decreases. When the embedment depth exceeds 37.2 m, the effects of varying embedment depths on the relative displacement along the floors become relatively minor. Moreover, the structure’s peak displacement response gradually decreases with increasing embedment depth. Compared to the exposed condition, embedment reduces the peak displacement response by up to approximately 30%.

2.2. Containment Structure
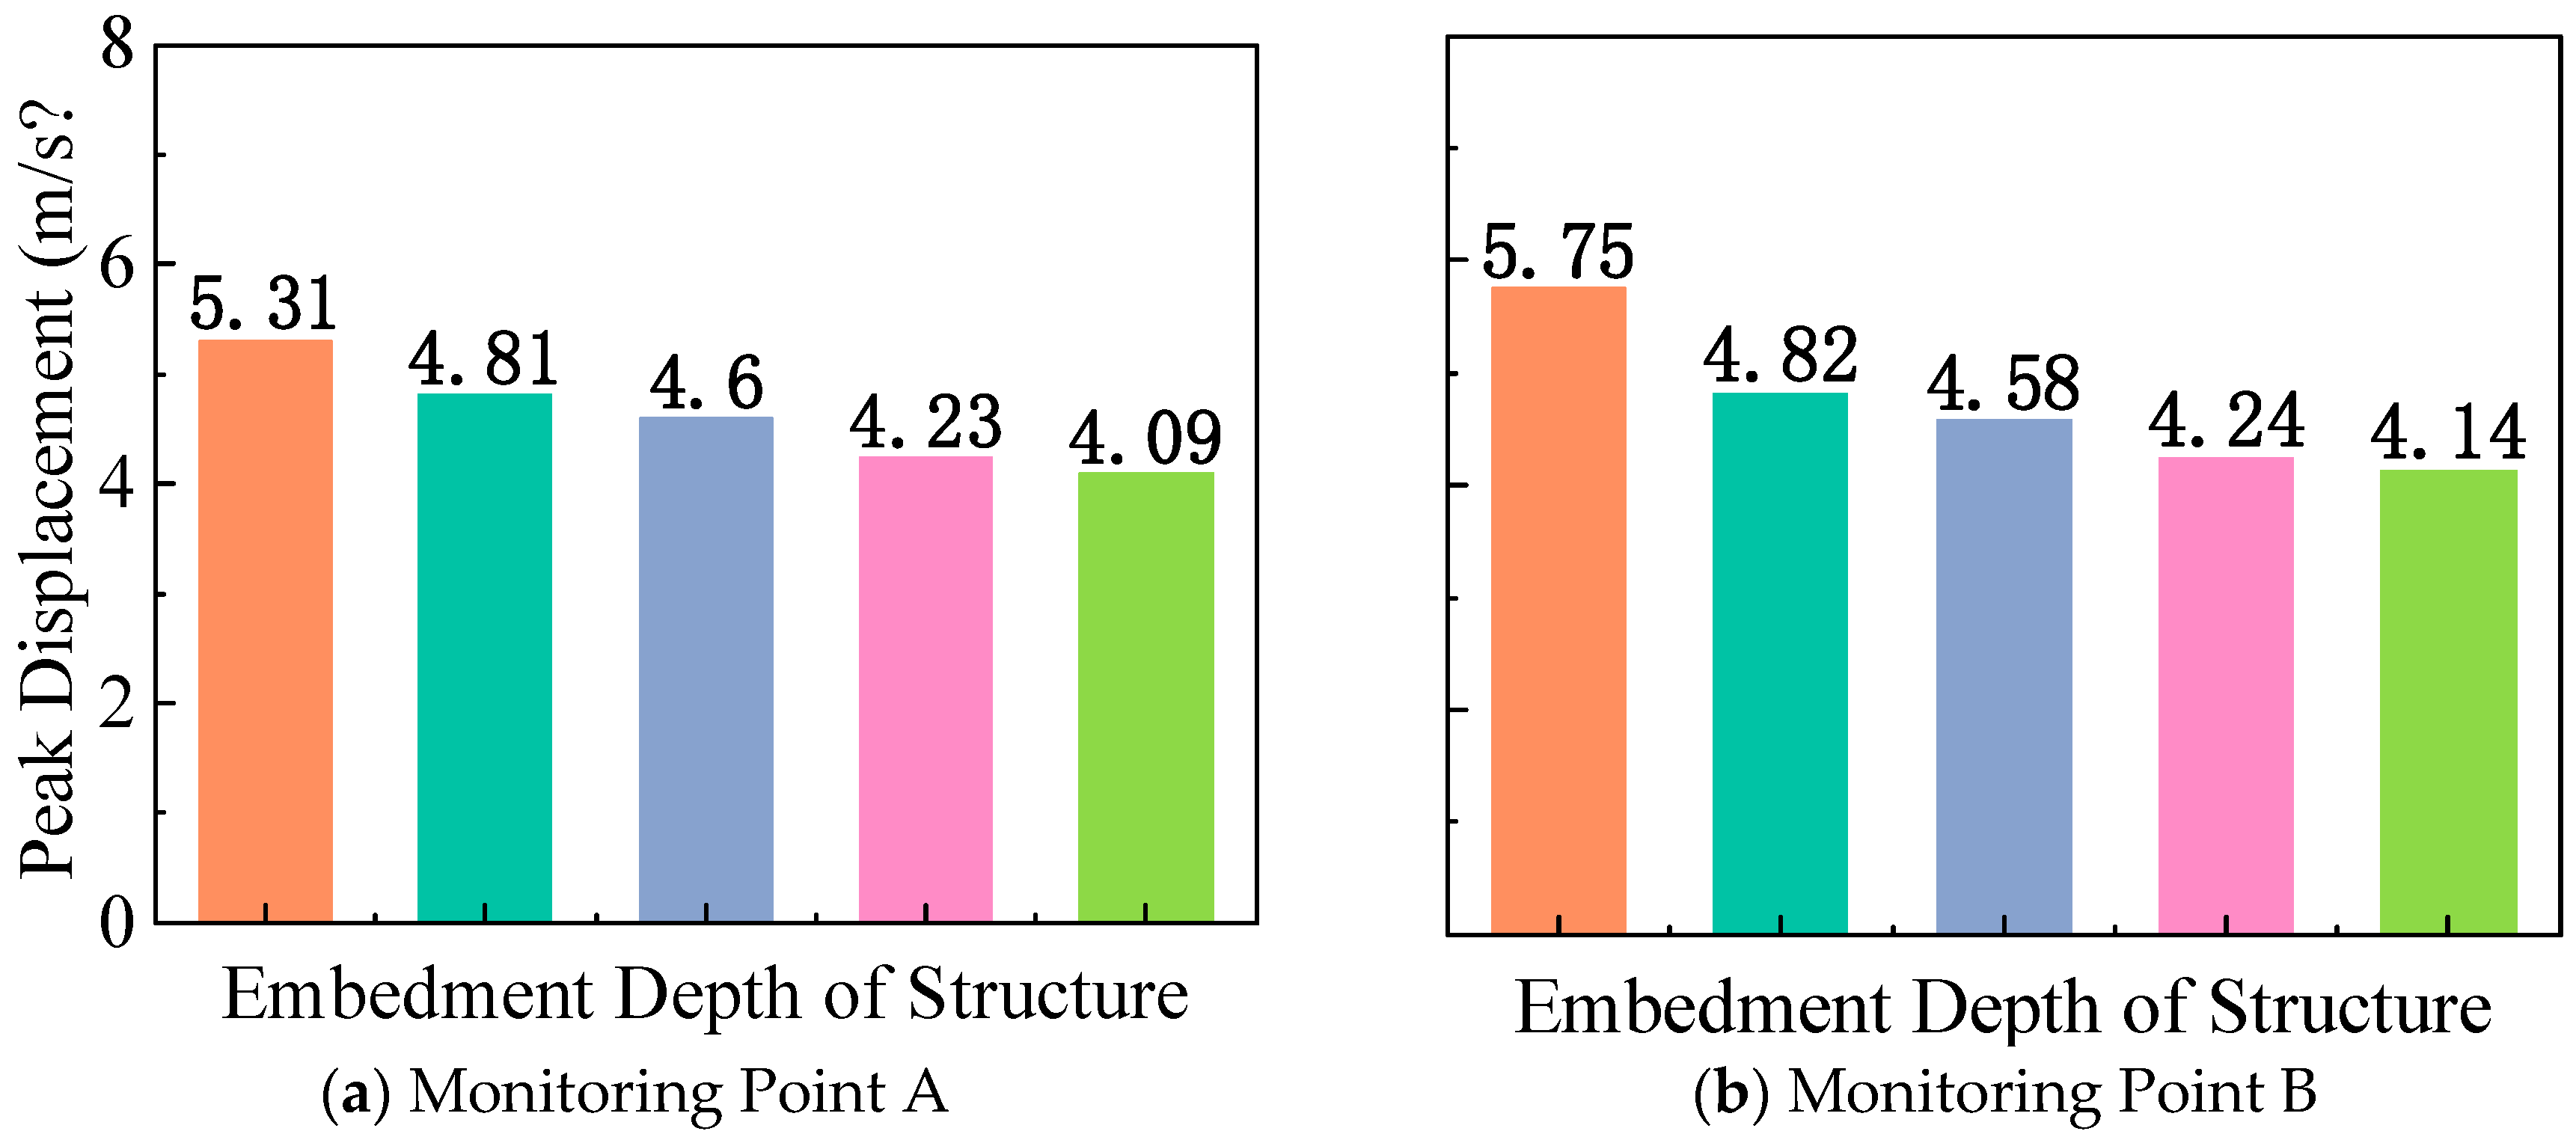
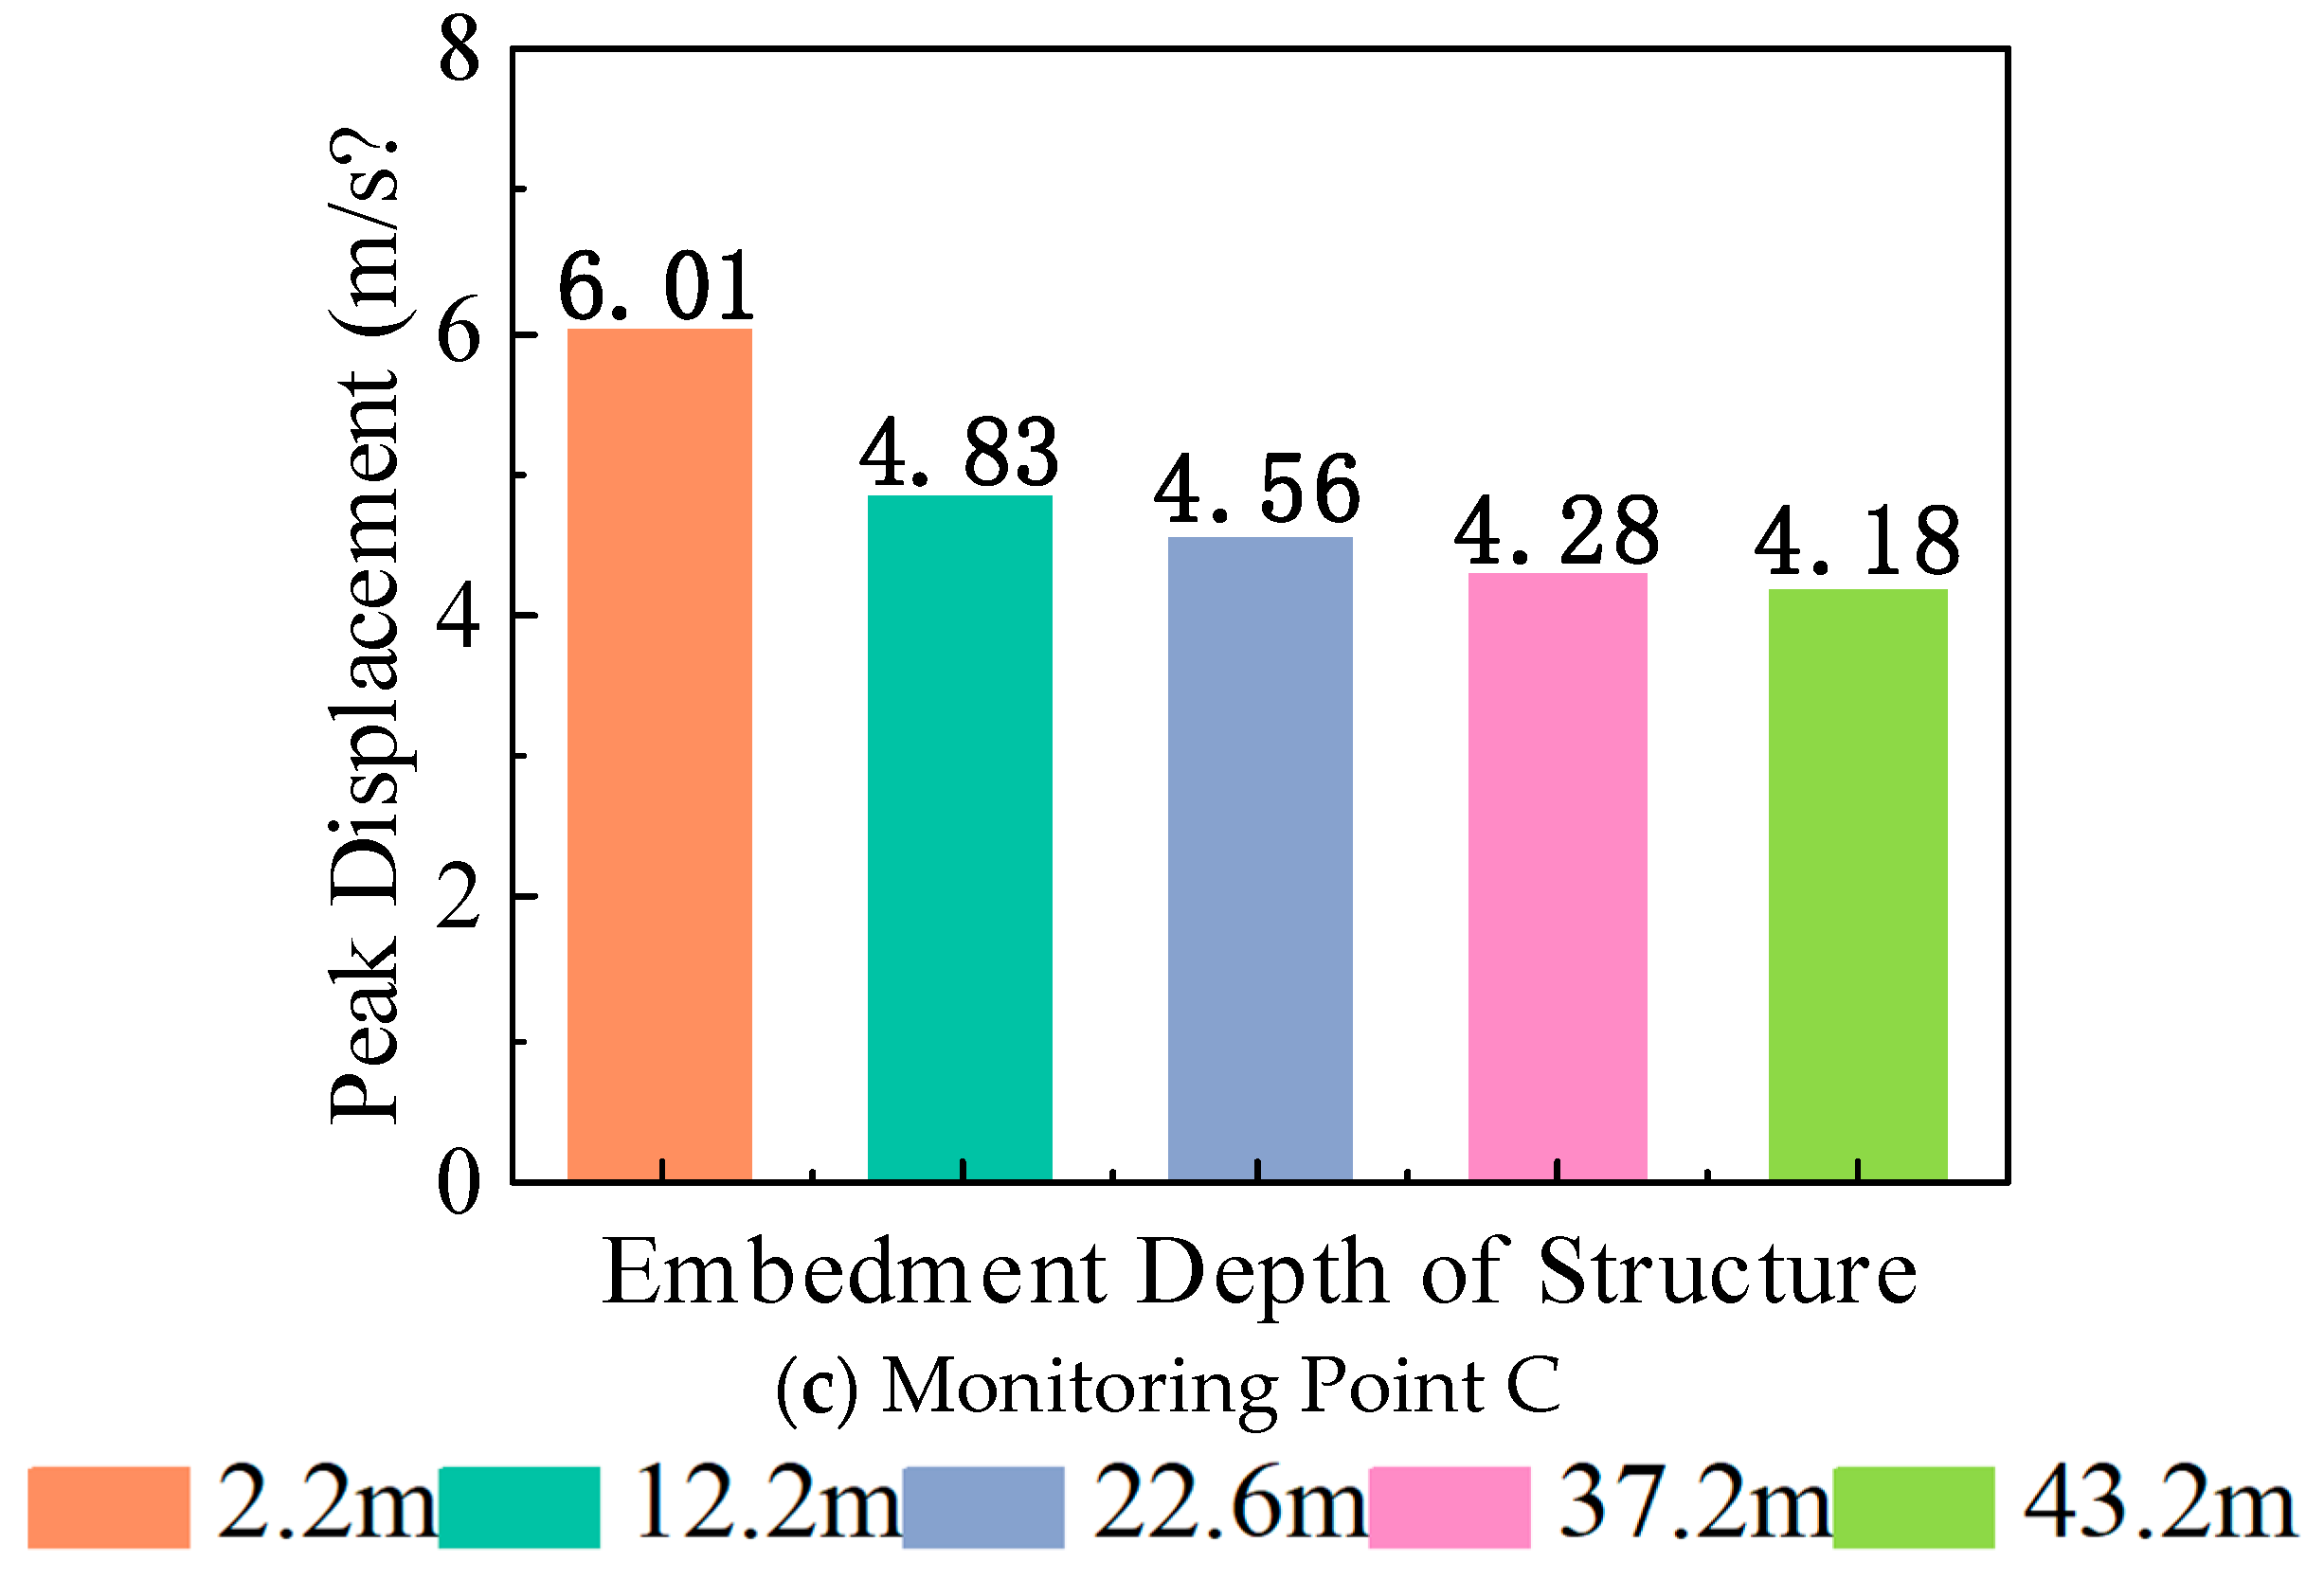
2.2.1. Acceleration

Figure 18 shows the acceleration time history curves for the floors of the safety shell structure, while Figure 19 presents the corresponding peak acceleration responses. It can be seen that the acceleration of the safety shell structure is influenced by embedment depth, following the same trend as the factory structure. In other words, as embedment depth increases, the acceleration of the safety shell structure gradually decreases. Deep embedment can reduce the peak floor acceleration of the safety shell structure by up to approximately 30% compared to the exposed condition.

2.2.2. Acceleration Response Spectrum

Figure 20 presents the floor response spectra of the safety shell structure. It can be observed that in the 0–1 Hz frequency range, the floor spectra nearly coincide under different embedment depth conditions, indicating that the influence of embedment depth can be neglected in this range. However, the effects of varying embedment depths on the frequency range corresponding to the peak of the spectra are significant, with the peak frequency shifting toward lower frequencies. Similar to the factory structure, when frequencies exceed 10 Hz, the impact of different embedment depths tends to stabilize. Overall, the seismic response indicated by the floor spectra decreases as the embedment depth increases.

2.2.3. Relative Displacement

Figure 21 shows the relative displacement distribution of the safety shell structure along the floors, and Figure 22 shows the peak relative displacement of the safety shell structure. It can be observed that as the embedment depth increases, the relative displacement of the safety shell structure gradually decreases. When the embedment depth exceeds 22.6 m, the influence on the structure’s floor relative displacement by different embedment depths becomes minimal. Furthermore, the structural peak displacement response gradually decreases with increased embedment depth. Compared to the aboveground condition, embedment can reduce the peak displacement response by up to approximately 44.8%.

3. Seismic Response Analysis of Site-Embedded Nuclear Power Structure Systems with Different Liquefaction Layer Positions

Seven reference points were selected for the auxiliary buildings, with their spatial distribution illustrated in Figure 23a, while three reference points were configured for the containment structure, as shown in Figure 23b. A comprehensive evaluation of the effects of varying liquefaction layer positions on the seismic response of embedded nuclear power plant structures under non-rock site conditions was conducted using three metrics: floor acceleration, floor spectral acceleration, and inter-story displacement.
Concurrently, site liquefaction phenomena are explicitly shown in Figure 24. Based on the liquefaction analysis results, the site responses under different liquefaction layer configurations in non-bedrock conditions were systematically assessed, with structural response characteristics induced by site liquefaction conclusively summarized. Monitoring points A, B, and C are strategically positioned at the center of the structure’s base, the apex of the internal containment structure, and the centroid of the containment shell, respectively.

3.1. Auxiliary Building

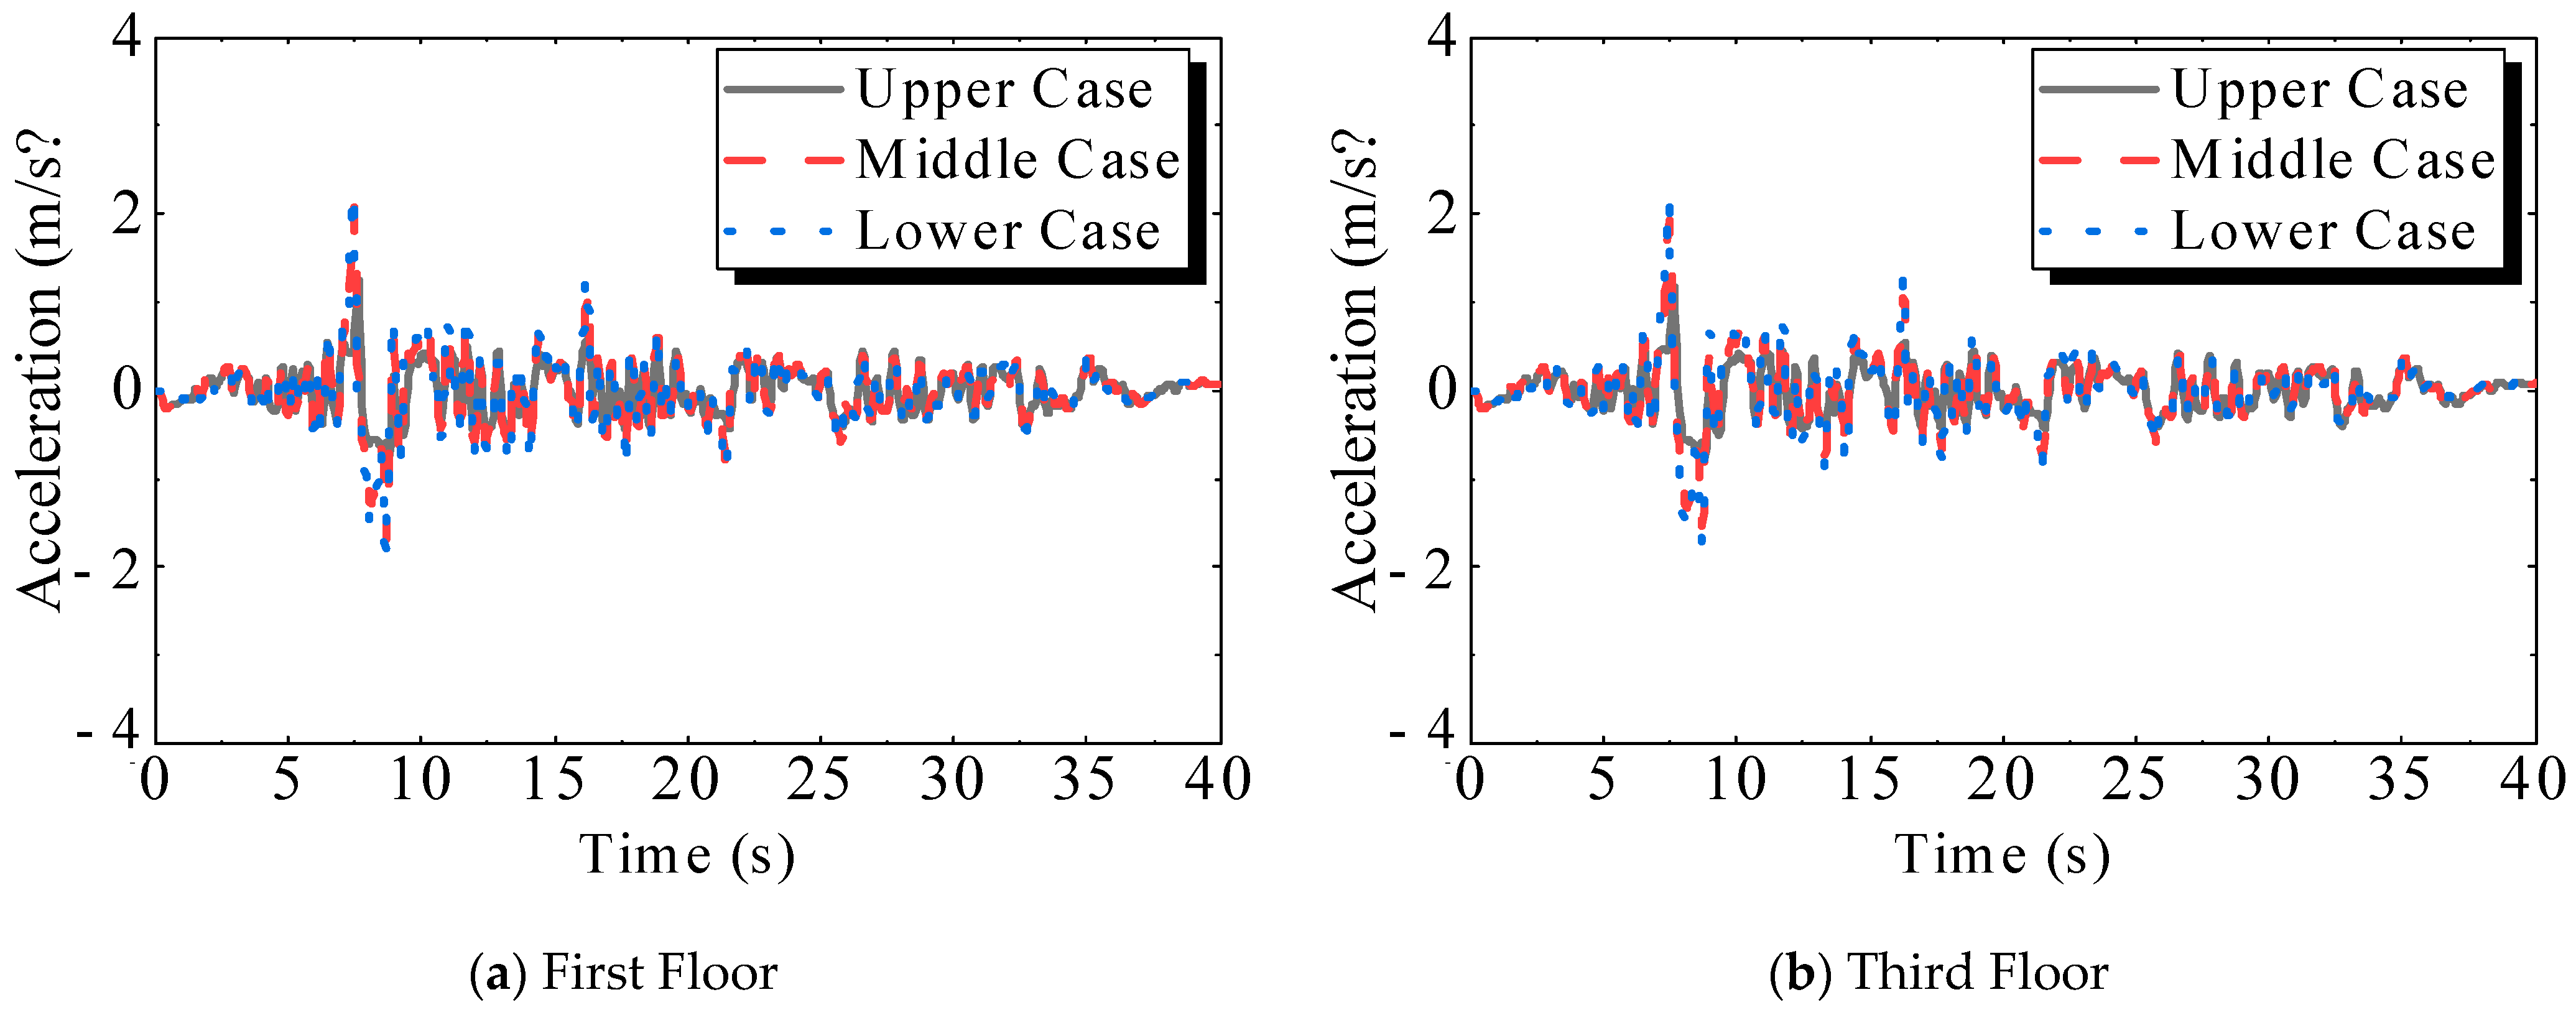
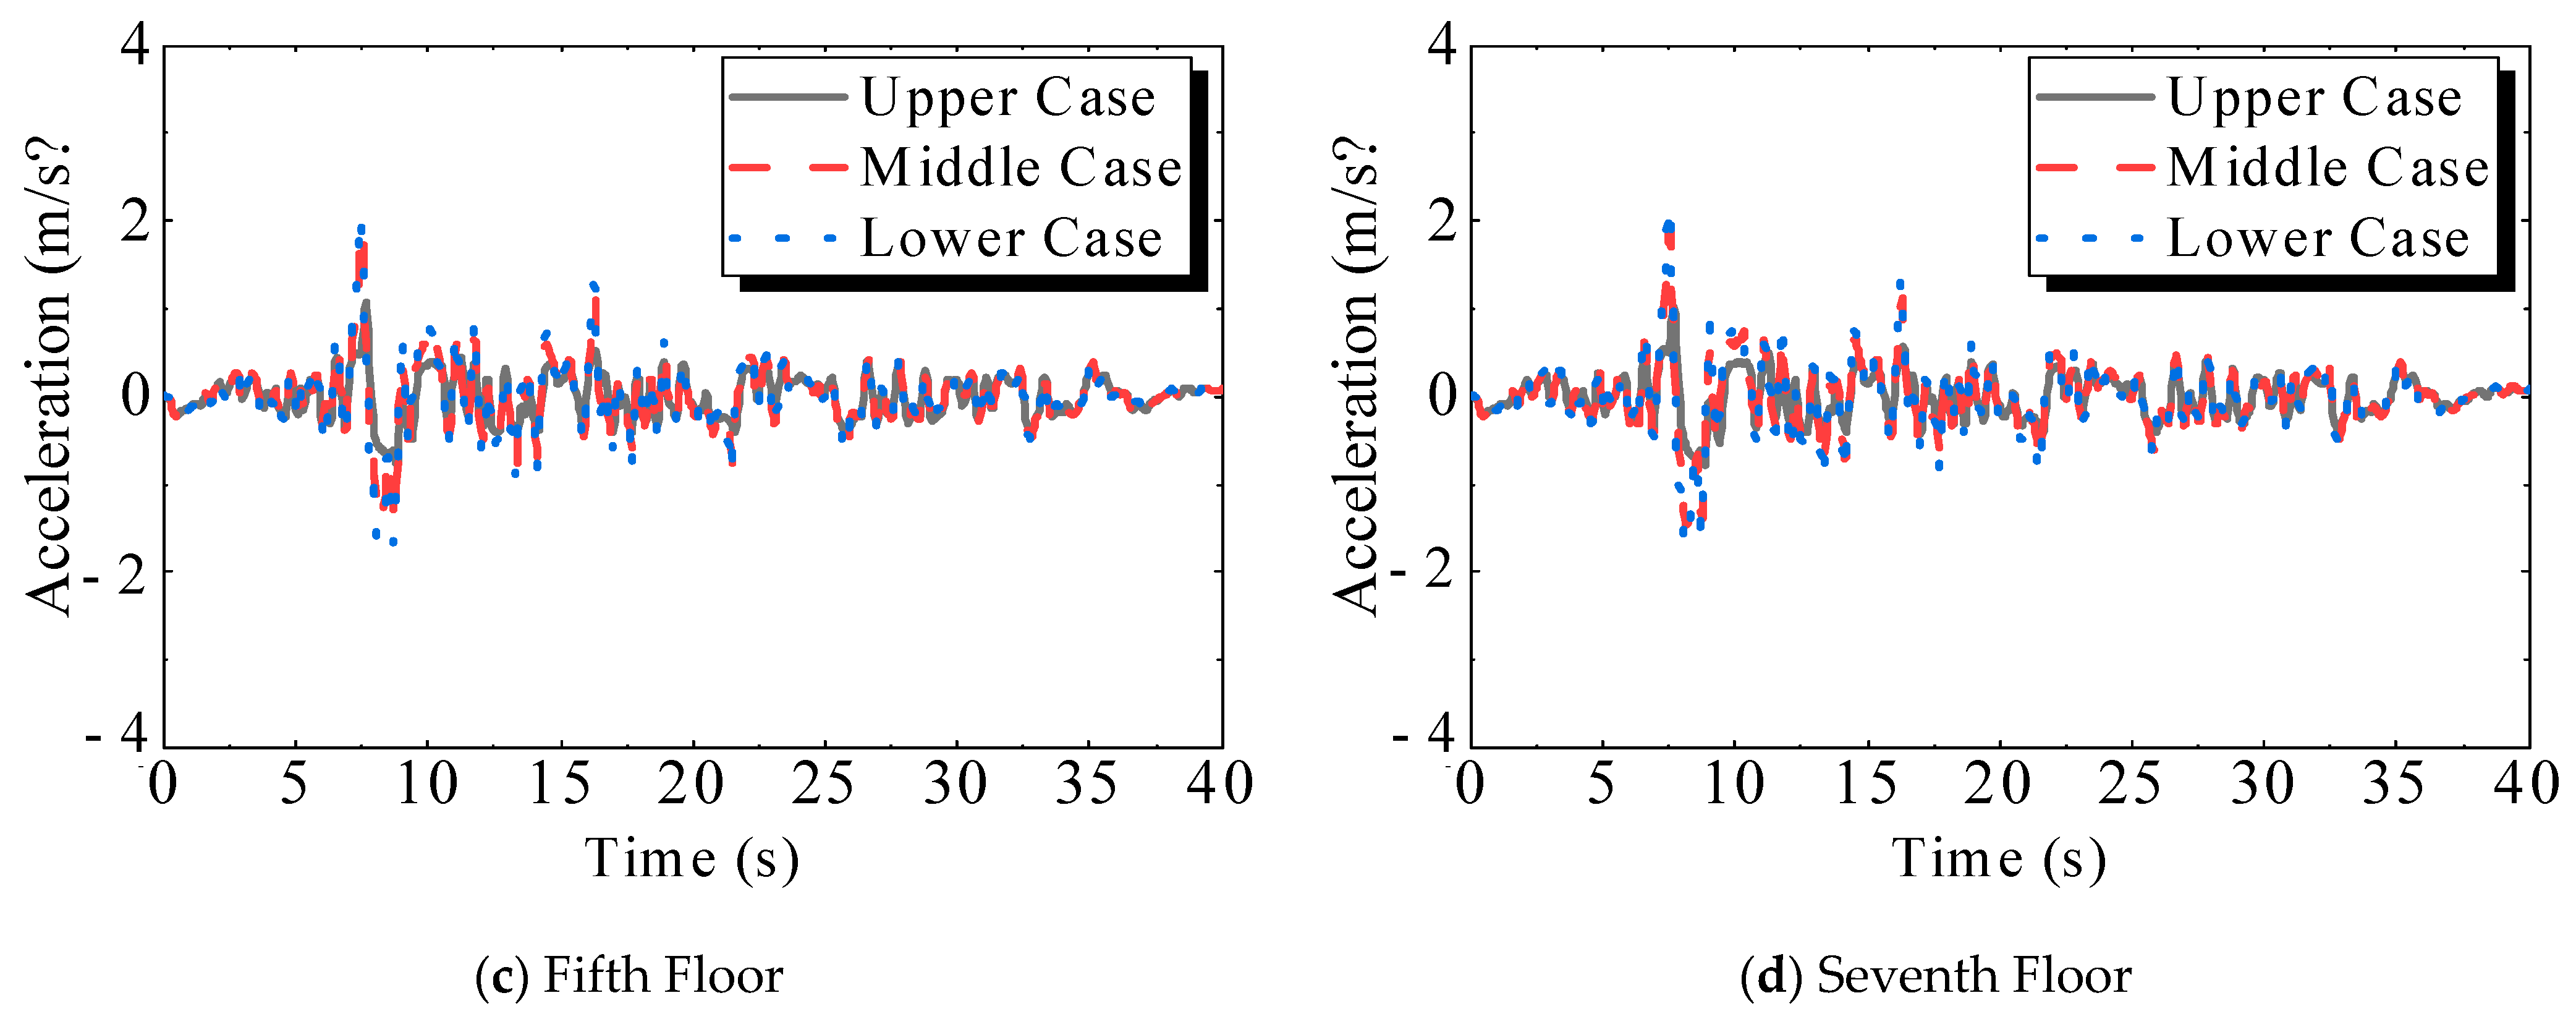
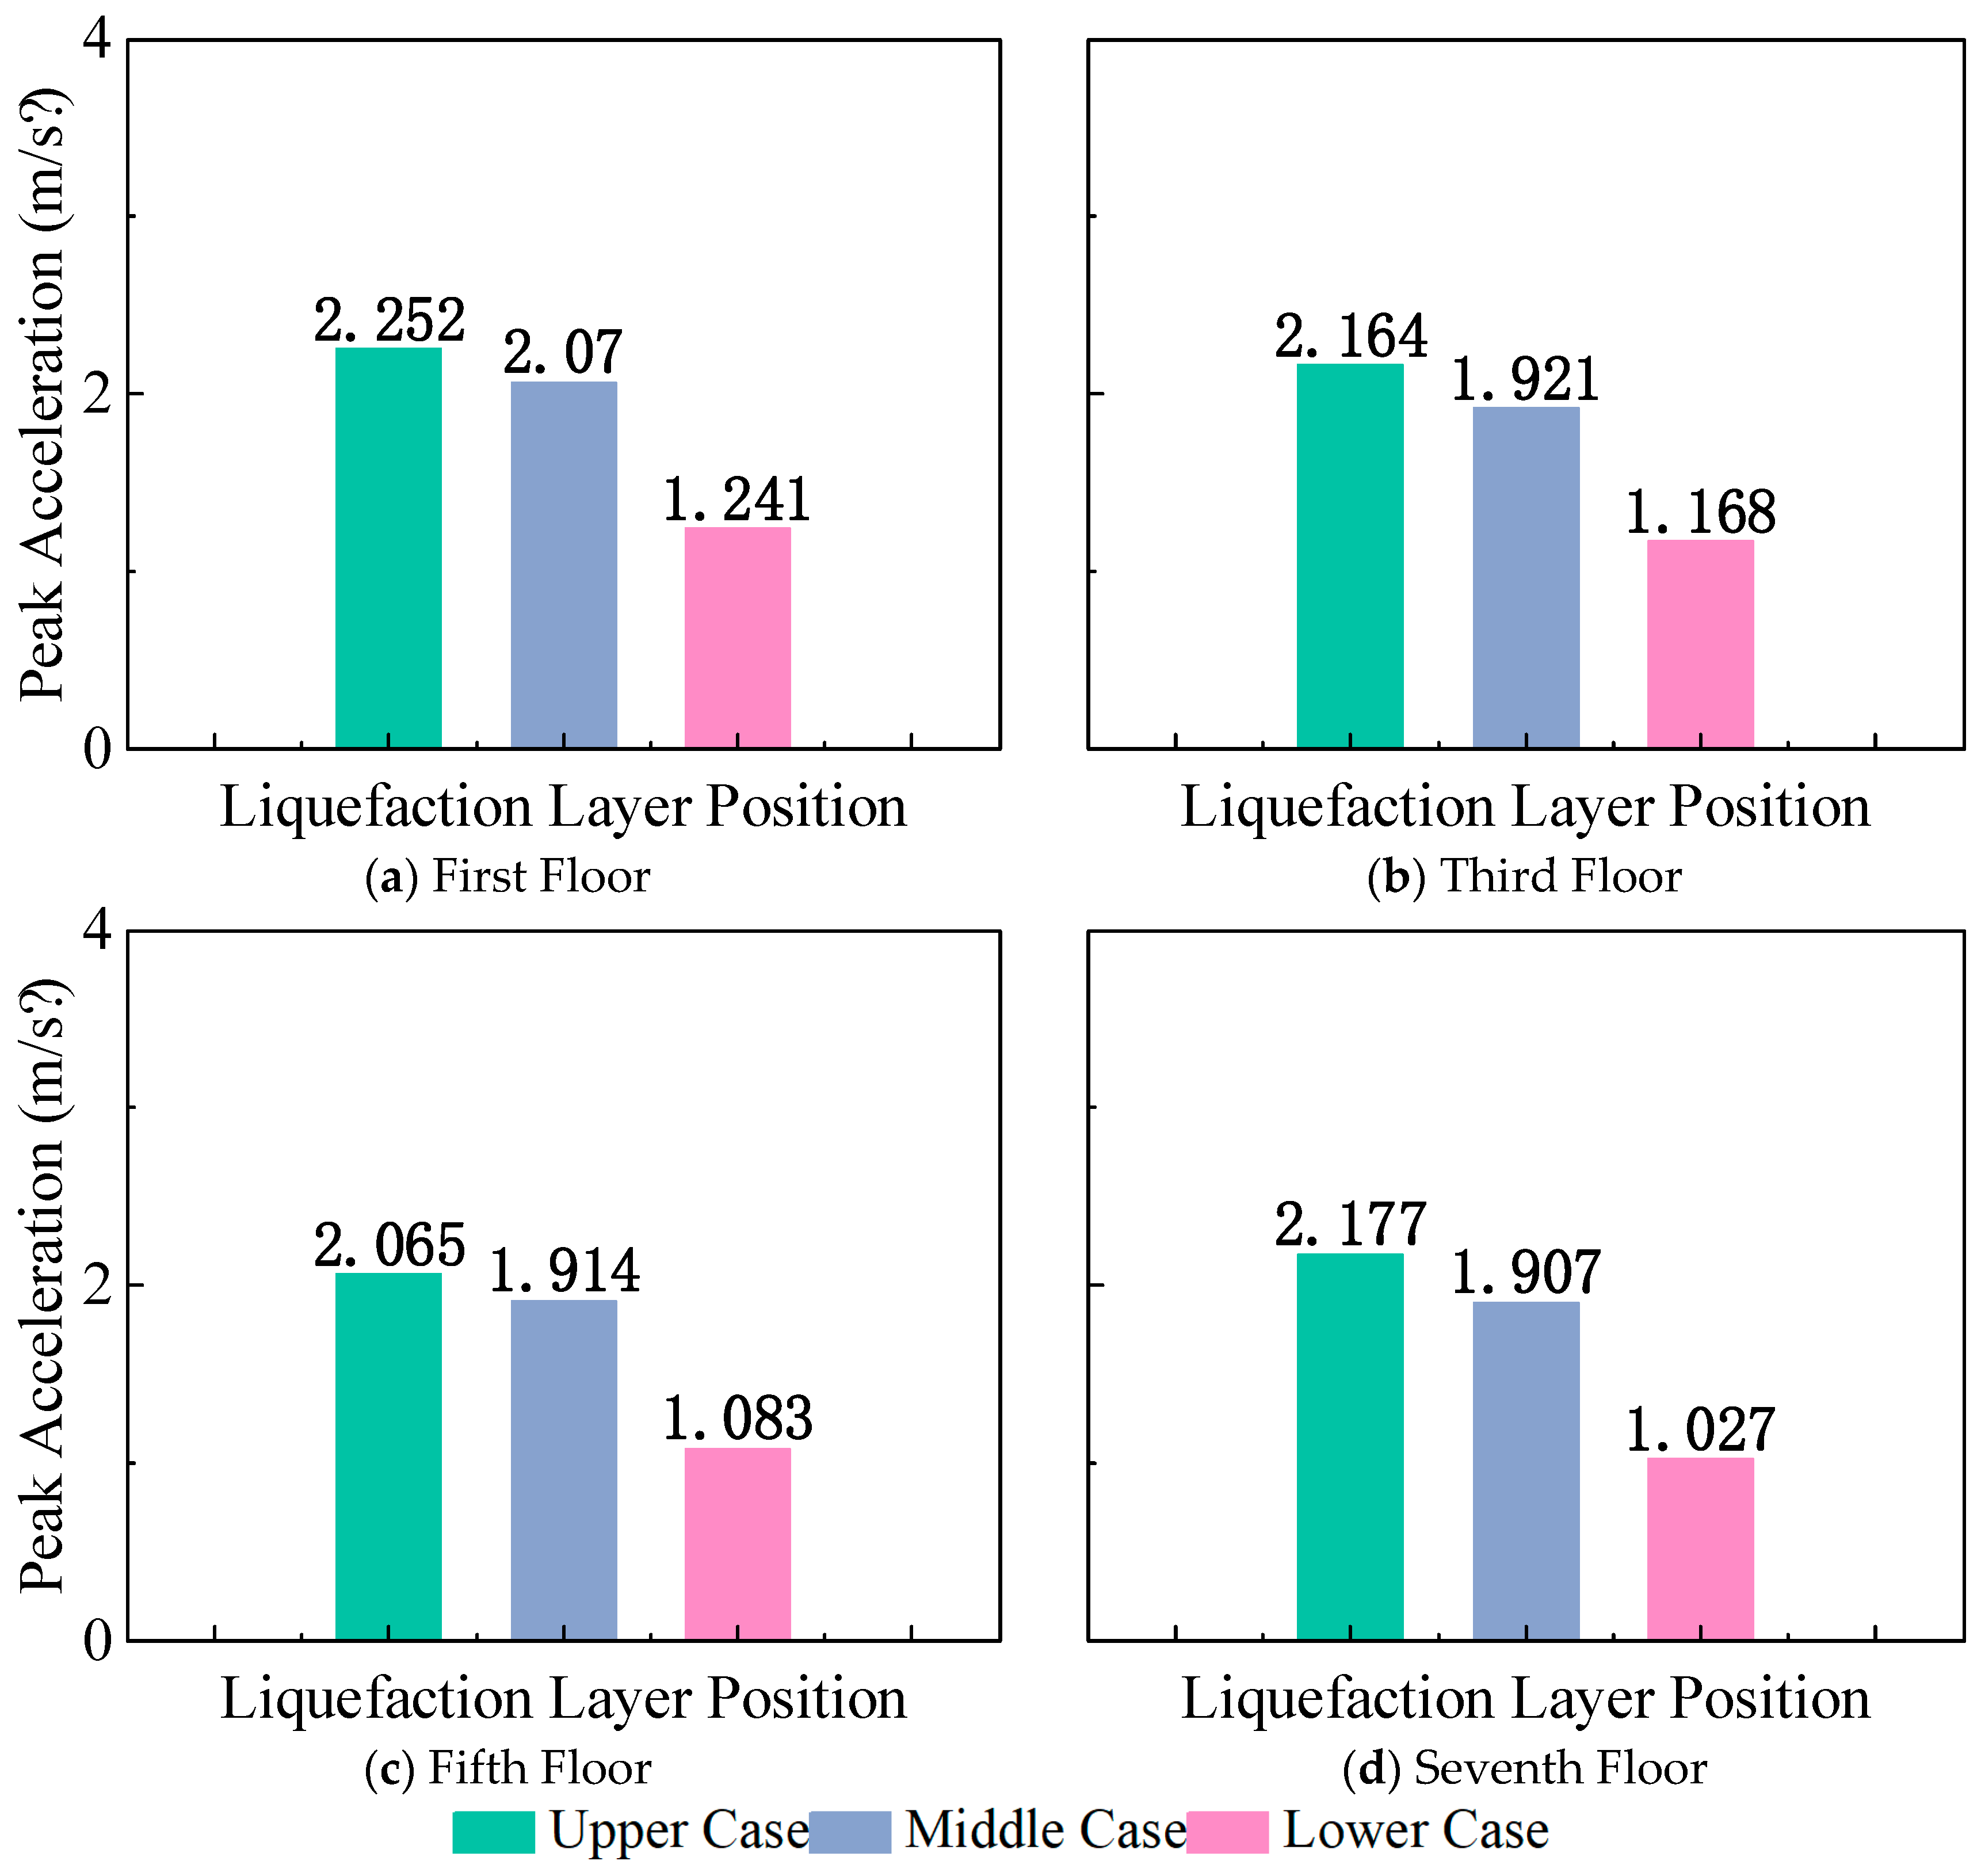
3.1.1. Acceleration of Floors

Figure 25 shows the acceleration time histories of the industrial building’s structural floors, and Figure 26 displays the corresponding peak acceleration responses. The results indicate that minor differences exist in acceleration time histories across floors under different liquefaction layer depths. When the liquefaction layer is located beneath the structure (lower position), peak accelerations on all floors exceed those observed when the layer is positioned at the upper or middle sections. There were similar distribution patterns of peak accelerations across floors for all three scenarios. There were also larger amplification factors when the liquefaction layer is in the middle or lower position compared to the upper position. A “first increase then decrease” trend was seen in peak accelerations on floors 3–7 for the upper-layer scenario. Reduced structural responses were seen in the middle- and lower-layer scenarios. These behaviors are attributed to energy dissipation in soft soil sites, which reduces site responses and consequently decreases structural responses.

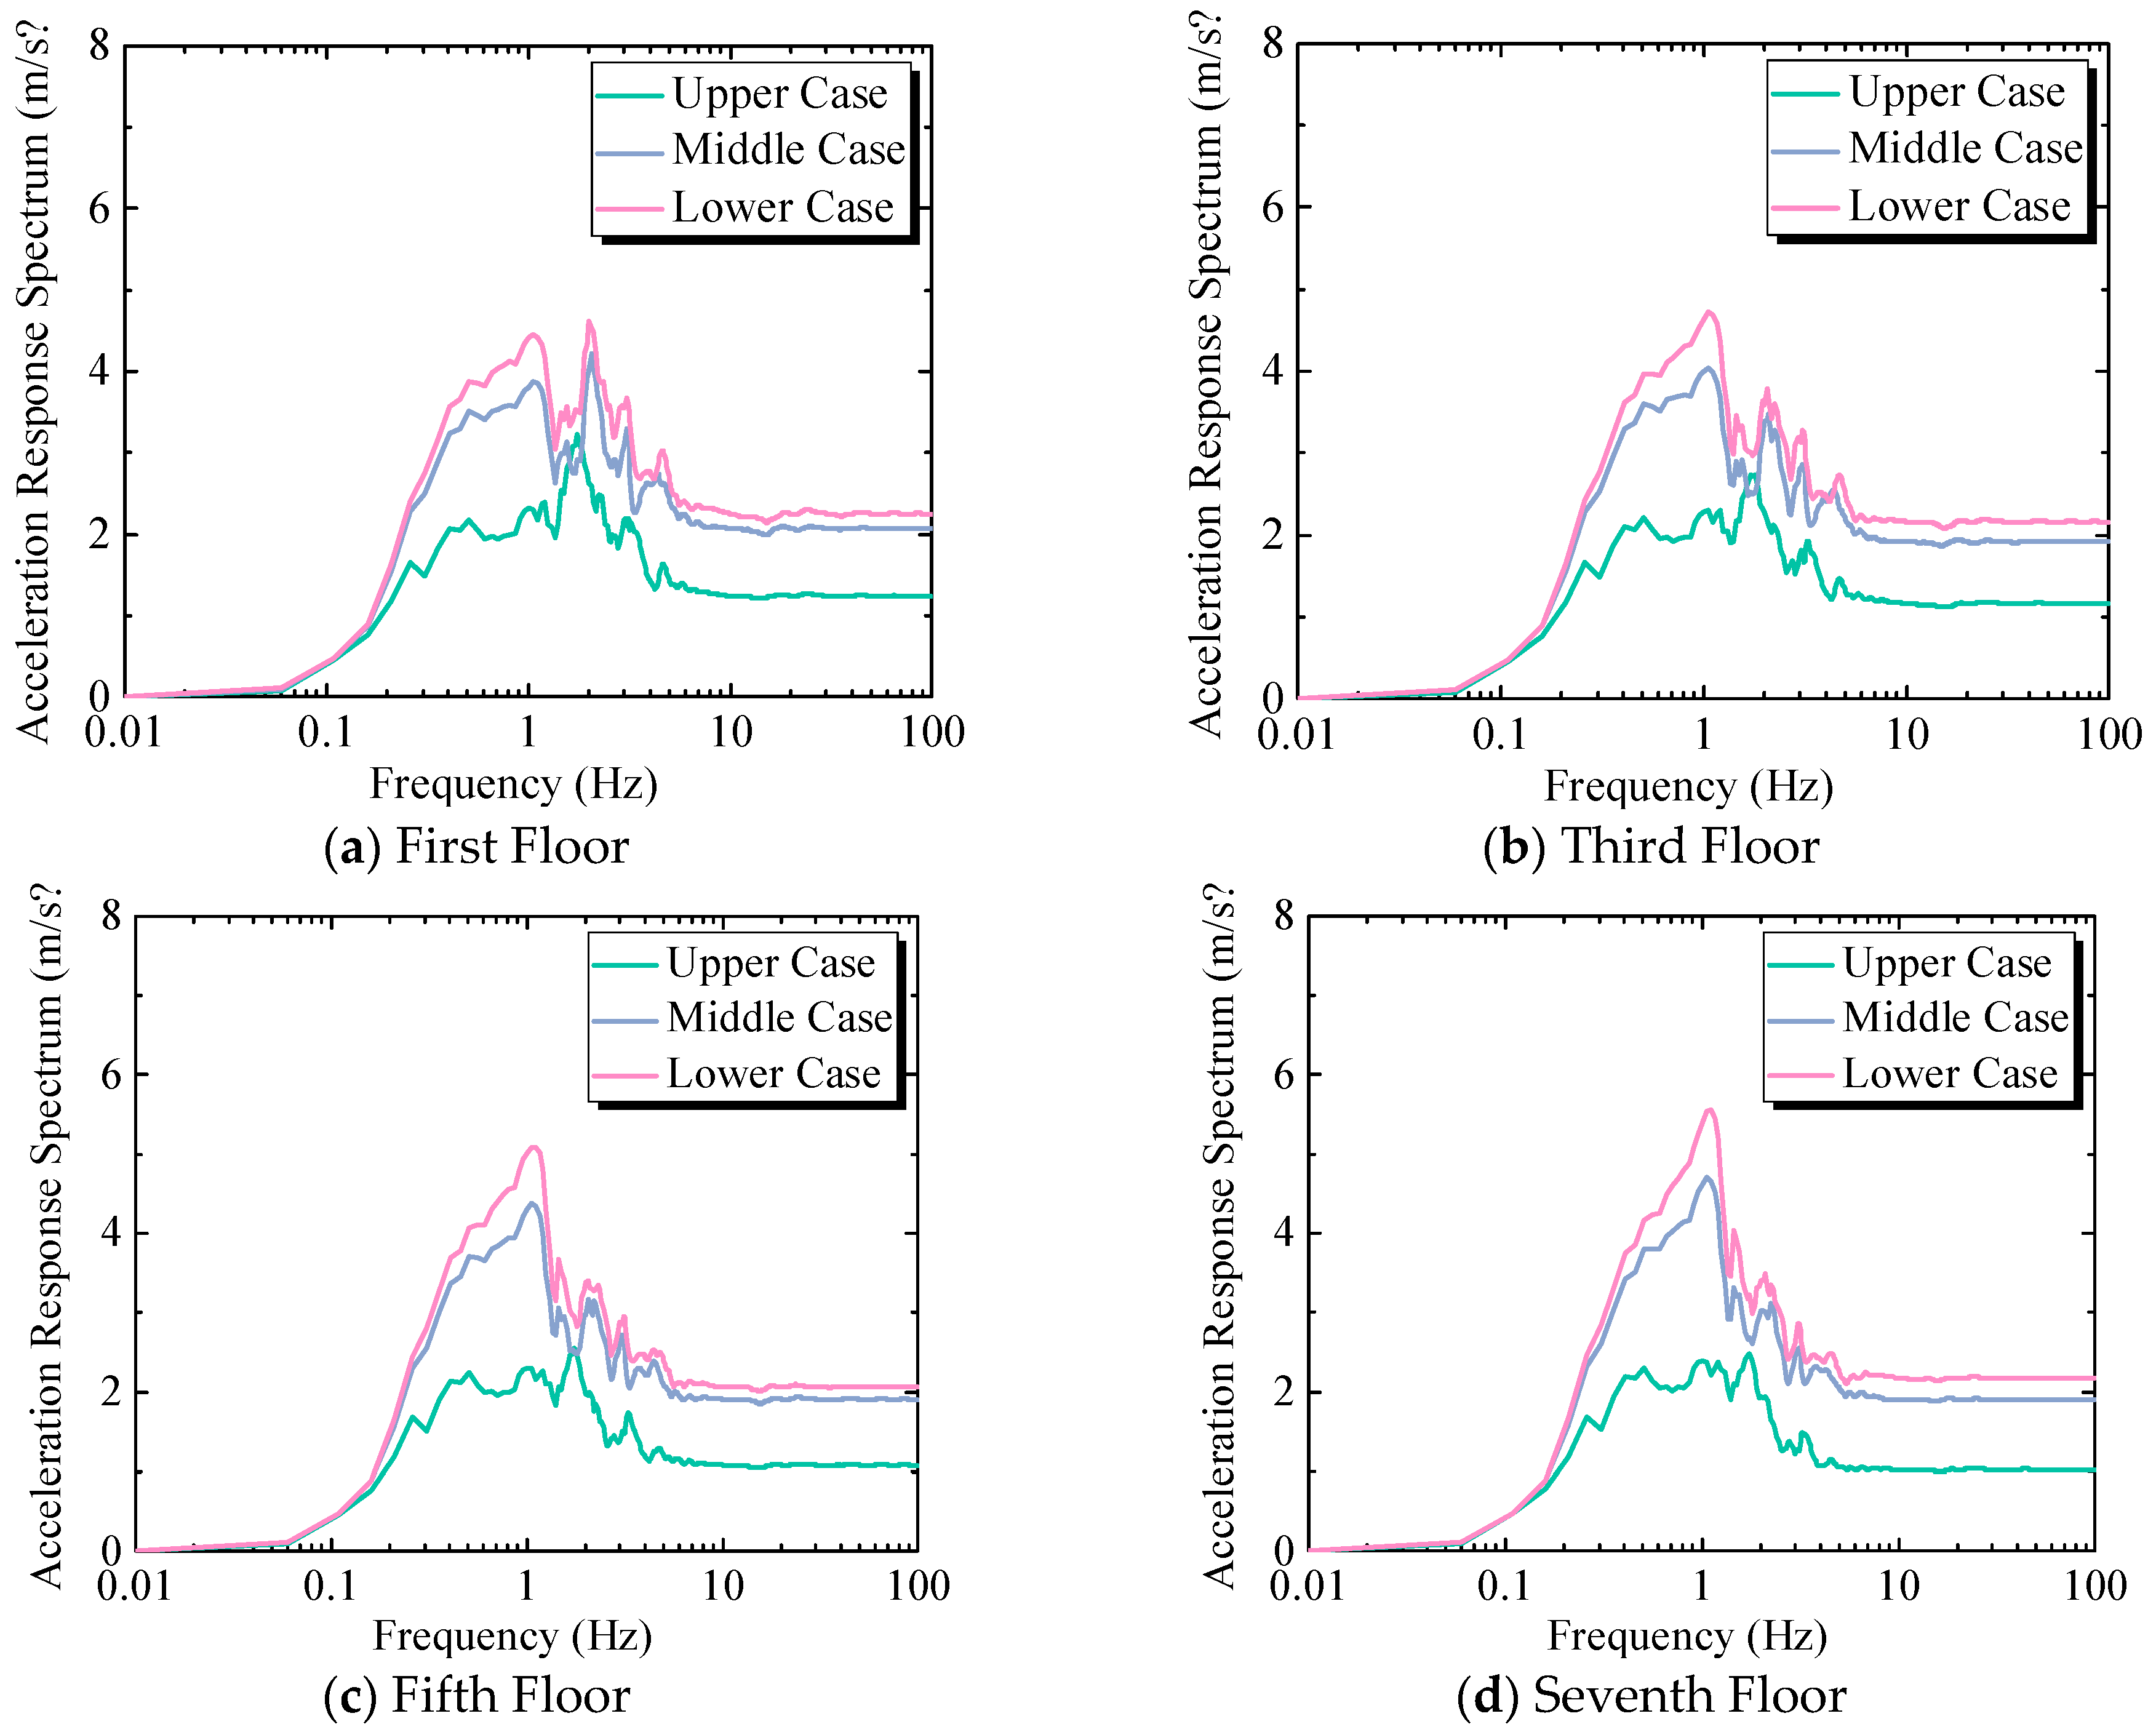
3.1.2. Acceleration Response Spectrum of Floors

Figure 27 shows the floor response spectra of the factory structure. It can be seen that the lower case consistently exhibits the highest acceleration response spectra across all floors, while the upper case shows the lowest response. This difference becomes more pronounced at higher floors. The acceleration response on the first floor is relatively low. The response spectra increase significantly from the third to seventh floor, reaching a peak on the seventh floor. The high-frequency response of the floor spectra decreases as the floor level increases.

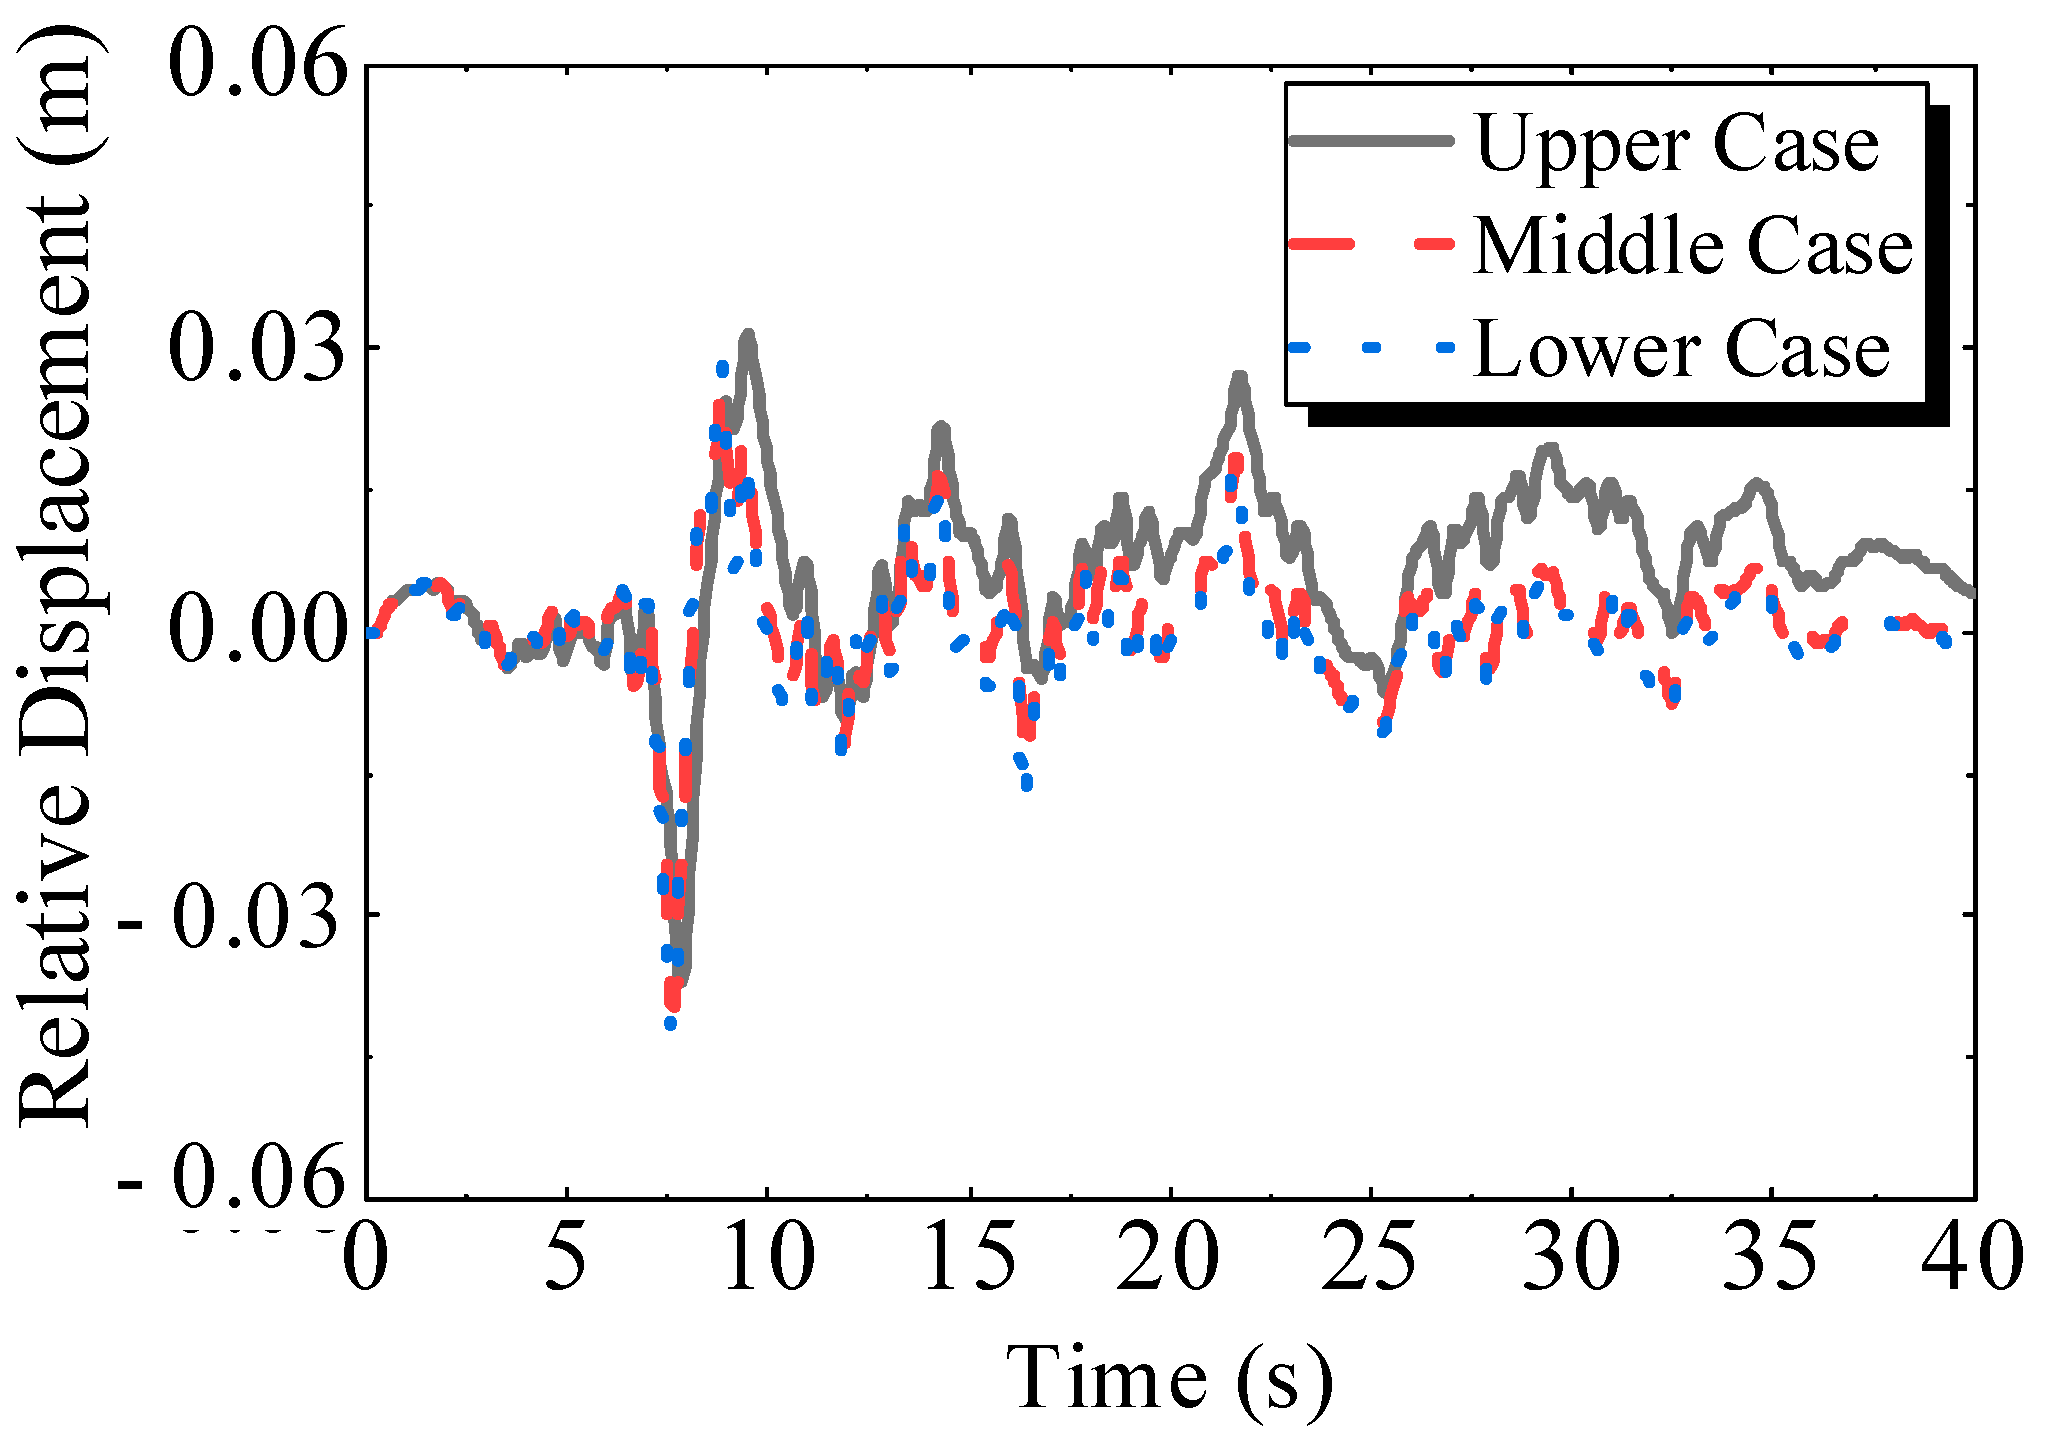
3.1.3. Relative Displacement

By comparing the peak relative displacements of the seventh floor with respect to the first floor before and after liquefaction, the influence of different liquefaction layer positions on structural response is studied. Figure 28 shows the relative displacement time history of the seventh floor with respect to the first floor, and Figure 29 presents the peak relative displacements of the seventh floor with respect to the first floor. It can be observed that the relative displacement before liquefaction exhibits more significant fluctuations with larger amplitudes. In the early stage of seismic motion, the relative displacements under the three cases show little difference. In the middle and late stages of seismic motion, the relative displacement peak of the upper case increases and maintains a residual displacement. For the middle case and lower case, the relative displacements decrease, with the reduction being more significant for the lower case.

3.2. Containment Structure
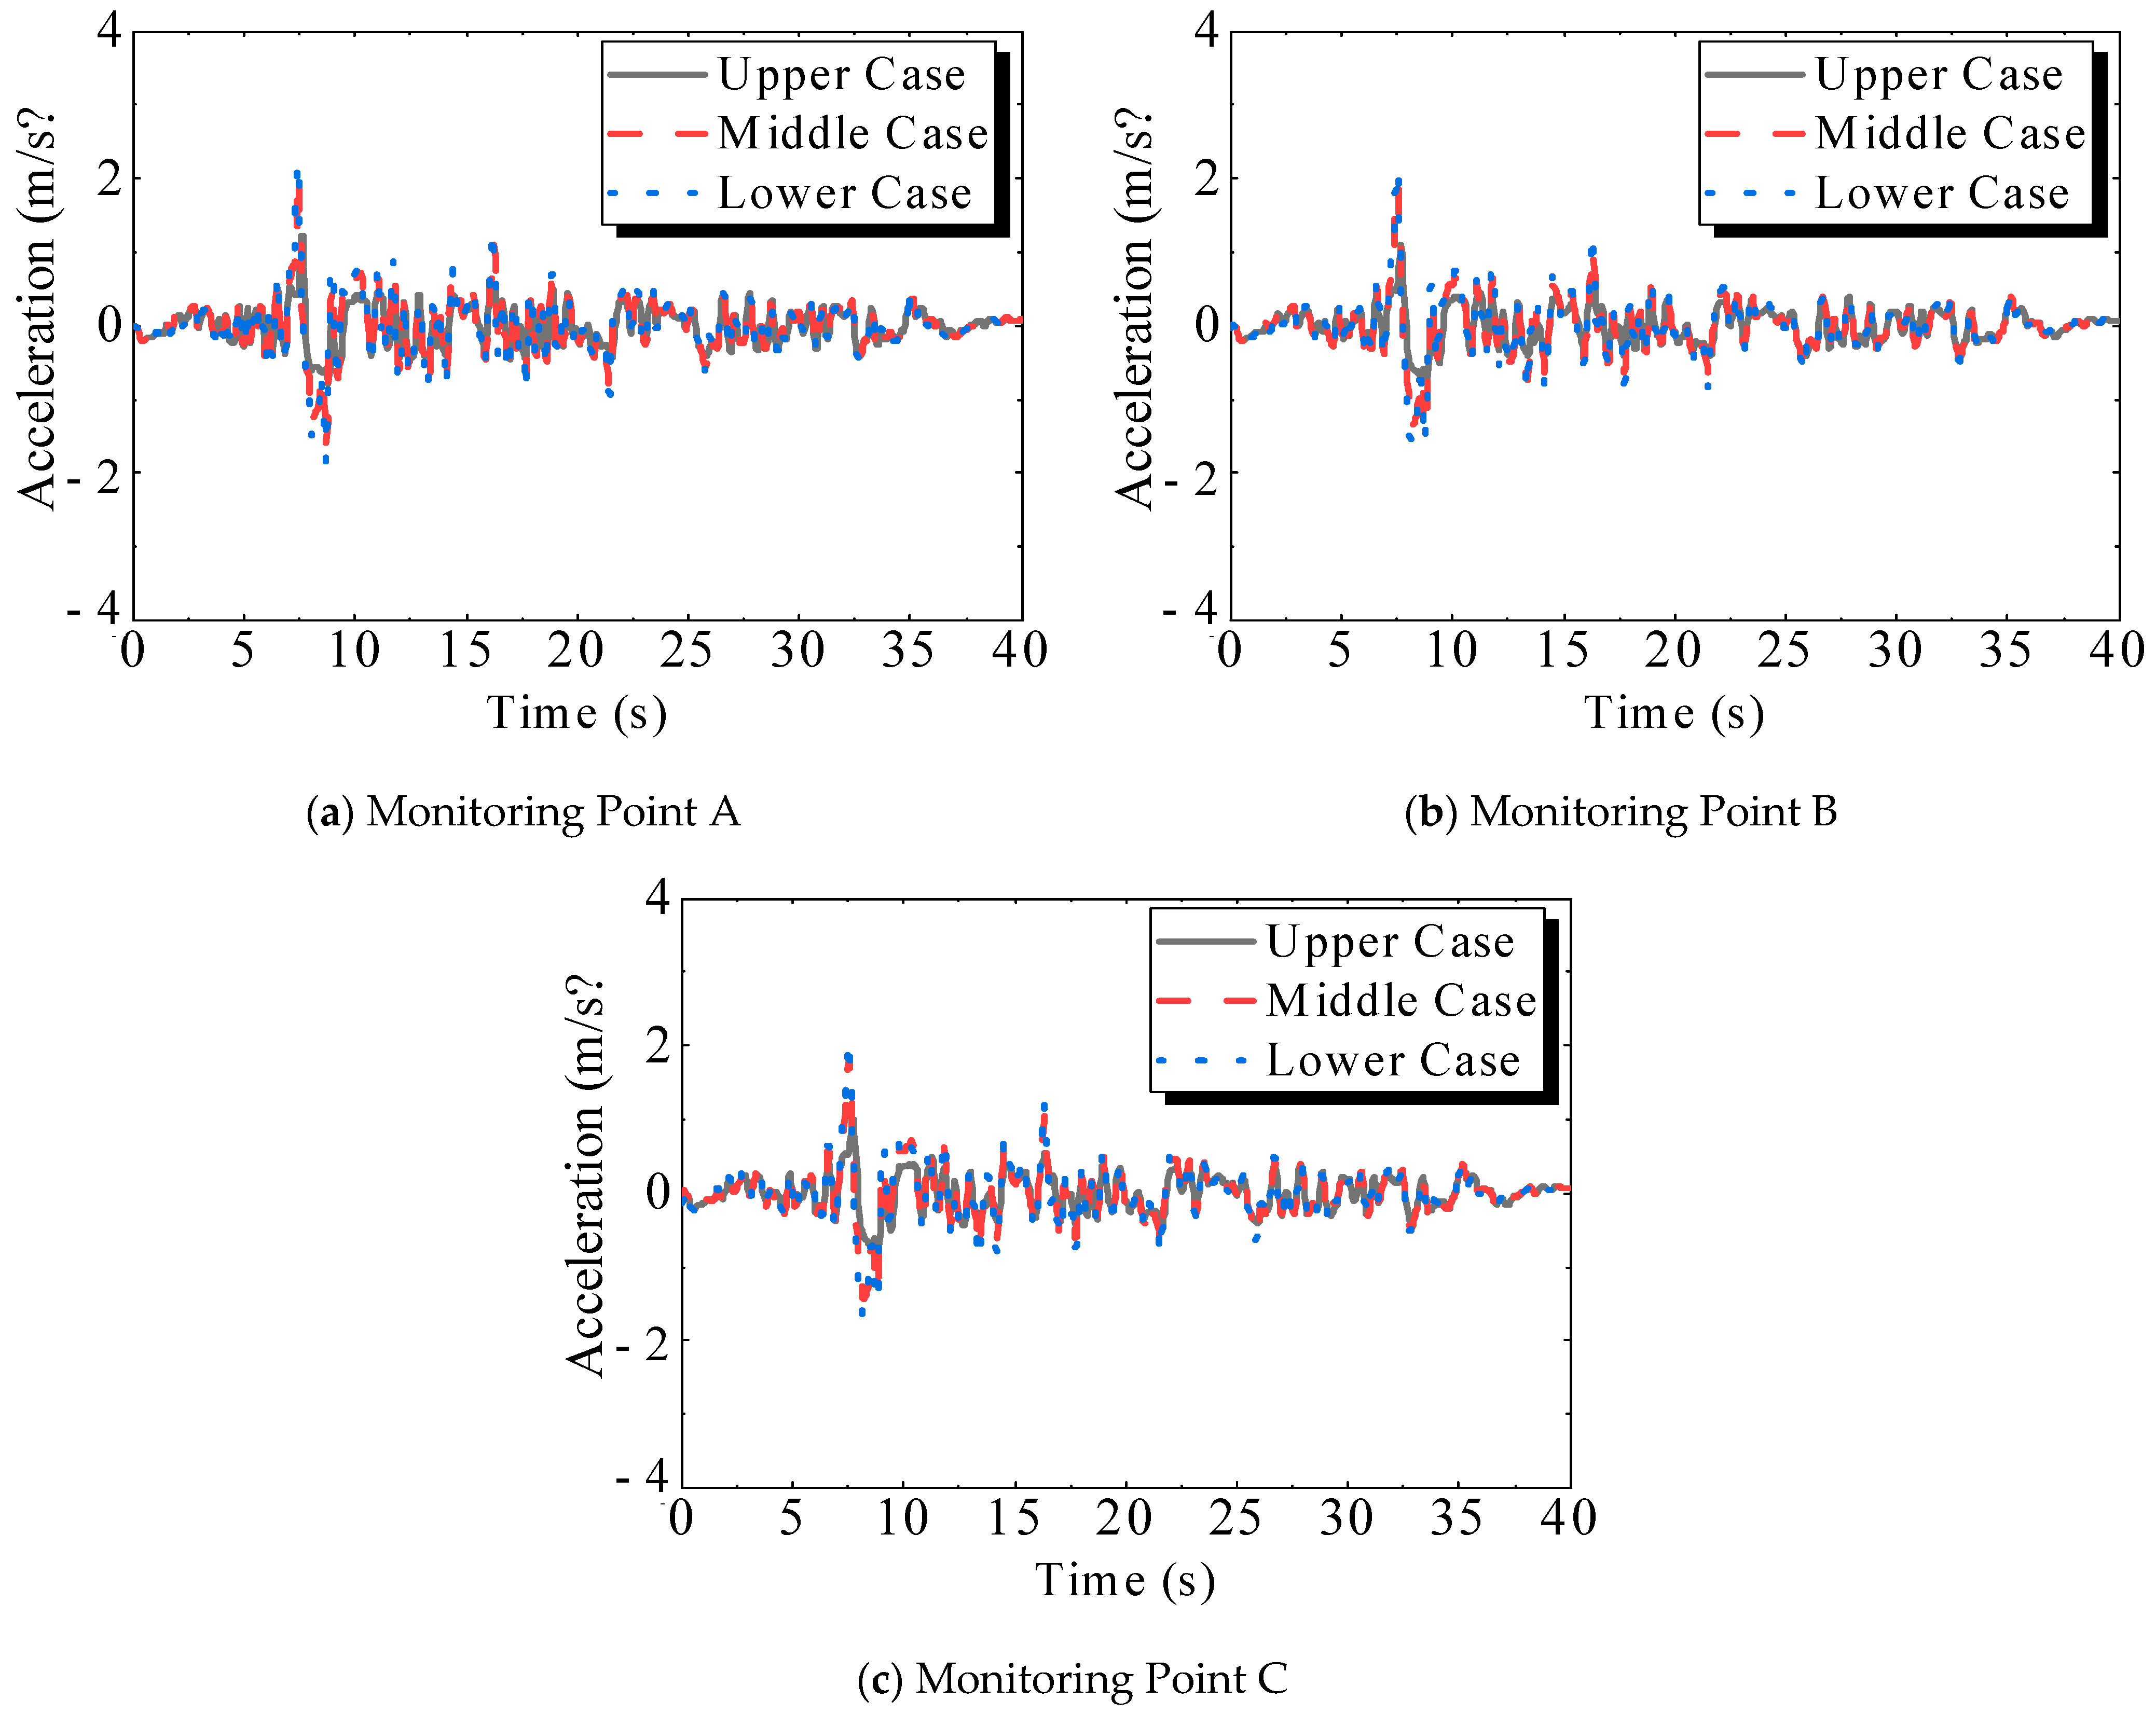
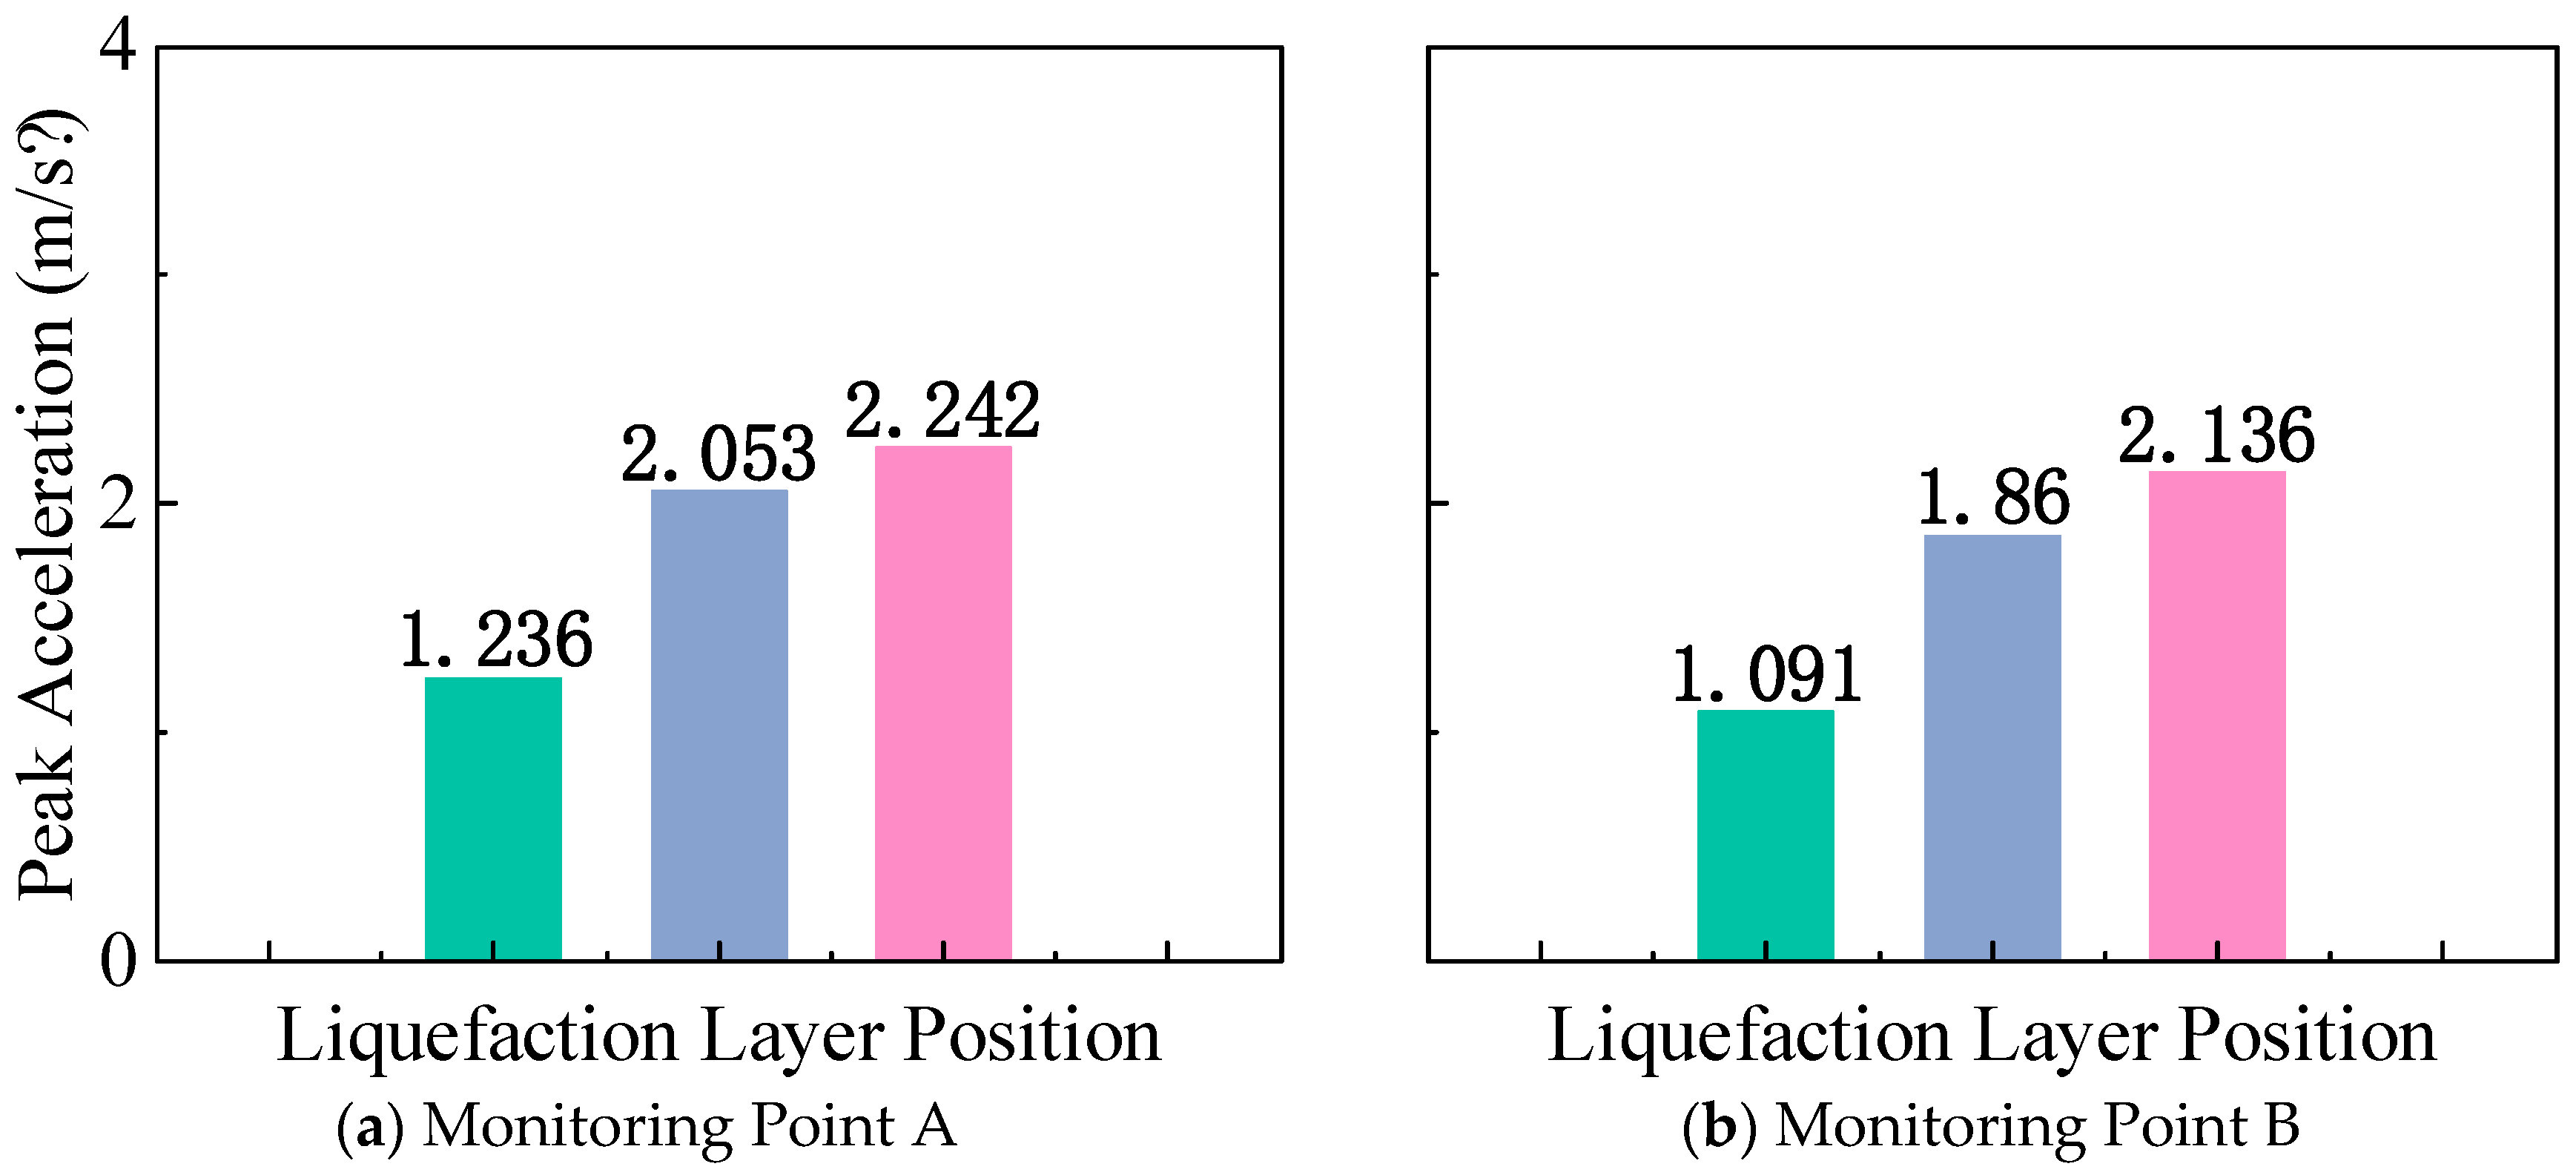
3.2.1. Acceleration

Figure 30 shows the acceleration time history curves of the containment at three monitoring points (A, B, C), corresponding to three liquefaction layer positions: the upper case, middle case, and lower case. It can be seen that the depth of the liquefaction layer plays a critical role in the dynamic response of the structure, with deeper liquefaction layers resulting in stronger acceleration responses.
Figure 31 shows the peak acceleration at three monitoring points (A, B, C), corresponding to three liquefaction layer positions. It can be seen that the peak acceleration at Monitoring Point C is always the highest, indicating that the acceleration response of the containment increases continuously with height.

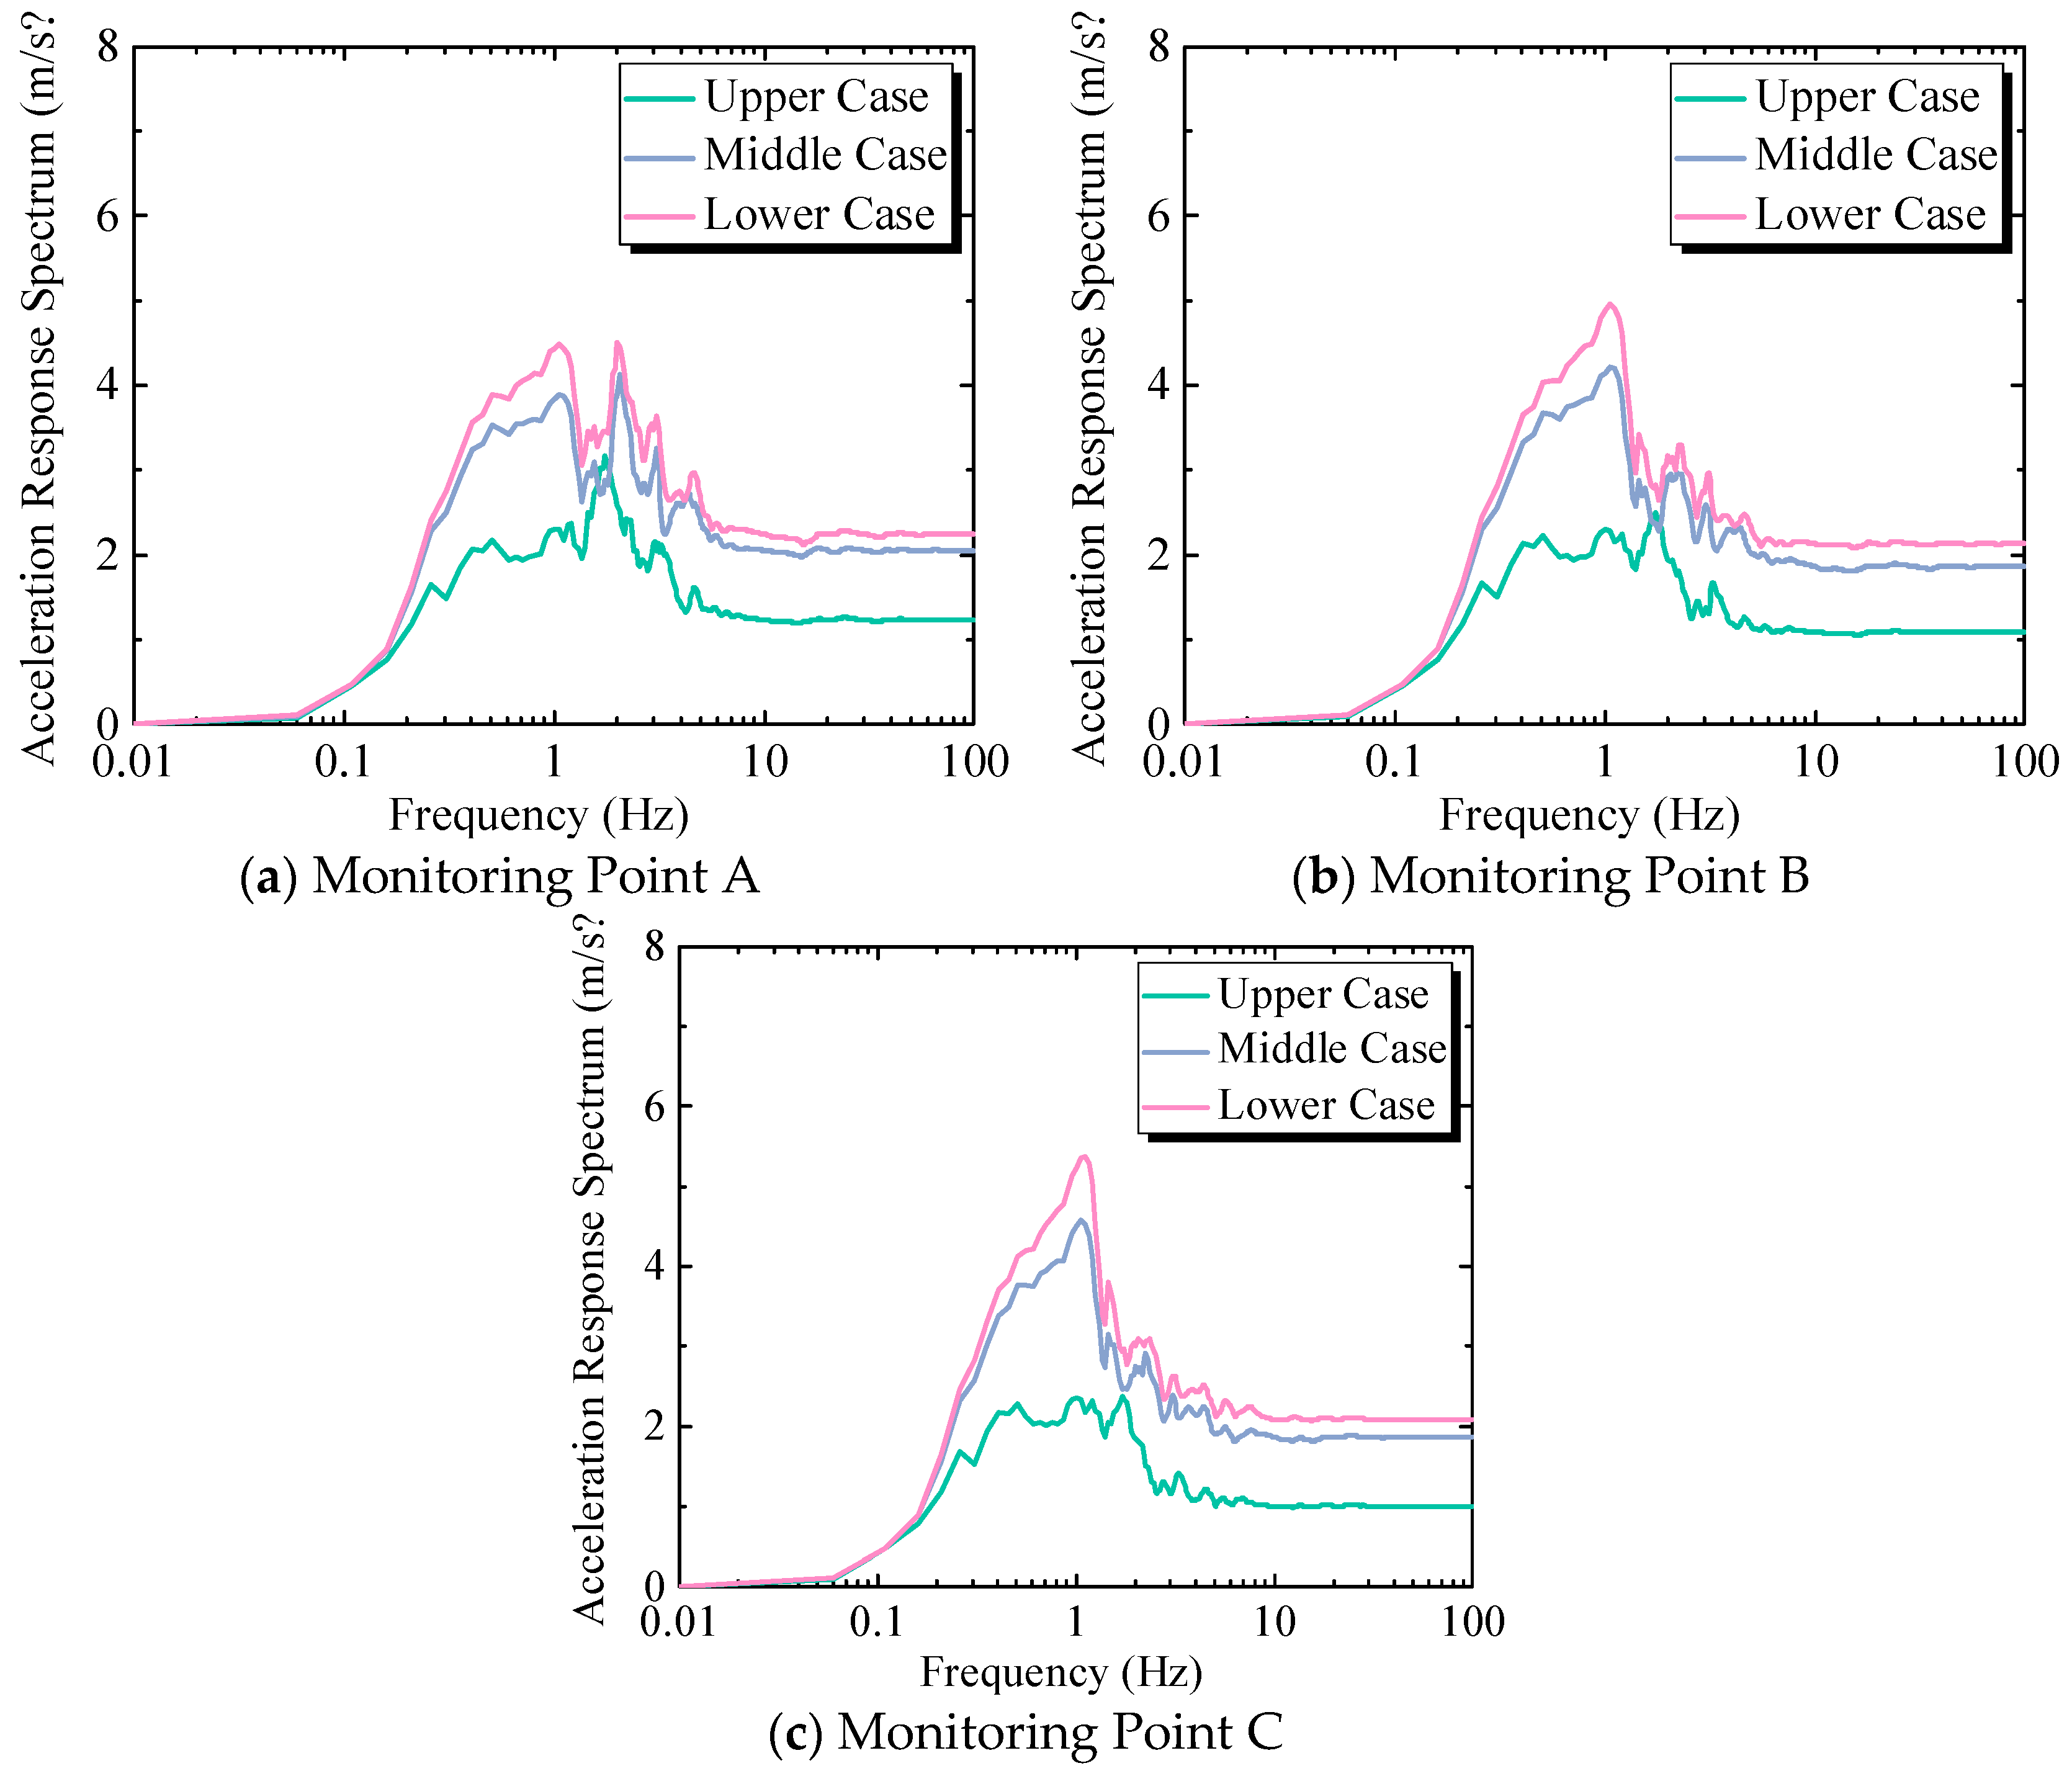
3.2.2. Acceleration Response Spectrum

Figure 32 shows the floor response spectra of the factory structure. It can be seen that the lower case consistently exhibits the highest acceleration response spectra across all floors, while the upper case shows the lowest response. This difference becomes more pronounced at higher floors. The acceleration response on the first floor is relatively low. The response spectra increase significantly from the third to seventh floor, reaching a peak on the seventh floor. The high-frequency response of the floor spectra decreases as the floor level increases.

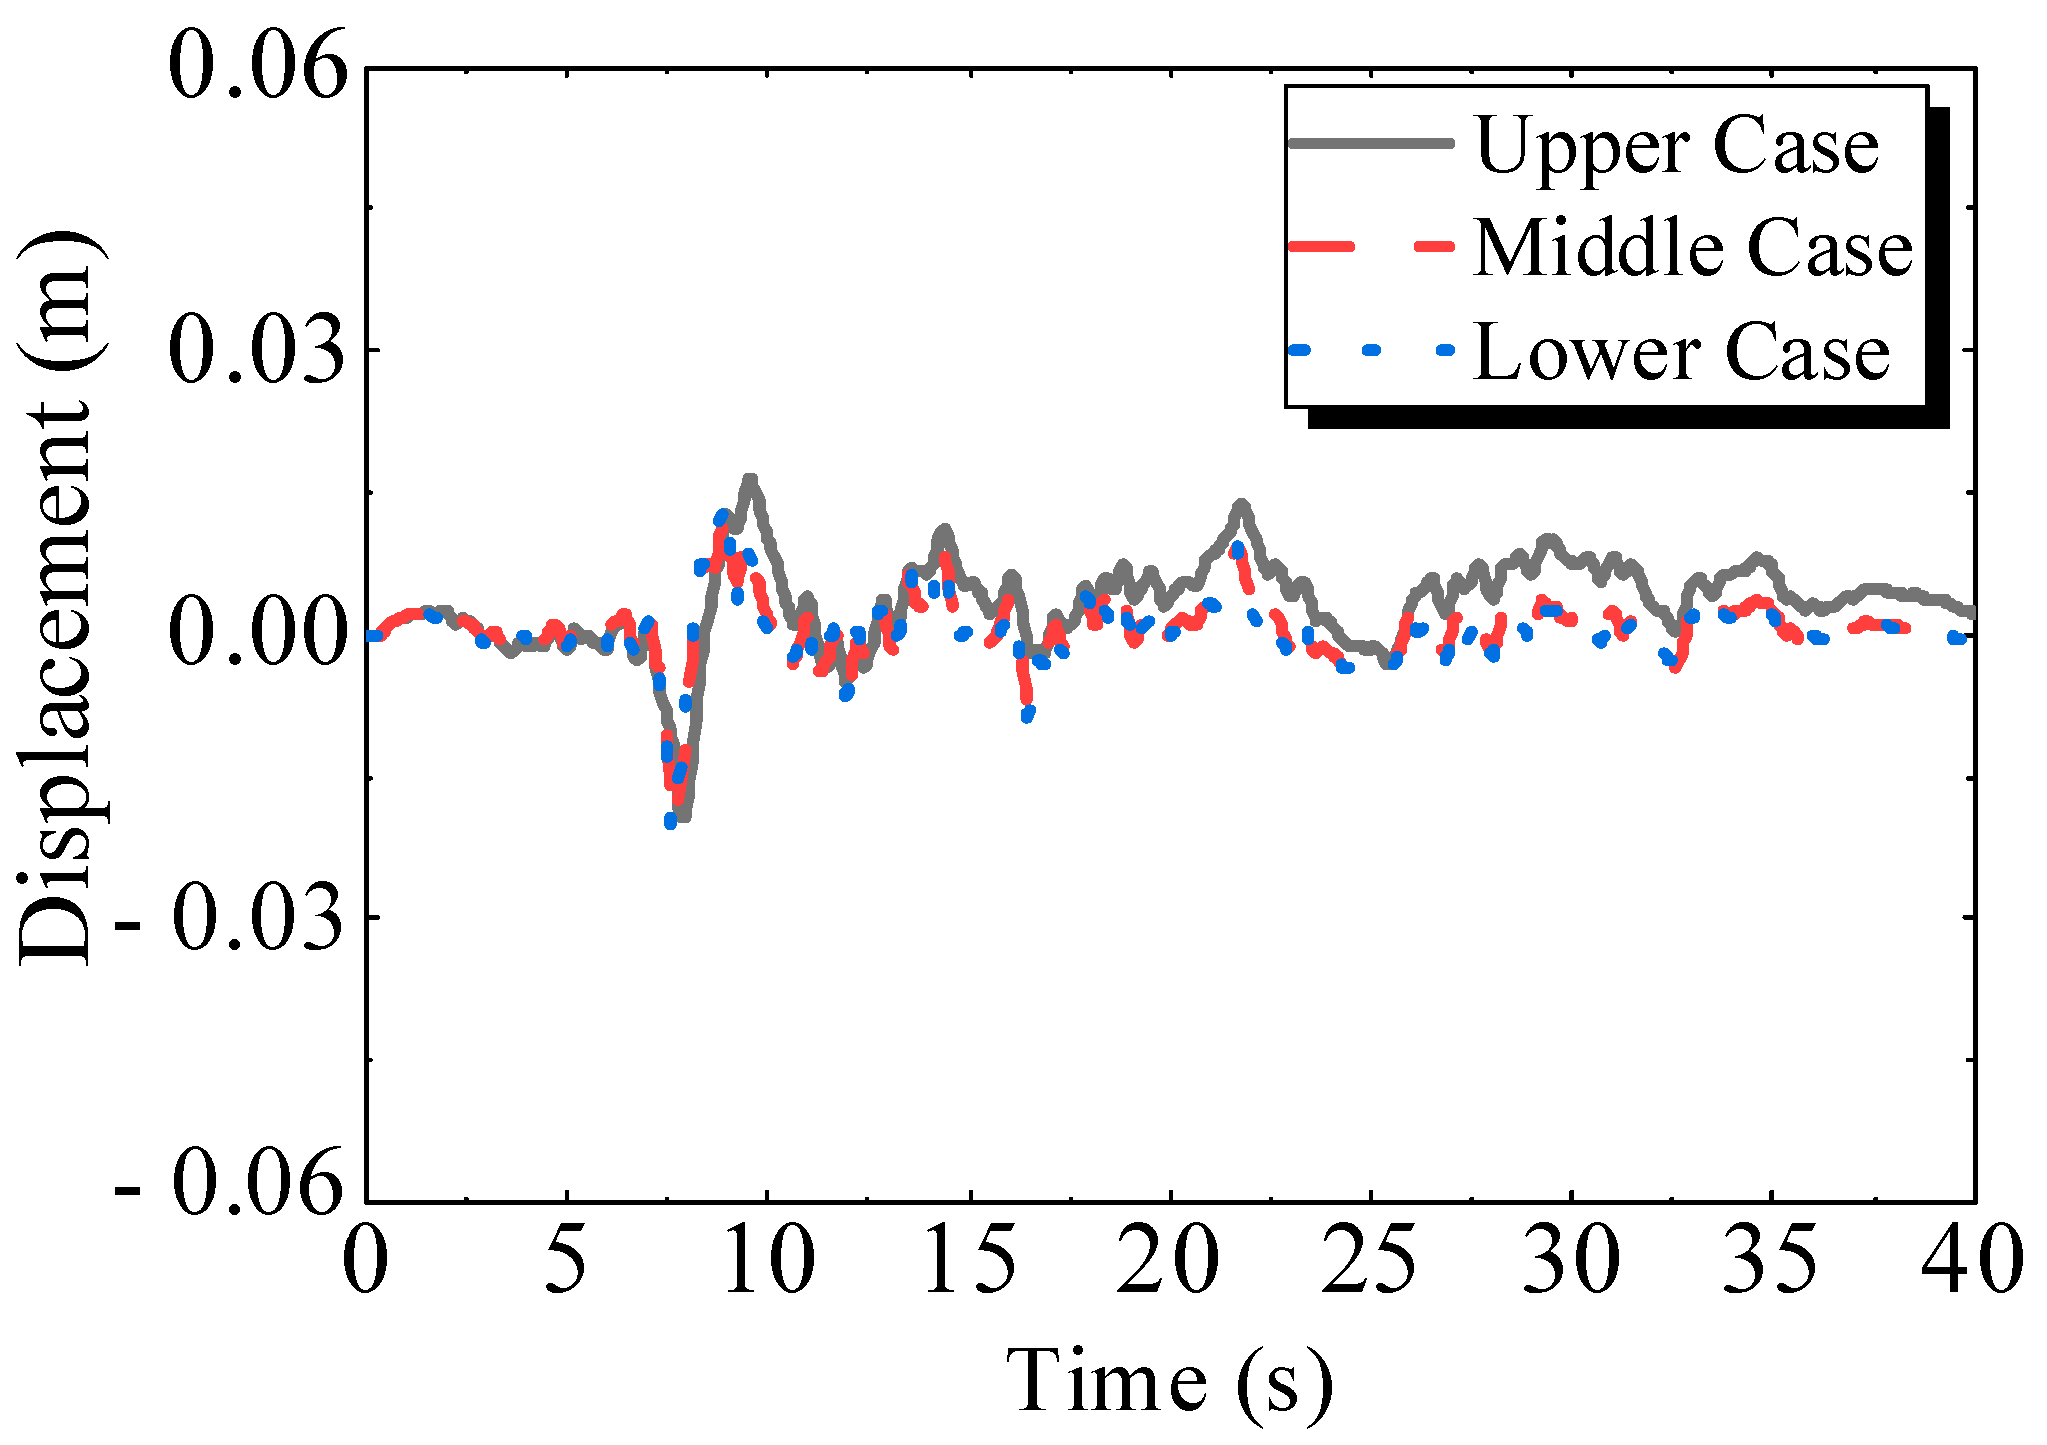
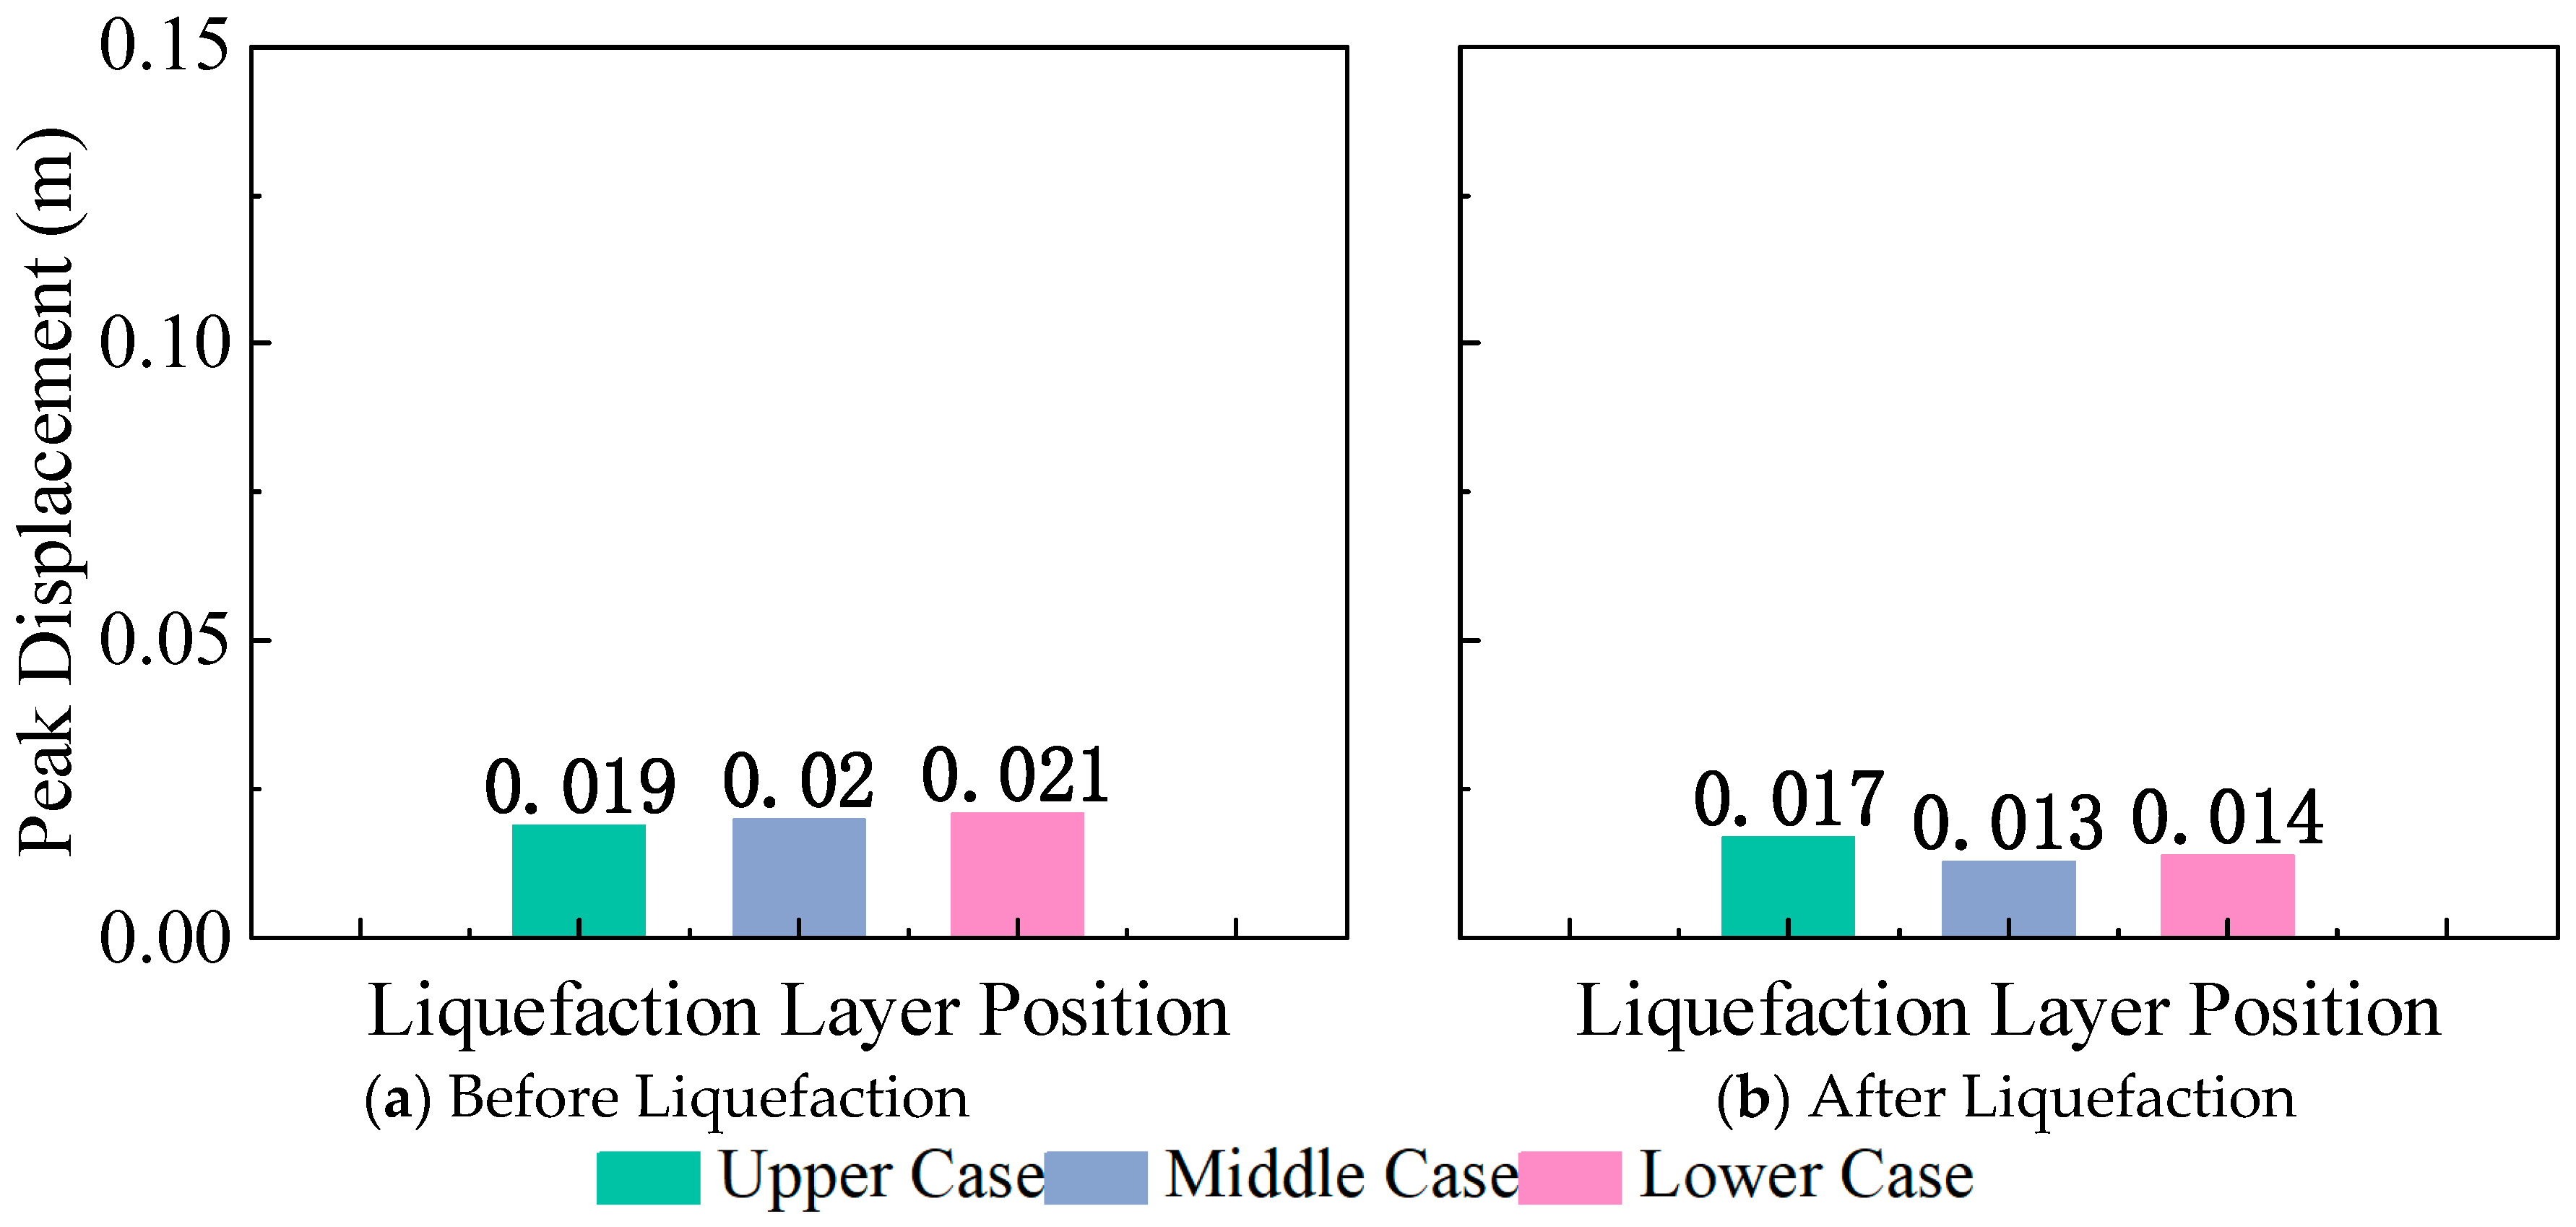
3.2.3. Relative Displacement

Figure 33 shows the relative displacement time history curve of Point C relative to Point A. The relative displacement response is small, but the relative displacement response under the lower case is slightly higher than that of the other cases. A slight residual displacement is observed in the relative displacement curve of the upper case during the later stages of seismic motion. Figure 34 shows the peak relative displacement of Point C relative to Point A. A reduction in the peak relative displacement is observed due to the soil–structure interaction.

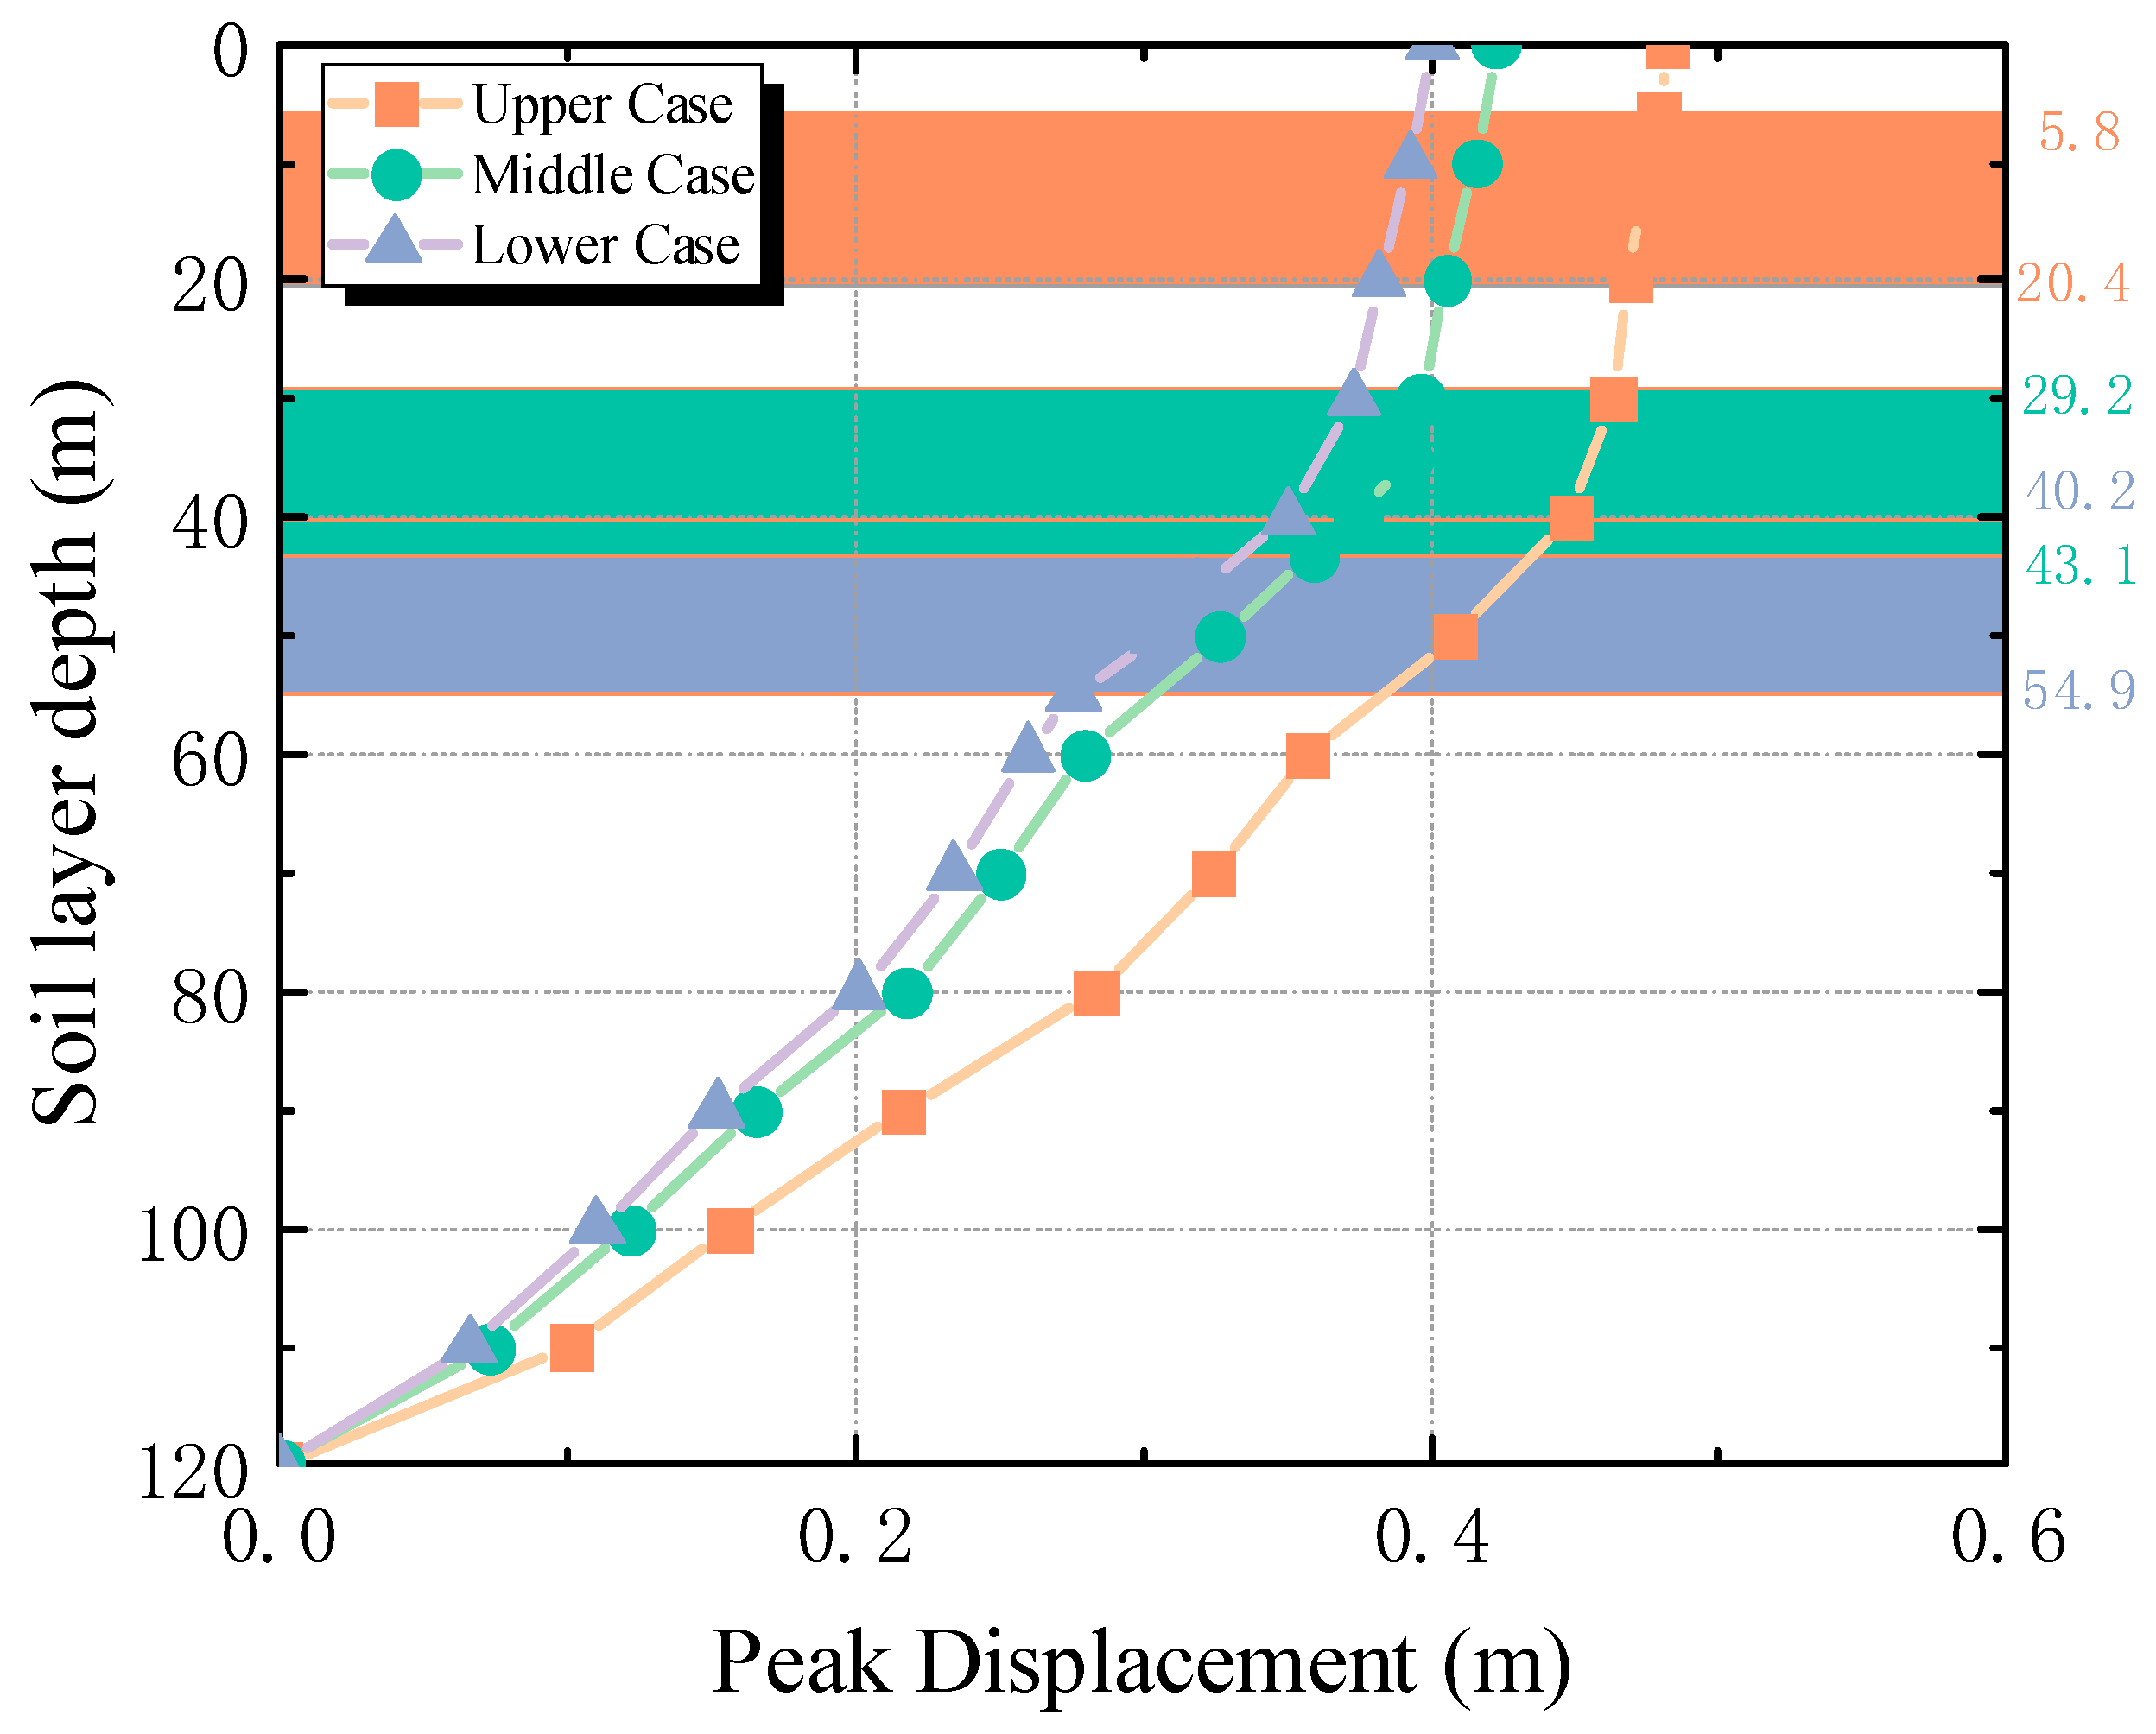
3.3. Liquefiable Site

Studies on the displacement conditions of liquefiable sites and the liquefaction phenomenon of liquefiable layers under different conditions were conducted. The seismic response patterns of site-embedded structural systems with different liquefaction layer positions were summarized.

3.3.1. Displacement

Figure 35 illustrates the relative displacement peaks under different liquefaction layer positions. As shown, identical patterns are observed across all three configurations: relative displacement magnitudes increase with reduced depth, with significantly greater peak values recorded when the liquefaction layer is positioned above the structural foundation compared to other operational scenarios.
When soil layers consist of heterogeneous stratified soils, variations in seismic motion response occur at soil layer interfaces. Additionally, non-bedrock sites significantly reduce the overall frequency of the soil–structure system, shifting the system’s frequency toward lower ranges. Consequently, structural responses progressively diminish with an increasing number of stories.

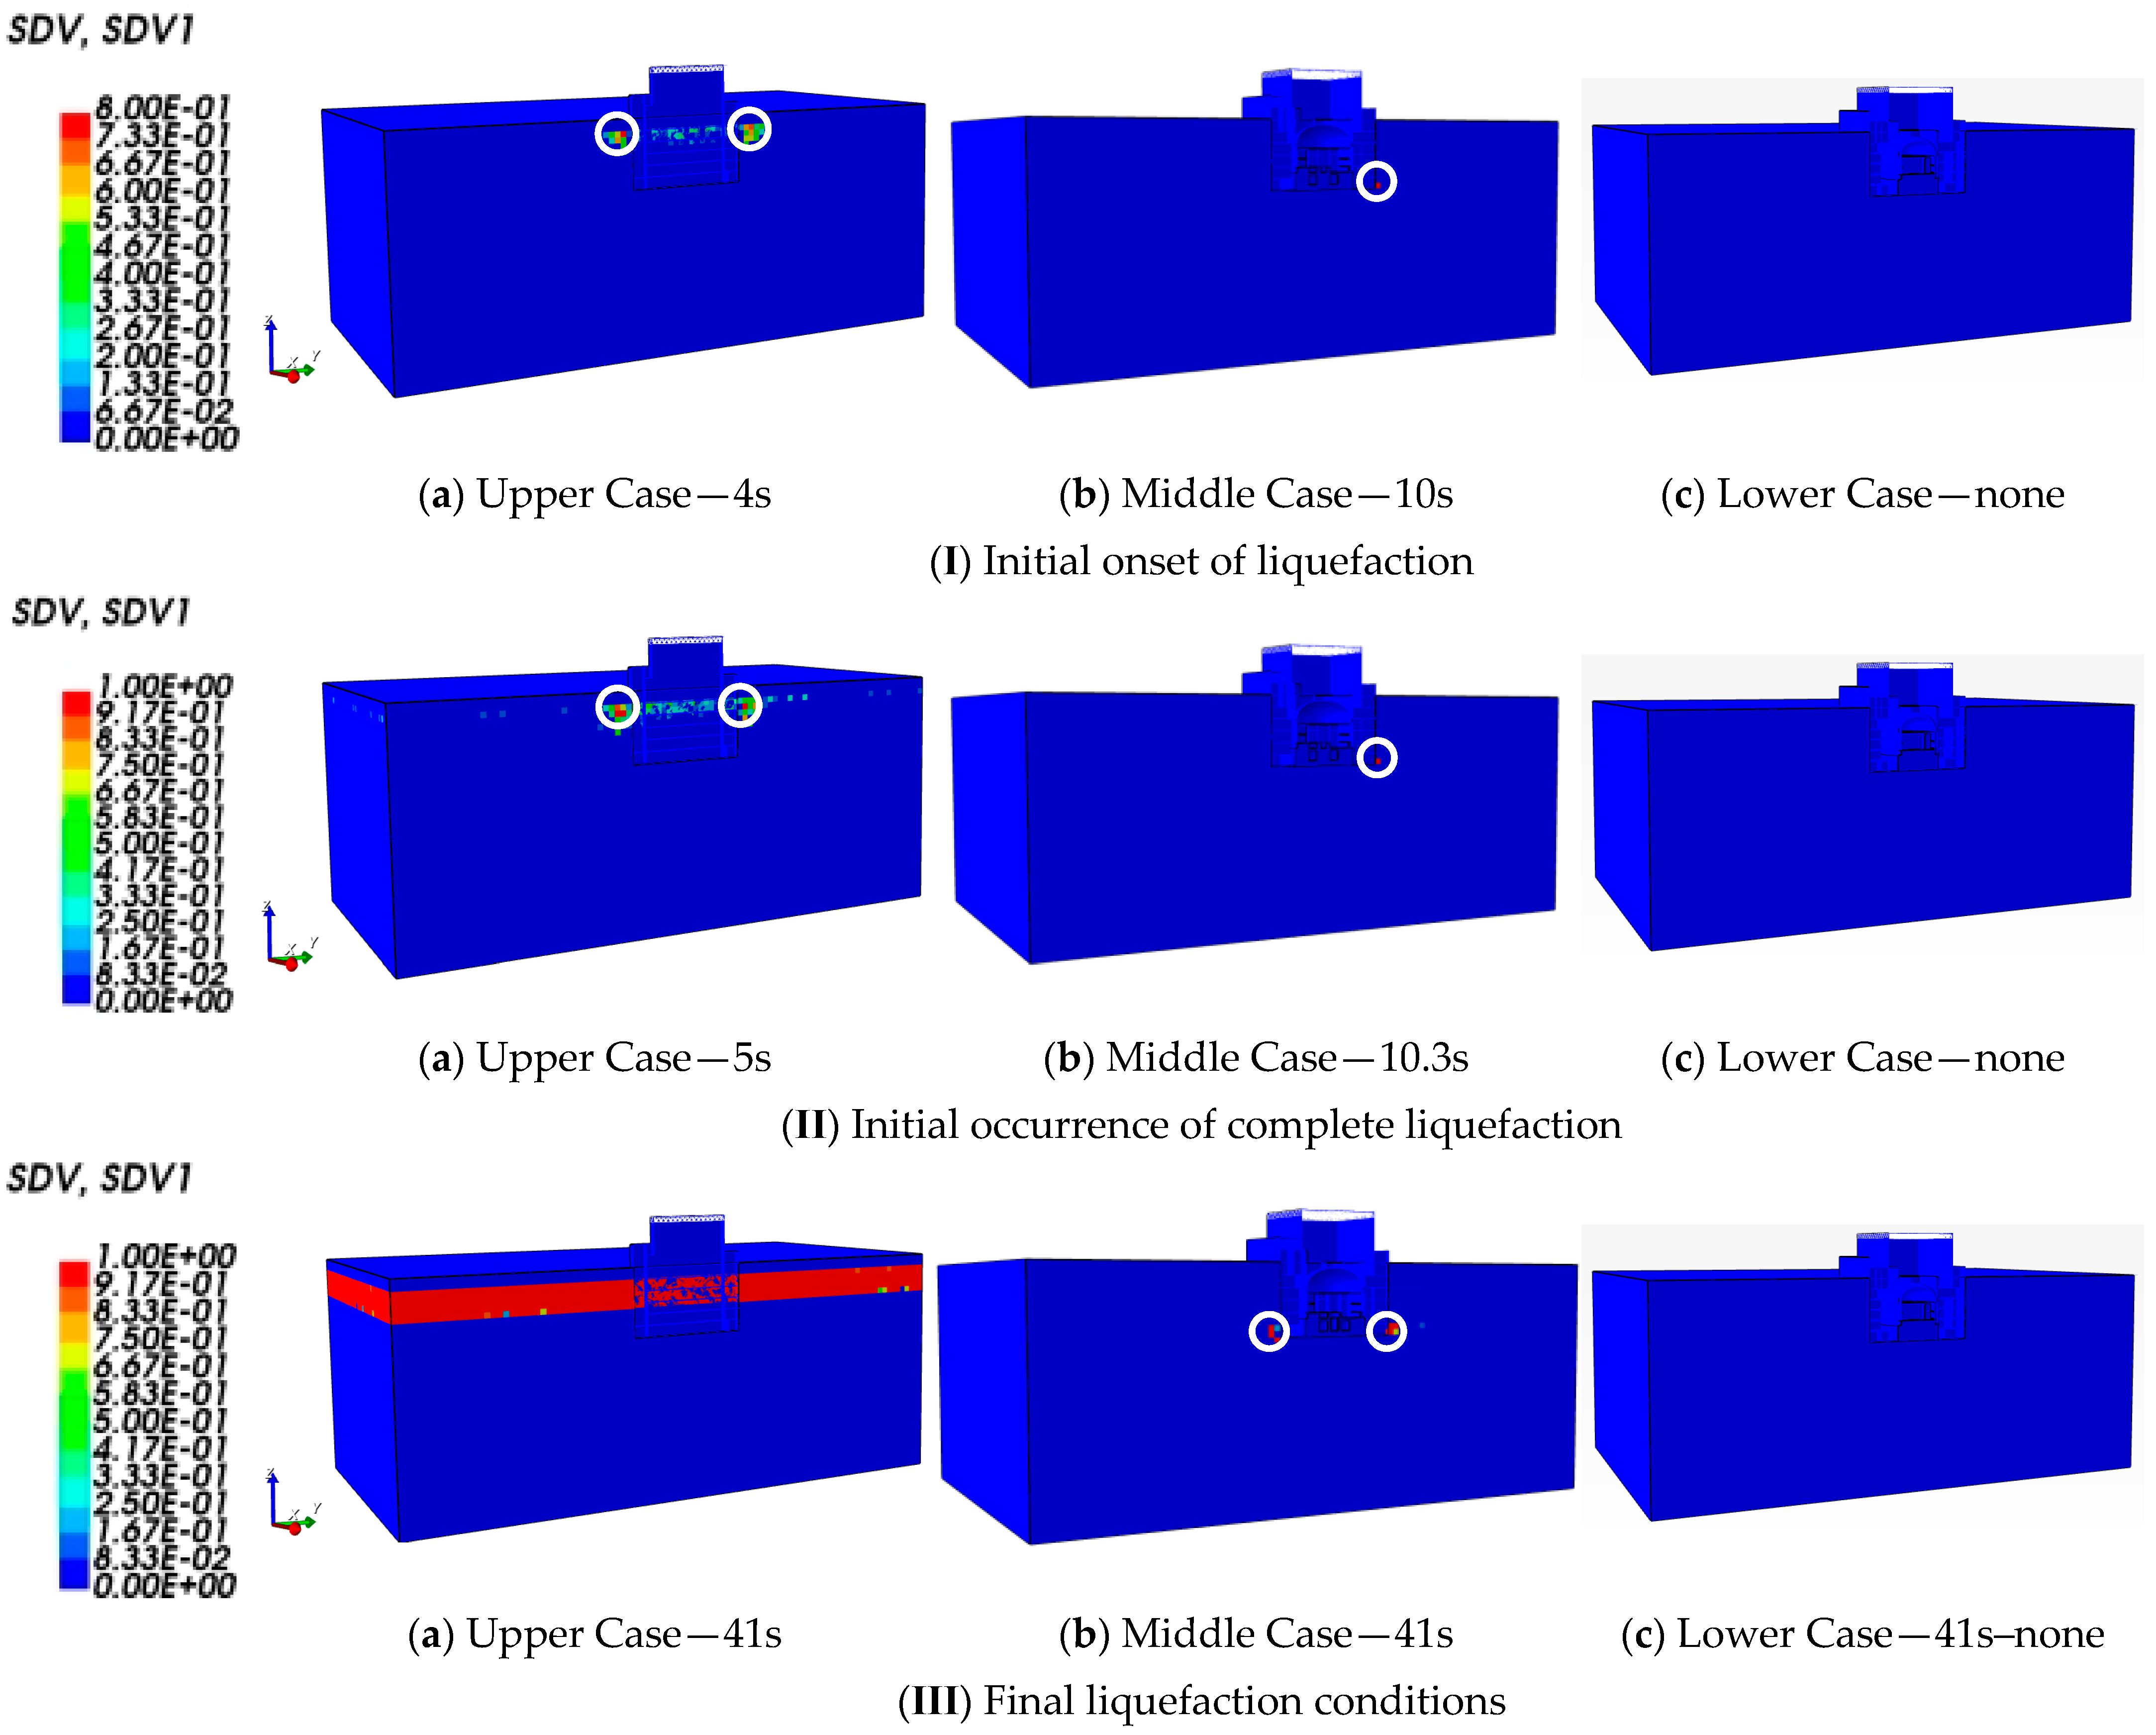
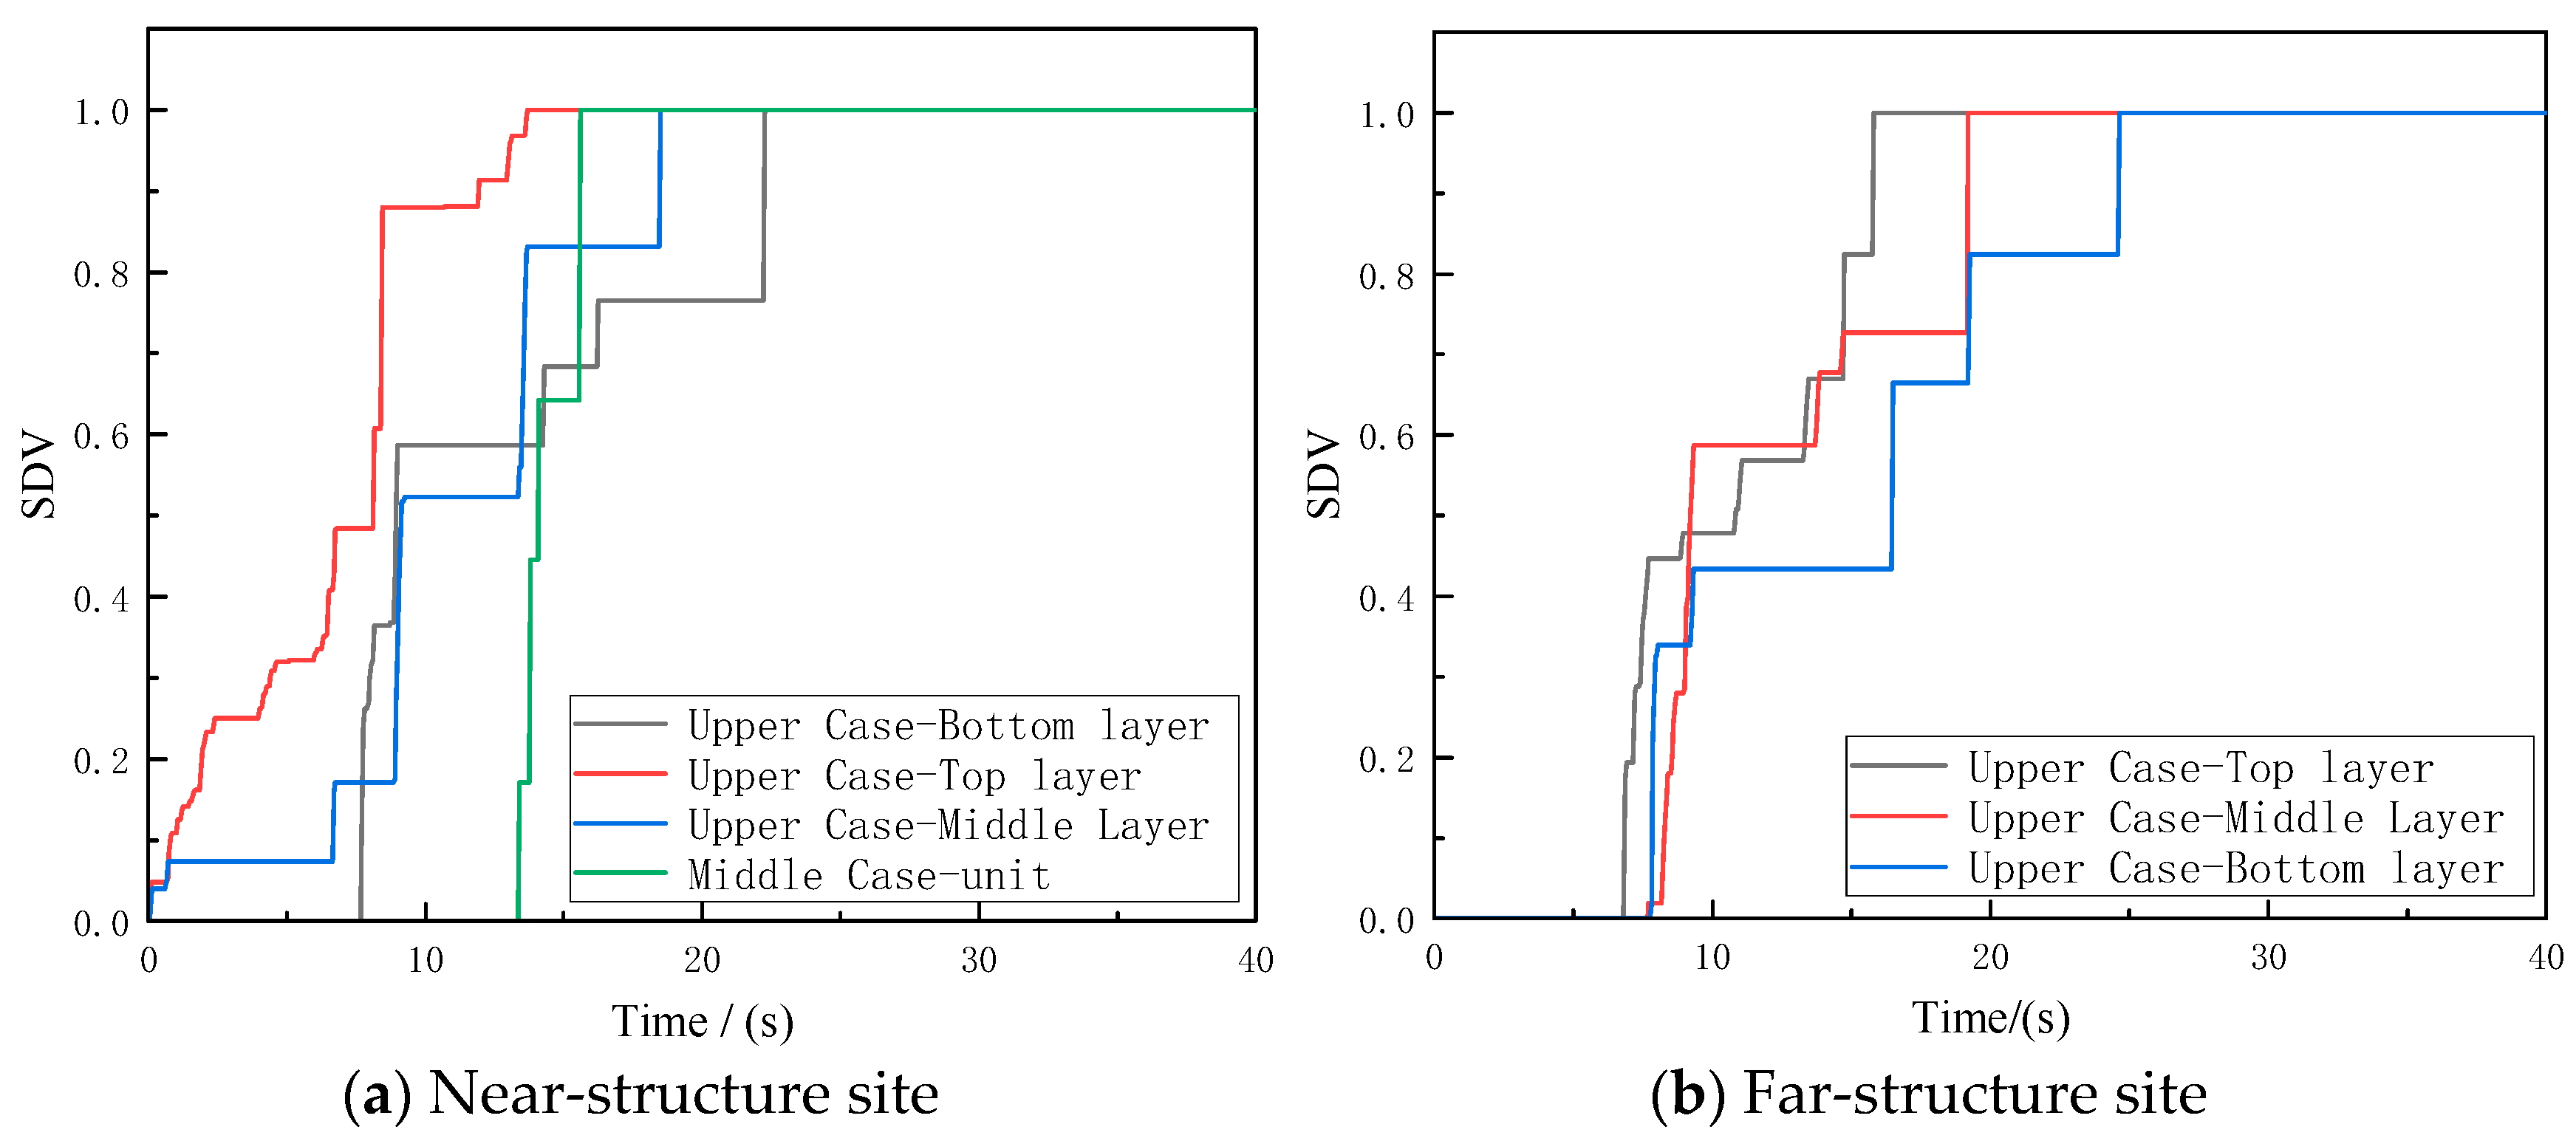
3.3.2. Liquefaction Phenomenon

Liquefaction is generally considered to begin when the excess pore pressure ratio exceeds 0.8, and the site is regarded as fully liquefied when it reaches 1.0. In this section, the liquefaction characteristics of a fully embedded nuclear island structure under different liquefaction layer positions are studied. The onset time of liquefaction and the final degree of liquefaction are evaluated. Figure 32 shows the excess pore pressure ratio contour maps at the onset of liquefaction, full liquefaction, and the final moment of seismic excitation. Due to the variation in liquefaction locations under different conditions, the regions displayed for the first occurrence of liquefaction differ across cases.
When the liquefaction layer is located closer to the surface above the structure, liquefaction is more likely to occur. In contrast, when the liquefaction layer is located below the structure, the accumulation of pore pressure in the liquefiable soil layer is significantly smaller than the confining pressure of the soil. This is caused by the self-weight stress of the soil. As a result, the pore pressure ratio remains much lower than the liquefaction threshold. Only partial liquefaction occurs, and the onset of liquefaction is significantly delayed. When the liquefiable layer is sufficiently deep (40.16 m to 53.49 m from the surface in this numerical simulation), no pore pressure accumulation occurs under a 0.5 g base input. Under the same conditions, liquefaction first occurs near the structure. As seismic excitation continues, pore pressure accumulation begins in areas farther from the structure.
Figure 36 illustrates the timing and liquefaction phenomena under different conditions. As the liquefaction layer deepens, the onset of liquefaction and the occurrence of full liquefaction are delayed. In some cases, liquefaction does not occur. This indicates that, under the same seismic excitation, increasing the depth of the liquefaction layer delays the onset of liquefaction and effectively reduces the likelihood of liquefaction in the liquefiable layer.
According to Figure 37, it can be observed that liquefaction begins at the top earlier than in the middle and bottom. Additionally, near the structure, pore pressure accumulates more rapidly, leading to a faster occurrence of liquefaction.
It is observed that the spatial position of the liquefaction layer is found to significantly affect the soil–structure seismic response. Under the same seismic excitation, liquefaction is more likely to occur when the liquefaction layer is closer to the surface. This is caused by the lower initial confining pressure of the soil. As the liquefaction layer moves deeper, liquefaction becomes less likely due to the increased initial confining pressure. When the liquefaction layer is located at the bottom of the structure, the overall acceleration response of the structure is observed to be greater than that in the upper or middle cases. This pattern is consistent with the variation in site response. It is shown that the site response significantly influences the seismic response of embedded nuclear power structures.

4. Conclusions

In this paper, a numerical analysis method was adopted to investigate the effects of different structural embedment depths on the seismic response of an embedded nuclear power plant structure under non-bedrock site conditions. This study shows the following:
(1) The structural response is influenced by the embedment depth, with greater embedment depth being beneficial to the seismic response of the nuclear power plant structure.
(2) The acceleration response and floor relative displacement of the nuclear power plant structure decrease significantly as the structural embedment depth increases. Different embedment depths have minimal influence on the floor response spectrum in the low-frequency range. However, the embedment depth significantly affects the frequency band corresponding to the spectral peak, causing an overall shift in this peak frequency toward the low-frequency range. The impact of different embedment depths on the high-frequency range of the floor response spectrum is relatively minor.
(3) Under the same seismic excitation, the liquefaction potential of the liquefiable layer is found to increase as the liquefaction layer is positioned closer to the surface.
(4) For embedded nuclear power structures, the seismic response of the structure is shown to be significantly influenced by site response characteristics.
(5) The buried nuclear island structure does not require extensive component modifications on the original structure to eliminate liquefaction hazards, significantly enhancing the seismic performance of the nuclear power structure. Based on this research, it is recommended that regulations consider adding site selection and design requirements for buried nuclear power structures as a new structural form. This can serve as discussion content or a direction for future research.

Author Contributions

Conceptualization, M.Z.; methodology, Z.G.; software, J.G.; validation, Z.G.; data curation, J.G.; writing—original draft preparation, J.G.; writing—review and editing, Z.G.; visualization, M.Z.; supervision, X.D. All authors have read and agreed to the published version of the manuscript.

Funding

This study is supported by the Key Program of the Natural Science Foundation of China (No. 52338001). This support is greatly appreciated.

Institutional Review Board Statement

Not applicable.

Informed Consent Statement

Not applicable.

Data Availability Statement

The original contributions presented in this study are included in the article. Further inquiries can be directed to the corresponding author.

Conflicts of Interest

The authors declare no conflict of interest.

References

  1. World Nuclear Performance Report 2024; World Nuclear Association: London, UK, 2024.
  2. Kobayashi, T.; Yoshikawa, K.; Takaoka, E.; Nakazawa, M.; Shikama, Y. Time history nonlinear earthquake response analysis considering materials and geometrical nonlinearity. Nucl. Eng. Des. 2002, 212, 145–154. [Google Scholar] [CrossRef]
  3. Zadoyan, P.; Simos, N. Seismic Reevaluation of the Armenian NPP Unit 2: Issues and Engineering Approach. In Proceedings of the 10th International Conference on Nuclear Engineering, Arlington, VA, USA, 14–18 April 2002; pp. 715–726. [Google Scholar]
  4. Nakamura, N.; Yabushita, N.; Suzuki, T.; Yamada, J.; Tsunashima, N.; Nakano, T. Analyses of Reactor Building by 3D Nonlinear FEM Models Considering Basemat Uplift for Simultaneous Horizontal and Vertical Ground Motions. Nucl. Eng. Des. 2008, 238, 3551–3560. [Google Scholar] [CrossRef]
  5. Johnson, J.J.; Schneider, O.; Schuetz, W.; Monette, P.; Asfura, A.P. Effects of SSI on EPRTM In-Structure Response for a Rock Site: Coherent High Frequency Ground Motion. In Proceedings of the ASME 2010 Pressure Vessels and Piping Division/K-PVP Conference, Bellevue, WA, USA, 18–22 July 2010; pp. 271–281. [Google Scholar]
  6. Nakaki, D.K.; Hashimoto, P.S.; Johnson, J.J.; Bayraktarli, Y.; Zuchuat, O. Probabilistic Seismic Soil Structure Interaction Analysis of the Mühleberg Nuclear Power Plant Reactor and SUSAN Buildings. In Proceedings of the ASME 2010 Pressure Vessels and Piping Division/K-PVP Conference, Bellevue, WA, USA, 18–22 July 2010; pp. 79–88. [Google Scholar]
  7. Chen, Y. Floor Response Spectrum Analysis of Nuclear Power Plant Structures Based on Three-Dimensional Solid Model. Ph.D. Thesis, Tianjin University, Tianjin, China, 2005. [Google Scholar]
  8. Wu, Z.H. Study on Practical Analysis Method of the Inner Containment in Nuclear Power Plant Reactor Building. Ph.D. Thesis, Institute of Engineering Mechanics, China Earthquake Administration, Harbin, China, 2014. [Google Scholar]
  9. Li, N. Seismic Dynamic Response of Nuclear Island Structure Considering the Influence of Equipment. Ph.D. Thesis, Institute of Engineering Mechanics, China Earthquake Administration, Harbin, China, 2020. [Google Scholar]
  10. GB 50267-2019; China Earthquake Administration (CEA). Standard for Seismic Design of Nuclear Island Structure. China Planning Press: Beijing, China, 2019.
  11. American Society of Civil Engineers (ASCE). Seismic Analysis of Safety-Related Nuclear Structures and Commentary; ASCE/SEI Standard: Reston, VA, USA, 2017; pp. 4–16. [Google Scholar]
  12. Westinghouse Electric Co. LLC. Westinghouse AP1000 Design Control Document, Revision 19; Nuclear Regulatory Commission: Butler County, PA, USA, 2011. [Google Scholar]
  13. Li, X.J.; He, Q.M.; Zhang, H.Y.; Lei, Y. Effect of ground motion velocity pulse on seismic performance of foundation isolation structures with different aspect ratio. J. Build. Struct. 2018, 33, 35–42. [Google Scholar]
  14. Liu, P.X.; Li, X.J.; Zhou, Z.H. Analysis of influence of types of strong seismic observation stations on ground motion. Acta Seismol. Sin. 2022, 44, 1083–1098. [Google Scholar]
  15. de Borbón, F.; Domizio, M.; Ambrosini, D.; Curadelli, O. Influence of various parameters in the seismic soil-structure interaction response of a nuclear power plant. Eng. Struct. 2020, 217, 110820. [Google Scholar] [CrossRef]
  16. Li, L.; Chen, Q.; Pan, R. Analysis of the Influence of Structure-Soil-Structure Interaction on the Seismic Response for Nuclear Power Plant ASTS. Energies 2023, 16, 194. [Google Scholar] [CrossRef]
  17. Patil, G.; Choudhury, D.; Mondal, A. Nonlinear dynamic soil-foundation-superstructure interaction analysis for a reactor building supported on a combined piled-raft system. Int. J. Geomech. 2023, 23, 04023009. [Google Scholar] [CrossRef]
  18. Firoj, M.; Maheshwari, B. Effect of CPRF on nonlinear seismic response of an NPP structure considering raft-pile-soil-structure-interaction. Soil Dyn. Earthq. Eng. 2022, 158, 107295. [Google Scholar] [CrossRef]
  19. Firoj, M.; Maheshwari, B.K. A new nonlinear spring-dashpot model of CPRF of NPP structure based on coupled BEM-FEM approach. Earthq. Eng. Struct. Dyn. 2023, 52, 932–955. [Google Scholar] [CrossRef]
  20. Maheshwari, B.K.; Firoj, M. Settlement of combined piled raft foundation of a nuclear power plant in non-liquefiable and liquefiable soils. Nucl. Eng. Des. 2023, 413, 112518. [Google Scholar] [CrossRef]
  21. Firoj, M.; Maheshwari, B.K. Dynamic impedances of CPRF using coupled BEM-FEM approach: A parametric study and application. Eng. Anal. Bound. Elem. 2023, 156, 8–19. [Google Scholar] [CrossRef]
  22. Yang, Y.; Fan, H.; Cheng, Y.P.; Gong, W.; Dai, G.; Liang, F.; Jia, Y. Seismic response of nuclear power station with disconnected pile-raft foundation using dynamic centrifuge tests. J. Clean. Prod. 2022, 379, 134572. [Google Scholar] [CrossRef]
  23. Amorosi, A.; Boldini, D. Numerical modeling of the transverse dynamic behavior of circular tunnels in clayey soils. Soil Dyn. Earthq. Eng. 2009, 59, 1059–1072. [Google Scholar] [CrossRef]
  24. Argyroudis, S.A.; Pitilakis, K.D. Seismic fragility curves of shallow tunnels in alluvial deposits. Soil Dyn. Earthq. Eng. 2012, 35, 1–12. [Google Scholar] [CrossRef]
  25. Chen, H.; Li, X.; Yan, W.; Chen, S.; Zhang, X. Shaking table test of immersed tunnel considering the geological condition. Eng. Geol. 2017, 227, 93–107. [Google Scholar] [CrossRef]
  26. Tsinidis, G. Response characteristics of rectangular tunnels in soft soil subjected to transversal ground shaking. Tunn. Undergr. Space Technol. 2017, 62, 1–22. [Google Scholar] [CrossRef]
  27. Patil, M.; Choudhury, D.; Ranjith, P.G.; Zhao, J. Behavior of shallow tunnel in soft soil under seismic conditions. Tunn. Undergr. Space Technol. 2018, 82, 30–38. [Google Scholar] [CrossRef]
  28. Chen, G.; Zhu, S.; Chen, W.; Li, X.; Juang, C.H. 3D seismic response characteristics of apile-mat-founded AP1000 nuclear-island building considering nonlinear hysteretic behavior of soil. Bull. Earthq. Eng. 2022, 20, 7077–7106. [Google Scholar] [CrossRef]
  29. Gao, Z.; Zhao, M.; Huang, J.; Du, X.; Wu, L. Three-dimensional nonlinear seismic response analysis of subway station crossing longitudinally inhomogeneous geology under obliquely incident P waves. Eng. Geol. 2021, 293, 106341. [Google Scholar] [CrossRef]
  30. Jiang, J.; El Naggar, M.H.; Huang, W.; Xu, C.; Zhao, K.; Du, X. Seismic vulnerability analysis for shallow-buried underground frame structure considering 18 existing subway stations. Soil Dyn. Earthq. Eng. 2022, 162, 107479. [Google Scholar] [CrossRef]
  31. Wang, X.; Zhao, M.; Guan, J.; Yang, J.; Du, X.; Zhao, X. Site effect on seismic response of buried nuclear power plant structure. Soil Dyn. Earthq. Eng. 2024, 183, 108759. [Google Scholar] [CrossRef]
  32. Kazemi, F.; Asgarkhani, N.; Jankowski, R. Machine learning-based seismic fragility and seismic vulnerability assessment of reinforced concrete structures. Soil Dyn. Earthq. Eng. 2023, 166, 107761. [Google Scholar] [CrossRef]
  33. Zhuang, H.; Hu, Z.; Wang, X.; Chen, G. Seismic responses of a large underground structure in liquefied soils by FEM numerical modelling. Bull. Earthq. Eng. 2015, 13, 3645–3668. [Google Scholar] [CrossRef]
  34. Cheng, X.; Sun, Z. Effects of Burial Depth on the Seismic Response of Subway Station Structure Embedded in Saturated Soft Soil. Adv. Civ. Eng. 2018, 1, 8978467. [Google Scholar] [CrossRef]
  35. Shen, Y.; Zhong, Z.; Li, L.; Du, X.; El Naggar, M.H. Seismic response of shield tunnel structure embedded in soil deposit with liquefiable interlayer. Comput. Geotech. 2022, 152, 105015. [Google Scholar] [CrossRef]
  36. Bao, X.; Xia, Z.; Ye, G.; Fu, Y.; Su, D. Numerical analysis on the seismic behavior of a large metro subway tunnel in liquefifiable ground. Tunn. Undergr. Space Technol. 2017, 66, 91–106. [Google Scholar] [CrossRef]
  37. Lu, C.C.; Hwang, J.H. Safety assessment for a shield tunnel in a liquefifiable deposit using a practical dynamic effffective stress analysis. Eng. Fail. Anal. 2019, 102, 369–383. [Google Scholar] [CrossRef]
  38. Zhao, M.; Ding, Q.; Cao, S.; Li, Z.; Du, X. Large-scale seismic soil-structure interaction analysis via efficient finite element modeling and multi-GPU parallel explicit algorithm. Comput.-Aided Civ. Infrastruct. Eng. 2024, 39, 1886–1908. [Google Scholar] [CrossRef]
  39. Zhang, G.; Zhao, M.; Zhang, J.; Wang, J.; Du, X. Scaled boundary perfectly matched layer for wave propagation in a three-dimensional poroelastic medium. Appl. Math. Model. 2024, 125, 108–138. [Google Scholar] [CrossRef]
  40. Chen, G.; Zhuang, H. Developed nonlinear dynamic constitutive relations of soils based on davidenkov skeleton curve. Chin. J. Geotech. Eng. 2005, 27, 860–864. [Google Scholar]
  41. Wang, Y.; Zhao, D.; Chen, G.; Liang, K. A new nonlinear effective stress method for one-dimensional seismic site response analysis and its validation. Chin. J. Geotech. Eng. 2021, 43, 502–510. [Google Scholar]
Figure 1. Embedded nuclear island schematic.
Applsci 15 04378 g001
Figure 2. Structural finite element model.
Applsci 15 04378 g002
Figure 3. Kobe University ground motion time history and response spectrum (bedrock location).
Applsci 15 04378 g003
Figure 4. Motion time history and response spectrum (bedrock location).
Applsci 15 04378 g004
Figure 5. Viscoelastic boundary schematic.
Applsci 15 04378 g005
Figure 6. Schematic diagram of structural embedment conditions.
Applsci 15 04378 g006
Figure 7. Schematic diagram of liquefaction layer.
Applsci 15 04378 g007
Figure 8. Site acceleration comparison.
Applsci 15 04378 g008
Figure 9. Acceleration comparison of structure.
Applsci 15 04378 g009
Figure 10. Schematic diagram of structural strain.
Applsci 15 04378 g010
Figure 11. Comparison of structural dynamic strain.
Applsci 15 04378 g011
Figure 12. Schematic diagram of structural monitoring point locations.
Applsci 15 04378 g012
Figure 13. Acceleration time history curves for the auxiliary building floors.
Applsci 15 04378 g013aApplsci 15 04378 g013b
Figure 14. Auxiliary building’s floor acceleration peak response.
Applsci 15 04378 g014
Figure 15. Factory structure’s floor response spectrum.
Applsci 15 04378 g015
Figure 16. Factory structure’s floor relative displacement.
Applsci 15 04378 g016
Figure 17. Factory structure’s peak relative displacement.
Applsci 15 04378 g017
Figure 18. Safety shell structure’s floor and velocity time history curves.
Applsci 15 04378 g018
Figure 19. Safety shell structure’s floor peak relative displacement.
Applsci 15 04378 g019aApplsci 15 04378 g019b
Figure 20. Safety shell structure’s floor response spectrum.
Applsci 15 04378 g020aApplsci 15 04378 g020b
Figure 21. Safety shell structure’s floor relative displacement.
Applsci 15 04378 g021
Figure 22. Safety shell structure’s floor peak relative displacement.
Applsci 15 04378 g022
Figure 23. Schematic diagram of structural monitoring point locations.
Applsci 15 04378 g023
Figure 24. Schematic layout of geotechnical monitoring point locations.
Applsci 15 04378 g024
Figure 25. Acceleration time history curves for the auxiliary building floors.
Applsci 15 04378 g025aApplsci 15 04378 g025b
Figure 26. Auxiliary building floor acceleration peak response.
Applsci 15 04378 g026
Figure 27. Factory structure floor response spectrum.
Applsci 15 04378 g027
Figure 28. Relative displacement time history (7th to 1st floors).
Applsci 15 04378 g028
Figure 29. Peak relative displacement response (7th to 1st floors).
Applsci 15 04378 g029
Figure 30. Acceleration time history curves of containment at three monitoring points.
Applsci 15 04378 g030
Figure 31. Acceleration peak response of containment structure.
Applsci 15 04378 g031aApplsci 15 04378 g031b
Figure 32. Floor response spectra of containment structure.
Applsci 15 04378 g032
Figure 33. Relative displacement time history (C to A).
Applsci 15 04378 g033
Figure 34. Peak relative displacement response (C to A).
Applsci 15 04378 g034
Figure 35. Relative peak displacement at the bottom of the soil.
Applsci 15 04378 g035
Figure 36. Liquefaction phenomena under varying operational conditions.
Applsci 15 04378 g036
Figure 37. Pore pressure ratio of site.
Applsci 15 04378 g037
Table 1. Simplified mean bedrock site parameters.
Soil LayerDensity (kg/m3)Soil Layer Thickness
(m)
Elastic Modulus (MPa)Shear Wave Velocity (m/s)
125001201593565
Table 2. LT layered equivalent site.
Soil LayerDensity (kg/m3)Soil Layer Thickness
(m)
Elastic Modulus (MPa)Shear Wave Velocity (m/s)
1176530.7219.024208.46
2195325.55389.376274.70
31989To Rock744.808385.96
Table 3. Case design under the influence of embedment depth.
CasesEmbedment Depth of Structural Embedment DepthCase Names
143.2 mDeep Embedment Case
237.2 mDesign Embedment Case
322.6 mSemi-embedded Case
412.2 mShallow Embedment Case
52.2 mExposed Case
637.2 mUpper Case
737.2 mMiddle Case
837.2 mExposed Case
Disclaimer/Publisher’s Note: The statements, opinions and data contained in all publications are solely those of the individual author(s) and contributor(s) and not of MDPI and/or the editor(s). MDPI and/or the editor(s) disclaim responsibility for any injury to people or property resulting from any ideas, methods, instructions or products referred to in the content.

